Embed Size (px)
Citation preview
Module 5:
Interest Rate Risk Management
No part of this publication may be reproduced, stored in a retrieval system, or transmitted in any form or by any means–electronic, mechanical, photocopying, recording or otherwise–without prior
permission of the Egyptian Banking Institute.
Not
For
Rel
ease
Participant Guide
DD08-V3 5-2
Table of Contents
Module 5: Interest Rate Risk Management
Introduction ................................................................................................................................ 3 Learning objectives ................................................................................................................ 3
The Meaning of Interest Rate Risk ............................................................................................ 4 Sources of Interest Rate Risk ..................................................................................................... 5 Effects of Interest Rate Risk ...................................................................................................... 6
Forecasting Interest Rate Moves: An elementary approach ...................................................... 7 Monetary Policy: the tradeoff between inflation and growth targeting ................................. 7 CBE’s Monetary Policy Committee (MPC) .......................................................................... 7 In Practice .............................................................................................................................. 7
First – Interest Rate Risk Measurement Techniques ................................................................. 8 Repricing Gap Analysis ......................................................................................................... 8 Duration ............................................................................................................................... 11 Simulation approaches ......................................................................................................... 12
Second – Management of interest rate risk .............................................................................. 13 Third: Banking (Fixed Income) Investment Portfolio ............................................................ 14
Nature ................................................................................................................................... 14 Components and accounting treatment ................................................................................ 14
The role in ALM .................................................................................................................. 14 Exercises .................................................................................................................................. 16
Simulation Approaches ........................................................................................................ 16 Duration ............................................................................................................................... 16
Summary .................................................................................................................................. 17
Not
For
Rel
ease
Participant Guide
DD08-V3 5-3
Asset and Liability Management – Introduction
Module 5: Interest Rate Risk Management
Introduction Building on Basel Committee recommendations and CBE directives, this session introduces
the second risk associated with ALM function, which is the interest rate risk. It starts with
defining and explaining the meaning of interest rate risk to present a general vision of this
source of risk and the importance of forecasting the course of interest rates, and then the
sources and effects of interest rate risk will be identified because following these sources later
will help to manage and control the interest rate risk.
How to use gap analysis as a basic method to measure the bank exposure toward interest rate
risk will be the next point to cover. Duration and how to use duration to measure the interest
rate risk will be explained.
This session will also include a comparison between static and dynamic gap analysis
mechanisms. Finally, the banking investment portfolio will be introduced.
Importance
The assets and liabilities management requires taking the utmost care with the interest rate
applied for both funding and lending products. So this session is concerned with the interest
rate risk management as an integral part of ALM function.
Overview
Based the on the previous introduction, this session will present and discuss the following
points:
The meaning, sources, and effects of interest rate risk
A general framework for interest rate risk management
Using the Gap and Duration analysis to evaluate bank exposure to interest rate risk
The difference between static vs. dynamic simulation approaches
How bankers forecast and plan for interest rate movements
Learning objectives
Upon the completion of this module, you will be able to:
Explain the meaning, sources, and effects of interest rate risk
Describe how to forecast and plan for interest rate movements from a simplified approach,
recognizing the tradeoff between targeting inflation on the one hand and growth and
employment on the other.
Recognize the Monetary Policy Committee (MPC) incentives for policy rate hike/drop
Explain the Gap and Duration analysis as measurement techniques of interest rate risk
Describe a general framework for interest rate risk management
Identify the difference between static vs. dynamic simulation approaches
Not
For
Rel
ease
Participant Guide
DD08-V3 5-4
Describe the banking investment portfolio; its nature, components and accounting treatment, and the role it plays in ALM.The Meaning of Interest Rate Risk
Suppose that a 10-year CD priced at a fixed rate1 of 10.5% is used to fund a 3-year floating
rate2 commercial loan priced at Corridor offer rate + 2.5%. Further, assume that the Corridor
rate equals 10% at the beginning of the deal and 8% one year later.
In this case, the bank starts with a 2% spread (10%+2.5% less 10.5%) at the beginning of the
deal that falls to 0% (8%+2.5% less 10.5%) one year later. The deposit will remain fixed at
10.5%, despite the drop in the loan applied rate.
This deal has turned from a profitable one to a break-even position because of the interest rate
risk resulting from the mismatch between the repricing dates of the asset and liability.
According to Basel Committee on Banking Supervision (BCBS); Interest rate risk is the
exposure of a bank's financial condition to adverse movements in interest rates. Accepting
this risk is a normal part of banking and can be an important source of profitability and
shareholder value. However, excessive interest rate risk can pose a significant threat to a
bank's earnings and capital base. Changes in interest rates affect a bank's earnings by
changing its net interest income and the level of other interest sensitive income and operating
expenses. Changes in interest rates also affect the underlying value of the bank's assets,
liabilities, and off-balance-sheet (OBS) instruments because the present value of future cash
flows (and in some cases, the cash flows themselves) change when interest rates change.
Accordingly, an effective risk management process that maintains interest rate risk within
prudent levels is essential to the safety and soundness of banks.3
Interest rate risk could be divided into:
Refinancing risk is the uncertainty of the cost of a new source of funds that are being
used to finance a long-term fixed-rate asset. This risk occurs when the bank is holding
fixed rate assets with maturities greater than the maturities of its fixed rate liabilities.
For example, if a bank has a ten-year fixed-rate loan funded by a 2-year time deposit,
the bank faces a risk of borrowing new deposits, or refinancing, at a higher rate in two
years. Thus, interest rate increases would reduce net interest income. The bank would
benefit if the rates fall as the cost of renewing the deposits would decrease, while the
earning rate on the assets would not change. In this case, net interest income would
increase.
Reinvestment risk is the uncertainty of the earning rate on the redeployment of assets
that have matured. This risk occurs when the bank holds fixed rate assets with
maturities that are less than the maturities of its fixed rate liabilities. For example, if a
bank has a two-year loan funded by a ten-year fixed-rate time deposit, the bank faces
the risk that it might be forced to lend or reinvest the money at lower rates after two
years, perhaps even below the deposit rates. Also, if the bank receives periodic cash
1 Fixed rate means that the pre-specified interest rate is fixed (doesn’t change) for the life of the deal.
2 Floating rate consists of a Benchmark + (or –) spread; which leads to changing the applied rate as the
benchmark changes with an agreed upon repricing frequency. The most widely used benchmarks are Corridor
rates in EGP, and LIBOR rates in foreign currencies. 3 “Principles for the management and supervision of interest rate risk”; July 2004
Not
For
Rel
ease
Participant Guide
DD08-V3 5-5
flows, such as coupon payments from a bond or monthly payments on a loan, these
periodic cash flows will also be reinvested at the new lower (or higher) interest rates.
Sources of Interest Rate Risk
Although the direct method to reduce the interest rate risk is matching the repricing dates of
assets and liabilities, but this method prevent ALM to benefits from taking view on yield
curve as well as being impractical at times. Foreign currency assets and liabilities structure is
an example of this impracticality; while depositors prefer fixed rate deposits, FCY borrowers
usually prefers floating rate loans. Still, the resulting mismatch could be hedged by using
Interest Rate Swaps (IRSs). In this specific case, the IRS is structured as that the bank pays
floating (from loans installments) and receive fixed (to be paid to depositors).
There are four sources of interest rate risk, as follows:
1. Repricing risk:
For instance, a bank that funded a long-term fixed-rate loan with a short-term deposit
could face a decline in both the future income arising from the position and its
underlying value if interest rates increase. These declines arise because the cash flows on
the loan are fixed over its lifetime, while the interest paid on the funding is variable, and
increases after the short-term deposit matures.
2. Yield curve risk:
Yield curve risk arises when unanticipated non-parallel shifts of the yield curve have
adverse effects on a bank's income or underlying economic value.
3. Basis risk:
Arises from imperfect correlation in the adjustment of the rates earned and paid on
different instruments with otherwise similar repricing characteristics. For example, a
strategy of funding a one-year loan that reprices monthly based on the one-month US
Treasury bill rate, with a one-year deposit that reprices monthly based on one-month
LIBOR, exposes the institution to the risk that the spread between the two index rates
may change unexpectedly.
4. Optionality risk:
Accounts for the risks from exercising explicit or implicit options in the bank’s assets or
liabilities, due to the effect on the timing and size of cash flows. Explicit options are very
rare in the Egyptian banking industry. Prepayment option of personal loans and early
redemption option of CDs are examples of implicit options.
Not
For
Rel
ease

Participant Guide
DD08-V3 5-6
Effects of Interest Rate Risk There are two separate, but complementary, perspectives for assessing a bank's interest rate
risk exposure.
1. Earnings perspective:
In the earnings perspective, the focus of analysis is the impact of changes in interest rates
on accrual or reported earnings. This is the traditional approach to interest rate risk
assessment taken by many banks. Variation in earnings is an important focal point for
interest rate risk analysis because reduced earnings or outright losses can threaten the
financial stability of an institution by undermining its capital adequacy and by reducing
market confidence.
2. Economic value perspective:
Variation in market interest rates can also affect the economic value of a bank's assets,
and liabilities. Thus, the sensitivity of a bank's economic value to fluctuations in interest
rates is a particularly important consideration of shareholders, management, and
supervisors alike. The economic value of an instrument represents an assessment of the
present value of its expected net cash flows, discounted to reflect market rates. By
extension, the economic value of a bank can be viewed as the present value of the bank's
expected net cash flows, defined as the expected cash flows on assets minus the expected
cash flows on liabilities. In this sense, the economic value perspective reflects one view
of the sensitivity of the net worth of the bank to fluctuations in interest rates.
Since the economic value perspective considers the potential impact of interest rate changes
on the present value of all future cash flows, it provides a more comprehensive view of the
potential long-term effects of changes in interest rates than is offered by the earnings
perspective.
Not
For
Rel
ease
Participant Guide
DD08-V3 5-7
Forecasting Interest Rate Moves: An elementary approach Following our understanding of the nature, source, and effects of interest rate risk, one of the
most important responsibilities of ALM is to expect the future trend of interest rates to
measure its impact on the level of interest rate risk and on the bank profitability.
Monetary Policy: the tradeoff between inflation and growth targeting
The course of interest rate changes is chiefly affected by the monetary policy decisions.
Monetary policy refers to actions taken by central banks to affect price levels (inflation),
aggregate output (GDP), and unemployment through controlling the money supply.
Many tools are available for monetary policy; including policy rate, banks’ required reserve
ratio, open market operations, and credit easing. Of those tools; policy rate is the focus of our
discussion here. Changing the policy rate affects the general level of interest rate in a given
economy. This will affect inflation and GDP in the same direction; meaning that, there is a
trade-off between inflation targeting and growth targeting.
To illustrate this central point, consider the case of increasing the policy rate, banks follow
this increase by rising both deposits and loans rates. Accordingly, saving will increase, which
will decrease money supply leading to lower inflation level. At the same time the cost of
borrowing needed for corporate expansion and funding of new projects will increase putting a
downward pressure on the economic growth, hence, employment. Decreasing the policy rate
has the opposite effect.
CBE’s Monetary Policy Committee (MPC)
The policy rate in Egypt is the Corridor rate set by CBE through the Monetary Policy
Committee. The Central Bank of Egypt (CBE) is responsible for the formulation and
implementation of monetary policy, with price stability being the primary and overriding
objective.4 The CBE is committed to achieving, over the medium term, low rates of inflation
which it believes are essential for maintaining confidence and for sustaining high rates of
investment and economic growth. The Government’s commitment to fiscal discipline is
important to achieve this objective.
In assessing the level of inflation, MPC calculates Core Consumer Price Index (CPI) by
excluding some volatile and regulated items from the headline CPI compiled by the Central
Agency for Public Mobilization and Statistics (CAPMAS). MPC judges whether the Core
CPI is within its comfort zone; if not, it decides on the appropriate action to bring it back into
an acceptable level.
In Practice
Now that we broadly understand the main factors behind fluctuations in the general level of
interest rates, ALM team needs to do the following in order to forecast the future course of
interest rates:
Follow up on major macro-economic indicators (e.g. inflation, GDP, unemployment,
money supply levels, and CBE foreign currency reserves) and analyze their collective
impact on expansionary/restrictive monetary policy stance (Corridor rates
drops/hikes).
Follow up on global economic trends pertaining to American Federal Reserve (FED)
and European Central Bank (ECB) actions.
It’s important to highlight that the economic data gathered for analysis should avoid rumors
be based on official, rigorous, and reliable sources (e.g. Bloomberg, Reuters, CBE
website,…); as the value of the analysis depends ultimately on the accuracy of the input data.
4 Law No. 88 of 2003 of the "Central Bank, Banking Sector and Monetary System"
Not
For
Rel
ease

Participant Guide
DD08-V3 5-8
First – Interest Rate Risk Measurement Techniques
Repricing Gap Analysis
The repricing gap measures the amount of mismatch between interest sensitive
assets and liabilities for each repricing tenor.
Like liquidity gaps, for any tenor, the gap could assume a positive value if , negative if , or zero if
Unlike liquidity gaps, both positive and negative repricing gaps exposes the bank to interest
rate risk depending on the future course of interest rate movement. Tabulated below are the
possible effects on the bank Net Interest Income (NII) for all possible combinations of gap
positions and interest rate changes:
Interest rate change
Gap Increase Decrease No change
Positive + – No effect
Negative – + No effect
Zero No effect No effect No effect
The time buckets (tenors) used in Egyptian bank’s interest rate risk disclosure are5:
Up to 1 month
1-3 months
3-12 months
1-5 years
> 5 years
The magnitude of effect on 12-month NII for each tenor depends on the size of the gap
and interest rate change, and the time remaining till end of the 12-month period; measured as
per the following formula:
could be the expected change in interest rates or a simulated standard shock, with 100bps
and 200bps as the most common. The total effect on 12-month NII equals the sum of effects
for tenors up to 12-month period. Using a standard shock to measure interest rate risk from
earnings perspective (effect on NII) is referred to as NII Simulation.
5 CBE “Rules of Preparation and Presentation of Financial Statements and the basis of Recognition and
Measurement”; December 2008
Not
For
Rel
ease

Participant Guide
DD08-V3 5-9
In practice
Let’s take the same four transactions from liquidity gap exercise. Recall that the deals
executed at the end of December 2015. We need to convert them into two repricing gaps; one
as of end of December 2015 and the other as of end of January 2016.
Amounts in EGP ’000
Uses Sources
Account Amount Description Account Amount Description
T-Bills 300 3-Mth at 9% Current
Account
800 Non-interest bearing, 70% of
balance is core; the remaining is
equally distributed in short term
tenors.
Commercial
Loans
700 3-year floating loan priced at
corridor + 2.5% and repriced
every month
CDs 200 3-year fixed rate at 9%
EGP Repricing Gap as of December 31, 2015
Up to
1Mth
1-3 Mth 3-6 Mth 6-12 Mth Over 12
Mth
Non-Interest Bearing Total
Assets: 1,000
T-Bills 300 300
Commercial Loans 700 700
Liabilities 1,000
Current Accounts 800 800
CDs 200 200
Current Gap 700 300 0 0 (200) 800
Cumulative Gap 700 1,000 1,000 1,000 800
What about the EGP Repricing Gap as of January 31, 2016?
The same shifting effect discussed with liquidity gaps applies for repricing gaps as well.
Limits are set for both current and cumulative gaps.
Not
For
Rel
ease
Participant Guide
DD08-V3 5-10
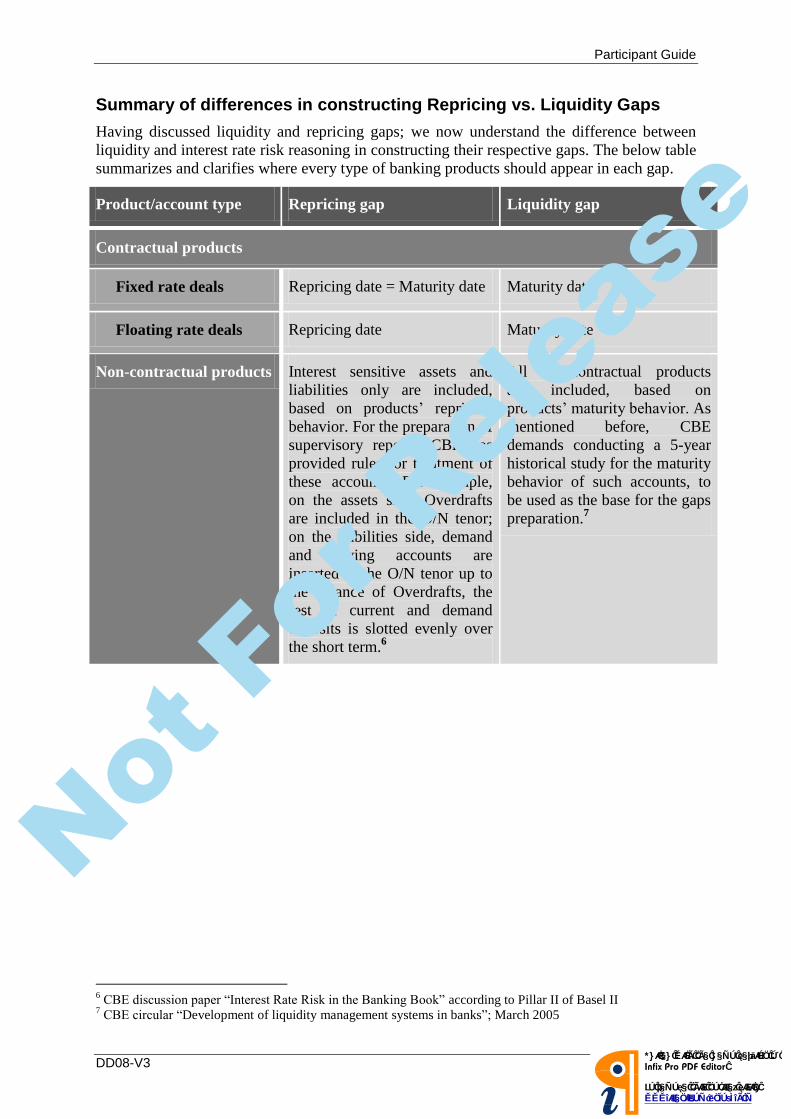
Summary of differences in constructing Repricing vs. Liquidity Gaps
Having discussed liquidity and repricing gaps; we now understand the difference between
liquidity and interest rate risk reasoning in constructing their respective gaps. The below table
summarizes and clarifies where every type of banking products should appear in each gap.
Product/account type Repricing gap Liquidity gap
Contractual products
Fixed rate deals Repricing date = Maturity date Maturity date
Floating rate deals Repricing date Maturity date
Non-contractual products Interest sensitive assets and
liabilities only are included,
based on products’ repricing
behavior. For the preparation of
supervisory reports, CBE has
provided rules for treatment of
these accounts. For example,
on the assets side, Overdrafts
are included in the O/N tenor;
on the liabilities side, demand
and saving accounts are
inserted in the O/N tenor up to
the balance of Overdrafts, the
rest of current and demand
deposits is slotted evenly over
the short term.6
All non-contractual products
are included, based on
products’ maturity behavior. As
mentioned before, CBE
demands conducting a 5-year
historical study for the maturity
behavior of such accounts, to
be used as the base for the gaps
preparation.7
6 CBE discussion paper “Interest Rate Risk in the Banking Book” according to Pillar II of Basel II
7 CBE circular “Development of liquidity management systems in banks”; March 2005
Not
For
Rel
ease
Participant Guide
DD08-V3 5-11
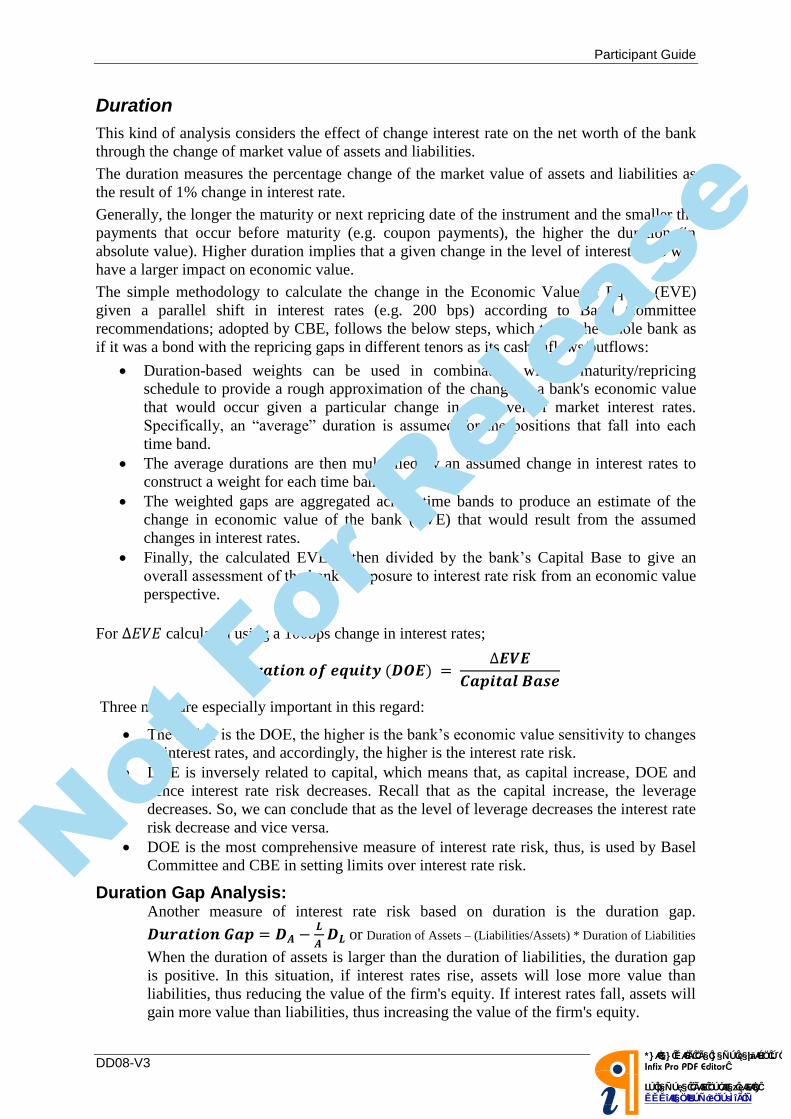
Duration
This kind of analysis considers the effect of change interest rate on the net worth of the bank
through the change of market value of assets and liabilities.
The duration measures the percentage change of the market value of assets and liabilities as
the result of 1% change in interest rate.
Generally, the longer the maturity or next repricing date of the instrument and the smaller the
payments that occur before maturity (e.g. coupon payments), the higher the duration (in
absolute value). Higher duration implies that a given change in the level of interest rates will
have a larger impact on economic value.
The simple methodology to calculate the change in the Economic Value of Equity (EVE)
given a parallel shift in interest rates (e.g. 200 bps) according to Basel Committee
recommendations; adopted by CBE, follows the below steps, which treats the whole bank as
if it was a bond with the repricing gaps in different tenors as its cash inflows/outflows:
Duration-based weights can be used in combination with a maturity/repricing
schedule to provide a rough approximation of the change in a bank's economic value
that would occur given a particular change in the level of market interest rates.
Specifically, an “average” duration is assumed for the positions that fall into each
time band.
The average durations are then multiplied by an assumed change in interest rates to
construct a weight for each time band.
The weighted gaps are aggregated across time bands to produce an estimate of the
change in economic value of the bank (EVE) that would result from the assumed
changes in interest rates.
Finally, the calculated EVE is then divided by the bank’s Capital Base to give an
overall assessment of the bank’s exposure to interest rate risk from an economic value
perspective.
For calculated using a 100bps change in interest rates;
Three notes are especially important in this regard:
The higher is the DOE, the higher is the bank’s economic value sensitivity to changes
in interest rates, and accordingly, the higher is the interest rate risk.
DOE is inversely related to capital, which means that, as capital increase, DOE and
hence interest rate risk decreases. Recall that as the capital increase, the leverage
decreases. So, we can conclude that as the level of leverage decreases the interest rate
risk decrease and vice versa.
DOE is the most comprehensive measure of interest rate risk, thus, is used by Basel
Committee and CBE in setting limits over interest rate risk.
Duration Gap Analysis: Another measure of interest rate risk based on duration is the duration gap.
or Duration of Assets – (Liabilities/Assets) * Duration of Liabilities
When the duration of assets is larger than the duration of liabilities, the duration gap
is positive. In this situation, if interest rates rise, assets will lose more value than
liabilities, thus reducing the value of the firm's equity. If interest rates fall, assets will
gain more value than liabilities, thus increasing the value of the firm's equity.
Not
For
Rel
ease

Participant Guide
DD08-V3 5-12
Simulation approaches
In one sense, these approaches can be viewed as refinements of simple repricing analysis.
However, simulation approaches usually involve a more detailed breakdown of products such
that specific assumptions about product behavior can be incorporated into the analysis. These
approaches also allow for more varied changes in the interest rate environment, such as
changes in the shape and slope of the yield curve, than does repricing analysis.
Static simulation
In static simulations, the cash flows arising solely from the bank's current positions are
assessed. For assessing the exposure of earnings, simulations estimating the cash flows and
resulting earnings streams over a specific period are conducted based on one or more
assumed interest rate scenarios.
Dynamic simulation
In a dynamic simulation approach, the simulation builds in more detailed assumptions about
the future course of interest rates and the expected changes in a bank's business activity over
that time. For instance, the simulation could involve assumptions about the behavior of the
bank's customers (e.g. withdrawals from demand and savings deposits), and/or about the
future stream of business (new loans or other transactions) that the bank will encounter.
As with other approaches, the usefulness of simulation-based interest rate risk measurement
techniques depends on the validity of the underlying assumptions and the accuracy of the
basic methodology.
Not
For
Rel
ease

Participant Guide
DD08-V3 5-13
Second – Management of interest rate risk In broad terms, the principles of sound interest rate management address the following issues:
The role of the Board and senior management in overseeing interest rate risk
management;
The need for clearly defined risk management policies and procedures that capture all
sources of interest rate risk and ensure adequate segregation of duties;
The importance of establishing and enforcing appropriate limits, of conducting stress
testing and of having adequate information systems for measuring, monitoring,
controlling and regularly reporting interest rate risk exposures; and
The need for robust internal controls that are independently reviewed on a regular
basis.
Not
For
Rel
ease

Participant Guide
DD08-V3 5-14
Third: Banking (Fixed Income) Investment Portfolio One of the most important functions of ALM is the management of the banking investment
portfolio. Regardless of the differences in banks’ organization structures that define the
department responsible for managing this portfolio; it deserves a great deal of attention due to
its vital role in a sound ALM function.
Nature
Banks strive to increase their market shares to grow their balance sheets and increase
profitability, especially, in a broadly under-banked country like Egypt. The bank may not
have a utilization channel in loans for all deposits raised. The consequent excess liquidity in
this case is deployed in the banking investment portfolio, to be able to pay interest on the
unutilized deposits and enhance profitability.
Components and accounting treatment
The banking investment portfolio consists mainly of highly liquid fixed income products with
different maturity ranges; from short to medium and long term. Generally, the sovereigns (T-
Bills and T-Bonds) represent the major portion. Recall from our discussion of banking
financial statements that different investment classifications exist, based on the management
intention from acquiring the investment. Tabulated below is a summary of these
classifications and their main features:
Investment classification Value on the Balance sheet Revaluation (Mark to
Market) treatment
Trading Market value Unrealized gain or loss
posted to income
statement
Available for Sale Market value Unrealized gain or loss
posted directly to equity
Held to Maturity Book Cost
(Face value –/+ unamortized
discount/premium)
Not marked to market
The role in ALM
For a sound ALM function; the banking investment portfolio plays a pivotal role in both of its
risk management and profitability objectives as follows:
Risk Management:
o Liquidity risk:
The portfolio is composed of highly liquid assets with an active secondary
market (especially, T-Bills) which provides for a dependable source of funds
in case of liquidity shortage or even crisis.
o Interest rate risk:
With various ranges of maturities available in T-Bills (3, 6, 9, and 12months)
and T-Bonds (mainly 3, 5, 7, and 10years); the portfolio is an effective tool
that could be used to alter banks’ DOE and reduce exposure to interest rate
risk.
Not
For
Rel
ease
Participant Guide
DD08-V3 5-15
Profitability:
As a secondary objective, the banking investment portfolio could provide for a
lucrative return, thus, enhance the bank’s NIM record.
This was particularly evident during the recent years post January 2011. Due to the
economic/political unrest and market turmoil witnessed post revolution, the lending
activity largely slowed down. Most of the banks kept their strategy to acquire more
market share in play. The resulting excess liquidity had no utilization alternative
rather than investing in governmental securities as part of the banking investment
book.
With the elevated country risk levels and withdrawal of foreign investors who usually
calm yields down; the increase in sovereigns’ balances was coupled with historical
hikes in yields.
Despite the fact that this had improved some banks’ profitability and NIMs
considerably, but this is not expected to last forever. As signs of market stability have
appeared, yields are calming down and on the downward trend, leaving banks with no
choice but to return to the strategic core business of lending to corporate and retail
customers even if this might put some pressure on the banks’ spreads in the near
future.
Not
For
Rel
ease

Participant Guide
DD08-V3 5-16
Exercises
Simulation Approaches
Instructions:
1. Identify the difference between Static and dynamic simulation approaches?
Duration
Instructions:
2. Corporate bonds usually pay interest semiannually. If a company decided to change from
semiannual to annual interest payments, how would this affect the bond’s interest rate risk?
Not
For
Rel
ease
Participant Guide
DD08-V3 5-17
Summary In this module, you learned how to:
Explain the meaning, sources, and effects of interest rate risk
Describe how to forecast and plan for interest rate movements from a simplified approach,
recognizing the tradeoff between targeting inflation on the one hand and growth and
employment on the other.
Recognize the Monetary Policy Committee (MPC) incentives for policy rate hike/drop
Explain the Gap and Duration analysis as measurement techniques of interest rate risk
Describe a general framework for interest rate risk management
Identify the difference between static vs. dynamic simulation approaches
Describe the banking investment portfolio; its nature, components and accounting
treatment, and the role it plays in ALM.
Not
For
Rel
ease