Embed Size (px)
Citation preview
Recalculated probability of M ������ 7 earthquakes beneath the Sea of
Marmara, Turkey
Tom ParsonsU.S. Geological Survey, Menlo Park, California, USA
Received 1 July 2003; revised 23 December 2003; accepted 5 February 2004; published 22 May 2004.
[1] New earthquake probability calculations are made for the Sea of Marmara region andthe city of Istanbul, providing a revised forecast and an evaluation of time-dependentinteraction techniques. Calculations incorporate newly obtained bathymetric images of theNorth Anatolian fault beneath the Sea of Marmara [Le Pichon et al., 2001; Armijo et al.,2002]. Newly interpreted fault segmentation enables an improved regional A.D. 1500–2000 earthquake catalog and interevent model, which form the basis for time-dependentprobability estimates. Calculations presented here also employ detailed models ofcoseismic and postseismic slip associated with the 17 August 1999 M = 7.4 Izmitearthquake to investigate effects of stress transfer on seismic hazard. Probability changescaused by the 1999 shock depend on Marmara Sea fault-stressing rates, which arecalculated with a new finite element model. The combined 2004–2034 regional Poissonprobability of M � 7 earthquakes is �38%, the regional time-dependent probability is44 ± 18%, and incorporation of stress transfer raises it to 53 ± 18%. The most importanteffect of adding time dependence and stress transfer to the calculations is an increase in the30 year probability of a M � 7 earthquake affecting Istanbul. The 30 year Poissonprobability at Istanbul is 21%, and the addition of time dependence and stress transferraises it to 41 ± 14%. The ranges given on probability values are sensitivities of thecalculations to input parameters determined by Monte Carlo analysis; 1000 calculationsare made using parameters drawn at random from distributions. Sensitivities are largerelative to mean probability values and enhancements caused by stress transfer, reflectinga poor understanding of large-earthquake aperiodicity. INDEX TERMS: 7223 Seismology:
Seismic hazard assessment and prediction; 7230 Seismology: Seismicity and seismotectonics; 8150
Tectonophysics: Plate boundary—general (3040); KEYWORDS: earthquake probability, Sea of Marmara,
seismic hazard, Turkey, stress interaction, North Anatolian fault
Citation: Parsons, T. (2004), Recalculated probability of M � 7 earthquakes beneath the Sea of Marmara, Turkey, J. Geophys. Res.,
109, B05304, doi:10.1029/2003JB002667.
1. Introduction
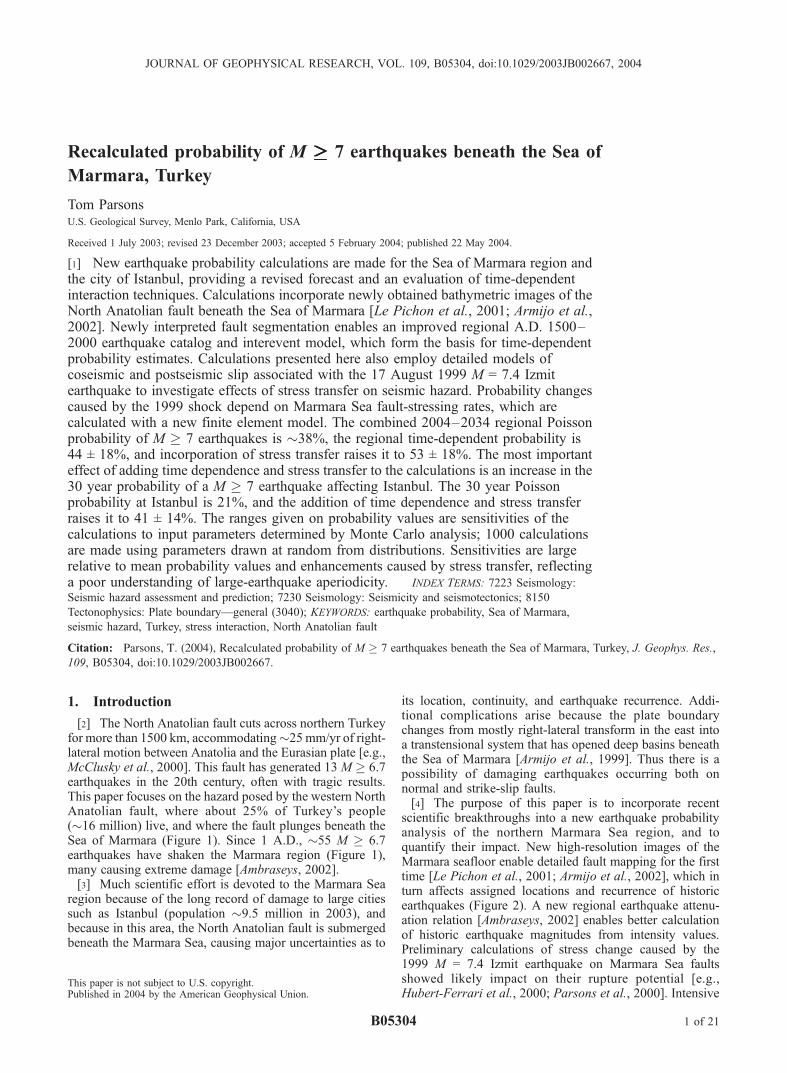
[2] The North Anatolian fault cuts across northern Turkeyfor more than 1500 km, accommodating�25mm/yr of right-lateral motion between Anatolia and the Eurasian plate [e.g.,McClusky et al., 2000]. This fault has generated 13 M � 6.7earthquakes in the 20th century, often with tragic results.This paper focuses on the hazard posed by the western NorthAnatolian fault, where about 25% of Turkey’s people(�16 million) live, and where the fault plunges beneath theSea of Marmara (Figure 1). Since 1 A.D., �55 M � 6.7earthquakes have shaken the Marmara region (Figure 1),many causing extreme damage [Ambraseys, 2002].[3] Much scientific effort is devoted to the Marmara Sea
region because of the long record of damage to large citiessuch as Istanbul (population �9.5 million in 2003), andbecause in this area, the North Anatolian fault is submergedbeneath the Marmara Sea, causing major uncertainties as to
its location, continuity, and earthquake recurrence. Addi-tional complications arise because the plate boundarychanges from mostly right-lateral transform in the east intoa transtensional system that has opened deep basins beneaththe Sea of Marmara [Armijo et al., 1999]. Thus there is apossibility of damaging earthquakes occurring both onnormal and strike-slip faults.[4] The purpose of this paper is to incorporate recent
scientific breakthroughs into a new earthquake probabilityanalysis of the northern Marmara Sea region, and toquantify their impact. New high-resolution images of theMarmara seafloor enable detailed fault mapping for the firsttime [Le Pichon et al., 2001; Armijo et al., 2002], which inturn affects assigned locations and recurrence of historicearthquakes (Figure 2). A new regional earthquake attenu-ation relation [Ambraseys, 2002] enables better calculationof historic earthquake magnitudes from intensity values.Preliminary calculations of stress change caused by the1999 M = 7.4 Izmit earthquake on Marmara Sea faultsshowed likely impact on their rupture potential [e.g.,Hubert-Ferrari et al., 2000; Parsons et al., 2000]. Intensive
JOURNAL OF GEOPHYSICAL RESEARCH, VOL. 109, B05304, doi:10.1029/2003JB002667, 2004
This paper is not subject to U.S. copyright.Published in 2004 by the American Geophysical Union.
B05304 1 of 21
study of the Izmit earthquake has resulted in more detailedmodels for coseismic and postseismic slip [Reilinger et al.,2000; Bouchon et al., 2002; Burgmann et al., 2002; DeLouis et al., 2002; Li et al., 2002], which improve stresschange calculations on Marmara Sea faults, as do theimproved fault locations [Le Pichon et al., 2001; Armijoet al., 2002].[5] To recalculate the probability of earthquakes beneath
the Sea of Marmara, I first develop a new earthquake catalogfor the period between A.D. 1500 and 2000 using newfault maps and the technique of Bakun and Wentworth[1997] modified with the regional attenuation relation ofAmbraseys [2002]. This catalog enables new interevent andelapsed time values for use in probability calculations. Next,new coseismic and postseismic models of Izmit earthquakeslip are used to calculate stress changes on the new MarmaraSea fault model; resulting earthquake advances and delaysare calculated using these stress change values and newtectonic loading rates determined from finite element model-ing of the Sea of Marmara segment of the North Anatolianfault. Results from these modeling exercises are used tomake up-to-date probability calculations for the MarmaraSea that fully incorporate coseismic and postseismic stressinteractions from the 1999 Izmit earthquake.
2. M �������� 7 Earthquake Catalog: A.D. 1500––2000
[6] In the period between A.D. 1500 and 2000, nine M �7 earthquakes occurred beneath, or partly beneath, theSea of Marmara (Figure 3), a mean rate of one every�60 years. Large earthquakes are documented back to1 A.D. [Ambraseys, 2002] (Figure 1), but damage descrip-tions from broadly distributed geographic locations beginwith the 1509 Marmara Sea earthquake [Ambraseys andFinkel, 1990, 1991, 1995]. These observations are requiredfor the quantitative approach to historic earthquake loca-tions and magnitudes used here.
2.1. Methods
[7] Published accounts of damage caused by Marmara Seaearthquakes [Ambraseys and Finkel, 1990, 1991, 1995] were
interpreted on the Modified Mercalli intensity (MMI) scalefor eight earthquakes from A.D. 1500 to 2000 (Table 1)[Parsons et al., 2000]; earthquakes in 1912 and 1999 wereincluded for test purposes because instrumental locations
Figure 1. Segments of the North Anatolian fault beneath the Sea of Marmara [Armijo et al., 2002] andlocations of Ms � 6.6 earthquakes (A.D. 1–1999) as located by Ambraseys [2002].
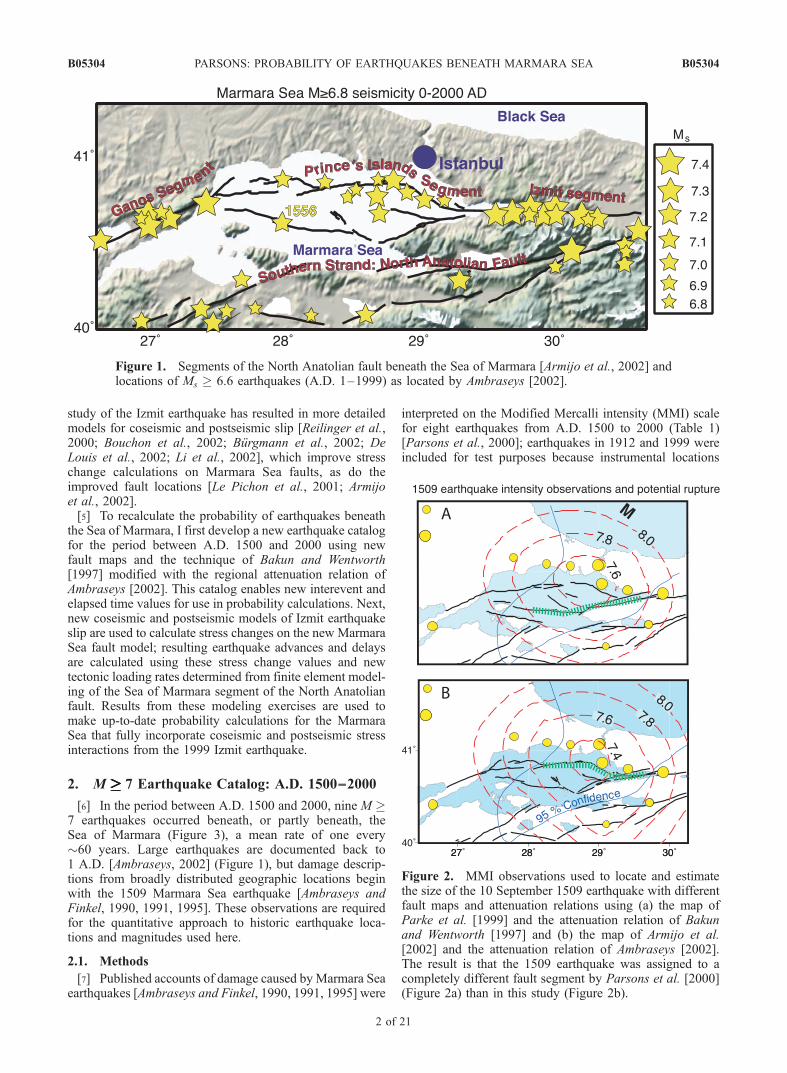
Figure 2. MMI observations used to locate and estimatethe size of the 10 September 1509 earthquake with differentfault maps and attenuation relations using (a) the map ofParke et al. [1999] and the attenuation relation of Bakunand Wentworth [1997] and (b) the map of Armijo et al.[2002] and the attenuation relation of Ambraseys [2002].The result is that the 1509 earthquake was assigned to acompletely different fault segment by Parsons et al. [2000](Figure 2a) than in this study (Figure 2b).
B05304 PARSONS: PROBABILITY OF EARTHQUAKES BENEATH MARMARA SEA
2 of 21
B05304
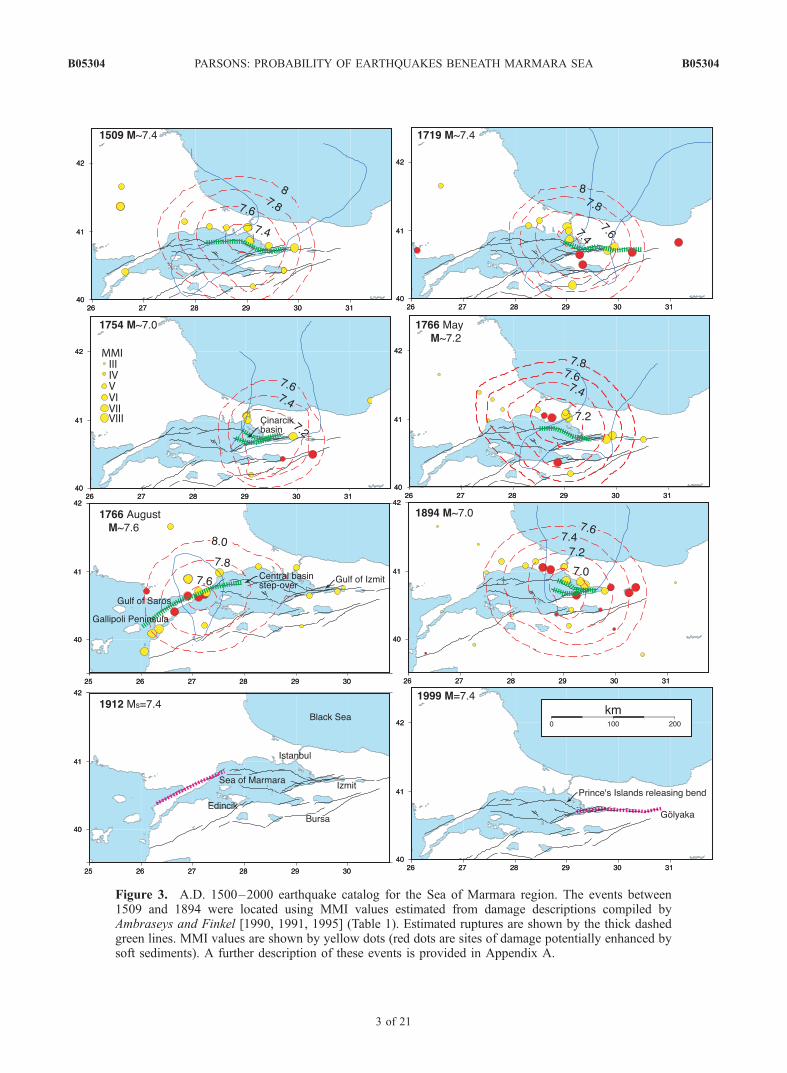
Figure 3. A.D. 1500–2000 earthquake catalog for the Sea of Marmara region. The events between1509 and 1894 were located using MMI values estimated from damage descriptions compiled byAmbraseys and Finkel [1990, 1991, 1995] (Table 1). Estimated ruptures are shown by the thick dashedgreen lines. MMI values are shown by yellow dots (red dots are sites of damage potentially enhanced bysoft sediments). A further description of these events is provided in Appendix A.
B05304 PARSONS: PROBABILITY OF EARTHQUAKES BENEATH MARMARA SEA
3 of 21
B05304
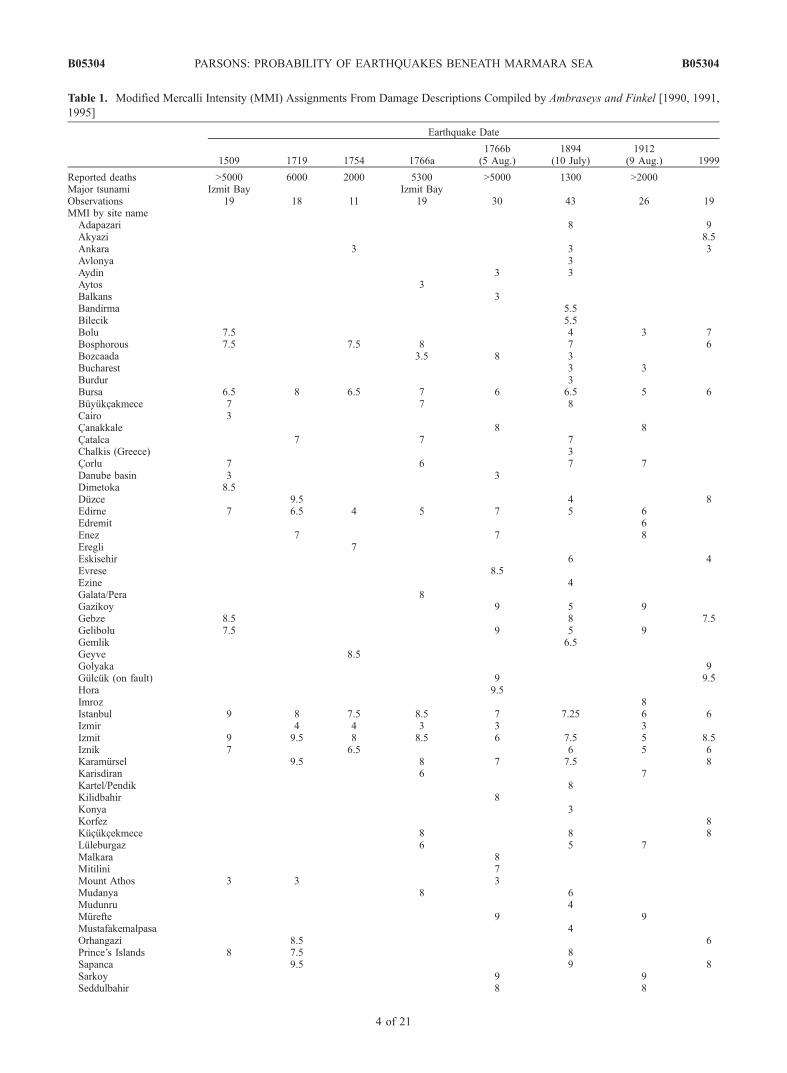
Table 1. Modified Mercalli Intensity (MMI) Assignments From Damage Descriptions Compiled by Ambraseys and Finkel [1990, 1991,
1995]
Earthquake Date
1509 1719 1754 1766a1766b(5 Aug.)
1894(10 July)
1912(9 Aug.) 1999
Reported deaths >5000 6000 2000 5300 >5000 1300 >2000Major tsunami Izmit Bay Izmit BayObservations 19 18 11 19 30 43 26 19MMI by site name
Adapazari 8 9Akyazi 8.5Ankara 3 3 3Avlonya 3Aydin 3 3Aytos 3Balkans 3Bandirma 5.5Bilecik 5.5Bolu 7.5 4 3 7Bosphorous 7.5 7.5 8 7 6Bozcaada 3.5 8 3Bucharest 3 3Burdur 3Bursa 6.5 8 6.5 7 6 6.5 5 6Buyukcakmece 7 7 8Cairo 3Canakkale 8 8Catalca 7 7 7Chalkis (Greece) 3Corlu 7 6 7 7Danube basin 3 3Dimetoka 8.5Duzce 9.5 4 8Edirne 7 6.5 4 5 7 5 6Edremit 6Enez 7 7 8Eregli 7Eskisehir 6 4Evrese 8.5Ezine 4Galata/Pera 8Gazikoy 9 5 9Gebze 8.5 8 7.5Gelibolu 7.5 9 5 9Gemlik 6.5Geyve 8.5Golyaka 9Gulcuk (on fault) 9 9.5Hora 9.5Imroz 8Istanbul 9 8 7.5 8.5 7 7.25 6 6Izmir 4 4 3 3 3Izmit 9 9.5 8 8.5 6 7.5 5 8.5Iznik 7 6.5 6 5 6Karamursel 9.5 8 7 7.5 8Karisdiran 6 7Kartel/Pendik 8Kilidbahir 8Konya 3Korfez 8Kucukcekmece 8 8 8Luleburgaz 6 5 7Malkara 8Mitilini 7Mount Athos 3 3 3Mudanya 8 6Mudunru 4Murefte 9 9Mustafakemalpasa 4Orhangazi 8.5 6Prince’s Islands 8 7.5 8Sapanca 9.5 9 8Sarkoy 9 9Seddulbahir 8 8
B05304 PARSONS: PROBABILITY OF EARTHQUAKES BENEATH MARMARA SEA
4 of 21
B05304
and magnitudes are available. MMI values were assigned to200 damage descriptions (Table 1), and the method of Bakunand Wentworth [1997] was used to infer M and epicentrallocation from MMI through an empirical attenuation rela-tion. The original relation used by Bakun and Wentworth[1997] is
Mi ¼ MMIi þ 3:29þ 0:0206dið Þ=1:68; ð1Þ
where di is distance in km between intensity (MMI)observation and epicenter, and was developed from 30California shocks with both intensity and instrumentalobservations. This expression was replaced in this study by
Msi ¼ �1:54þ 0:65 MMIið Þ þ 0:0029di þ 2:14 log dið Þ; ð2Þ
where moment magnitude (M) is determined from surfacewave magnitude (Ms) using
log Mið Þ ¼ 16:07þ 1:5Msi ð3Þ
[Ambraseys, 2002]. The RMS fit to this relation iscalculated for trial locations on a 5 � 5 km-spaced grid.Felt reports (MMI < IV) were excluded and MMI > VIIIobservations were saturated to VIII because criteria forhigher intensities involve observations other than buildingdamage, and because for poorly constructed, or degradedmasonry, damage may be total at MMI = VIII. The Bakunand Wentworth [1997] method uses a grid search for anintensity center; thus distance in equation (1) is to a pointsource. However in the near field and for the largest MMIvalues, distance (di) in the attenuation relation of Ambraseys[2002] is not epicentral, but is instead the nearest distance tothe earthquake rupture plane. Far from the fault rupture,distances between an intensity observation point and anypoint along the rupture are not substantially different. Thisis not true very close to the rupture plane, thus equation (2)cannot be used in the Bakun and Wentworth [1997] method,and equation (1) is used instead. Ambraseys [2002]provided criteria for where equation (2) is epicentral, whichare adopted here, and investigated the differences betweenequation (1) and equation (2), which do not tend to be largein the near field.
[8] The input MMI values yield an output grid ofmoment magnitudes and confidence intervals. The histor-ical earthquake rupture most consistent with the MMI datawould be the one that minimizes M and falls within 95%confidence bounds on minimized misfit to input MMIvalues. The historical earthquake rupture must be associ-ated with a fault; the segment nearest the zone of mini-mum magnitude of sufficient length to accommodate therupture is identified as the earthquake source. Additionally,the rupture is centered in the 95% confidence interval(Figures 2 and 3).[9] The historic earthquake location process is highly
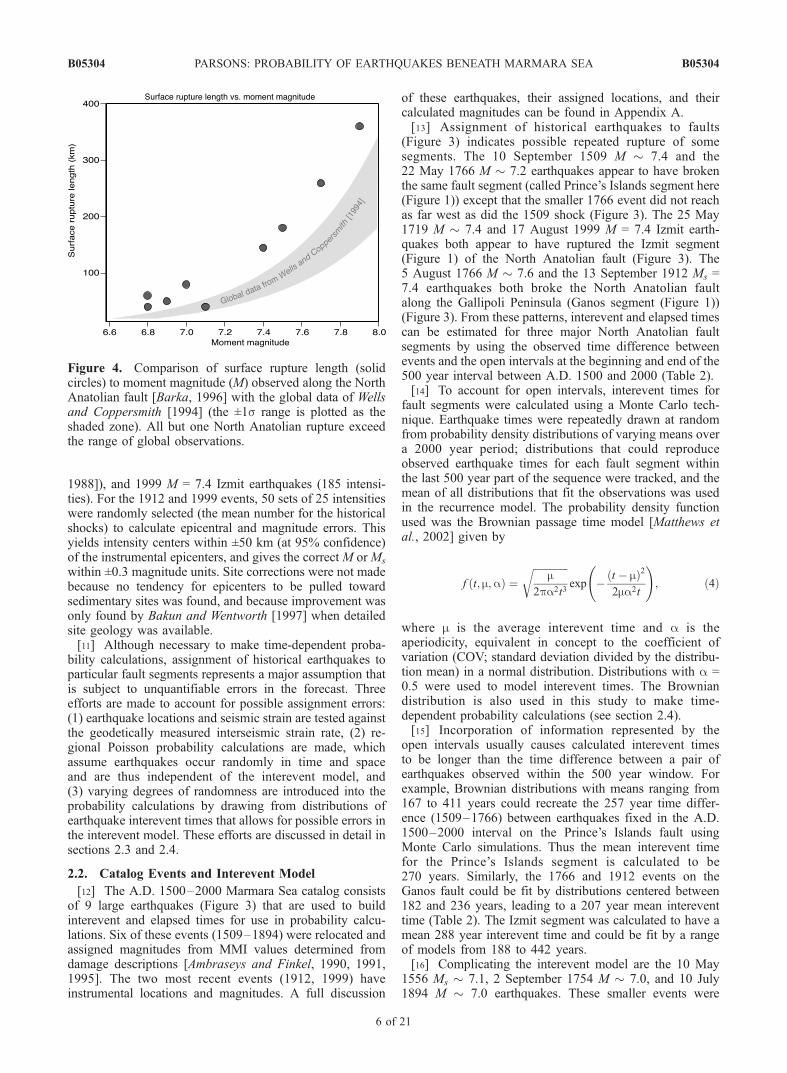
dependent on the input data. Parsons et al. [2000]located historic Marmara Sea events with a map byParke et al. [1999] (based on seismic reflection profiles),estimated rupture lengths and the mean slip from empir-ical relations on M for continental strike-slip faults [Wellsand Coppersmith, 1994], and used the original attenua-tion relation of Bakun and Wentworth [1997] (equation (1)).In this study the new map of Armijo et al. [2002] is used,which is based on multibeam bathymetry, and which showsmore continuous strike-slip fault segments (Figure 2). Sur-face rupture lengths along the North Anatolian fault [Barka,1996] are found to be longer than the global mean of Wellsand Coppersmith [1994], exceeding one standard deviation(Figure 4). The combined use of the new fault map, the newregression of rupture length and M, and the new attenuationrelation (equation (2)) leads to different historic earthquakelocation from MMI values. For example, Parsons et al.[2000] calculated the 1509 earthquake to have beenM� 7.6,and located the event on a combination of interpreted strike-slip and normal faults in the southern Sea of Marmara(Figure 2a). In this study the event isM � 7.4, and is locatedon a more continuous segment of the North Anatolian faultin the north Sea of Marmara (Figure 2b). These differenceshave important ramifications for earthquake interevent timesand time elapsed since the last rupture of a given faultsegment.[10] Marmara Sea earthquakes associated with both in-
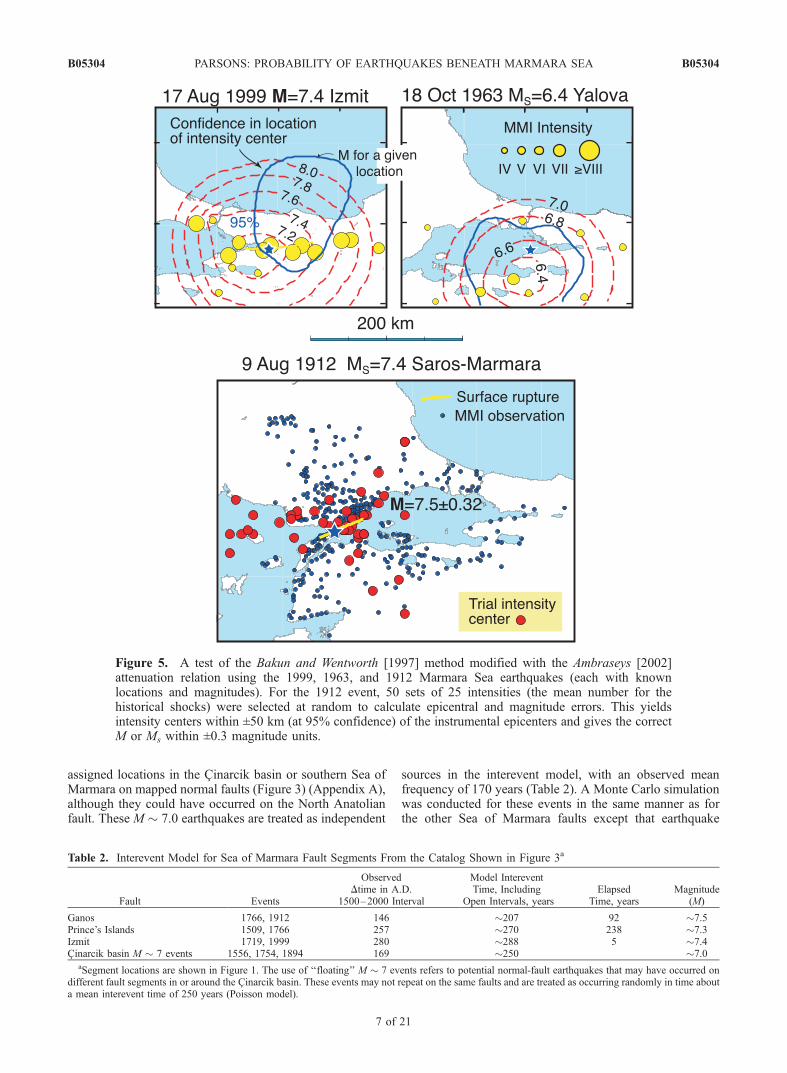
tensity and instrumental data were used to test the locationtechnique (Figure 5). These include the 1912 Ms = 7.4Saros-Marmara (360 intensities [Ambraseys and Finkel,1987]), 1963 Ms = 6.4 Yalova (11 intensities [Ambraseys,
Table 1. (continued)
Earthquake Date
1509 1719 1754 1766a1766b(5 Aug.)
1894(10 July)
1912(9 Aug.) 1999
Siebenburg 3Silivri 7 7Silivri (north of) 7Sofia (Bulgaria) 3 3Sopron 3Tanem 3Tekirdag 6 8.5 6 8Thasos 6Thessaloniki 4 3 3 3Uskudar 7.5 7.5Vienna 3Yalova 10 7 8.5 5 8Yannina (Iannina) 3Yenice 5.5Yesilkoy/St. Stephano 7.5
B05304 PARSONS: PROBABILITY OF EARTHQUAKES BENEATH MARMARA SEA
5 of 21
B05304
1988]), and 1999 M = 7.4 Izmit earthquakes (185 intensi-ties). For the 1912 and 1999 events, 50 sets of 25 intensitieswere randomly selected (the mean number for the historicalshocks) to calculate epicentral and magnitude errors. Thisyields intensity centers within ±50 km (at 95% confidence)of the instrumental epicenters, and gives the correct M orMs
within ±0.3 magnitude units. Site corrections were not madebecause no tendency for epicenters to be pulled towardsedimentary sites was found, and because improvement wasonly found by Bakun and Wentworth [1997] when detailedsite geology was available.[11] Although necessary to make time-dependent proba-
bility calculations, assignment of historical earthquakes toparticular fault segments represents a major assumption thatis subject to unquantifiable errors in the forecast. Threeefforts are made to account for possible assignment errors:(1) earthquake locations and seismic strain are tested againstthe geodetically measured interseismic strain rate, (2) re-gional Poisson probability calculations are made, whichassume earthquakes occur randomly in time and spaceand are thus independent of the interevent model, and(3) varying degrees of randomness are introduced into theprobability calculations by drawing from distributions ofearthquake interevent times that allows for possible errors inthe interevent model. These efforts are discussed in detail insections 2.3 and 2.4.
2.2. Catalog Events and Interevent Model
[12] The A.D. 1500–2000 Marmara Sea catalog consistsof 9 large earthquakes (Figure 3) that are used to buildinterevent and elapsed times for use in probability calcu-lations. Six of these events (1509–1894) were relocated andassigned magnitudes from MMI values determined fromdamage descriptions [Ambraseys and Finkel, 1990, 1991,1995]. The two most recent events (1912, 1999) haveinstrumental locations and magnitudes. A full discussion
of these earthquakes, their assigned locations, and theircalculated magnitudes can be found in Appendix A.[13] Assignment of historical earthquakes to faults
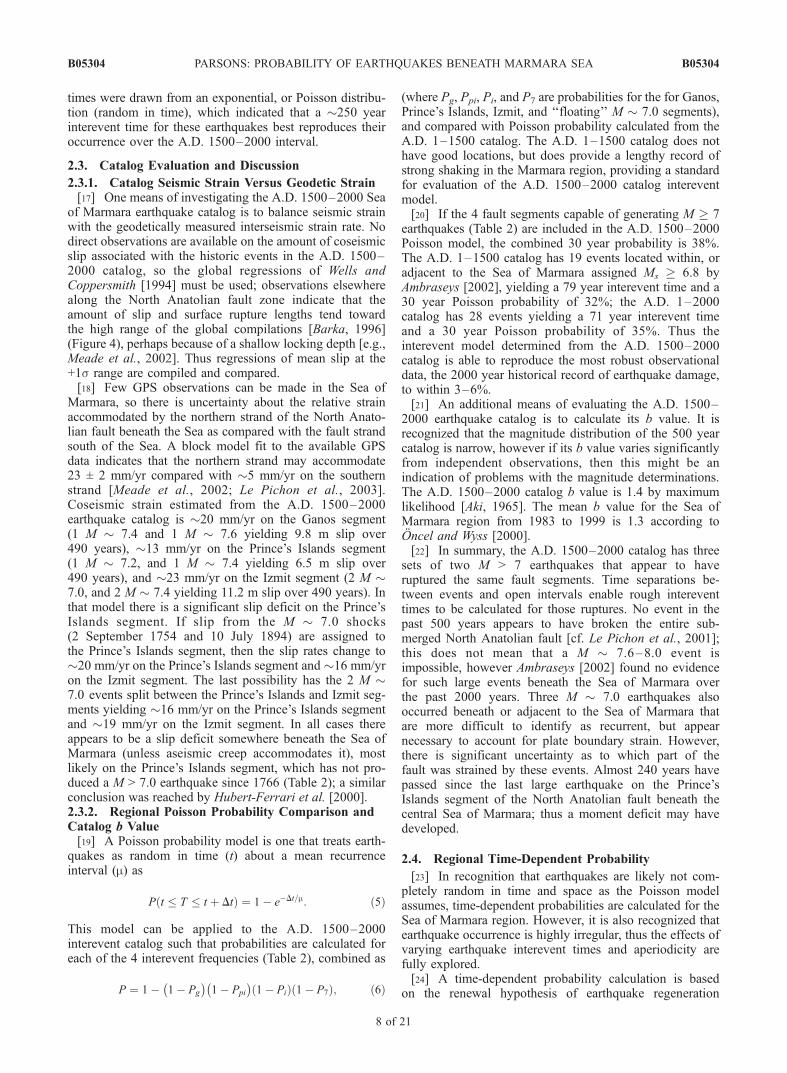
(Figure 3) indicates possible repeated rupture of somesegments. The 10 September 1509 M � 7.4 and the22 May 1766 M � 7.2 earthquakes appear to have brokenthe same fault segment (called Prince’s Islands segment here(Figure 1)) except that the smaller 1766 event did not reachas far west as did the 1509 shock (Figure 3). The 25 May1719 M � 7.4 and 17 August 1999 M = 7.4 Izmit earth-quakes both appear to have ruptured the Izmit segment(Figure 1) of the North Anatolian fault (Figure 3). The5 August 1766 M � 7.6 and the 13 September 1912 Ms =7.4 earthquakes both broke the North Anatolian faultalong the Gallipoli Peninsula (Ganos segment (Figure 1))(Figure 3). From these patterns, interevent and elapsed timescan be estimated for three major North Anatolian faultsegments by using the observed time difference betweenevents and the open intervals at the beginning and end of the500 year interval between A.D. 1500 and 2000 (Table 2).[14] To account for open intervals, interevent times for
fault segments were calculated using a Monte Carlo tech-nique. Earthquake times were repeatedly drawn at randomfrom probability density distributions of varying means overa 2000 year period; distributions that could reproduceobserved earthquake times for each fault segment withinthe last 500 year part of the sequence were tracked, and themean of all distributions that fit the observations was usedin the recurrence model. The probability density functionused was the Brownian passage time model [Matthews etal., 2002] given by
f t; m;að Þ ¼ffiffiffiffiffiffiffiffiffiffiffiffiffiffi
m2pa2t3
rexp � t � mð Þ2
2ma2t
!; ð4Þ
where m is the average interevent time and a is theaperiodicity, equivalent in concept to the coefficient ofvariation (COV; standard deviation divided by the distribu-tion mean) in a normal distribution. Distributions with a =0.5 were used to model interevent times. The Browniandistribution is also used in this study to make time-dependent probability calculations (see section 2.4).[15] Incorporation of information represented by the
open intervals usually causes calculated interevent timesto be longer than the time difference between a pair ofearthquakes observed within the 500 year window. Forexample, Brownian distributions with means ranging from167 to 411 years could recreate the 257 year time differ-ence (1509–1766) between earthquakes fixed in the A.D.1500–2000 interval on the Prince’s Islands fault usingMonte Carlo simulations. Thus the mean interevent timefor the Prince’s Islands segment is calculated to be270 years. Similarly, the 1766 and 1912 events on theGanos fault could be fit by distributions centered between182 and 236 years, leading to a 207 year mean intereventtime (Table 2). The Izmit segment was calculated to have amean 288 year interevent time and could be fit by a rangeof models from 188 to 442 years.[16] Complicating the interevent model are the 10 May
1556 Ms � 7.1, 2 September 1754 M � 7.0, and 10 July1894 M � 7.0 earthquakes. These smaller events were
Figure 4. Comparison of surface rupture length (solidcircles) to moment magnitude (M) observed along the NorthAnatolian fault [Barka, 1996] with the global data of Wellsand Coppersmith [1994] (the ±1s range is plotted as theshaded zone). All but one North Anatolian rupture exceedthe range of global observations.
B05304 PARSONS: PROBABILITY OF EARTHQUAKES BENEATH MARMARA SEA
6 of 21
B05304
assigned locations in the Cinarcik basin or southern Sea ofMarmara on mapped normal faults (Figure 3) (Appendix A),although they could have occurred on the North Anatolianfault. These M � 7.0 earthquakes are treated as independent
sources in the interevent model, with an observed meanfrequency of 170 years (Table 2). A Monte Carlo simulationwas conducted for these events in the same manner as forthe other Sea of Marmara faults except that earthquake
Figure 5. A test of the Bakun and Wentworth [1997] method modified with the Ambraseys [2002]attenuation relation using the 1999, 1963, and 1912 Marmara Sea earthquakes (each with knownlocations and magnitudes). For the 1912 event, 50 sets of 25 intensities (the mean number for thehistorical shocks) were selected at random to calculate epicentral and magnitude errors. This yieldsintensity centers within ±50 km (at 95% confidence) of the instrumental epicenters and gives the correctM or Ms within ±0.3 magnitude units.
Table 2. Interevent Model for Sea of Marmara Fault Segments From the Catalog Shown in Figure 3a
Fault Events
ObservedDtime in A.D.
1500–2000 Interval
Model IntereventTime, Including
Open Intervals, yearsElapsed
Time, yearsMagnitude
(M)
Ganos 1766, 1912 146 �207 92 �7.5Prince’s Islands 1509, 1766 257 �270 238 �7.3Izmit 1719, 1999 280 �288 5 �7.4Cinarcik basin M � 7 events 1556, 1754, 1894 169 �250 �7.0
aSegment locations are shown in Figure 1. The use of ‘‘floating’’ M � 7 events refers to potential normal-fault earthquakes that may have occurred ondifferent fault segments in or around the Cinarcik basin. These events may not repeat on the same faults and are treated as occurring randomly in time abouta mean interevent time of 250 years (Poisson model).
B05304 PARSONS: PROBABILITY OF EARTHQUAKES BENEATH MARMARA SEA
7 of 21
B05304
times were drawn from an exponential, or Poisson distribu-tion (random in time), which indicated that a �250 yearinterevent time for these earthquakes best reproduces theiroccurrence over the A.D. 1500–2000 interval.
2.3. Catalog Evaluation and Discussion
2.3.1. Catalog Seismic Strain Versus Geodetic Strain[17] One means of investigating the A.D. 1500–2000 Sea
of Marmara earthquake catalog is to balance seismic strainwith the geodetically measured interseismic strain rate. Nodirect observations are available on the amount of coseismicslip associated with the historic events in the A.D. 1500–2000 catalog, so the global regressions of Wells andCoppersmith [1994] must be used; observations elsewherealong the North Anatolian fault zone indicate that theamount of slip and surface rupture lengths tend towardthe high range of the global compilations [Barka, 1996](Figure 4), perhaps because of a shallow locking depth [e.g.,Meade et al., 2002]. Thus regressions of mean slip at the+1s range are compiled and compared.[18] Few GPS observations can be made in the Sea of
Marmara, so there is uncertainty about the relative strainaccommodated by the northern strand of the North Anato-lian fault beneath the Sea as compared with the fault strandsouth of the Sea. A block model fit to the available GPSdata indicates that the northern strand may accommodate23 ± 2 mm/yr compared with �5 mm/yr on the southernstrand [Meade et al., 2002; Le Pichon et al., 2003].Coseismic strain estimated from the A.D. 1500–2000earthquake catalog is �20 mm/yr on the Ganos segment(1 M � 7.4 and 1 M � 7.6 yielding 9.8 m slip over490 years), �13 mm/yr on the Prince’s Islands segment(1 M � 7.2, and 1 M � 7.4 yielding 6.5 m slip over490 years), and �23 mm/yr on the Izmit segment (2 M �7.0, and 2 M � 7.4 yielding 11.2 m slip over 490 years). Inthat model there is a significant slip deficit on the Prince’sIslands segment. If slip from the M � 7.0 shocks(2 September 1754 and 10 July 1894) are assigned tothe Prince’s Islands segment, then the slip rates change to�20 mm/yr on the Prince’s Islands segment and �16 mm/yron the Izmit segment. The last possibility has the 2 M �7.0 events split between the Prince’s Islands and Izmit seg-ments yielding �16 mm/yr on the Prince’s Islands segmentand �19 mm/yr on the Izmit segment. In all cases thereappears to be a slip deficit somewhere beneath the Sea ofMarmara (unless aseismic creep accommodates it), mostlikely on the Prince’s Islands segment, which has not pro-duced a M > 7.0 earthquake since 1766 (Table 2); a similarconclusion was reached by Hubert-Ferrari et al. [2000].2.3.2. Regional Poisson Probability Comparison andCatalog b Value[19] A Poisson probability model is one that treats earth-
quakes as random in time (t) about a mean recurrenceinterval (m) as
P t T t þ Dtð Þ ¼ 1� e�Dt=m: ð5Þ
This model can be applied to the A.D. 1500–2000interevent catalog such that probabilities are calculated foreach of the 4 interevent frequencies (Table 2), combined as
P ¼ 1� 1� Pg
� �1� Ppi
� �1� Pið Þ 1� P7ð Þ; ð6Þ
(where Pg, Ppi, Pi, and P7 are probabilities for the for Ganos,Prince’s Islands, Izmit, and ‘‘floating’’ M � 7.0 segments),and compared with Poisson probability calculated from theA.D. 1–1500 catalog. The A.D. 1–1500 catalog does nothave good locations, but does provide a lengthy record ofstrong shaking in the Marmara region, providing a standardfor evaluation of the A.D. 1500–2000 catalog intereventmodel.[20] If the 4 fault segments capable of generating M � 7
earthquakes (Table 2) are included in the A.D. 1500–2000Poisson model, the combined 30 year probability is 38%.The A.D. 1–1500 catalog has 19 events located within, oradjacent to the Sea of Marmara assigned Ms � 6.8 byAmbraseys [2002], yielding a 79 year interevent time and a30 year Poisson probability of 32%; the A.D. 1–2000catalog has 28 events yielding a 71 year interevent timeand a 30 year Poisson probability of 35%. Thus theinterevent model determined from the A.D. 1500–2000catalog is able to reproduce the most robust observationaldata, the 2000 year historical record of earthquake damage,to within 3–6%.[21] An additional means of evaluating the A.D. 1500–
2000 earthquake catalog is to calculate its b value. It isrecognized that the magnitude distribution of the 500 yearcatalog is narrow, however if its b value varies significantlyfrom independent observations, then this might be anindication of problems with the magnitude determinations.The A.D. 1500–2000 catalog b value is 1.4 by maximumlikelihood [Aki, 1965]. The mean b value for the Sea ofMarmara region from 1983 to 1999 is 1.3 according toOncel and Wyss [2000].[22] In summary, the A.D. 1500–2000 catalog has three
sets of two M > 7 earthquakes that appear to haveruptured the same fault segments. Time separations be-tween events and open intervals enable rough intereventtimes to be calculated for those ruptures. No event in thepast 500 years appears to have broken the entire sub-merged North Anatolian fault [cf. Le Pichon et al., 2001];this does not mean that a M � 7.6–8.0 event isimpossible, however Ambraseys [2002] found no evidencefor such large events beneath the Sea of Marmara overthe past 2000 years. Three M � 7.0 earthquakes alsooccurred beneath or adjacent to the Sea of Marmara thatare more difficult to identify as recurrent, but appearnecessary to account for plate boundary strain. However,there is significant uncertainty as to which part of thefault was strained by these events. Almost 240 years havepassed since the last large earthquake on the Prince’sIslands segment of the North Anatolian fault beneath thecentral Sea of Marmara; thus a moment deficit may havedeveloped.
2.4. Regional Time-Dependent Probability
[23] In recognition that earthquakes are likely not com-pletely random in time and space as the Poisson modelassumes, time-dependent probabilities are calculated for theSea of Marmara region. However, it is also recognized thatearthquake occurrence is highly irregular, thus the effects ofvarying earthquake interevent times and aperiodicity arefully explored.[24] A time-dependent probability calculation is based
on the renewal hypothesis of earthquake regeneration
B05304 PARSONS: PROBABILITY OF EARTHQUAKES BENEATH MARMARA SEA
8 of 21
B05304
wherein the likelihood of an earthquake on a givenfault is lowest just after the last shock. As tectonicstress builds over time, the odds of another earthquakegrow. A time-dependent probability calculation sums a
probability density function f(t) that mimics this tendencyas
P t T t þ Dtð Þ ¼Z tþDt
t
f tð Þdt; ð7Þ
where f(t) can be any distribution, such as lognormal [e.g.,Nishenko and Buland, 1987], Weibull [Hagiwara, 1974], orBrownian Passage Time [Matthews et al., 2002]; theBrownian model is used in this study and is given byequation (4). The breadth of the chosen distribution isrepresentative of the irregularity, or aperiodicity of earth-quake recurrence.[25] The A.D. 1500–2000 catalog is not adequate to
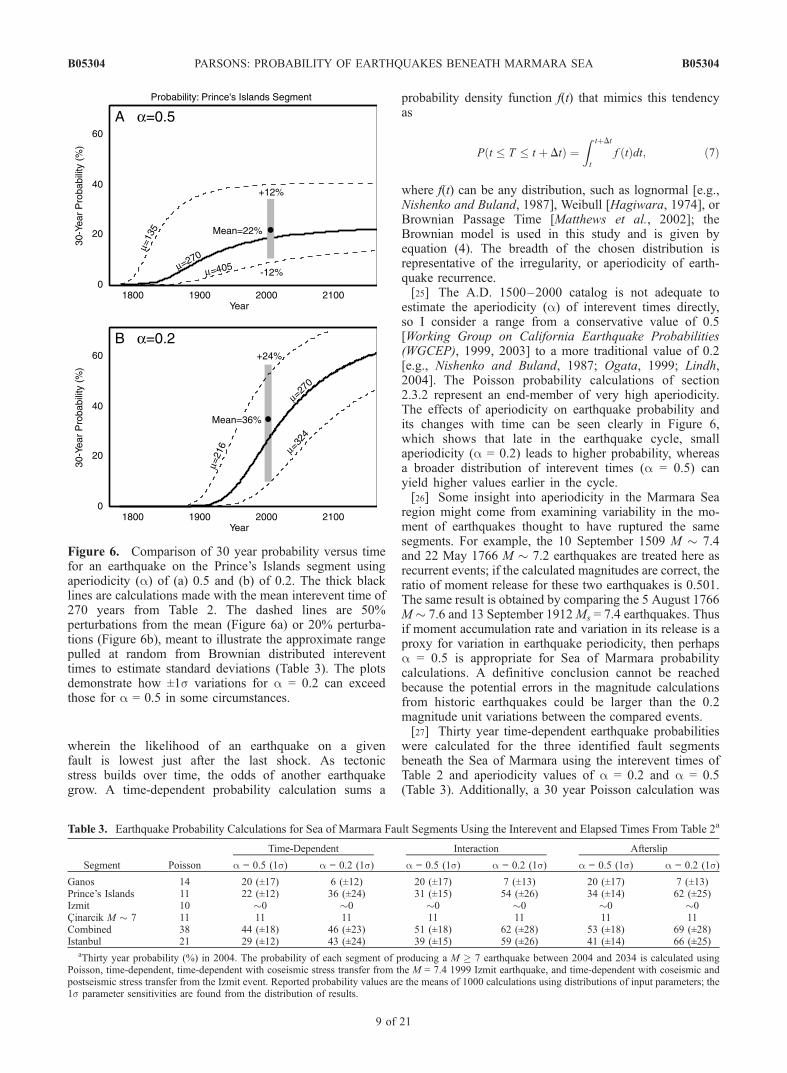
estimate the aperiodicity (a) of interevent times directly,so I consider a range from a conservative value of 0.5[Working Group on California Earthquake Probabilities(WGCEP), 1999, 2003] to a more traditional value of 0.2[e.g., Nishenko and Buland, 1987; Ogata, 1999; Lindh,2004]. The Poisson probability calculations of section2.3.2 represent an end-member of very high aperiodicity.The effects of aperiodicity on earthquake probability andits changes with time can be seen clearly in Figure 6,which shows that late in the earthquake cycle, smallaperiodicity (a = 0.2) leads to higher probability, whereasa broader distribution of interevent times (a = 0.5) canyield higher values earlier in the cycle.[26] Some insight into aperiodicity in the Marmara Sea
region might come from examining variability in the mo-ment of earthquakes thought to have ruptured the samesegments. For example, the 10 September 1509 M � 7.4and 22 May 1766 M � 7.2 earthquakes are treated here asrecurrent events; if the calculated magnitudes are correct, theratio of moment release for these two earthquakes is 0.501.The same result is obtained by comparing the 5 August 1766M� 7.6 and 13 September 1912Ms = 7.4 earthquakes. Thusif moment accumulation rate and variation in its release is aproxy for variation in earthquake periodicity, then perhapsa = 0.5 is appropriate for Sea of Marmara probabilitycalculations. A definitive conclusion cannot be reachedbecause the potential errors in the magnitude calculationsfrom historic earthquakes could be larger than the 0.2magnitude unit variations between the compared events.[27] Thirty year time-dependent earthquake probabilities
were calculated for the three identified fault segmentsbeneath the Sea of Marmara using the interevent times ofTable 2 and aperiodicity values of a = 0.2 and a = 0.5(Table 3). Additionally, a 30 year Poisson calculation was
Table 3. Earthquake Probability Calculations for Sea of Marmara Fault Segments Using the Interevent and Elapsed Times From Table 2a
Segment Poisson
Time-Dependent Interaction Afterslip
a = 0.5 (1s) a = 0.2 (1s) a = 0.5 (1s) a = 0.2 (1s) a = 0.5 (1s) a = 0.2 (1s)
Ganos 14 20 (±17) 6 (±12) 20 (±17) 7 (±13) 20 (±17) 7 (±13)Prince’s Islands 11 22 (±12) 36 (±24) 31 (±15) 54 (±26) 34 (±14) 62 (±25)Izmit 10 �0 �0 �0 �0 �0 �0Cinarcik M � 7 11 11 11 11 11 11 11Combined 38 44 (±18) 46 (±23) 51 (±18) 62 (±28) 53 (±18) 69 (±28)Istanbul 21 29 (±12) 43 (±24) 39 (±15) 59 (±26) 41 (±14) 66 (±25)
aThirty year probability (%) in 2004. The probability of each segment of producing a M � 7 earthquake between 2004 and 2034 is calculated usingPoisson, time-dependent, time-dependent with coseismic stress transfer from the M = 7.4 1999 Izmit earthquake, and time-dependent with coseismic andpostseismic stress transfer from the Izmit event. Reported probability values are the means of 1000 calculations using distributions of input parameters; the1s parameter sensitivities are found from the distribution of results.
Figure 6. Comparison of 30 year probability versus timefor an earthquake on the Prince’s Islands segment usingaperiodicity (a) of (a) 0.5 and (b) of 0.2. The thick blacklines are calculations made with the mean interevent time of270 years from Table 2. The dashed lines are 50%perturbations from the mean (Figure 6a) or 20% perturba-tions (Figure 6b), meant to illustrate the approximate rangepulled at random from Brownian distributed intereventtimes to estimate standard deviations (Table 3). The plotsdemonstrate how ±1s variations for a = 0.2 can exceedthose for a = 0.5 in some circumstances.
B05304 PARSONS: PROBABILITY OF EARTHQUAKES BENEATH MARMARA SEA
9 of 21
B05304
made for ‘‘floating’’ M � 7 earthquakes based on threeevents identified between A.D. 1500–2000 (interevent time�250 years), which is 11%. Reported time-dependentprobability values are the means of 1000 calculations madeper segment, with interevent times drawn at random fromBrownian distributions about the modeled interevent times[Savage, 1991, 1992]. This process enables examination ofparameter choices and calculation of standard deviations onprobability values (Table 3). The ranges given on calculatedprobabilities are not formal uncertainties; rather theyprovide an understanding of the sensitivity to parameterchoices.[28] The Ganos segment of the North Anatolian fault last
ruptured on 13 September 1912, and has a modeledinterevent time of �207 years. Trenches on the Ganossegment were used to calculate a mean interevent time of350 years, longer than the modeled value, although periodsof shorter interevent times of 150 years over the pastseveral surface ruptures were noted [Rockwell, 2000],which match the event separation from the A.D. 1500–2000 catalog. The 30 year Poisson probability for thissegment is 14%; the time-dependent calculation for thissegment over the period 2004–2034 is 20 ± 17% if a = 0.5(reported sensitivities are one standard deviation, or 67%confidence), and 6 ± 12% if a = 0.2. The Ganos segment(Figure 1) calculations are associated with the largestuncertainty relative to the probability values in this studybecause the short elapsed time since 1912 compared withmodeled interevent time of 207 years causes the calcula-tions to be particularly susceptible to small variations ininterevent time.[29] The Prince’s Islands segment in the central Sea of
Marmara (Figure 1) last ruptured on 22 May 1766, and iscalculated to have a 270 year interevent time. Consequently,while the 30 year Poisson probability for this segment is11%, the time-dependent calculation for 2004–2034 ishigher at 22 ± 12% if a = 0.5, and 36 ± 24% if a = 0.2(Table 3). The Izmit segment last ruptured on 17 August1999; the interevent time was calculated to be 288 years,yielding a 30 year Poisson probability for this segment of10%. The time-dependent calculation for 2004–2034 onthe Izmit segment is �0% because so little time haselapsed since the last rupture in 1999. The 30 year time-dependent segment probabilities can be combined usingequation (5); if a = 0.5, the probability of a M � 7earthquake in the Sea of Marmara region (includes Ganos,Prince’s Islands, Izmit, and ‘‘floating’’ earthquake sources)is 44 ± 18%. If a = 0.2, the combined probability is nearlythe same at 46 ± 23% (Table 3), although with greaterparameter sensitivity.[30] The distribution of possible interevent times is more
limited if a = 0.2, thus one might expect a smaller range ofvalues in parameter sensitivity calculations. However, whena is smaller in time-dependent calculations, it causes themaximum probability to be larger. This in turn can lead to awider range of possible probabilities. Additionally, at agiven time, the spectrum of probabilities resulting froma distribution of interevent times depends on the slope ofprobability gain with time, which differs depending on a(Figure 6). Thus for Sea of Marmara time-dependentcalculations, sensitivities on 30 year probability when a =0.2 can exceed those when a = 0.5 (Figure 6).
[31] Of the identified fault segments beneath the Sea ofMarmara capable of generating M � 7 earthquakes, themean time-dependent probability is calculated to be signif-icantly higher than the Poisson value only on the Prince’sIslands fault. The combined time-dependent probability forall segments is nearly the same as the combined Poissonvalue (44% versus 38%) because the increased time-depen-dent probability on the Prince’s Islands fault is offset by adecrease on the Izmit segment relative to the Poisson values(Table 3). One important distinction between the Poissonand time-dependent calculations is that under the time-dependent model, most of the hazard is associated withthe Prince’s Islands fault, which is the closest fault to highlypopulated Istanbul (Figure 1). The time-dependent 30 yearprobability for Istanbul is 29–43% compared with thePoisson calculation of 21% (Table 3). In the next twosections, the influence of the 17 August 1999 M = 7.4Izmit earthquake on the probability of earthquakes beneaththe Sea of Marmara will be calculated.
3. Stress Changes Caused by the 17 August 1999M ==== 7.4 Izmit Earthquake
[32] The 17 August 1999 M = 7.4 Izmit earthquakekilled 18,000 people, destroyed 15,400 buildings, andcaused $10–25 billion in damage. However, the Izmitevent is only the most recent in a largely westwardprogression of seven M � 6.7 earthquakes along the NorthAnatolian fault since 1939. Stress triggering has beeninvoked to explain the 60 year sequence of earthquakesrupturing toward Istanbul [e.g., Ketin, 1969; Barka, 1996;Toksoz et al., 1979], in which all but one event promotedthe next [Stein et al., 1997]. An earthquake can bemodeled as a slipping dislocation in an elastic half space[e.g., Okada, 1992], enabling estimation of stress transferto other faults. Calculated changes in stress tensor compo-nents are resolved on planes of interest, and changes infailure stress are related to triggering or inhibition of futureearthquakes. Usually the Coulomb stress change is calcu-lated and used to explain patterns of seismicity [e.g.,Harris, 1998, and references therein]. The Coulomb failurecriterion (Dt) is defined by
Dt D�tf�� ��þ m Dsn þ Dpð Þ; ð8Þ
where D�tf is the change in shear stress on the receiver fault(set positive in the direction of fault slip), m is the coefficientof friction, Dsn is the change in normal stress acting on thereceiver fault (set positive for unclamping), and Dp is porepressure change.[33] Globally, seismicity rates are observed to rise in
regions of calculated stress increase and fall where theoff-fault stress decreases [e.g., Kagan and Jackson, 1991;Kagan, 1994; Parsons, 2002a]. The M = 7.4 Izmit earth-quake, as well as most background seismicity [Ito et al.,1999], occurred where the failure stress is calculated to haveincreased 0.1–0.2 MPa by M � 6.7 earthquakes since 1939[Stein et al., 1997; Nalbant et al., 1998; Parsons et al.,2000]. The Izmit event, in turn, increased the stress beyondthe east end of the rupture by �0.1–0.2 MPa, where theM = 7.2 Duzce earthquake struck, and by 0.05–0.5 MPabeyond the west end of the 17 August rupture, where a
B05304 PARSONS: PROBABILITY OF EARTHQUAKES BENEATH MARMARA SEA
10 of 21
B05304
cluster of aftershocks occurred [Parsons et al., 2000]. Thecorrespondence seen between calculated stress changes andthe occurrence of large and small earthquakes, also reportedby Hubert-Ferrari et al. [2000], strengthens the rationalefor incorporating stress transfer into a seismic hazardassessment.
3.1. Slip Models
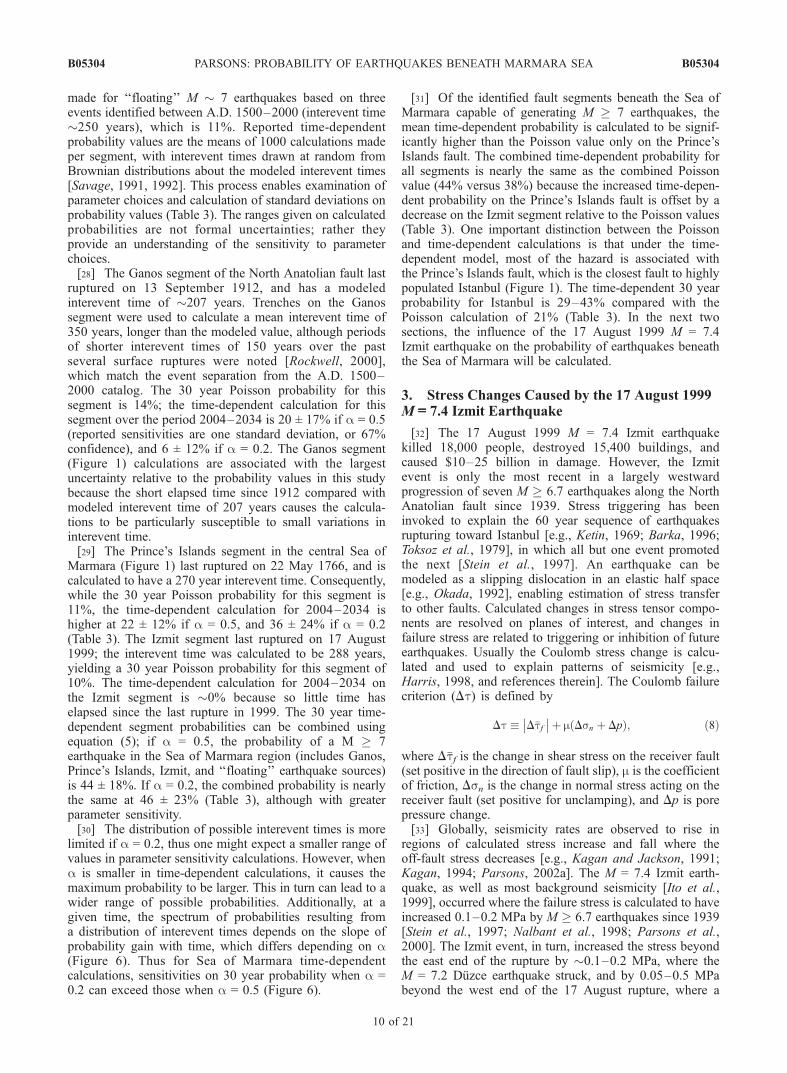
[34] Stress change calculations require a dislocationmodel of the perturbing earthquake, the 17 August 1999M = 7.4 Izmit earthquake in this case. Preliminary stresschange calculations were made not long after the Izmitshock that indicated stress increases on most Marmara Seafaults [Hubert-Ferrari et al., 2000; Parsons et al., 2000],using rough slip distribution estimates. As more time haspassed since 1999, researchers have examined teleseismic,strong ground motion, and geodetic data [e.g., Reilinger etal., 2000; Bouchon et al., 2002; De Louis et al., 2002; Li etal., 2002], yielding more detailed slip models (Figure 7).In addition, studies of postseismic deformation [e.g.,Burgmann et al., 2002; Hearn et al., 2002] calculated deepafterslip beneath the coseismic rupture zone that may alsoaffect Marmara Sea faults.[35] Comparison of slip models determined from diverse
data sources shows differences in the extent of the ruptureand slip distribution (Figure 7). These variations causedifferent stress change values to be resolved on the Mar-mara Sea fault model (Figure 8). The exercise is usefulbecause variability caused by uncertainty in Izmit earth-
quake coseismic slip can be examined and accounted for inprobability calculations.
3.2. Coseismic Stress Changes
[36] To resolve stress on individual fault planes I usedthe program, DLC, written by R. Simpson (based on thesubroutines of Okada [1992]) to calculate changes in thestress tensor at points along specified receiver fault surfa-ces caused by slip in the different Izmit earthquake sourcemodels in an elastic half space. For resolved stresses, notectonic stress is applied; instead the strike, dip, and rakeof the receiver faults are assumed. Post-Izmit microseis-micity rate changes were best matched using low tointermediate friction coefficients (m = 0.2–0.4) on theMarmara Sea receiver faults [Parsons et al., 2000], anda value of m = 0.4 was adopted for this study for use inequation (8).[37] Calculated Coulomb stress changes at seismogenic
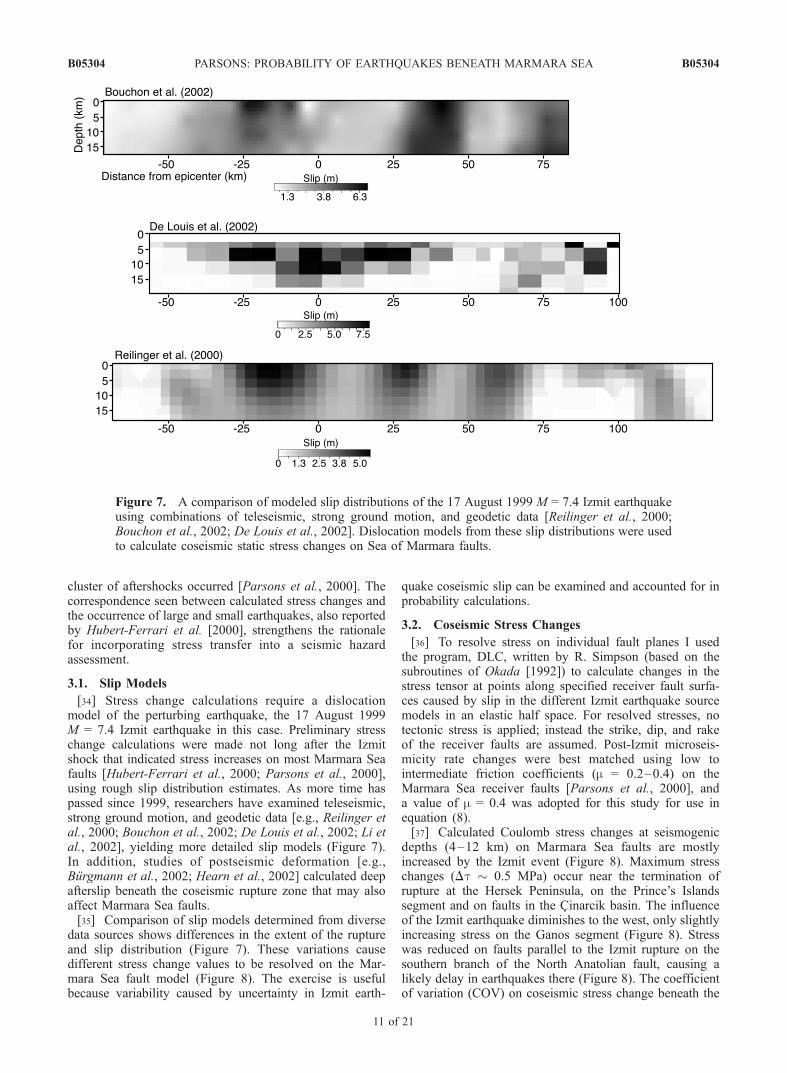
depths (4–12 km) on Marmara Sea faults are mostlyincreased by the Izmit event (Figure 8). Maximum stresschanges (Dt � 0.5 MPa) occur near the termination ofrupture at the Hersek Peninsula, on the Prince’s Islandssegment and on faults in the Cinarcik basin. The influenceof the Izmit earthquake diminishes to the west, only slightlyincreasing stress on the Ganos segment (Figure 8). Stresswas reduced on faults parallel to the Izmit rupture on thesouthern branch of the North Anatolian fault, causing alikely delay in earthquakes there (Figure 8). The coefficientof variation (COV) on coseismic stress change beneath the
Figure 7. A comparison of modeled slip distributions of the 17 August 1999 M = 7.4 Izmit earthquakeusing combinations of teleseismic, strong ground motion, and geodetic data [Reilinger et al., 2000;Bouchon et al., 2002; De Louis et al., 2002]. Dislocation models from these slip distributions were usedto calculate coseismic static stress changes on Sea of Marmara faults.
B05304 PARSONS: PROBABILITY OF EARTHQUAKES BENEATH MARMARA SEA
11 of 21
B05304
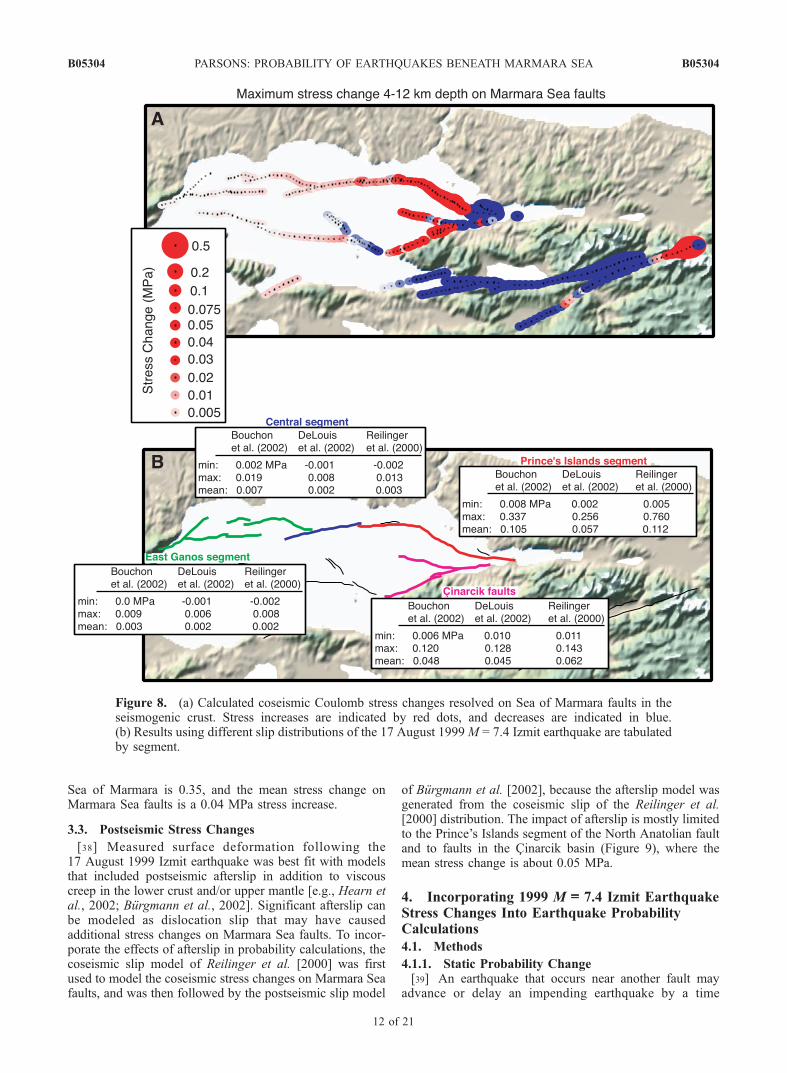
Sea of Marmara is 0.35, and the mean stress change onMarmara Sea faults is a 0.04 MPa stress increase.
3.3. Postseismic Stress Changes
[38] Measured surface deformation following the17 August 1999 Izmit earthquake was best fit with modelsthat included postseismic afterslip in addition to viscouscreep in the lower crust and/or upper mantle [e.g., Hearn etal., 2002; Burgmann et al., 2002]. Significant afterslip canbe modeled as dislocation slip that may have causedadditional stress changes on Marmara Sea faults. To incor-porate the effects of afterslip in probability calculations, thecoseismic slip model of Reilinger et al. [2000] was firstused to model the coseismic stress changes on Marmara Seafaults, and was then followed by the postseismic slip model
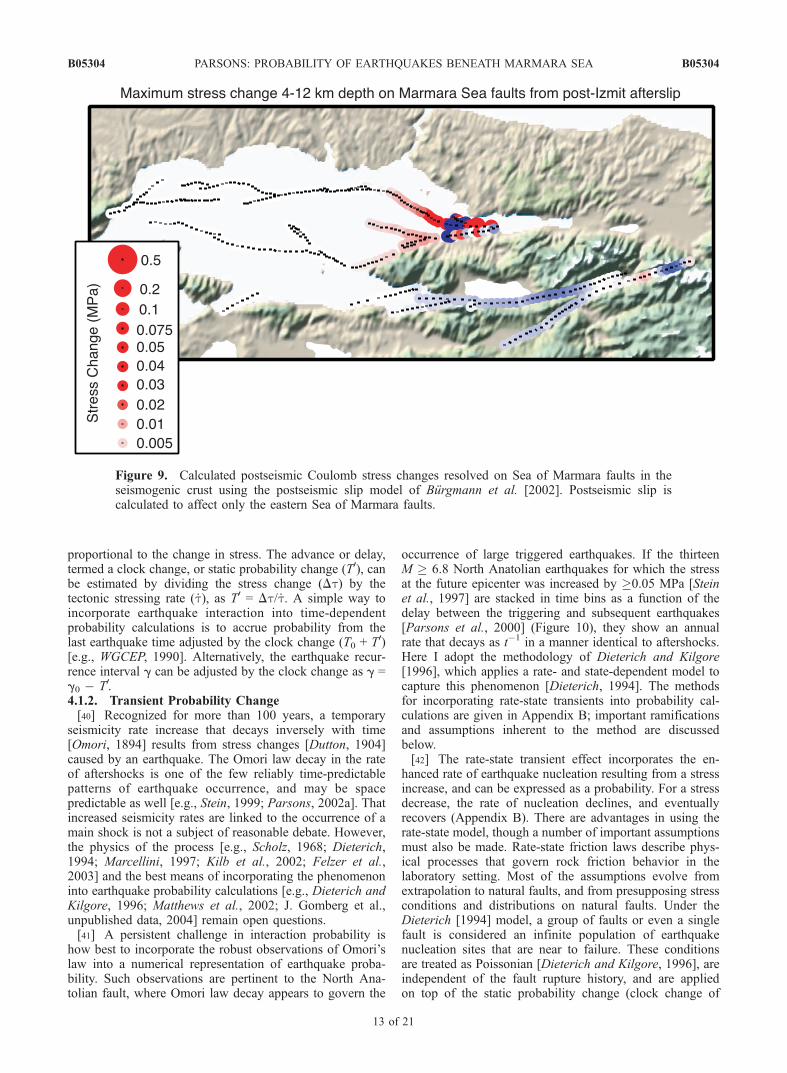
of Burgmann et al. [2002], because the afterslip model wasgenerated from the coseismic slip of the Reilinger et al.[2000] distribution. The impact of afterslip is mostly limitedto the Prince’s Islands segment of the North Anatolian faultand to faults in the Cinarcik basin (Figure 9), where themean stress change is about 0.05 MPa.
4. Incorporating 1999 M ==== 7.4 Izmit EarthquakeStress Changes Into Earthquake ProbabilityCalculations
4.1. Methods
4.1.1. Static Probability Change[39] An earthquake that occurs near another fault may
advance or delay an impending earthquake by a time
Figure 8. (a) Calculated coseismic Coulomb stress changes resolved on Sea of Marmara faults in theseismogenic crust. Stress increases are indicated by red dots, and decreases are indicated in blue.(b) Results using different slip distributions of the 17 August 1999M = 7.4 Izmit earthquake are tabulatedby segment.
B05304 PARSONS: PROBABILITY OF EARTHQUAKES BENEATH MARMARA SEA
12 of 21
B05304
proportional to the change in stress. The advance or delay,termed a clock change, or static probability change (T0), canbe estimated by dividing the stress change (Dt) by thetectonic stressing rate ( _t), as T0 = Dt/ _t. A simple way toincorporate earthquake interaction into time-dependentprobability calculations is to accrue probability from thelast earthquake time adjusted by the clock change (T0 + T0)[e.g., WGCEP, 1990]. Alternatively, the earthquake recur-rence interval g can be adjusted by the clock change as g =g0 � T0.4.1.2. Transient Probability Change[40] Recognized for more than 100 years, a temporary
seismicity rate increase that decays inversely with time[Omori, 1894] results from stress changes [Dutton, 1904]caused by an earthquake. The Omori law decay in the rateof aftershocks is one of the few reliably time-predictablepatterns of earthquake occurrence, and may be spacepredictable as well [e.g., Stein, 1999; Parsons, 2002a]. Thatincreased seismicity rates are linked to the occurrence of amain shock is not a subject of reasonable debate. However,the physics of the process [e.g., Scholz, 1968; Dieterich,1994; Marcellini, 1997; Kilb et al., 2002; Felzer et al.,2003] and the best means of incorporating the phenomenoninto earthquake probability calculations [e.g., Dieterich andKilgore, 1996; Matthews et al., 2002; J. Gomberg et al.,unpublished data, 2004] remain open questions.[41] A persistent challenge in interaction probability is
how best to incorporate the robust observations of Omori’slaw into a numerical representation of earthquake proba-bility. Such observations are pertinent to the North Ana-tolian fault, where Omori law decay appears to govern the
occurrence of large triggered earthquakes. If the thirteenM � 6.8 North Anatolian earthquakes for which the stressat the future epicenter was increased by �0.05 MPa [Steinet al., 1997] are stacked in time bins as a function of thedelay between the triggering and subsequent earthquakes[Parsons et al., 2000] (Figure 10), they show an annualrate that decays as t�1 in a manner identical to aftershocks.Here I adopt the methodology of Dieterich and Kilgore[1996], which applies a rate- and state-dependent model tocapture this phenomenon [Dieterich, 1994]. The methodsfor incorporating rate-state transients into probability cal-culations are given in Appendix B; important ramificationsand assumptions inherent to the method are discussedbelow.[42] The rate-state transient effect incorporates the en-
hanced rate of earthquake nucleation resulting from a stressincrease, and can be expressed as a probability. For a stressdecrease, the rate of nucleation declines, and eventuallyrecovers (Appendix B). There are advantages in using therate-state model, though a number of important assumptionsmust also be made. Rate-state friction laws describe phys-ical processes that govern rock friction behavior in thelaboratory setting. Most of the assumptions evolve fromextrapolation to natural faults, and from presupposing stressconditions and distributions on natural faults. Under theDieterich [1994] model, a group of faults or even a singlefault is considered an infinite population of earthquakenucleation sites that are near to failure. These conditionsare treated as Poissonian [Dieterich and Kilgore, 1996], areindependent of the fault rupture history, and are appliedon top of the static probability change (clock change of
Figure 9. Calculated postseismic Coulomb stress changes resolved on Sea of Marmara faults in theseismogenic crust using the postseismic slip model of Burgmann et al. [2002]. Postseismic slip iscalculated to affect only the eastern Sea of Marmara faults.
B05304 PARSONS: PROBABILITY OF EARTHQUAKES BENEATH MARMARA SEA
13 of 21
B05304
section 4.1.1). Thus application of the model for earthquakeprobability of a given size to faults that have recentlyruptured implies that, despite an expected stress drop causedby the recent earthquake, there still are an infinite number ofpotential rupture sites on the fault plane capable of gener-ating the same-sized earthquake.[43] Applying the rate-state model to probability calcu-
lations in the Marmara Sea region means that if there is notan infinite population of M � 7 nucleation sites along theNorth Anatolian fault, or if a M � 7 earthquake hasoccurred recently relative to the interevent time on a givenfault, then the peak transient probability values could beoverstated (J. Gomberg et al., unpublished data, 2004).Additionally, regionally applied rate-state parameters (seesection 4.1.3) imply significant heterogeneity of fault zoneconditions along the North Anatolian fault. At present,knowledge of fault zones nucleation populations is insuffi-cient to gauge how many M � 7 sites exist, which isreflected by choosing broad distributions of parameters foruse in the probability calculations made here. I adopt theDieterich and Kilgore [1996] formulation because it cap-tures observations of Omori decay following stress pertur-bations like the Izmit earthquake, and is derived fromobservations of laboratory rock physics. In addition, twoprevious reports of regional earthquake probability [Stein etal., 1997; Parsons et al., 2000] have applied the samemethods, which enables results from this study to bedirectly compared.
4.1.3. Summary of Needed Parameters[44] In addition to the interevent time, aperiodicity, and
elapsed time on each fault, an interaction probability calcu-lation that incorporates static and transient effects requiresvalues for the stress change caused by the 17 August M =7.4 Izmit earthquake (Dt), an observed aftershock duration(ta), the combination of normal stress and constitutiveconstant As (see Appendix B), and the secular stressingrate ( _t) on a receiver fault. The A.D. 1500–2000 earth-quake catalog permits rough estimates of the first threeparameters as discussed in section 2.6. The mean coseismicand postseismic stress changes can be calculated as dis-cussed in sections 3.2 and 3.3. The aftershock duration (ta),As, and secular stressing rate ( _t) are related by
_t ¼ Asta
ð9Þ
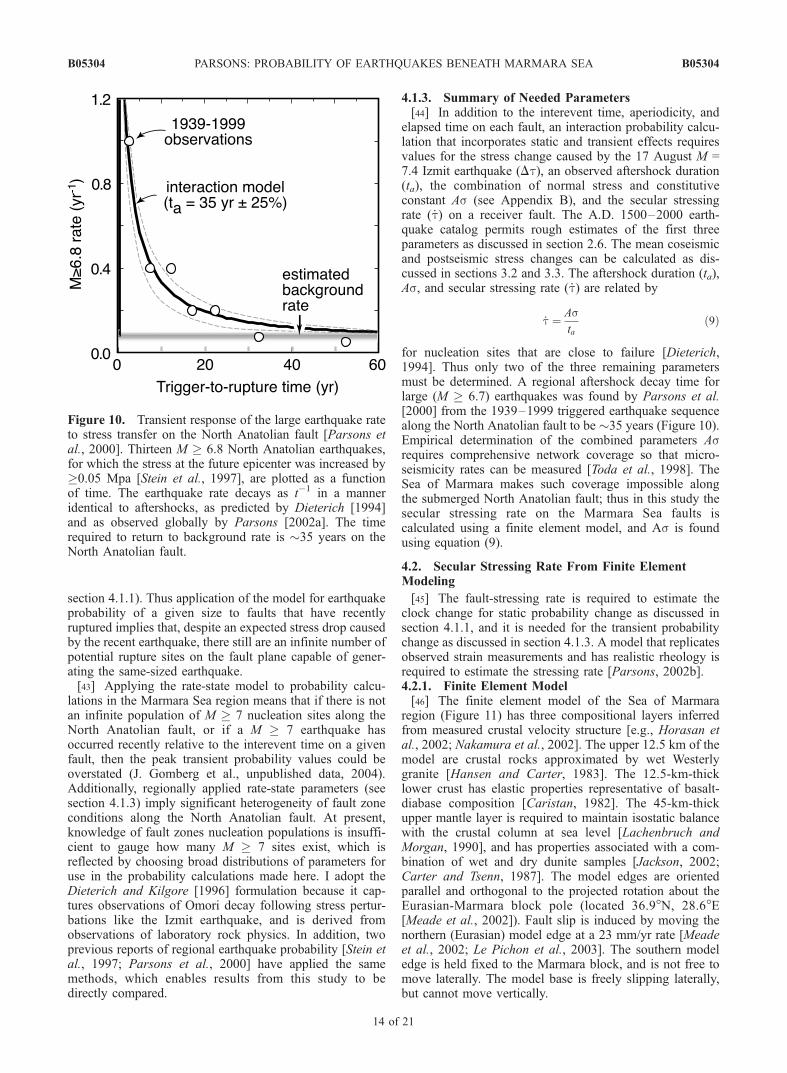
for nucleation sites that are close to failure [Dieterich,1994]. Thus only two of the three remaining parametersmust be determined. A regional aftershock decay time forlarge (M � 6.7) earthquakes was found by Parsons et al.[2000] from the 1939–1999 triggered earthquake sequencealong the North Anatolian fault to be �35 years (Figure 10).Empirical determination of the combined parameters Asrequires comprehensive network coverage so that micro-seismicity rates can be measured [Toda et al., 1998]. TheSea of Marmara makes such coverage impossible alongthe submerged North Anatolian fault; thus in this study thesecular stressing rate on the Marmara Sea faults iscalculated using a finite element model, and As is foundusing equation (9).
4.2. Secular Stressing Rate From Finite ElementModeling
[45] The fault-stressing rate is required to estimate theclock change for static probability change as discussed insection 4.1.1, and it is needed for the transient probabilitychange as discussed in section 4.1.3. A model that replicatesobserved strain measurements and has realistic rheology isrequired to estimate the stressing rate [Parsons, 2002b].4.2.1. Finite Element Model[46] The finite element model of the Sea of Marmara
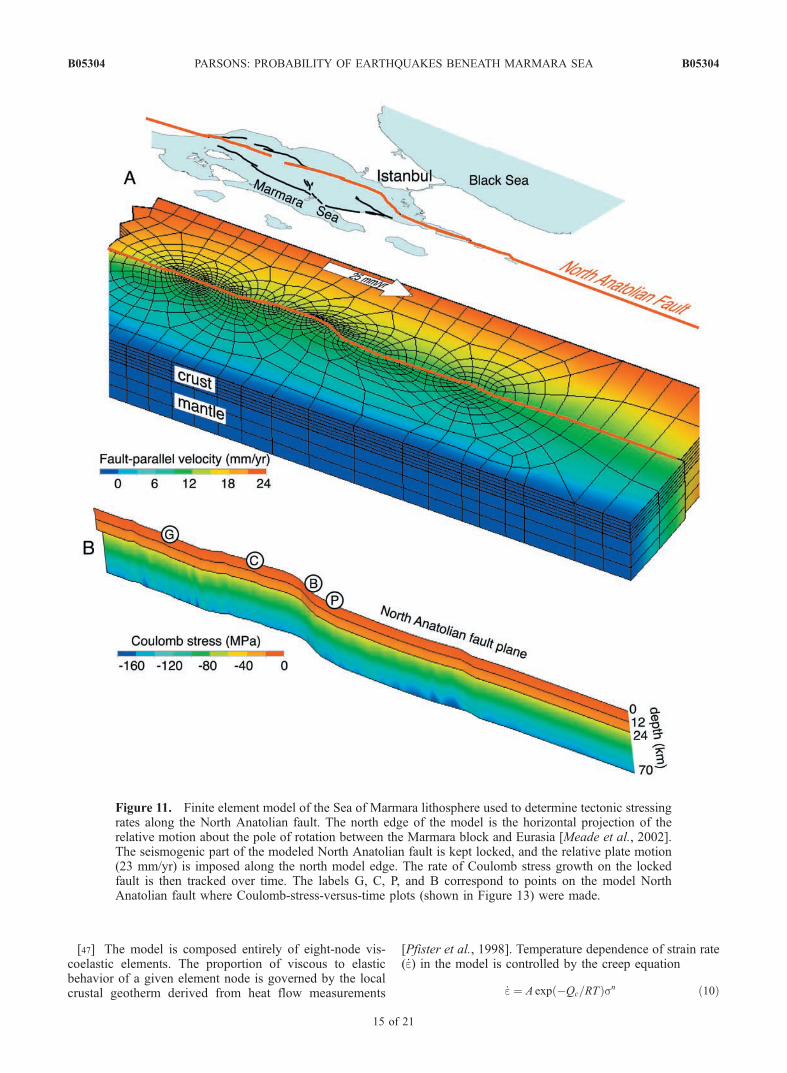
region (Figure 11) has three compositional layers inferredfrom measured crustal velocity structure [e.g., Horasan etal., 2002; Nakamura et al., 2002]. The upper 12.5 km of themodel are crustal rocks approximated by wet Westerlygranite [Hansen and Carter, 1983]. The 12.5-km-thicklower crust has elastic properties representative of basalt-diabase composition [Caristan, 1982]. The 45-km-thickupper mantle layer is required to maintain isostatic balancewith the crustal column at sea level [Lachenbruch andMorgan, 1990], and has properties associated with a com-bination of wet and dry dunite samples [Jackson, 2002;Carter and Tsenn, 1987]. The model edges are orientedparallel and orthogonal to the projected rotation about theEurasian-Marmara block pole (located 36.9�N, 28.6�E[Meade et al., 2002]). Fault slip is induced by moving thenorthern (Eurasian) model edge at a 23 mm/yr rate [Meadeet al., 2002; Le Pichon et al., 2003]. The southern modeledge is held fixed to the Marmara block, and is not free tomove laterally. The model base is freely slipping laterally,but cannot move vertically.
Figure 10. Transient response of the large earthquake rateto stress transfer on the North Anatolian fault [Parsons etal., 2000]. Thirteen M � 6.8 North Anatolian earthquakes,for which the stress at the future epicenter was increased by�0.05 Mpa [Stein et al., 1997], are plotted as a functionof time. The earthquake rate decays as t�1 in a manneridentical to aftershocks, as predicted by Dieterich [1994]and as observed globally by Parsons [2002a]. The timerequired to return to background rate is �35 years on theNorth Anatolian fault.
B05304 PARSONS: PROBABILITY OF EARTHQUAKES BENEATH MARMARA SEA
14 of 21
B05304
[47] The model is composed entirely of eight-node vis-coelastic elements. The proportion of viscous to elasticbehavior of a given element node is governed by the localcrustal geotherm derived from heat flow measurements
[Pfister et al., 1998]. Temperature dependence of strain rate(_e) in the model is controlled by the creep equation
_e ¼ A exp �Qc=RTð Þsn ð10Þ
Figure 11. Finite element model of the Sea of Marmara lithosphere used to determine tectonic stressingrates along the North Anatolian fault. The north edge of the model is the horizontal projection of therelative motion about the pole of rotation between the Marmara block and Eurasia [Meade et al., 2002].The seismogenic part of the modeled North Anatolian fault is kept locked, and the relative plate motion(23 mm/yr) is imposed along the north model edge. The rate of Coulomb stress growth on the lockedfault is then tracked over time. The labels G, C, P, and B correspond to points on the model NorthAnatolian fault where Coulomb-stress-versus-time plots (shown in Figure 13) were made.
B05304 PARSONS: PROBABILITY OF EARTHQUAKES BENEATH MARMARA SEA
15 of 21
B05304
[e.g., Kirby and Kronenberg, 1987], where A, Qc (activationenergy), and n are experimentally derived elastic constants,R is the universal gas constant, T is temperature, and s isdifferential stress. In the lower-temperature upper crust, themodel behaves elastically, while deeper, higher-temperatureregions behave increasingly more viscoelastically.[48] The finite element model has a cut through the crust
[e.g., Parsons, 1998; Burgmann et al., 2002] that representsthe North Anatolian fault in the Marmara Sea region; it ismodeled as throughgoing [Le Pichon et al., 2001], thoughin reality the fault may be interrupted by a step over in thecentral Sea of Marmara (Figure 3) [Armijo et al., 2002].This issue is unimportant for the stressing rate calculationbecause the model fault is locked throughout the uppercrust. The modeled fault is deformable, and is constructedfrom contact elements that obey the Coulomb failurerelation. Contact elements have zero thickness and arewelded to the sides of viscoelastic elements. The Eurasianplate was moved past the Marmara block at a 23 mm/yr ratewith the upper crustal faults locked so that the rate ofCoulomb stress accumulation on the faults could be deter-mined. When the seismogenic (0–12.5 km) parts of thefaults are locked, the finite element model can roughlyreproduce the transitional surface deformation rates mea-sured across the North Anatolian fault zone with GPS[Reilinger et al., 2000] (Figure 12). For the crustal stressingrates to be valid, the strain rates must be matched.4.2.2. Stressing Rate Calculations[49] The modeled rate of Coulomb stress accumulation on
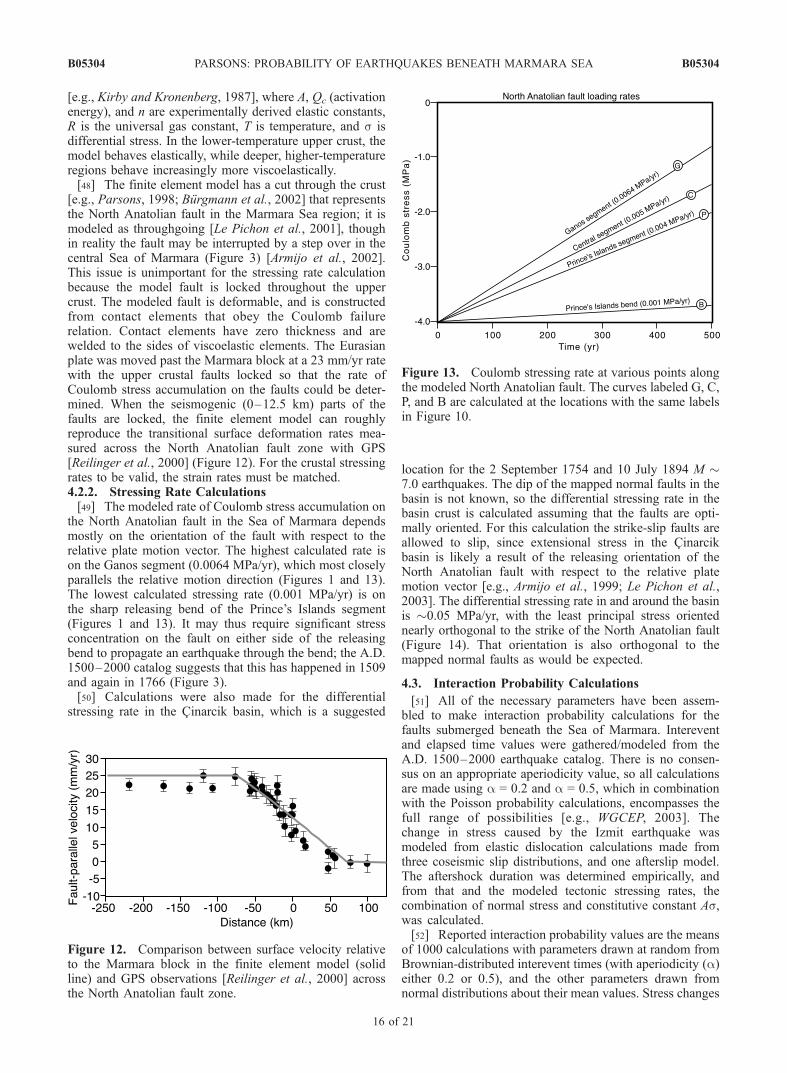
the North Anatolian fault in the Sea of Marmara dependsmostly on the orientation of the fault with respect to therelative plate motion vector. The highest calculated rate ison the Ganos segment (0.0064 MPa/yr), which most closelyparallels the relative motion direction (Figures 1 and 13).The lowest calculated stressing rate (0.001 MPa/yr) is onthe sharp releasing bend of the Prince’s Islands segment(Figures 1 and 13). It may thus require significant stressconcentration on the fault on either side of the releasingbend to propagate an earthquake through the bend; the A.D.1500–2000 catalog suggests that this has happened in 1509and again in 1766 (Figure 3).[50] Calculations were also made for the differential
stressing rate in the Cinarcik basin, which is a suggested
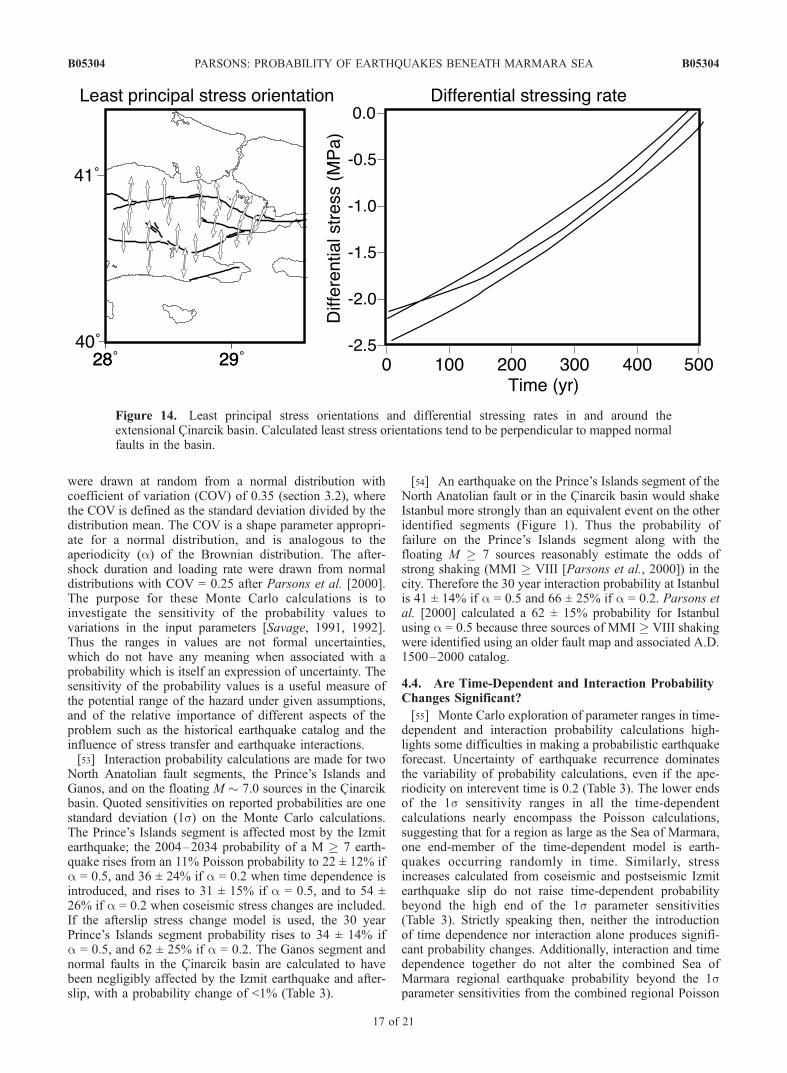
location for the 2 September 1754 and 10 July 1894 M �7.0 earthquakes. The dip of the mapped normal faults in thebasin is not known, so the differential stressing rate in thebasin crust is calculated assuming that the faults are opti-mally oriented. For this calculation the strike-slip faults areallowed to slip, since extensional stress in the Cinarcikbasin is likely a result of the releasing orientation of theNorth Anatolian fault with respect to the relative platemotion vector [e.g., Armijo et al., 1999; Le Pichon et al.,2003]. The differential stressing rate in and around the basinis �0.05 MPa/yr, with the least principal stress orientednearly orthogonal to the strike of the North Anatolian fault(Figure 14). That orientation is also orthogonal to themapped normal faults as would be expected.
4.3. Interaction Probability Calculations
[51] All of the necessary parameters have been assem-bled to make interaction probability calculations for thefaults submerged beneath the Sea of Marmara. Intereventand elapsed time values were gathered/modeled from theA.D. 1500–2000 earthquake catalog. There is no consen-sus on an appropriate aperiodicity value, so all calculationsare made using a = 0.2 and a = 0.5, which in combinationwith the Poisson probability calculations, encompasses thefull range of possibilities [e.g., WGCEP, 2003]. Thechange in stress caused by the Izmit earthquake wasmodeled from elastic dislocation calculations made fromthree coseismic slip distributions, and one afterslip model.The aftershock duration was determined empirically, andfrom that and the modeled tectonic stressing rates, thecombination of normal stress and constitutive constant As,was calculated.[52] Reported interaction probability values are the means
of 1000 calculations with parameters drawn at random fromBrownian-distributed interevent times (with aperiodicity (a)either 0.2 or 0.5), and the other parameters drawn fromnormal distributions about their mean values. Stress changes
Figure 12. Comparison between surface velocity relativeto the Marmara block in the finite element model (solidline) and GPS observations [Reilinger et al., 2000] acrossthe North Anatolian fault zone.
Figure 13. Coulomb stressing rate at various points alongthe modeled North Anatolian fault. The curves labeled G, C,P, and B are calculated at the locations with the same labelsin Figure 10.
B05304 PARSONS: PROBABILITY OF EARTHQUAKES BENEATH MARMARA SEA
16 of 21
B05304
were drawn at random from a normal distribution withcoefficient of variation (COV) of 0.35 (section 3.2), wherethe COV is defined as the standard deviation divided by thedistribution mean. The COV is a shape parameter appropri-ate for a normal distribution, and is analogous to theaperiodicity (a) of the Brownian distribution. The after-shock duration and loading rate were drawn from normaldistributions with COV = 0.25 after Parsons et al. [2000].The purpose for these Monte Carlo calculations is toinvestigate the sensitivity of the probability values tovariations in the input parameters [Savage, 1991, 1992].Thus the ranges in values are not formal uncertainties,which do not have any meaning when associated with aprobability which is itself an expression of uncertainty. Thesensitivity of the probability values is a useful measure ofthe potential range of the hazard under given assumptions,and of the relative importance of different aspects of theproblem such as the historical earthquake catalog and theinfluence of stress transfer and earthquake interactions.[53] Interaction probability calculations are made for two
North Anatolian fault segments, the Prince’s Islands andGanos, and on the floating M � 7.0 sources in the Cinarcikbasin. Quoted sensitivities on reported probabilities are onestandard deviation (1s) on the Monte Carlo calculations.The Prince’s Islands segment is affected most by the Izmitearthquake; the 2004–2034 probability of a M � 7 earth-quake rises from an 11% Poisson probability to 22 ± 12% ifa = 0.5, and 36 ± 24% if a = 0.2 when time dependence isintroduced, and rises to 31 ± 15% if a = 0.5, and to 54 ±26% if a = 0.2 when coseismic stress changes are included.If the afterslip stress change model is used, the 30 yearPrince’s Islands segment probability rises to 34 ± 14% ifa = 0.5, and 62 ± 25% if a = 0.2. The Ganos segment andnormal faults in the Cinarcik basin are calculated to havebeen negligibly affected by the Izmit earthquake and after-slip, with a probability change of <1% (Table 3).
[54] An earthquake on the Prince’s Islands segment of theNorth Anatolian fault or in the Cinarcik basin would shakeIstanbul more strongly than an equivalent event on the otheridentified segments (Figure 1). Thus the probability offailure on the Prince’s Islands segment along with thefloating M � 7 sources reasonably estimate the odds ofstrong shaking (MMI � VIII [Parsons et al., 2000]) in thecity. Therefore the 30 year interaction probability at Istanbulis 41 ± 14% if a = 0.5 and 66 ± 25% if a = 0.2. Parsons etal. [2000] calculated a 62 ± 15% probability for Istanbulusing a = 0.5 because three sources of MMI � VIII shakingwere identified using an older fault map and associated A.D.1500–2000 catalog.
4.4. Are Time-Dependent and Interaction ProbabilityChanges Significant?
[55] Monte Carlo exploration of parameter ranges in time-dependent and interaction probability calculations high-lights some difficulties in making a probabilistic earthquakeforecast. Uncertainty of earthquake recurrence dominatesthe variability of probability calculations, even if the ape-riodicity on interevent time is 0.2 (Table 3). The lower endsof the 1s sensitivity ranges in all the time-dependentcalculations nearly encompass the Poisson calculations,suggesting that for a region as large as the Sea of Marmara,one end-member of the time-dependent model is earth-quakes occurring randomly in time. Similarly, stressincreases calculated from coseismic and postseismic Izmitearthquake slip do not raise time-dependent probabilitybeyond the high end of the 1s parameter sensitivities(Table 3). Strictly speaking then, neither the introductionof time dependence nor interaction alone produces signifi-cant probability changes. Additionally, interaction and timedependence together do not alter the combined Sea ofMarmara regional earthquake probability beyond the 1sparameter sensitivities from the combined regional Poisson
Figure 14. Least principal stress orientations and differential stressing rates in and around theextensional Cinarcik basin. Calculated least stress orientations tend to be perpendicular to mapped normalfaults in the basin.
B05304 PARSONS: PROBABILITY OF EARTHQUAKES BENEATH MARMARA SEA
17 of 21
B05304
probability (Table 3). However, a combination of stressinteractions and time dependence can alter individual faultsegments significantly from the Poisson values; comparethe interaction probability of 31–54% for the Prince’sIslands fault with the Poisson value of 11%. Thus time-dependent interaction probability methods might best beused as a means of assessing the relative probabilityamongst a group of fault segments rather than to makeaggregate calculations on a regional scale.[56] In summary, the concepts of time dependence and
stress transfer appear to be useful tools in assessing thelikely order of future earthquakes in a region, and tocompare the hazard at different locations. For example,the time-dependent interaction probability values for theSea of Marmara region are not very different from a simplePoission model (compare 53 ± 18% with 38%). However,the values in the eastern Sea of Marmara at Istanbul aremuch different at 41 ± 14% (interaction; a = 0.5) versus21% (Poisson). It is concluded that two factors give thetime-dependent interaction values significance for Istanbul:(1) incorporation of the long elapsed time since the lastlarge earthquake on the Prince’s Islands fault (238 yearssince 1766) in the time-dependent calculation, and (2) thelargest calculated stress increases from the 1999 Izmitearthquake occur on the Prince’s Islands fault maximizingthe interaction effect relative to other Sea of Marmara faults.
5. Conclusions
[57] The probability of a M � 7 earthquake rupturingbeneath the Sea of Marmara is �35–70% in the next30 years if a time-dependent model that includes coseismicand postseismic effects of the 1999 M = 7.4 Izmit earth-quake is used. Despite one of the world’s longest writtenrecords of earthquake occurrence, uncertainties in the inter-event model lead to the broad range of possible earthquakeprobability. Improved Marmara Sea fault mapping, a newearthquake attenuation relation, and a new regional rela-tionship between M and surface slip enable a new A.D.1500–2000 earthquake catalog calculated from damagedescriptions that identifies four primary M � 7 earthquakesources (Figure 1): (1) the Izmit segment of the NorthAnatolian fault, (2) a fault in the east Sea of Marmara herecalled the Prince’s Islands segment of the North Anatolianfault, (3) a segment in the west Sea of Marmara (west of theCentral Basin step over (Figures 1 and 3)) that emerges onland as the Ganos segment of the North Anatolian fault, and(4) normal faults in the Cinarcik basin and southern Sea ofMarmara. The A.D. 1500–2000 earthquake catalog indi-cates two events on each of the North Anatolian segments,and three events in the Cinarcik basin/southern Seaof Marmara. Using the new catalog to calculate time-dependent probability without any interaction effects yieldsa �44 ± 18% probability of a M � 7 earthquake somewherein the region over the next 30 years. This value is nearly thesame as the regional combined Poisson probability of�38%, except that under the time-dependent model, mostof the regional probability shifts to the Prince’s Islands faultin the eastern Sea of Marmara near Istanbul.[58] More detailed coseismic and postseismic slip models
of the 1999 M = 7.4 Izmit earthquake combined with betterMarmara Sea fault mapping allow presumably more accu-
rate stress transfer calculations, which add a mean 7–16%probability increase above background depending on pa-rameter choices. Monte Carlo exploration of parametersshows that uncertainty in interevent times (COV rangesfrom 0.2 to 0.5) has by far the greatest impact on probabilityvalues (Table 3). Thus input parameter variability exceedsthe impact of stress interactions on the regional calculations.However, it is concluded that valuable information isconveyed by reporting the mean interaction probabilityand the 1s parameter sensitivity range because individualfault segment probabilities can be affected more than the 1sparameter sensitivity range. For example, the Prince’sIslands fault probability, already increased by time depen-dence, is further increased by the largest stress transfereffect of the Izmit shock. These combined effects cause theprobability of MMI�VIII shaking in Istanbul over the2004–2034 interval to rise from a Poisson estimate of 21%to values of 41 ± 14% (a = 0.5) and 66 ± 25% (a = 0.2) underthe time-dependent interaction model.
Appendix A: A.D. 1500––2000 EarthquakeCatalog Events
A1. The 10 September 1509 Earthquake
[59] One of the largest and most damaging earthquakes tostrike the eastern Mediterranean region, this event wasextremely destructive in Istanbul, was felt as far away asthe Danube region, Greece, and the Nile delta, and causedan eastern Marmara Sea tsunami [Ambraseys and Finkel,1990, 1995]. Parsons et al. [2000] located this earthquakein the southern Marmara Sea (Figure 2) because no faultmodel indicated any other segment of sufficient length toaccommodate the M � 7.4 quake. The new fault model ofArmijo et al. [2002] indicates less continuity in the southernSea of Marmara and more on the main trace of the NorthAnatolian fault. Following the rules set out in section 2.1, Ithus relocate this earthquake to the main trace of the NorthAnatolian fault with a western bound at the Central basinstep over, and an eastern boundary near the Hersek Penin-sula. Ambraseys [2002] located this event epicenter in theSea of Marmara near Istanbul, and calculated its size asMs = 7.2.
A2. The 10 May 1556 Earthquake
[60] A destructive earthquake was felt around the Sea ofMarmara with damage reported at Edincik, Bursa andIstanbul [Ambraseys and Finkel, 1995]. The limited distri-bution of damage reports and omission of descriptions inmany areas makes this earthquake very difficult to locatewith any confidence. It was assigned a Ms = 7.1 byAmbraseys [2002], who suggested that it ruptured a faultbeneath the southern Sea of Marmara, or the southern strandof the North Anatolian fault south of the Sea of Marmara. Ineither case this earthquake is not included in the intereventmodel because if it did occur beneath the southern Sea ofMarmara, it is the only large quake to do so in that locationduring the past �2000 years [Ambraseys, 2002] (Figure 1).
A3. The 25 May 1719 Earthquake
[61] A major earthquake shook the eastern Sea of Mar-mara, and was especially damaging in the Gulf of Izmit,destroying many of the towns and cities along the coast
B05304 PARSONS: PROBABILITY OF EARTHQUAKES BENEATH MARMARA SEA
18 of 21
B05304
there; significant damage was also reported in Istanbul[Ambraseys and Finkel, 1991, 1995]. This M � 7.4 ruptureis best fit to the MMI values if it is located in the Gulf ofIzmit and east of the Sea of Marmara (Figure 3), roughly thesame part of the North Anatolian fault that slipped duringthe 1999 M = 7.4 Izmit earthquake. Ambraseys [2002]cataloged this event as Ms = 7.4, located �15 km westof Izmit.
A4. The 2 September 1754 Earthquake
[62] Another large earthquake struck in the eastern Sea ofMarmara just over 35 years after the 1719 event (thoughless severe), with most damage recorded in Istanbul; it wasassociated with a small tsunami [Ambraseys and Finkel,1991, 1995]. The relatively sparse MMI interpretationsfrom damage descriptions permit two possible segmentruptures for this M � 7.0 event: (1) in the Cinarcik basinwhere there are mapped normal faults of sufficient length(Figure 3) probably related to the releasing bend of theNorth Anatolian fault near the Prince’s Islands (Figure 3), or(2) the 1754 event filled an unruptured gap on the NorthAnatolian fault between the 1719 and May 1766 shocks.Ambraseys [2002] placed this earthquake along the northernCinarcik basin and calculated Ms = 6.8.
A5. The 22 May 1766 Earthquake
[63] This earthquake was destructive in Istanbul, butcaused more damage to the west in Thrace than did the1754 event; it was also associated with a damaging tsunamiin the Bosphorus [Ambraseys and Finkel, 1991, 1995]. Theonly fault segment of sufficient length to accommodate thisM � 7.2 shock that can satisfy the MMI distribution,appears to be the main trace of the North Anatolian fault(Figure 3). The damage distribution is similar to the M �7.4 1509 earthquake (Figure 3), and the May 1766 eventprobably ruptured much of the same fault segment asslipped in 1509. Ambraseys [2002] calculated Ms = 7.1and placed it on the North Anatolian fault slightly west ofthe 1754 earthquake, adjacent to Istanbul.
A6. The 5 August 1766 Earthquake
[64] This large earthquake most affected the western Seaof Marmara, in the Ganos region, and was more severethan the May 1766 quake to the east [Ambraseys andFinkel, 1991, 1995]. The best fit to the MMI interpreta-tions from damage descriptions is a M � 7.6 rupture ofthe North Anatolian fault east of the Central basin stepover, and toward the west along the Gallipoli Peninsula(Figure 3). A trenching study found evidence for thisearthquake near Kavakkoy, where the North Anatolianfault enters the Gulf of Saros [Rockwell, 2000]. Ambraseys[2002] calculated Ms = 7.4 and also located it on theGallipoli Peninsula.
A7. The 10 July 1894 Earthquake
[65] This earthquake was destructive in the Gulf of Izmit,but also damaged Istanbul; the main shock caused atsunami with a 1.5 m height [Ambraseys and Finkel, 1991;Ambraseys, 2001]. Calculations from MMI values place thelikely rupture of this M � 7.0 event either on the north orsouth edge of the Cinarcik basin (Figure 3). Ambraseys[2001] concluded from the distribution of damage that the1894 event occurred in the Gulf of Izmit, and may have
overlapped the 1999 Izmit rupture; a trenching study nearIzmit also suggested overlap with the 1999 event [Tsutsumiet al., 2002]. Le Pichon et al. [2003] suggested this eventmay have occurred on a normal fault. Generation of atsunami requires some vertical seafloor motion and mightfavor a normal fault origin along the southern Cinarcik basinexcept that earthquakes interpreted to have ruptured thePrince’s Islands releasing bend (1509; May 1766) werealso tsunamigenic. Thus like the 1754 earthquake, thereare two possible fault sources for this earthquake.
A8. The 13 September 1912 Earthquake
[66] This Ms = 7.4 earthquake struck the GallipoliPeninsula region, destroying more than 300 villages; theon land part of the rupture was associated with a 50-km-longfault break [Ambraseys and Finkel, 1991]. The 360 MMIobservations from this earthquake were used to test themagnitude location determination methods as discussedpreviously.
A9. The 17 August 1999 Earthquake
[67] The M = 7.4 Izmit earthquake ruptured the NorthAnatolian fault from the western Gulf of Izmit to the townof Golyaka in the east; the on land fault break was 145 kmlong [Barka et al., 2002]. This event killed more than18,000 people and collapsed, or heavily damaged about75,000 buildings.
Appendix B: Rate-State Transient ProbabilityChange
[68] Dieterich [1994] derived a time-dependent seismicityrate R(t), after a stress perturbation as
R tð Þ ¼ r
exp �Dtas
� �� 1
exp �t
ta
h iþ 1
; ðB1Þ
where r is the steady state seismicity rate, Dt is the stressstep, s is the normal stress, a is a fault constitutive constant,and ta is an observed aftershock duration, a fault-specificparameter. An example application of this concept is toearthquake clustering and aftershocks, where R(t) takes theform of Omori’s law.[69] The transient change in expected earthquake rate R(t)
after a stress step can be related to the probability of anearthquake of a given size over the time interval Dt througha nonstationary Poisson process as
P t;Dtð Þ ¼ 1� exp �Z tþDt
t
R tð Þdt �
¼ 1� exp �N tð Þð Þ; ðB2Þ
after Dieterich and Kilgore [1996], where N(t) is theexpected number of earthquakes in the interval Dt. Thistransient probability change is superimposed on thepermanent change that results from a time shift, or a changein the repeat time as discussed previously. Integrating forN(t) yields
N tð Þ ¼ rp Dt þ ta ln1þ exp �Dt
as
� �� 1
exp �Dt
ta
h iexp �Dt
as
� �24
35
8<:
9=;; ðB3Þ
B05304 PARSONS: PROBABILITY OF EARTHQUAKES BENEATH MARMARA SEA
19 of 21
B05304
where rp is the expected rate of earthquakes associated withthe permanent probability change [Toda et al., 1998]. Thisrate can be determined by again applying a stationaryPoisson probability expression as
rp ¼�1
Dt
� �ln 1� Pcð Þ; ðB4Þ
where Pc is a conditional probability, and can be calculatedusing any distribution. The Brownian Passage Time modelis used here [Matthews et al., 2002] (equation (7)).
[70] Acknowledgments. I thank Michel Bouchon, Roland Burgmann,Bertrand De Louis, Xu Li, and Haruko Sekiguchi for sharing their Izmitearthquake source models. Many of the ideas presented in this paper weredeveloped with a working group that included Bill Bakun, Aykut Barka, JimDieterich, Ross Stein, and Shinji Toda. Substantial improvements weremade as a result of insightful reviews by Massimo Cocco, Rodolfo Console,Joan Gomberg, Ross Stein, and Shinji Toda. Partial funding from SwissReis gratefully acknowledged.
ReferencesAki, K. (1965), Maximum likelihood estimate of b in the formula log N = a–bM and its confidence limits, Bull. Earthquake Res. Inst., 43, 237–239.
Ambraseys, N. N. (1988), Engineering seismology, Earthquake Eng. Struct.Dyn., 17, 1–105.
Ambraseys, N. N. (2001), The earthquake of 10 July 1894 in the Gulfof Izmit (Turkey) and its relation to the earthquake of 17 August 1999,J. Seismol., 5, 117–128.
Ambraseys, N. N. (2002), The seismic activity of the Marmara Sea regionover the last 2000 years, Bull. Seismol. Soc. Am., 92, 1–18.
Ambraseys, N. N., and C. F. Finkel (1987), Seismicity of Turkey andneighboring regions, 1899–1915, Ann. Geophys., 5, 701–725.
Ambraseys, N. N., and C. F. Finkel (1990), The Marmara Sea earthquake of1509, Terra Nova, 2, 167–174.
Ambraseys, N. N., and C. F. Finkel (1991), Long-term seismicity of Istan-bul and the Marmara sea region, Terra Nova, 3, 527–539.
Ambraseys, N. N., and C. F. Finkel (1995), The Seismicity of Turkey andAdjacent Areas: A Historical Review,1500–1800, 240 pp., Muhittin SalihEREN, Istanbul.
Armijo, R., B. Meyer, A. Hubert, and A. Barka (1999), Westward propaga-tion of the North Anatolian fault into the northern Aegean: Timing andkinematics, Geology, 27, 267–270.
Armijo, R., B. Meyer, S. Navarro, G. King, and A. Barka (2002), Asym-metric slip partitioning in the Sea of Marmara pull-apart: A clue topropagation processes of the North Anatolian fault?, Terra Nova, 14,80–86.
Bakun, W. H., and C. M. Wentworth (1997), Estimating earthquakelocation and magnitude from seismic intensity data, Bull. Seismol. Soc.Am., 87, 1502–1521.
Barka, A. A. (1996), Slip distribution along the North Anatolianfault associated with large earthquakes of the period 1939 to 1967, Bull.Seismol. Soc. Am., 86, 1234–1238.
Barka, A. A., et al. (2002), The surface rupture and slip distribution of the17 August 1999 Izmit earthquake (M 7.4), North Anatolian Fault, Bull.Seismol. Soc. Am., 92, 43–60.
Bouchon, M., M. N. Toksoz, H. Karabulut, M.-P. Bouin, M. Dietrich,M. Aktar, and M. Edie (2002), Space and time evolution of ruptureand faulting during the 1999 Izmit (Turkey) earthquake, Bull. Seismol.Soc. Am., 92, 256–266.
Burgmann, R., S. Ergintav, P. Segall, E. H. Hearn, S. C. McClusky, R. E.Reilinger, H. Woith, and J. Zschau (2002), Time-dependent distributedafterslip on and deep below the Izmit earthquake rupture, Bull. Seismol.Soc. Am., 92, 1450–1469.
Caristan, Y. (1982), The transition from high temperature creep to fracturein Maryland diabase, J. Geophys. Res., 87, 6781–6790.
Carter, N. L., and M. C. Tsenn (1987), Flow properties of the lithosphere,Tectonophysics, 136, 27–63.
De Louis, B., D. Giardini, P. Lundgren, and J. Salichon (2002), Jointinversion of InSAR, GPS, teleseismic, and strong-motion data for thespatial and temporal distribution of earthquake slip: Application to the1999 Izmit mainshock, Bull. Seismol. Soc. Am., 92, 278–299.
Dieterich, J. H. (1994), A constitutive law for rate of earthquake productionand its application to earthquake clustering, J. Geophys. Res., 99, 2601–2618.
Dieterich, J. H., and B. Kilgore (1996), Implications of fault constitutiveproperties for earthquake prediction, Proc. Natl. Acad. Sci. USA, 93,3787–3794.
Dutton, C. E. (1904), Earthquakes in the Light of the New Seismology,314 pp., G. P. Putnam, New York.
Felzer, K. R., R. E. Abercrombie, and G. Ekstrom (2003), Secondary after-shocks and their importance for aftershock forecasting, Bull. Seismol.Soc. Am., 93, 1433–1448.
Hagiwara, Y. (1974), Probability of earthquake occurrence as obtained froma Weibull distribution analysis of crustal strain, Tectonophysics, 23, 313–318.
Hansen, F. D., and N. L. Carter (1983), Semibrittle creep of dry and wetWesterly granite at 1000 MPa, in 24th U.S. Symposium on RockMechanics, pp. 429–447, Tex. A&M Univ., College Station.
Harris, R. A. (1998), Introduction to special section: Stress triggers, stressshadows, and implications for seismic hazard, J. Geophys. Res., 103,24,347–24,358.
Hearn, E. H., R. Burgmann, and R. E. Reilinger (2002), Dynamics of Izmitearthquake postseismic deformation and loading of the Duzce earthquakehypocenter, Bull. Seismol. Soc. Am., 92, 172–193.
Horasan, G., L. Gulen, A. Pinar, D. Kalafat, N. Ozel, H. S. Kuleli, and A. M.Isikara (2002), Lithospheric structure of the Marmara and Aegeanregions, western Turkey, Bull. Seismol. Soc. Am., 92, 322–329.
Hubert-Ferrari, A., A. Barka, E. Jaques, S. S. Nalbant, B. Meyer, R. Armijo,P. Tapponnier, and G. C. P. King (2000), Seismic hazard in the MarmaraSea region following the 17 August 1999 Izmit earthquake, Nature, 404,269–273.
Ito, A., et al. (1999), Precise distribution of aftershocks of the Izmit earth-quake of August 17, 1999, Turkey, Eos Trans. AGU, 80(46), Fall Meet.Suppl., F662.
Jackson, J. (2002), Strength of the continental lithosphere: Time to abandonthe jelly sandwich?, GSA Today, 12, 4–9.
Kagan, Y. Y. (1994), Incremental stress and earthquakes, Geophys. J. Int.,117, 345–364.
Kagan, Y. Y., and D. D. Jackson (1991), Long-term earthquake clustering,Geophys. J. Int., 104, 117–133.
Ketin, I. (1969), Uber die nordanatolische Horizontalverschiebung, Bull.Min. Res. Explor. Inst. Turkey, 72, 1–28.
Kilb, D., J. Gomberg, and P. Bodin (2002), Aftershock triggering by com-plete Coulomb stress changes, J. Geophys. Res., 107(B4), 2060,doi:10.1029/2001JB000202.
Kirby, S. H., and A. K. Kronenberg (1987), Rheology of the lithosphere:Selected topics, Rev. Geophys., 25, 1219–1244.
Lachenbruch, A. H., and P. Morgan (1990), Continental extension,magmatism, and elevation: Formal relations and rules of thumb, Tecto-nophysics, 174, 39–62.
Le Pichon, X., et al. (2001), The active main Marmara Fault, Earth Planet.Sci. Lett., 192, 595–616.
Le Pichon, X., N. Chamot-Rooke, C. Rangin, and A. M. C. Sengor (2003),The North Anatolian fault in the Sea of Marmara, J. Geophys. Res.,108(B4), 2179, doi:10.1029/2002JB001862.
Li, X., V. F. Cormier, and M. N. Toksoz (2002), Complex source process ofthe 17 August 1999 Izmit, Turkey, earthquake, Bull. Seismol. Soc. Am.,92, 267–277.
Lindh, A. G. (2004), Long-term earthquake forecasts in the San FranciscoBay area, Bull. Seismol. Soc. Am, in press.
Marcellini, A. (1997), Physical model of aftershock temporal behavior,Tectonophysics, 277, 137–146.
Matthews, M. V., W. L. Ellsworth, and P. A. Reasenberg (2002), A Brown-ian model for recurrent earthquakes, Bull. Seismol. Soc. Am., 92, 2233–2250.
McClusky, S., et al. (2000), Global Positioning System constraints on platekinematics and dynamics in the eastern Mediterranean and Caucasus,J. Geophys. Res., 105, 5695–5719.
Meade, B. J., B. H. Hager, S. C. McClusky, R. E. Reilinger, S. Ergintav,O. Lenk, A. Barka, and H. Ozener (2002), Estimates of seismic potentialin the Marmara Sea region from block models of secular deformationconstrained by Global Positioning System measurements, Bull. Seismol.Soc. Am., 92, 208–215.
Nakamura, A., A. Hasegawa, A. Ito, B. Ucer, S. Baris, Y. Honkura, T. Kono,S. Hori, R. Pektas, T. Kolmut, C. Celik, and A. M. Isikara (2002), P-wavevelocity of the crust and its relationship to the occurrence of the 1999Izmit, Turkey, earthquake and aftershocks, Bull. Seismol. Soc. Am., 92,330–338.
Nalbant, S. S., A. Hubert, and G. C. P. King (1998), Stress couplingbetween earthquakes in northwest Turkey and the north Aegean Sea,J. Geophys. Res., 103, 24,469–24,486.
Nishenko, S. P., and R. Buland (1987), A generic recurrence interval dis-tribution for earthquake forecasting, Bull. Seismol. Soc. Am., 77, 1382–1399.
B05304 PARSONS: PROBABILITY OF EARTHQUAKES BENEATH MARMARA SEA
20 of 21
B05304
Ogata, Y. (1999), Estimating the hazard of rupture using uncertain occur-rence times of paleoearthquakes, J. Geophys. Res., 104, 17,995–18,014.
Okada, Y. (1992), Internal deformation due to shear and tensile faults in ahalf-space, Bull. Seismol. Soc. Am., 82, 1018–1040.
Omori, F. (1894), On aftershocks, Rep. Imp. Earthquake Invest. Comm., 2,103–109.
Oncel, A. O., and M. Wyss (2000), The major asperities of the 1999 Mw =7.4 Izmit earthquake defined by the microseismicity of the two decadesbefore it, Geophys. J. Int., 143, 501–506.
Parke, J. R., T. A. Minshull, G. Anderson, R. S. White, D. McKenzie,I. Kuscu, J. M. Bull, N. Gorur, and C. Sengor (1999), Active faults inthe Sea of Marmara, western Turkey, imaged by seismic reflectionprofiles, Terra Nova, 11, 223–227.
Parsons, T. (1998), Seismic-reflection evidence that the Hayward faultextends into the lower crust of the San Francisco Bay area, California,Bull. Seismol. Soc. Am., 88, 1212–1223.
Parsons, T. (2002a), Global Omori law decay of triggered earthquakes:Large aftershocks outside the classical aftershock zone, J. Geophys.Res., 107(B9), 2199, doi:10.1029/2001JB000646.
Parsons, T. (2002b), Post-1906 stress recovery of the San Andreas faultsystem from three-dimensional finite element analysis, J. Geophys. Res.,107(B8), 2162, doi:10.1029/2001JB001051.
Parsons, T., S. Toda, R. S. Stein, A. Barka, and J. H. Dieterich (2000),Heightened odds of large earthquakes near Istanbul: An interaction-basedprobability calculation, Science, 288, 661–665.
Pfister, M., L. Rybach, and S. Simsek (1998), Geothermal reconnaissanceof the Marmara Sea region (NW Turkey): Surface heat flow density in anarea of active continental extension, Tectonophysics, 291, 77–89.
Reilinger, R. E., et al. (2000), Coseismic and postseismic fault slip for the17 August 1999, M = 7.5, Izmit, Turkey earthquake, Science, 289, 1519–1524.
Rockwell, T. (2000), Paleoearthquake history of the North Anatolian fault,western Turkey: An investigation into the nature of earthquake recurrenceas revealed by precise stratigraphic and historical records, San Diego, CA,in Geological Sciences, 28 pp., San Diego State Univ., San Diego, Calif.
Savage, J. C. (1991), Criticism of some forecasts of the National EarthquakePrediction Evaluation Council, Bull. Seismol. Soc. Am., 81, 862–881.
Savage, J. C. (1992), The uncertainty in earthquake conditional probabil-ities, Geophys. Res. Lett., 19, 709–712.
Scholz, C. H. (1968), Microfractures, aftershocks, and seismicity, Bull.Seismol. Soc. Am., 58, 1117–1130.
Stein, R. S. (1999), The role of stress transfer in earthquake occurrence,Nature, 402, 605–609.
Stein, R. S., A. A. Barka, and J. H. Dieterich (1997), Progressive failure onthe North Anatolian fault since 1939 by earthquake stress triggering,Geophys. J. Int., 128, 594–604.
Toda, S., R. S. Stein, P. A. Reasenberg, J. H. Dieterich, and A. Yoshida(1998), Stress transferred by the 1995 Mw = 6.9 Kobe, Japan, shock:Effect on aftershocks and future earthquake probabilities, J. Geophys.Res., 103, 24,543–24,565.
Toksoz, M. N., A. F. Shakal, and A. J. Michael (1979), Space-time migra-tion of earthquakes along the North Anatolian fault zone and seismicgaps, Pageoph, 117, 1258–1270.
Tsutsumi, H., S. Toda, O. Emre, M. Okuno, S. Ozalp, C. Yildirim, K. Takada,and T. Nakamura (2002), Recurrence of large earthquakes on the 1999Izmit surface rupture, North Anatolian Fault, Turkey, Eos Trans. AGU,83(47), Fall Meet. Suppl., Abstract S11B-1152.
Wells, D. L., and K. J. Coppersmith (1994), New empirical relationshipsamong magnitude, rupture length, rupture width, rupture area, and sur-face displacement, Bull. Seismol. Soc. Am., 84, 974–1002.
Working Group on California Earthquake Probabilities (WGCEP) (1990),Probabilities of large earthquakes in the San Francisco Bay region,California, U.S. Geol. Surv. Circ., 1053, 51 pp.
Working Group on California Earthquake Probabilities (WGCEP) (1999),Probabilities of large earthquakes in the San Francisco Bay region,California, U.S. Geol. Surv. Open File Rep., 99-517, 60 pp.
Working Group on California Earthquake Probabilities (WGCEP) (2003),Probabilities of large earthquakes in the San Francisco Bay region:2002–2031, U.S. Geol. Surv. Open File Rep., 03-214, 235 pp.
�����������������������T. Parsons, U.S. Geological Survey, Mail Stop 999, 345 Middlefield
Road, Menlo Park, CA 94025, USA. ([email protected])
B05304 PARSONS: PROBABILITY OF EARTHQUAKES BENEATH MARMARA SEA
21 of 21
B05304