Embed Size (px)
DESCRIPTION
Citation preview
Measuring Student Satisfaction with Online Learning
XLENTS.com
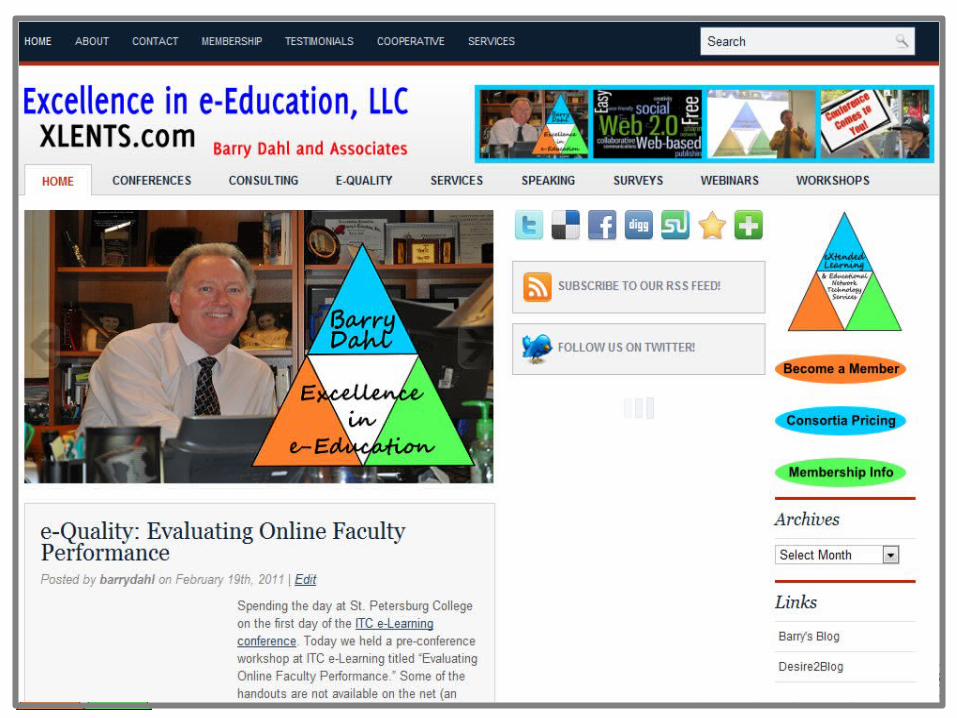
Upcoming MCCVLC Webinars• Jan. 19 - Evaluating Performance of
Online Faculty
• Feb. 9 - Student Preparedness for Online Learning
• Mar. 22 – Evaluating Online Learning Programs
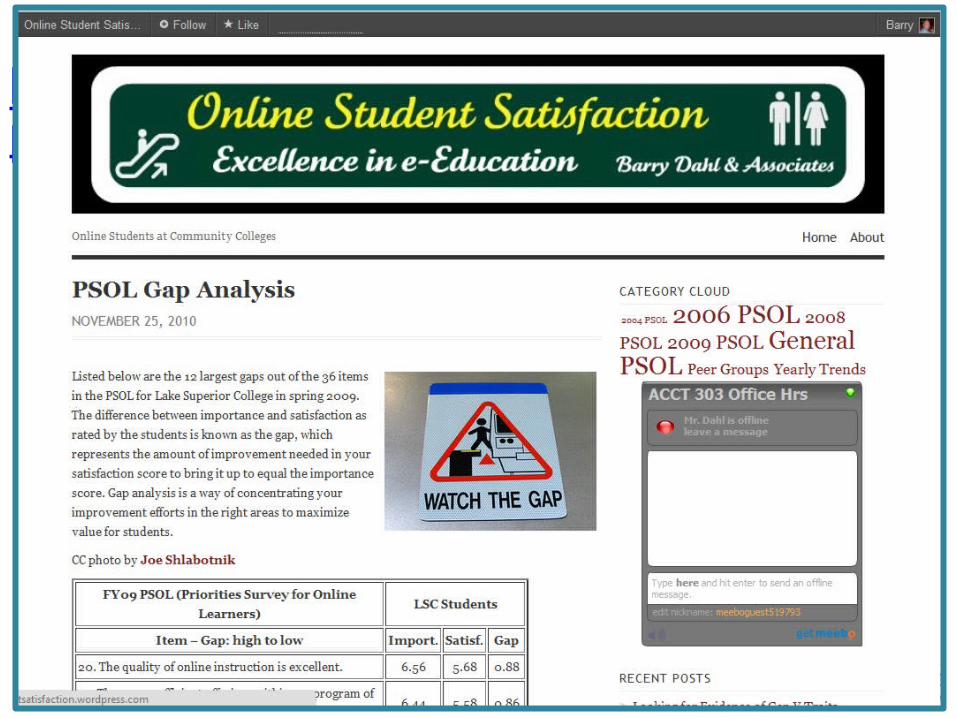
http://studentsatisfaction.wordpress.com/
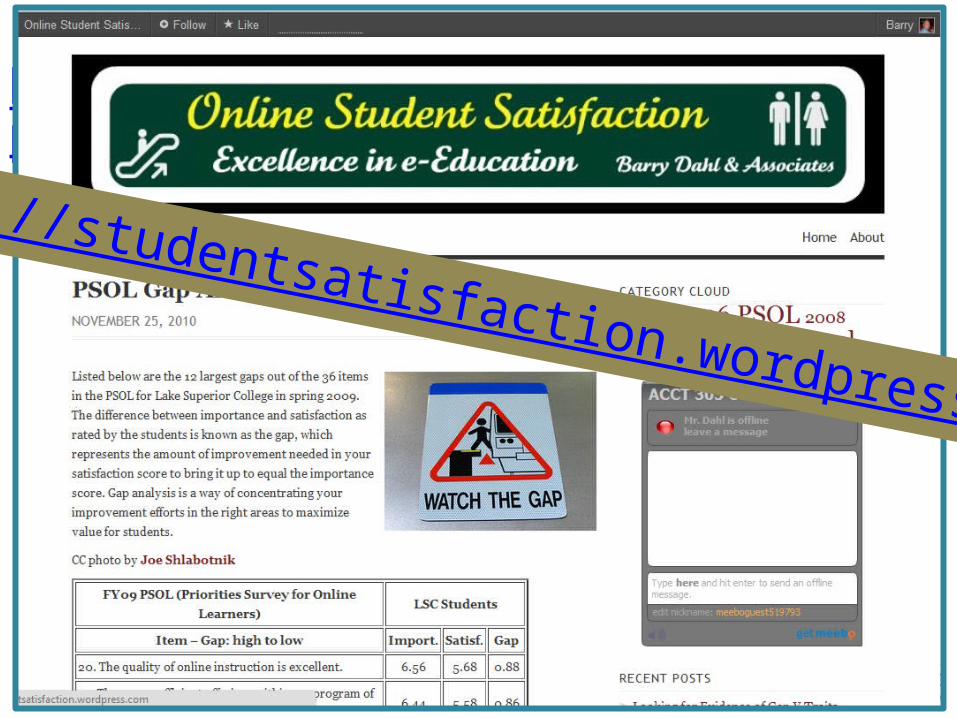
http://studentsatisfaction.wordpress.com/
http://studentsatisfaction.wordpress.com
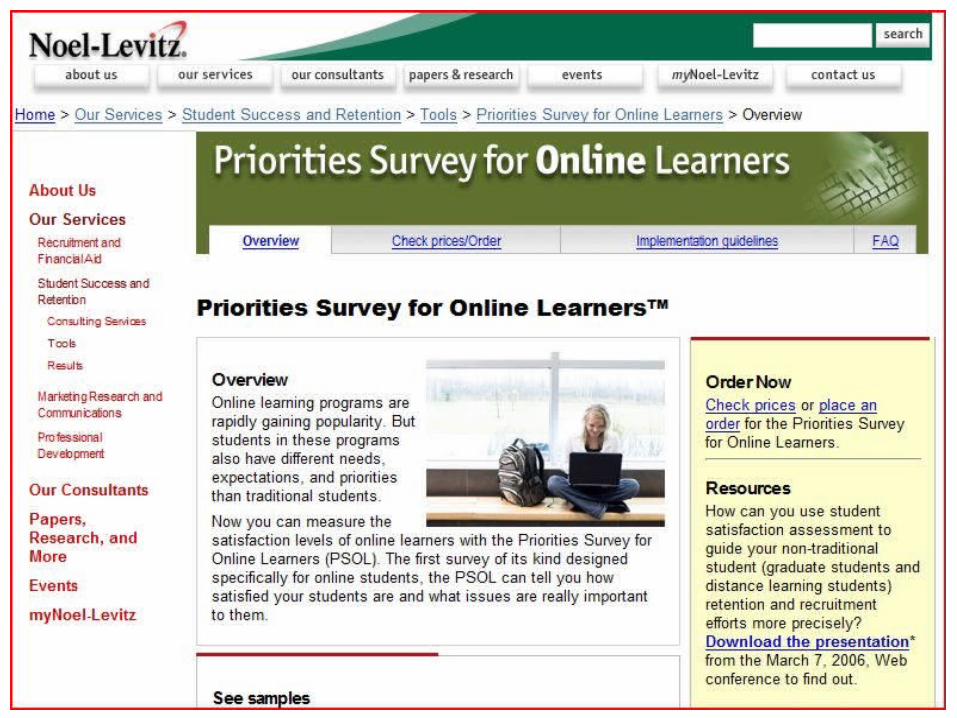
Option 1 - PSOL
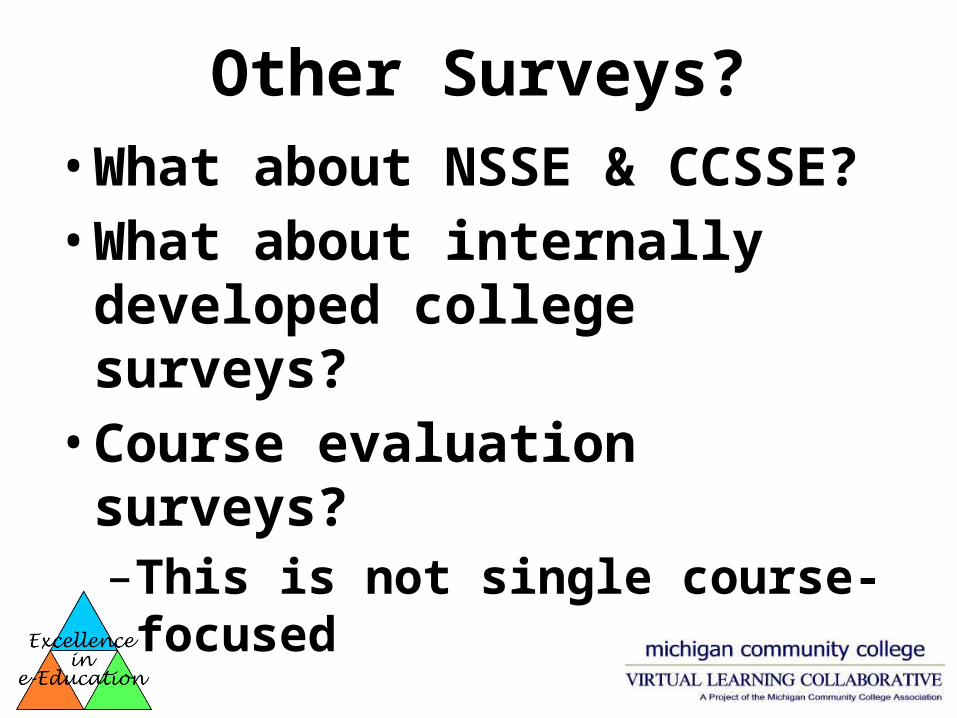
Other Surveys?• What about NSSE & CCSSE?• What about internally developed
college surveys?• Course evaluation surveys?
–This is not single course-focused
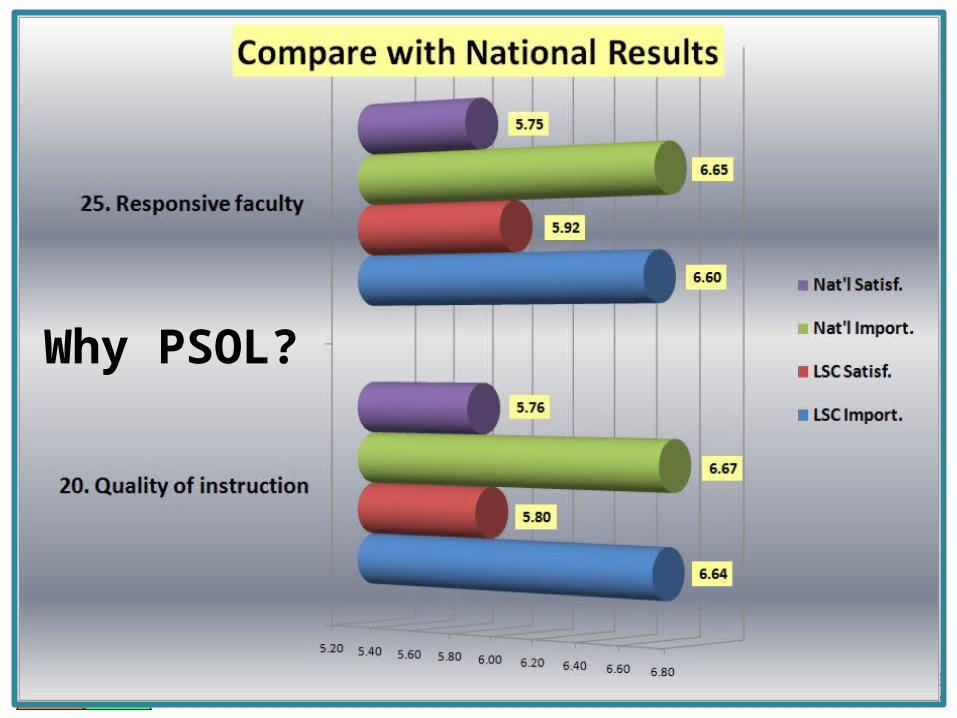
Why PSOL?
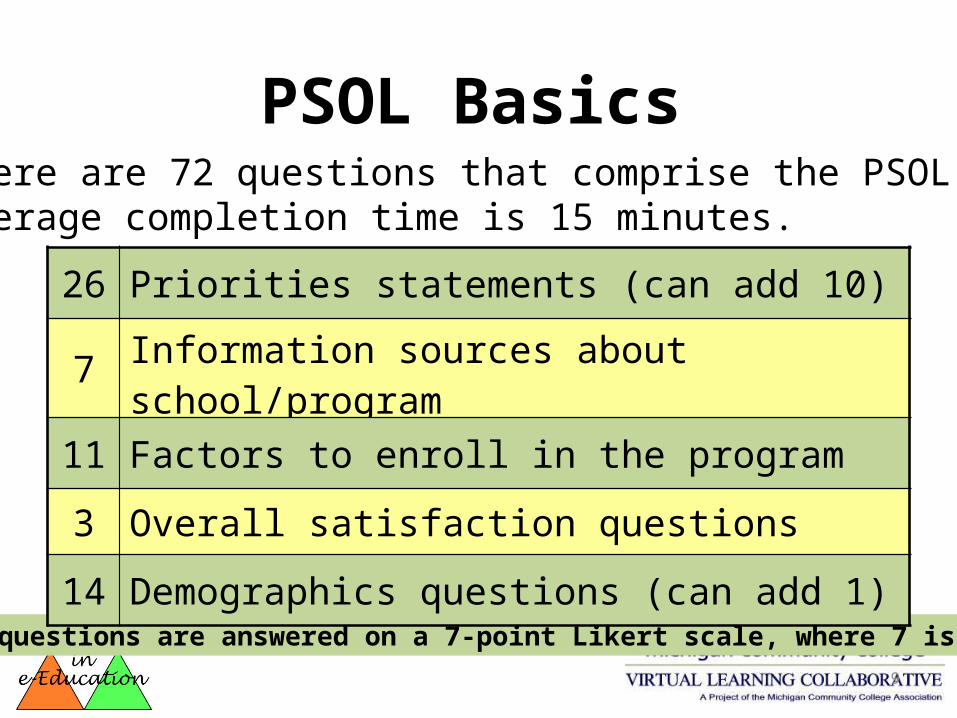
PSOL BasicsThere are 72 questions that comprise the PSOL. Average completion time is 15 minutes.
NOTE: questions are answered on a 7-point Likert scale, where 7 is high.
26 Priorities statements (can add 10)
7 Information sources about school/program
11 Factors to enroll in the program
3 Overall satisfaction questions
14 Demographics questions (can add 1)
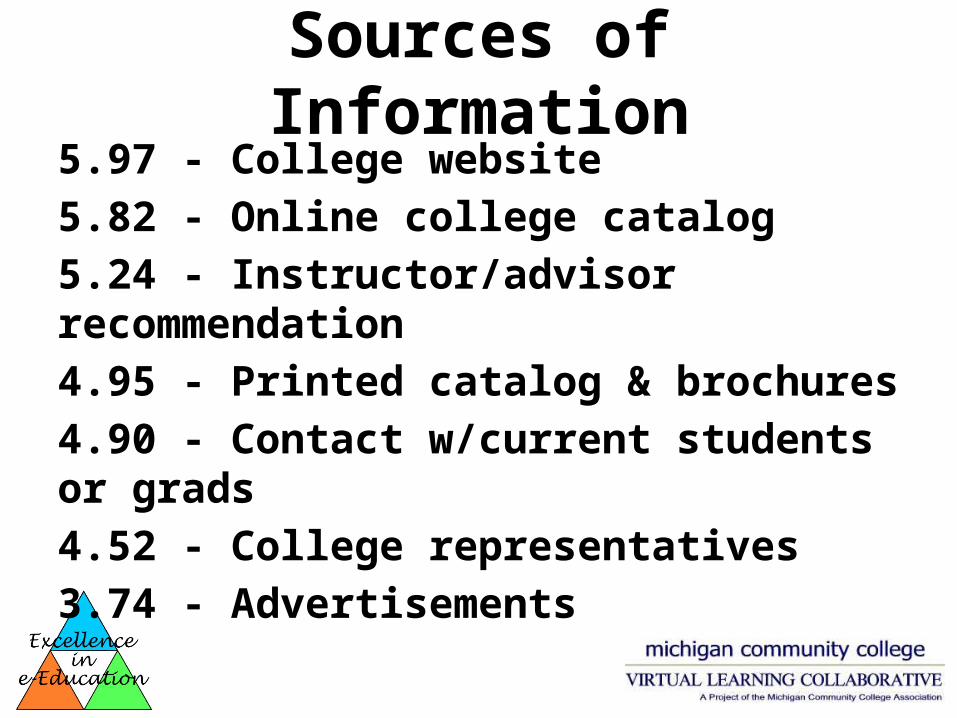
Sources of Information5.97 - College website5.82 - Online college catalog5.24 - Instructor/advisor recommendation4.95 - Printed catalog & brochures4.90 - Contact w/current students or grads4.52 - College representatives3.74 - Advertisements
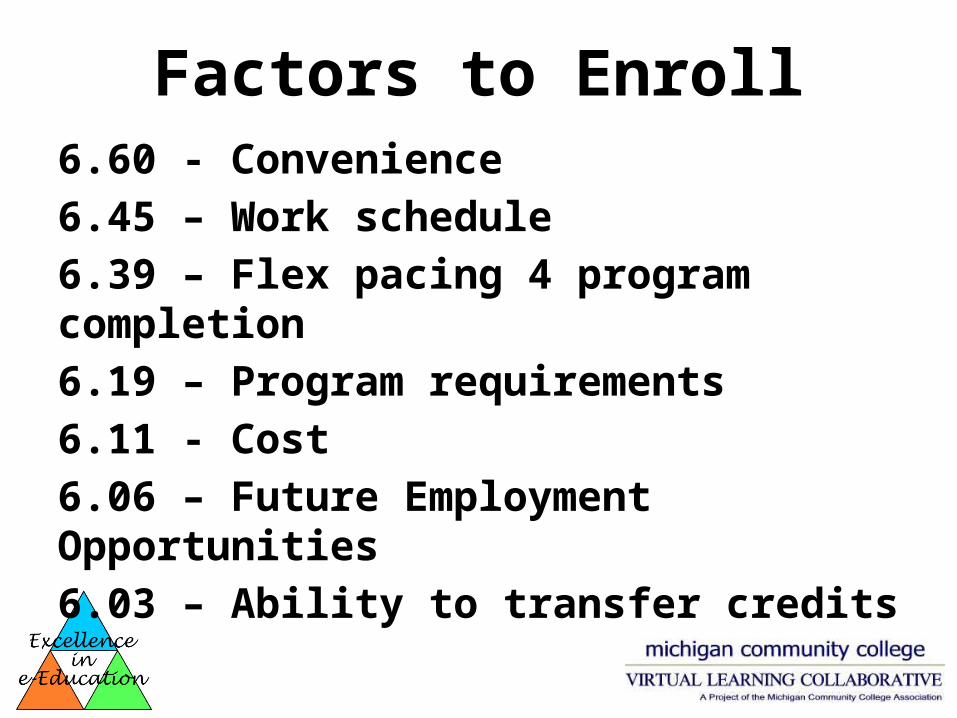
Factors to Enroll6.60 - Convenience6.45 – Work schedule6.39 – Flex pacing 4 program completion6.19 – Program requirements6.11 - Cost6.06 – Future Employment Opportunities6.03 – Ability to transfer credits
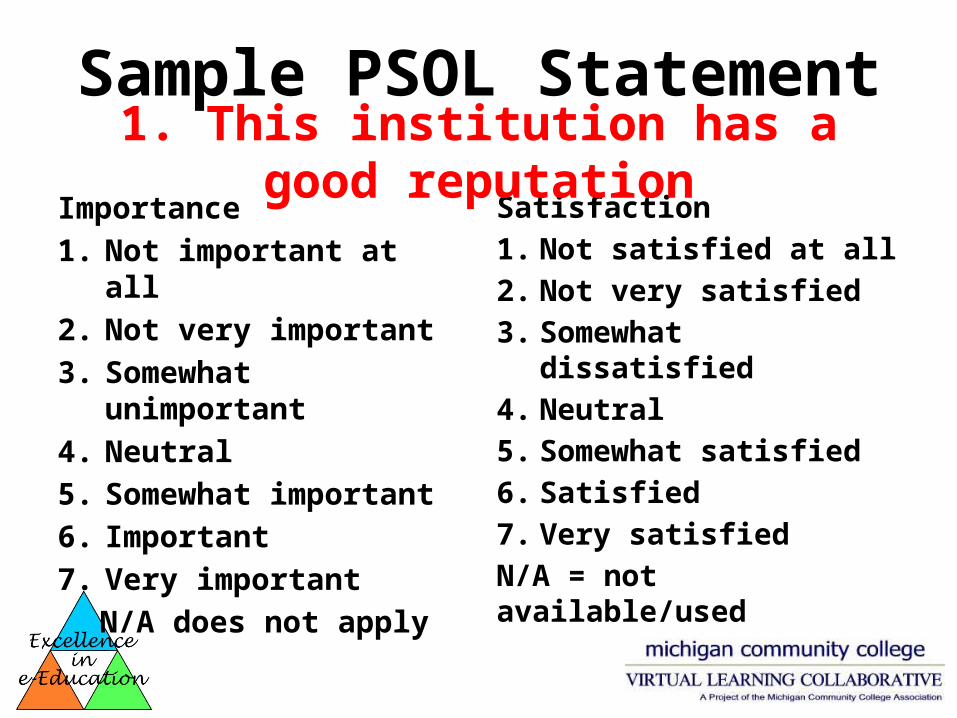
Sample PSOL Statement
Importance1. Not important at all2. Not very important3. Somewhat unimportant4. Neutral5. Somewhat important6. Important7. Very important
N/A does not apply
Satisfaction1. Not satisfied at all2. Not very satisfied3. Somewhat dissatisfied4. Neutral5. Somewhat satisfied6. Satisfied7. Very satisfiedN/A = not available/used
1. This institution has a good reputation
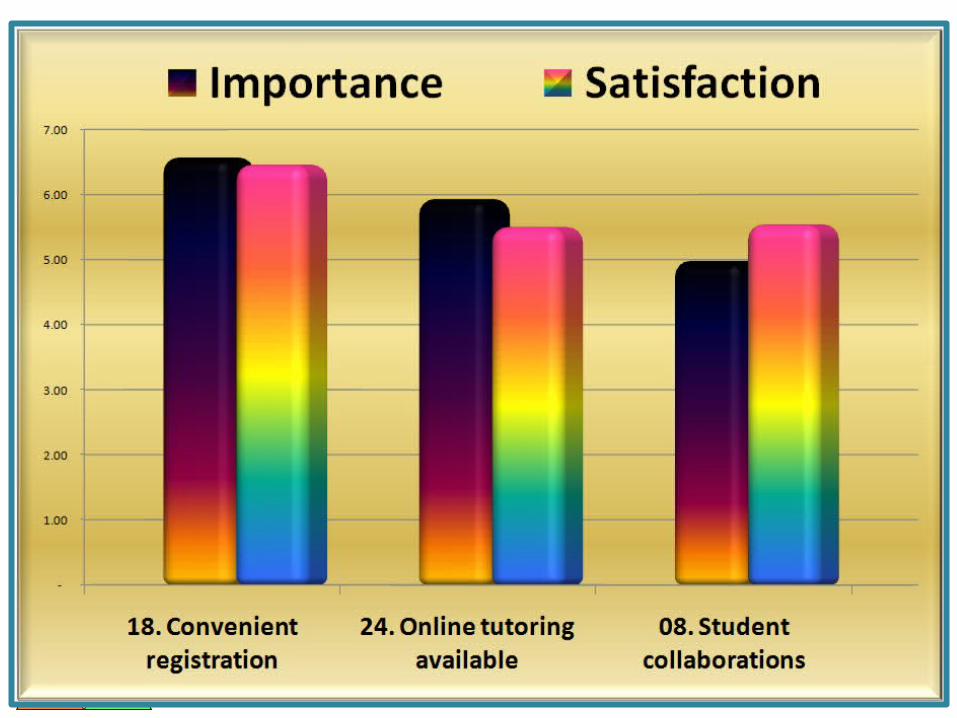
The Importance of Importance
Examples of Useful Reports
• Student satisfaction breakdown by online program area
• Primarily online vs. Primarily on-campus• Previous online enrollment• Age breakdown: 24 & under vs. 25 & up• Comparison to MnOnline consortium• Comparison to Peer Group of Schools
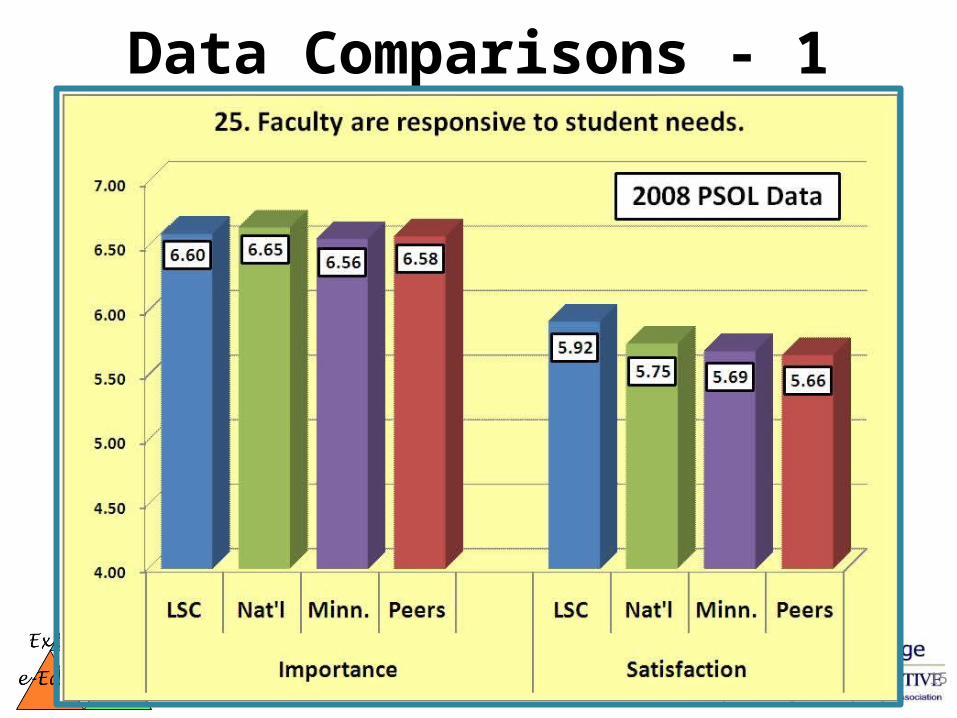
Data Comparisons - 1
15
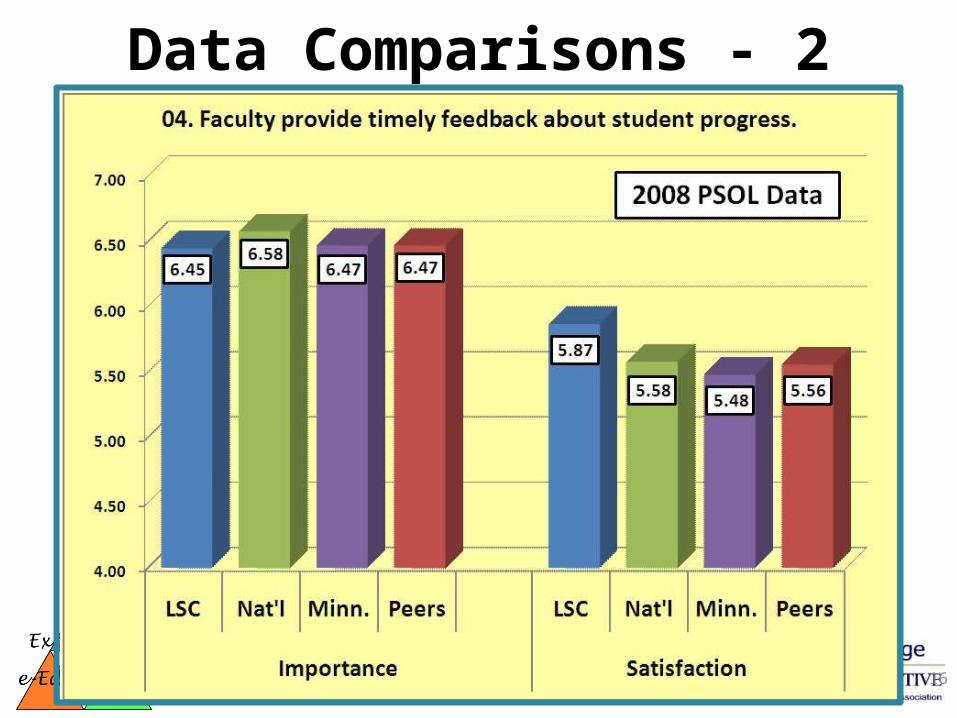
Data Comparisons - 2
16
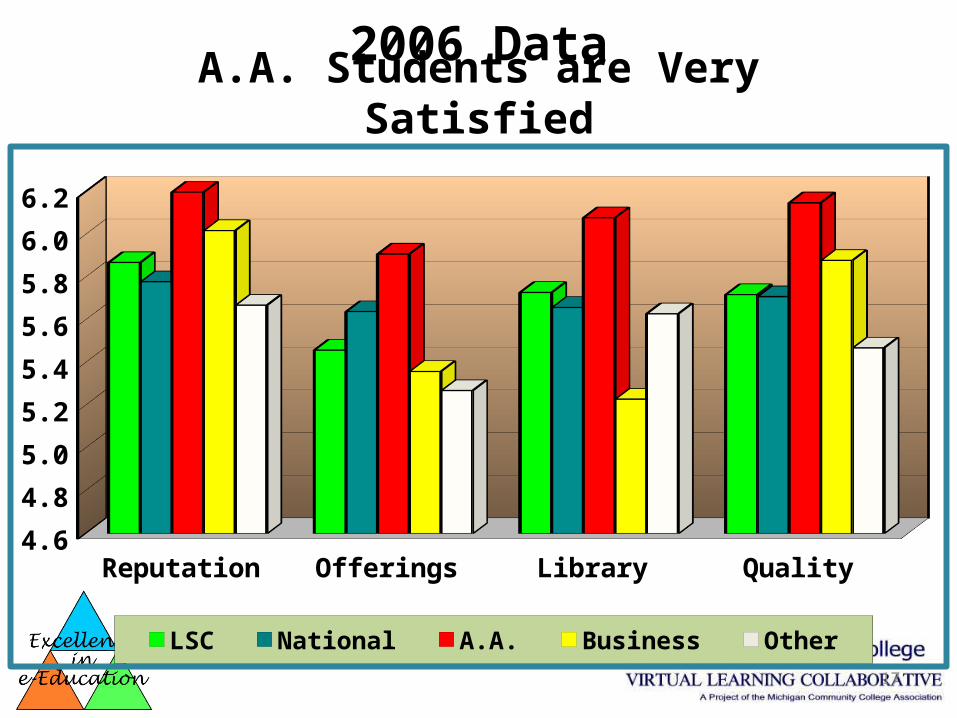
A.A. Students are Very Satisfied
Reputation Offerings Library Quality4.6
4.8
5.0
5.2
5.4
5.6
5.8
6.0
6.2
LSC National A.A. Business Other
2006 Data
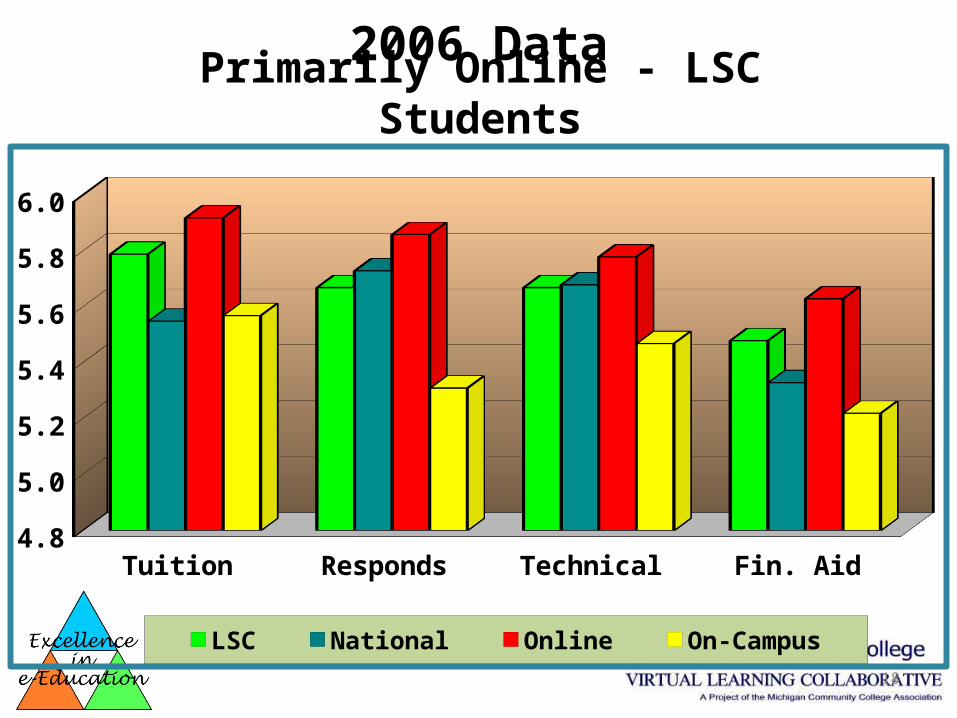
Primarily Online - LSC Students
Tuition Responds Technical Fin. Aid4.8
5.0
5.2
5.4
5.6
5.8
6.0
LSC National Online On-Campus
2006 Data
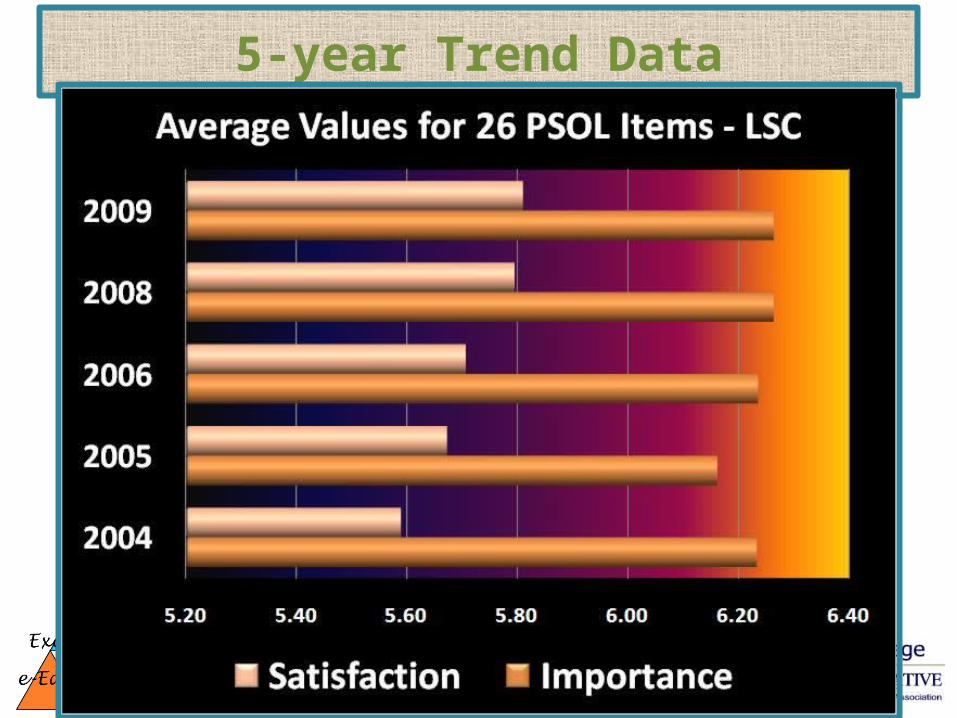
5-year Trend Data
19

4-year Trend Data
20
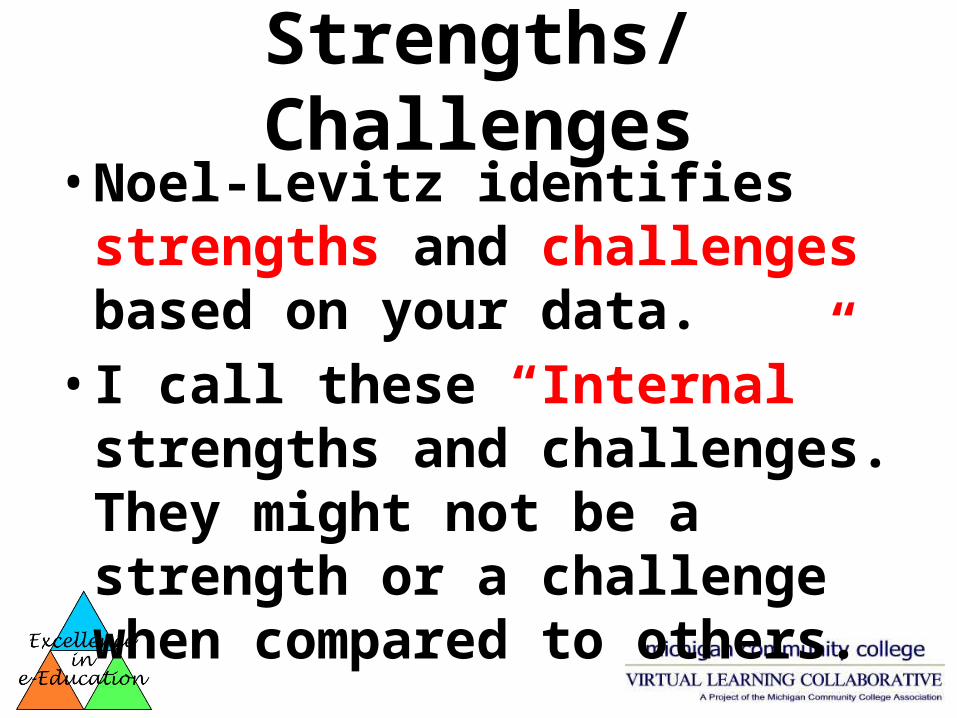
Strengths/Challenges• Noel-Levitz identifies strengths and
challenges based on your data.• I call these “Internal” strengths and
challenges. They might not be a strength or a challenge when compared to others.
22
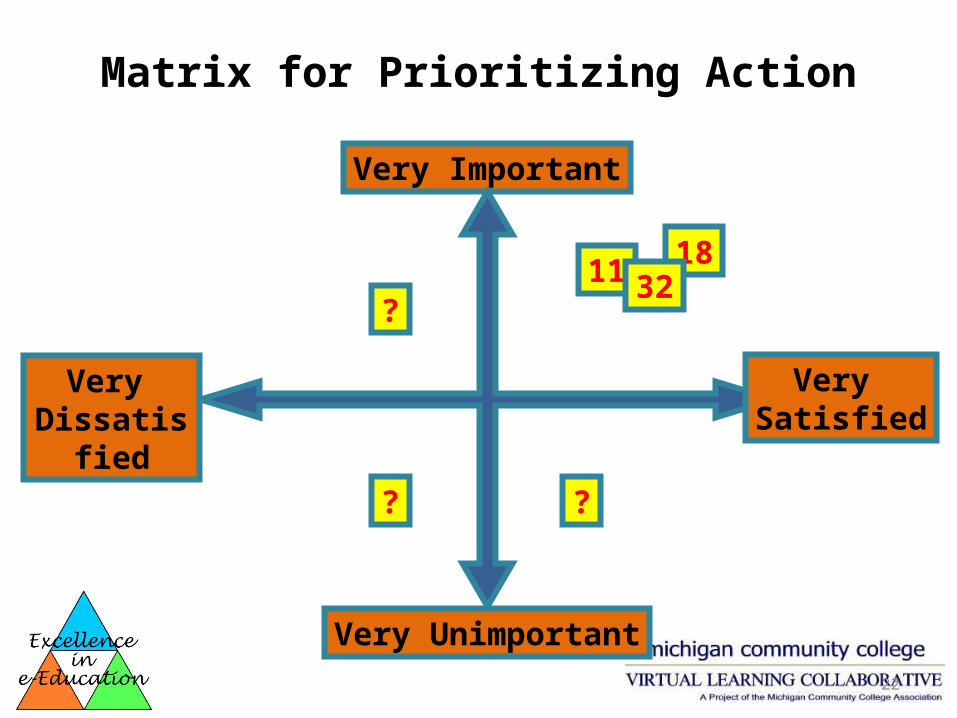
Matrix for Prioritizing ActionVery Important
Very Unimportant
Very
DissatisfiedVery
Satisfied
1811 32
??
?
23
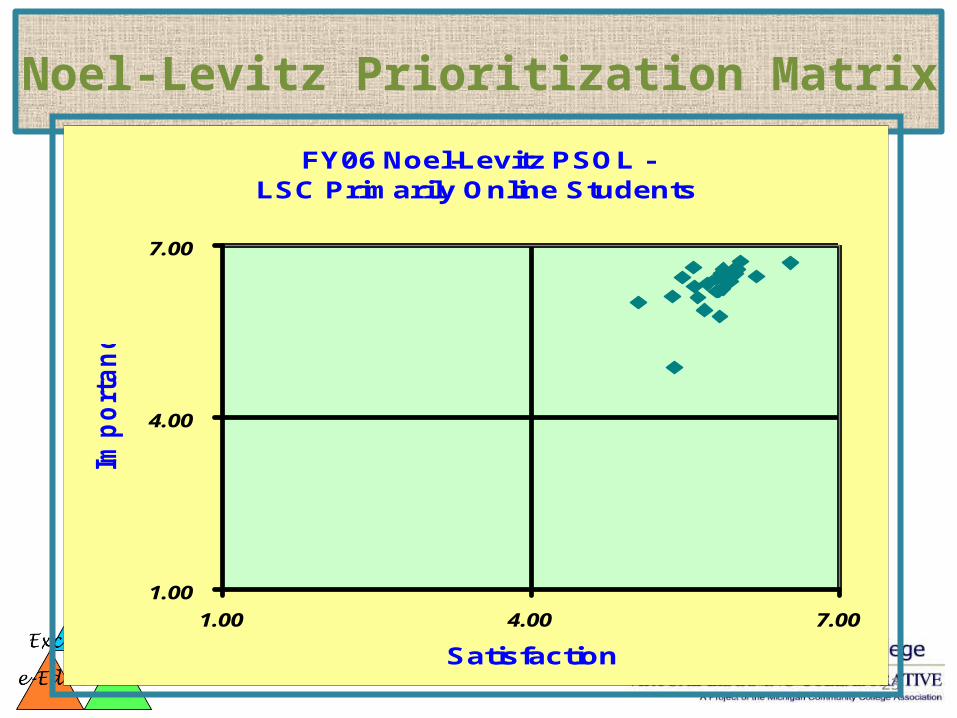
FY06 Noel-Levitz PSOL - LSC Primarily Online Students
1.00
4.00
7.00
1.00 4.00 7.00
Satisfaction
Imp
ort
an
ce
Noel-Levitz Prioritization Matrix
24
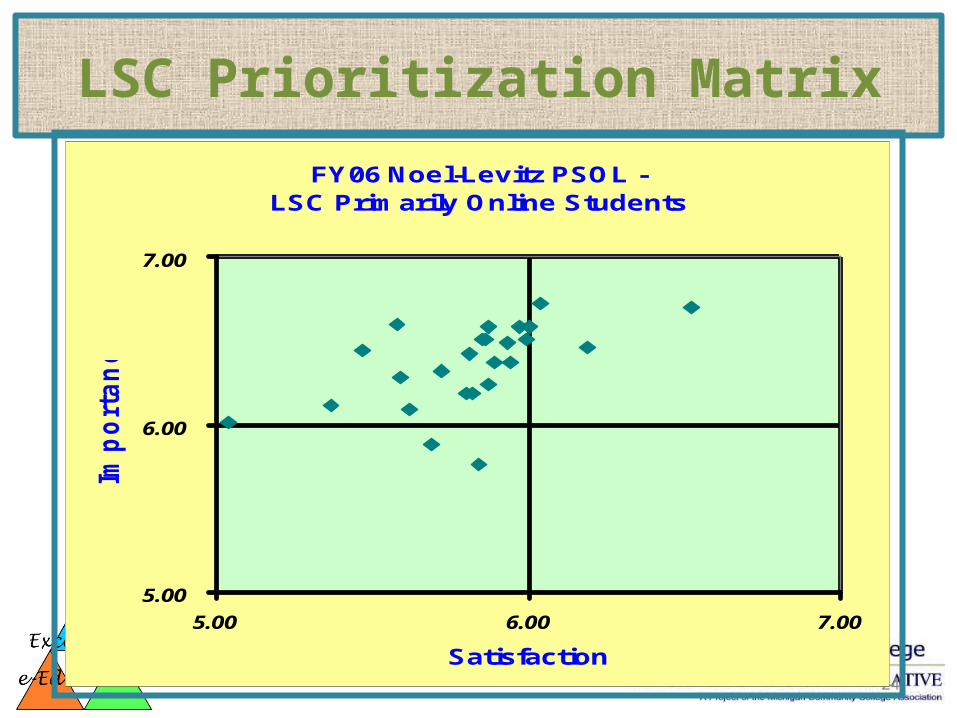
FY06 Noel-Levitz PSOL - LSC Primarily Online Students
5.00
6.00
7.00
5.00 6.00 7.00
Satisfaction
Imp
ort
an
ce
LSC Prioritization Matrix
25
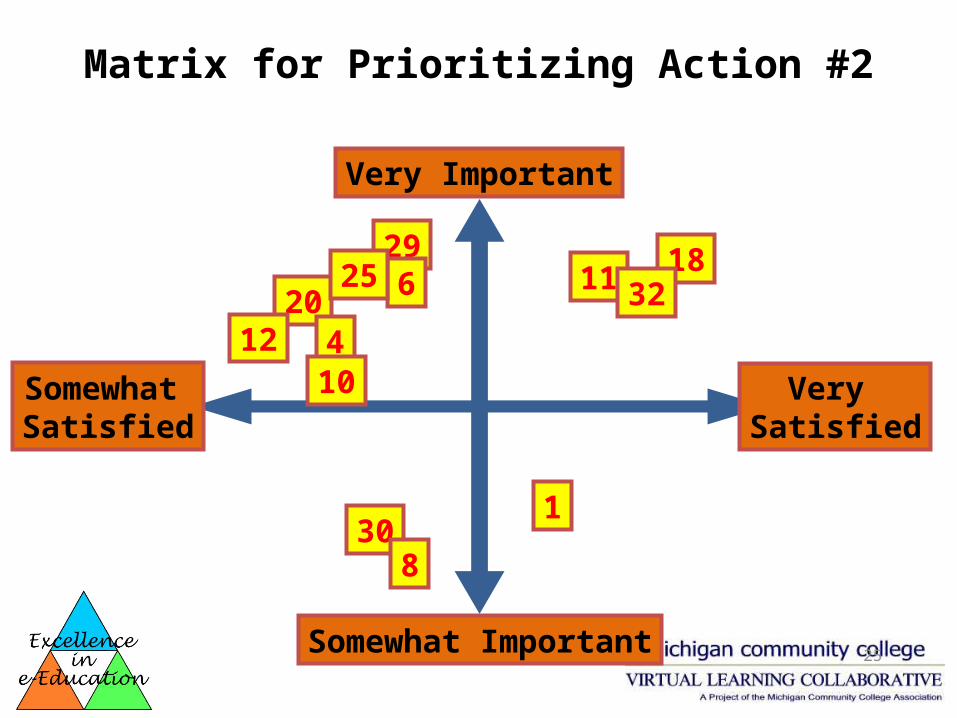
Matrix for Prioritizing Action #2
Very Important
Somewhat Important
Somewhat
SatisfiedVery
Satisfied
1811 32
308
29
20 6
12
25
410
1
26
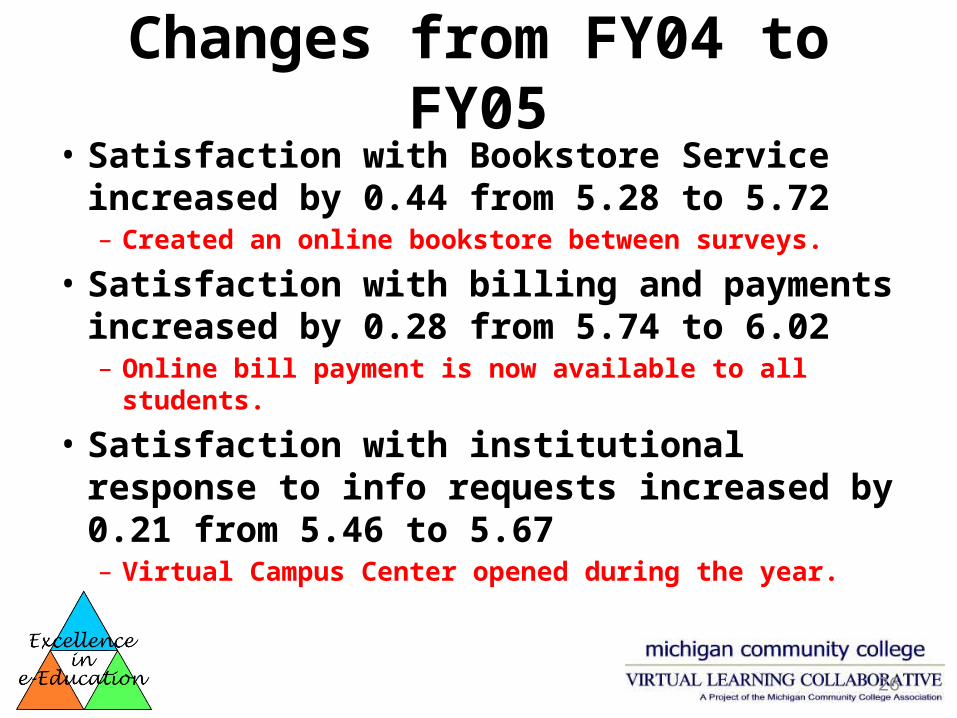
Changes from FY04 to FY05• Satisfaction with Bookstore Service increased
by 0.44 from 5.28 to 5.72– Created an online bookstore between surveys.
• Satisfaction with billing and payments increased by 0.28 from 5.74 to 6.02– Online bill payment is now available to all students.
• Satisfaction with institutional response to info requests increased by 0.21 from 5.46 to 5.67– Virtual Campus Center opened during the year.
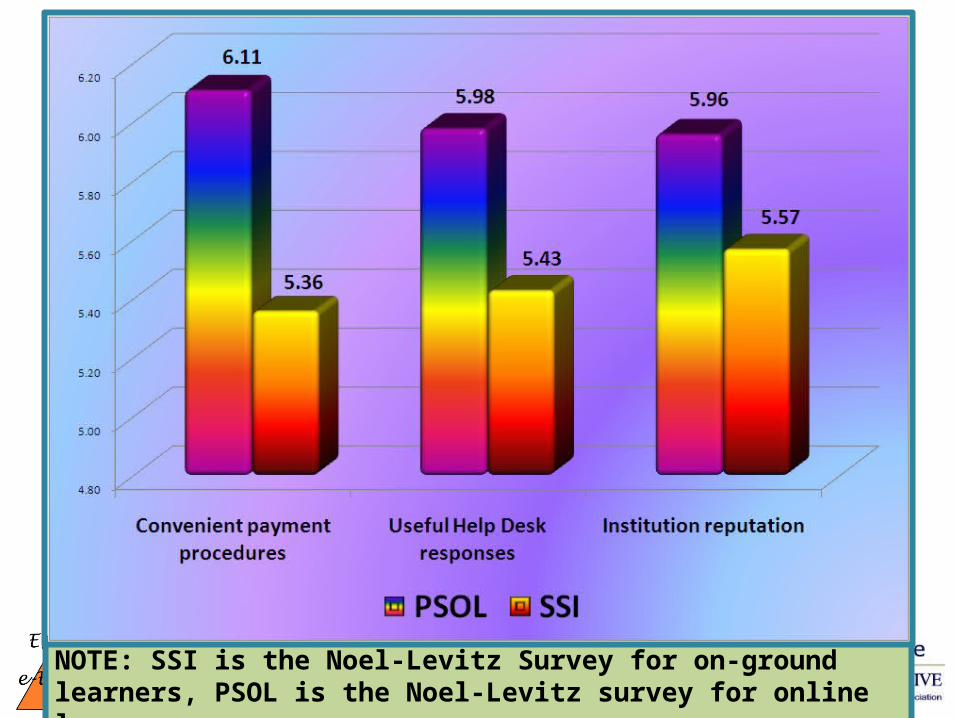
NOTE: SSI is the Noel-Levitz Survey for on-ground learners, PSOL is the Noel-Levitz survey for online learners.
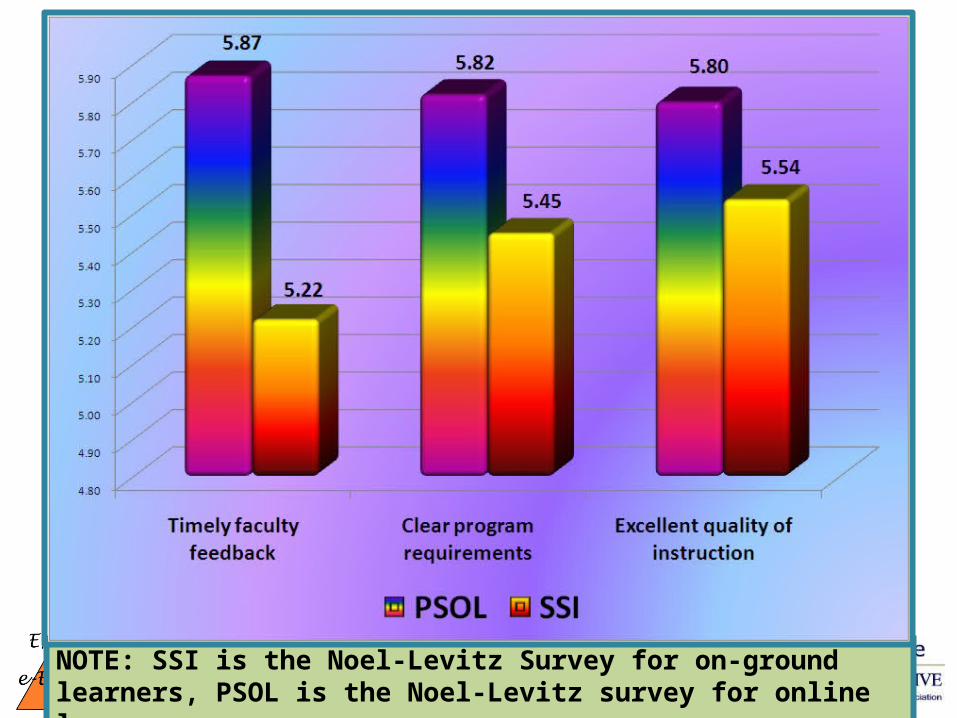
NOTE: SSI is the Noel-Levitz Survey for on-ground learners, PSOL is the Noel-Levitz survey for online learners.
Peer Group Comparison• Better than National data• Better than MnOnline consortium data• We picked 10-13 schools with similar
missions and circumstances• Noel-Levitz ran special reports for us• 2006 (13 schools) and 2008 (10 schools)
and 2009 (11 schools)
30
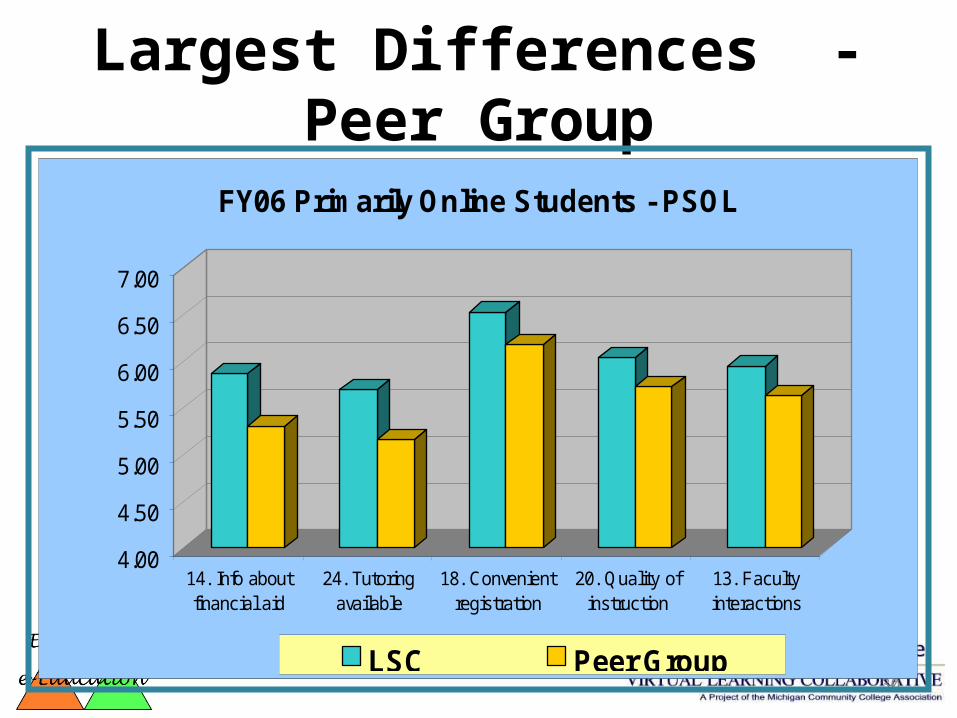
Largest Differences - Peer Group
4.00
4.50
5.00
5.50
6.00
6.50
7.00
14. Info aboutfinancial aid
24. Tutoringavailable
18. Convenientregistration
20. Quality ofinstruction
13. Facultyinteractions
FY06 Primarily Online Students - PSOL
LSC Peer Group
Added Questions• 10 spots for additional statements• MnSCU uses 5 spots for MnOnline
questions, including reliability of D2L• LSC uses 5 spots to ask about things of
importance. In 2009 we hit a sweet spot with student importance.
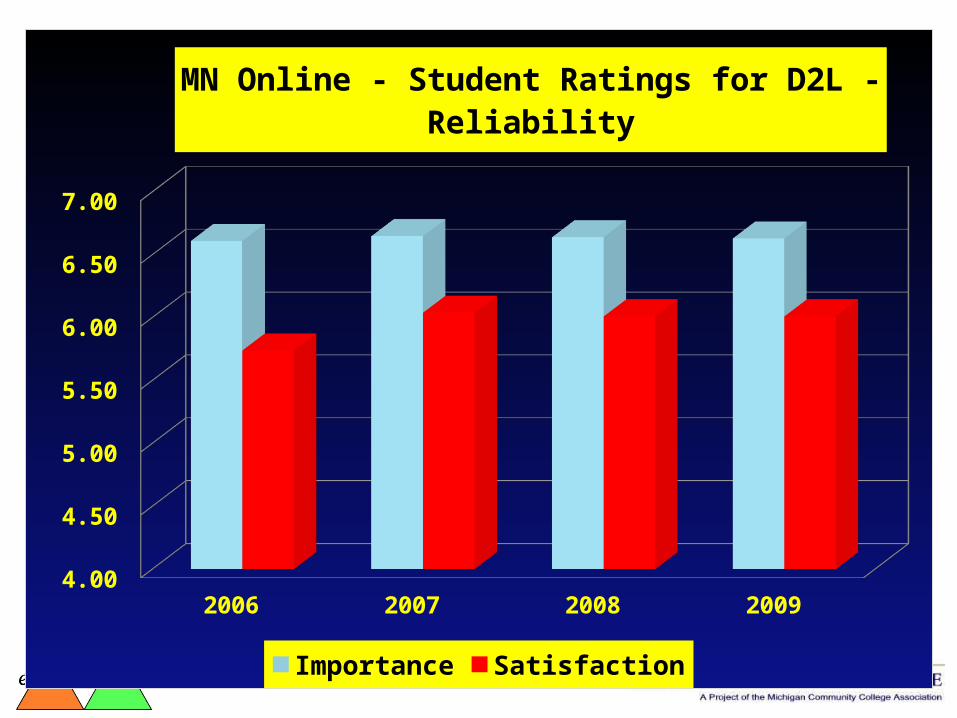
D2L Student Ratings
2006 2007 2008 2009 4.00
4.50
5.00
5.50
6.00
6.50
7.00
MN Online - Student Ratings for D2L - Reliability
Importance Satisfaction
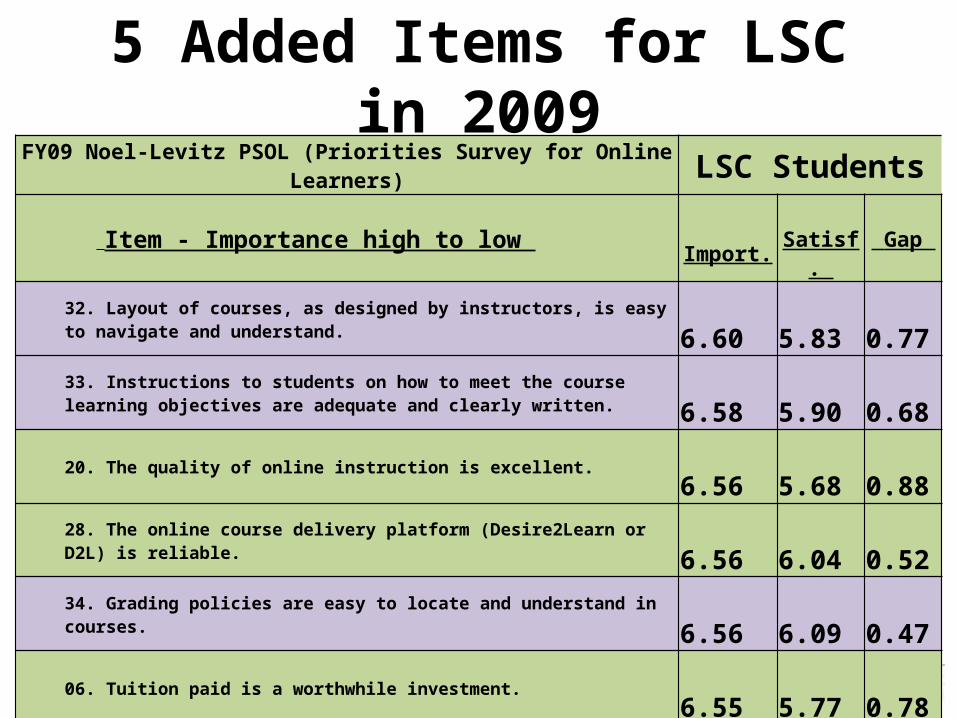
5 Added Items for LSC in 2009FY09 Noel-Levitz PSOL (Priorities Survey for Online Learners) LSC Students
Item - Importance high to low Import. Satisf. Gap 32. Layout of courses, as designed by instructors, is easy to navigate and understand. 6.60 5.83 0.77 33. Instructions to students on how to meet the course learning objectives are adequate and clearly written. 6.58 5.90 0.68 20. The quality of online instruction is excellent. 6.56 5.68 0.88 28. The online course delivery platform (Desire2Learn or D2L) is reliable. 6.56 6.04 0.52 34. Grading policies are easy to locate and understand in courses. 6.56 6.09 0.47
06. Tuition paid is a worthwhile investment. 6.55 5.77 0.78
18. Registration for online courses is convenient. 6.55 6.36 0.19 36. Clear standards are set in courses for instructor availability and response time. 6.55 5.99 0.56 31. Taking an online course allowed me to stay on track with my educational goals. 6.54 6.18 0.36 35. Instructional materials have sufficient depth in content to learn the subject. 6.54 5.91 0.63
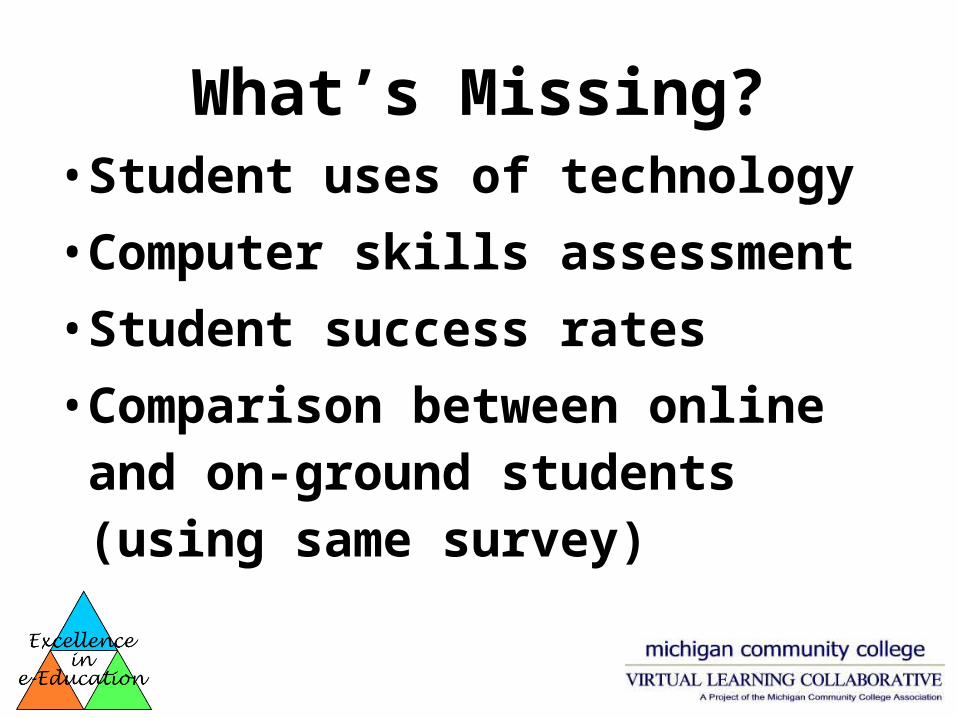
What’s Missing?• Student uses of technology• Computer skills assessment• Student success rates• Comparison between online and
on-ground students (using same survey)
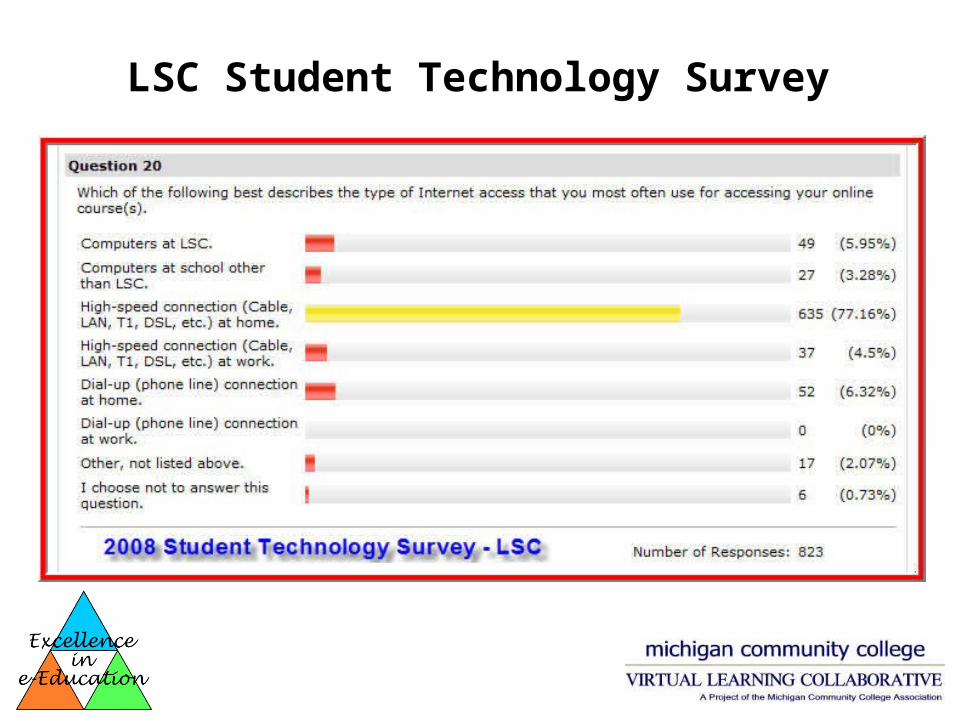
LSC Student Technology Survey
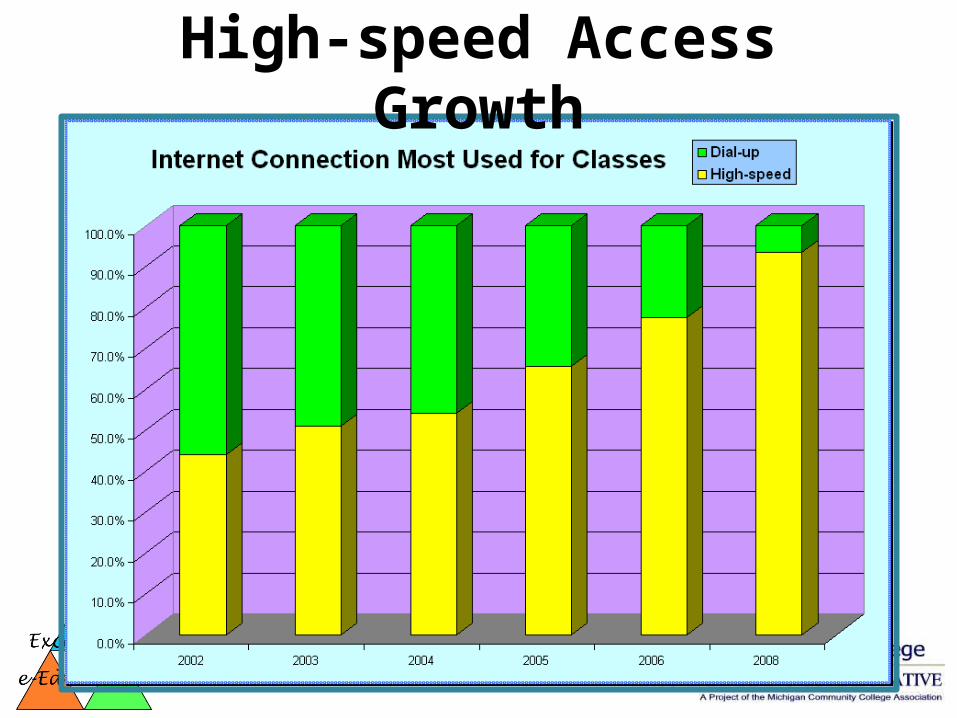
High-speed Access Growth
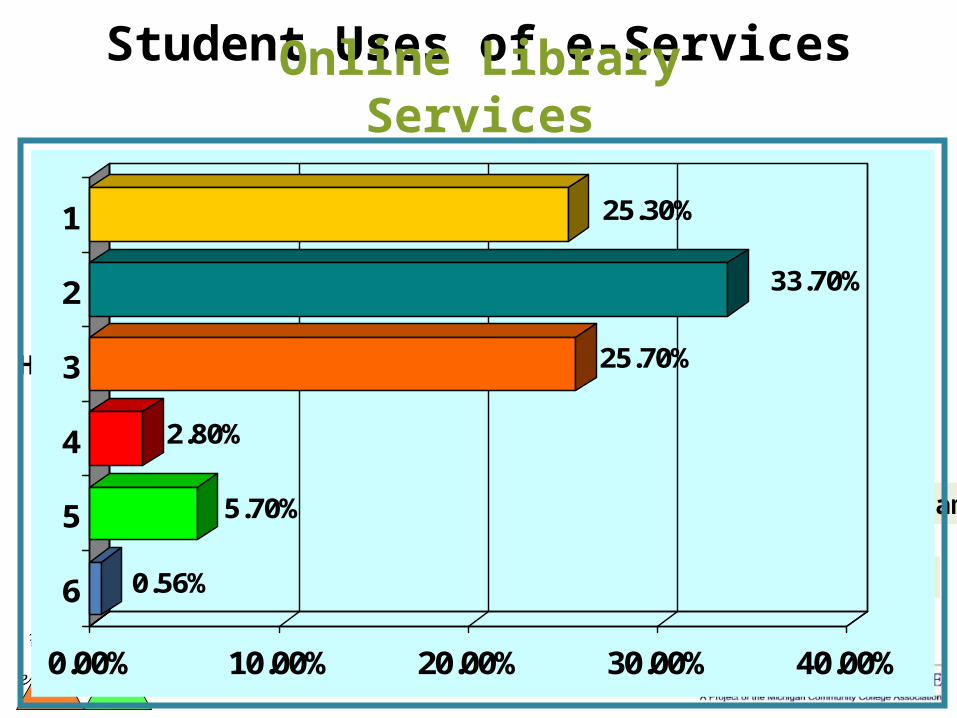
Student Uses of e-Services
0.56%
5.70%
2.80%
25.70%
33.70%
25.30%
0.00% 10.00% 20.00% 30.00% 40.00%
6
5
4
3
2
1 Never used it; didn't know about it.
Never used it; but was aware of it.
Have used it a little; will use again.
Have used it a lot; planning to continue the same.
Have used it a little; won’t use it again.
Have used it a lot; planning to reduce usage.
Online Library Services
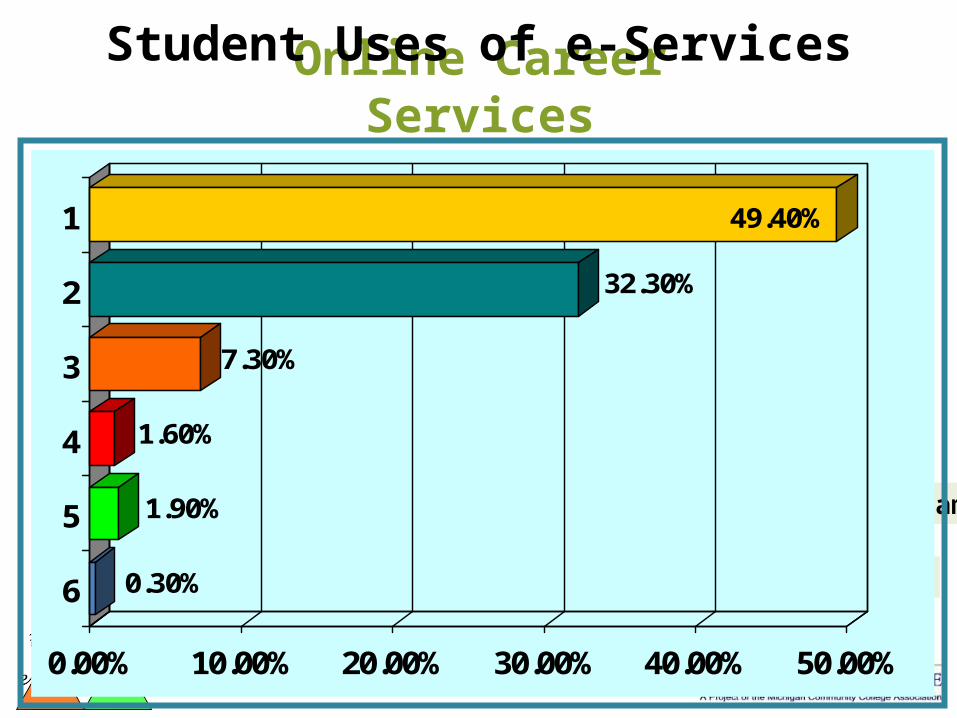
0.30%
1.90%
1.60%
7.30%
32.30%
49.40%
0.00% 10.00% 20.00% 30.00% 40.00% 50.00%
6
5
4
3
2
1 Never used it; didn't know about it.
Never used it; but was aware of it.
Have used it a lot; planning to continue the same.
Have used it a little; won’t use it again.
Have used it a lot; planning to reduce usage.
Have used it a little; will use it again.
Online Career ServicesStudent Uses of e-Services
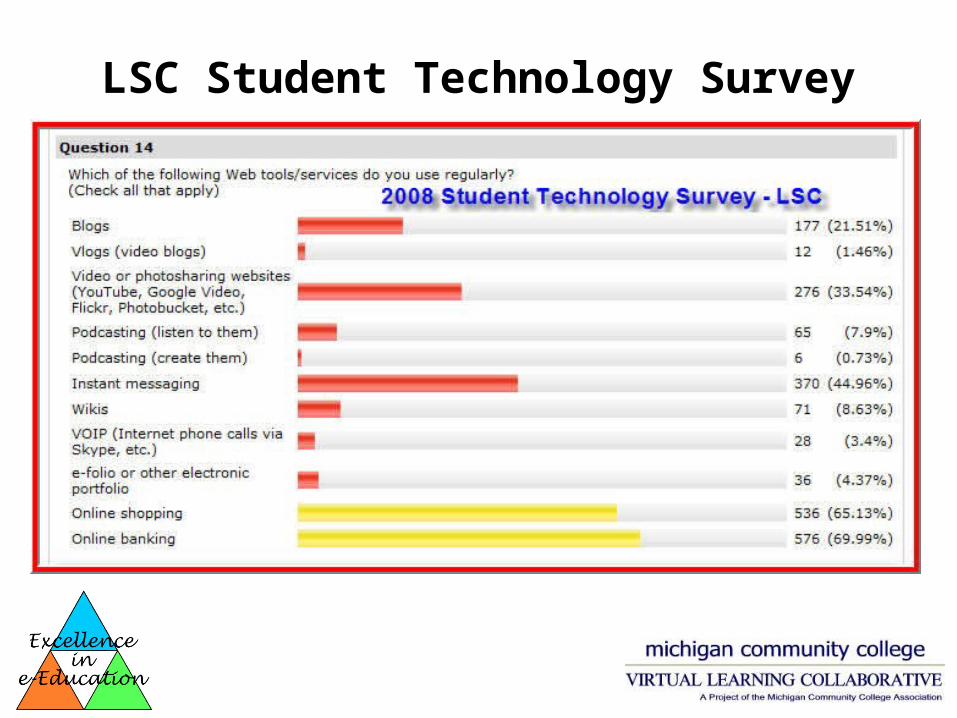
LSC Student Technology Survey
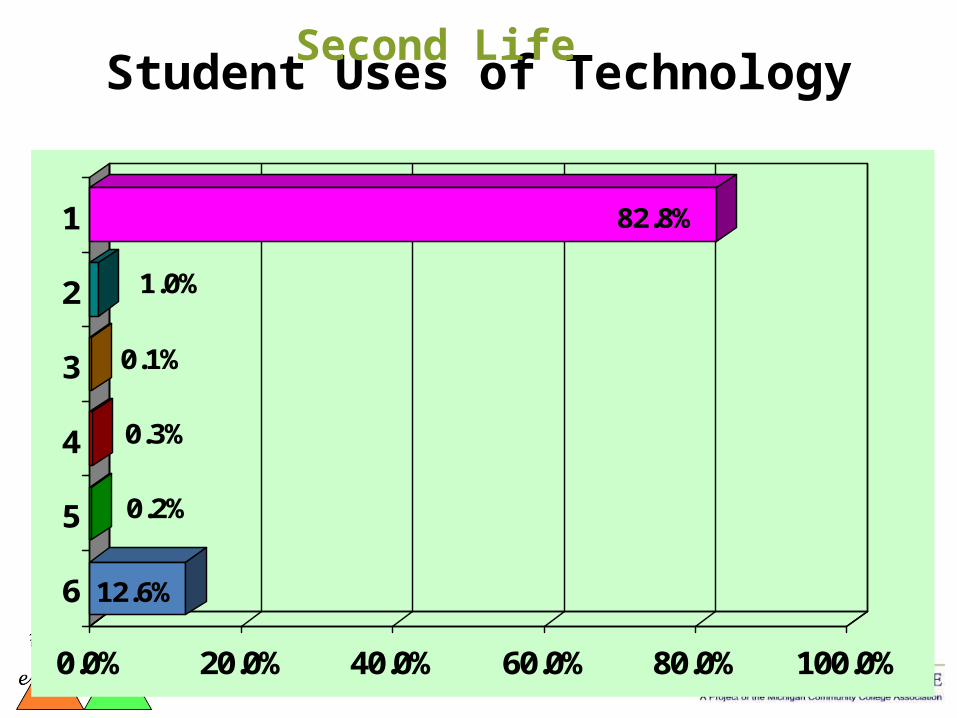
Student Uses of Technology
12.6%
0.2%
0.3%
0.1%
1.0%
82.8%
0.0% 20.0% 40.0% 60.0% 80.0% 100.0%
6
5
4
3
2
1 Do not use
Very frequently use
Frequently use
N/A
Second Life
Occasionally use
Rarely use
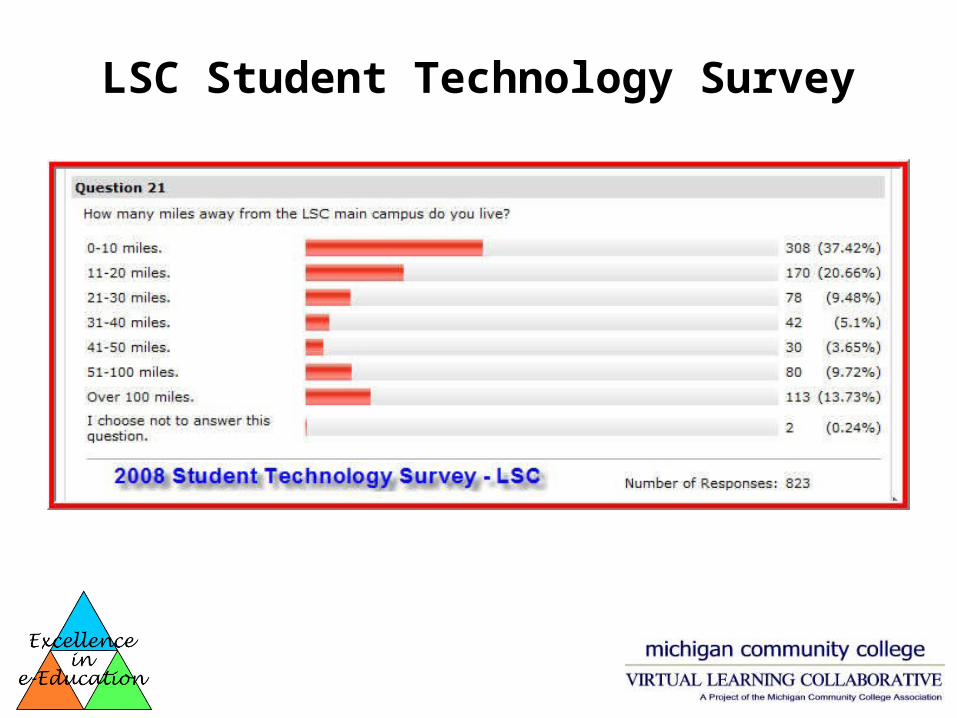
LSC Student Technology Survey
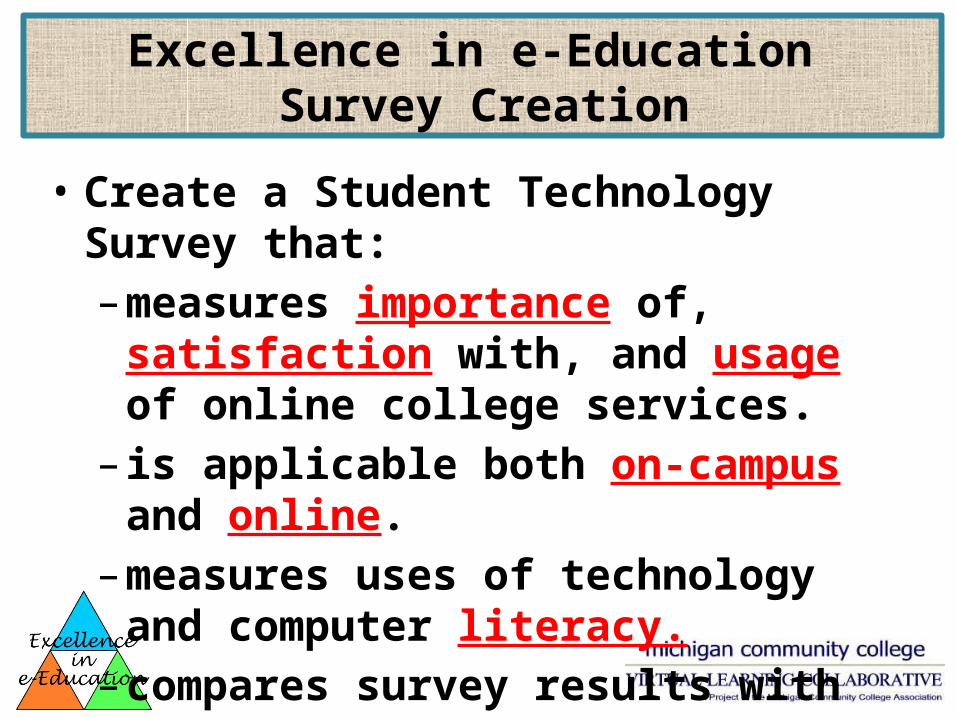
Excellence in e-Education Survey Creation
• Create a Student Technology Survey that:– measures importance of, satisfaction with,
and usage of online college services.– is applicable both on-campus and online.– measures uses of technology and
computer literacy.– compares survey results with student
success factors.
Discussion Time
Measuring Student Satisfaction with Online Learning