Embed Size (px)
Citation preview

ESSENTIALSESSENTIALS OF MARKETING RESEARCHOF MARKETING RESEARCHHair/Wolfinbarger/Ortinau/BushHair/Wolfinbarger/Ortinau/Bush

Understand the role of measurement in marketing research
Explain the four basic levels of scales Describe scale development and its
importance gathering primary data Discuss comparative and noncomparative
scales

Measurement is the process of assigning numbers or labels to objects, persons, states, or events in accordance with specific rules to represent quantities or qualities of attributes.
We do not measure specific objects, persons, etc., we measure attributes or features that define them.
Ex., What defines the person Brent Wren? What is a student’s level of education? How customer oriented is our company?
Overriding Goal: To provide a valid and reliable description or enumeration of the person, objects, issue, etc.

Why do scores on a measurement scale differ?◦ A true difference in the characteristic being
measured.◦ Short-term personal factors (e.g., moods, time
constraints)◦ Situational factors (e.g., surroundings)◦ Variations in method of administering survey.◦ Sampling of items included in the questionnaire.◦ Lack of clarity in the measurement instrument.◦ Mechanical or instrument factors causing
completion errors.

1. Define concepts to be measured2. Define attributes of the concepts3. Select scale of measurement (data type)4. Generate Items/Questions◦ Wording◦ Response format
1. Layout and design questionnaire2. Pretest and refine

Concept or Construct ◦ A generalized idea about a class of objects,
attributes, occurrences, or processes◦ Concrete – demographics, traffic patterns, purchase
quantity◦ Abstract – loyalty, personality, satisfaction, leadership
Attribute◦ A single characteristic or fundamental feature of an
object, person, situation, or issue◦ Often measure multiple attributes

1. Define concepts to be measured2. Define attributes of the concepts3. Select scale of measurement (data type)4. Generate Items/Questions◦ Wording◦ Response format
1. Layout and design questionnaire2. Pretest and refine
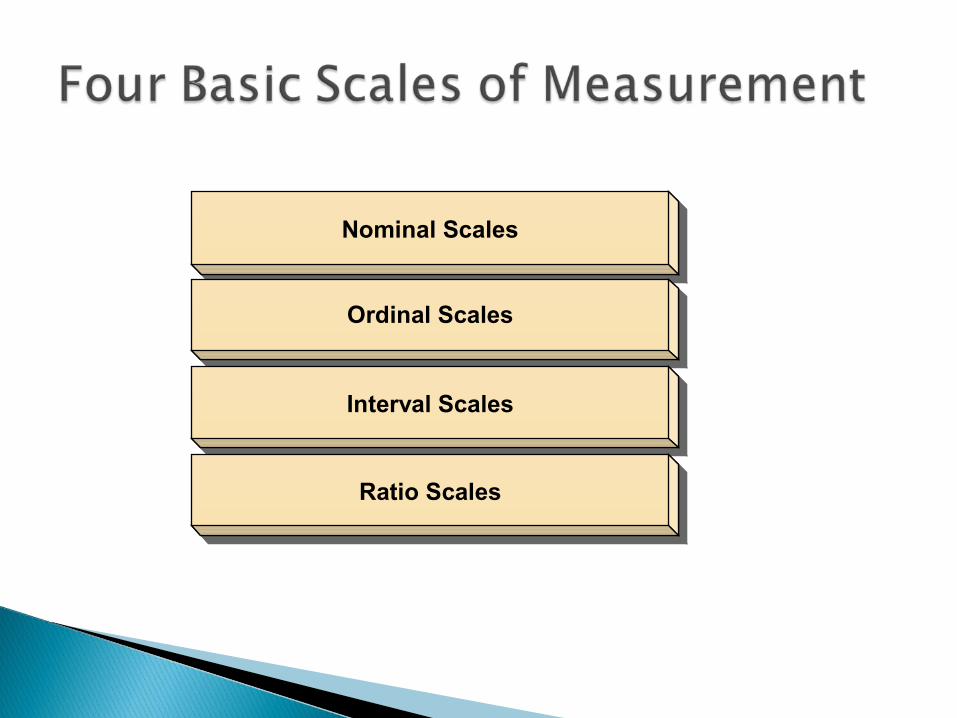
Nominal ScalesNominal Scales
Ordinal ScalesOrdinal Scales
Interval ScalesInterval Scales
Ratio ScalesRatio Scales

Nominal scales focus on only requiring arespondent to provide some type of
descriptor as the raw response
Nominal scales focus on only requiring arespondent to provide some type of
descriptor as the raw response
Example.
Please indicate your current martial status.
__Married __ Single __ Single, never married __ Widowed

Ordinal scales allow the respondent to express “relative magnitude” between the raw
responses to a question
Ordinal scales allow the respondent to express “relative magnitude” between the raw
responses to a question
Example.
Which one statement best describes your opinion of an Intel PC processor? __ Higher than AMD’s PC processor__ About the same as AMD’s PC processor __ Lower than AMD’s PC processor

Interval scales demonstrate the absolute differences between each scale point
Interval scales demonstrate the absolute differences between each scale point
Example.
How likely are you to recommend the Santa Fe Grill to a friend?
Definitely will not Definitely will
1 2 3 4 5 6 7

Ratio scales allow for the identification of absolute differences between each scale point,
and absolute comparisons between raw responses
Ratio scales allow for the identification of absolute differences between each scale point,
and absolute comparisons between raw responses
Example 1.
Please circle the number of children under 18 years of age currently living in your household.
0 1 2 3 4 5 6 7 (if more than 7, please specify ___.)

Understanding of the questions Discriminatory power of scale descriptors Balanced versus unbalanced scales Forced or nonforced choice scales Desired measure of central tendency and
dispersion

Central Tendency◦ Mode ◦ Median ◦ Mean
Dispersion◦ Frequency
distribution ◦ Range◦ Standard deviations

If a nominal scale is used, analysis of raw data can only be done using modes and frequency distributions
If ordinal scales are used, analysis of raw data can be done using medians and ranges (plus modes and frequency distributions)
If interval or ratio scales are used, analysis of raw data can be done through the use of sample means and estimated standard deviations as the sample statistic (plus the above)

1. Define concepts to be measured2. Define attributes of the concepts3. Select scale of measurement (data type)4. Generate Items/Questions◦ Wording◦ Response format
1. Layout and design questionnaire2. Pretest and refine

Items are basically questions Need to ensure that enough questions are
asked to generate information necessary to address research problems.
Likely will have a mix of question types and scales of measurement
Multi-item, Composite or Index Measures◦ A measurement scale containing multiple questions
addressing same construct or attribute
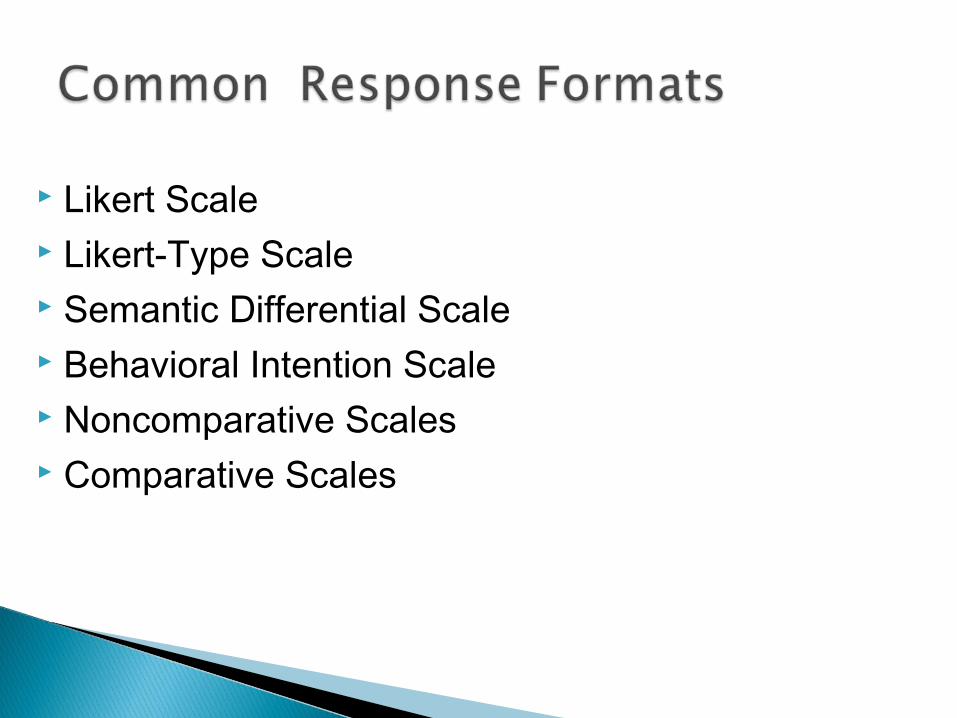
Likert Scale Likert-Type Scale Semantic Differential Scale Behavioral Intention Scale Noncomparative Scales Comparative Scales
A likert scale isan ordinal scale format that asks respondents
to indicate the extent to which they agree or disagree with a series of
mental or behavioral belief statements about a given object


A semantic differential scale isunique bipolar ordinal scale format that captures a person’s attitudes
and/or feelings about a given object


A behavioral intention scale isa special type of rating scale designed
to capture the likelihood that people will demonstrate some type of
predictable behavior intent toward purchasing an object or service
in a future time frame

Noncomparative Rating Scales◦ format that requires a judgment without reference to
another object, person, or concept Comparative Rating Scales◦ format that requires a judgment comparing one object,
person, or concept against another on the scale


1. Define concepts to be measured2. Define attributes of the concepts3. Select scale of measurement (data type)4. Generate Items/Questions◦ Wording◦ Response format
1. Layout and design questionnaire2. Pretest and refine

Major Issues◦ What should be included?
Comes from objectives, construct definitions, and associated attributes
◦ How should questions be phrased?◦ In what sequence should questions be arranged?◦ What layout will best serve the research objectives?

Open-ended vs. Closed-ended Simple dichotomous vs. Multi-choice◦ A place for every respondent but only one place
(Exhaustive and Mutually Exclusive)◦ Range of choices needs to be consistent with the
sample (ex. income categories for students vs. professionals)
How to handle “no opinion” or “not applicable” respondents?
Do you need odd or even number of choices?

Use simple language that is consistent with your population
Be as specific as possible Avoid leading and loaded questions Avoid double-barreled questions◦ Ex. How would you rate our company’s service,
selection of products, and prices? Avoid questions that are too difficult to answer

Always begin with simple, non-offensive questions and get more complex as you move along.◦ Funneling technique
Pay attention to whether certain questions are relevant for every respondent or only some◦ Use branching or filter questions appropriately
Give clear instructions for completing questionnaire
Use appropriate fonts and white space to avoid crowding
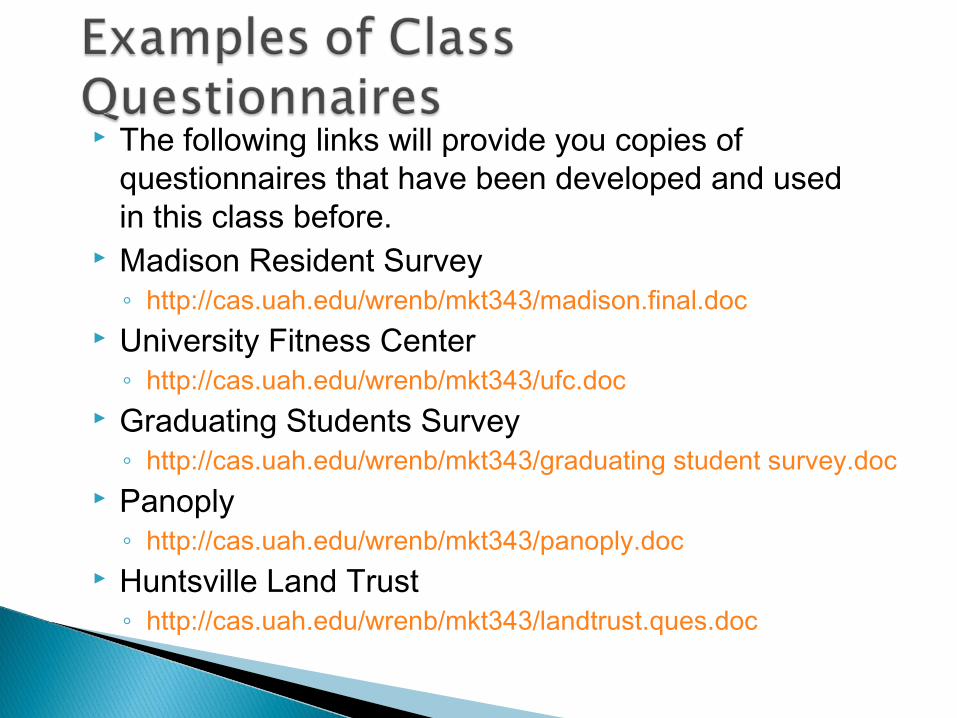
The following links will provide you copies of questionnaires that have been developed and used in this class before.
Madison Resident Survey◦ http://cas.uah.edu/wrenb/mkt343/madison.final.doc
University Fitness Center◦ http://cas.uah.edu/wrenb/mkt343/ufc.doc
Graduating Students Survey◦ http://cas.uah.edu/wrenb/mkt343/graduating student survey.doc
Panoply◦ http://cas.uah.edu/wrenb/mkt343/panoply.doc
Huntsville Land Trust◦ http://cas.uah.edu/wrenb/mkt343/landtrust.ques.doc