Embed Size (px)
Citation preview
Monitoring Policy and Sector National Reform to
Accelerate and Sustain Access to Improved Rural Sanitation
April 2013 • Eddy Perez
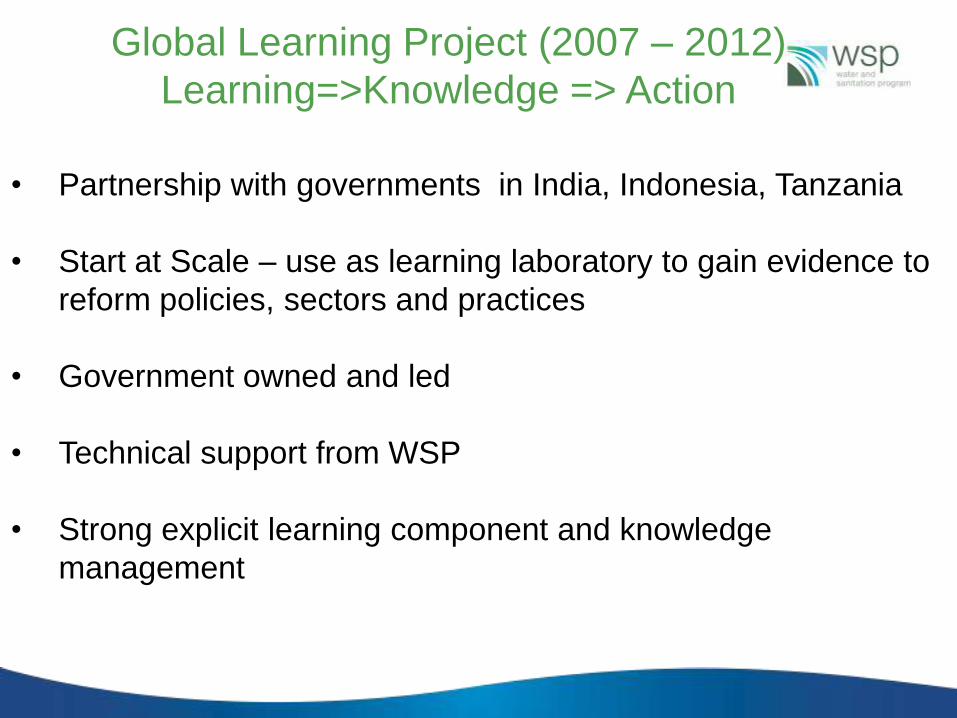
• Partnership with governments in India, Indonesia, Tanzania
• Start at Scale – use as learning laboratory to gain evidence to
reform policies, sectors and practices
• Government owned and led
• Technical support from WSP
• Strong explicit learning component and knowledge
management
Global Learning Project (2007 – 2012)
Learning=>Knowledge => Action
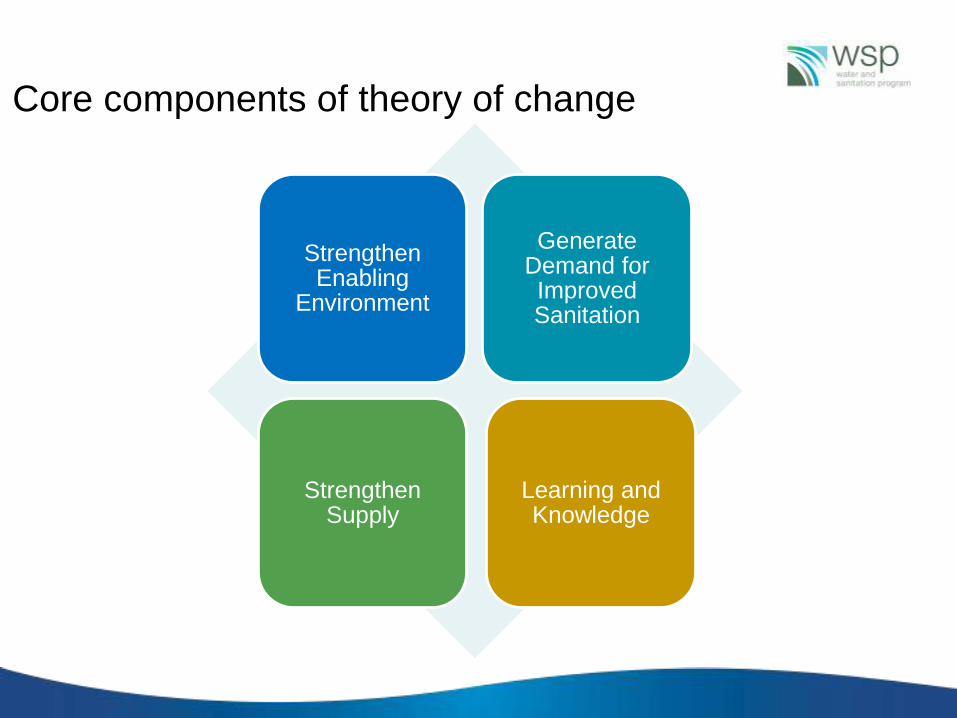
Strengthen Enabling
Environment
Generate Demand for Improved Sanitation
Strengthen Supply
Learning and Knowledge
Core components of theory of change
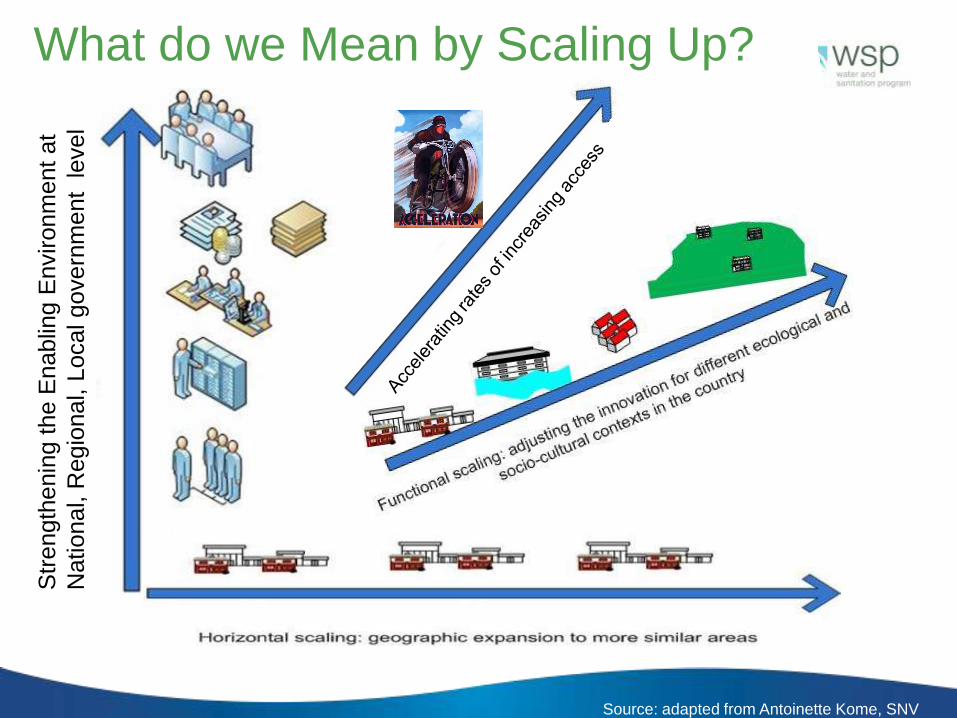
Str
ength
enin
g t
he E
nablin
g E
nvironm
ent
at
National, R
egio
nal, L
ocal govern
ment
level
What do we Mean by Scaling Up?
Source: adapted from Antoinette Kome, SNV
Monitoring the Development
of an Enabling Environment for a
Government Led Scaling Up Rural
Sanitation Programs in
India, Indonesia and Tanzania
This Presentation will describe and discuss:
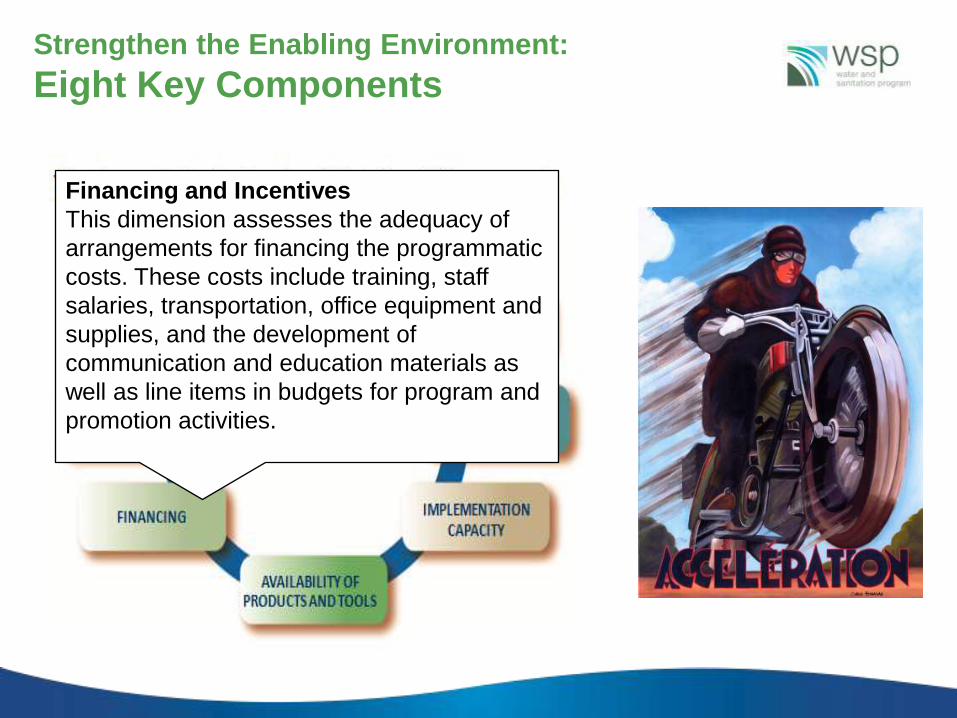
Strengthen the Enabling Environment:
Eight Key Components
Financing and Incentives
This dimension assesses the adequacy of
arrangements for financing the programmatic
costs. These costs include training, staff
salaries, transportation, office equipment and
supplies, and the development of
communication and education materials as
well as line items in budgets for program and
promotion activities.
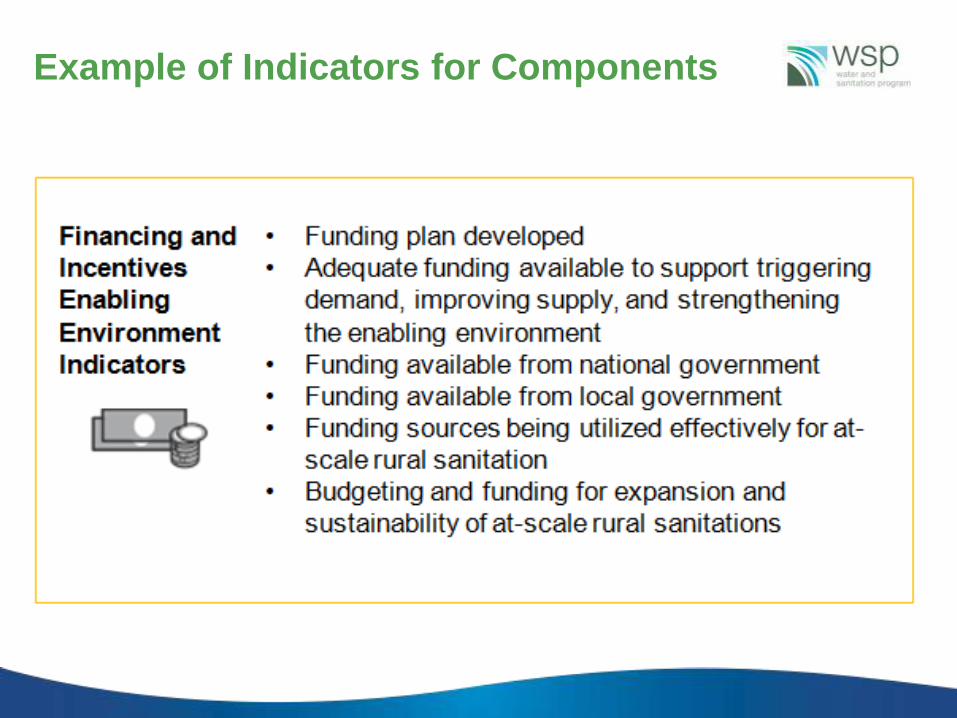
Example of Indicators for Components
Baseline assessment in 2007
TA action plan to address
weaknesses based on assessment
Large Scale pilot as learning
laboratory
Endline assessment in 2010
Monitoring and strengthening
enabling environment continuing
>2010
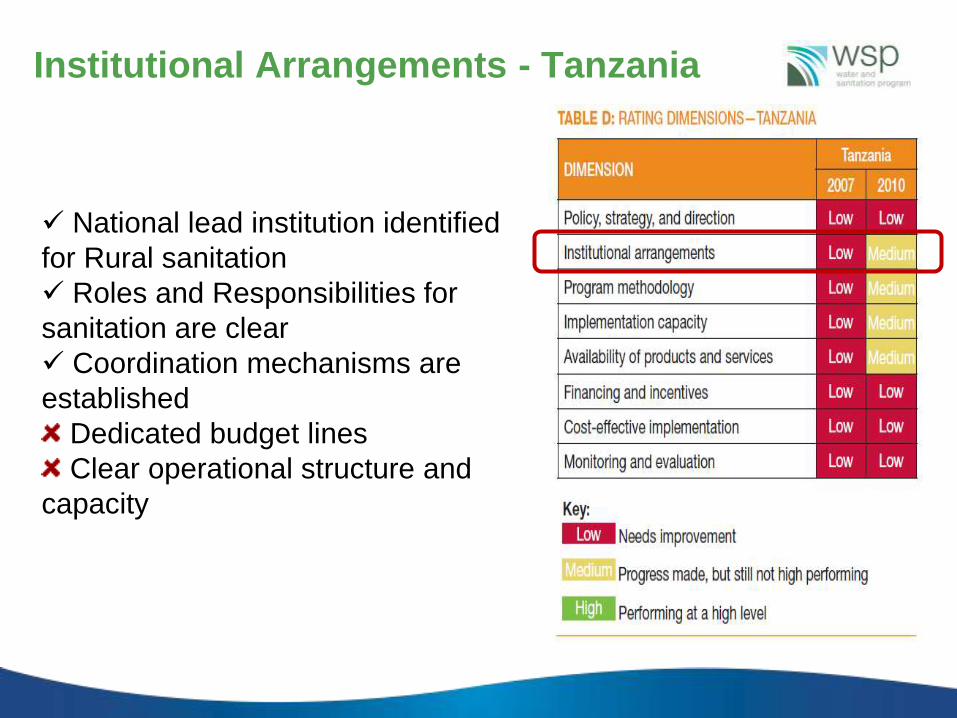
Institutional Arrangements - Tanzania
National lead institution identified
for Rural sanitation
Roles and Responsibilities for
sanitation are clear
Coordination mechanisms are
established
Dedicated budget lines
Clear operational structure and
capacity
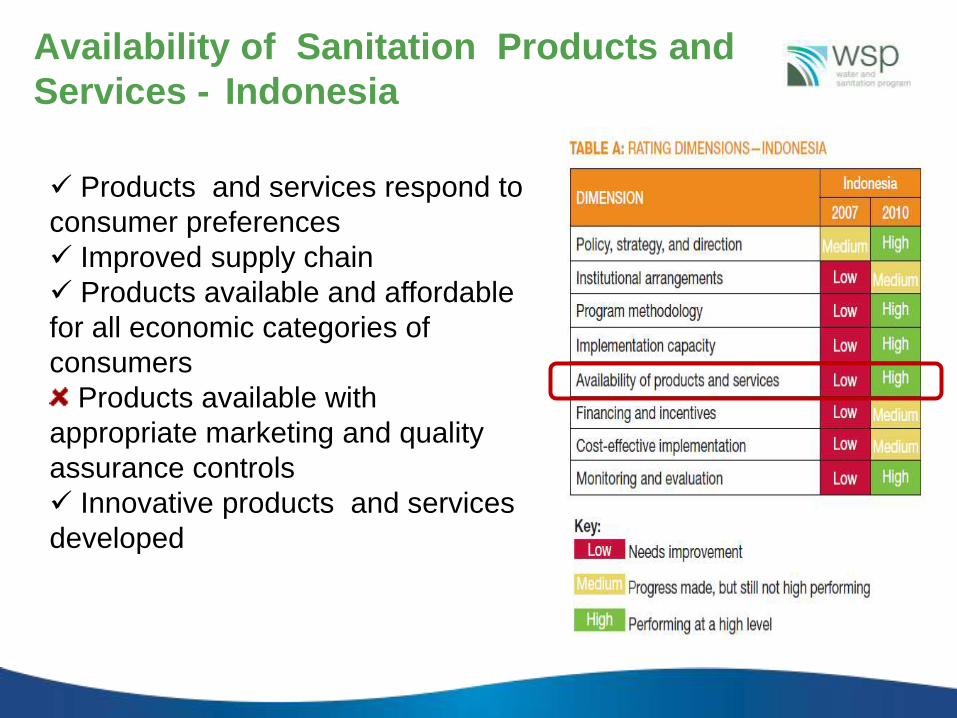
Availability of Sanitation Products and
Services - Indonesia
Products and services respond to
consumer preferences
Improved supply chain
Products available and affordable
for all economic categories of
consumers
Products available with
appropriate marketing and quality
assurance controls
Innovative products and services
developed
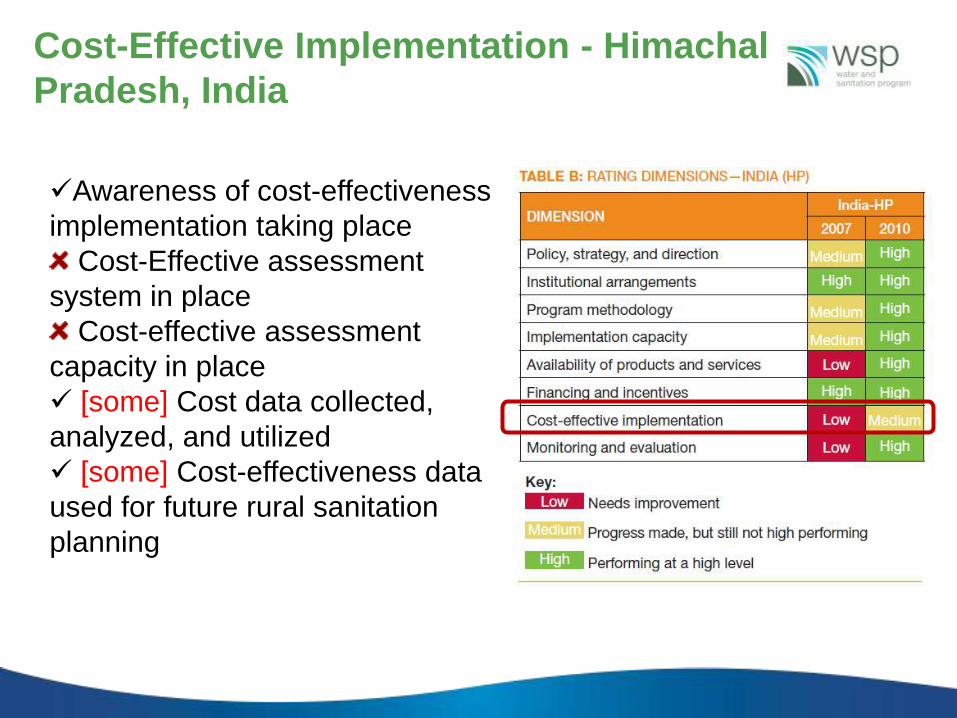
Cost-Effective Implementation - Himachal
Pradesh, India
Awareness of cost-effectiveness
implementation taking place
Cost-Effective assessment
system in place
Cost-effective assessment
capacity in place
[some] Cost data collected,
analyzed, and utilized
[some] Cost-effectiveness data
used for future rural sanitation
planning
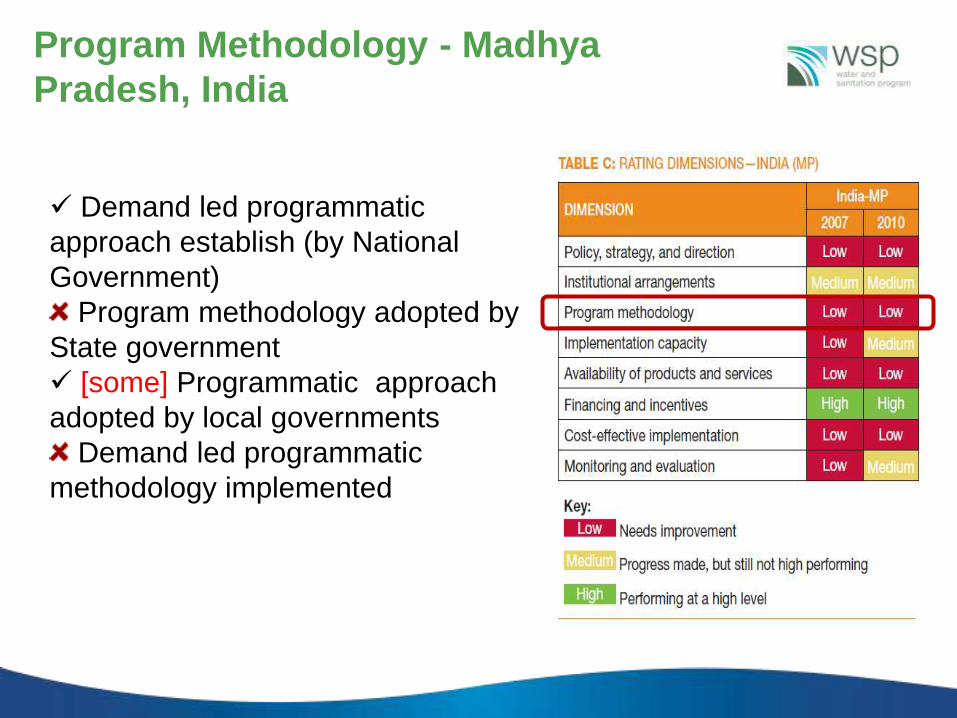
Program Methodology - Madhya
Pradesh, India
Demand led programmatic
approach establish (by National
Government)
Program methodology adopted by
State government
[some] Programmatic approach
adopted by local governments
Demand led programmatic
methodology implemented
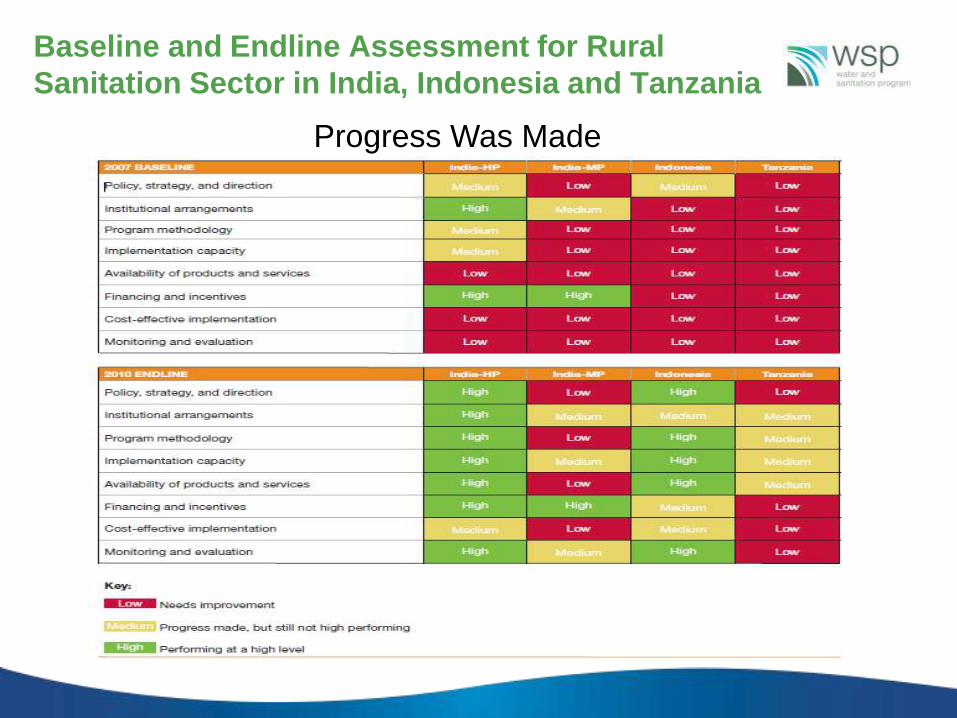
Baseline and Endline Assessment for Rural
Sanitation Sector in India, Indonesia and Tanzania
Progress Was Made
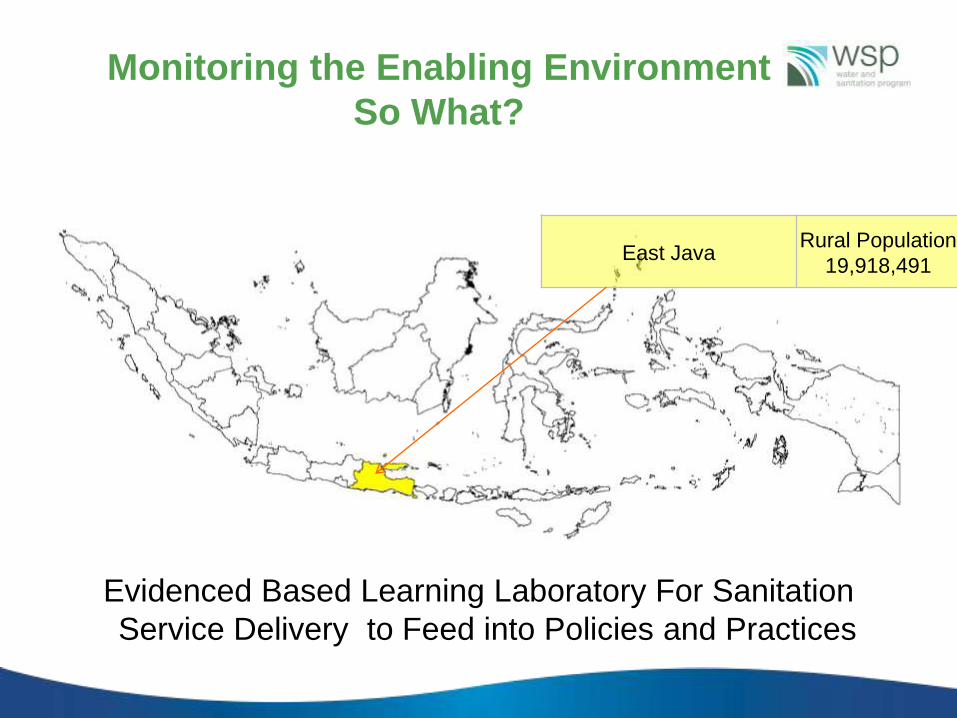
Monitoring the Enabling Environment
So What?
East JavaRural Population
19,918,491
Evidenced Based Learning Laboratory For Sanitation
Service Delivery to Feed into Policies and Practices
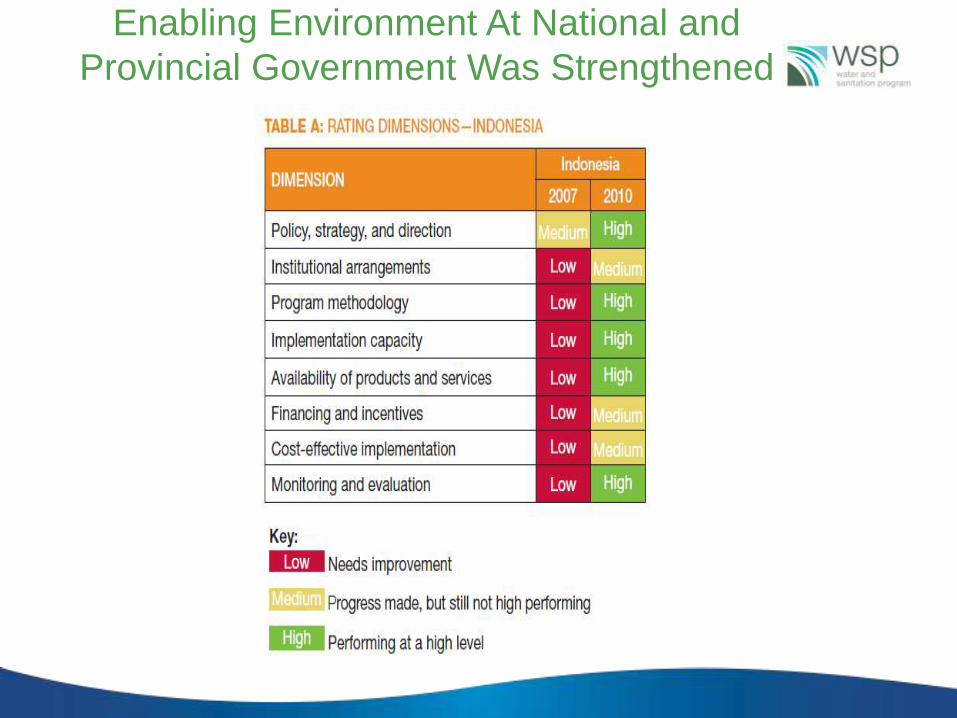
Enabling Environment At National and
Provincial Government Was Strengthened
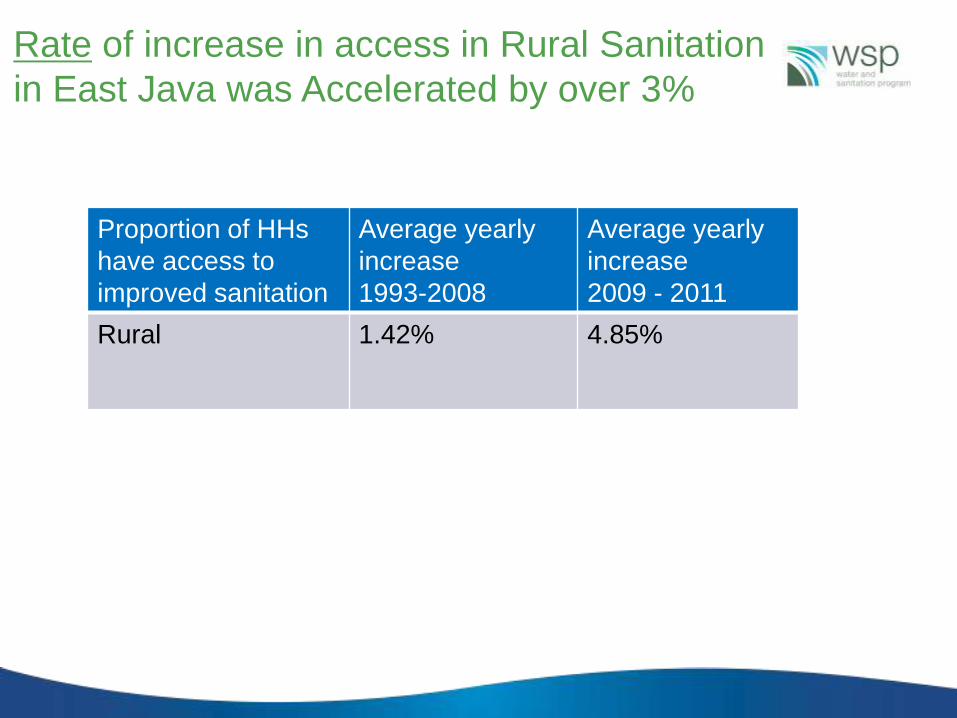
Rate of increase in access in Rural Sanitation
in East Java was Accelerated by over 3%
Proportion of HHs
have access to
improved sanitation
Average yearly
increase
1993-2008
Average yearly
increase
2009 - 2011
Rural 1.42% 4.85%
0%
10%
20%
30%
40%
50%
60%
70%
80%
90%
100%
1985 1990 1995 2000 2005 2010 2015 2020 2025 2030 2035 2040 2045 2050 2055 2060 2065 2070 2075 2080 2085
% o
f H
ou
se
ho
lds
wit
h Im
pro
ve
d S
an
itati
on
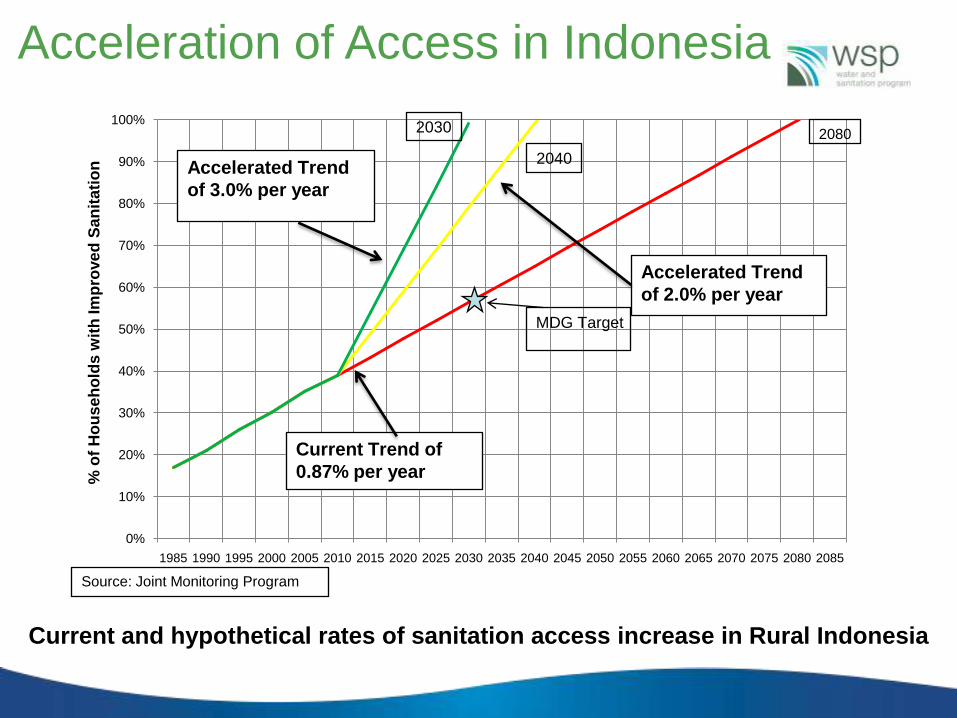
Current Trend of
0.87% per year
Accelerated Trend
of 3.0% per year
Accelerated Trend
of 2.0% per year
Source: Joint Monitoring Program
20802030
MDG Target
2040
Current and hypothetical rates of sanitation access increase in Rural Indonesia
Acceleration of Access in Indonesia
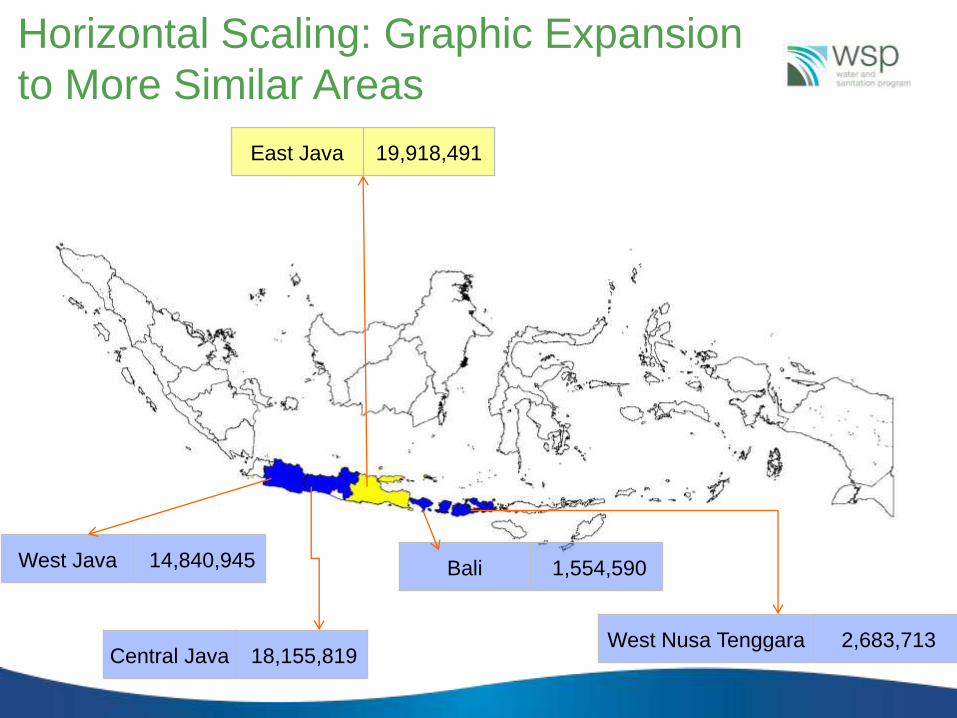
Horizontal Scaling: Graphic Expansion
to More Similar Areas
Central Java 18,155,819
West Java 14,840,945
West Nusa Tenggara 2,683,713
Bali 1,554,590
East Java 19,918,491
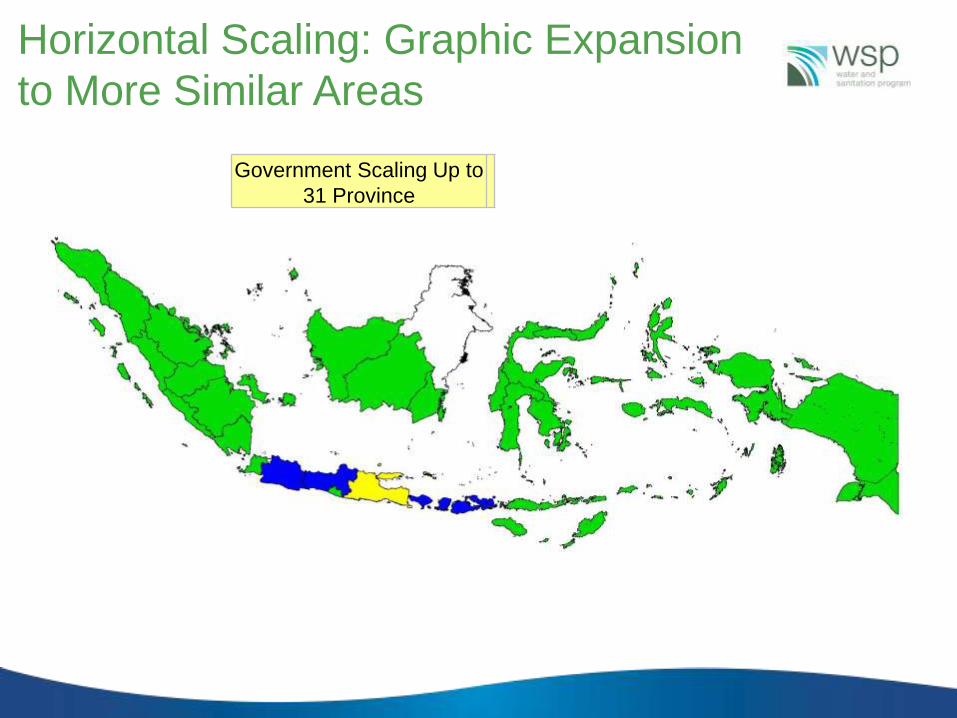
Government Scaling Up to
31 Province
Horizontal Scaling: Graphic Expansion
to More Similar Areas
Selected Learnings
Countries/States with the strongest enabling environment at
endline made the most progress in terms of increasing access to
improved sanitation and stopping open defecation.
Real time monitoring of the enabling environment helped identify
bottlenecks that needed be addressed at the national policy and
sector level – resulting in strengthening the enabling environment
Key Take-Away Messages
A solid methodology for carrying out a comprehensive assessment
and ongoing monitoring of the enabling environment exists and is
now being used in multiple countries
A strong enabling environment is key for a sustainable sanitation
program that will enable governments to accelerate access to
improved sanitation.
For more information:
wsp.org
@WSPworldbank
This presentation was based on the WSP
Working Paper, Policy and Sector Reform
to Accelerate Access to Improved Rural
Sanitation.
Printed copies of the report are available today at
the publications table, and at the World
Bank/WSP Exhibition Booth (BO1:18).
Download the PDF at wsp.org