Embed Size (px)
Citation preview

Kohei Arai and Achmad Basuki
Geoinformatica - An International Journal (GIIJ), Volume (1): Issue (1) 1
New Approach of Prediction of Sidoarjo Hot Mudflow Disastered Area Based on Probabilistic Cellular Automata
Kohei Arai [email protected] Department of Information Science Faculty of Science and Engineering, Saga University
Achmad Basuki [email protected] Department of Information Science Faculty of Science and Engineering, Saga University Electronic Engineering Polytechnic Institute of Surabaya
Abstract
A new approach of prediction of Sidoarjo hot mudflow disaster area using cellular automata with probabilistic adjustment for minimizing prediction errors is proposed. Sidoarjo hot mudflow has some characteristics such as occurring in the urban area, huge-mud plumes, high-viscosity and surface temperature changes, so that it needs combined approaches of slow debris flow, and material changes caused by viscous fluid and thermal changes. Some deterministic approaches can not show the high-state changes. This paper presents a new approach of cellular automata using probabilistic state changing to simulate hot mudflow spreading. The model was calibrated with the time series of topological maps. The experimental results show new inundated areas that are identified as high-risk areas where are covered with mud. Furthermore, the proposed probabilistic cellular automata approach works well for prediction of hot mudflow spreading areas much accurate than the existing conventional methods. Keywords: Cellular Automata, LUSI, Hot Mudflow, Prediction, Minimization Difference, Probabilistic State Changing.
1. INTRODUCTION
The occurrence of hot mudflow at Sidoarjo (East Java, Indonesia) has attracted many researchers from around the world to study its cause, environment effects and the flow behavior. About 150,000m3/day of hot mud have been coming up from several unexpected location for four years now [1][2]. The uncontrolled nature of this hot-mud phenomenon may affect the dense highly populated area with several critical public infrastructures, such as railway, highway, schools and hospital as shown in Figure 1. It is necessary to estimate the new inundated area around the disaster area due to minimize disaster damage. To estimate the new inundated area, several models for simulations have been proposed. For example, Argentini [3] proposed fluid a flow model, Vicari [4] proposed a lava flow model, and Ambrossio [5] and Yuan [6] proposed a soil-erosion model using two-dimensional CA. However, those models lack dynamic-moving parameters, which is necessary to predict the new inundated location of hot mudflow. With this parameter, it is difficult to develop mathematical equation of mass transport model using two-dimensional CA because there are many considered phenomena such as infiltration, thermal surface changing and absorption [7]. When simulations

Kohei Arai and Achmad Basuki
Geoinformatica - An International Journal (GIIJ), Volume (1): Issue (1) 2
are based on differential equation methods for solution, predicting the fluid flow on disaster spreading may meet serious difficulties. Avolio [8] proposed the minimization differences approach on CA model to simulate lava flow. This approach has dynamical state changing. The key-point of this approach is easy to develop. The update state algorithm can be developed by ordinary rules for all lattice condition. This approach show appreciable result to predict lava flow area, but it is not for water flow. Therefore, combination of water flow and lava flow need some unknown parameters.
FIGURE 1. LUSI mud Eruption at Sidoarjo, Indonesia (CRISP & Google Map).
The mud characteristic is similar with the lava characteristic, but it contains 70% water as high viscous fluid. Because the minimization approach is deterministic approach for reach equilibrium state by average, this condition makes the minimization approach is not powerful to simulate hot mudflow on LUSI mud eruption disaster, because some possibility mass transports change every time. A new approach of cellular automata with probability state adjustment is proposed to simulate hot mudflow with high dynamic mass transports [9]. In this approach, mass transports depend on not only landslide, mud volume and viscosity but also probability to material changing as a function of material mixing ratio and surface thermal changing. Simulation results were obtained by the landscape map using ASTER DEM, and initial parameters of mud flow such as mud blow volume, viscosity and some probability function of material changing. This paper shows some simulation result on map view and percentage of predicting performances. We also show the comparison of predicting on inundated area and direction with the other previous approach.
2. CELLULAR AUTOMATA APPROACH
CA approach is a discrete dynamical system to explain a complex system such as fluid dynamic, whose evolution can be described in terms of local interactions [10]. The use of cellular automata for the representation of the evolution of a phenomenon, natural or not, presents two benefits respect a possible analytical description [3]. CA model consist of an array of cells, and each cell contain a limited range of values that are called cell’s state. The cell’s state is updated in discrete time step according to set of rules. These rules depend on the state of the cell or its neighbors in

Kohei Arai and Achmad Basuki
Geoinformatica - An International Journal (GIIJ), Volume (1): Issue (1) 3
current time steps [11]. Cellular Automata (CA) is an alternative approach to standard differential equation method in modeling complex phenomenon [4]. The use of CA for the representation of the evolution of a phenomenon, natural or not, presents two benefits respect as possible analytical description [3]:
• the facility of a computational implementation, • the possibility of avoiding the formulation of a sophisticated mathematical model and/or the
resolution of complicated differential equations, if they have been already found.
FIGURE 2. CA approach for water flow
Some CA approaches were used to simulate complex fluid dynamic with some obstacle and fluid charateristic such as water flow [3] and lava flow [4][8]. Argentini showed the simple CA approach to simulate water flow that mass of fluid was assumed by discrete state as shown in figure 2. Vicari showed more extend CA approach using Newtonian fluid dynamic to simulate lava flow as viscous fluid. Some differential equation was used of this approach, and it made some difficulties to develop new phenomenon of fluid dynamic such as absorption. Avolio introduced a CA approach to simulate viscous fluid is the minimization difference approach [8]. It is one alternative approach for solve the complex fluid dynamic without sophisticated mathematical formulation. Another implementation of this method, D’Ambrossio used it to simulate soil erosion by water [5]. This approach obtains the lava flow spreading with many parameters such as viscosity and surface thermal changing that are similar with hot mudflow in this plan. This approach is powerful to simulate fluid flow. The minimization difference approach has the following instruction to update states: (a) A is the set of cell not eliminated. Its initial value is set to the number of its neighbors. (b) The average height is found for the set of A of non-eliminated cells:
1+
+
=
∑∈
A
Ai
ic
n
hh
m
Where: hc is height of the center cell. hi is height of the non-eliminated neighbor cells. nA is number of non-eliminated neighbor cells.
(c) The cells with height larger than average height are eliminated from A. (d) Go to step (b) until no cell is to be eliminated. (e) The flows, which minimize the height differences locally, are such that the new height of the
non-eliminated cell is the value of the average height. Figure 3 shows an example of two-dimensional CA based on minimization of difference. In this figure, the final result is flat on average. When the previous state we have 10 elements of solid material and 7 elements of fluid material, the final state we have 9 elements of solid material. This approach does not describe the solid or fluid material on the mass transport, although it shows sediment erosion.

Kohei Arai and Achmad Basuki
Geoinformatica - An International Journal (GIIJ), Volume (1): Issue (1) 4
FIGURE 3. Example of minimization of differences in a two dimensional CA.
3. PROPOSED METHODS The minimization difference approach does not show the mass transport creates direct equilibrium states as water or low viscous fluid. For example, the characteristic of mass transport does not change when the unknown variables add to the system such as human built structures. For this purpose, we use the probability of moving on the neighbor depend on the structure of the neighbor cells such as mud height, static soil height and dynamic soil height. Static soil is the ground that can not flow, and dynamic soil is the soil on the surface of soil that have the possibility to change because erosion. Because of that reason, in this proposed method, we use three variables on each cell that are static soil, dynamic soil and mud. The height of mud is written by sij. The height of dynamic soil is written by uij. The height of static soil is written by gij. Probability of changing from dynamic soil to mud is pm that describe the differences of dynamic soil in this state. Probability of changing from mud to soil is pvis that depends on the viscosity value. Figure 4 shows state variables on this simulation and some probability value for material changing caused by viscous flow.
FIGURE 4. Three state variables
The update rule in this approach is comparable with the minimization rules, but the flow is not deterministic as minimization rules. We use probability values adjustment pm and pvis to derive some mass from the center cell to its neighbor cells. To improve the prediction results suggest controlling of these probability values. Our proposed approach based on minimization method has the following instruction to update states and an example of our approach is shown in figure 5: (a) A is the set of cell not eliminated. Its initial value is set to the number of its neighbors. Each
cell on position (i,j) has two components such as soil and mud. The height of them are gij and sij. Total height of this cell is: hij = gij + sij. There is dynamic soil uij, but it is the small portion of soil and we adjust on normal distribution of pm.
(b) The average height is found for the set of A of non-eliminated cells:
( )
1
.
+
++
=
∑∈
A
Ai
cmic
n
gphh
m
Where:

Kohei Arai and Achmad Basuki
Geoinformatica - An International Journal (GIIJ), Volume (1): Issue (1) 5
hc is height of the center cell. hi is height of the non-eliminated neighbor cells. nA is number of non-eliminated neighbor cells.
(c) The cells with height larger than average height are eliminated from A. (d) Go to step (b) until no cell is to be eliminated. (e) The flows, which minimize the height differences locally, are such that the new height of the
non-eliminated cell changes with difference of fluid material mass transport soil and mud are
△hg and △hs. In the center cell:
ijvisg gpmh ).1( −−=∆
)1).(.( mijvisij
cs pgpsh −+=∆
mijvisij pgpsd )..( +=
where d is moving material. In the neighbors:
d
m
hmsh
ij
ijns
−+=∆
FIGURE 5. Proposed approach in a two dimensional CA.
4. MODEL SPECIFICATION The simulation have purpose to know the inundated area in the future. For this purpose, we use some map data on February 2008, May 2008 and August 2008 as shown in figure 6. We use ASTER DEM and IKONOS data for landscape prediction. We compare the simulation result on one month step and compare it with the real data. The simulation start using map data on February 2008 as initial map, and predict mudflow inundated area on May 2008 as the short-period prediction and August 2008 the long-period prediction.
FIGURE 6. Some image maps from IKONOS [12] on February 2008 (left), May 2008 (center) and August 2008 (right).

Kohei Arai and Achmad Basuki
Geoinformatica - An International Journal (GIIJ), Volume (1): Issue (1) 6
We use ASTER/DEM map that has resolution 30m×30m. Every image data has image size approximate 3.705km × 4.036km. When the resolution image is 400×400 pixels, pixel size is 9.2625m×10.09m. It needs to quantize the location/point that contains mud or not for this simulation. The other data, mud contains 70% water, high viscous and mud blows 100,000-150,000m3 per day [13]. We adjust volume of blowing, water percentage and two probabilities pm and pvis to simulate mudflow. This simulation concern to know the location will inundate in the future.
5. SIMULATION RESULT On this simulation, we investigate some lattice size to show mudflow spreading characteristic. For the formulation, we know the differences of this approach and Avolio’s approach is on the equilibrium state. The Avolio’s approach will require all non-eliminated cells will have the same height, but it depends on probability value and obtain the final state has a normal distribution height different in all non-eliminated cells. Comparison With Real Data We use three maps to investigate this simulation; real map in May 2008 as target map, prediction map for May 2008, and overlay map between real map and prediction map. Real-mud area is in red colored area. Simulation result mud area is in blue colored area. Intersection of real map and simulation results area is in pink colored area. The simulation result shows same location and direction with real data on May 2008, but there is some different area in detail that shows in percentage of intersection new predicted area about 67.78%, this value only for new area and initial area are not including to determine intersection area as shown in figure 5. We use 30m�30m ASTER/DEM imagery data that can not show some detail map components such as small building. It is still approximate of detail landscape although we had quantified this map using the height data on some points. Resolution influence will show in other sub-chapter of this paper.
FIGURE 7. Real map on May 2008 (left), simulation result (middle) and overlay map (right)
Figure 8 shows the intersection for new inundated area. The percentage of intersection area is the comparison between the numbers of pixels of pink colored area and all new colored area. Cellular Automata approach using probabilistic adjustment on Minimization Differences approach obtains correct location and direction with real data for short-period prediction. For medium period prediction, we check this approach to predict new inundated area on August 2008. Figure 9 shows the real map on August 2008 on red colored area, simulation result on blue colored area and comparison the real map and simulation result with intersection area on pink colored area. Although in mainly result prediction area show same location and direction with real data, this result is better result that has intersection area 56.54% than previous method using Fluid Dynamic Cellular Automata approach and Vicari’s approach that have intersection area 36.44% and 36.29% [14].

Kohei Arai and Achmad Basuki
Geoinformatica - An International Journal (GIIJ), Volume (1): Issue (1) 7
FIGURE 8. New inundated area and overlay between real data and simulation result
FIGURE 9. Real map on August 2008 (left), simulation result (middle) and overlay map (right)
Lattice Size Analysis Lattice size analysis show how simulation runs in some resolutions. We use lattice size from 200×200 pixels as lowest resolution to 700×700 pixels as highest resolution. Because CA approach is a microscopic approach to simulate hot mudflow disaster, this approach needs high resolution. Figure 10 shows increasing resolution causes increasing prediction performance when prediction performance is assumed by percentage of intersection area between simulation result and real data. Neighbor Size Analysis One of parameter of Cellular Automata approach is neighborhood, and neighbor size is an important variable to define neighborhood [15]. Because our model is 2D CA model, there are three neighbors size on our model: 3×3 Von Newmann, 3×3 Moore and 5×5 Moore. Figure 11 shows three model of neighborhood.

Kohei Arai and Achmad Basuki
Geoinformatica - An International Journal (GIIJ), Volume (1): Issue (1) 8
40.00
45.00
50.00
55.00
60.00
65.00
70.00
75.00
80.00
200 250 300 350 400 450 500 550 600 650 700
Lattice Size (Resolution)
Performance
(%)
Intersection Area
Intersection Pattern
FIGURE 10. Performance of prediction vs lattice size.
FIGURE 11. Neighborhood model: 3×3 Von Newmann (left), 3×3 Moore (middle) and 5×5 Moore (right)
Figure 12 shows comparison of performance result for each neighbor size, 3×3 and 5×5. Number of neighbor is one important parameter in our model. Increasing number of neighbor causes increasing performance of prediction. Although we use same approach, Moore neighborhood has good performance, but Von Newmann neighborhood has poor performance to predict inundated area.
40
45
50
55
60
65
70
75
80
85
90
200 300 400 500 600 700 800 900 1000
Lattice Size (Resolution)
Intersection Area (%)
Von N ewm ann
M oore 3x3
M oore 5x5
FIGURE 12. Neighbor size on each resolution
Kohei Arai and Achmad Basuki
Geoinformatica - An International Journal (GIIJ), Volume (1): Issue (1) 9
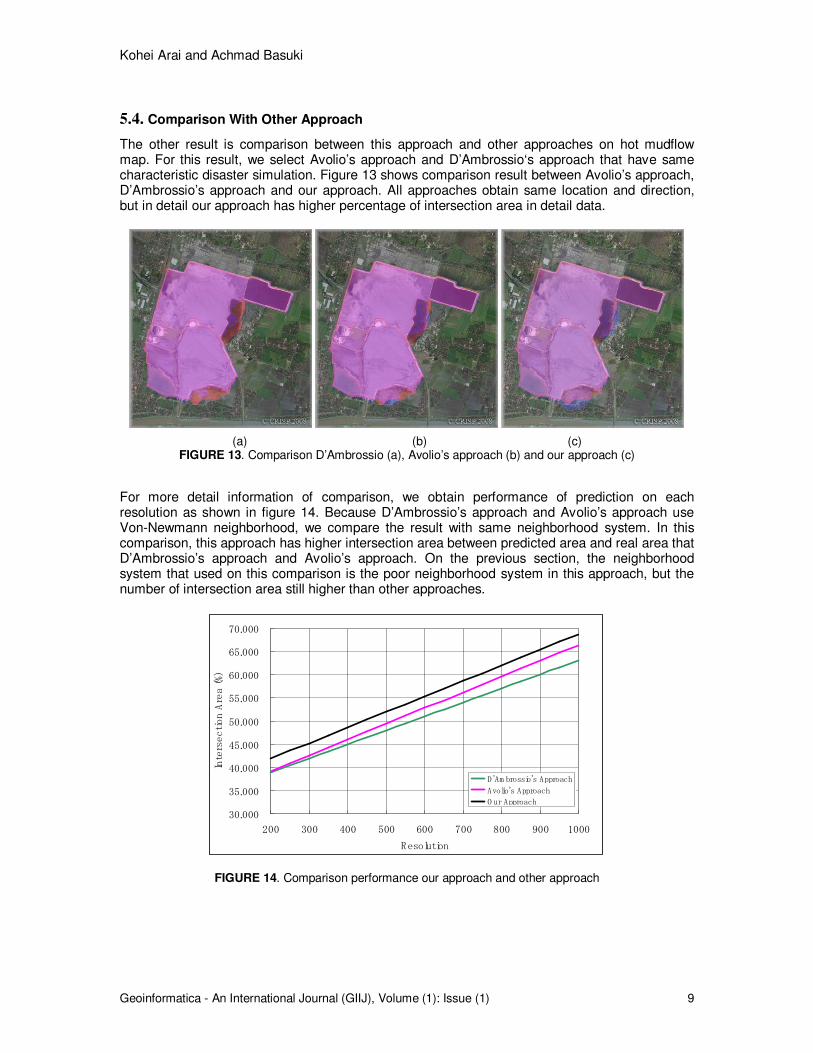
5.4. Comparison With Other Approach
The other result is comparison between this approach and other approaches on hot mudflow map. For this result, we select Avolio’s approach and D’Ambrossio‘s approach that have same characteristic disaster simulation. Figure 13 shows comparison result between Avolio’s approach, D’Ambrossio’s approach and our approach. All approaches obtain same location and direction, but in detail our approach has higher percentage of intersection area in detail data.
(a) (b) (c) FIGURE 13. Comparison D’Ambrossio (a), Avolio’s approach (b) and our approach (c)
For more detail information of comparison, we obtain performance of prediction on each resolution as shown in figure 14. Because D’Ambrossio’s approach and Avolio’s approach use Von-Newmann neighborhood, we compare the result with same neighborhood system. In this comparison, this approach has higher intersection area between predicted area and real area that D’Ambrossio’s approach and Avolio’s approach. On the previous section, the neighborhood system that used on this comparison is the poor neighborhood system in this approach, but the number of intersection area still higher than other approaches.
30.000
35.000
40.000
45.000
50.000
55.000
60.000
65.000
70.000
200 300 400 500 600 700 800 900 1000
Resolution
Intersection Area (%)
D'Am brossio's Approach
Avolio's Approach
O ur Approach
FIGURE 14. Comparison performance our approach and other approach

Kohei Arai and Achmad Basuki
Geoinformatica - An International Journal (GIIJ), Volume (1): Issue (1) 10
5.4. Mud-Height Differences
This simulation shows the mud-height change in every period. We cut one line from main crater to farthest point and determine mud-height in every point on this line. We show two graphs of mud height; mud height in May 2008 (blue line) and August 2008 (red line) as shown in figure 15 in order to describe mud height differences. This result shows the difference of mud-height for three months. The average of mud-height is 2.94m. It means every month mud-height increases 0.97m around main crater.
0
5
10
15
20
25
30
35
5 80 155 230 305 380 455 530 605
Distance from m ain crater (m )
Mud Height (m)
M ay-08
Aug-08
FIGURE 14. Mud-height differences
6. CONCLUSION AND FUTURE WORK A new approach of probabilistic cellular automata approach offers a solution to predict new inundated area on hot mudflow disaster. This approach is not only easy to develop but also has better performance than other previous approach to predict new inundated area. It also obtains the same location and direction with real data. This approach as model-based approach depends on some parameters such as resolution and neighbor size. This approach obtains better performance that previous CA approach, although the percentage of intersection area still less than 70%. It happens because this approach requires high-resolution map. In low-resolution map, this approach still open to improve. One possible approach is the use of clustering on material flow. Using the cluster of material flow, we can adjust the probability values in equilibrium states.
7. REFERENCES 1. Indra Harsaputra, “Govt. weighs options for battling the sludge”, The Jakarta Post, May 29
2007; http://mudflow-sidoarjo.110mb.com, Comments and Prospects (retrieved 11.06.07)
2. Argentini. G (2003), “A first approach for a possible cellular automaton model of fluids dynamic, New Technologies & Models”, Information & Communication Technology Department Riello Group, Legnago (Verona), Italy, February 2003
3. Richard J. Davies, “Birth of a mud volcano: East Java, 29 May 2006”, GSA Today: v. 17, no.
2, doi: 10.1130/GSAT01702A

Kohei Arai and Achmad Basuki
Geoinformatica - An International Journal (GIIJ), Volume (1): Issue (1) 11
4. Vicari A, Alexis H, Del Negro C, Coltelli M, Marsella M, and Proietti C, “Modeling of the 2001 Lava Flow at Etna Volcano by a Cellular Automata Approach”, Environmental Modelling & Software 22, pp.1465-1471, 2007
5. D’Ambrosio D., Di Gregorio S., Gabriele S. and Claudio R., “A Cellular Automata Model for Soil Erosion by Water”, Physic and Chemistry of The Earth, EGS, B 26 1 2001, pp.33-39, 2001
6. Yuan Lifeng, A Soil Erosion Model Based on Cellular Automata, The International Archives of
the Photogrammetry, Remote Sensing and Spatial Sciences, Vol. XXXVII Part B6b, pp.21-25 7. Kohei Arai, Achmad Basuki, “A Cellular Automata Based Approach for Prediction of Hot
Mudflow Disaster Area”, ICCSA 2010 Lecture Notes in Computer Science, 2010, Volume 6017/2010, pp.87-98
8. Avolio MV, Di Gregorio S., Mantovani F., Pasuto A., Rongo R., Silvano S., and Spataro W., “Simulation of the 1992 Tessina Landslide by a Cellular Automata Model and Future Hazard Scenarios”, International Journal of Applied Earth Observation and Geoinformation, Volume 2, Issue 1, pp.41-50, 2000
9. Pierre J.P. Pimienta, Edward J. Garboczi, W. Craig Carter, Cellular automaton algorithm for
surface mass transport due to curvature gradients simulations of sintering, Computational Materials Science, Volume 1, Issue 1, October 1992, pp. 63-77
10. Spataro W., D’Ambrosio D., Di Gregorio S., Rongo R., Avolio M.V., Giuseppe A. Trunfio
(2007), “Evolutionary Computation And Modeling Of Natural Phenomena: An Application To Lava Flows”, In Proceedings of the 21st European Conference on Modeling and Simulation, ECMS, 2007
11. Malamud, B.D., Turcotte, D.L., “Cellular-Automata models applied to natural hazards”, IEEE Computing in Science & Engineering, Vol. 2, No. 3, pp. 42-51, 2000
12. Centre for Remote Imaging, Sensing and Processing (CRISP), National University of
Singapore, http://www.crisp.nus.edu.sg/coverages/mudflow/index_IK_p30.html
13. Subrata K Chakraborty, Jayanti Anggraini, “Massive Mudflow and Enviromental Damage Following Drilling Failure – An Example from Indonesia”, PETROTECH 2009, India, P09-532
14. Achmad Basuki, Tri Harsono, and Kohei Arai, “Modeling and Simulation of Hot Mudflow
Movement Prediction Using Cellular Automata”, AMS 2009, Third Asia International Conference on Modelling & Simulation, pp.176-181, 2009
15. Chopard, B., Luthi, P. and Masselot, A., “Cellular Automata and Lattice Boltzmann Techniques : An Approach to Model and Simulate Complex Systems”, In Proceedings of Advances in Physics Conference, 1998