Embed Size (px)
Citation preview
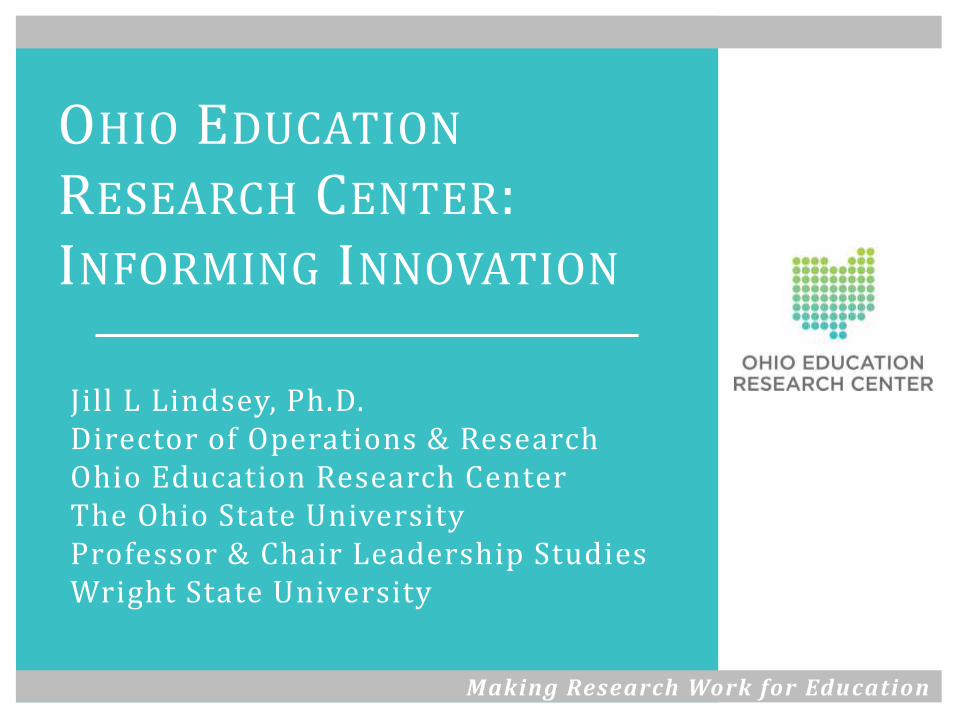
OHIO EDUCATION
RESEARCH CENTER: INFORMING INNOVATION
Jill L Lindsey, Ph.D. Director of Operations & ResearchOhio Education Research Center The Ohio State UniversityProfessor & Chair Leadership StudiesWright State University
Making Research Work for Education
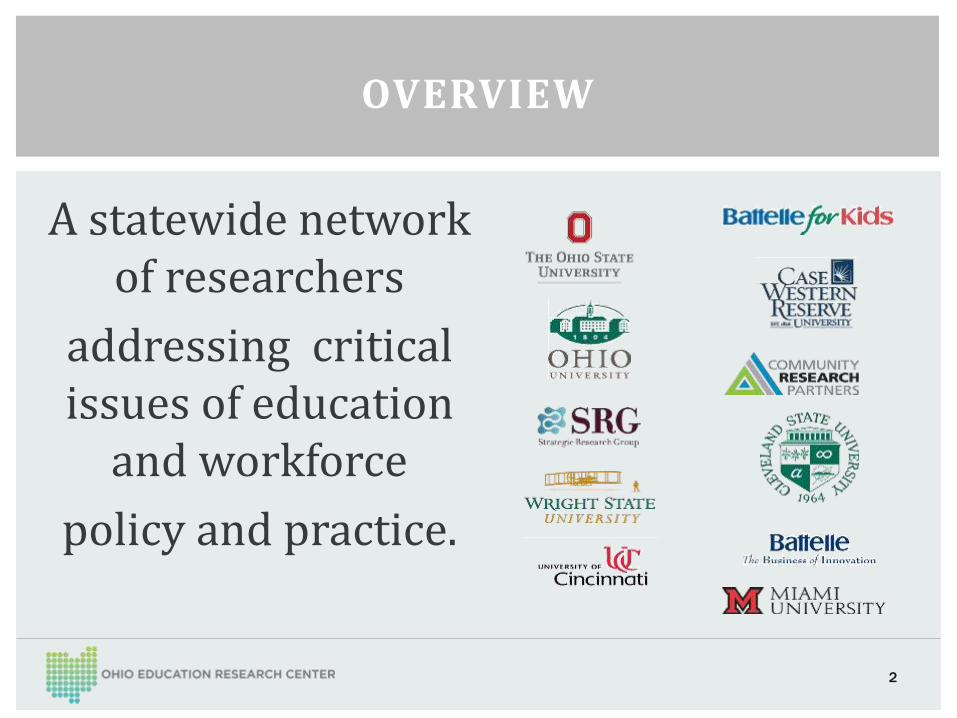
OVERVIEW
A statewide network of researchers
addressing critical issues of education
and workforce
policy and practice.
2
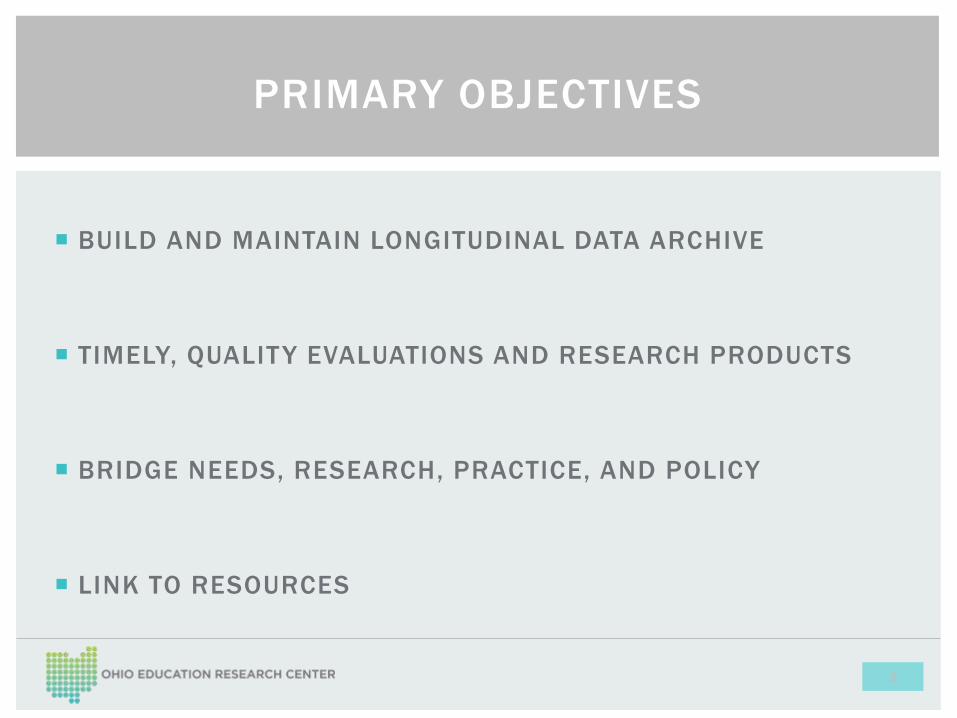
BUILD AND MAINTAIN LONGITUDINAL DATA ARCHIVE
TIMELY, QUALITY EVALUATIONS AND RESEARCH PRODUCTS
BRIDGE NEEDS, RESEARCH, PRACTICE, AND POLICY
LINK TO RESOURCES
3
PRIMARY OBJECTIVES
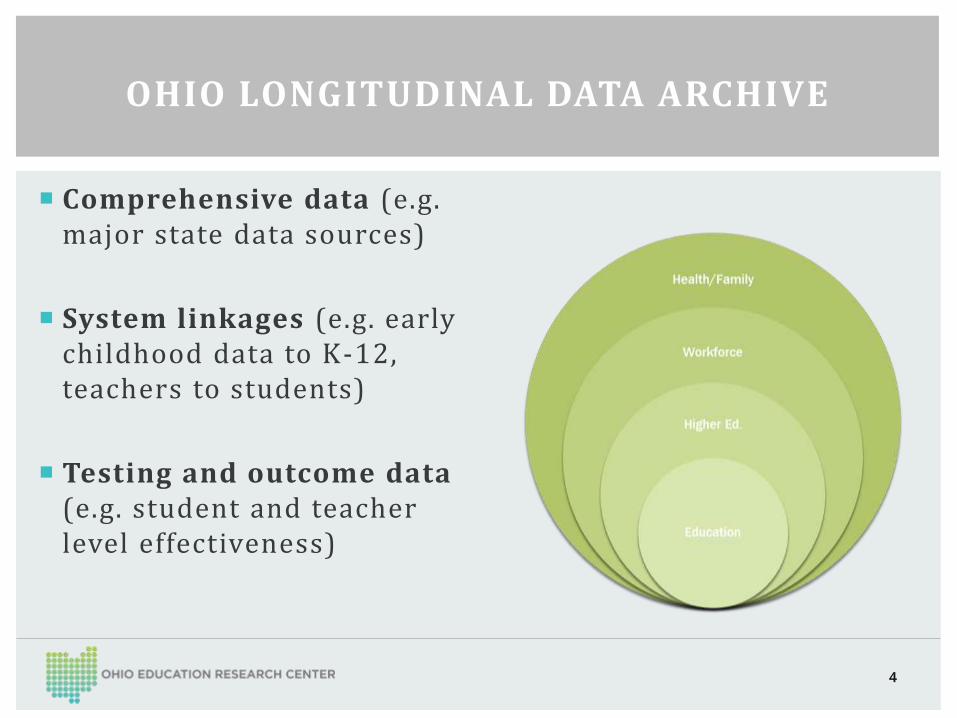
Comprehensive data (e.g. major state data sources)
System linkages (e.g. early childhood data to K-12, teachers to students)
Testing and outcome data (e.g. student and teacher level effectiveness)
OHIO LONGITUDINAL DATA ARCHIVE
4
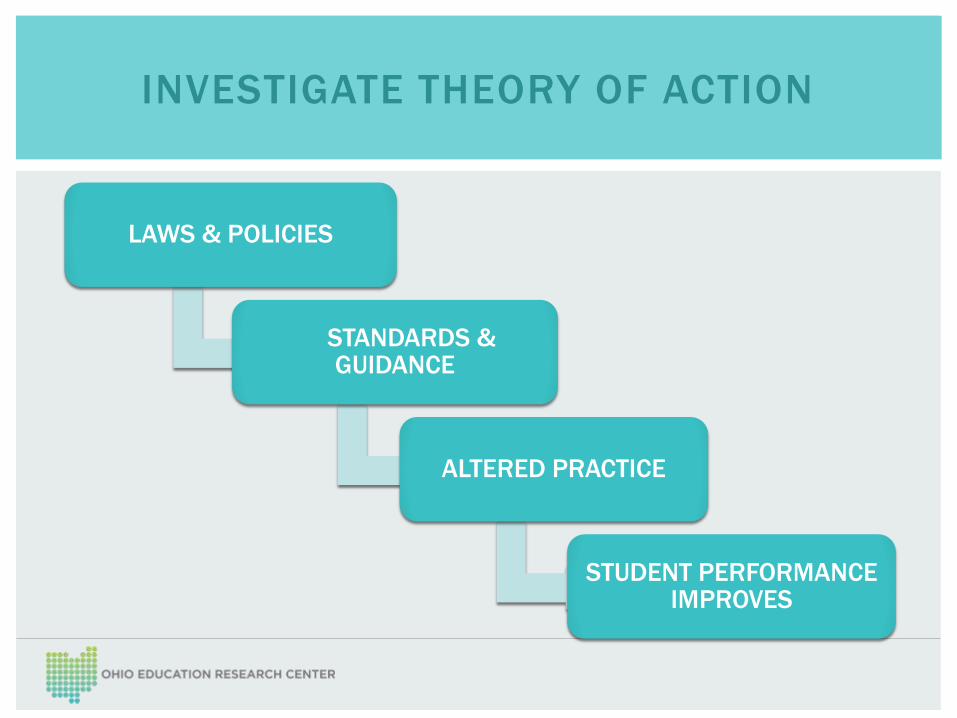
LAWS & POLICIES
STANDARDS & GUIDANCE
ALTERED PRACTICE
STUDENT PERFORMANCE IMPROVES
INVESTIGATE THEORY OF ACTION
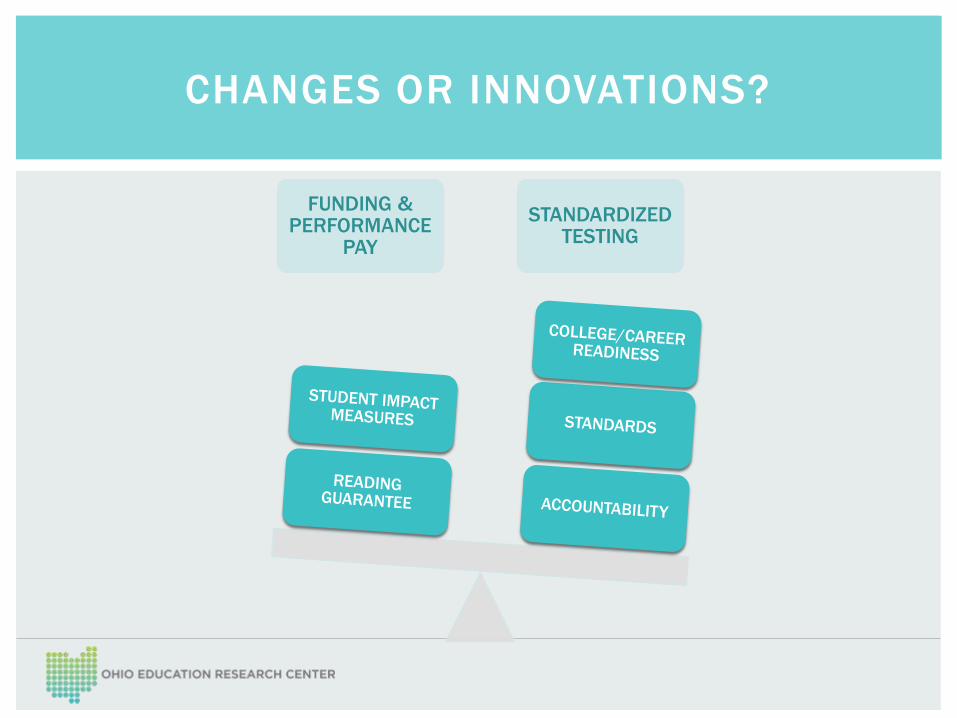
CHANGES OR INNOVATIONS?
FUNDING & PERFORMANCE
PAY
STANDARDIZED TESTING
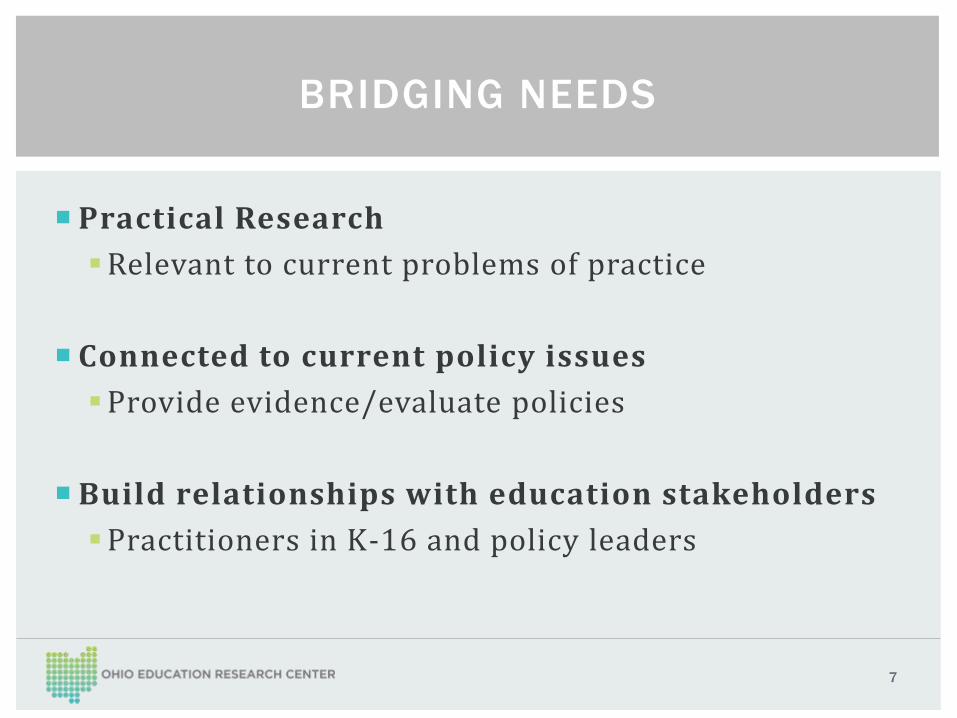
Practical Research
Relevant to current problems of practice
Connected to current policy issues
Provide evidence/evaluate policies
Build relationships with education stakeholders
Practitioners in K-16 and policy leaders
BRIDGING NEEDS
7
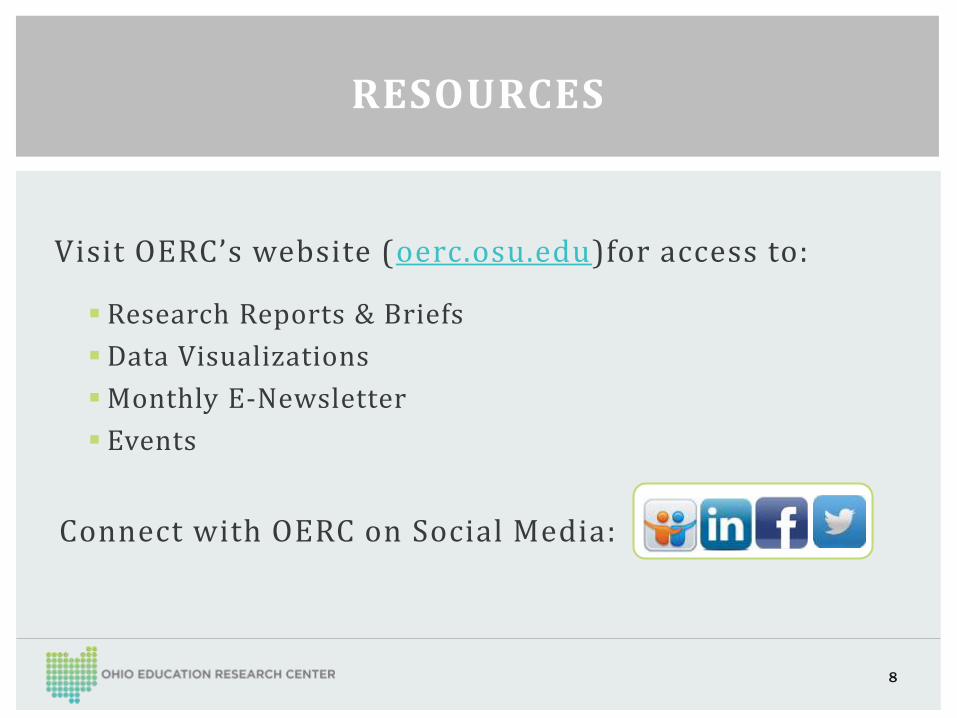
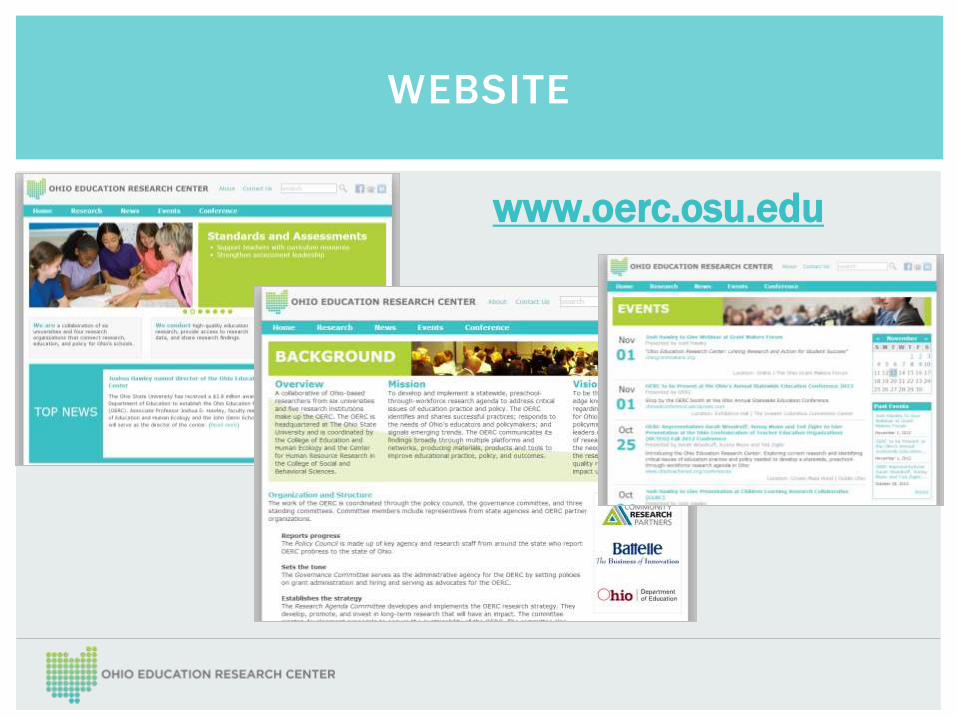
Visit OERC’s website (oerc.osu.edu)for access to:
Research Reports & Briefs
Data Visualizations
Monthly E-Newsletter
Events
Connect with OERC on Social Media:
RESOURCES
8
STUDENT SUCCESS DASHBOARD
STUDENT GROWTH MEASURES: A STUDY OF POLICY AND PRACTICE
HIGHER EDUCATION OUTCOMES DASHBOARD
9
RECENT & CURRENT
INNOVATIVE PROJECTS
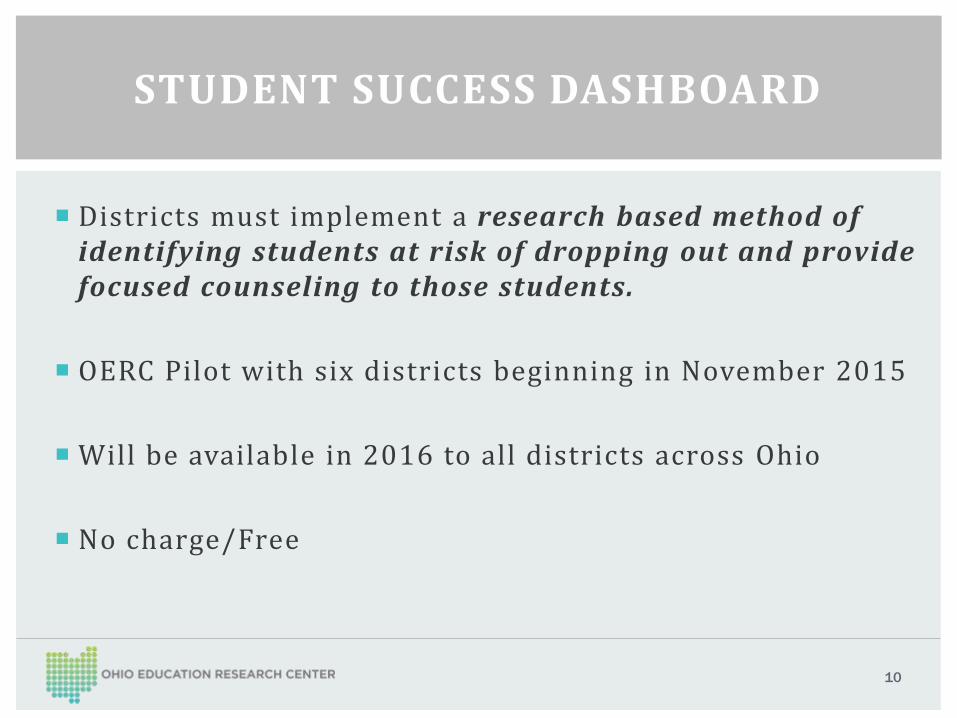
Districts must implement a research based method of identifying students at risk of dropping out and provide focused counseling to those students.
OERC Pilot with six districts beginning in November 2015
Will be available in 2016 to all districts across Ohio
No charge/Free
PRIMARY OBJECTIVESSTUDENT SUCCESS DASHBOARD
10
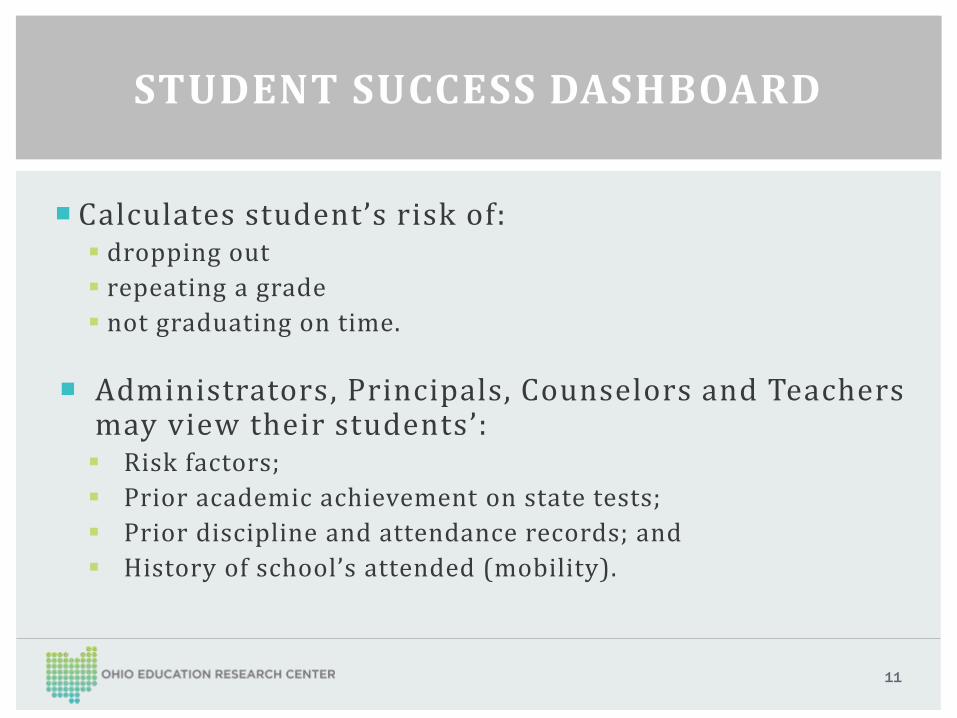
Calculates student’s risk of: dropping out
repeating a grade
not graduating on time.
Administrators, Principals, Counselors and Teachers may view their students ’: Risk factors;
Prior academic achievement on state tests;
Prior discipline and attendance records; and
History of school’s attended (mobility).
PRIMARY OBJECTIVESSTUDENT SUCCESS DASHBOARD
11
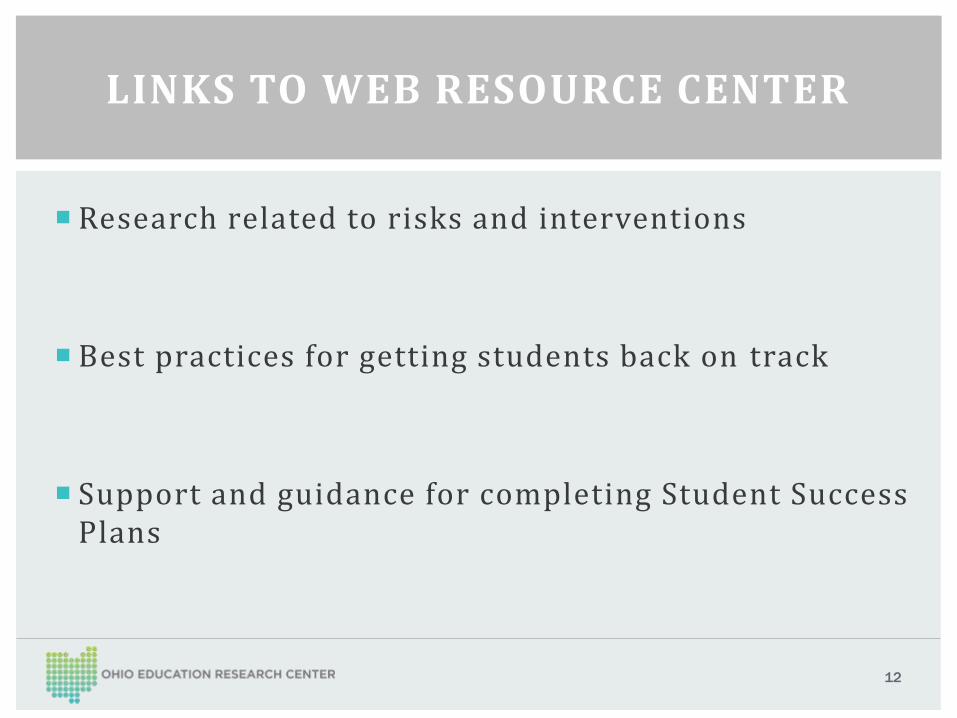
Research related to risks and interventions
Best practices for getting students back on track
Support and guidance for completing Student Success Plans
PRIMARY OBJECTIVESLINKS TO WEB RESOURCE CENTER
12
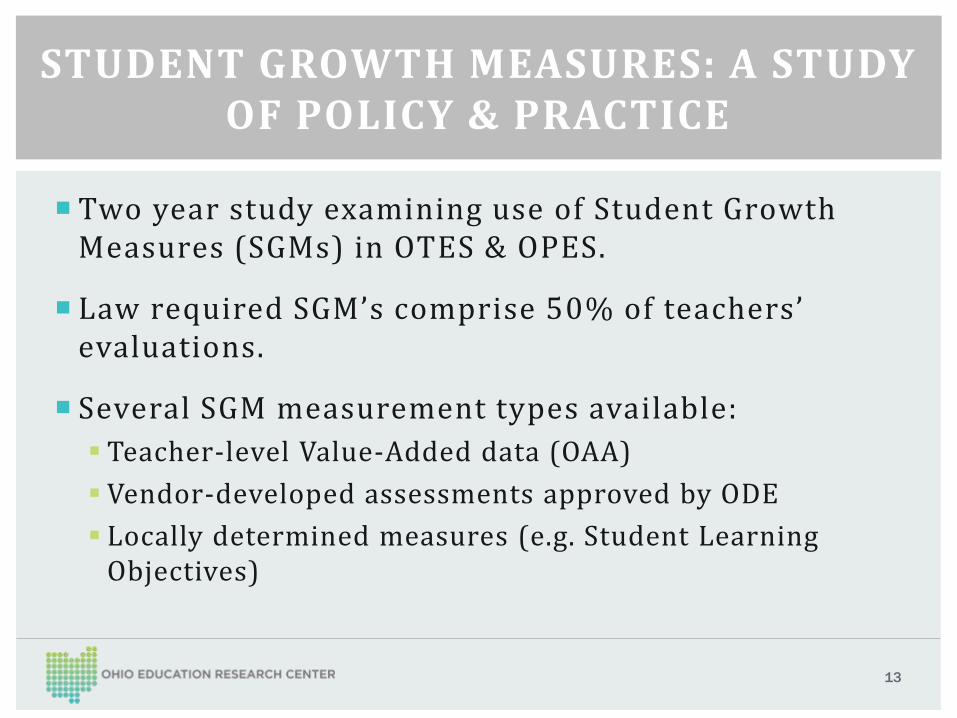
Two year study examining use of Student Growth Measures (SGMs) in OTES & OPES.
Law required SGM’s comprise 50% of teachers’ evaluations.
Several SGM measurement types available:
Teacher-level Value-Added data (OAA)
Vendor-developed assessments approved by ODE
Locally determined measures (e.g. Student Learning Objectives)
PRIMARY OBJECTIVESSTUDENT GROWTH MEASURES: A STUDY
OF POLICY & PRACTICE
13
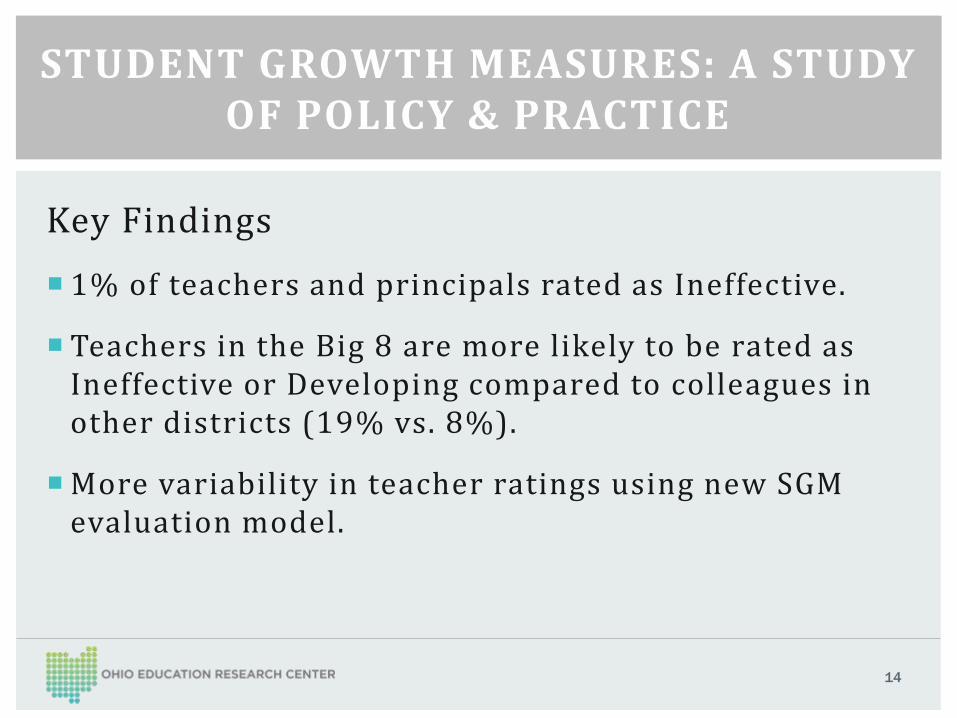
Key Findings
1% of teachers and principals rated as Ineffective.
Teachers in the Big 8 are more likely to be rated as Ineffective or Developing compared to colleagues in other districts (19% vs. 8%).
More variability in teacher ratings using new SGM evaluation model.
PRIMARY OBJECTIVESSTUDENT GROWTH MEASURES: A STUDY
OF POLICY & PRACTICE
14
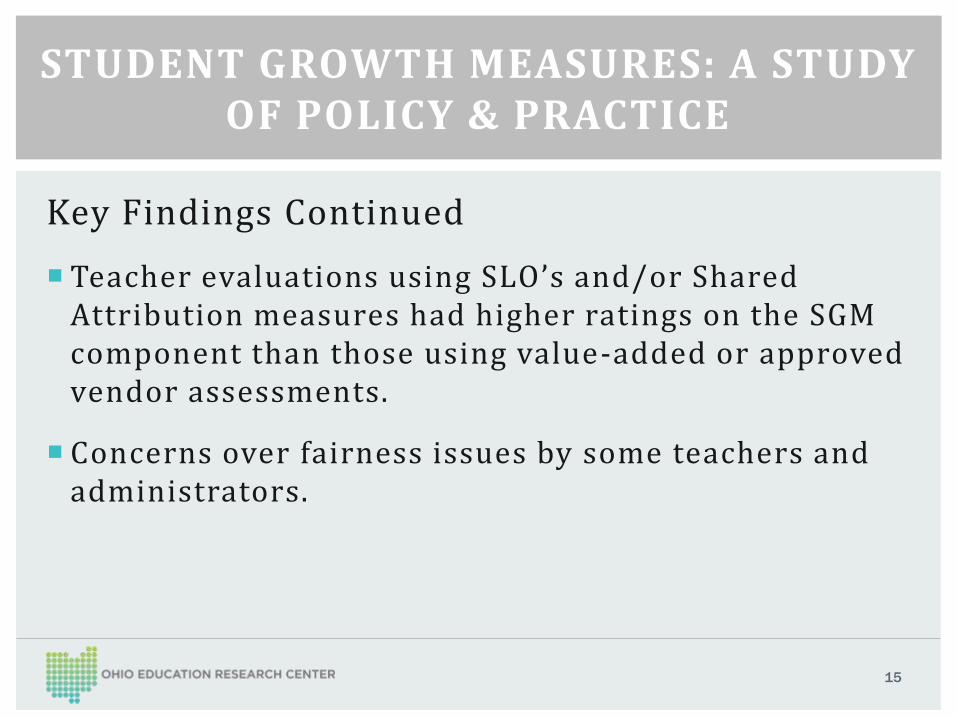
Key Findings Continued
Teacher evaluations using SLO’s and/or Shared Attribution measures had higher ratings on the SGM component than those using value-added or approved vendor assessments.
Concerns over fairness issues by some teachers and administrators.
PRIMARY OBJECTIVESSTUDENT GROWTH MEASURES: A STUDY
OF POLICY & PRACTICE
15
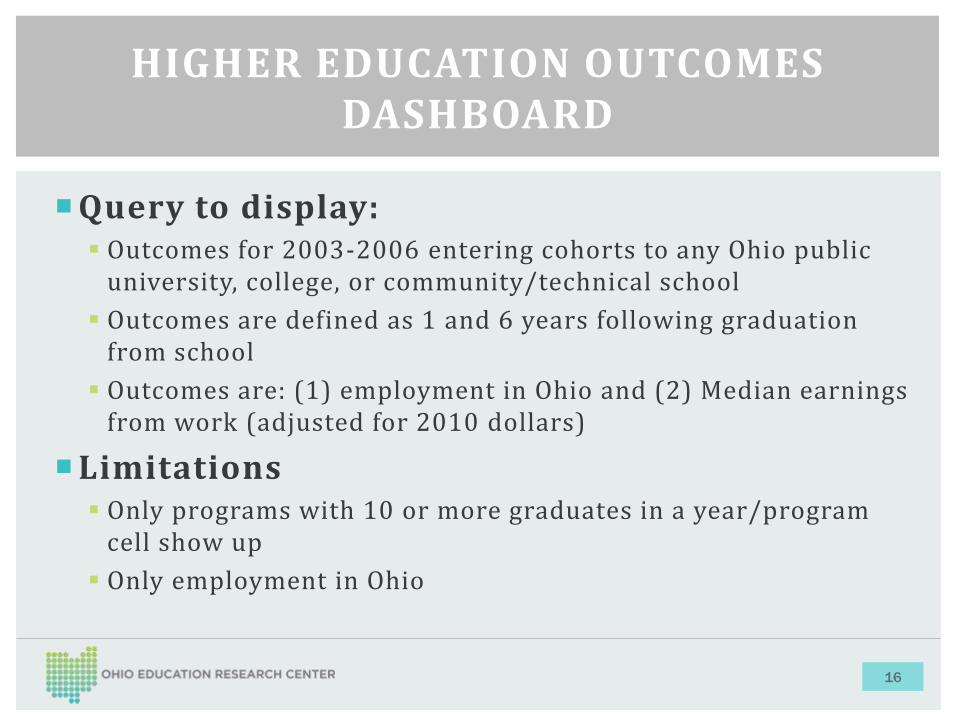
Query to display: Outcomes for 2003-2006 entering cohorts to any Ohio public
university, college, or community/technical school
Outcomes are defined as 1 and 6 years following graduation from school
Outcomes are: (1) employment in Ohio and (2) Median earnings from work (adjusted for 2010 dollars)
Limitations Only programs with 10 or more graduates in a year/program
cell show up
Only employment in Ohio
HIGHER EDUCATION OUTCOMES DASHBOARD
16
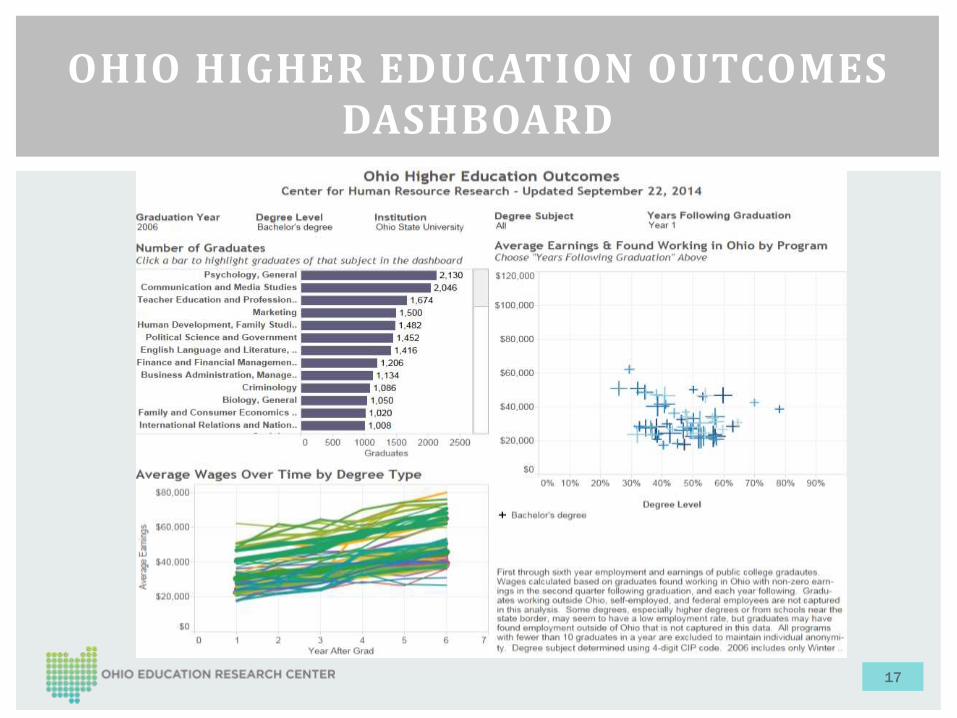
OHIO HIGHER EDUCATION OUTCOMES DASHBOARD
17
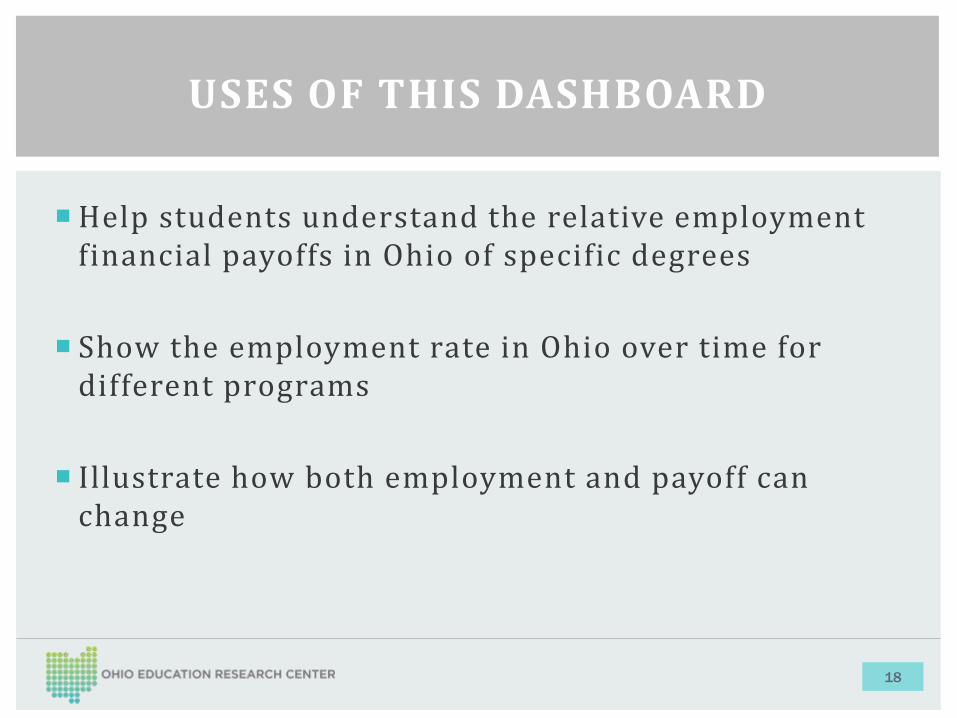
Help students understand the relative employment financial payoffs in Ohio of specific degrees
Show the employment rate in Ohio over time for different programs
Illustrate how both employment and payoff can change
USES OF THIS DASHBOARD
18
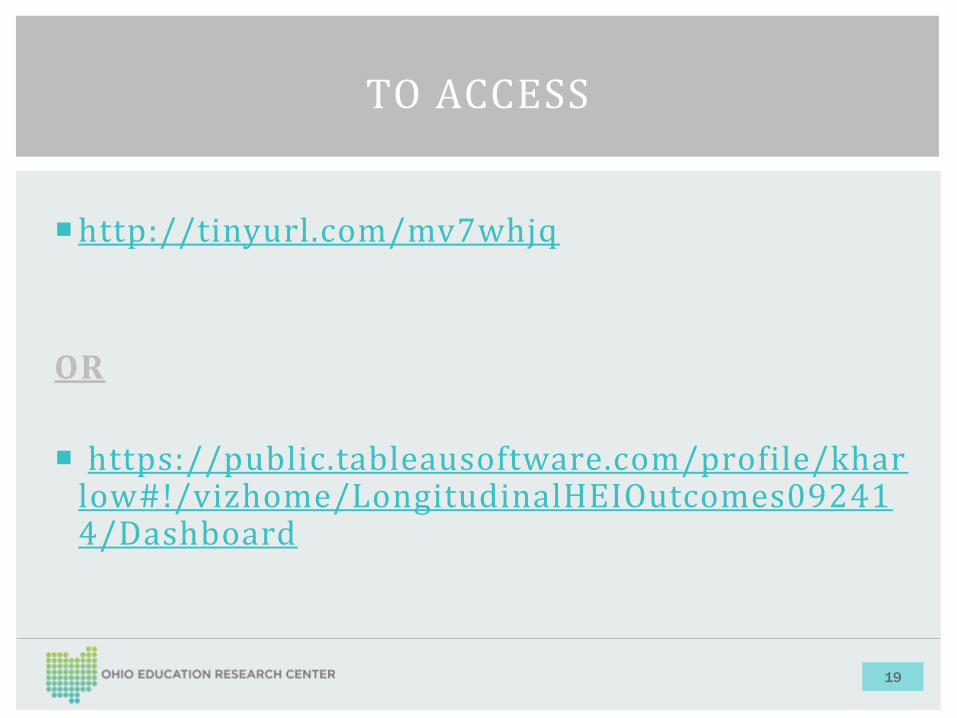
http://tinyurl.com/mv7whjq
OR
https://public.tableausoftware.com/profile/kharlow#!/vizhome/LongitudinalHEIOutcomes092414/Dashboard
TO ACCESS
19
Ohio’s Race to the Top Benchmark Progress Study
Implementation of the “Collaboration on Economic Success in Appalachia” High School-Higher Education Alignment Project
Ohio Network for Educational Transformation Evaluation Report
Ohio’s Race to the Top Dropout Tracking Report
Ohio STEM School Impact Study
EXAMPLES OF OTHER OERC REPORTS
20
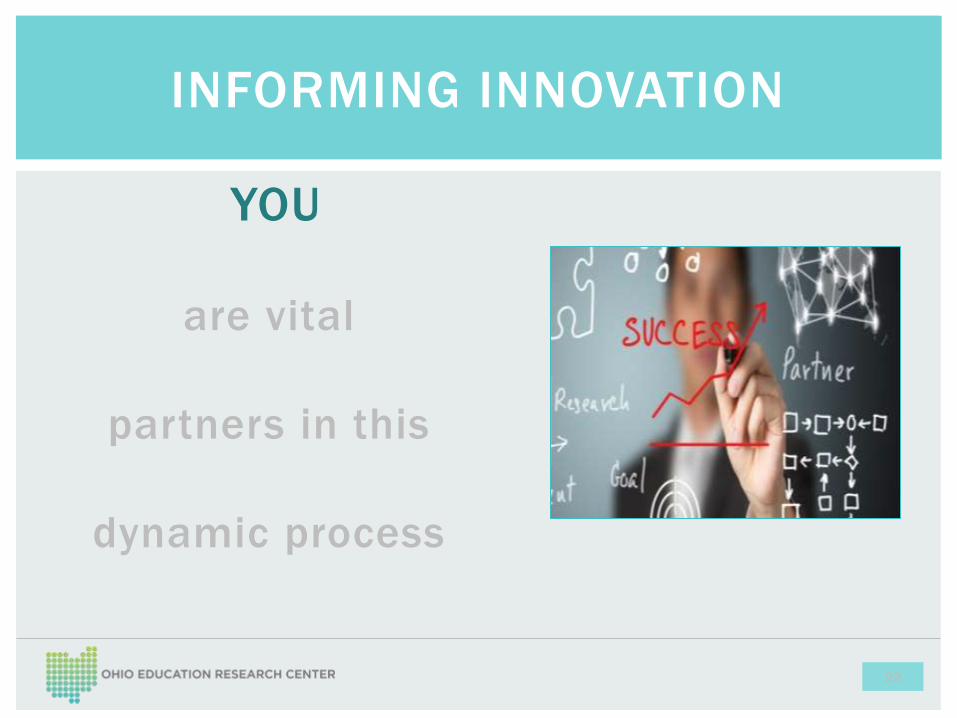
YOU
are vital
partners in this
dynamic process
22
INFORMING INNOVATION
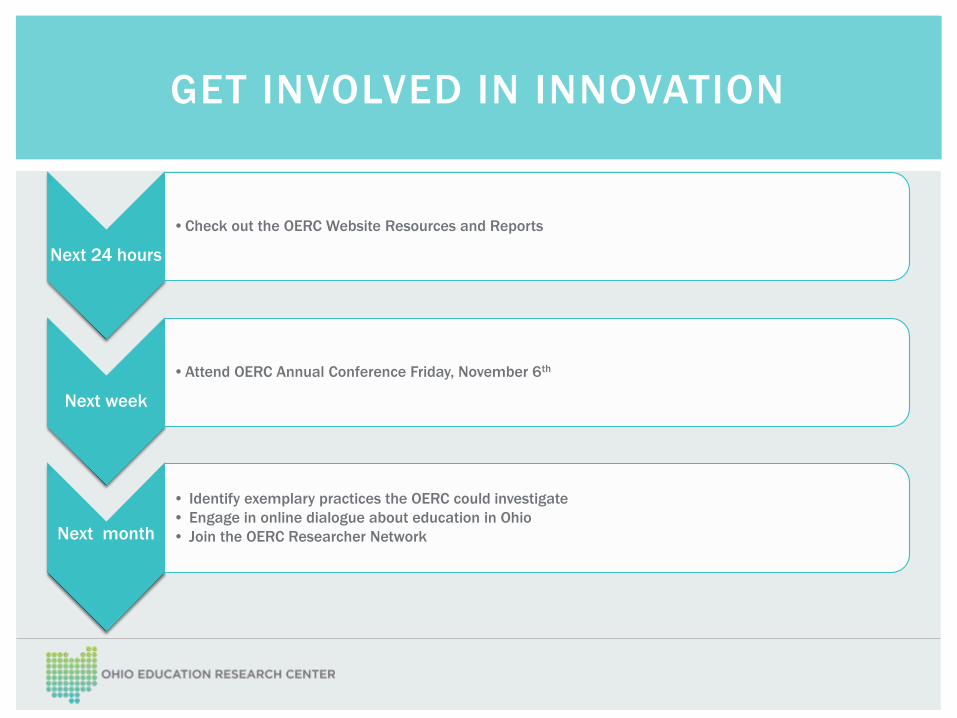
Next 24 hours
•Check out the OERC Website Resources and Reports
Next week
•Attend OERC Annual Conference Friday, November 6th
Next month
• Identify exemplary practices the OERC could investigate
• Engage in online dialogue about education in Ohio
• Join the OERC Researcher Network
GET INVOLVED IN INNOVATION
THANK YOU
Dr. Jill Lindsey(937) 775-3298
Dr. Joshua Hawley(614) 247-8140
Ms. Kristen Kubitza(614) 634-1847