Embed Size (px)
Citation preview
Presentation by Árni M. Mathiesen Assistant Director-General
Fisheries and Aquaculture DepartmentFood and Agriculture Organization of the
United Nations


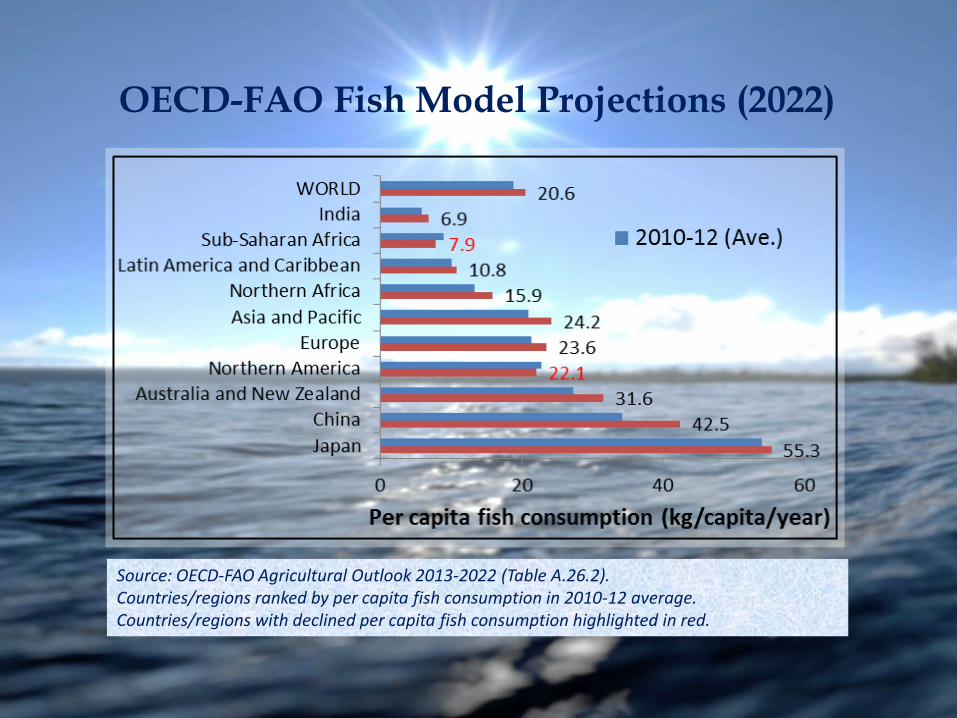
OECD-FAO Fish Model Projections (2022)
Source: OECD-FAO Agricultural Outlook 2013-2022 (Table A.26.2). Countries/regions ranked by per capita fish consumption in 2010-12 average.Countries/regions with declined per capita fish consumption highlighted in red.
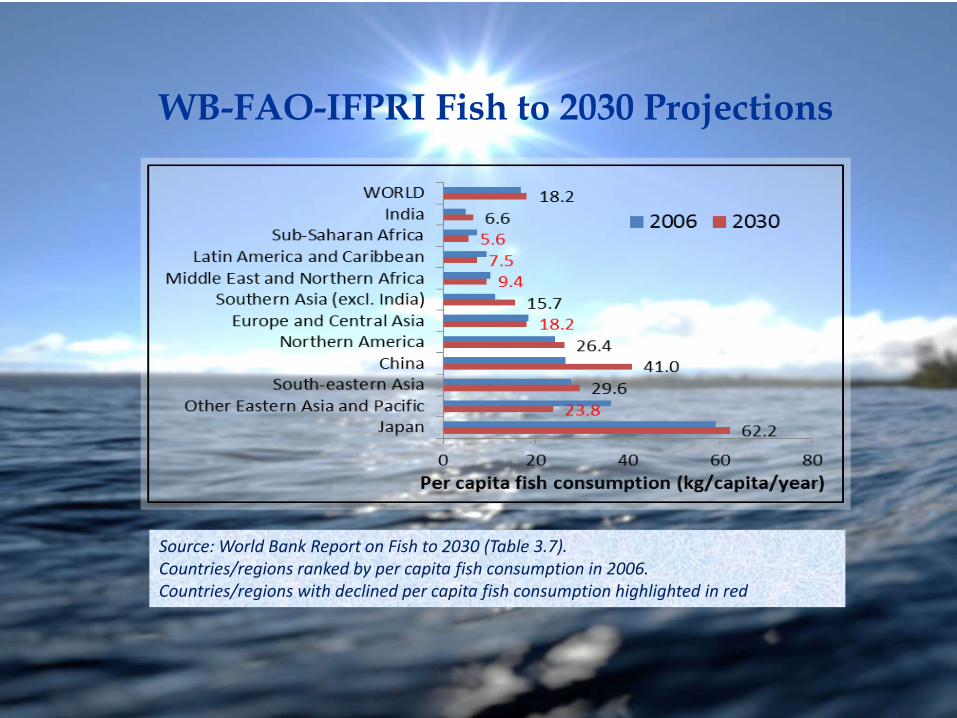
WB-FAO-IFPRI Fish to 2030 Projections
Source: World Bank Report on Fish to 2030 (Table 3.7). Countries/regions ranked by per capita fish consumption in 2006. Countries/regions with declined per capita fish consumption highlighted in red
Country/region
Fish Demand (2030)
Total fish prod. (2012, mil. tonne)
S-Dgap
2030 (col. 4 minus col. 3)
kg/cap.Total (mil.
tonne)
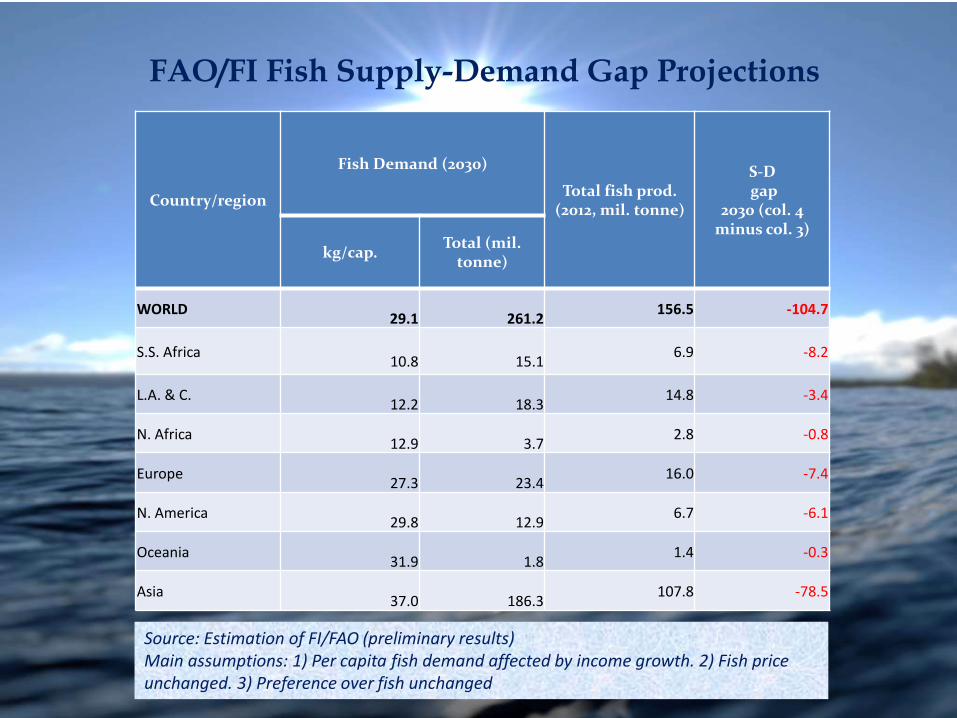
WORLD29.1 261.2
156.5 -104.7
S.S. Africa10.8 15.1
6.9 -8.2
L.A. & C.12.2 18.3
14.8 -3.4
N. Africa12.9 3.7
2.8 -0.8
Europe27.3 23.4
16.0 -7.4
N. America29.8 12.9
6.7 -6.1
Oceania31.9 1.8
1.4 -0.3
Asia37.0 186.3
107.8 -78.5
FAO/FI Fish Supply-Demand Gap Projections
Source: Estimation of FI/FAO (preliminary results)Main assumptions: 1) Per capita fish demand affected by income growth. 2) Fish price unchanged. 3) Preference over fish unchanged
0.0
2.0
4.0
6.0
8.0
10.0
12.0
14.0
16.0
18.0
20.0
0
20
40
60
80
100
120
140
160
180
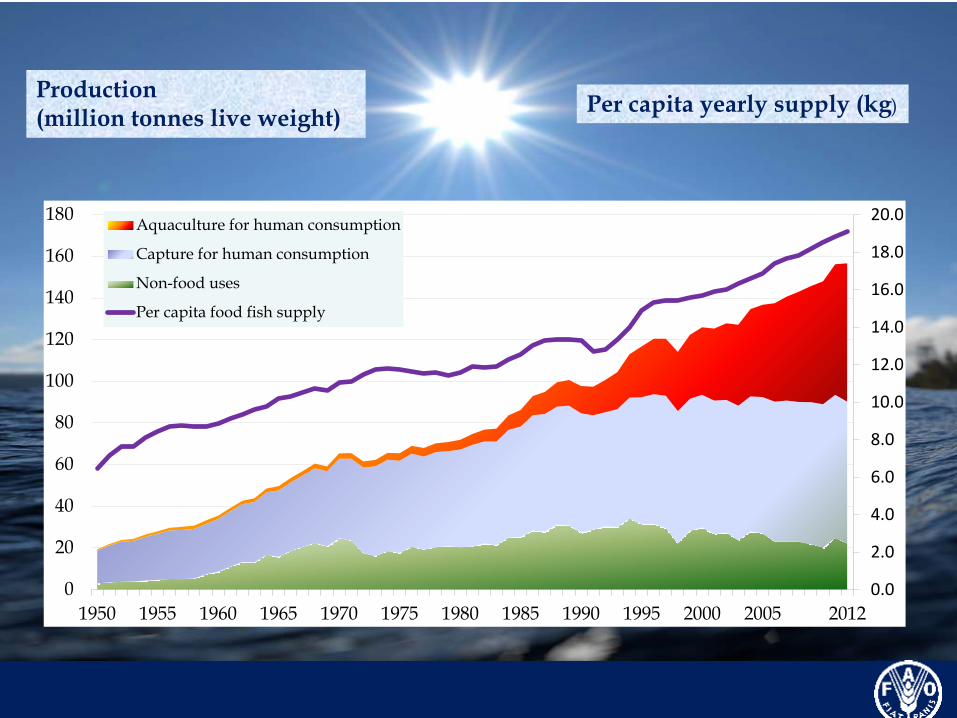
1950 1955 1960 1965 1970 1975 1980 1985 1990 1995 2000 2005 2012
Aquaculture for human consumption
Capture for human consumption
Non-food uses
Per capita food fish supply
Production (million tonnes live weight)
Per capita yearly supply (kg)
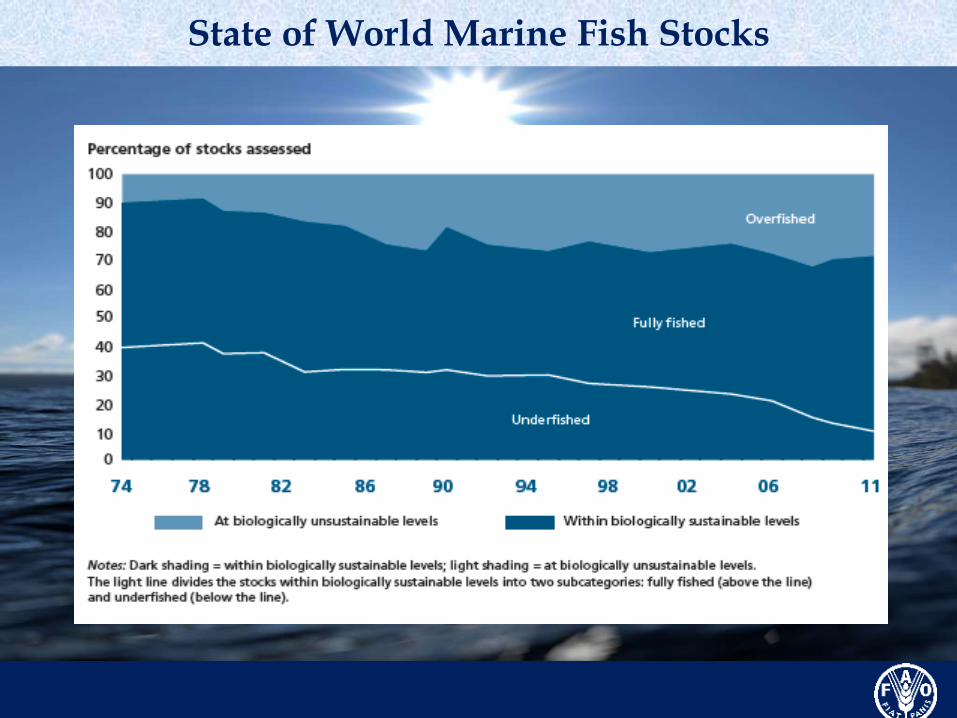
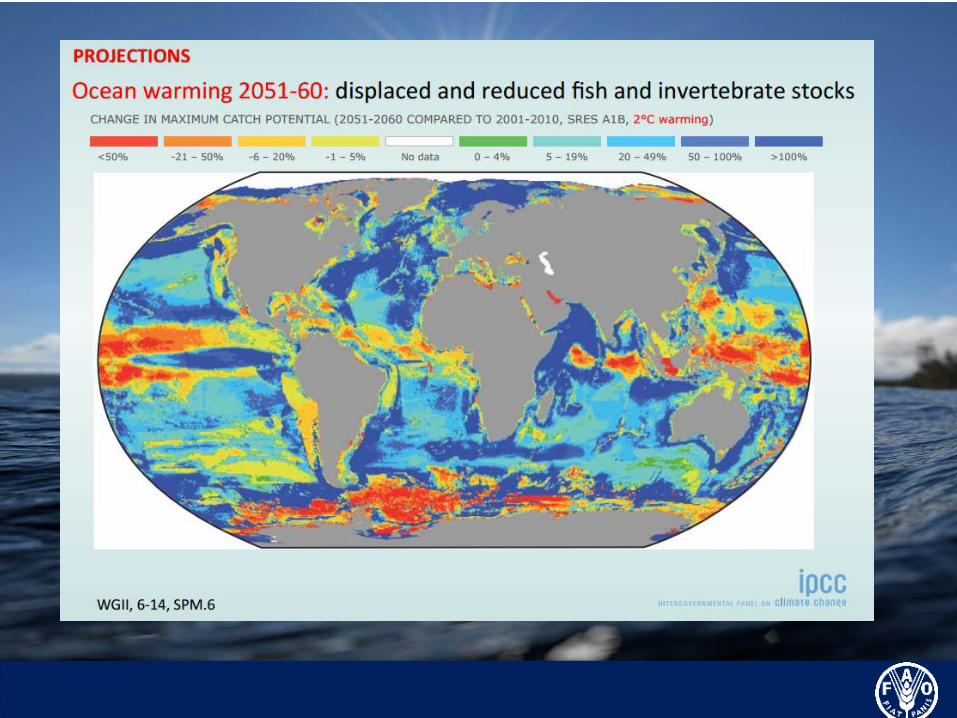
State of World Marine Fish Stocks
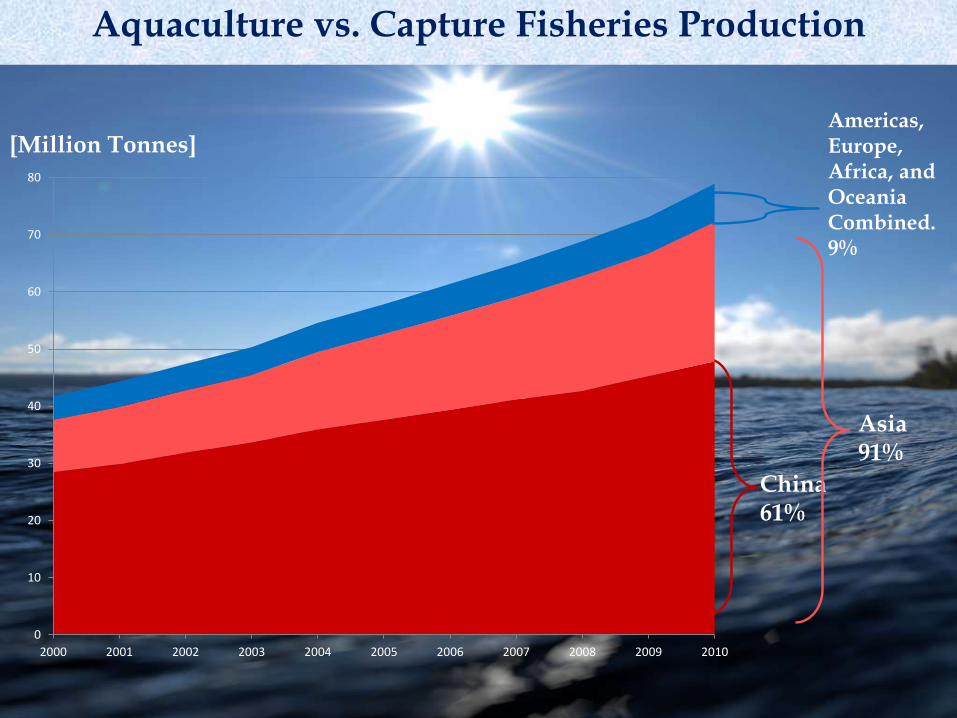
Americas, Europe, Africa, and Oceania Combined. 9%
[Million Tonnes]
0
10
20
30
40
50
60
70
80
2000 2001 2002 2003 2004 2005 2006 2007 2008 2009 2010
China61%
Asia91%
Aquaculture vs. Capture Fisheries Production
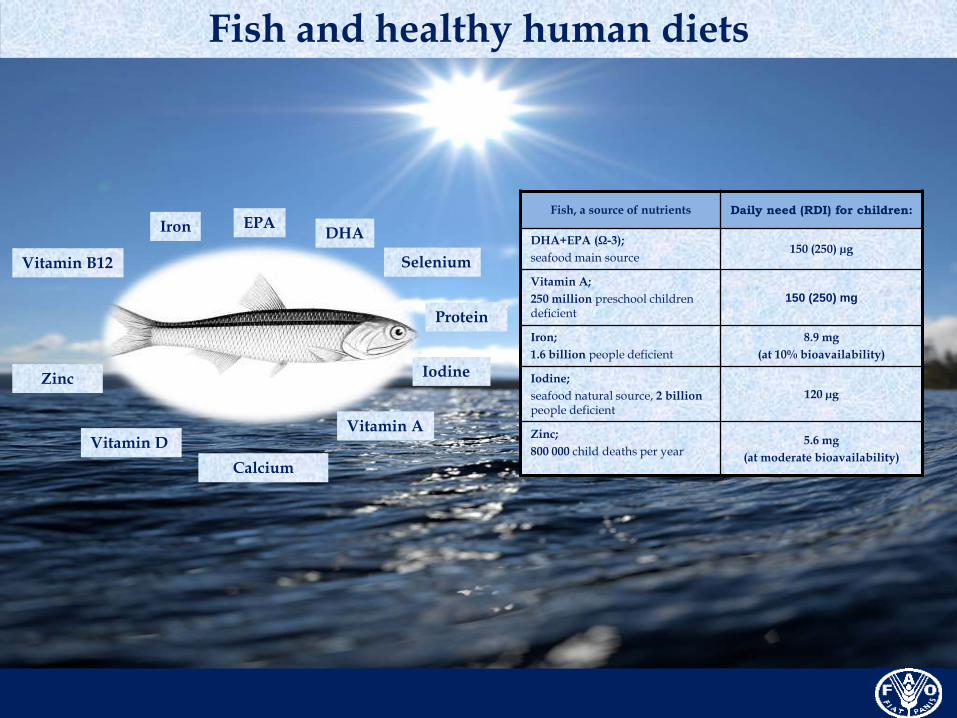
Fish and healthy human diets
Vitamin A
Protein
DHAEPA
Vitamin D
Vitamin B12
Zinc
Iron
Calcium
Selenium
Iodine
Fish, a source of nutrients Daily need (RDI) for children:
DHA+EPA (Ω-3);
seafood main source150 (250) µg
Vitamin A;
250 million preschool children deficient
150 (250) mg
Iron;
1.6 billion people deficient
8.9 mg
(at 10% bioavailability)
Iodine;
seafood natural source, 2 billion people deficient
120 µg
Zinc;
800 000 child deaths per year5.6 mg
(at moderate bioavailability)
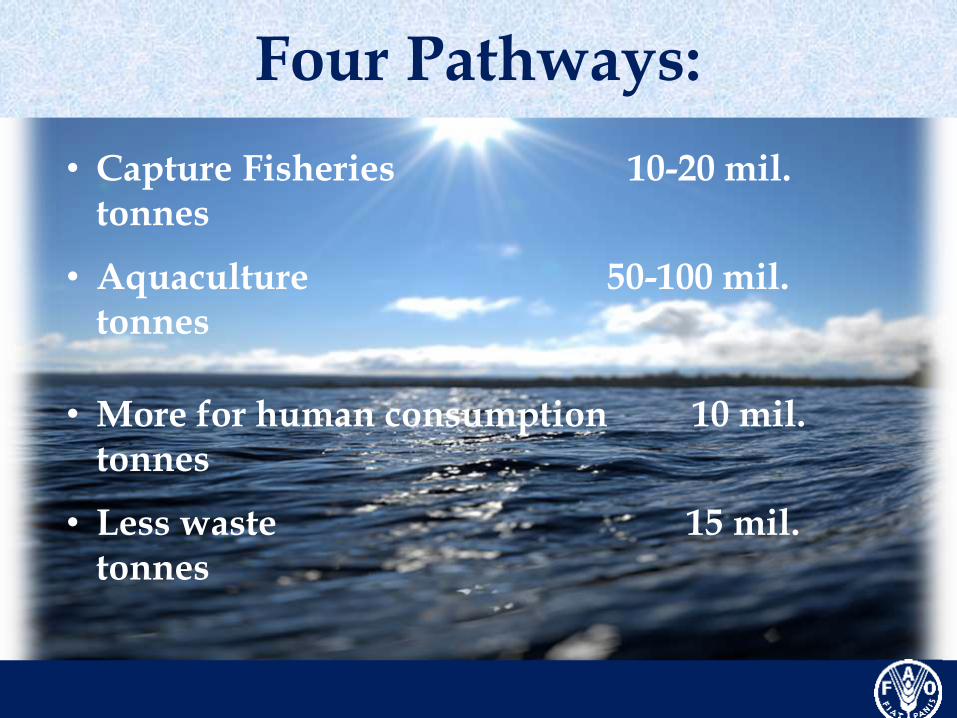
• Capture Fisheries 10-20 mil. tonnes
• Aquaculture 50-100 mil. tonnes
• More for human consumption 10 mil. tonnes
• Less waste 15 mil. tonnes
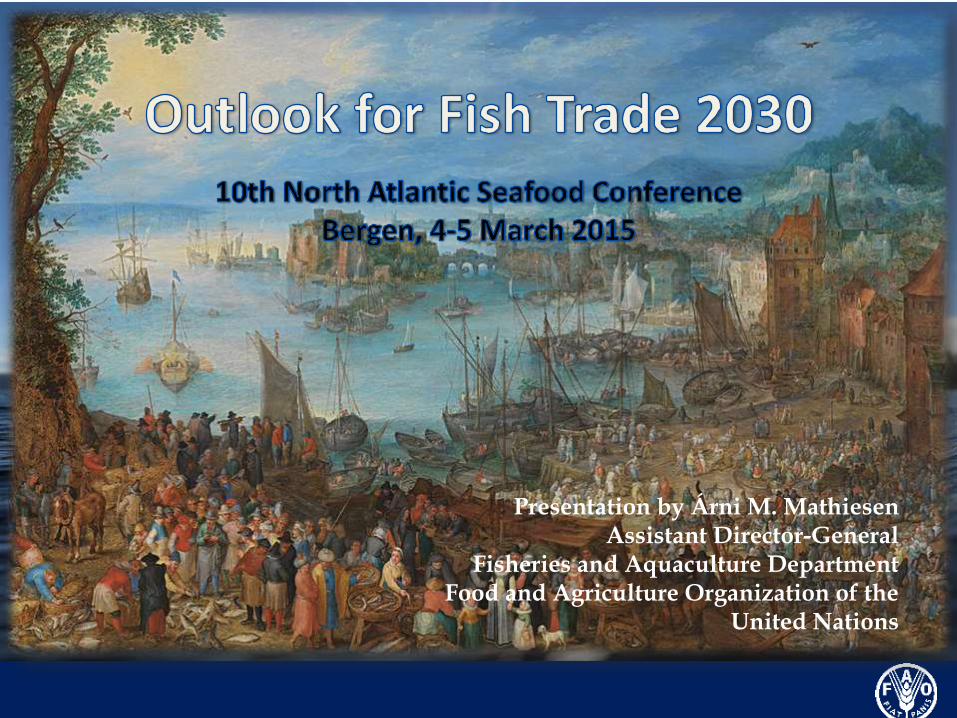
Four Pathways:
Possible?
Plausible?
What is possible is plausible
What has happened before can happen again
Optimistic
Realistic
Skeptical
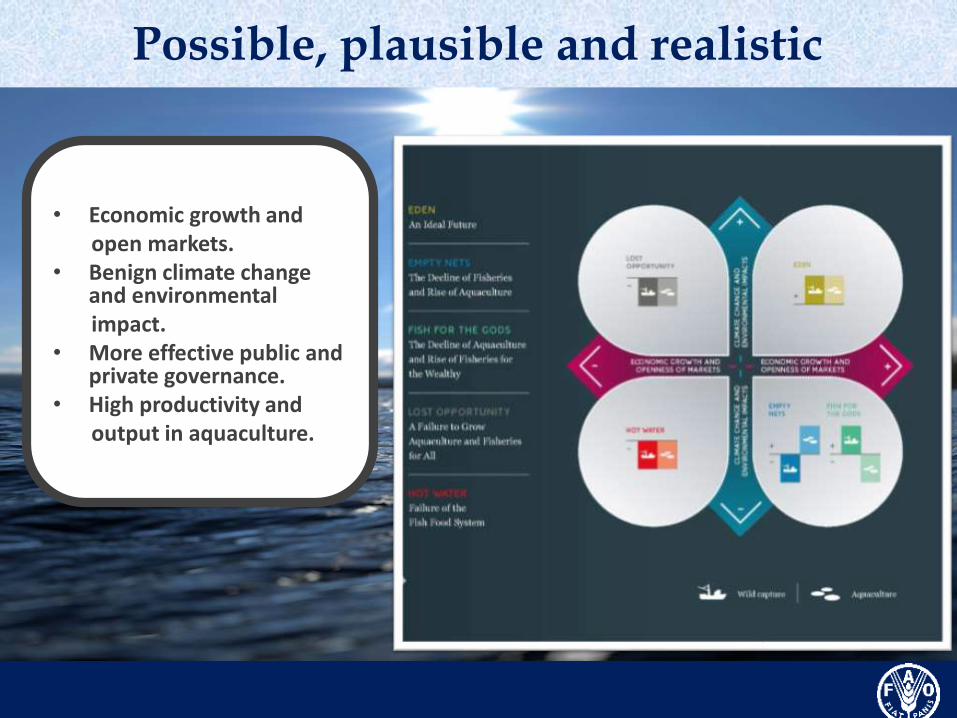
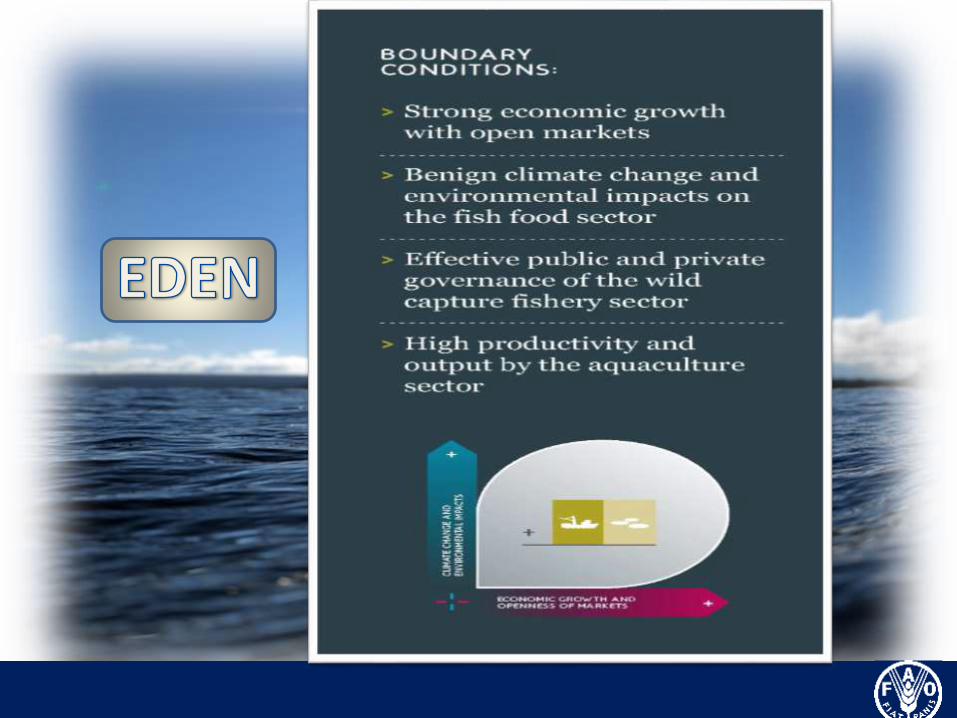
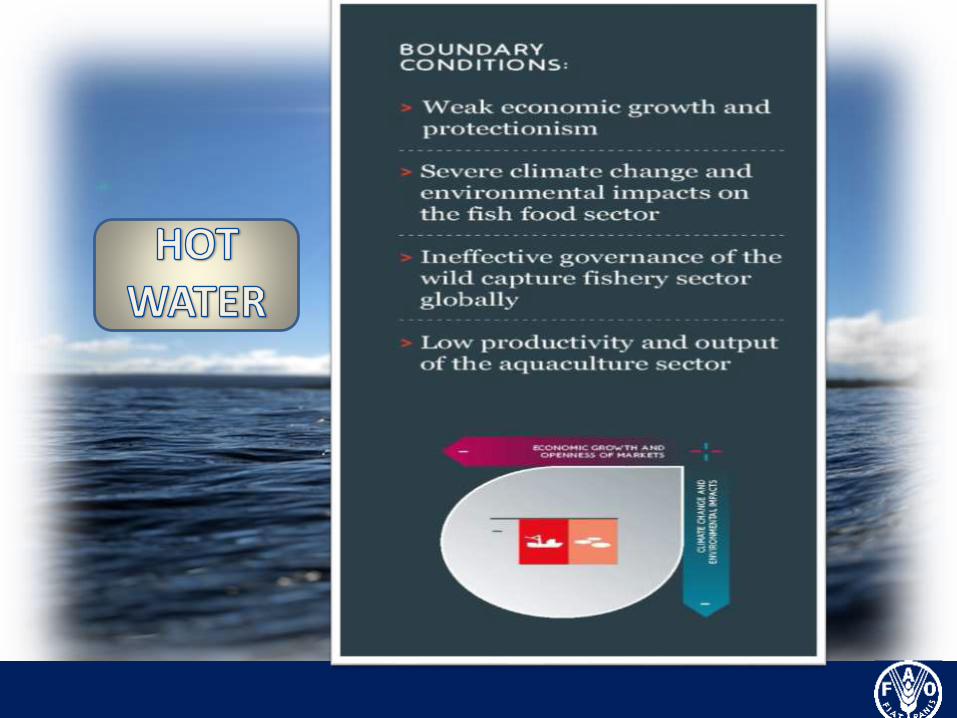
• Economic growth andopen markets.
• Benign climate change and environmental impact.
• More effective public and private governance.
• High productivity and output in aquaculture.
Possible, plausible and realistic