Embed Size (px)
Citation preview
Pilotní ověření návrhu nové metodiky
hodnocení výzkumných organizací
Pilot Test of New Evaluation Methodology
of Research Organisations
Samostatný doplňující dokument 5: Příklad bibliometrické zprávy
Background document 5:
Example of a Bibliometric Report
Tým KA1 IPN Metodika Martin Lhoták
Pavel Mika Jakuba Szarzec
Tento dokument byl zpracován v rámci Individuálního projektu národního pro oblast terciárního vzdělávání, výzkumu
a vývoje „Efektivní systém hodnocení a financování výzkumu, vývoje a inovací, CZ.1.07/4.1.00/33.0003“. Projekt byl
realizován Ministerstvem školství, mládeže a tělovýchovy a financován prostřednictvím Operačního programu
Vzdělávání pro konkurenceschopnost z Evropského sociálního fondu a státního rozpočtu České republiky.
This document has been prepared as a part of the Individual National Project for the area of Tertiary Education,
Research and Development „Effective System of Research Financing, Development and Innovation,
CZ.1.07/4.1.00/33.0003“. The project was realised by the Ministry of Education, Youth and Sports and financed by
the Operational Programme Education for Competitiveness of the European Social Fund and state budget of the Czech
Republic.
Dokument „Example of a Bibliometric Report“ neprošel jazykovou korekturou.
3
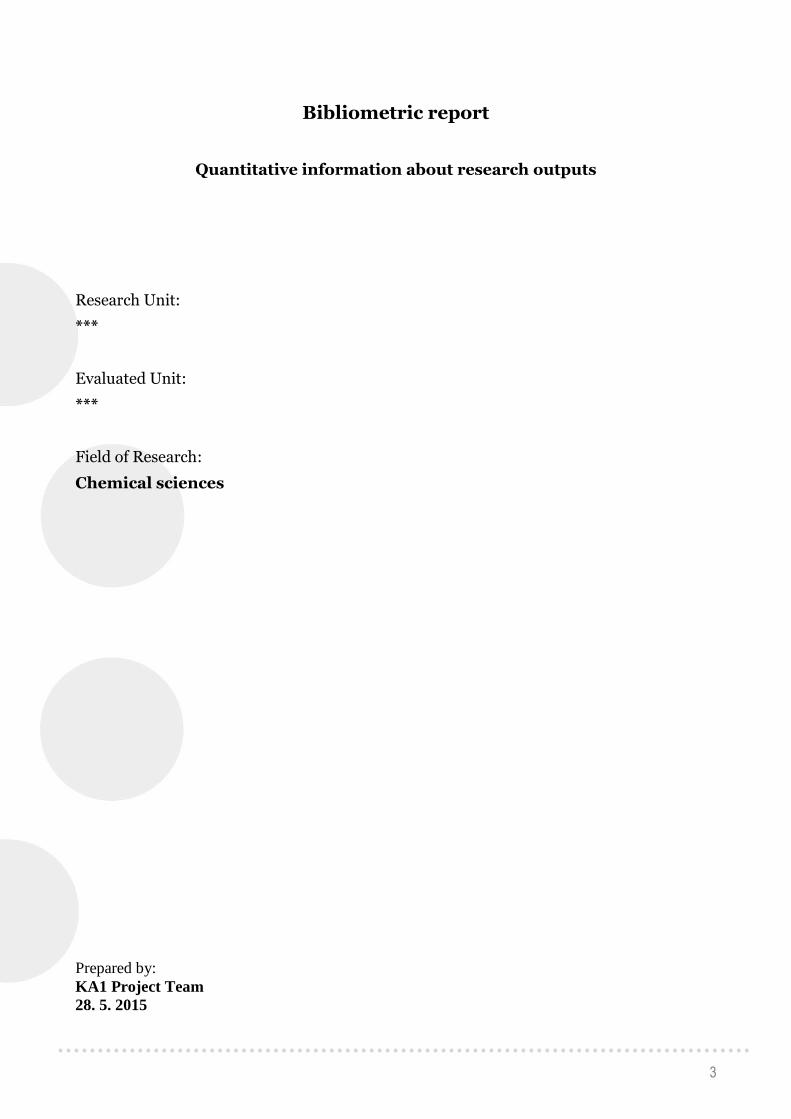
Bibliometric report
Quantitative information about research outputs
Research Unit:
***
Evaluated Unit:
***
Field of Research:
Chemical sciences
Prepared by:
KA1 Project Team
28. 5. 2015

4
List of content
1.1 Introduction ................................................................................................................................ 5
1.1.1 Three groups of research outputs ......................................................................................... 5
1.1.2 Purpose of the quantitative information .............................................................................. 5
1.1.3 Data sources ........................................................................................................................ 5
1.1.4 The selection of bibliometric indicators .............................................................................. 6
1.1.5 Time span of the indicators ................................................................................................. 6
1.1.6 Field categorisation of the research outputs ..................................................................... 6
1.1.7 Types of information and indicators ................................................................................... 6
1.2 A: Characteristics of the field (CR) ........................................................................................... 8
1.3 B: Characteristics of the Research Unit (RU) .......................................................................... 15
1.4 C: Publishing Profile (RU) ....................................................................................................... 17
1.5 D: Citation Impact (RU) .......................................................................................................... 20
1.6 E: Collaboration (RU) .............................................................................................................. 21
1.7 F: Research outputs and activities – statistical data (RU) ........................................................ 22
1.8 G: IPR-related outputs (RU) .................................................................................................... 25

5
1.1 Introduction
1.1.1 Three groups of research outputs
The research outputs are divided in three groups – scholarly outputs, non-traditional scholarly outputs, and IPR-related outputs.
For the scholarly outputs, bibliometric indicators are provided that can be compared within fields across Evaluated Units. The bibliometric indicators are based on bibliographic data that are derived from or can be verified against independently produced bibliographic data sources.
The quantitative information about non-traditional scholarly outputs and IPR-related outputs is based on institutional self-reporting in the national RD&I Information System (IS). In many cases, this information is less easy to verify and to bring into comparable indicators. Nonetheless, this information is important in the evaluation to understand and assess the activities that can be seen as expressed in non-scholarly outputs. These outputs will be listed with numbers in the self-reported categories.
Context information that is needed to understand and assess data on non-traditional scholarly and IPR-related outputs include: a) the self-evaluation report on these outputs and the activities they represent, and b) data to study examples of non-scholarly outputs.
For both the publication-type outputs and other type outputs and activities and IPR-related ones, it is necessary to understand how their types and relative frequencies vary with the field and type of research.
1.1.2 Purpose of the quantitative information
The quantitative information about research outputs is only part of the material provided for the evaluation. The quantitative information is designed to support, not to replace, the qualitative judgement of the panel.
The relative importance of the three groups of outputs – as well as the types of outputs within them – can be expected to vary not only by field of research, but also the different purposes and forms of research.
None of the bibliometric indicators or numbers provided should be used alone. Instead, they should be seen in the context of each other and of other information provided for the evaluation. One reason is that peer review – much more than the performance indicators themselves – allows for overview, understanding, discussion and formative judgements. Another reason is that the indicators can enlighten each other, e.g an indicator of the number of authors per article in a field can enlighten the indicator of the presence of international co-authorship in the same field.
1.1.3 Data sources
The bibliometric indicators covering publication-type research outputs have two complementary data sources:
International: InCites by Thomson Reuters, providing data based on publications indexed for Web of Science in these categories: Articles, Reviews, Proceedings Papers, Letters. The indicators were counted based on Underlying Source Article Data from InCites provided by Thomson Reuters in the middle of year 2014.
National: the Czech RD&I Information System (IS), providing data for publications in the following categories: Articles in peer-reviewed journals (type J); monographs (type B); book chapters (type C - includes Articles in Books and Chapters in Books); Proceedings papers (type D)
The data source for information about other research outputs and activities and IPR-related outputs is the Czech RD&I Information System, which can provide data for outputs in the following categories:
6
Results used by the funding provider, projected into legislation or norm, projected into non-legislative or strategic documents (type H), Research report containing classified information (type V), Certified methodologies, art conservation methodologies, specialized map works (type N), Pilot plant (Zpilot), Verified technology (Ztech), Software (R), Prototypes, Function examples (G), Audiovisual production, electronic documents(A), Conference organization(M), Workshop organization (W), Exhibition organization (E), Other results (O)
IPR-related outputs, i.e. Patents (type P), Plant variety (type Zodru), Animal breed (type Zplem), Utility model, Industrial design (F)
1.1.4 The selection of bibliometric indicators
The selection of the bibliometric indicators for quantitative information about scholarly publications is based on:
The purpose of informing field specific panels in the best possible way
Relevance for the institutional level of evaluation
Well-established international practice in the field
Availability, compatibility and transparency in relation to chosen data sources
Comprehensiveness by also including publications not covered in international data sources, which is important especially in the humanities, the social sciences and the engineering sciences.
1.1.5 Time span of the indicators
The time span for bibliometric indicators, also allowing for time series, is (for an evaluation conducted in 2015):
2009-2013 for publication-based indicators
2009-2012 for citation-based indicators, allowing a minimum of one full year for citing publications to be indexed
1.1.6 Field categorisation of the research outputs
In Web of Science/InCites-based indicators, publications are classified by fields according to the journals they were published in. Thomson Reuters predefines both the underlying journal classification in 251 Web of Science fields and the aggregated OECD field classification used here.
It is important to highlight here, that publication could be classified to more than one Web of Science fields (max 6) and those multi-fields publications are counted once in each field in the field devided indicators (such as A1, A2, A4 - A9, B1).
In RD&I IS-based data, the research outputs are classified in fields as they are reported to the RD&I IS by the institution. The RD&I IS classification is mapped over to the OECD classification.
RD&I IS classification doesn’t exactly fit the OECD classification. There are some OECD fields to which are not coupled any RD&I IS fields.
Not coupled OECD fields:
1.7 Other natural sciences
2.8 Environmental biotechnology
2.10 Nano-technology
6.5 Other humanities
1.1.7 Types of information and indicators
The bibliometric information and indicators presented below are categorised in five main categories. The first category (A) are indicators on country level (Czech Republic); the other four categories are on the level of Research Units.
A: Characteristics of the field (CR)
7
B: Characteristics of the Research Unit (RU)
C: Publishing Profile (RU)
D: Citation Impact (RU)
E: Collaboration (RU)
Citation indicators and collaboration indicators that demand reasonable coverage of the publications in Web of Science will not be applied in fields with more limited coverage.
The first five sections of this report (A to E) focus on the publication-type outputs as defined in Section 1.1.3, above. For these indicators, the total outputs in the time span 2009-2013 (2009-2012 D indicators) have been taken into account.
The last two sections, instead, provide statistical data on all research outputs of the Research Unit, including the publication trends over the years. These data are based on information registered in the Czech RD&I Information System. The sections are:
F: All RD&I Information System registered outputs (RU)
G: IPR-related outputs (RU)
8
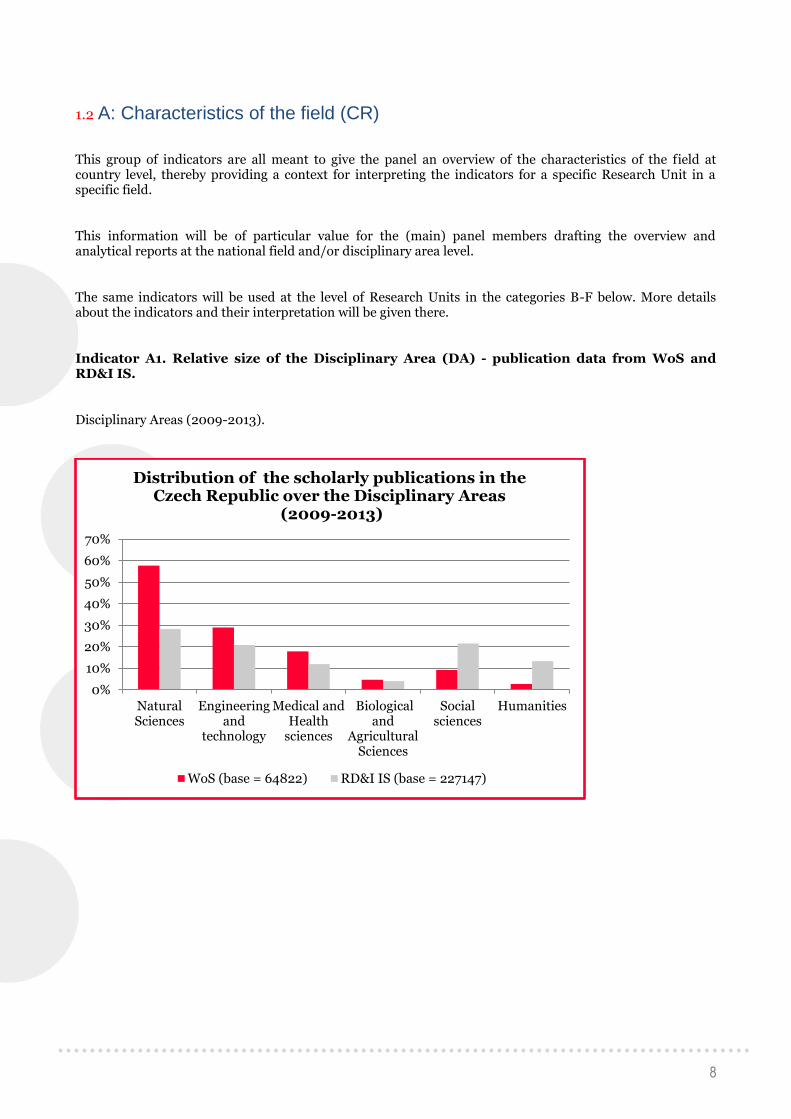
1.2 A: Characteristics of the field (CR)
This group of indicators are all meant to give the panel an overview of the characteristics of the field at country level, thereby providing a context for interpreting the indicators for a specific Research Unit in a specific field.
This information will be of particular value for the (main) panel members drafting the overview and analytical reports at the national field and/or disciplinary area level.
The same indicators will be used at the level of Research Units in the categories B-F below. More details about the indicators and their interpretation will be given there.
Indicator A1. Relative size of the Disciplinary Area (DA) - publication data from WoS and RD&I IS.
Disciplinary Areas (2009-2013).
0%
10%
20%
30%
40%
50%
60%
70%
NaturalSciences
Engineeringand
technology
Medical andHealth
sciences
Biologicaland
AgriculturalSciences
Socialsciences
Humanities
Distribution of the scholarly publications in the Czech Republic over the Disciplinary Areas
(2009-2013)
WoS (base = 64822) RD&I IS (base = 227147)
9
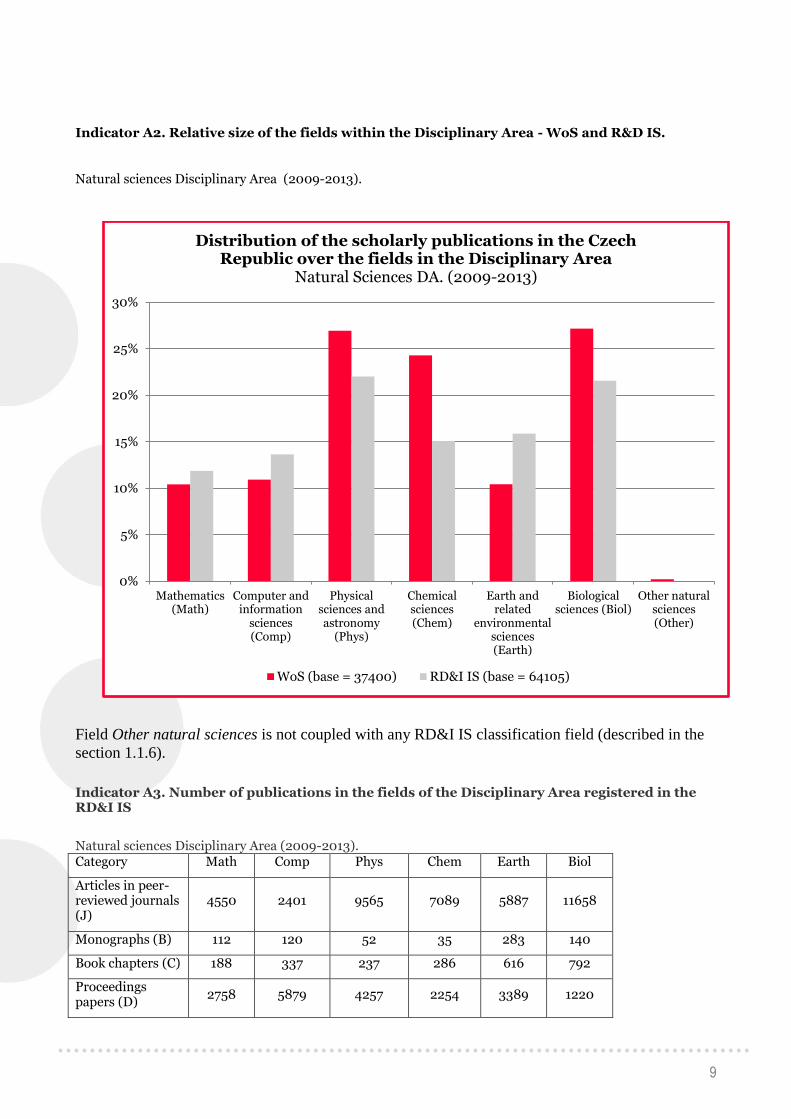
Indicator A2. Relative size of the fields within the Disciplinary Area - WoS and R&D IS.
Natural sciences Disciplinary Area (2009-2013).
Field Other natural sciences is not coupled with any RD&I IS classification field (described in the
section 1.1.6).
Indicator A3. Number of publications in the fields of the Disciplinary Area registered in the RD&I IS
Natural sciences Disciplinary Area (2009-2013). Category Math Comp Phys Chem Earth Biol
Articles in peer-reviewed journals (J)
4550 2401 9565 7089 5887 11658
Monographs (B) 112 120 52 35 283 140
Book chapters (C) 188 337 237 286 616 792
Proceedings papers (D)
2758 5879 4257 2254 3389 1220
0%
5%
10%
15%
20%
25%
30%
Mathematics(Math)
Computer andinformation
sciences(Comp)
Physicalsciences andastronomy
(Phys)
Chemicalsciences(Chem)
Earth andrelated
environmentalsciences(Earth)
Biologicalsciences (Biol)
Other naturalsciences(Other)
Distribution of the scholarly publications in the Czech Republic over the fields in the Disciplinary Area
Natural Sciences DA. (2009-2013)
WoS (base = 37400) RD&I IS (base = 64105)
10
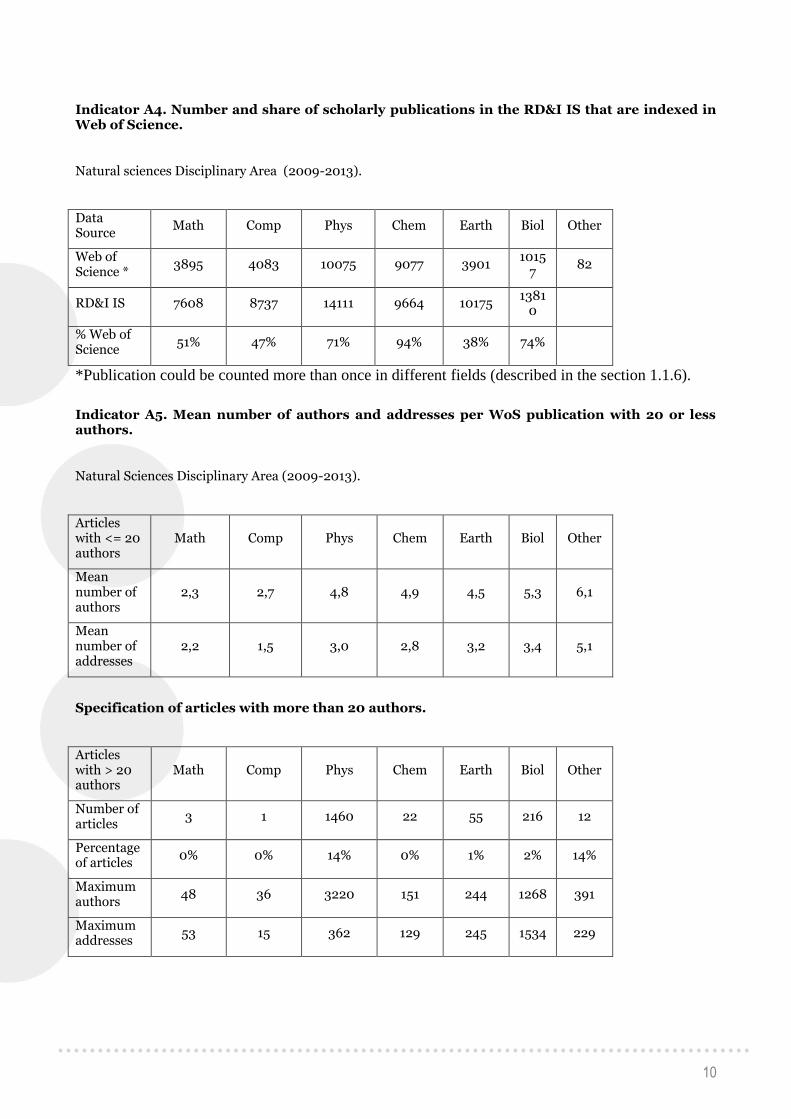
Indicator A4. Number and share of scholarly publications in the RD&I IS that are indexed in Web of Science.
Natural sciences Disciplinary Area (2009-2013).
Data Source
Math Comp Phys Chem Earth Biol Other
Web of Science *
3895 4083 10075 9077 3901 1015
7 82
RD&I IS 7608 8737 14111 9664 10175 1381
0
% Web of Science
51% 47% 71% 94% 38% 74%
*Publication could be counted more than once in different fields (described in the section 1.1.6).
Indicator A5. Mean number of authors and addresses per WoS publication with 20 or less authors.
Natural Sciences Disciplinary Area (2009-2013).
Articles with <= 20 authors
Math Comp Phys Chem Earth Biol Other
Mean number of authors
2,3 2,7 4,8 4,9 4,5 5,3 6,1
Mean number of addresses
2,2 1,5 3,0 2,8 3,2 3,4 5,1
Specification of articles with more than 20 authors.
Articles with > 20 authors
Math Comp Phys Chem Earth Biol Other
Number of articles
3 1 1460 22 55 216 12
Percentage of articles
0% 0% 14% 0% 1% 2% 14%
Maximum authors
48 36 3220 151 244 1268 391
Maximum addresses
53 15 362 129 245 1534 229

11
Indicator A6. Percentage of WoS publications in the most cited WoS journals
Percentage of Web of Science publications in the most cited 10 per cent , 25 per cent, and 50 per cent of the journals in the field (counted from the top by the number of articles in the field), based on Journal Impact Factor in the latest (2013) edition of Journal Citation Reports.
Natural Sciences Disciplinary Area (2009-2013).
Math Comp Phys Chem Earth Biol Other
In the 10% most cited journals
2% 1% 1% 1% 3% 2% 24%
In the 25% most cited journals
12% 10% 9% 9% 8% 9% 26%
In the 50% most cited journals
34% 27% 40% 30% 21% 34% 58%
In the 50% least cited journals
66% 73% 60% 70% 79% 66% 42%
Indicator A7. Mean Field Normalized Citation Impact of Czech WoS publications
Mean Field Normalized Citation Impact, compared to the world average (=1,00) and the EU28 average (=1,00).
Natural sciences Disciplinary Area (2009-2012).
World average 2009 2010 2011 2012
Math 0,71 0,88 0,56 0,81
Comp 0,77 0,79 0,76 1,17
Phys 0,88 0,96 1,05 1,48
Chem 0,83 0,80 0,71 0,73
Earth 0,82 0,85 0,75 0,85
Biol 0,92 0,89 1,02 1,01
Other 2,77 5,84 1,26 2,13
EU28 average 2009 2010 2011 2012
Math 0,67 0,85 0,56 0,75
Comp 0,64 0,71 0,66 0,88
Phys 0,74 0,79 0,87 1,10
Chem 0,77 0,76 0,67 0,68
Earth 0,74 0,74 0,67 0,71
Biol 0,79 0,76 0,85 0,81
Other 1,00 2,25 0,50 0,86
High and oscillating values in the Other natural sciences field are caused by occasionally appearing
highly cited articles from journals Nature and Science which are classified to this field.

12
Indicator A8. Number and percentage of Czech publications in WoS among the most cited
publications.
Number and percentage of Czech WoS publications among the top 10%, and 25% most cited publications (world, EU28).
Natural sciences Disciplinary Area (2009-2012).
World
Number Math Comp Phys Chem Earth Biol Other
10% most cited publications
259 117 798 532 221 533 11
25% most cited publications
815 387 1979 1547 684 1382 19
50% most cited publications
1401 1027 3404 3005 1278 2589 35
50% least cited publications
1694 2388 4541 4116 1857 2787 27
Percentage Math Comp Phys Chem Earth Biol Other
10% most cited publications
8% 3% 10% 7% 7% 10% 18%
25% most cited publications
26% 11% 25% 22% 22% 26% 31%
50% most cited publications
45% 30% 43% 42% 41% 48% 56%
50% least cited publications
55% 70% 57% 58% 59% 52% 44%
EU28
Number Math Comp Phys Chem Earth Biol Other
10% most cited publications
252 121 624 532 192 405 9
25% most cited publications
644 371 1640 1426 571 1068 17
50% most cited publications
1401 1027 3404 3005 1278 2589 35
50% least cited publications
1694 2388 4541 4116 1857 2787 27
Percentage Math Comp Phys Chem Earth Biol Other
10% most cited publications
8% 4% 8% 7% 6% 8% 8%
25% most cited publications
21% 11% 21% 20% 18% 20% 21%
13
50% most cited publications
45% 30% 43% 42% 41% 48% 45%
50% least cited publications
55% 70% 57% 58% 59% 52% 55%
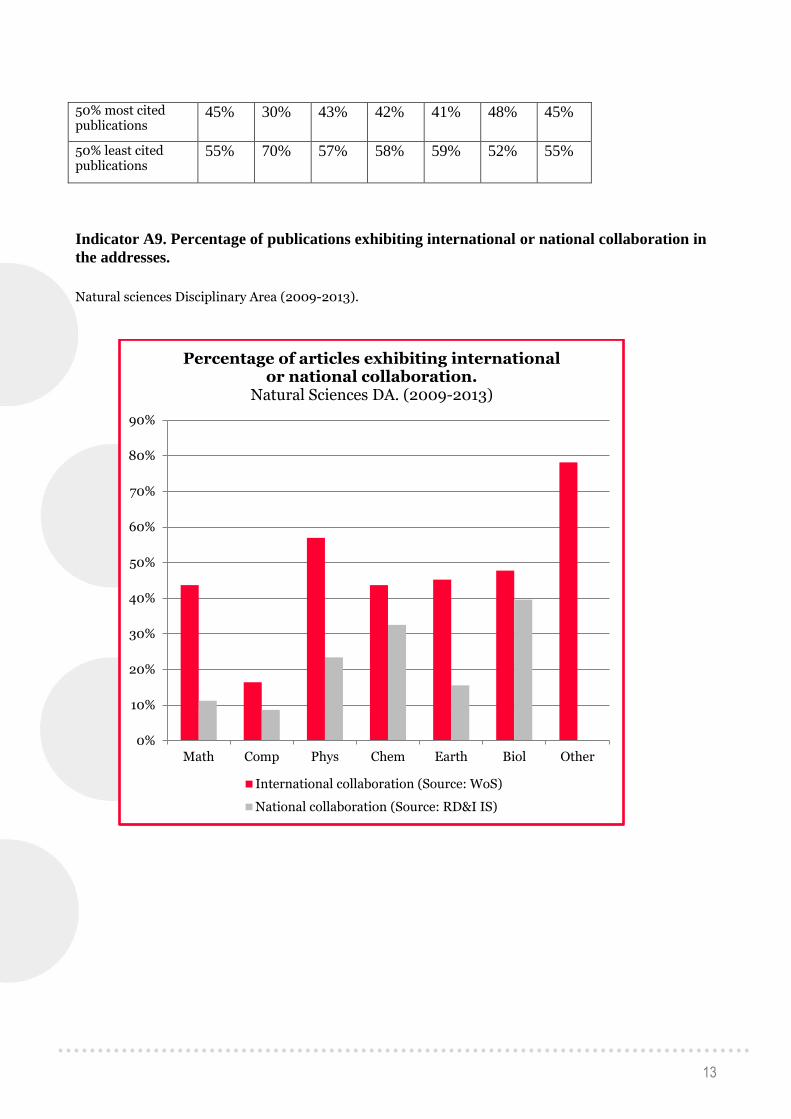
Indicator A9. Percentage of publications exhibiting international or national collaboration in
the addresses.
Natural sciences Disciplinary Area (2009-2013).
0%
10%
20%
30%
40%
50%
60%
70%
80%
90%
Math Comp Phys Chem Earth Biol Other
Percentage of articles exhibiting international or national collaboration.
Natural Sciences DA. (2009-2013)
International collaboration (Source: WoS)
National collaboration (Source: RD&I IS)
14
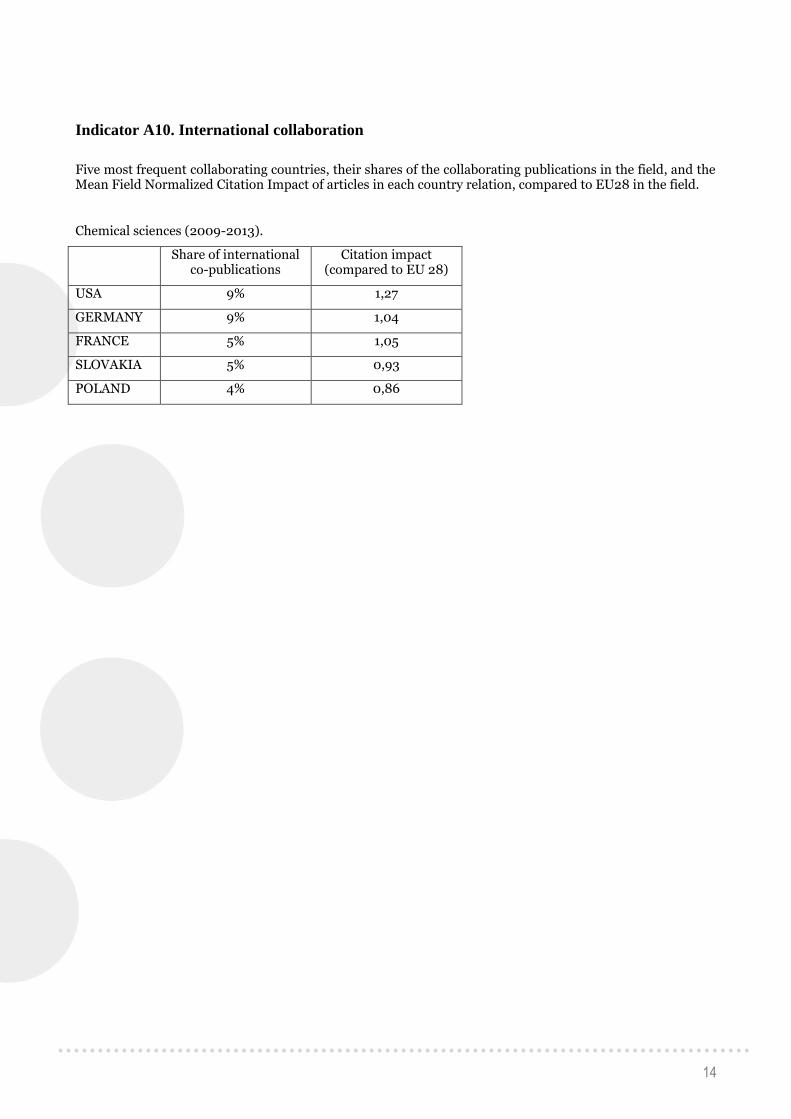
Indicator A10. International collaboration
Five most frequent collaborating countries, their shares of the collaborating publications in the field, and the Mean Field Normalized Citation Impact of articles in each country relation, compared to EU28 in the field.
Chemical sciences (2009-2013).
Share of international
co-publications Citation impact
(compared to EU 28)
USA 9% 1,27
GERMANY 9% 1,04
FRANCE 5% 1,05
SLOVAKIA 5% 0,93
POLAND 4% 0,86

15
1.3 B: Characteristics of the Research Unit (RU) Research Unit: ***
Evaluated Unit: ***
Field of Research: Chemical sciences
Indicator B1. RU publications - percentage share of all Czech scholarly publications in the main fields
RU scholarly publications as a share of all Czech publications in the main fields.
RU (2009-2013).
WoS R&D IS
Field % CZ Count* % R&D IS Count
1,1 Mathematics 0,05% 2
1,2 Computer and information
sciences 0,05% 2 0,07% 6
1,3 Physical sciences and
astronomy 0,20% 20 0,01% 2
1,4 Chemical sciences 2,60% 236 3,65% 353
1,5 Earth and related
environmental sciences 0,51% 20 0,16% 16
1,6 Biological sciences 0,19% 19 0,06% 8
1,7 Other natural sciences
2,1 Civil engineering 0,26% 2
2,2
Electrical engineering,
electronic engineering,
information engineering
0,01% 1
2,3 Mechanical engineering 0,18% 5
2,4 Chemical engineering 2,58% 25 7,42% 111
2,5 Materials engineering 0,58% 30 0,36% 33
2,6 Medical engineering
2,7 Environmental engineering 0,58% 13 0,03% 1
2,8 Environmental
biotechnology 0,47% 4
2,9 Industrial Biotechnology
2.10 Nano-technology 0,19% 2
2,11 Other engineering and
technologies 0,13% 4
3,1 Basic medical research 0,37% 18 0,04% 1
3,2 Clinical medicine 0,04% 3 0,01% 1
3,3 Health sciences 0,12% 2
3,4 Medical biotechnology
3,5 Other medical sciences
0,11% 3
4,1 Agriculture, forestry, and
fisheries
16
4,2 Animal and dairy science
4,3 Veterinary science
4,4 Agricultural biotechnology
4,5 Other agricultural sciences
5,1 Psychology
5,2 Economics and business
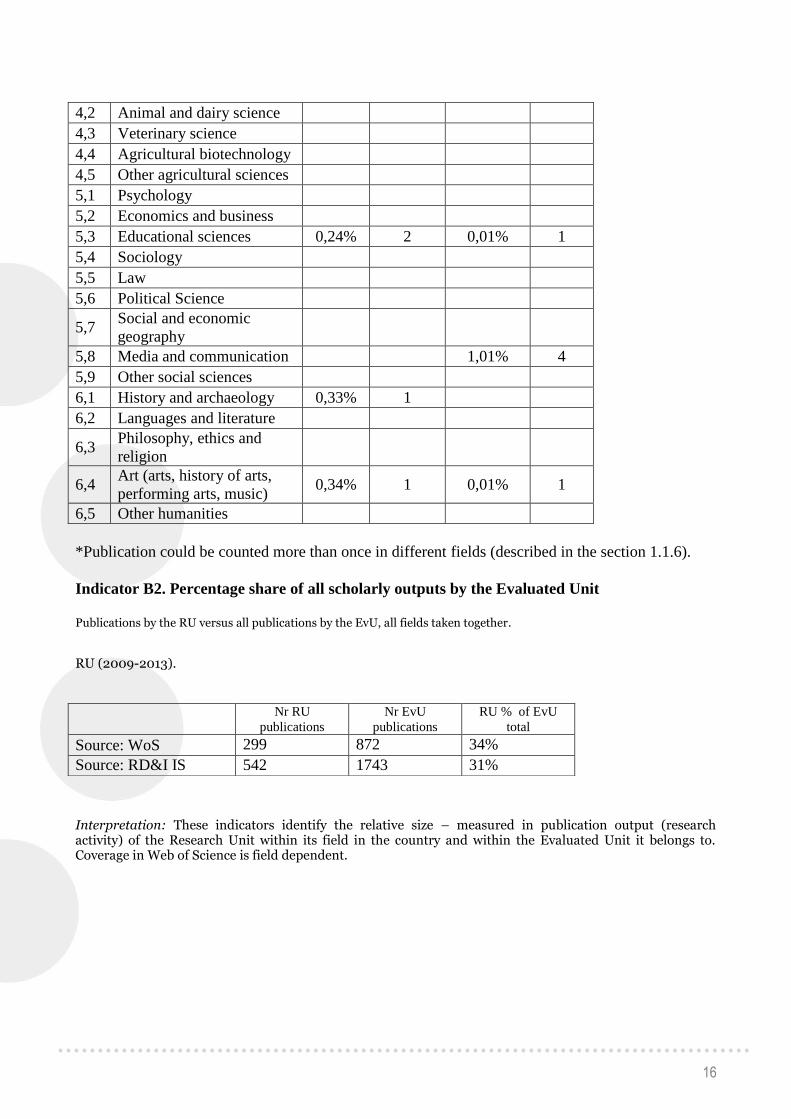
5,3 Educational sciences 0,24% 2 0,01% 1
5,4 Sociology
5,5 Law
5,6 Political Science
5,7 Social and economic
geography
5,8 Media and communication
1,01% 4
5,9 Other social sciences
6,1 History and archaeology 0,33% 1
6,2 Languages and literature
6,3 Philosophy, ethics and
religion
6,4 Art (arts, history of arts,
performing arts, music) 0,34% 1 0,01% 1
6,5 Other humanities
*Publication could be counted more than once in different fields (described in the section 1.1.6).
Indicator B2. Percentage share of all scholarly outputs by the Evaluated Unit
Publications by the RU versus all publications by the EvU, all fields taken together.
RU (2009-2013).
Interpretation: These indicators identify the relative size – measured in publication output (research activity) of the Research Unit within its field in the country and within the Evaluated Unit it belongs to. Coverage in Web of Science is field dependent.
Nr RU
publications
Nr EvU
publications
RU % of EvU
total
Source: WoS 299 872 34%
Source: RD&I IS 542 1743 31%
17
1.4 C: Publishing Profile (RU)
Interpretation: The indicators in this group give an overview of the publishing profile of the Research Unit. This profile should be contextualized with other material provided to the evaluation panel, such as:
The information on the level of the field given in indicator group A
Field and type of research
Mission, size and resources of the Evaluated Unit, as given in the self-evaluation and in other statistical information provided for the evaluation
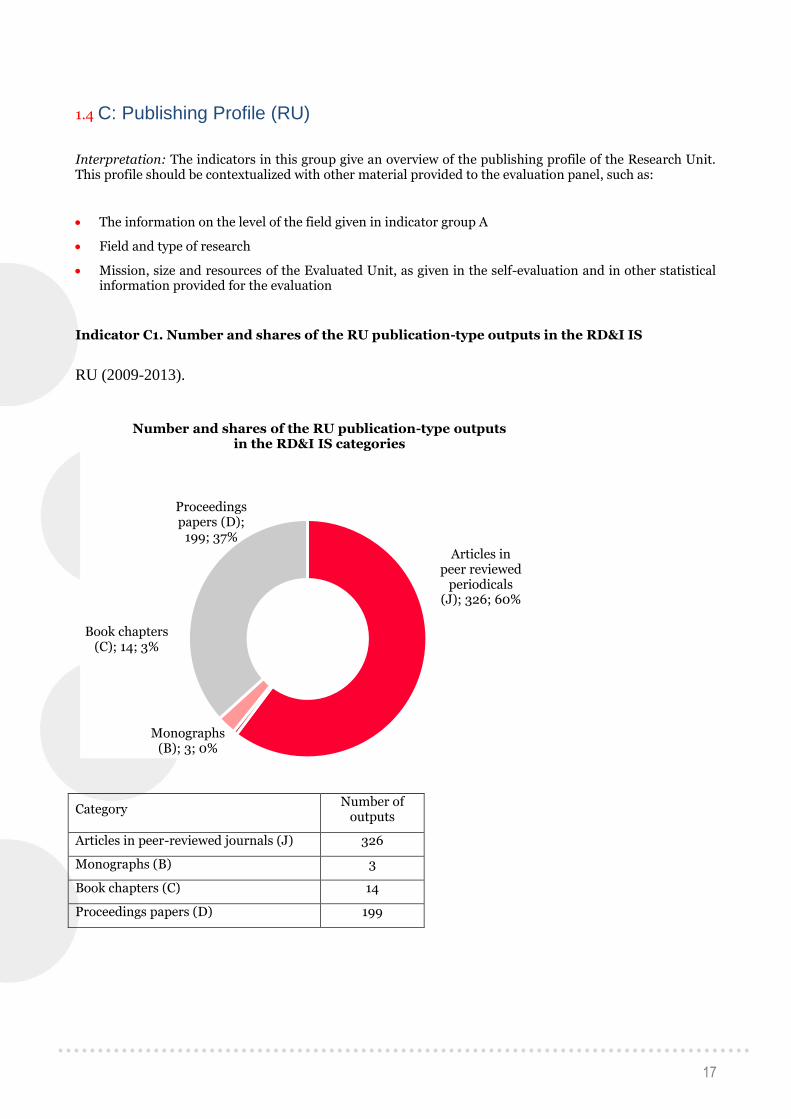
Indicator C1. Number and shares of the RU publication-type outputs in the RD&I IS
RU (2009-2013).
Category Number of
outputs
Articles in peer-reviewed journals (J) 326
Monographs (B) 3
Book chapters (C) 14
Proceedings papers (D) 199
Articles in peer reviewed
periodicals (J); 326; 60%
Monographs (B); 3; 0%
Book chapters (C); 14; 3%
Proceedings papers (D);
199; 37%
Number and shares of the RU publication-type outputs in the RD&I IS categories

18
Indicator C2. Number and shares of RU publications indexed in Web of Science
RU (2009-2013).
Data Source Indicator
Web of Science
(N) 299
RD&I IS (N) 542
Web of Science
(%) 55%
Indicator C3. Mean and median number of authors and institutional affiliations (published addresses) per WoS publication by the RU
Data Source Mean Median
Authors 5,6 5
Addresses 2,9 3
Specification of articles with more than 20 authors.
No articles with more than 20 authors.
Indicator C4. Percentage of WoS publications by the RU in the most cited WoS journals
Percentage of Web of Science publications in the most cited 10 per cent, 25 per cent, and 50 per cent of the journals in the field (counted from the top by the number of articles in the field), based on Journal Impact Factor in the latest (2014) edition of Journal Citation Reports.
RU (2009-2013).
RU publications
In the 10% most cited
journals 3%
In the 25% most cited
journals 17%
In the 50% most cited
journals 44%
In the 50% least cited journals 56%
19
Indicator C5. Number and percentage of RU articles per journal in Web of Science
The listing includes those journals with more than 5 per cent of the total volume of RU articles.
RU (2009-2013).
No journals with more than 5 per cent.
20
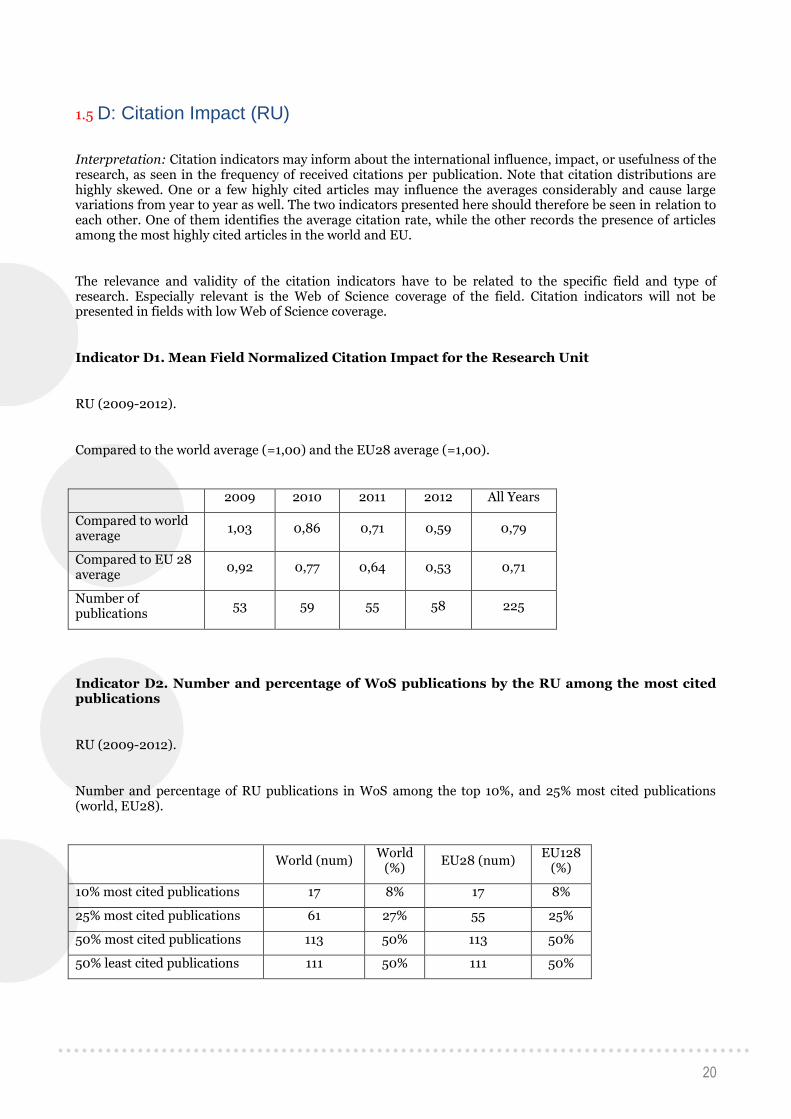
1.5 D: Citation Impact (RU)
Interpretation: Citation indicators may inform about the international influence, impact, or usefulness of the research, as seen in the frequency of received citations per publication. Note that citation distributions are highly skewed. One or a few highly cited articles may influence the averages considerably and cause large variations from year to year as well. The two indicators presented here should therefore be seen in relation to each other. One of them identifies the average citation rate, while the other records the presence of articles among the most highly cited articles in the world and EU.
The relevance and validity of the citation indicators have to be related to the specific field and type of research. Especially relevant is the Web of Science coverage of the field. Citation indicators will not be presented in fields with low Web of Science coverage.
Indicator D1. Mean Field Normalized Citation Impact for the Research Unit
RU (2009-2012).
Compared to the world average (=1,00) and the EU28 average (=1,00).
2009 2010 2011 2012 All Years
Compared to world average
1,03 0,86 0,71 0,59 0,79
Compared to EU 28 average
0,92 0,77 0,64 0,53 0,71
Number of publications
53 59 55 58 225
Indicator D2. Number and percentage of WoS publications by the RU among the most cited publications
RU (2009-2012).
Number and percentage of RU publications in WoS among the top 10%, and 25% most cited publications (world, EU28).
World (num) World
(%) EU28 (num)
EU128 (%)
10% most cited publications 17 8% 17 8%
25% most cited publications 61 27% 55 25%
50% most cited publications 113 50% 113 50%
50% least cited publications 111 50% 111 50%
21
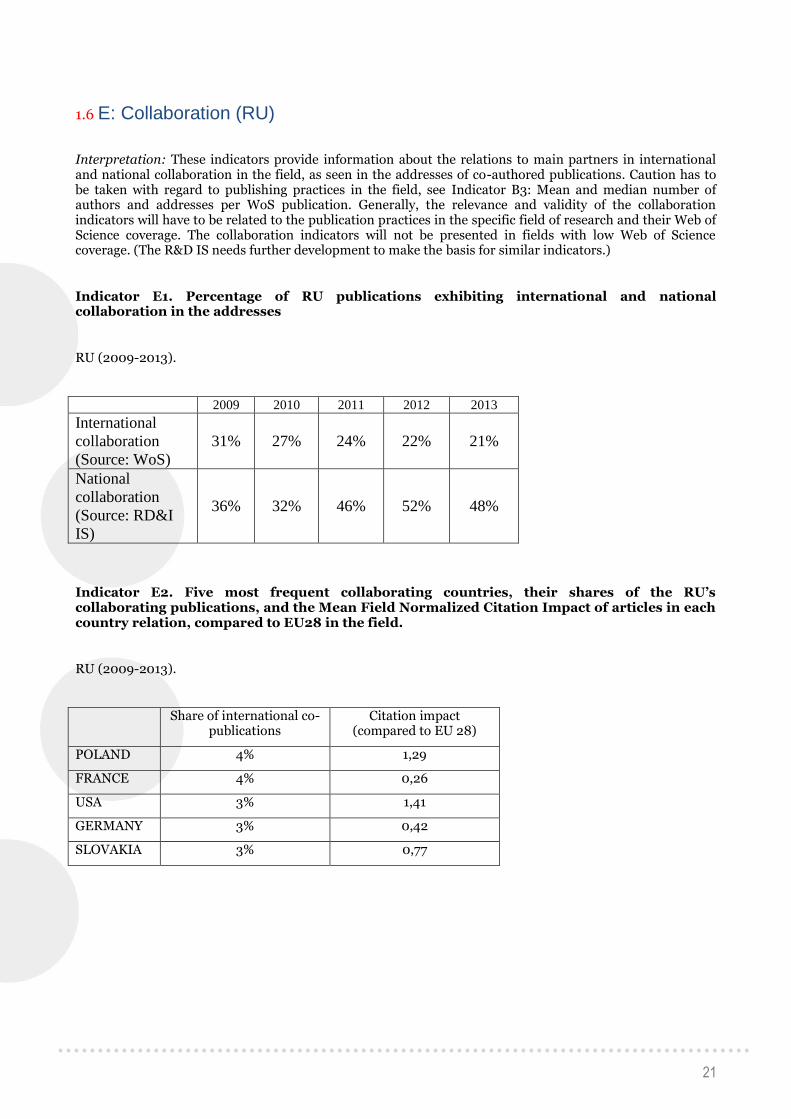
1.6 E: Collaboration (RU)
Interpretation: These indicators provide information about the relations to main partners in international and national collaboration in the field, as seen in the addresses of co-authored publications. Caution has to be taken with regard to publishing practices in the field, see Indicator B3: Mean and median number of authors and addresses per WoS publication. Generally, the relevance and validity of the collaboration indicators will have to be related to the publication practices in the specific field of research and their Web of Science coverage. The collaboration indicators will not be presented in fields with low Web of Science coverage. (The R&D IS needs further development to make the basis for similar indicators.)
Indicator E1. Percentage of RU publications exhibiting international and national collaboration in the addresses
RU (2009-2013).
2009 2010 2011 2012 2013
International
collaboration
(Source: WoS)
31% 27% 24% 22% 21%
National
collaboration
(Source: RD&I
IS)
36% 32% 46% 52% 48%
Indicator E2. Five most frequent collaborating countries, their shares of the RU’s collaborating publications, and the Mean Field Normalized Citation Impact of articles in each country relation, compared to EU28 in the field.
RU (2009-2013).
Share of international co-
publications Citation impact
(compared to EU 28)
POLAND 4% 1,29
FRANCE 4% 0,26
USA 3% 1,41
GERMANY 3% 0,42
SLOVAKIA 3% 0,77

22
1.7 F: Research outputs and activities – statistical data (RU)
Interpretation: the statistical data presented below give the panels a view on the trends in scholarly and non-traditional scholarly outputs during the evaluation period and set the publication profile of the Research Units in the context of the field in the CR. It also provides information on the potential reach of the journals in which the articles are published (national versus international), based upon the databases in which the journals are registered.
Indicator F1: Research outputs by the RU and their distribution over the years (raw data)
RU (2009-2013).
Output type 2009 2010 2011 2012 2013 All
years
Article in a periodical (J) 60 72 61 70 63 326
Monographs and books
(B) 0 0 1 2 0 3
Book chapter (C.) 0 6 1 6 1 14
Conference proceedings /
Article in proceedings (D) 54 49 37 39 20 199
Results used by the
funding provider, i.e. into
legislation or norm, into
non-legislative or strategic
documents (H)
0 0 0 0 0 0
Research report containing
classified information (V) 0 0 0 0 0 0
Certified methodologies,
art conservation
methodologies,
specialized map works (N)
0 0 0 0 0 0
Pilot plant (Zpilot) 0 0 0 0 0 0
Verified technology
(Ztech) 1 2 4 6 0 13
Software (R) 1 3 1 0 2 7
Prototypes, Function
examples (G) 0 0 3 0 0 3
Audiovisual production,
electronic documents(A) 1 1 0 0 0 2
Conference
organization(M) 2 0 0 2 1 5
Workshop organization
(W) 0 1 2 0 1 4
Exhibition organization
(E) 0 0 0 0 0 0
Other results (O) 0 0 0 0 0 0
23
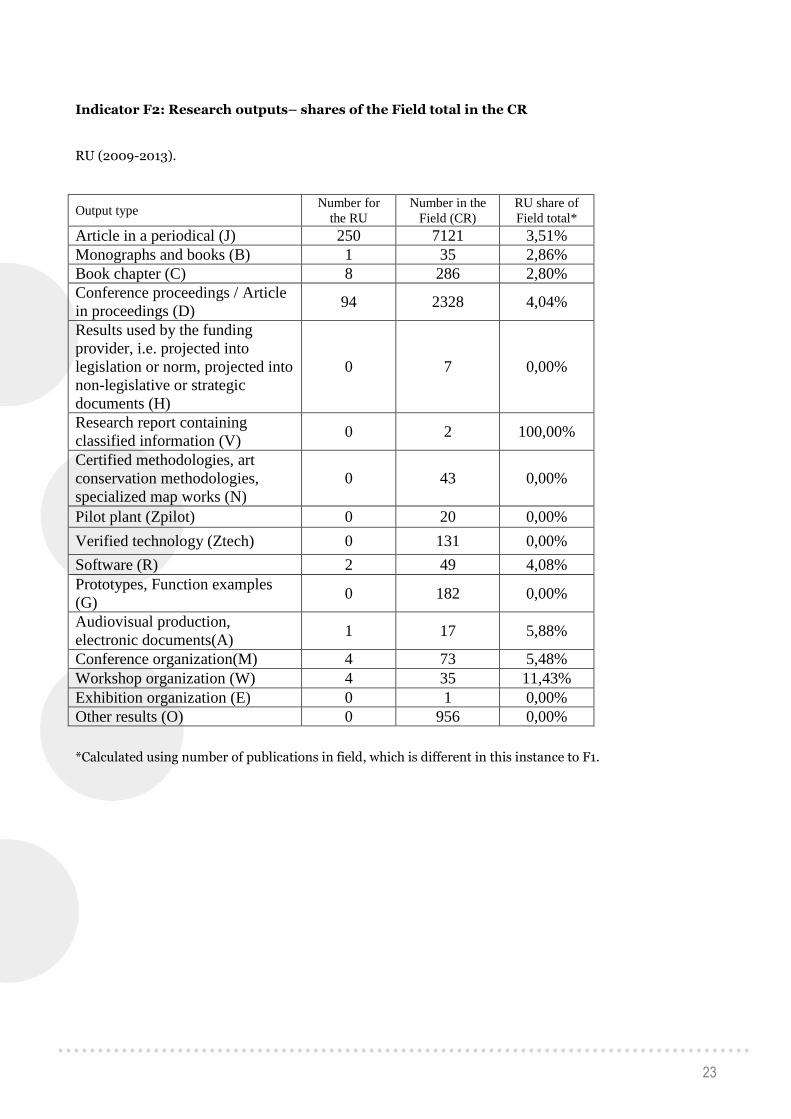
Indicator F2: Research outputs– shares of the Field total in the CR
RU (2009-2013).
Output type Number for
the RU Number in the
Field (CR)
RU share of
Field total*
Article in a periodical (J) 250 7121 3,51%
Monographs and books (B) 1 35 2,86%
Book chapter (C) 8 286 2,80%
Conference proceedings / Article
in proceedings (D) 94 2328 4,04%
Results used by the funding
provider, i.e. projected into
legislation or norm, projected into
non-legislative or strategic
documents (H)
0 7 0,00%
Research report containing
classified information (V) 0 2 100,00%
Certified methodologies, art
conservation methodologies,
specialized map works (N)
0 43 0,00%
Pilot plant (Zpilot) 0 20 0,00%
Verified technology (Ztech) 0 131 0,00%
Software (R) 2 49 4,08%
Prototypes, Function examples
(G) 0 182 0,00%
Audiovisual production,
electronic documents(A) 1 17 5,88%
Conference organization(M) 4 73 5,48%
Workshop organization (W) 4 35 11,43%
Exhibition organization (E) 0 1 0,00%
Other results (O) 0 956 0,00%
*Calculated using number of publications in field, which is different in this instance to F1.
24
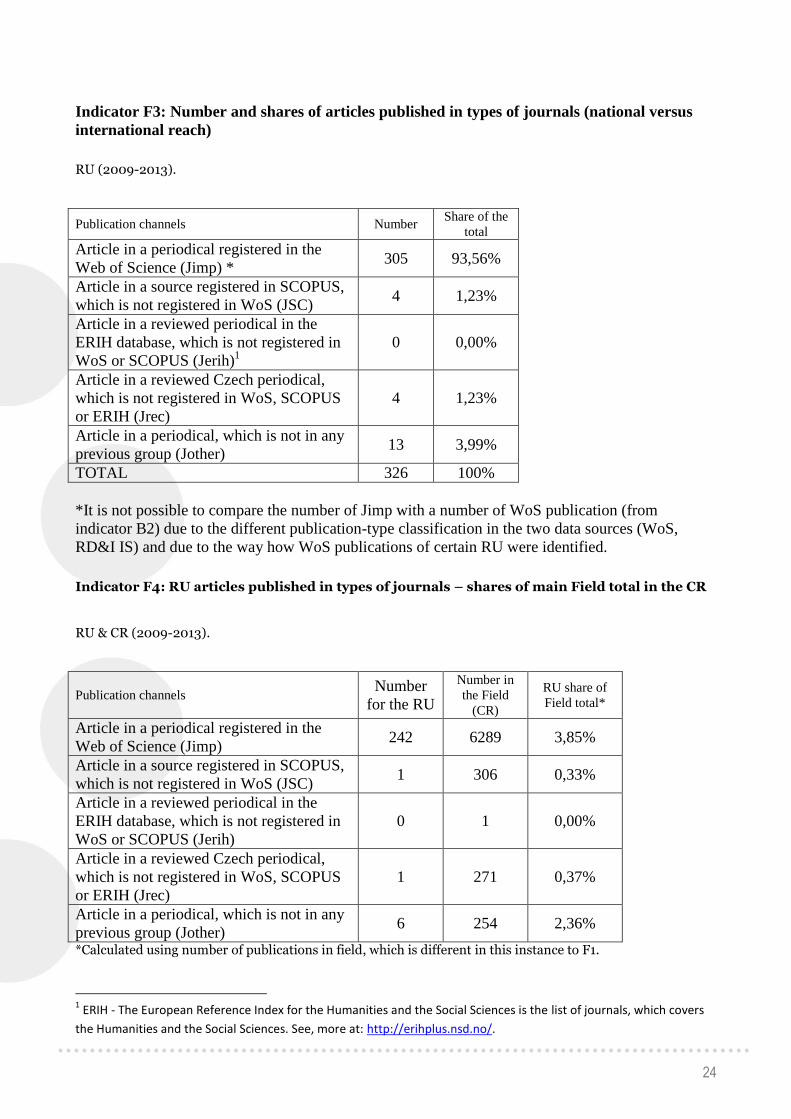
Indicator F3: Number and shares of articles published in types of journals (national versus
international reach)
RU (2009-2013).
Publication channels Number Share of the
total
Article in a periodical registered in the
Web of Science (Jimp) * 305 93,56%
Article in a source registered in SCOPUS,
which is not registered in WoS (JSC) 4 1,23%
Article in a reviewed periodical in the
ERIH database, which is not registered in
WoS or SCOPUS (Jerih)1
0 0,00%
Article in a reviewed Czech periodical,
which is not registered in WoS, SCOPUS
or ERIH (Jrec)
4 1,23%
Article in a periodical, which is not in any
previous group (Jother) 13 3,99%
TOTAL 326 100%
*It is not possible to compare the number of Jimp with a number of WoS publication (from
indicator B2) due to the different publication-type classification in the two data sources (WoS,
RD&I IS) and due to the way how WoS publications of certain RU were identified.
Indicator F4: RU articles published in types of journals – shares of main Field total in the CR
RU & CR (2009-2013).
Publication channels Number
for the RU
Number in
the Field
(CR)
RU share of
Field total*
Article in a periodical registered in the
Web of Science (Jimp) 242 6289 3,85%
Article in a source registered in SCOPUS,
which is not registered in WoS (JSC) 1 306 0,33%
Article in a reviewed periodical in the
ERIH database, which is not registered in
WoS or SCOPUS (Jerih)
0 1 0,00%
Article in a reviewed Czech periodical,
which is not registered in WoS, SCOPUS
or ERIH (Jrec)
1 271 0,37%
Article in a periodical, which is not in any
previous group (Jother) 6 254 2,36%
*Calculated using number of publications in field, which is different in this instance to F1.
1 ERIH - The European Reference Index for the Humanities and the Social Sciences is the list of journals, which covers
the Humanities and the Social Sciences. See, more at: http://erihplus.nsd.no/.
25
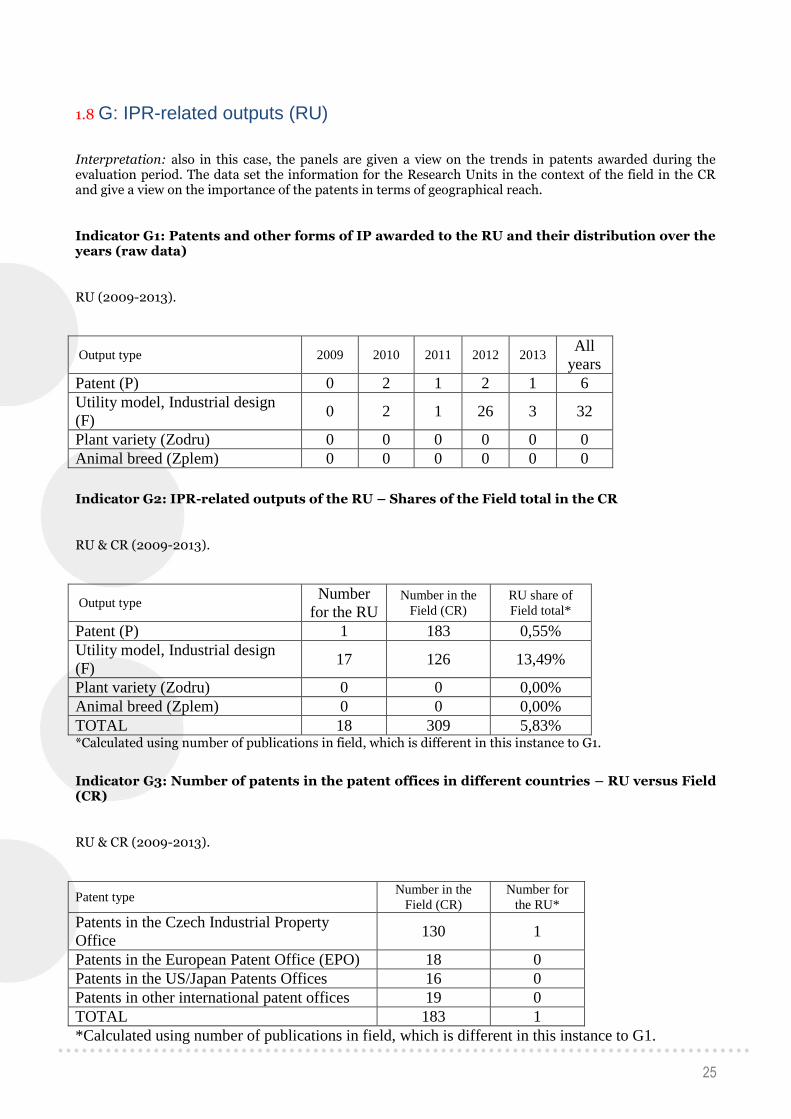
1.8 G: IPR-related outputs (RU)
Interpretation: also in this case, the panels are given a view on the trends in patents awarded during the evaluation period. The data set the information for the Research Units in the context of the field in the CR and give a view on the importance of the patents in terms of geographical reach.
Indicator G1: Patents and other forms of IP awarded to the RU and their distribution over the years (raw data)
RU (2009-2013).
Output type 2009 2010 2011 2012 2013 All
years
Patent (P) 0 2 1 2 1 6
Utility model, Industrial design
(F) 0 2 1 26 3 32
Plant variety (Zodru) 0 0 0 0 0 0
Animal breed (Zplem) 0 0 0 0 0 0
Indicator G2: IPR-related outputs of the RU – Shares of the Field total in the CR
RU & CR (2009-2013).
Output type Number
for the RU Number in the
Field (CR)
RU share of
Field total*
Patent (P) 1 183 0,55%
Utility model, Industrial design
(F) 17 126 13,49%
Plant variety (Zodru) 0 0 0,00%
Animal breed (Zplem) 0 0 0,00%
TOTAL 18 309 5,83% *Calculated using number of publications in field, which is different in this instance to G1.
Indicator G3: Number of patents in the patent offices in different countries – RU versus Field (CR)
RU & CR (2009-2013).
Patent type Number in the
Field (CR)
Number for
the RU*
Patents in the Czech Industrial Property
Office 130 1
Patents in the European Patent Office (EPO) 18 0
Patents in the US/Japan Patents Offices 16 0
Patents in other international patent offices 19 0
TOTAL 183 1
*Calculated using number of publications in field, which is different in this instance to G1.
Pilotní ověření návrhu nové metodiky hodnocení výzkumných organizací
Samostatný doplňující dokument 5
Příklad bibliometrické zprávy
Vydává Ministerstvo školství, mládeže a tělovýchovy, Karmelitská 7, Praha 1
Individuální projekt národní pro oblast terciárního vzdělávání, výzkumu a vývoje:
Efektivní systém hodnocení a financování výzkumu, vývoje a inovací (IPN Metodika)
www.metodika.reformy-msmt.cz
Praha 2015