Embed Size (px)
Citation preview

Designing Ranavirus Surveillance Studies
University of TennesseeCenter for Wildlife Health
Department of Forestry, Wildlife and Fisheries
Matthew J. Gray
Outline
III.Amphibian Surveillance Example
• Importance of “Aseptic” Sampling
I. Uses and Biases of Surveillance Data
• What are the limitations?
II. Sample Design and Required Sample Size
IV. Disinfecting Procedures
Part One
Part Two
Part Three

Goal of Surveillance
To detect a pathogen/disease or obtain an unbiased estimate of pathogen/disease
prevalence (or incidence) in a population
Pathogen Prevalence
An estimate of the proportion of individuals in a population that are infected with a
pathogenInfection Disease
Challenge Studies:
Background Levels
Incidence
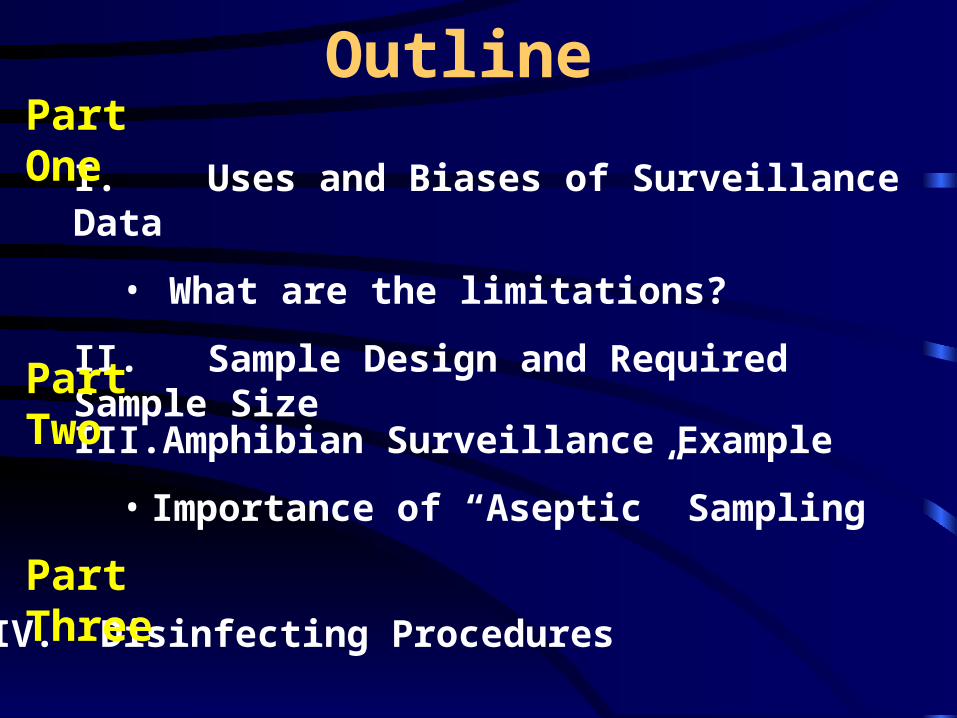
Detection Biases
Dead vs. Morbid vs. Health
Vegetation
Water Depth
Seasonality
Sample Frequency?
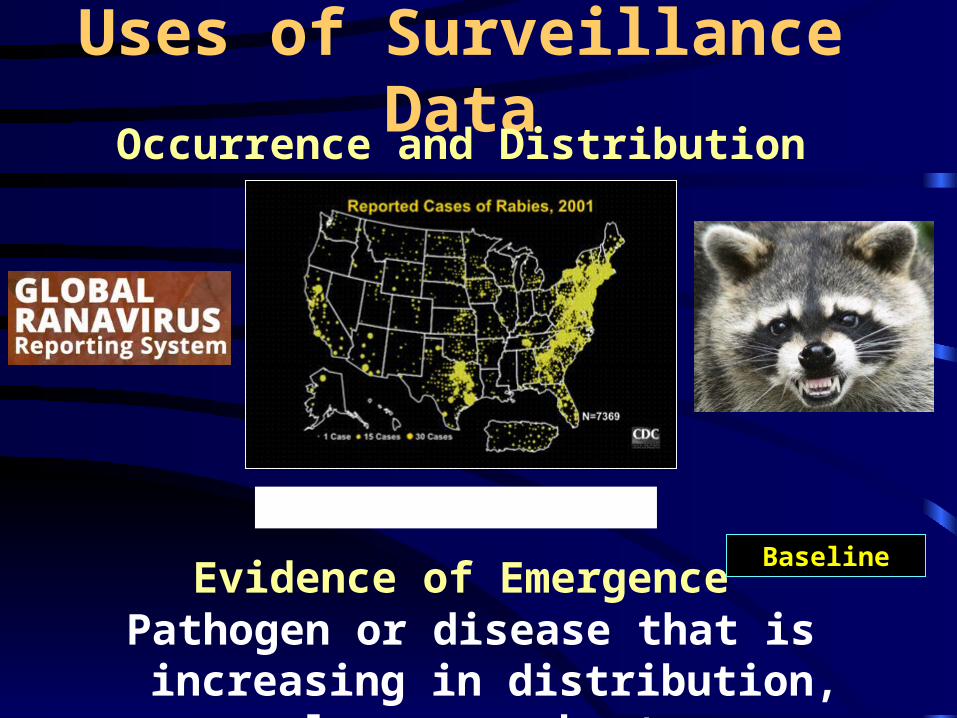
Uses of Surveillance DataOccurrence and Distribution
Evidence of EmergencePathogen or disease that is increasing in
distribution, prevalence, or host range
Baseline
http://www.bd-maps.net/

Uses of Surveillance Data
Evidence of Hotspots
Identification of Mechanisms of Emergence
Elevated?
$$
Population Effects?

Uses of Surveillance DataDisease Intervention Strategies
1. Transmission: DD
2. Distribution expansion
3. Stressors
Interrupt Host-Pathogen Cycle
Reduce Stressors
OIE: Routes of Entry4. Novel
(Introduced) Isolate

Surveillance Designs
Random Sampling
All individuals or surveillance locations have an equal
probability of being sampled
Random Numbers Table or Programs
Collecting Unbiased, Representative Sample
1) Sample all captured individuals
2) Sample up to n captured individuals
3) Randomly select individuals from sample of n captured individuals
Avoid Systematic or Haphazard Sampling
Objective?

Detect a Pathogen
Estimating Required Sample Size
•Assumed Pathogen Prevalence Level (APPL)
•Estimated Host Population Size
•Confidence in detection (95%)
Information Needed
501002505002000>100,000
202325262730
354550556060
5075110130145150
Population Size 10% APPL 5% APPL 2% APPL
(Amos 1985, Thoesen 1994)
epiR (epi.detectsize)

Precise Estimate of Prevalence
Estimating Required Sample Size
n p pd
( )
.1
1 962
Prevalence from a previous study
d = error in estimation
Zα/2 =1.96
(95% confidence)
p =
“Error in Estimation” is the amount of error you are willing to tolerate in your estimate of prevalence
p = 85%
Error = 5%
n
( . )( . )( . )
.0 85 0 15
1 96
0 05196
2
p = 85%
Error = 10%p = unknown
Error = 10%
n
( . )( . )( . )
.0 85 0 15
1 96
0 1049
2
n
( . )( . )
.0 25
1 96
0 1096
2
What happens if estimation error increases?
What happens if prevalence is near 0.5?0.01< P(1-p) < 0.25
Two Proportions

Wildlife Surveillance:An Amphibian (Ranavirus) Example
University of Tennessee 1Center for Wildlife Health
2CVM Department of Pathobiology
Matthew J. Gray1 and Debra L. Miller1,2

Enclosure (Pipe) Sampling
Count Number of Dips
Dip until No Larvae Captured after 10 dips
Is probability of transmission
affected?

Co-housing Animals
Mean = 0.8 – 0.9 contacts/min for 40 tadpoles/m2
(10 tadpoles per 5-gal [19 L] bucket)
Uniform Contact = 9 Minutes
10, 20, 40% X
15, 30, 60 min
What about gloves?
Ranavirus Example
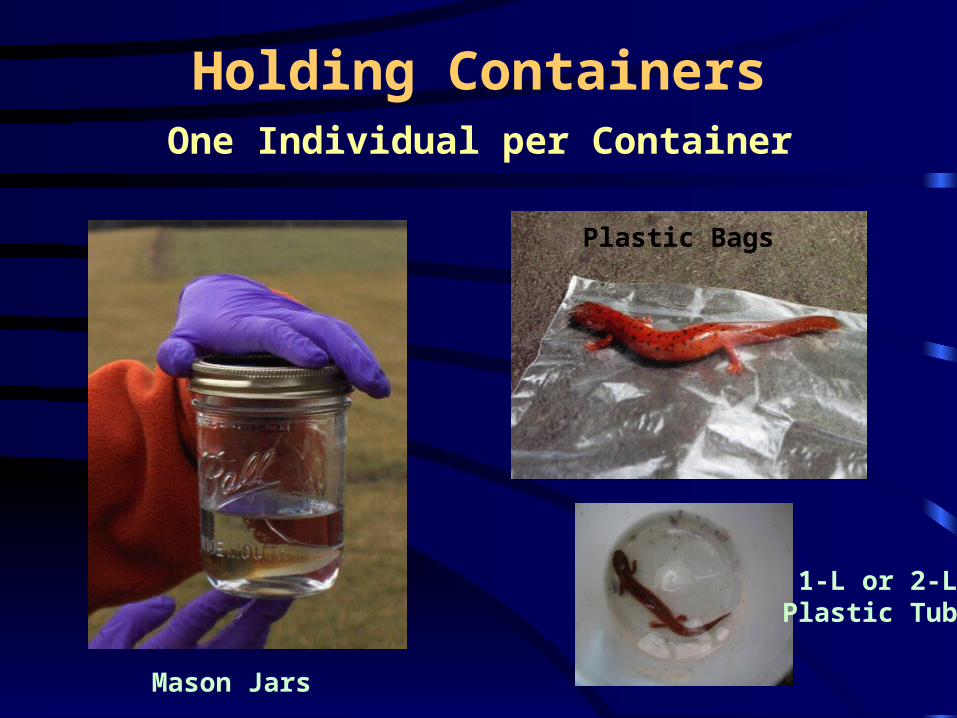
Holding ContainersOne Individual per Container
Plastic Bags
1-L or 2-LPlastic Tubs
Mason Jars

Area Searches
Search under Cover Objects
Record Time and Observers: CPU
Return to Approximate Capture Location

Aseptic Processing Station
People that collect do
NOT process!!

Aseptic Processing StationStation 1
ID Rinsed & Labeled

Weigh SVL
Aseptic Processing StationStation 2

Swabs
Aseptic Processing StationStation 3

Tail Clip
Data Recording
Aseptic Processing StationStations 4 and 5

Aseptic Processing StationSample Storage
90% EtOH or Dry Ice

Aseptic Processing StationStation 6
Releasing or Collecting Individuals

Collecting Additional Data
Water Quality
Vegetation
Apparent Stressors

Take the Opportunity to Instruct

Matt Gray, Debra Miller, and Amanda DuffusDiseases, Pathogens and Parasites Task Team
Biosecurity Precautions:Disinfecting Procedures

Wear Disposable Gloves
Gloves Rinsed with Distilled H2OGreer et al. (2009)
Latex Vinyl
Nitrile
$12/box of 100

Disinfecting EquipmentScrape Mud and Scrub

Disinfecting EquipmentSpray Bottle or Immersion
•Bleach >4%•EtOH >70%•Virkon >1%
•Nolvasan >0.75%
Johnson et al. (2003), Bryan et al. (2009), Gold et al. (2013)
$50/ bottle

Amphibian Biosecurity References
www.separc.org
Dodd, C. K., editor. 2009. Amphibian Ecology and Conservation: A handbook of techniques. Oxford University Press, UK.
ISBN 9780199541188
Pessier, A.P. and J.R. Mendelson (eds.). 2010.
Miller et al. (2015)