Embed Size (px)
Citation preview
1
Reader Analytics
presented by
Andrew Rhomberg
founder
©Antonio Roselló
Part I
Reader
Analytics
Why ?©Li Dandan
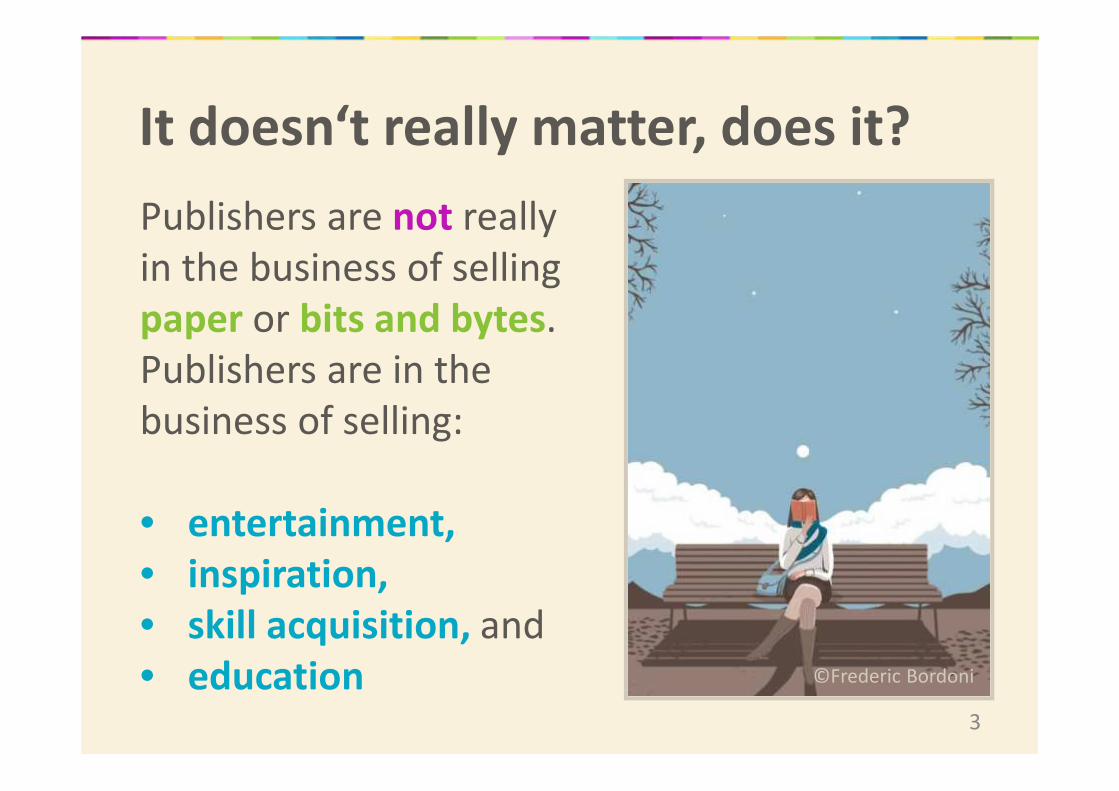
It doesn‘t really matter, does it?
3
Publishers are not really
in the business of selling
paper or bits and bytes.
Publishers are in the
business of selling:
• entertainment,
• inspiration,
• skill acquisition, and
• education ©Frederic Bordoni
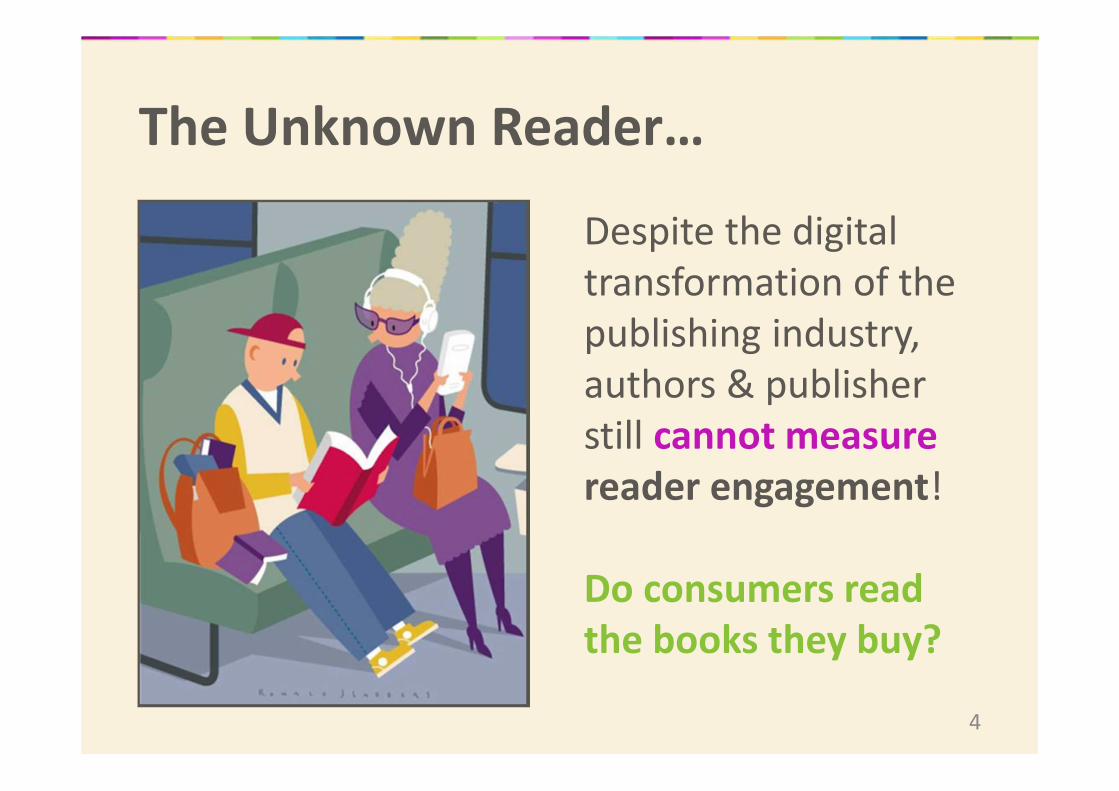
The Unknown Reader…
4
Despite the digital
transformation of the
publishing industry,
authors & publisher
still cannot measure
reader engagement!
Do consumers read
the books they buy?
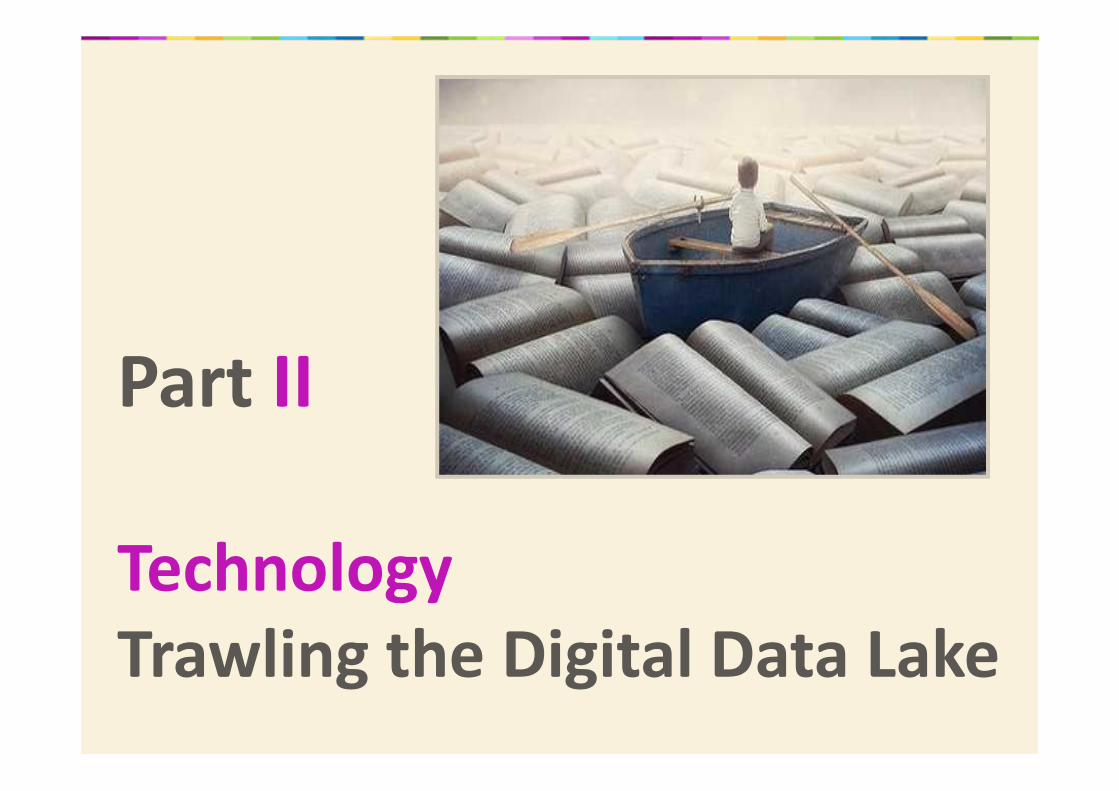
Part II
Technology
Trawling the Digital Data Lake
6
Amazon, Apple, Google and platform operators
collect vast amounts of reading app/device data,
but don‘t share this with publishers.
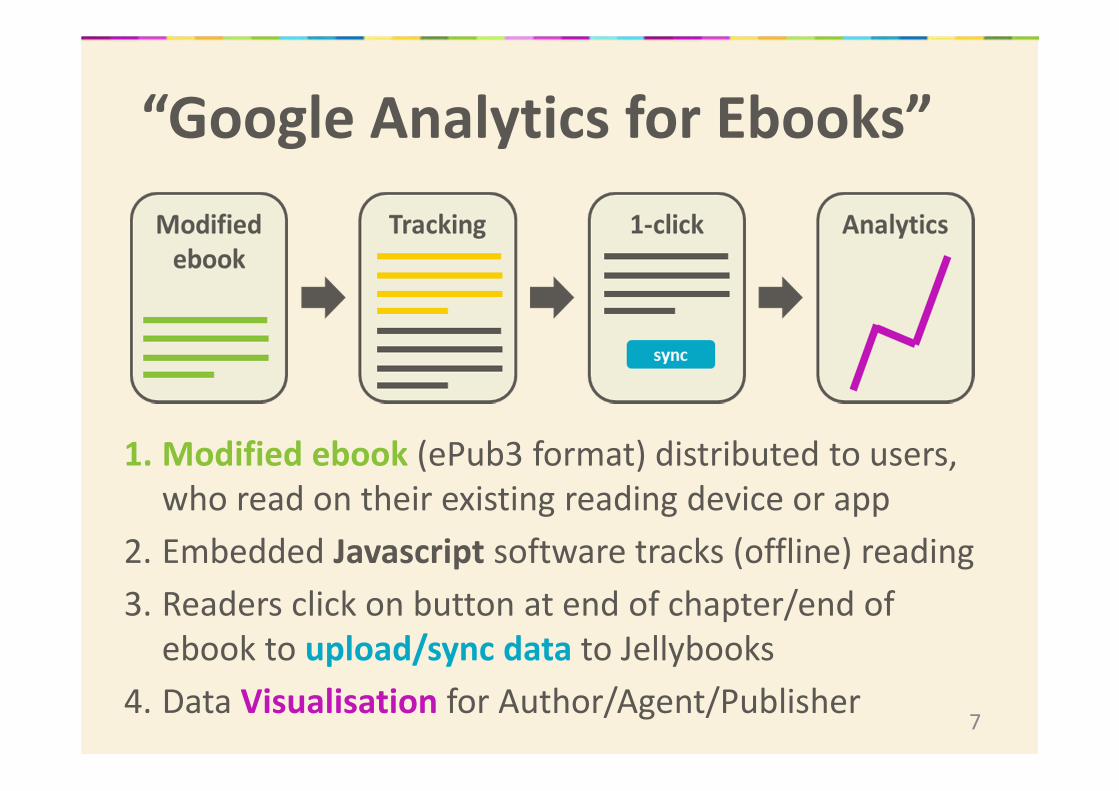
“Google Analytics for Ebooks”
7
1. Modified ebook (ePub3 format) distributed to users,
who read on their existing reading device or app
2. Embedded Javascript software tracks (offline) reading
3. Readers click on button at end of chapter/end of
ebook to upload/sync data to Jellybooks
4. Data Visualisation for Author/Agent/Publisher
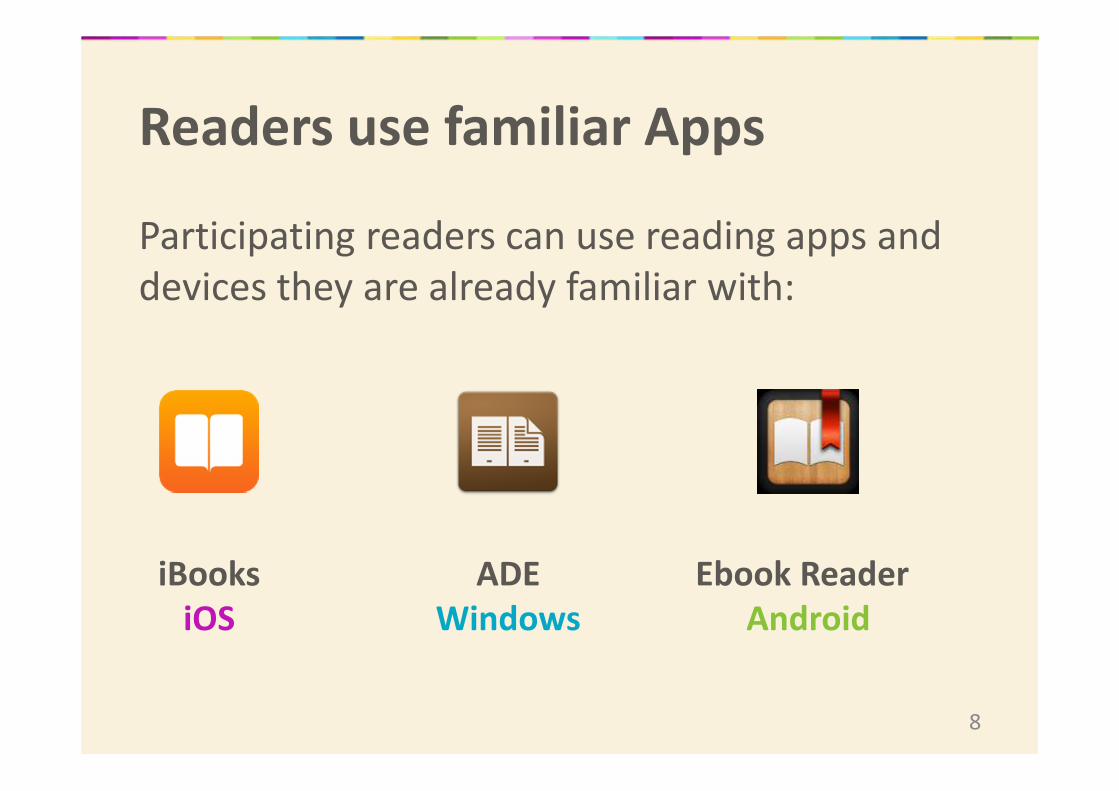
Readers use familiar Apps
Participating readers can use reading apps and
devices they are already familiar with:
8
iBooks
iOS
ADE
Windows
Ebook Reader
Android
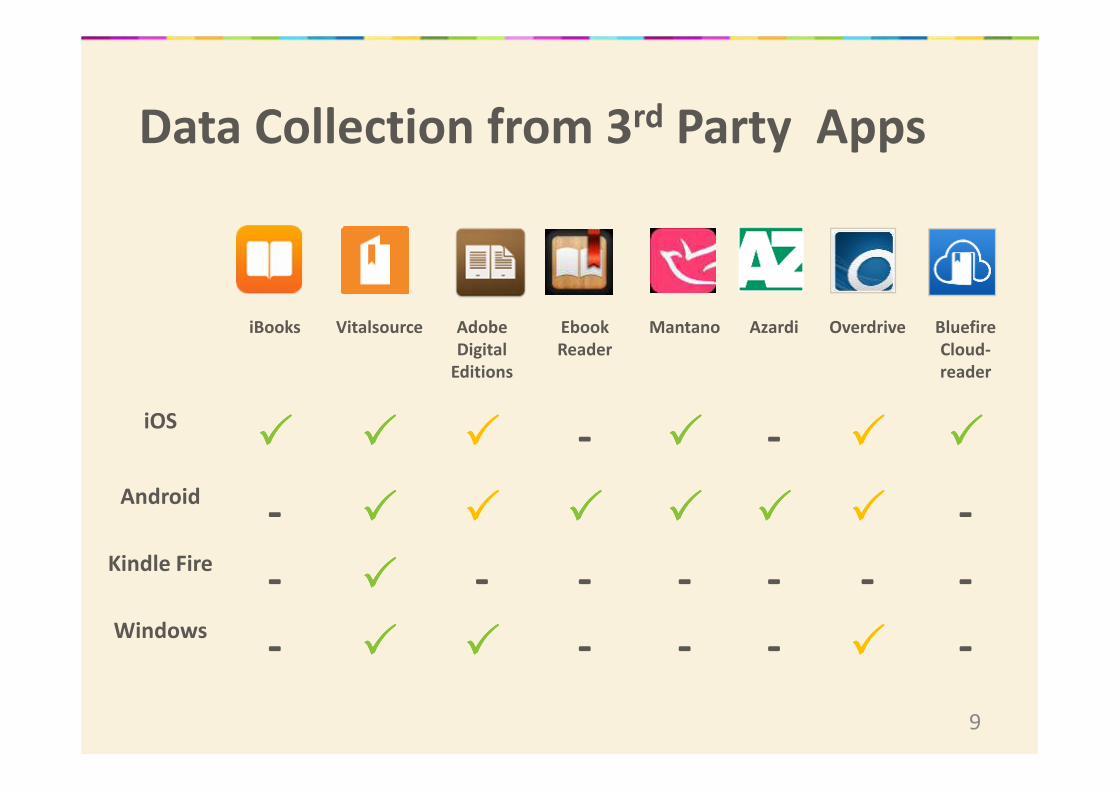
Data Collection from 3rd Party Apps
9
iBooks Vitalsource Adobe
Digital
Editions
Ebook
Reader
Mantano Azardi Overdrive Bluefire
Cloud-
reader
iOS���� ���� ���� - ���� - ���� ����
Android- ���� ���� ���� ���� ���� ���� -
Kindle Fire- ���� - - - - - -
Windows- ���� ���� - - - ���� -
10
3
=
HTML 5 + CSS 3 + JSA key feature of ePub 3 is the support for Javascript,
as well as HTML5 support for offline storage of data.
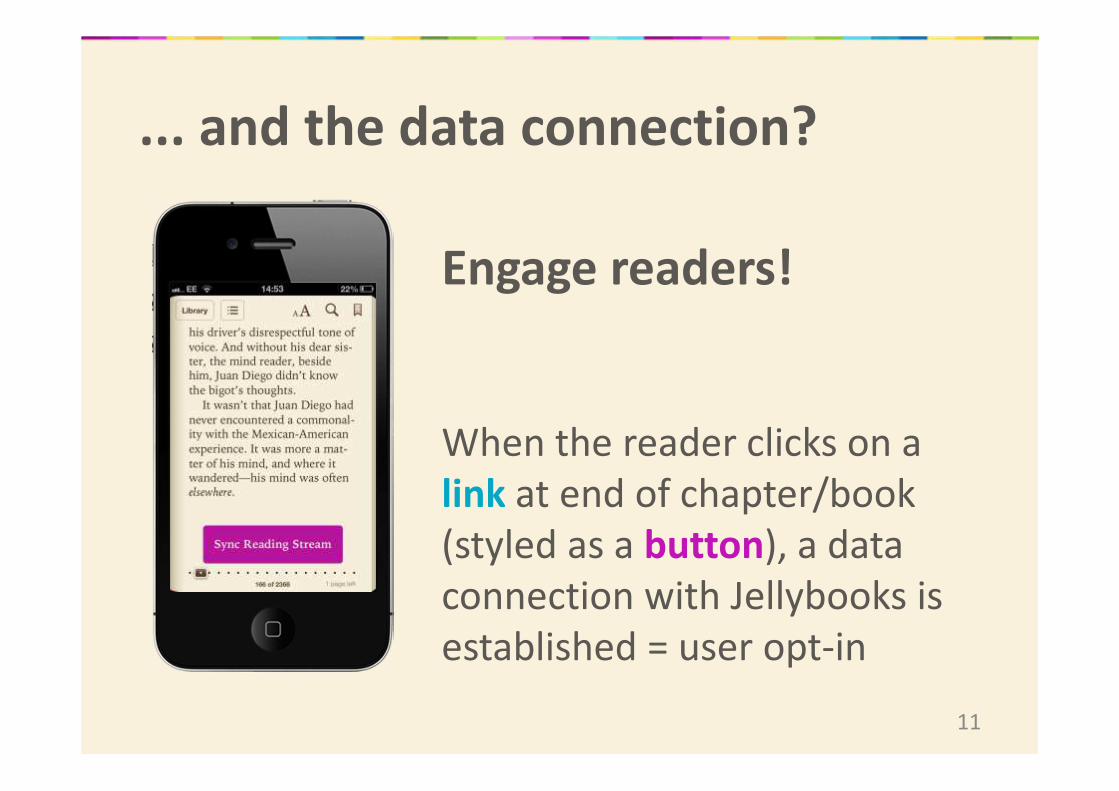
... and the data connection?
Engage readers!
When the reader clicks on a
link at end of chapter/book
(styled as a button), a data
connection with Jellybooks is
established = user opt-in
11
Part III
Tansparency
User in Control
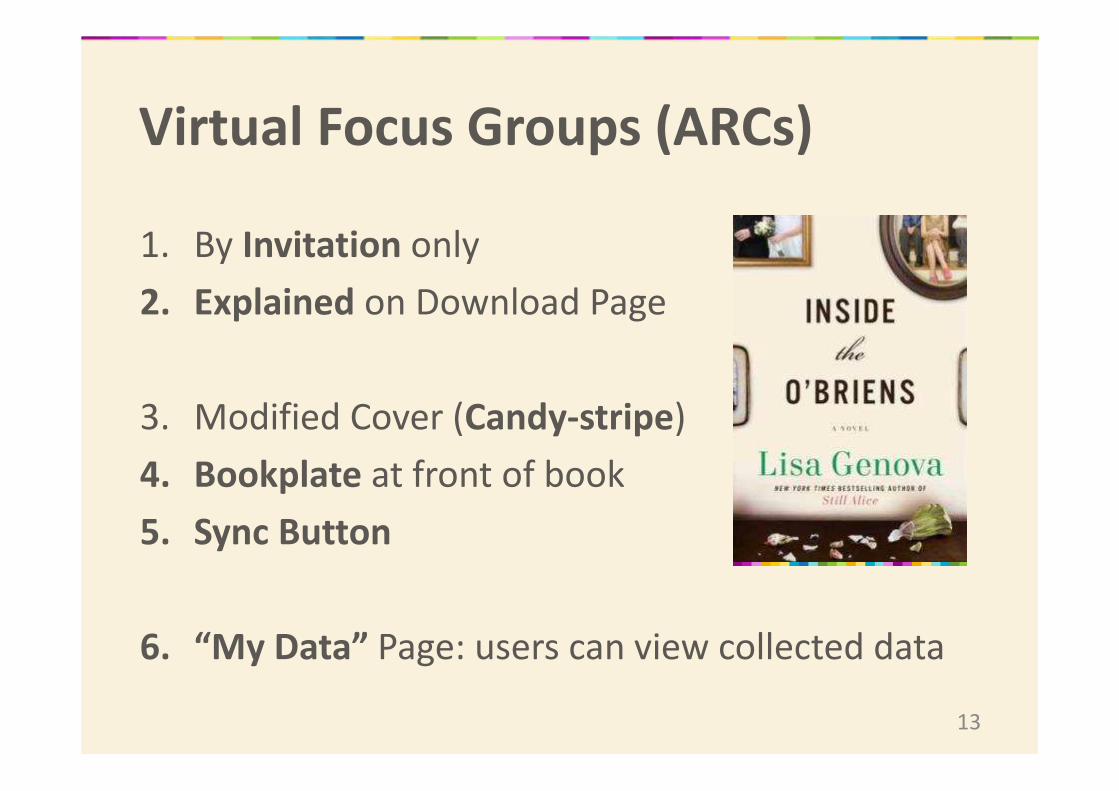
Virtual Focus Groups (ARCs)
1. By Invitation only
2. Explained on Download Page
3. Modified Cover (Candy-stripe)
4. Bookplate at front of book
5. Sync Button
6. “My Data” Page: users can view collected data
13
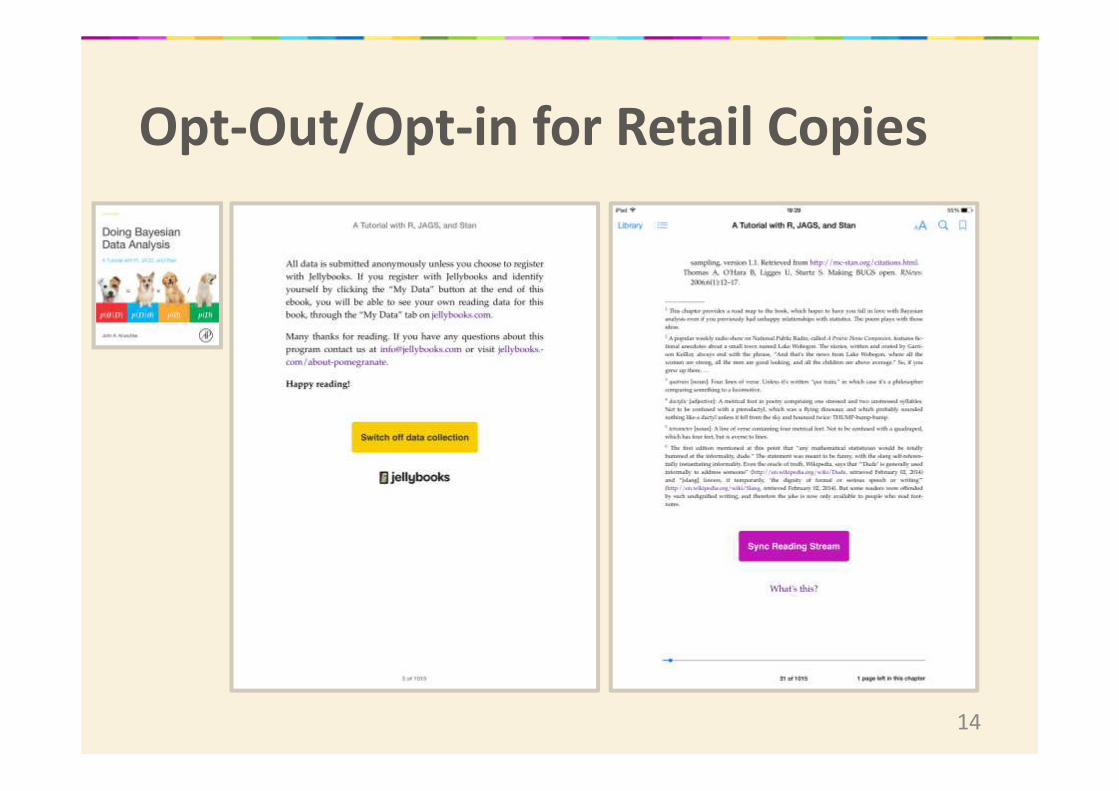
Opt-Out/Opt-in for Retail Copies
14
Part IV
Visualising Data
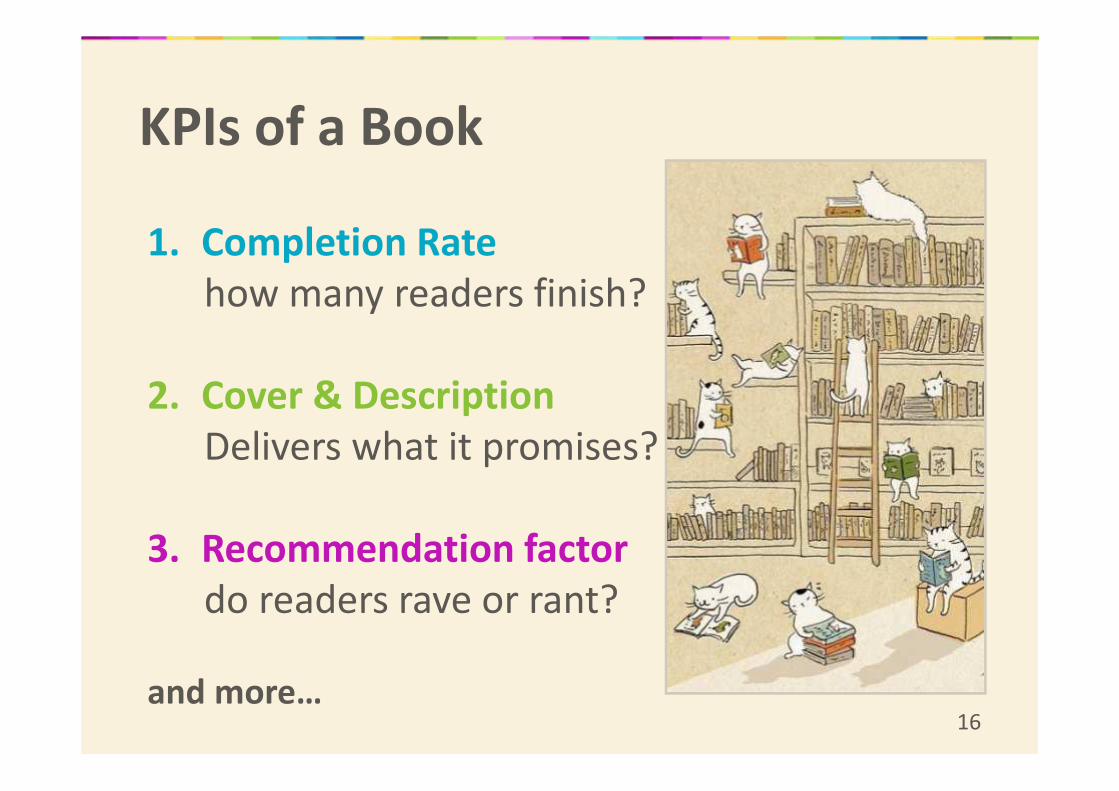
KPIs of a Book
16
1. Completion Rate
how many readers finish?
2. Cover & Description
Delivers what it promises?
3. Recommendation factor
do readers rave or rant?
and more…
KPI – 1
Completion Rate
17
18
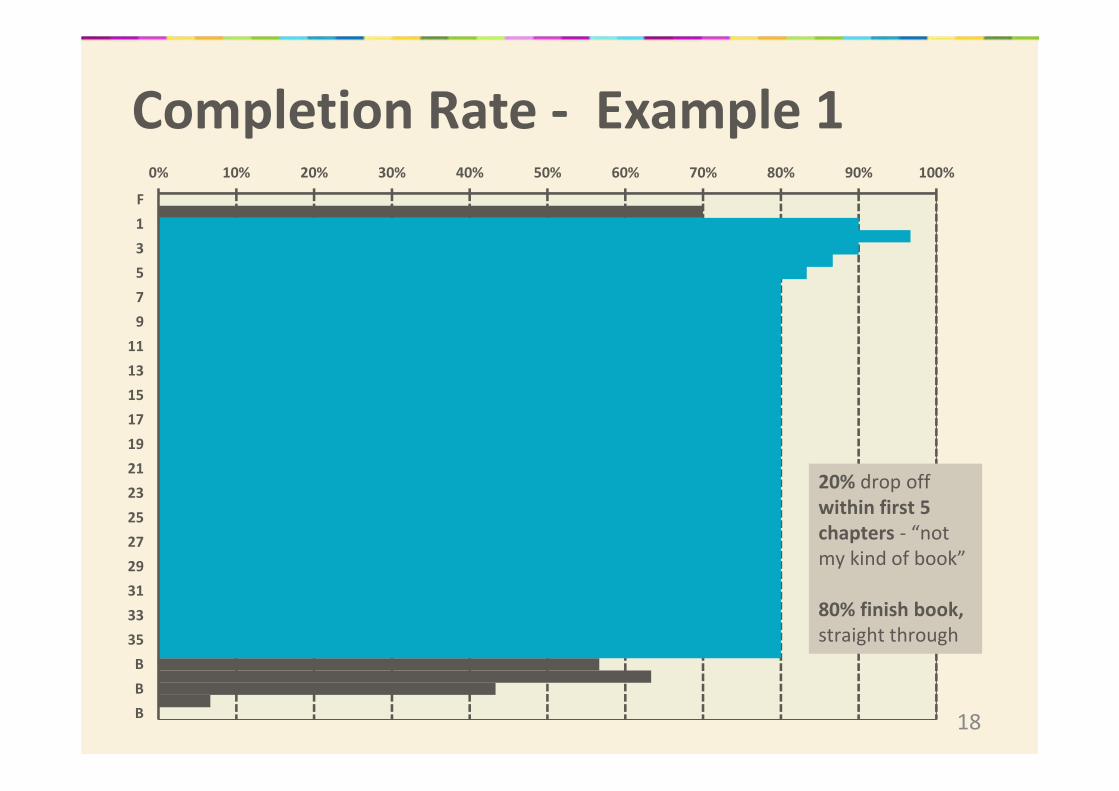
Completion Rate - Example 1 0% 10% 20% 30% 40% 50% 60% 70% 80% 90% 100%
F
1
3
5
7
9
11
13
15
17
19
21
23
25
27
29
31
33
35
B
B
B
20% drop off
within first 5
chapters - “not
my kind of book”
80% finish book,
straight through
19
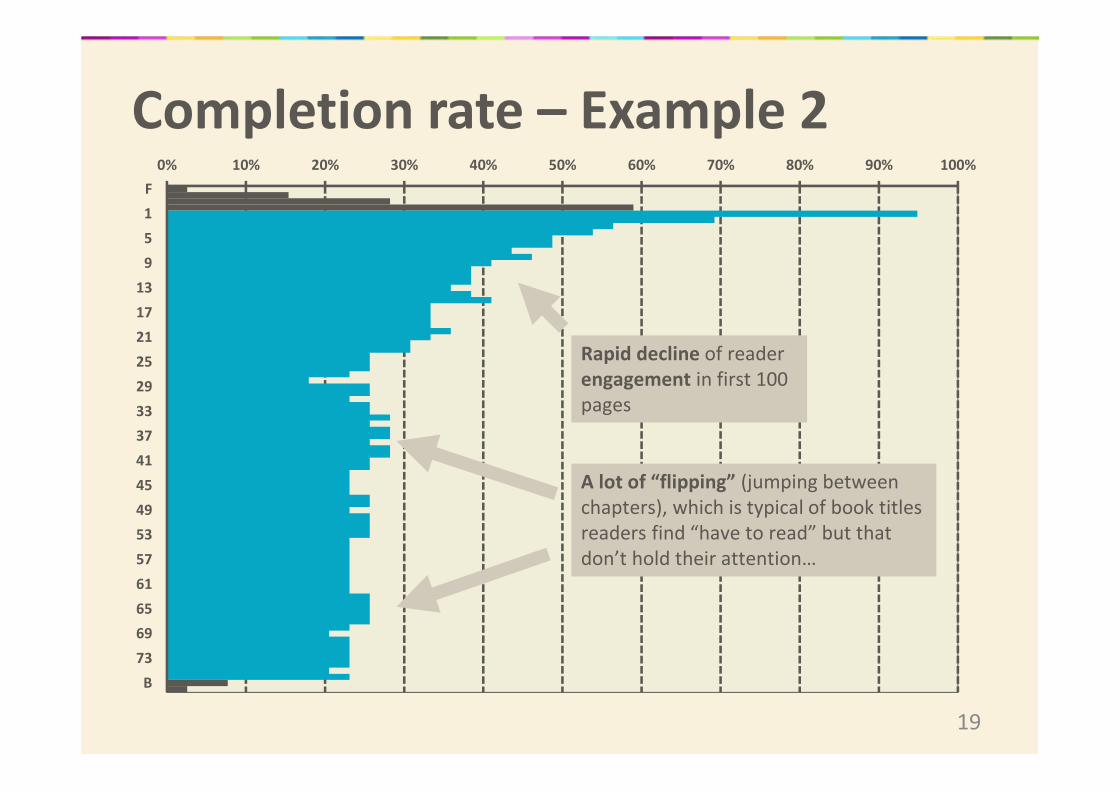
Completion rate – Example 20% 10% 20% 30% 40% 50% 60% 70% 80% 90% 100%
F
1
5
9
13
17
21
25
29
33
37
41
45
49
53
57
61
65
69
73
B
A lot of “flipping” (jumping between
chapters), which is typical of book titles
readers find “have to read” but that
don’t hold their attention…
Rapid decline of reader
engagement in first 100
pages
20
0% 10% 20% 30% 40% 50% 60% 70% 80% 90% 100%
F
F
F
F
1
2
3
4
5
6
7
8
9
10
B
B
B
B
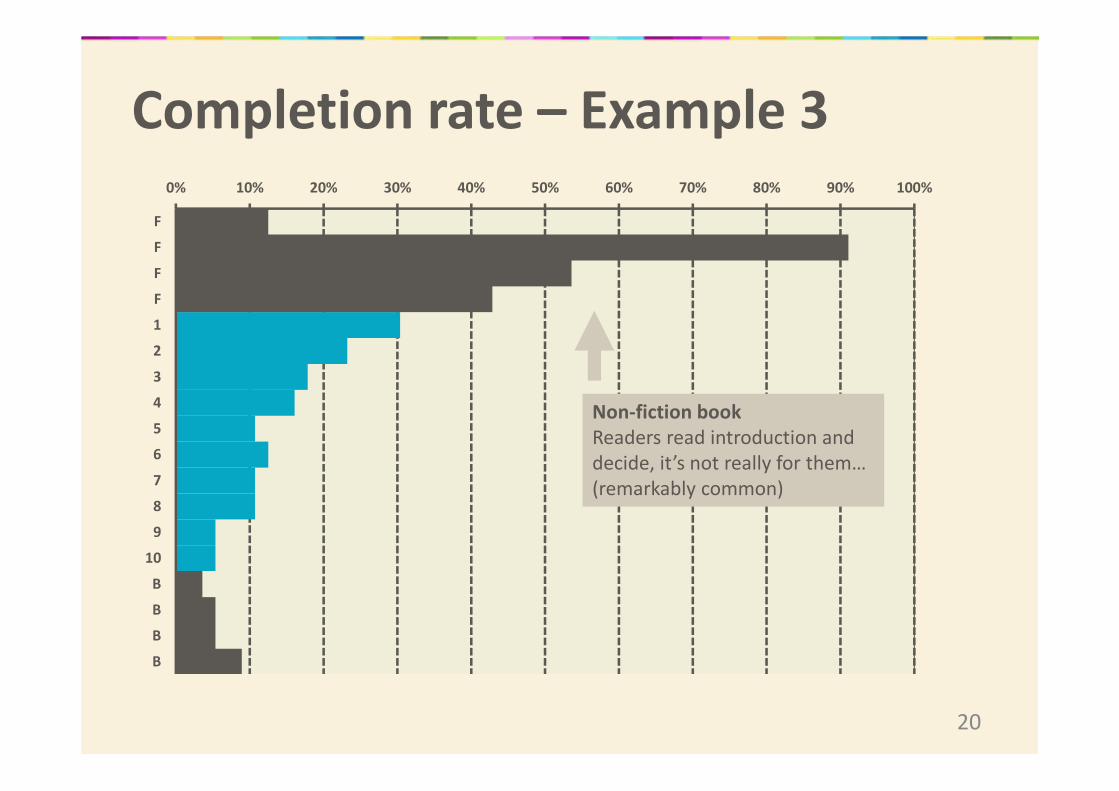
Completion rate – Example 3
Non-fiction book
Readers read introduction and
decide, it’s not really for them…
(remarkably common)
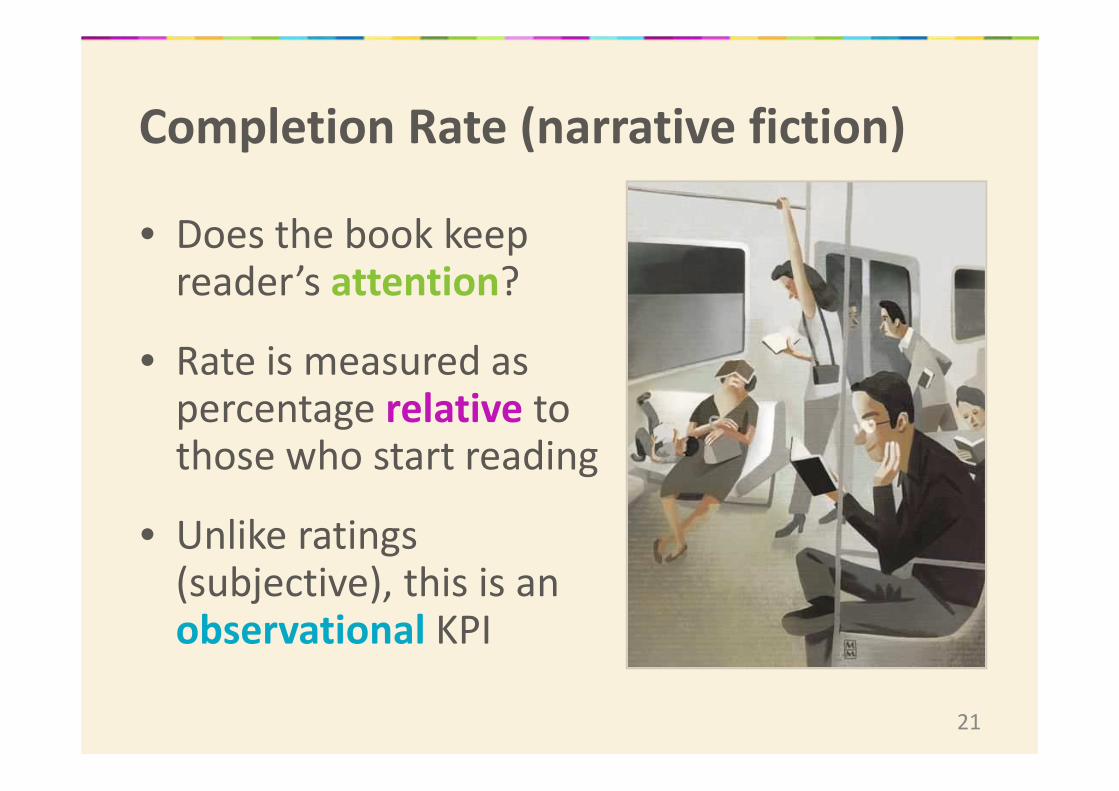
Completion Rate (narrative fiction)
• Does the book keep reader’s attention?
• Rate is measured as percentage relative to those who start reading
• Unlike ratings (subjective), this is an observational KPI
21
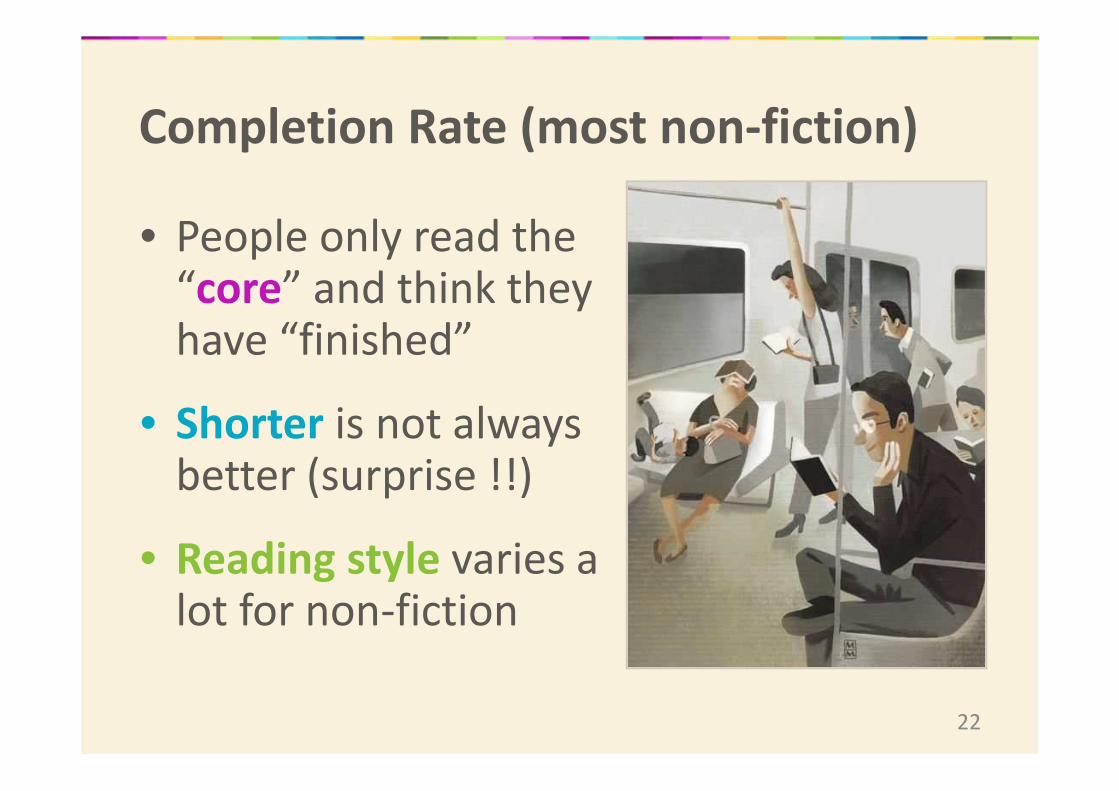
Completion Rate (most non-fiction)
• People only read the “core” and think they have “finished”
• Shorter is not always better (surprise !!)
• Reading style varies a lot for non-fiction
22
KPI - 2
Velocity
23
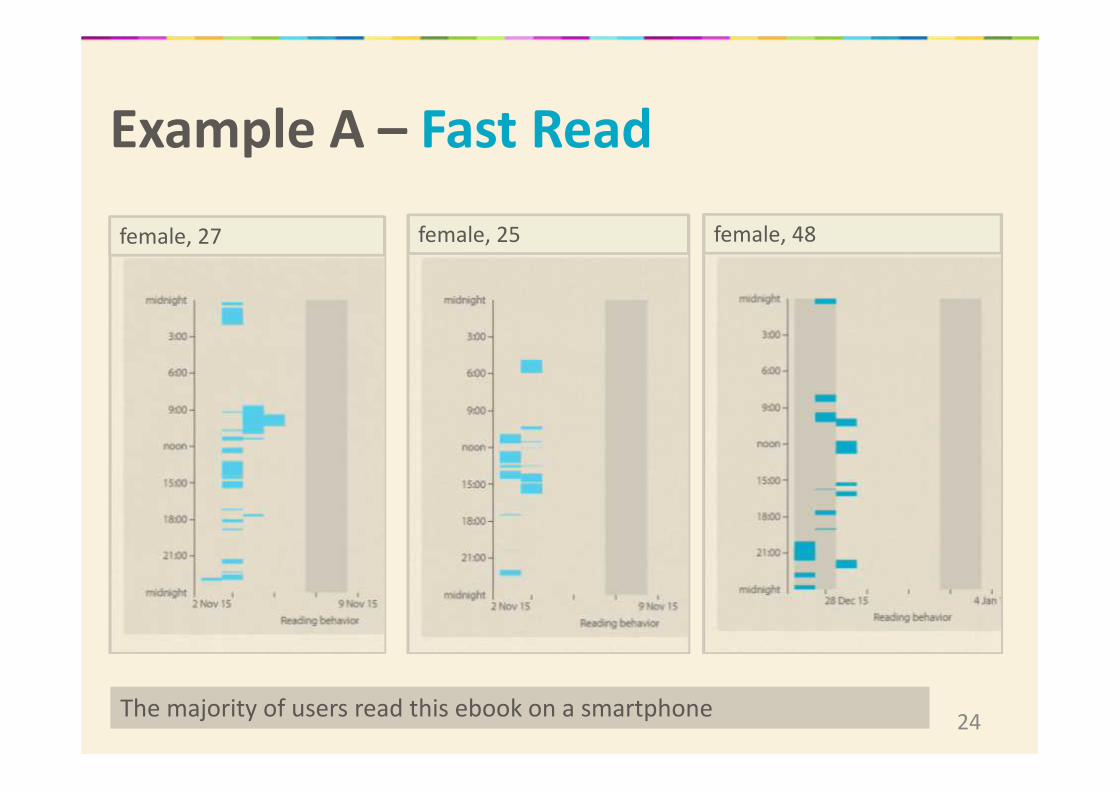
Example A – Fast Read
24The majority of users read this ebook on a smartphone
female, 27 female, 25 female, 48
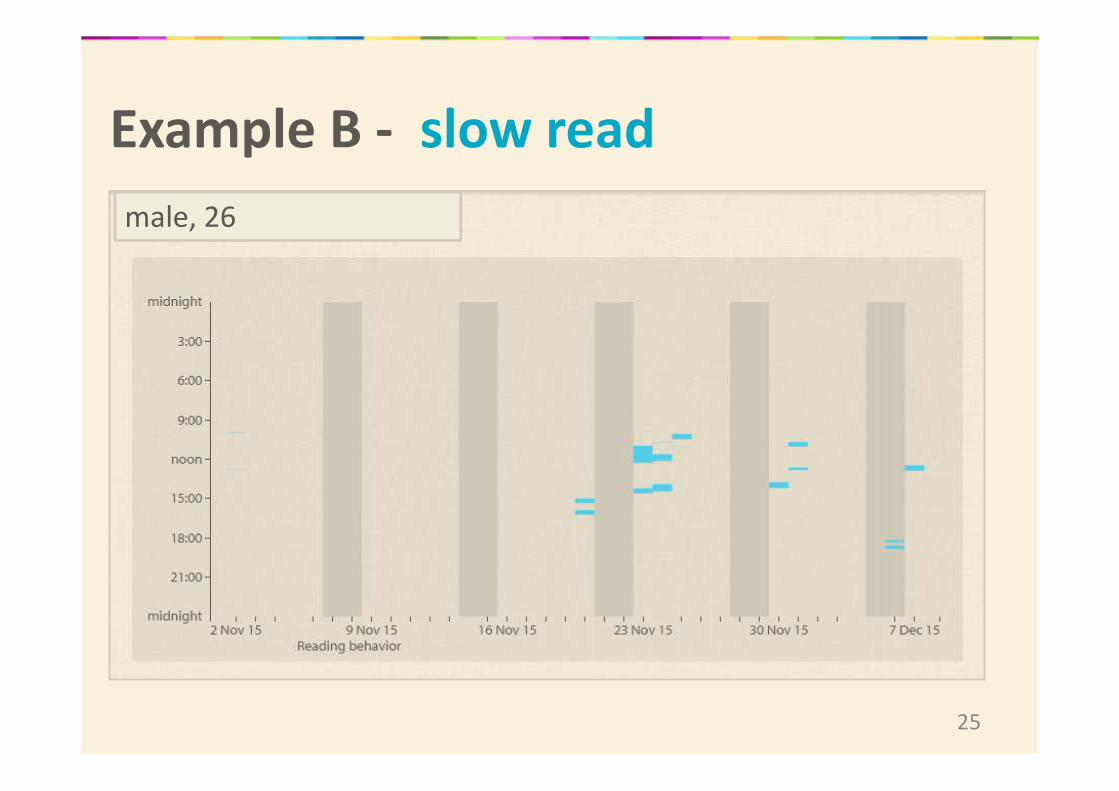
Example B - slow read
25
male, 26
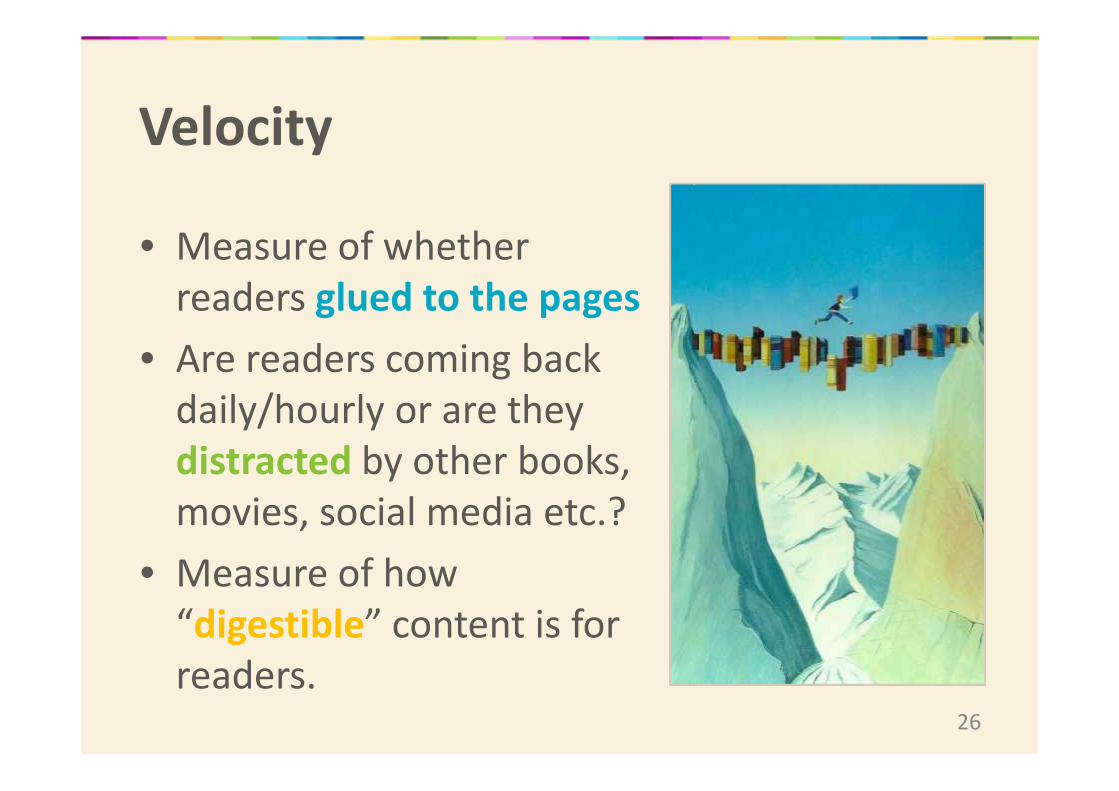
Velocity
• Measure of whether
readers glued to the pages
• Are readers coming back
daily/hourly or are they
distracted by other books,
movies, social media etc.?
• Measure of how
“digestible” content is for
readers.26
KPI - 3
Recommendation Factor
27
28
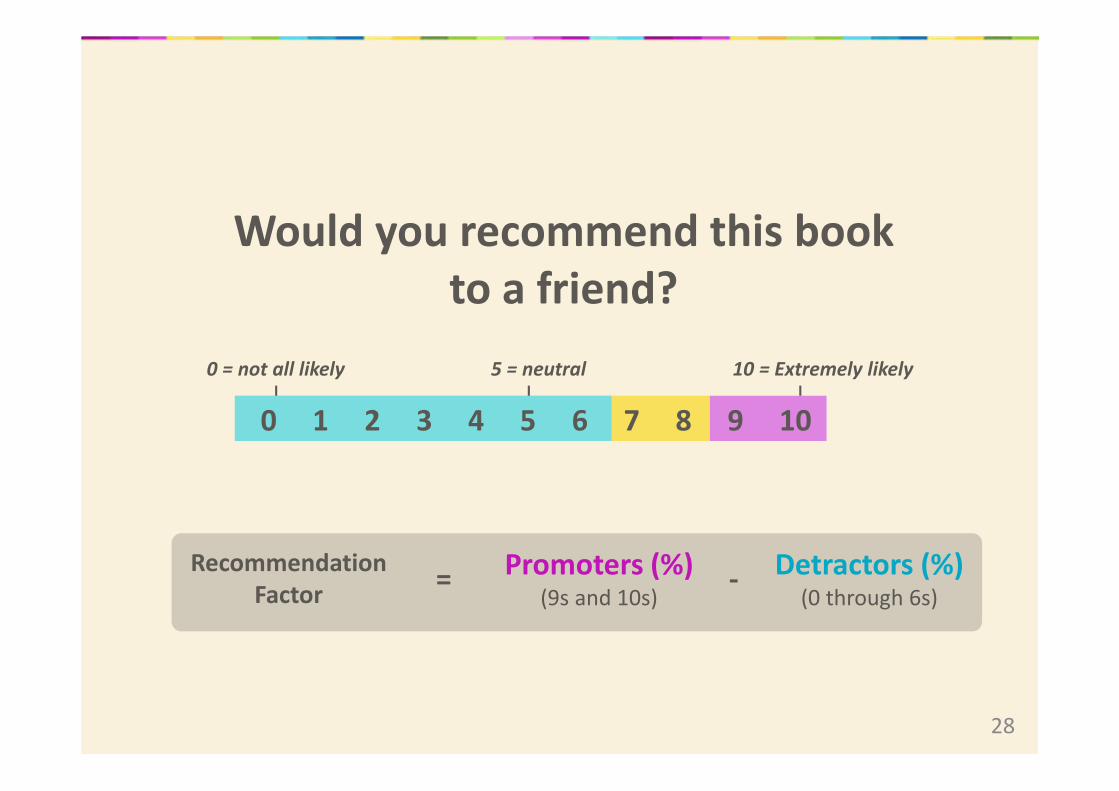
Would you recommend this book
to a friend?
0 = not all likely 5 = neutral 10 = Extremely likely
0 1 2 3 4 5 6 7 8 9 10
Recommendation
Factor= Promoters (%)
(9s and 10s)
Detractors (%)(0 through 6s)
-
29
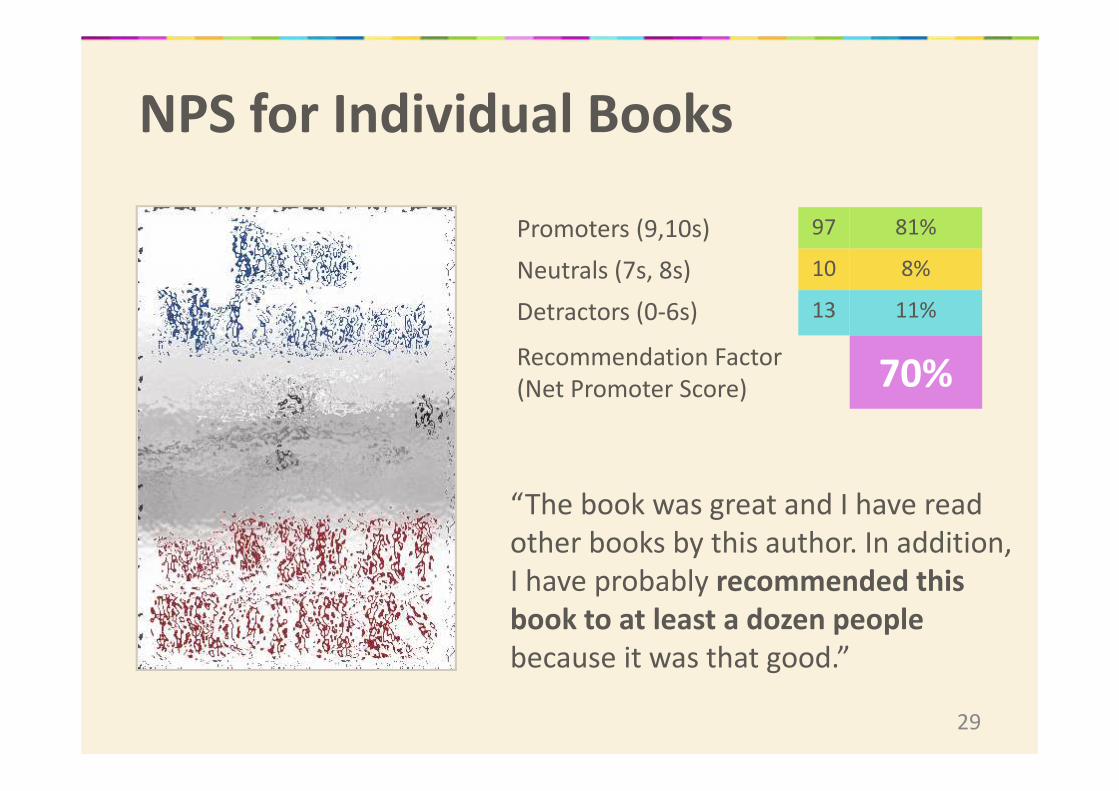
NPS for Individual Books
“The book was great and I have read
other books by this author. In addition,
I have probably recommended this
book to at least a dozen people
because it was that good.”
Promoters (9,10s) 97 81%
Neutrals (7s, 8s) 10 8%
Detractors (0-6s) 13 11%
Recommendation Factor
(Net Promoter Score) 70%

30
Trade Publishers

31
Pilot Partners – Professional & STM
Professional & STM
• Reading behaviour is sometimes radically
different for STM compared to trade
• What is “trade” and what is “professional” is
varies and depends on the user’s needs
• Trying to understand user journeys, not just
“pages read”
• What content are people actually accessing
• What should be “placed together”
32
Reader analytics was made possible
in large part through the financial support of
33
Book candy for readers, data candy for publishers.
sign up to be a test reader at jellybooks.com


![Niso 50hz[1]](https://img.pdfslide.net/doc/110x75/579070041a28ab68749b8a03/niso-50hz1.jpg)