Embed Size (px)
Citation preview

ADDITIONAL SOLVED PROBLEMS

CHAPTER 2
P.2.12 An investor wishes to choose the better of the two equally costly cashflow streams, namely, Annuity X (AX) and Annuity Y (AY). While AX is an annuity due (i.e. cash flows occur at the beginning of the year) with a cash inflow of Rs 90,000 for each of 6 years, AY is an ordinary annuity (i.e. cash flows occur at the end of the year) with a cash inflow of Rs 1,00,000 for each of 6 years. Assuming 15 per cent return on investment (a) find the future value at the end of year 6 (FVA6) for both AX and AY and (b) which annuity is more attractive?
Solution (a) Annuity X, FAV6 = Rs 90,000 3 FVIA (15.6 3 0.15) = Rs 90,000 3 8.754 3 1.15 = Rs 9,06,039 Annuity Y, FVA6 = Rs 1,00,000 3 FVIFA(15,6) = Rs 1,00,000 3 8.754 = Rs 8,75,400 (b) AX is more attractive as its FVA6 is larger than that of AY. This is so because the benefit of receiving the
cash flows of AX at the beginning of the year more than offsets the fact that its flows are Rs 10,000 less than those of AY, which has year-end cash flows. The cash flows of AX earn 15 per cent for an extra year, thereby enhancing its future value.
P.2.13 You have a choice of accepting either of two 5-year cashflow streams or lump-sum amounts given below.
End of year Cash fl ow stream
Alternative I Alternative II
1 Rs 7,000 Rs 11,0002 7,000 9,0003 7,000 7,0004 7,000 5,0005 7,000 3,000 Lump-sum amountAt time zero (t = 0) 28,250 28,000
Assuming 10 per cent required rate of return, which alternative (I or II) and in which form (Cash flow or lump-sum) would you prefer and why?SolutionAlternative I:Cash flow stream (annuity): PVA5 = Rs 7,000 3 PVIFA(10,5) = Rs 7,000 3 3.791 = Rs 26,537 Lump sum = Rs 28,250Alternative II:
Cash fl ow stream (mixed stream)
Year (n) Cash fl ow PVIF(10,n) Present value (1) (2) [(1) 3 (2)] (3)
1 Rs 11,000 0.909 Rs 9,9992 9,000 0.826 7,4343 7,000 0.751 5,2574 5,000 0.683 3,4155 3,000 0.621 1,863 27,968Lump sum = Rs 28,000

Additional Solved Problems 3
Conclusion: Alternative I in the form of lump-sum payment is preferable as it has the largest present value.
P.2.14 You wish to accumulate Rs 80,00,000 by the end of 5 years by making equal annual year-end deposits over the next 5 years. Assuming 7 per cent rate of return, how much should you deposit at the end of each year to accumulate Rs 8,00,000?
Solution FVAn = X[FVIFA(r,n)] FVA5 = Rs 80,000; FVIFA(7,5) = 5.751 Rs 8,00,000 = 5.751 X X = Rs 8,00,000 4 5.751 = Rs 1,39,106.P.2.15 Compute the future values of (1) an initial Rs 100 compounded annually for 10 years at 10 per cent and (2) an annuity of Rs 100 for 10 years at 10 per cent.
Solution (1) The future value of an investment compounded annually = Fn = P(1 + i)n = P 3 FIVFi,n = F10 = Rs 100
(1 + 0.10)10 = Rs 100 (2.5937) = Rs 259.4 (2) The future value of an annuity = Sn = A 3 FVIFAi,n = Rs 100 3 15.937 = Rs 1,593.7.
P.2.16 An investor has two options to choose from: (a) Rs 6,000 after 1 year; (b) Rs 9,000 after 4 years. Assuming a discount rate of (i) 10 per cent and (ii) 20 per cent, which alternative should he opt for?
Solution (i) (a) Rs 6,000 after 1 year at 10 per cent discount = P = Rs 6,000(0.9091) = Rs 5,454.6. (i) (b) Rs 9,000 after 4 years at 10 per cent discount = P = Rs 9,000(0.6830) = Rs 6,147. At 10 per cent required rate, the investor should choose Rs 9,000 after 4 years. (ii) (a) Rs 6,000 after 1 year at 20 per cent discount = P = Rs 6,000(0.8333) = Rs 4,999.8. (ii) (b) Rs 9,000 after 4 years at 20 per cent discount = P = Rs 9,000(0.4823) = Rs 4,340.7. At 20 per cent required rate, the investor should choose Rs 6,000 after 1 year.
P.2.17 An investor is 50 years of age today. He will retire at the age of 60. In order to receive Rs 2,00,000 annually for 10 years after retirement, how much amount should he have at the time of retirement? Assume the required rate of return is 10 per cent.
Solution Pn(present value of annuity) = A 3 PVIFAi,n = P10 = Rs 2,00,000 (6.1446) = Rs 12,28,920.
P.2.18 A person would need Rs 100, 5 years from now. How much amount should he deposit each year in his bank account, if the yearly interest rate is 10 per cent?
Solution Sn = A 3 FVIFAi,n or A = Sn/FVIFAi,n = Rs 100/6.1051 = Rs 16.38
P.2.19 X has taken a 20-month car loan of Rs 6,00,000. The rate of interest is 12 per cent per annum. What will be the amount of monthly loan amortisation?
Solution A = Rs 6,00,000/PVIFA1,20 = Rs 6,00,000/18.0456 = Rs 33,249.1. Monthly interest = 12 per cent/12 = 1 per cent.
P.2.20 ABC Ltd has borrowed Rs 1,000 to be repaid in equal instalments at the end of each of the next 3 years. The interest rate is 15 per cent. Prepare a amortisation schedule.
Solution Amount of equal instalment, A = Pn/PVIFAi, n = Rs 1,000/2.2832 = Rs 437.98

4 Financial Management
Amortisation schedule
Year Payment Interest* Repayment of principal Balance outstand-ing
1 Rs 437.98 Rs 150.00 Rs 287.98 Rs 712.02 2 437.98 106.80 331.18 380.84 3 437.98 57.13 380.85
*= Loan balance at the beginning of the year 3 interest rate, e.g., year 1 = (Rs 1,000 3 0.15) = Rs 150.
P.2.21 ABC Ltd has borrowed Rs 1,000 to be repaid in 12 monthly instalments of Rs 94.56. Compute the annual interest.
Solution Pn = A 3 PVIFAi,n PVIFAi,n = Pn /A = Rs 1,000/Rs 94.56 = 10.5753 According to Table A-4 (Appendix), a PVIFA of 10.5753 for 12 periods at interest (i) = 2 per cent. The annual interest rate is therefore 0.02 3 12 = 24 per cent.

CHAPTER 3
P.3.15 The risk-free rate is 6 per cent and the expected rate of return on the market portfolio is 16 per cent, with a standard deviation of 8 per cent. An aggressive investor is keen to earn 20 per cent return. Is it possible for a rational investor to achieve the target return? How? Explain the nature of risk-return trade-off for him and verify results.
Solution The capital market line (CML) shows that returns in excess of market portfolio can be obtained by creating a margined or leveraged portfolio, that is borrowing at the risk-free rate and investing the whole amount in the market portfolio. With borrowings, the weight of the market portfolio (risky asset ) is taken as w, which is greater than one. Since the sum of the weights should be zero, the weight of risk-free asset (T-bills or any other asset like savings deposit) is one minus w (1 – w).
E (rp) = wara + wbrb = w (16%) + (1 – w) (6%) = 20 = 16w – 6w + 6 10w = 20 – 6 = 14 w = 14/10 = 1.4 1 – w = 1.0 – 1.4 = –0.4 Thus, the investor should borrow a sum equivalent to 40% of his owned funds at risk-free rate and invest the owned plus borrowed funds in the market portfolio. His risk return trade-off is implicit in the CML, which constitutes an efficient frontier. With risk-free lending (borrowing), the portfolio risk is simply the weight of risky asset times the standard deviation of the market portfolio. Thus, portfolio risk (sp) = w sm = 1.4 3 8% = 11.2 per cent.Verification: Using the CML, the portfolio return may be obtained using the formula
E (rp) = rf + [(rm – rf)/sm] sp
= 6 + [(16–6)/8] 3 11.2 = 6 + 14 = 20 per centAlternatively,Return on the market portfolio = w 3 rm = 1.4 3 16% = 22.4 per centInterest cost of borrowings = (1 – w) 3 rf = – 0.4 3 6% = 2.4 per centNet return from investment = 22.4% – 2.4% = 20 per centP.3.16 If the simple CAPM holds good, comment on the following situations.(a)
Portfolio E(r) s
Aries (%) 30 25Taurus (%) 40 15
(b)
Portfolio E(r) s
Risk-free asset (%) 10 0Market 18 24Libra 18.8 27
Solution (a) Positive incremental return 10 per cent (40% – 30%) is available with lower risk (standard deviation). This
violates the basic assumption of the CAPM. Between Aries and Taurus. Aries is dominated by Taurus. (b) The equation of the capital market line (CML) as per the CAPM is:
E (rr) = rf + (sr/sm) [E (rm) – rf ]
= 10% + (27/24) (18 – 10) = 10% + 27/3% = 19%
The expected return on Libra is not commensurate with the total variability in returns (standard deviation). It is an inefficient portfolio and lies below the CML.

6 Financial Management
P.3.17 Risk-return features of two securities X and Y are:
Portfolio E(r) s
X (%) 20 16Y (%) 25 20
If the correlation coefficient between X and Y is 0.6, determine: (a) Weights of X and Y, which would produce minimum portfolio risk (standard deviation), calculate expected
return for these weights (b) Portfolio risk and return, if weights are equal (c) Portfolio risk and return, if weights are 3:1 (d) Portfolio risk and return, if weights are 1:3
Solution (a) Weights that produce minimum variance in a 2 security portfolio may be obtained as:
W*x = (s2Y – COVxy)/(s
2x + s2
y – 2COVxy) where COVxy = r sx sy COVxy = 0.6 3 16 3 20 = 192 W*x = [(20)2 – 192]/[(16)2 + (20)2 – 2.192] = (400 – 192)/(256 + 400 – 384) = 208/272 = 0.765 = 76.5 per cent Wy = 1 – W *x = 1–0.765 = 0.235 = 23.5 per cent
s2p = (Wx sx)
2 3 (Wy sy)2 + 2 sxsy Wx Wy r
= (0.765 3 16)2 + (0.235 3 20)2 + 2 (0.765) (0.235) 16 3 20 3 0.6)
= 149.82 + 22.09 + 69.03 = 240.94 per cent
sr = 15.52 per cent
E (rp) = wx.rx + wy ry = 0.765 3 20% + 0.235 3 25% = 15.3% + 5.88% = 21.18 per cent
(b) s2p = (0.5 3 16)2 + (0.5 3 20)2 + 2 (0.6 3 16 3 20) (0.5) (0.5) = 64 + 100 + 96 = 260 per cent
sp = 16.12 per cent
E (rp) = 0.5 3 20% + 0.5 3 25% = 10% + 12.5% = 22.5 per cent
(c) s2p = (0.75 3 16)2 + (0.25 3 20)2 + 2 (0.6 3 16 3 20) ( 0.75 3 0.25)
= 144 + 25 + 72 = 241 per cent
sp = 15.52 per cent
E (rp) = 0.75 3 20% 3 0.25 3 25% = 15% + 6.25% = 21.25 per cent
(d) s2p = (0.25 3 16)2 + (0.75 3 20)2 + 2 (0.6 3 16 3 20) (0.75 3 0.25)
= 16 + 225 + 72 = 313 per cent
sp = 17.69 per cent
E (rp) = 0.25 3 20% + 0.75 3 25% = 5% + 18.75% = 23.75 per cent
CHAPTER 5
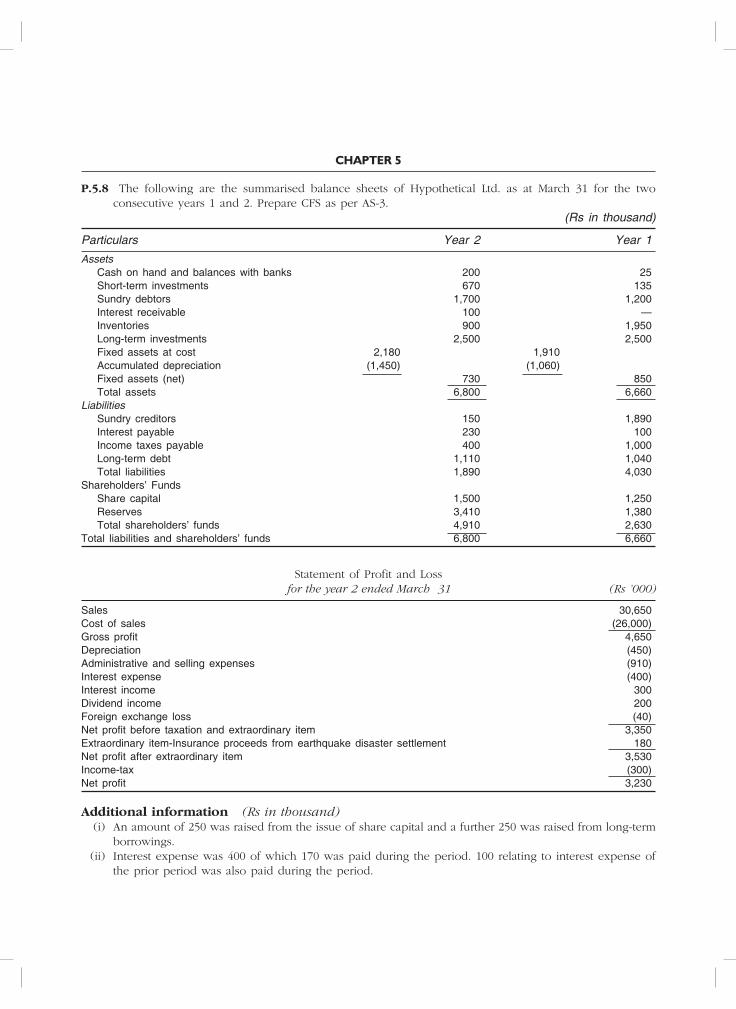
P.5.8 The following are the summarised balance sheets of Hypothetical Ltd. as at March 31 for the two consecutive years 1 and 2. Prepare CFS as per AS-3.
(Rs in thousand)
Particulars Year 2 Year 1
Assets Cash on hand and balances with banks 200 25 Short-term investments 670 135 Sundry debtors 1,700 1,200 Interest receivable 100 — Inventories 900 1,950 Long-term investments 2,500 2,500 Fixed assets at cost 2,180 1,910 Accumulated depreciation (1,450) (1,060) Fixed assets (net) 730 850 Total assets 6,800 6,660Liabilities Sundry creditors 150 1,890 Interest payable 230 100 Income taxes payable 400 1,000 Long-term debt 1,110 1,040 Total liabilities 1,890 4,030Shareholders’ Funds Share capital 1,500 1,250 Reserves 3,410 1,380 Total shareholders’ funds 4,910 2,630Total liabilities and shareholders’ funds 6,800 6,660
Statement of Profit and Loss for the year 2 ended March 31 (Rs ’000)
Sales 30,650Cost of sales (26,000)Gross profi t 4,650Depreciation (450)Administrative and selling expenses (910)Interest expense (400)Interest income 300Dividend income 200Foreign exchange loss (40)Net profi t before taxation and extraordinary item 3,350Extraordinary item-Insurance proceeds from earthquake disaster settlement 180Net profi t after extraordinary item 3,530Income-tax (300)Net profi t 3,230
Additional information (Rs in thousand) (i) An amount of 250 was raised from the issue of share capital and a further 250 was raised from long-term
borrowings. (ii) Interest expense was 400 of which 170 was paid during the period. 100 relating to interest expense of
the prior period was also paid during the period.

8 Financial Management
(iii) Dividends paid were 1,200. (iv) Tax deducted at source on dividends received (included in the tax expense of 300 for the year) amounted
to 40. (v) During the period, the enterprise acquired fixed assets for 350. The payment was made in cash. (vi) Plant with original cost of 80 and accumulated depreciation of 60 was sold for 20. (vii) Foreign exchange loss of 40 represents the reduction in the carrying amount of a short-term investment
in foreign-currency designated bonds arising out of a change in exchange rate between the date of acquisition of the investment and the balance sheet date.
(viii) Sundry debtors and sundry creditors include amounts relating to credit sales and credit purchases only.
Solution Direct Method Cash Flow Statement (Rs ’000)
Cash fl ows from operating activities Cash receipts from customers 30,150 Cash paid to suppliers and employees (27,600) Cash generated from operations 2,550 Income taxes paid (860) Cash fl ow before extraordinary item 1,690 Proceeds from earthquake disaster settlement 180 Net cash from operating activities 1,870Cash fl ows from investing activities Purchase of fi xed assets (350) Proceeds from sale of equipment 20 Interest received 200 Dividends received 160 Net cash from investing activities 30Cash fl ows from fi nancing activities Proceeds from issuance of share capital 250 Proceeds from long-term borrowings 250 Repayment of long-term borrowings (180) Interest paid (270) Dividends paid (1,200) Net cash used in fi nancing activities (1,150)Net increase in cash and cash equivalents 750Cash and cash equivalents at beginning of period (see Note 1) 160Cash and cash equivalents at the end of period (see Note 1) 910
Indirect Method Cash Flow Statement (Rs '000)
Cash fl ows from operating activities Net profi t before taxation, and extraordinary item 3,350 Adjustments for: Depreciation 450 Foreign exchange loss 40 Interest income (300) Dividend income (200) Interest expense 400 Operating profi t before working capital changes 3,740 Increase in sundry debtors (500) Decrease in inventories 1,050 Decrease in sundry creditors (1,740) Cash generated from operations 2,550 Income taxes paid (860)
(Contd)

Additional Solved Problems 9
Cash fl ow before extraordinary item 1,690 Proceeds from earthquake disaster settlement 180Net cash from operating activities 1,870Cash fl ows from investing activities: Purchase of fi xed assets (350) Proceeds from sale of equipment 20 Interest received 200 Dividends received 160Net cash from investing activities 30Cash fl ows from fi nancing activities 250 Proceeds from issuance of share capital 250 Proceeds from long-term borrowings (180) Repayment of long-term borrowings (270) Interest paid (1,200) Dividends paid (1,150)Net cash used in fi nancing activities 750Net increase in cash and cash equivalents 750Cash and cash equivalents at beginning of period (see Note 1) 160Cash and cash equivalents at end of period (see Note 1) 910
Notes to the cash flow statement (direct method and indirect method) 1. Cash and cash-equivalents Cash and cash equivalents consist of cash on hand and balances with banks, and investments in money-
market instruments. Cash and cash-equivalents included in the cash flow statement comprise the following balance sheet amounts.
Year 2 Year 1
Cash on hand and balances with banks Rs 200 Rs 25Short-term investments 670 135Cash and cash-equivalents 870 160Effect of exchange rate changes 40 —
Cash and cash equivalents as restated 910 160
Cash and cash-equivalents at the end of the period include deposits with banks of 100 held by a branch which are not freely remissible to the company because of currency exchange restrictions.
The company has undrawn borrowing facilities of 2,000 of which 700 may be used only for future expansion.
2. Total tax paid during the year (including tax deducted at source on dividends received) amounted to 900.
Alternative Presentation (indirect method): As an alternative, in an indirect method cash flow statement, operating profit before working capital
changes is sometimes presented as follows:
Revenues excluding investment income Rs 30,650 Operating expense excluding depreciation (26,910) Operating profi t before working capital changes Rs 3,740
(Contd)

10 Financial Management
Working Notes(Figures in Rs ’000)
1. Cash receipts from customers Sales 30,650 Add: Sundry debtors at the end of the year 1,200 31,850 Less: Sundry debtors at the end of the year 1,700 30,150 2. Cash paid to suppliers and employees Cost of sales 26,000 Administrative and selling expenses 910 26,910 Add: Sundry creditors at the beginning of the year 1,890 Inventories at the end of the year 900 2,790 Less: Sundry creditors at the end of the year 150 29,700 Inventories at the beginning of the year 1,950 2,100 27,600 3. Income taxes paid (including tax deducted at source from dividends received) Income tax expense for the year (including tax deducted at source from dividends received) 300 Add: Income tax liability at the beginning of the year 1,000 1,300 Less: Income tax liability at the end of the year 400 900
Out of 900, tax deducted at source on dividends received (amounting to 40) is included in cash fl ows from investing activities and the balance of 860 is included in cash fl ows from operating activities.
4. Repayment of long-term borrowings Long-term debt at the beginning of the year 1,040 Add: Long-term borrowing made during the year 250 1,290 Less: Long-term borrowings at the end of the year 1,110 180 5. Interest paid Interest expense for the year 400 Add: Interest payable at the beginning of the year 100 500 Less: Interest payable at the end of the year 230 270
P.5.9 The following are the summarised balance sheets of Sound Ltd. as on March 31 for the two consecutive years 1 and 2:
(Rs in thousand )
Particulars Year 2 Year 1
Assets: Plant and machinery 1,980 1,010 Land and buildings 1,000 1,000 Long-term investments 550 550 Short-term investments 470 85 Sundry debtors 2,195 2,500 Inventories 1,400 1,300
(Contd)

Additional Solved Problems 11
Interest receivable 100 65 Cash in hand 300 500 Cash in bank 405 300
8,400 7,310
Liabilities: Share capital 2,600 2,150 Reserve and surplus 1,460 900 15% debentures 2,000 1,800 Sundry creditors 440 650 Wages outstanding 40 20 Income-tax payable 400 450 Accumulated depreciation: Plant and machinery 910 840 Land and buildings 550 500
8,400 7,310
Income Statement for the period ending March 31, year 2 (Rs in thousand)
Sales revenue 45,300 Less: Cost of sales 39,000Gross profi t 6,300 Less: Depreciation (540) Selling and administration expenses (2,960) Interest paid (300) Add: Interest income 65 Dividend income (gross) 95 Net profi t before extraordinary items 2,660 Add: Insurance settlement received 10 2,670 Less: Provision for income-taxes 550 Net profi t after taxes 2,120
Additionation Information (Rs in thousand): (1) 15% Debentures of Rs 300 was redeemed during year 2. (2) Tax deducted at source on dividends received (included in provision for taxes) amounts to Rs 15. (3) A plant costing Rs 500, having accumulated depreciation of Rs 420 was sold for Rs 80. (4) During year 2, interim dividend of Rs 760 was paid; final dividend paid was Rs 800. (5) All sales and purchases are made on credit basis.You are required to prepare a cash flow statement as per AS-3 (revised).Solution Direct Method Cash Flow Statement (Rs in thousand)
Cash fl ows from operating activities: Cash receipts from customers 45,605 Cash paid to suppliers and employees (42,250) Cash generated from operations 3,355 Income tax paid (585)
(Contd)
(Contd)

12 Financial Management
Cash fl ow before extraordinary item 2,770 Proceeds from insurance settlement 10Net cash from operating activities 2,780Cash fl ows from investing activities: Purchases of plant and machinery (1,470) Proceeds from sale of plant and machinery 80 Interest received 30 Dividends received (Rs 95 – 15) 80Net cash used in investing activities (1,280)Cash fl ows from fi nancing activities: Proceeds from issuance of share capital 450 Proceeds from issue of 15% debentures 500 Redemption of 15% debentures (300) Interest paid (300) Dividends paid (interim + fi nal) (1,560)Net cash used in fi nancing activities (1,210)Net increase in cash and cash-equivalent 290Cash and cash-equivalent at beginning of year 2 885Cash and cash-equivalents at the end of year 2 1,175
Working Notes (figures in Rs ’000) 1. Cash receipts from customers: Sales 45,300 Add: Sundry debtors at the beginning of year 2 2,500 47,800 Less: Sundry debtors at the end of year 2 (2,195)
45,605 2. Cash paid to suppliers and employees: Cost of sales 39,000 Add: Administrative and selling expenses 2,960 Sundry creditors at the beginning of year 2 650 Wages outstanding at the beginning of year 2 20 Inventories at the end of year 2 1,400 44,030 Less: Sundry creditors at the end of year 2 (440) Wages outstanding at the end of the year 2 (40) Inventories at the end of year 1 (1,300)
42,250
3. Income tax paid (including tax deducted at source from dividends received) Income tax for year 2 (including tax deducted at source from dividends received) 550 Add: Income tax liability at the beginning of year 2 450 Less: Income tax liability at the end of year 2 (400)
600
Out of Rs 600, tax deducted at source on dividend received (amounting to Rs 15) is included in cash flows from investing activities and the balance of Rs 585 is included in cash flows from operating activities.
(Contd)

Additional Solved Problems 13
4. Interest received: Interest income for year 2 65 Add: Interest receivable in the beginning of year 2 65 Less: Amount receivable at the end of year 2 (100)
30
5. Machinery purchased: Balance at the end of year 2 1,980 Add: Book value of machine sold 500 Less: Balance at the beginning of year 2 (1,010)
1,470
Indirect Method Cash Flow Statement (Amount in ’000 Rs)
Cash fl ows from operating activities: Net profi t before taxation and extraordinary items 2,660 Adjustment for: Depreciation 540 Interest income (65) Dividend income (95) Interest expenses 300 Operating profi t before working capital changes 3,740 Decrease in sundry debtors 305 Increase in wages outstanding 20 Increase in inventories (100) Decrease in creditors (210) Cash generated from operations 3,355 Income taxes paid (585) Cash fl ow before extraordinary item 2,770 Add: Insurance settlement 10 Net cash from operating activities 2,780Cash fl ows from investing activities: Purchase of plant and machinery (1,470) Proceeds from sale of plant and machinery 80 Interest received 30 Dividends received (95 – 15) 80Net cash used in investing activities (1,280)Cash fl ows from fi nancial activities: Proceeds from issuance of share capital 450 Proceeds from issue of 15% debentures 500 Redemption of 15% debentures (300) Interest paid (300) Dividends paid (interim + fi nal) (1,560) Net cash used in fi nancing activities (1,210)Net increase in cash and cash-equivalent 290Cash and cash-equivalents at beginning of year 2 885Cash and cash-equivalents at the end of year 2 1,175
Cash and Cash-equivalents (Figures in ’000 Rs)
Particulars Year 2 Year 1
Cash in hand 300 500Cash at bank 405 300Short-term investments 470 85
1,175 885

CHAPTER 6
P.6.17 While working in a financial institution, you have come across the following statements. Give your views and comments on these statements with the necessary arguments. (a) ‘The sales of company A have been growing at a faster rate than those of company B. The profitability
of company A must, therefore, be greater than that of company B.’ (b) ‘From the viewpoint of equity shareholders, debt in the capital structure affects both the risk and the
profitability of the firm.’ (c) ‘Firm X and firm Y have the same expected sales volume for next year and they are identical in every
respect except that the firm X has a greater proportion of fixed costs. If sales are expected to increase (decrease), firm X will have greater (lower) profit from operations than firm Y.’
(d) ‘Assume Calico has a profit margin of 20 per cent and Mafatlal has a profit margin of 25 per cent. It is, therefore, obvious that Mafatlal is a better investment than Calico.’
(e) ‘Firm A is aggressively making capital expenditure and firm B is not. Firm A is clearly more efficient and profitable than firm B.’
Solution (a) The profitability of a company is a product of two factors: (i) margin of profit on sales, and
(ii) assets turnover. Symbolically, it is equal to Net income Sales
Sales Total assets or Margin of net profit 3 Assets
turnover Accordingly, the profitability of company A need not necessarily be greater than that of company B. The answer hinges on the margin of profit of company A. If the margin of profit on sales of both the companies is equal, the profitability of company A would certainly be greater than that of B; because of higher sales company A would cause a higher assets turnover vis-a-vis company B (assuming the size of total assets of companies A and B is equal). If the margin of profit of company B is greater than that of A, profitability of company B may be even greater than that of company A. For instance, the margin of profit on sales of company A is 2 per cent and that of company B is 4 per cent. Let us assume further the assets turnover of company A is 8 while that of company B is 5. Due to increased sales, the total rate of return would be 16 per cent of company A, while that of Company B would be 20 per cent.(b) Debt in the capital structure certainly affects both the risk and profitability from the point of view of equity-holders. If the company’s earnings rate is greater than the interest rate paid on debt, the company is said to have favourable leverage as it enhances the rate of return available to equityholders. Conversely, if the rate of interest paid on debt exceeds the company’s earning rate, the company is said to have unfavourable leverage as it will depress the rate of return available to equity holders. Let us take a simple example to make the point clear: Total assets Rs 20,000 Equity capital 10,000 10% Debt 10,000 Net income before interest and taxes 5,000 Tax rate (%) 35
Profi t and loss statement
Net income before interest and taxes Rs 5,000 Less: Interest on debt 1,000Net income 4,000 Less: Taxes (0.35) 1,400Net income available to equityholders 2,600Rate of return on equity capital (per cent) 26
The company is increasing the profitability of equity holders by employing debt in the capital structure.In the absence of debt, the rate of return would have been 16.25 per cent [(Rs 5,000 – Rs 1,750 taxes) 4Rs 20,000].

Additional Solved Problems 15
If the net income before interest and taxes is Rs 1,500 only, the use of debt would work against the interest of equityholders, as shown by the following calculations:
Net income before interest and taxes Rs 1,500 Less: Interest on debt 1,000Net income 500 Less: Taxes 175Net income available to equityholders 325Rate of return on equity capital (per cent) 3.25
In the absence of debt, the rate of return on equity capital would have been 4.9 per cent [Rs 1,500 –Rs 525] 4 Rs 20,000. The use of debt in the company’s capital structure increases the financial risk of equityholders, as the use of debt increases the variability of the shareholders’ returns and probability of insolvency if the firm fails to make the payment of interest and repayment of the principal in time.(c) The profit of firm X need not necessarily be higher than that of Y. The answer hinges on the margin of safety and amount of fixed costs of firms X and Y. Let us take an example.
Firms
Particulars X Y
Sales Rs 1,00,000 Rs 1,00,000 P/V ratio (%) 50 50 Fixed cost 40,000 20,000 Net profi t 10,000 30,000
Net profit X, (Sales, Rs 1,00,000 – Variable cost, Rs 50,000 – Fixed cost, Rs 40,000) = Rs 10,000. Net profit, Y (Sales, Rs 1,00,000 – Variable cost, Rs 50,000 – Fixed cost, Rs 20,000) = Rs 30,000. If sales increase by 20 per cent,
Particulars X Y Sales Rs 1,20,000 Rs 1,20,000 Less: Variable cost (1 – P/V ratio) 60,000 60,000 Contribution 60,000 60,000 Less: Fixed costs 40,000 40,000
20,000 20,000
(d) Mafatlal need not necessarily be a better investment than Calico for the following reasons: (i) Profitability is also affected by turnover of total assets and not by margin of profit only. The assets
turnover of Calico may be greater than Mafatlal’s. (ii) The degree of financial risk in Mafatlal due to the use of debt may be more than that in Calico.
Therefore, the required rate of return on equity capital of Mafatlal would be more than that of Calico affecting the market value of their shares.
(iii) Calico may be pursuing a stable dividend policy as against an unstable dividend policy by Mafatlal. (iv) The future prospects of the two companies may be different.The above factors taken together determine the quality of investments.(e) The answer rests on the existing position of firm B and the rate of return earned by company A on capital expenditures. If company A is investing in such proposals which will add to the net present value of the shareholders’ wealth, they will certainly add to the efficiency and profitability of firm A. But if the firm B has already made such investments in the past, the company A need not necessarily be more efficient and profitable than firm B.
16 Financial Management
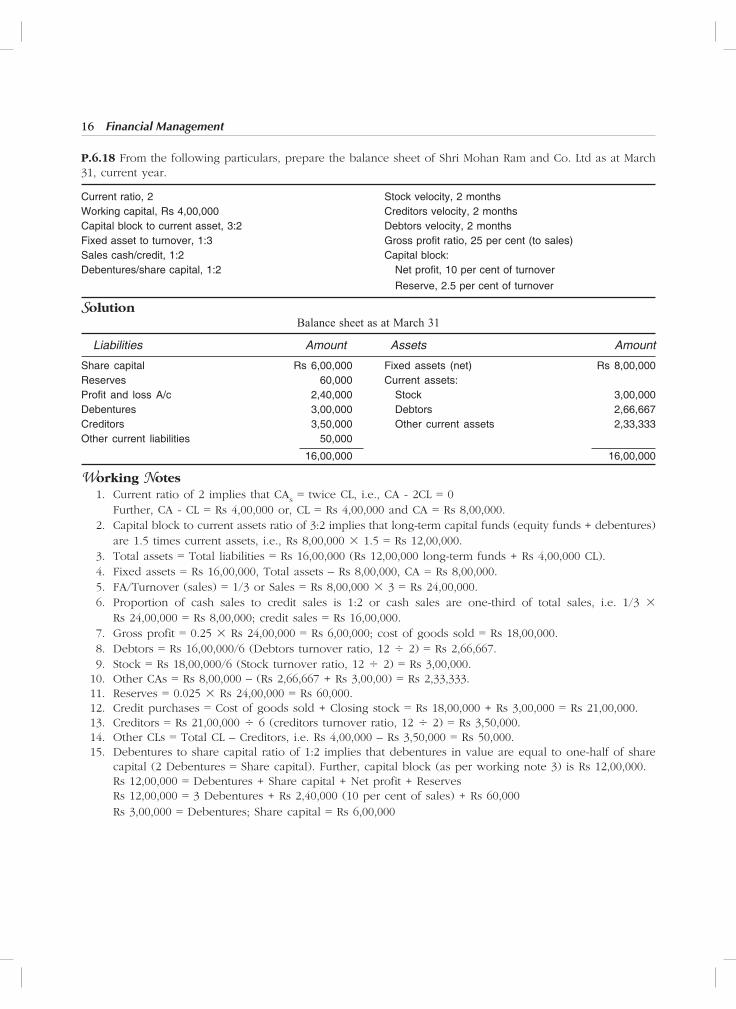
P.6.18 From the following particulars, prepare the balance sheet of Shri Mohan Ram and Co. Ltd as at March 31, current year.
Current ratio, 2 Stock velocity, 2 monthsWorking capital, Rs 4,00,000 Creditors velocity, 2 monthsCapital block to current asset, 3:2 Debtors velocity, 2 monthsFixed asset to turnover, 1:3 Gross profi t ratio, 25 per cent (to sales)Sales cash/credit, 1:2 Capital block:Debentures/share capital, 1:2 Net profi t, 10 per cent of turnover
Reserve, 2.5 per cent of turnover
SolutionBalance sheet as at March 31
Liabilities Amount Assets Amount
Share capital Rs 6,00,000 Fixed assets (net) Rs 8,00,000Reserves 60,000 Current assets:Profi t and loss A/c 2,40,000 Stock 3,00,000Debentures 3,00,000 Debtors 2,66,667Creditors 3,50,000 Other current assets 2,33,333Other current liabilities 50,000
16,00,000 16,00,000
Working Notes 1. Current ratio of 2 implies that CAs = twice CL, i.e., CA - 2CL = 0 Further, CA - CL = Rs 4,00,000 or, CL = Rs 4,00,000 and CA = Rs 8,00,000. 2. Capital block to current assets ratio of 3:2 implies that long-term capital funds (equity funds + debentures)
are 1.5 times current assets, i.e., Rs 8,00,000 3 1.5 = Rs 12,00,000. 3. Total assets = Total liabilities = Rs 16,00,000 (Rs 12,00,000 long-term funds + Rs 4,00,000 CL). 4. Fixed assets = Rs 16,00,000, Total assets – Rs 8,00,000, CA = Rs 8,00,000. 5. FA/Turnover (sales) = 1/3 or Sales = Rs 8,00,000 3 3 = Rs 24,00,000. 6. Proportion of cash sales to credit sales is 1:2 or cash sales are one-third of total sales, i.e. 1/3 3
Rs 24,00,000 = Rs 8,00,000; credit sales = Rs 16,00,000. 7. Gross profit = 0.25 3 Rs 24,00,000 = Rs 6,00,000; cost of goods sold = Rs 18,00,000. 8. Debtors = Rs 16,00,000/6 (Debtors turnover ratio, 12 4 2) = Rs 2,66,667. 9. Stock = Rs 18,00,000/6 (Stock turnover ratio, 12 4 2) = Rs 3,00,000. 10. Other CAs = Rs 8,00,000 – (Rs 2,66,667 + Rs 3,00,00) = Rs 2,33,333. 11. Reserves = 0.025 3 Rs 24,00,000 = Rs 60,000. 12. Credit purchases = Cost of goods sold + Closing stock = Rs 18,00,000 + Rs 3,00,000 = Rs 21,00,000. 13. Creditors = Rs 21,00,000 4 6 (creditors turnover ratio, 12 4 2) = Rs 3,50,000. 14. Other CLs = Total CL – Creditors, i.e. Rs 4,00,000 – Rs 3,50,000 = Rs 50,000. 15. Debentures to share capital ratio of 1:2 implies that debentures in value are equal to one-half of share
capital (2 Debentures = Share capital). Further, capital block (as per working note 3) is Rs 12,00,000. Rs 12,00,000 = Debentures + Share capital + Net profit + Reserves Rs 12,00,000 = 3 Debentures + Rs 2,40,000 (10 per cent of sales) + Rs 60,000 Rs 3,00,000 = Debentures; Share capital = Rs 6,00,000

CHAPTER 7
P.7.7 On investigation it was found that variable cost in XYZ Ltd is 80 per cent of the selling price. If the fixed expenses are Rs 10,000, calculate the break-even sales of the company. Another firm, IMN Company Ltd, having the same amount of fixed expenses, has its break-even point at a lower figure than that of XYZ Ltd. Comment on the causes.
Solution BEP (amount) = Rs 10,000/ P/V ratio (100 per cent-Variable cost to volume ratio = 0.80) = Rs 10,000/0.20 = Rs 50,000 (XYZ Ltd) The lower break-even point of IMN Ltd vis-à-vis XYZ Ltd is due to its lower variable expenses to volume ratio, which in turn may be either due to its lower VC per unit or higher SP per unit, eventually yielding higher contribution margin and, hence, higher P/V ratio and lower BEP.
P.7.8 Calculate from the following data (i) the value of output at which the business breaks even; and (ii) the percentage of capacity at which it breaks even:
Particulars Budget based on Shut down 100 per cent capacity expenditure
Direct wages Rs 2,09,964 Direct materials 2,44,552 Works expenses 88,292 Rs 93,528 Selling and distribution expenses 21,000 40,188 Administrative expenses 9,492 20,508 Net sales 8,40,000
Solution Determination of P/V ratio
(i) Net sales Rs 8,40,000 Less: Variable costs: Direct wages Rs 2,09,964 Direct materials 2,44,552 Works expenses 88,292 Selling and distribution expenses 21,000 Administrative expenses 9,492 5,73,300 Contribution (C) 2,66,700 P/V ratio (C ÷ Sales) (per cent) 31.75
BEP (amount) = Fixed costs (shut down expenditure)/P/V ratio = Rs 1,54,224/0.3175 = Rs 4,85,744.88(ii) Break-even sales/Sales at 100 per cent capacity = Rs 4,85,744.88/Rs 8,40,000 = 57.83 per cent
P.7.9 Calculate the break-even sales from the following data for a company producing three products:
Product Sales Variable costs
A Rs 10,000 Rs 6,000 B 5,000 2,500 C 5,000 2,000 20,000 10,500
Total fixed costs amount to Rs 5,700.

18 Financial Management
Solution Determination of weighted P/V ratio
Product Sales Variable costs Contribution
A Rs 10,000 Rs 6,000 4,000 B 5,000 2,500 2,500 C 5,000 2,000 3,000 20,000 10,500 9,500
Weighted P/V ratio = (Total contribution/Total sales) 3 100 = (Rs 9,500/ Rs 20,000) 3 100 = 47.5 per centBEP = FC/Weighted P/V ratio = Rs 5,700/0.475 = Rs 12,000
P.7.10 Market Well Ltd manufactures filing cabinets. For the current year, the company expects to sell 4,000 cabinets involving a loss of Rs 2,00,000. Only 40 per cent of the plant’s normal capacity is being utilised during the current year. The fixed costs for the year are Rs 10,00,000 and fully variable costs are 60 per cent of sales value. You are required to 1. Calculate the break-even point; 2. Calculate the profit if the company operates at 70 per cent of its normal capacity; 3. Calculate the sales required to achieve a profit of Rs 60,00,000; 4. Calculate the revised break-even point if the existing selling prices are decreased by 10 per cent, the
total fixed and variable expenses remaining the same.
Solution 1. BEP (amount) = FC/ PV ratio = Rs 10,00,000/0.40 = Rs 25,00,000
2. Determination of the existing sales volume and sales price per cabinet
Sales revenue X
Less: Variable cost (0.60) 0.6 X
Contribution (X – 0.6X)
Less: Fixed costs Rs 10,00,000
Loss (given) 2,00,000
0.4 X – Rs 10,00,000 = (– Rs 2,00,000)
0.4 X = Rs 8,00,000
X = 20,00,000 (sales revenue)
Sales price per cabinet = Rs 20,00,000/4,000 cabinets = Rs 500
Number of cabinets sold at 70 per cent capacity = 7,000 = (4,000 3 70/40)
Projected income statement at 70 per cent capacity
Sales revenue (7,000 3 Rs 500) Rs 35,00,000
Less: Variable cost (0.60) 21,00,000
Contribution 14,00,000
Less: Fixed costs 10,00,000
Profi t 4,00,000
Alternatively, (Expected sales revenue-Break-even sales revenue) 3 P/V ratio or (Margin of safety) 3 P/V ratio = (Rs 35,00,000 – Rs 25,00,000) 3 0.40 = Rs 4,00,000
3. Desired sales volume to earn a profit of Rs 60,00,000 = (FC + Rs 60,00,000)/0.40 = (Rs 10,00,000 + Rs 60,00,000)/0.40 = Rs 1,75,00,000
Additional Solved Problems 19
4. Break-even point (revised) at reduced selling price by 10 per cent
Sales price Rs 450 Less: Variable cost (0.60 3 Rs 500) 300 CM 150 P/V ratio (Rs 150/Rs 450) (%) 33.33 BEP Rs (10,00,000/0.3333) 30,00,000
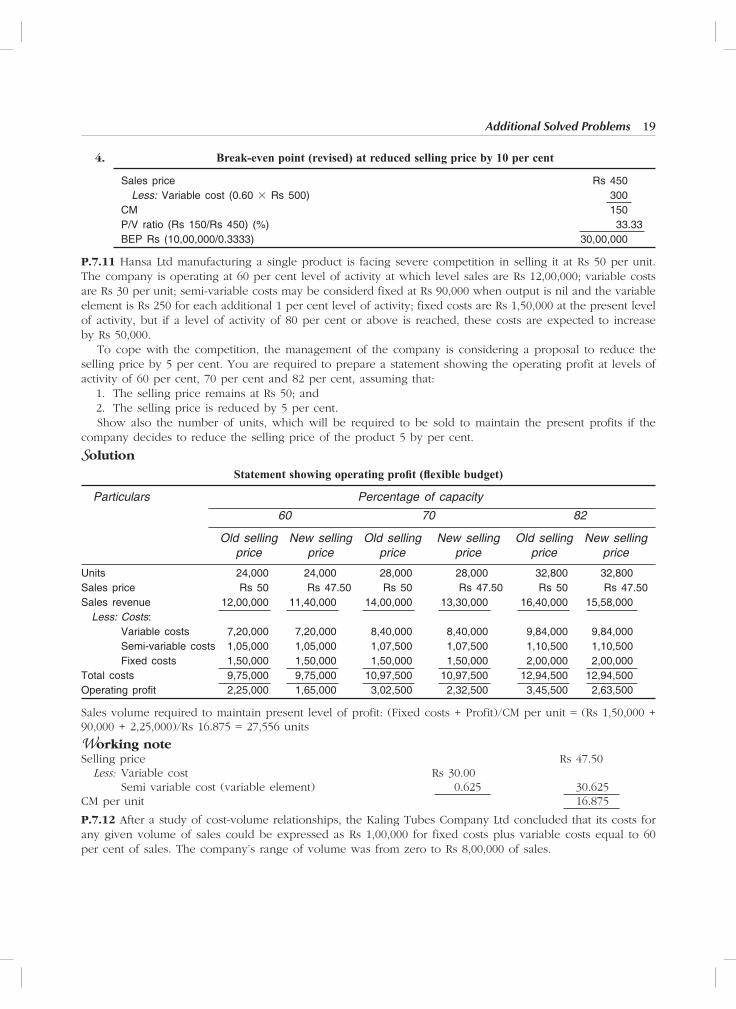
P.7.11 Hansa Ltd manufacturing a single product is facing severe competition in selling it at Rs 50 per unit. The company is operating at 60 per cent level of activity at which level sales are Rs 12,00,000; variable costs are Rs 30 per unit; semi-variable costs may be considerd fixed at Rs 90,000 when output is nil and the variable element is Rs 250 for each additional 1 per cent level of activity; fixed costs are Rs 1,50,000 at the present level of activity, but if a level of activity of 80 per cent or above is reached, these costs are expected to increase by Rs 50,000. To cope with the competition, the management of the company is considering a proposal to reduce the selling price by 5 per cent. You are required to prepare a statement showing the operating profit at levels of activity of 60 per cent, 70 per cent and 82 per cent, assuming that: 1. The selling price remains at Rs 50; and 2. The selling price is reduced by 5 per cent. Show also the number of units, which will be required to be sold to maintain the present profits if the company decides to reduce the selling price of the product 5 by per cent.
Solution
Statement showing operating profi t (fl exible budget)
Particulars Percentage of capacity
60 70 82
Old selling New selling Old selling New selling Old selling New selling price price price price price price
Units 24,000 24,000 28,000 28,000 32,800 32,800Sales price Rs 50 Rs 47.50 Rs 50 Rs 47.50 Rs 50 Rs 47.50Sales revenue 12,00,000 11,40,000 14,00,000 13,30,000 16,40,000 15,58,000 Less: Costs: Variable costs 7,20,000 7,20,000 8,40,000 8,40,000 9,84,000 9,84,000 Semi-variable costs 1,05,000 1,05,000 1,07,500 1,07,500 1,10,500 1,10,500 Fixed costs 1,50,000 1,50,000 1,50,000 1,50,000 2,00,000 2,00,000Total costs 9,75,000 9,75,000 10,97,500 10,97,500 12,94,500 12,94,500Operating profi t 2,25,000 1,65,000 3,02,500 2,32,500 3,45,500 2,63,500
Sales volume required to maintain present level of profit: (Fixed costs + Profit)/CM per unit = (Rs 1,50,000 + 90,000 + 2,25,000)/Rs 16.875 = 27,556 units
Working noteSelling price Rs 47.50 Less: Variable cost Rs 30.00 Semi variable cost (variable element) 0.625 30.625CM per unit 16.875
P.7.12 After a study of cost-volume relationships, the Kaling Tubes Company Ltd concluded that its costs for any given volume of sales could be expressed as Rs 1,00,000 for fixed costs plus variable costs equal to 60 per cent of sales. The company’s range of volume was from zero to Rs 8,00,000 of sales.

20 Financial Management
Prepare a graph, which will illustrate this cost-volume relationship. Also draw a proper sales line to the graph to form a break-even chart. Determine the break-even point. A competitor operating a plant of the same size as Kaling also has fixed cost of approximately Rs 1,00,000 per year, but his break-even point is Rs 3,00,000 of sales. What may be the probable causes of the difference between the break- even points of the Kaling Company Ltd and its competitor?
Solution Since selling price per unit is not given, it is necessary to draw the cost-volume graph on the same scale so that a 458 line can be the proxy of the sales line.
FIGURE 7.9 Volume-Cost-Profit Graph
Determination of two points for drawing the total cost line:
Sales revenue FC VC TC
Rs 1,00,000 Rs 1,00,000 Rs 60,000 Rs 1,60,000 8,00,000 1,00,000 4,80,000 5,80,000
The point of intersection of the TC line and sales line is BEP (Rs 2,50,000).Verification: FC/P/V ratio = Rs 1,00,000/0.40 = Rs 2,50,000Possible causes for the differences in BEP: 1. The competitors are having a higher variable cost to volume ratio than the Kaling Tubes Ltd. It is 66.67
per cent for the competitors, assuming the selling price per unit for both the firms is same. BEP = FC/ P/V ratio = Rs 3,00,000 = Rs 1,00,000 P/V ratio P/V ratio = Rs 1,00,000/ Rs 3,00,000 = 33.33 per cent 2. The competitors are having lower sales price per unit. Their prices per units are 6.67 per cent lower
than those of the Kaling Tubes Ltd as shown below: BEP = Rs 1,00,000/(0.9333-0.60) = Rs 1,00,000/0.3333 = Rs 3,00,000
Additional Solved Problems 21
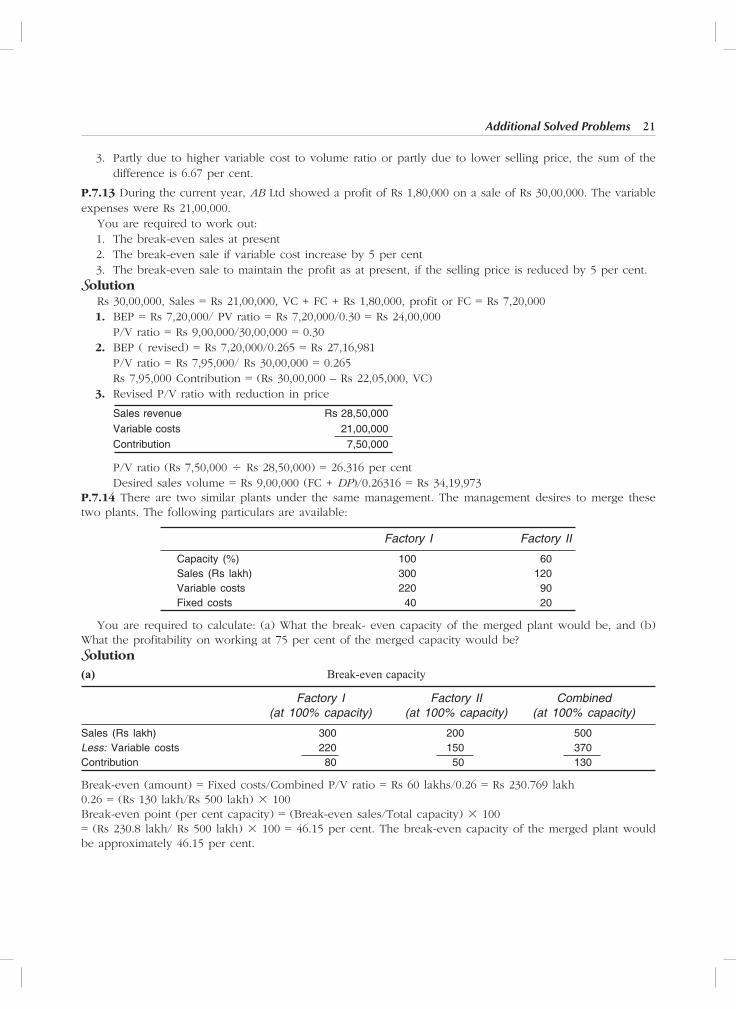
3. Partly due to higher variable cost to volume ratio or partly due to lower selling price, the sum of the difference is 6.67 per cent.
P.7.13 During the current year, AB Ltd showed a profit of Rs 1,80,000 on a sale of Rs 30,00,000. The variable expenses were Rs 21,00,000. You are required to work out: 1. The break-even sales at present 2. The break-even sale if variable cost increase by 5 per cent 3. The break-even sale to maintain the profit as at present, if the selling price is reduced by 5 per cent.Solution Rs 30,00,000, Sales = Rs 21,00,000, VC + FC + Rs 1,80,000, profit or FC = Rs 7,20,000 1. BEP = Rs 7,20,000/ PV ratio = Rs 7,20,000/0.30 = Rs 24,00,000 P/V ratio = Rs 9,00,000/30,00,000 = 0.30 2. BEP ( revised) = Rs 7,20,000/0.265 = Rs 27,16,981 P/V ratio = Rs 7,95,000/ Rs 30,00,000 = 0.265 Rs 7,95,000 Contribution = (Rs 30,00,000 – Rs 22,05,000, VC) 3. Revised P/V ratio with reduction in price
Sales revenue Rs 28,50,000
Variable costs 21,00,000
Contribution 7,50,000
P/V ratio (Rs 7,50,000 4 Rs 28,50,000) = 26.316 per cent Desired sales volume = Rs 9,00,000 (FC + DP)/0.26316 = Rs 34,19,973P.7.14 There are two similar plants under the same management. The management desires to merge these two plants. The following particulars are available:
Factory I Factory II
Capacity (%) 100 60 Sales (Rs lakh) 300 120 Variable costs 220 90 Fixed costs 40 20
You are required to calculate: (a) What the break- even capacity of the merged plant would be, and (b) What the profitability on working at 75 per cent of the merged capacity would be?Solution
(a) Break-even capacity
Factory I Factory II Combined (at 100% capacity) (at 100% capacity) (at 100% capacity)
Sales (Rs lakh) 300 200 500Less: Variable costs 220 150 370Contribution 80 50 130
Break-even (amount) = Fixed costs/Combined P/V ratio = Rs 60 lakhs/0.26 = Rs 230.769 lakh0.26 = (Rs 130 lakh/Rs 500 lakh) 3 100Break-even point (per cent capacity) = (Break-even sales/Total capacity) 3 100= (Rs 230.8 lakh/ Rs 500 lakh) 3 100 = 46.15 per cent. The break-even capacity of the merged plant would be approximately 46.15 per cent.

22 Financial Management
(b) Income statement at 75 per cent merged capacity
Sales (Rs lakh) 375.00 Less: Variable costs (0.74 3 V/V ratio) 277.50 Contribution 97.50 Less: Fixed costs 60.00 Net profi t 37.50
Alternatively, (Actual sales – BE sales) 3 P/V ratio = (Rs 375 lakh – Rs 230.769 lakh) 3 0.26 = Rs 37.50 lakhP.7.15 The question as to which products to stress in order to obtain the most profitable sales-mix has always been of prime importance to businessmen. The amount of profit contribution, or the difference between the selling price and the variable costs, tells how much each product is contributing to fixed costs and profit in the present sales-mix. This information assists management in forming an opinion as to which products will add to profits if sales of these units can be increased. Direct cost data can be utilised in this type of analysis when management seeks an answer to the question: “Which product shall we push”?
Data Product A Product B
Selling price Rs 12.60 Rs 5.50
Variable cost 9.62 4.18
Fixed costs 2.07 0.65
Units per hour 45 0.70
1. What is the amount of net profit for each product? 2. What is the percentage of profit to selling price for each product? 3. What is the amount of profit contribution towards fixed cost and the profit for each product? 4. What is the profit contribution ratio? 5. What is the profit contribution per hour for each product? 6. If one allocates: (a) 200 hours to Product A and 100 hours to Product B or (b) 100 hours to Product A
and 200 hours to Product B, which of the two courses is more profitable?Solution
1. Net profi t for products A and B
Particulars A B
Selling price Rs 12.60 Rs 5.50
Less: Costs:
Variable 9.62 4.18
Fixed 2.07 0.65
Net profi t 0.91 0.67
2. Percentage of profit to selling price = (Net profit 3 100) 4 Selling price 7.22 12.18 3. Profit contribution (Selling price-Variable costs) 2.98 1.32 4. P/V ratio (%) 23.65 24 5. (Profit contribution per unit 3 Units produced per hour) Product A : Rs 2.98 3 45 134.10 B : Rs 1.32 3 70 92.40
Additional Solved Problems 23
6. Statement of Profit
Particulars Alternative (a) Alternative (b)
Product A (Profi t contribution per hour Rs 134.10 Rs 134.10 3 Hours) 3 200 3 100 (a) 26,820 (a) 13,410 Product B (Profi t contribution per hour 92.40 92.40 3 Hours) 3 100 3 200 (b) 9,240 (b) 18,480 Total profi t [(a) + (b)] 36,060 31,890
Alternative (a) of allocating 200 hours to Product A and 100 hours to Product B is the more profitable course as it yields higher profits.
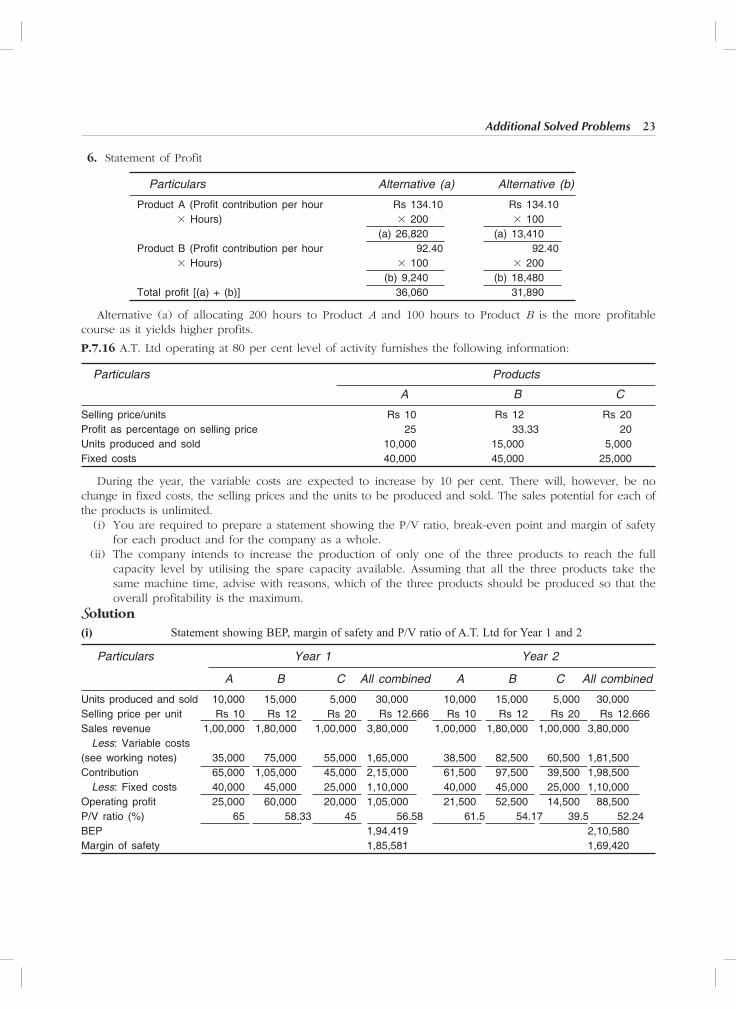
P.7.16 A.T. Ltd operating at 80 per cent level of activity furnishes the following information:
Particulars Products
A B C
Selling price/units Rs 10 Rs 12 Rs 20Profi t as percentage on selling price 25 33.33 20Units produced and sold 10,000 15,000 5,000Fixed costs 40,000 45,000 25,000
During the year, the variable costs are expected to increase by 10 per cent. There will, however, be no change in fixed costs, the selling prices and the units to be produced and sold. The sales potential for each of the products is unlimited. (i) You are required to prepare a statement showing the P/V ratio, break-even point and margin of safety
for each product and for the company as a whole. (ii) The company intends to increase the production of only one of the three products to reach the full
capacity level by utilising the spare capacity available. Assuming that all the three products take the same machine time, advise with reasons, which of the three products should be produced so that the overall profitability is the maximum.
Solution
(i) Statement showing BEP, margin of safety and P/V ratio of A.T. Ltd for Year 1 and 2
Particulars Year 1 Year 2
A B C All combined A B C All combined
Units produced and sold 10,000 15,000 5,000 30,000 10,000 15,000 5,000 30,000Selling price per unit Rs 10 Rs 12 Rs 20 Rs 12.666 Rs 10 Rs 12 Rs 20 Rs 12.666Sales revenue 1,00,000 1,80,000 1,00,000 3,80,000 1,00,000 1,80,000 1,00,000 3,80,000 Less: Variable costs(see working notes) 35,000 75,000 55,000 1,65,000 38,500 82,500 60,500 1,81,500Contribution 65,000 1,05,000 45,000 2,15,000 61,500 97,500 39,500 1,98,500 Less: Fixed costs 40,000 45,000 25,000 1,10,000 40,000 45,000 25,000 1,10,000Operating profi t 25,000 60,000 20,000 1,05,000 21,500 52,500 14,500 88,500P/V ratio (%) 65 58.33 45 56.58 61.5 54.17 39.5 52.24BEP 1,94,419 2,10,580Margin of safety 1,85,581 1,69,420

24 Financial Management
Working NotesA Rs 1,00,000 = 40,000 FC + Rs 25,000 profit (0.25 3 Rs 1,00,000) + VC, that is, Rs 35,000.B Rs 1,80,000 = 45,000 FC + Rs 60,000 profit (0.3333 3 Rs 1,80,000) + VC, that is, Rs 75,000.C Rs 1,00,000 = 25,000 FC + Rs 20,000 profit (0.20 3 Rs 1,00,000) + VC, that is, Rs 55,000. (ii) Product C should be produced to utilise the SP are capacity of 20 per cent as its marginal contribution per unit is maximum as shown below:
Particulars A B C
Sales price Rs 10 Rs 12 Rs 20 Less: Variable cost per unit 3.5 5.0 11 CM 6.5 7.0 9.0

CHAPTER 8
P.8.5 The Delhi Electrical Supply Company Ltd has a business of supplying electrical goods to various government and non-government companies. The controller, in collaboration with the economist, has developed the following equation that, he says, will forecast sales quite well, based on past pattern of behaviour: monthly sales (amount) = Rs 1,00,000 + (Rs 2,000 x orders received in prior month). The sales manager is confused and seeks your advice. He presents you with the following data regarding actual and forecast numbers of orders. The forecasts have generally been quite accurate.
August (actual) 200 September (forecast) 300 October 450 November 700 December 650
It is the first week of September, the sales manager would like the forecasts of sales and income for as many months as you can prepare. The cost accountant informs you that costs of goods sold, which are all fixed costs, amount to Rs 2,00,000 per month. You are required to prepare the budgeted income statement for as many months as you can.Solution
Budgeted income statement of Delhi Electric Supply Company Ltd
Particulars September October November December January
Sales: Fixed component Rs 1,00,000 Rs 1,00,000 Rs 1,00,000 Rs 1,00,000 Rs 1,00,000 Variable component (Rs 2,000 3 orders received in previous months) 4,00,000 6,00,000 9,00,000 14,00,000 13,00,000Total sales 5,00,000 7,00,000 10,00,000 15,00,000 14,00,000 Less: Cost of goods sold (0.50 3 of sales) 2,50,000 3,50,000 5,00,000 7,50,000 7,00,000Contribution (manufacturing) 2,50,000 3,50,000 5,00,000 7,50,000 7,00,000 Less: Other variable costs (0.20 3 sales) 50,000 70,000 1,00,000 1,50,000 1,40,000Contribution (fi nal) 2,00,000 2,80,000 4,00,000 6,00,000 5,60,000 Less: Fixed costs 2,00,000 2,00,000 2,00,000 2,00,000 2,00,000Income — 80,000 2,00,000 4,00,000 3,60,000
P. 8.6 The cost of an article at the capacity level of 5,000 units is given under A below. For a variation of 25 per cent in capacity above or below this level, the individual expenses vary as indicated under B below:
Particulars A B (per cent)
Material cost Rs 25,000 100 (variable) Labour cost 15,000 100 (variable) Power 1,250 80 (semi-variable) Repairs and maintenance 2,000 75 (semi-variable) Stores 1,000 100 (variable) Inspection 500 20 (semi-variable)
(Contd)

26 Financial Management
Administration overheads 5,000 25 (semi-variable) Selling overheads 3,000 50 (semi-variable) Depreciation 10,000 100 (fi xed)Total 62,750Cost per unit 12.55
Prepare the production cost budget at 4,000 units and 6,000 units.
SolutionProduction cost (fl exible) budget
Particulars 4,000 units 6,000 units
Material cost (variable) Rs 20,000 Rs 30,000 Labour cost (variable) 12,000 18,000 Stores (variable) 800 1,200 Power (semi-variable) 1,050 1,450 Repairs and maintenance (semi-variable) 1,700 2,300 Inspection (semi-variable) 480 520 Administration overheads (semi-variable) 4,750 5,250 Selling overheads (semi-variable) 2,700 3,300 Depreciation (fi xed) 10,000 10,000Total 53,480 72,020Cost per unit 13.37 12.00
P.8.7 The Jay Engineering Limited manufacturers only one product, which passes through three departments. A study has been made by the cost accountant in consultation with engineers, technicians and other production experts of the variability of overheads. Each item was carefully analysed and the results are summarised as follows:Department 2; Normal level of activity, 5,000 machine-hours.
Overheads Fixed amount Variable rate per machine-hour
Indirect material Rs 1,200 Rs 0.20 Supervision and inspection 9,600 — Indirect labour 2,400 0.40 Repairs and maintenance 1,800 0.30 Power, heat and light 4,200 1.20 Water 1,200 0.10 Telephone 2,400 0.10 Insurance 3,000 — Depreciation 9,600 — Miscellaneous 600 0.10 36,000 2.40 Machine hour rate at normal level of activity: Fixed (Rs 36,000 ÷ 5,000 hours) 7.20 Variable 2.40Total 9.60
The study has estimated the following results for a level of activity of 7,000 machine-hours: 1. Indirect labour will increase by Rs 800. 2. Increased supervision will be needed at a cost of Rs 1,400. 3. Increased maintenance and repairs are estimated at Rs 600.
(Contd)

Additional Solved Problems 27
4. Machinery will depreciate more rapidly than estimated at the normal level of activity to the extent of Rs 1,400.
5. Overtime will cost Rs 3,200. Prepare a flexible budget at 4,000, 5,000, 6,000 and 7,000 machine-hours and also determine the machine-hour rate at these levels.
SolutionDepartment 2: fl exible budget
Overheads Level of activity in machine-hours
4,000 5,000 6,000 7,000
Indirect material Rs 2,000 Rs 2,200 Rs 2,400 Rs 2,600Supervision and inspection 9,600 9,600 9,600 11,000Indirect labour 4,000 4,400 4,800 6,000Repairs and maintenance 3,000 3,300 3,600 4,500Power, heat and light 9,000 10,200 11,400 12,600Water 1,600 1,700 1,800 1,900Telephone 2,800 2,900 3,000 3,100Insurance 3,000 3,000 3,000 3,000Depreciation 9,600 9,600 9,600 11,000Overtime cost — — — 3,200Miscellaneous 1,000 1,100 1,200 1,300 45,600 48,000 50,400 60,200Machine-hour rate 11.40 9.6 8.4 8.6
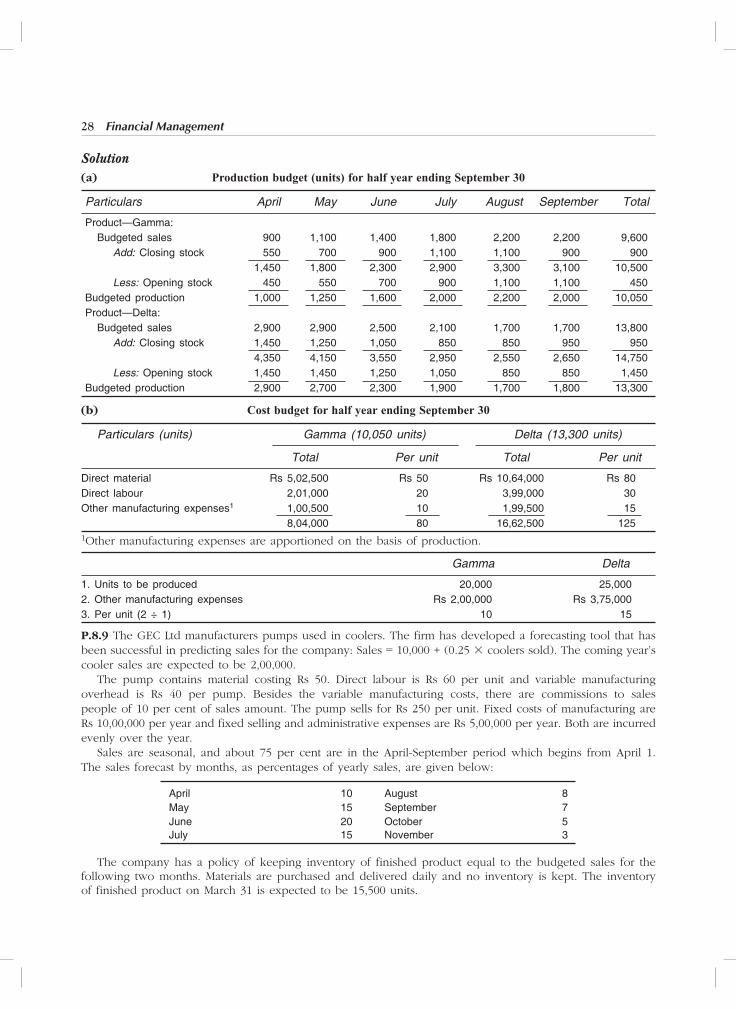
P.8.8 A company is drawing its production plan for the next year in respect of two of its products ‘Gamma’ and ‘Delta’. The company’s policy is not to carry any closing work-in-process (WIP) at the end of any month. However, its policy is to hold a closing stock of finished goods at 50 per cent of the anticipated quantity of sales of the succeeding month. For the next year, the company’s budgeted production is 20,000 units of ‘Gamma’ and 25,000 units of ‘Delta’. The following is the estimated cost data:
Particulars Gamma Delta
Direct material per unit Rs 50 Rs 80Direct labour per unit 20 80Other manufacturing expenses apportionable to each type of product based on production 2,00,000 3,75,000
The estimated units to be sold in the first 7 months of the next year are as under:
Particulars April May June July August September October
Gamma 900 1100 1400 1800 2200 2200 1800Delta 2900 2900 2500 2100 1700 1700 1900
You are required to (a) Prepare a production budget showing month-wise number of units to be manufactured: (b) Present a summarised production cost budget for the half-year ending September 30.
28 Financial Management
Solution(a) Production budget (units) for half year ending September 30
Particulars April May June July August September Total
Product—Gamma: Budgeted sales 900 1,100 1,400 1,800 2,200 2,200 9,600 Add: Closing stock 550 700 900 1,100 1,100 900 900 1,450 1,800 2,300 2,900 3,300 3,100 10,500 Less: Opening stock 450 550 700 900 1,100 1,100 450Budgeted production 1,000 1,250 1,600 2,000 2,200 2,000 10,050Product—Delta: Budgeted sales 2,900 2,900 2,500 2,100 1,700 1,700 13,800 Add: Closing stock 1,450 1,250 1,050 850 850 950 950 4,350 4,150 3,550 2,950 2,550 2,650 14,750 Less: Opening stock 1,450 1,450 1,250 1,050 850 850 1,450Budgeted production 2,900 2,700 2,300 1,900 1,700 1,800 13,300
(b) Cost budget for half year ending September 30
Particulars (units) Gamma (10,050 units) Delta (13,300 units)
Total Per unit Total Per unit
Direct material Rs 5,02,500 Rs 50 Rs 10,64,000 Rs 80Direct labour 2,01,000 20 3,99,000 30Other manufacturing expenses1 1,00,500 10 1,99,500 15 8,04,000 80 16,62,500 1251Other manufacturing expenses are apportioned on the basis of production.
Gamma Delta
1. Units to be produced 20,000 25,000 2. Other manufacturing expenses Rs 2,00,000 Rs 3,75,000 3. Per unit (2 ÷ 1) 10 15
P.8.9 The GEC Ltd manufacturers pumps used in coolers. The firm has developed a forecasting tool that has been successful in predicting sales for the company: Sales = 10,000 + (0.25 3 coolers sold). The coming year’s cooler sales are expected to be 2,00,000. The pump contains material costing Rs 50. Direct labour is Rs 60 per unit and variable manufacturing overhead is Rs 40 per pump. Besides the variable manufacturing costs, there are commissions to sales people of 10 per cent of sales amount. The pump sells for Rs 250 per unit. Fixed costs of manufacturing areRs 10,00,000 per year and fixed selling and administrative expenses are Rs 5,00,000 per year. Both are incurred evenly over the year. Sales are seasonal, and about 75 per cent are in the April-September period which begins from April 1. The sales forecast by months, as percentages of yearly sales, are given below:
April 10 August 8May 15 September 7June 20 October 5July 15 November 3
The company has a policy of keeping inventory of finished product equal to the budgeted sales for the following two months. Materials are purchased and delivered daily and no inventory is kept. The inventory of finished product on March 31 is expected to be 15,500 units.

Additional Solved Problems 29
You are required to prepare a: (i) Budgeted income statement for the coming year (ii) Budgeted income statement for the first six months of the year. (iii) Production budget by months for the first six months, in unit.
Solution(i) and (ii) Budgeted income statement
Particulars Six months Year
Sales (units) 45,000 60,000Sales price per unit Rs 250 Rs 250Total sales revenue 1,12,50,000 1,50,00,000 Less: Variable costs: Materials (Rs 60 per unit) 22,50,000 30,00,000 Labour (Rs 50 per unit) 27,00,000 36,00,000 Overheads (Rs 40 per unit) 18,00,000 24,00,000Contribution (manufacturing) 45,00,000 60,00,000 Less: Sales commission (0.10 3 sales) 11,25,000 15,00,000Contribution (fi nal) 33,75,000 45,00,000 Less: Fixed costs Manufacturing 5,00,000 10,00,000 Selling and administrative 2,50,000 5,00,000Income 26,25,000 30,00,000
(iii) Production budget (units)
Month Sales Planned inventory Required production
Closing Opening (Col. 2 + 3 – 4)
1 2 3 4 5
April 6,000 21,000 15,500 11,500May 9,000 21,000 21,000 9,000June 12,000 13,800 21,000 4,800July 9,000 9,000 13,800 4,200August 4,800 7,200 9,000 3,000September 4,200 4,800 7,200 1,800
Working Notes(i) Sales forecasts for the coming year = 10,000 + (0.25 3 2,00,000) = 60,000 unitsSales forecasts by month (units):
April (0.10) 6,000May (0.15) 9,000June (0.20) 12,000July (0.15) 9,000August (0.08) 4,800September (0.07) 4,200.= 45,000 units (75 per cent)October (0.05) 3,000November (0.03) 1,800

CHAPTER 9
P.9.13 Swastik Ltd, manufacturers of special purpose machine tools, have two divisions which are periodi-cally assisted by visiting teams of consultants. The management is worried about the steady increase of expenses in this regard over the years. An analysis of the last year’s expenses reveals the following: The management estimates accommodation expenses to increase by Rs 2,00,000 annually. As part of cost reduction drive, Swastik Ltd is proposing to construct a consultancy centre to take care of the accommodation requirements of the consultants. This centre will additionally save the company Rs 50,000 in boarding charges and Rs 2,00,000 in the cost of executive training programme hitherto conducted outside the company’s premises, every year. The following details are available regarding the construction and maintenance of the new centre. (a) Land: at a cost of Rs 8,00,000 already owned by the company, will be used. (b) Construction: Rs 15,00,000 including special furnishing. (c) Cost of annual maintenance: Rs 1,50,000. (d) Construction cost will be written off (at a uniform rate) over 5 years, being the useful life. Assuming that the write-off of construction cost as aforesaid will be accepted for tax purposes, that the rate of tax will be 35 per cent and that the desired rate of return is 15 per cent, you are required to analyse the feasibility of the proposal and make recommendations. Use present value up to two digits.Solution
Financial feasibility of constructing consultancy centre (Amount in lakh of rupees)
Particulars Years
1 2 3 4 5
Cost savings: Accommodation expenses 8 10 12 14 16 Boarding charges 0.5 0.5 0.5 0.5 0.5 Hire charges of executive training programme 2.0 2.0 2.0 2.0 2.0Total 10.5 12.5 14.5 16.5 18.5 Less: Cost of annual maintenance 1.5 1.5 1.5 1.5 1.5 Less: Amortization of construction cost 3.0 3.0 3.0 3.0 3.0Net savings/EBT 6.0 8.0 10.0 12.0 14.0 Less: Taxes (0.35) 2.1 2.8 3.5 4.2 4.9EAT 3.9 5.2 6.5 7.8 9.1CFAT 6.9 8.2 9.5 10.8 12.1(x) PV factor at (0.15) 0.87 0.76 0.66 0.57 0.50Present value 6.00 6.23 6.27 6.16 6.05
Total present value (t = 1 – 6) 30.71 Less: Incremental CO 15.00NPV 15.71
Recommendation It is desirable for the company to construct its own consultancy centre.
Notes: (i) Land cost does not involve any additional cash flows. (ii) The firm will continue to incur expenses namely, consultants’ remuneration, travel and conveyance
and special allowances, and, hence, ignored.
Consultants’ remuneration Rs 2,50,000 Travel and conveyance 1,50,000 Accommodation expenses 6,00,000 Boarding charges 2,00,000 Special allowances 50,000 12,50,000

Additional Solved Problems 31
P.9.14 A plastic manufacturing company is considering replacing an older machine which was fully depre-ciated for tax purposes with a new machine costing Rs 40,000. The new machine will be depreciated over its eight-year life. It is estimated that the new machine will reduce labour costs by Rs 8,000 per year. The management believes that there will be no change in other expenses and revenues of the firm due to the machine. The company requires an after-tax return on investment of 10 per cent. Its rate of tax is 35 per cent. The company’s income statement for the current year is given for other informations.
Income statement for the current year
Sales Rs 5,00,000 Costs: Materials Rs 1,50,000 Labour 2,00,000 Factory and administrative 40,000 Depreciation 40,000 4,30,000 Net income before taxes 70,000 Taxes (0.35) 24,500 Earnings after taxes 45,500
Should the company buy the new machine? You may assume the company follows straight line method of depreciation and the same is allowed for tax purposes.Solution
Cash infl ows: (i) Present: Earnings after taxes Rs 45,500 Add: Depreciation 40,000 CFAT (present) 85,500 (ii) Estimated CFAT, if the new machine is purchased:
Sales 5,00,000
Costs: Material Rs 1,50,000 Labour 1,92,000 Factory and administrative 40,000 Depreciation (including Rs 5,000 on new machine) 45,000 4,27,000 Net income before taxes 73,000 Taxes 25,550 Earnings after taxes 47,450 Add: Depreciation 45,000 CFAT (expected) 92,450 (iii) Differential cash fl ow: Rs 92,450 – Rs 85,500 6,950
(iv) Determination of NPV
Years CFAT PV factor (0.10) Total PV
1-8 Rs 6,950 5.335 Rs 37,078 Less: Cost of new machine 40,000 NPV (2,922)
Recommendation Since the NPV is negative, the new machine should not be purchased.P.9.15 The United Petroleum Ltd (UPL) has a retail outlet of petrol, diesel and petroleum products. Presently, it has two pumps exclusively for petrol, one for non-lead petrol and one for diesel. Free air filling is carried out for vehicles buying fuel from the outlet. The pumps have a useful life of 10 years with no salvage value as the underground tank will be completely corroded and unfit for reuse.

32 Financial Management
The UPL sells petrol and diesel @ Rs 23 and Rs 10 per litre respectively. The existing annual sale is petrol, 5 lakh litres, and diesel, 2 lakh litres. Its earnings are 4 per cent as commission on sales. Due to a manifold increase in traffic, the existing pumps are not able to meet the demand during peak hours. The UPL is contemplating installation of additional pumps for diesel and petrol at a cost of Rs 10,00,000 together with additional working capital of Rs 5,00,000. The additional sales of petrol and diesel are expected to be 2 lakh litres and 1 lakh litres per annum respectively. As a result of the installation of the new pump, the operating cost would increase by Rs 24,000 annually by way of salary of the pump operator. Other yearly associated additional costs are estimated to be: insurance @ 1 per cent of the cost of the pump, maintenance cost, Rs 12,000 and power costs, Rs 13,000. United Petroleum Ltd pays 35 per cent on tax on its income. Depreciation will be on straight line basis and the same is allowed for tax purposes. The management of UPL seeks your advice on the financial viability of the expansion proposal. Prepare a report for its consideration, assuming 12 per cent required rate of return.Solution
Financial analysis for setting up additional pumps (using NPV method)
Cash outfl ows:
Cost of new pump Rs 10,00,000
Increase in working capital 5,00,000 15,00,000 Incremental CFAT and NPV (years (1 - 10): Commission on incremental sales Petrol: 2 lakhs 3 Rs 23 3 0.04 1,84,000 Diesel: 1 lakh 3 Rs 10 3 0.04 40,000 2,24,000 Less: Incremental costs: Salary Rs 24,000 Insurance 10,000 Maintenance costs 12,000 Power costs 13,000 Depreciation (Rs 10 lakh/10) 1,00,000 1,59,000 Earnings before taxes 65,000 Less: Taxes 22,750 Earnings after taxes 42,250 CFAT (EAT + D) 1,42,250 (x) PV factor for annuity for 10 years (0.12) 5.650 Present value 8,03,713 Add: PV of recovery of working capital (Rs 5,00,000 3 0.322) 1,61,000 Total present value 9,64,713 Less: Cash outfl ows 15,00,000 NPV (5,35,287)
Recommendation Since NPV is negative, the installation of additional pumps is not financially viable.P.9.16 Senior executives of Laxmi Rice Mill Ltd have been considering the proposal to replace the existing coal-fired furnace in the paddy boiling section by a new furnace is cyclone type husk-fired furnace. The capital cost of the new furnace is expected to be Rs 1 lakh. It will have useful life of 10 years at the end of which period its residual value will be negligible. The present furnace has a book value of Rs 15,000 and can be used for another 10 years with only minor repairs. If scrapped now, it can fetch Rs 10,000 but it cannot fetch any amount if scrapped after ten more years of use. The basic advantage of the new furnace is that it does not depend on the coal whose supplies are becoming increasingly erratic in recent years. On a conservative estimate, the new furnace will result in a saving of Rs
Additional Solved Problems 33
25,000 per annum on account of eliminated coal cost. However, the cost of electricity and other operating expenses are likely to go up by Rs 8,000 and Rs 4,000 per annum respectively. The husk which results as a by-product during the normal milling operations at 3,000 metric ton of paddy milled per year is considered adequated for operating the new furnace. On a average, for every metric ton of paddy milled, the husk content is 20 per cent. At present, the husk resulting during the milling operations is sold at a price of Rs 50 per metric ton. Once the new furnace is installed, the husk will be diverted for own use. ‘White Ash’ which constitutes about 5 percent of the husk burnt in the new furnace, will be collected in a separate ash-pit as it has considerable demand in the refractory industry. It can be sold very easily at a price of Rs 1,500 per metric ton. The new furnace will require a motor of 15 HP, whose cost is not included in Rs 1 lakh, the capital cost of the furnace. A 15 HP motor is lying idle with the polishing section of the Mill which can fetch an amount of Rs 3,000 on sale. It has a net book value of Rs 5,000. The motor can be used for the new furnace. At the end of the ten years, it can be scrapped at zero residual value. All the assets of the company are in the same block. Depreciation will be on straight line basis and the same is assumed to be acceptable for tax purpose as well. Applicable tax rate is 35 per cent and cost of capital is 12 per cent.
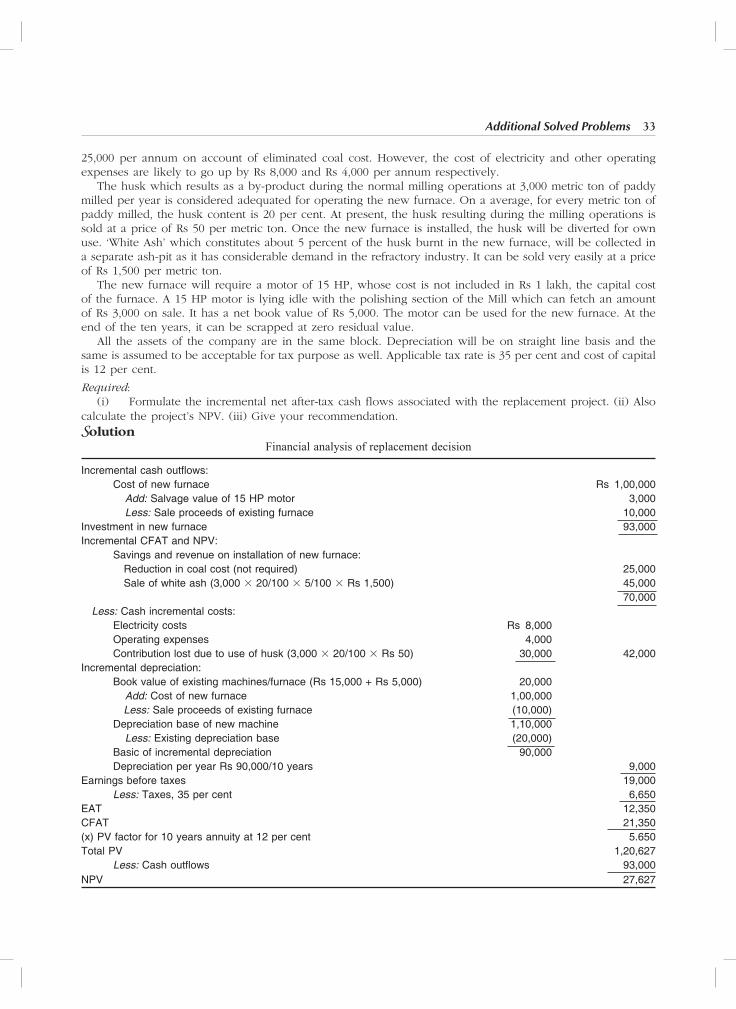
Required: (i) Formulate the incremental net after-tax cash flows associated with the replacement project. (ii) Also calculate the project’s NPV. (iii) Give your recommendation.Solution
Financial analysis of replacement decision
Incremental cash outfl ows: Cost of new furnace Rs 1,00,000 Add: Salvage value of 15 HP motor 3,000 Less: Sale proceeds of existing furnace 10,000Investment in new furnace 93,000Incremental CFAT and NPV: Savings and revenue on installation of new furnace: Reduction in coal cost (not required) 25,000 Sale of white ash (3,000 3 20/100 3 5/100 3 Rs 1,500) 45,000 70,000 Less: Cash incremental costs: Electricity costs Rs 8,000 Operating expenses 4,000 Contribution lost due to use of husk (3,000 3 20/100 3 Rs 50) 30,000 42,000Incremental depreciation: Book value of existing machines/furnace (Rs 15,000 + Rs 5,000) 20,000 Add: Cost of new furnace 1,00,000 Less: Sale proceeds of existing furnace (10,000) Depreciation base of new machine 1,10,000 Less: Existing depreciation base (20,000) Basic of incremental depreciation 90,000 Depreciation per year Rs 90,000/10 years 9,000Earnings before taxes 19,000 Less: Taxes, 35 per cent 6,650EAT 12,350CFAT 21,350(x) PV factor for 10 years annuity at 12 per cent 5.650Total PV 1,20,627 Less: Cash outfl ows 93,000NPV 27,627

34 Financial Management
Recommendation As NPV is positive, the company is advised to replace the existing coal-fired furnace by new furnace.
P.9.17 Nine Gems Ltd has just installed Machine-R at a cost of Rs 2,00,000. The machine has a five year life with no residual value. The annual volume of production is estimated at 1,50,000 units, which can be sold at Rs 6 per unit. Annual operating costs are estimated at Rs 2,00,000 (excluding depreciation) at this output level. Fixed costs are estimated at Rs 3 per unit for the same level of production. Nine Gems Ltd has just come across another model called Machine-S capable of giving the same output at an annual operating cost of Rs 1,80,000 (exclusive of depreciation). There will be no change in fixed costs. Capital cost of this machine is Rs 2,50,000 and the estimated life is for 5 years with no residual value. The company has an offer for sale of Machine-R at Rs 1,00,000. The cost of dismantling and removal will be Rs 30,000. As the company has not yet commenced operations, it wants to sell Machine-R and purchase Machine-S. Nine Gems Ltd will be a zero-tax company, for seven years in view of several incentives and allowances available. The cost of capital may be assumed at 14 per cent. (i) Advise whether the company should opt for replacement. (ii) Will there be any change in your view if Machine-R has not been installed but the company is in
the process of selecting one or the other machine?
Solution Financial evaluation of whether to replace Machine-R(i) Incremental cash outfl ows
Cost of Machine-S Rs 2,50,000
Less: Effective sale proceeds of Machine-R (Rs 1,00,000 – Rs 30,000, dismantling/removal costs) 70,000 1,80,000Incremental cash infl ows and NPV (for years t = 1 – 5) Savings in annual operating costs: Annual cash operating costs (R) Rs 2,00,000 Annual cash operating costs (S) 1,80,000 20,000 (x) PV factor of annuity for 5 years (0.14) 3 3.433Total present value 68,660 Less: Incremental cash outfl ows 1,80,000NPV (1,11,340)
Recommendation Since NPV is negative, the company is advised not to replace Machine-R.
(ii) Financial evaluation of Machine-R and S (determination of NPV)
Particulars Machine-R Machine-S
Sales revenue (1,50,000 3 Rs 6) Rs 9,00,000 Rs 9,00,000 Less: Operating costs 2,00,000 1,80,000 Less: Fixed costs (1,50,000 3 Rs 3) 4,50,000 4,50,000Annual cash infl ows 2,50,000 2,70,000(x) PV factor of annuity for 5 years (0.14) (3) 3.433 (3) 3.433Total present value 8,58,250 9,26,910 Less: Cash outfl ows 2,00,000 2,50,000Net present value 6,58,250 6,76,910
Recommendation As NPV of Machine-S is higher, the company is advised to opt for Machine-S
Note: As the company is a zero-tax company for seven yerars and life of both the machines is five years only, depreciation aspect is not relevant.

Additional Solved Problems 35
P.9.18 Band-Box is considering the purchase of a new wash and dry equipment in order to expand its opera-tions. Two types of options are available: a low-speed system (LSS) with a Rs 20,000 initial cost and a high speed system (HSS) with an initial cost of Rs 30,000. Each system has a fifteen year life and no salvage value. The net cash flows after taxes (CFAT) associated with each investment proposal are:
Low speed system (LSS) High speed system (HSS)CFAT for years 1 through 15 Rs 4,000 Rs 6,000
Which speed system should be chosen by Band-Box, assuming 14 per cent cost of capital?
Solution
Determination of NPV
Years CFAT PV factor (0.14) Total PV
LSS HSS LSS HSS
1-15 Rs 4,000 Rs 6,000 6.142 Rs 24,568 Rs 36,852 Less: Initial cost 20,000 30,000 NPV 4,568 6,852
The high speed system should be chosen by Band-Box as its NPV is greater.
P.9.19 Welcome Limited is considering the manufacture of a new product. They have prepared the following estimate of profit in the first year of manufacture:
Sales, 9,000 units @ Rs 32 Rs 2,88,000 Cost of goods sold: Labour 40,000 hours @ Rs 3.50 per hour Rs 1,40,000 Materials and other variable costs 65,000 Depreciation 45,000 2,50,000 Less: Closing stock 25,000 2,25,000 Net profi t 63,000
The product is expected to have a life of four years. Annual sales volume is expected to be constant over the period at 9,000 units. Production which was estimated at 10,000 units in the first year would be only 9,000 units each in year two and three and 8,000 units in year four. Debtors at the end of each year would be 20 per cent of sales during the year; creditors would be 10 per cent of materials and other variable costs. If sales differed from the forecast level, stocks would be adjusted in proportion. Depreciation relates to machinery which would be purchased especially for the manufacture of the new product and is calculated on the straight line basis assuming that the machinery would last for four years and have no terminal scrap value. Fixed costs are included in labour cost. There is high level of confidence concerning the accuracy of all the above estimates except the annual sales volume. Cost of capital is 20 per cent per annum. You may assume that debtors are realised and creditors are paid in the following year. No changes in the prices of inputs or outputs are expected over the next four years. You are required to show whether the manufacture of the new product is worthwhile. Ignore taxes.Solution Cash outflows:
Cost of the machine(Depreciation per year 3 years of useful life of the machine, i.e. Rs 45,000 3 4) Rs 1,80,000

36 Financial Management
Cash infl ows and NPV
Particulars ` Year 1 2 3 4 5
Sales revenue Rs 2,88,000 Rs 2,88,000 Rs 2,88,000 Rs 2,88,000 Less: Expenses: Labour cost 1,40,000 1,26,000 1,26,000 1,12,000 Materials and other Variable costs 65,000 58,500 58,500 52,000 Funds infl ows 83,000 1,03,500 1,03,500 1,24,000 Less: Debtors outstanding 57,600 57,600 57,600 57,600 Add: Receipts from debtors — 57,600 57,600 57,600 Rs 57,600 Add: Creditors outstanding 6,500 5,850 5,850 5,200 Less: Payments to creditors — 6,500 5,850 5,850 5,200Cash infl ows 31,900 1,02,850 1,03,500 1,23,300 52,400(x) PV factor 0.833 0.694 0.579 0.482 0.402Present Value 26,573 71,378 59,927 59,455 21,065Total PV (year, t = 1-5) 2,38,398 Less: Cash outfl ows 1,80,000NPV 58,398
Since the NPV is positive, the manufacture of new product is worthwhile.
P.9.20 A company is currently considering modernisation of a machine originally costing Rs 50,000 (current book value zero). However, it is in a good working condition and can be sold for Rs 25,000. Two choices are available. One is to rehabilitate the existing machine at a total cost of Rs 1,80,000; and the other is to replace the existing machine with a new machine costing Rs 2,10,000 and requiring Rs 30,000 to install. The rehabili-tated machine as well as the new machine would have a six year life and no salvage value. The projected after-tax profits under the various alternatives are:
Expected after-tax profi ts
Year Existing machine Rehabilitated machine New machine
1 Rs 2,00,000 Rs 2,20,000 Rs 2,40,000 2 2,50,000 2,90,000 3,10,000 3 3,10,000 3,50,000 3,50,000 4 3,60,000 4,00,000 4,10,000 5 4,10,000 4,50,000 4,30,000 6 5,00,000 5,40,000 5,10,000
The firm is taxed at 35 per cent. The company uses the straight line depreciation method and the same is allowed for tax purposes. Ignore block assets concept. The cost of capital is 12 per cent. Advise the company whether it should rehabilitate the existing machine or should replace it with the new machine. Also, state the situation in which the company would like to continue with the existing machine.
SolutionCash outfl ows
(i) If machine is rehabilitated: Rehabilitation costs Rs 1,80,000 (ii) If machine is purchased: Cost of new machine 2,10,000 Add: Installation cost 30,000 Less: Effective sale value of old machine (Rs 25,000 – Rs 8,750, tax) (16,250) Incremental cash outfl ows 2,23,750
Additional Solved Problems 37
Cash infl ows after taxes
Existing machine Rehabilitated machine New machine
Year EAT/ CFATa EAT D CFAT EAT D CFAT
1 Rs 2,00,000 Rs 2,20,000 Rs 30,000 Rs 2,50,000 Rs 2,40,000 Rs 40,000 Rs 2,80,000
2 2,50,000 2,90,000 30,000 3,20,000 3,10,000 40,000 3,50,000
3 3,10,000 3,50,000 30,000 3,80,000 3,50,000 40,000 3,90,000
4 3,60,000 4,00,000 30,000 4,30,000 4,10,000 40,000 4,50,000
5 4,10,000 4,50,000 30,000 4,80,000 4,30,000 40,000 4,70,000
6 5,00,000 5,40,000 30,000 5,70,000 5,10,000 40,000 5,50,000
aSince the existing machine has been fully depreciated (book value being zero), no depreciation would be added to determine CFAT.
Determination of NPV
Year Incremental CFAT Total PV Rehabilitated New PV factor Rehabilitated New machine machine (0.12) machine machine
1 Rs 50,000 Rs 80,000 0.893 Rs 44,650 Rs 71,440 2 70,000 1,00,000 0.797 55,790 79,700 3 70,000 80,000 0.712 49,840 56,960 4 70,000 90,000 0.636 44,520 57,240 5 70,000 60,000 0.567 39,690 34,020 6 70,000 50,000 0.507 35,490 25,350Total present value 2,69,980 3,24,710 Less: Initial cash outfl ows 1,80,000 2,23,750NPV 89,980 1,00,960
Recommendation Since NPV of the new machine is more, the company should buy it. If the NPV of incremental CFAT of both the alternatives were negative, the company would have continued with the existing machine.
P.9.21 Excel Ltd manufactures a special chemical for sale at Rs 30 per kg. The variable cost of manufacture is Rs 15 per kg. Fixed cost excluding depreciation is Rs 2,50,000. Excel Ltd is currently operating at 50 per cent capacity. It can produce a maximum of 1,00,000 kg at full capacity. The production manager suggests that if the existing machines are replaced, the company can achieve maximum capacity in the next 5 years gradually increasing the production by 10 per cent a year. The finance manager estimates that for each 10 per cent increase in capacity, the additional increase in fixed cost will be Rs 50,000. The existing machinesa with a current book value of Rs 10,00,000 and remaining useful life of 5 years can be disposed of for Rs 5,00,000. The vice-president (finance) is willing to replace the existing machines provided the NPV on replacement is Rs 4,53,000 at 15 per cent cost of capital. PV factor may be used up to two digits only. (i) You are required to compute the total value of machines necessary for replacement. For your exercise
you may assume the following: (a) All the assets are in the same block. Depreciation will be on straight line basis and the same is
allowed for tax purposes. (b) There will be no slavage value for the new machines. The entire cost of the assets will be depre-
ciated over a five year period. (c) Tax rate is 40 per cent.

38 Financial Management
(d) Cash inflows will accrue at the end of the year. (e) Replacement outflow will be at the beginning of the year (year 0). (ii) On the basis of data given above, the managing director feels that the replacement, if carried out, would
at least yield a post-tax return of 15 per cent in three years provided the capacity build up is 60, 80 and 100 per cent respectively. Do you agree?
Solution Determination of total replacement value of machines
(i) (a) Incremental cash outfl ows
Cost of replacement of new machines Rs X Less: Disposal value of existing machines 5,00,000 Cash outfl ows required (X – Rs 5,00,000)
(b) Determination of CFAT and NPV (excluding depreciation)
Particulars Years
1 2 3 4 5
Increased production and sales (Kg) 10,000 20,000 30,000 40,000 50,000 (x) contribution per unit (Rs 30 – Rs 15) (Rs) 15 15 15 15 15 Incremental contribution 1,50,000 3,00,000 4,50,000 6,00,000 7,50,000 Less: Incremental fi xed costs 50,000 1,00,000 1,50,000 2,00,000 2,50,000 Incremental profi t before taxes 1,00,000 2,00,000 3,00,000 4,00,000 5,00,000 Less: Taxes (0.40) 40,000 80,000 1,20,000 1,60,000 2,00,000 Earnings after taxes 60,000 1,20,000 1,80,000 2,40,000 3,00,000 (x) PV factor (0.15) 0.87 0.76 0.66 0.57 0.49 Present value 52,200 91,200 1,18,800 136,800 1,47,000 Total PV for 5 years (t = 1 – 5) 5,46,000
(c) Base for incremental depreciation
Current book value of existing machine Rs 10,00,000 Add: Cost of new machine X Less: Sale proceeds of existing machine 5,00,000 Depreciation base of new machine X + 5,00,000 Less: Depreciation base of existing machine 10,00,000 Base for incremental depreciation X – 5,00,000
(d) PV of tax savings on incremental depreciation for years 1 - 5
Incremental depreciation per year (X – Rs 5,00,000) 4 5 0.2X – Rs 1,00,000 (x) Tax rate 0.40 (x) PV factor of annuity for 5 years 3.35 (0.2 X – Rs 1,00,000) 3 0.40 3 3.35 = 0.268X – Rs 1,34,000
(e) Total PV (b + d) = Rs 5,46,000 + 0.268X – Rs 1,34,000 (f) Desired NPV = PV of CFAT – PV of outflows Rs 4,53,000 = (Rs 4,12,000 + 0.268X) – (X – Rs 5,00,000) Rs 4,53,000 = Rs 4,12,000 + 0.268X – X + Rs 5,00,000 Or 0.732X = Rs 4,59,000 Or X = Rs 4,59,000/0.732 = Rs 6,27,049 Total value of machines required for replacement is Rs 6,27,049.

Additional Solved Problems 39
(ii) Financial evaluation whether replacement would yield post-tax return of 15 per cent in 3 years
Particulars Year
1 2 3 Increased capacity (per cent) 10 30 50Increased sales (kg) 10,000 30,000 50,000Incremental contribution (@ Rs 15 per kg) Rs 1,50,000 Rs 4,50,000 Rs 7,50,000 Less: Incremental fi xed cost 50,000 1,50,000 2,50,000 Less: Incremental depreciation (Rs 11,27,049 – Rs 10,00,000) 4 5 years 25,410 25,410 25,410Earnings before taxes 74,590 2,74,590 4,74,590 Less: Taxes (0.40) 29,836 1,09,836 1,89,836Earnings after taxes 44,754 1,64,754 2,84,754CFAT 70,164 1,90,164 3,10,164(x) PV factor (0.15) 0.87 0.76 0.66Present value 61,043 1,44,525 2,04,708Total present value (t = 1 – 3) 4,10,276 Less: Incremental cash outfl ows 1,27,049NPV 2,83,227
The assessment of the managing director is correct as the NPV is positive.

CHAPTER 10
P.10.22 The Indo Metal Works (IMW) Ltd manufactures products such as cooler shelving, stocking carts and bakery racks. Most of its products are directly sold to shops, super markets and hotels. The IMW is currently using a manual system which was purchased 2 years ago for Rs 20 crore and has a remaining useful life of 6 years and zero salvage value. In order to gain competitive advantage by adopting new technology for higher level of profitability with improved quality of products and productivity, the managing director of IMW has under consideration the replacement of the manual system with a robotics manufacturing system. It would require an initial investment of Rs 56 crore as purchase and Rs 7 crore as installation cost. To work out the cost-benefit analysis of the proposal, he assigns the task to a committee consisting of the controller, the marketing director and the production director. The controller supplies the given facts relating to the expected revenues and expenses (in lakh of rupees):
Year Sales Variable costs Fixed costs (excluding depreciation)
1 4,000 2,280 720 2 4,500 2,360 730 3 4,750 2,445 800 4 5,150 2,705 880 5 5,550 2,810 960 6 5,800 2,864 1,000
The AIDE 900 robotic system has the capability to weld stainless steel and aluminum used by the IMW as raw materials and can be programmed to adjust the path, angle and speed of the torch. The production director is excited as the system would eliminate the need to hire welders who are so expensive and the market for welders seems perpetually tight. Since the robotics welding is likely to provide better quality products and product scheduling and avoid late deliveries, the marketing director is convinced that the annual sales would increase by 40 per cent compared to the existing manual system of equipment. It is also anticipated that there would be reduction to the extent of 25 per cent in variables costs and 10 per cent in fixed costs (excluding depreciation). The existing manual system can be sold for Rs 3 crore. Due to replacement, the management estimates the working capital requirement of Rs 7 crore. Assuming 12 per cent cost of capital and 35 per cent tax, prepare a financial analysis report for the committee of directors of IMW to be submitted to the managing director. What recommendation would you make? The IMW uses written down value method of depreciation. The new system like the existing manual system will be subject to 25 per cent depreciation. It is expected to have useful economic life of six years with Rs 5 crore as salvage value. The company has several other plants in the asset block of 25 per cent depreciation.
Solution Financial analysis whether to adopt AIDE 900 robotic system (Rs in lakh)
Cash outfl ows (incremental): Cost of AIDE 900 system 5,600 Installation costs 700 Working capital 700 Less: Sale value of existing manual system 300 6,700

Additional Solved Problems 41
Determination of incremental CFBT (in lakh of rupees)
Manual system Robotic system Differential
Year Sales – VC – FC = CFBT Sales – VC – FC = CFBT CFBT
1 4,000 2,280 720 1,000 5,600 2,394 * 648 2,558 1,558 2 4,500 2,360 730 1,410 6,300 2,478 657 3,165 1,755 3 4,750 2,445 800 1,505 6,650 2,567 720 3,363 1,858 4 5,150 2,705 880 1,565 7,210 2,840 792 3,578 2,013 5 5,550 2,810 960 1,780 7,770 2,950 864 3,956 2,176 6 5,800 2,864 1,000 1,936 8,120 3,007 900 4,213 2,277
*(Existing VC ratio 3 0.75 3 sales under robotic system)
Determination of CFAT and NPV (amount in lakh of rupees)
Years
Particulars 1 2 3 4 5 6
CFBT 1,558 1,755 1,858 2,013 2,176 2,277Incremental Depreciation 1,500 1,125 844 633 475 231Taxable income 58 630 1,014 1,380 1,701 2,046 Less: Taxes 20.3 220 355 483 595 716EAT 37.7 410 659 897 1,106 1,330CFAT 1,537.7 1,535 1,503 1,530 1,581 1,561 Add: SV + Release of WC (500 + 700) 1,200 3 PV factor (0.12) 0.893 0.797 0.712 0.636 0.567 0.507PV 1,373 1,223 1,070 973 896 1,400Total PV (t = 1 – 6) 6,935 Less: Cash outfl ows 6,700NPV 235
Recommendation Since the NPV is positive, IMW is advised to switch to robotic system.
Working Notes (i) WDV of existing machine in the beginning of year 3 (Rs in lakh): Cost of machine 2,000 Less: Depreciation: year 1 500 2 375 875 1,125 (ii) Depreciation base of new robotic system (Rs in lakh): WDV of existing system 1,125 Add: Cost of new robotic system 6,300 Less: Sale value of existing system 300 7,125 (iii) Base for incremental depreciation: Rs 7,125 lakh – Rs 1,125 lakh = Rs 6,000 lakh.
Incremental depreciation (t = 1 – 6) (Rs in lakh)
Year Increment asset cost base Depreciation
1 6,000 1,500 2 4,500 1,125 3 3,375 844 4 2,531 633
(Contd)

42 Financial Management
5 1,898 475 6 1,423 231*
*0.25 3 (Rs 1,423 lakh – Rs 500 lakh, salvage value)
P.10.23 Company Y is operating an elderly machine that is expected to produce a net cash inflow of Rs 40,000 in the coming year and Rs 40,000 next year. Current salvage value is Rs80,000 and next year’s value is Rs 70,000. The machine can be replaced now with a new machine, which costs Rs 1,50,000 but is much more efficient and will provide a cash inflow of Rs 80,000 a year for 3 years. Company Y wants to know whether it should replace the equipment now or wait a year with the clear understanding that the new machine is the best of the available alternatives and that it in turn be replaced at the optimal point. Ignore tax. Take oppor-tunity cost of capital as 10 per cent. Advise with reasons.
Solution (i) Determination of Equivalent Annual NPV if an elderly (Existing) Machine is Replaced Now (at time = 0 period)
(a) Cash outfl ows (incremental)
Cost of new machine Rs 1,50,000 Less: Salvage value of an elderly machine 80,000 70,000
(b) NPV of cash infl ows
Year Incremental cash infl ows PV factor at 10% Total PV
1 Rs 40,000 0.909 Rs 36,360 2 40,000 0.826 33,040 3 80,000 0.751 60,080 Total PV of incremental cash infl ows 1,29,480 Less: Incremental cash outfl ows 70,000 Net present value 59,480
(c) Equivalent annual net present value (Rs 59,480 4 2.487 PVF for 3 years at 10 per cent) 23,916.37
(ii) Determination of Equivalent Annual NPV if an Elderly Machine is replaced next year (at time = 0 period)
(a) Incremental cash outfl ows Cost of new machine (Rs 1,50,000 3 0.909) Rs 1,36,350 Less: Salvage value of an elderly machine (Rs 70,000 3 0.909) 63,630 72,720
(b) NPV of cash infl ows
Year Incremental cash infl ows PV factor at 10% Total PV
2 Rs 40,000 0.826 Rs 33,040 3 80,000 0.751 60,080 4 80,000 0.683 54,640 1,47,760 Less: PV of cash outfl ows at t = 0 72,720 NPV at t = 0 75,040
(c) Equivalent annual NPV (Rs. 75,040 4 2.487) Rs 30,172.90
(Contd)

Additional Solved Problems 43
Recommendation Company Y is advised to replace the machine one year from now as it promises a higher equivalent annual NPV.
P.10.24 A software company is considering installing an air conditioning plant, for the entire company. It has two options, X and Y. Plant X costs Rs 5,00,000 to purchase and install. It has 5 years of useful life and will be depreciated over this period on a straight-line basis to a book value of Rs 25,000. However, the management hopes to sell it for Rs 40,000. Maintenance and other operating costs of running the plant are Rs 2,50,000 per year. Plant Y has a 10 year life but costs Rs 7,00,000 to purchase and install. It will be depreciated over 8 years on a straight-line basis to zero book value. However, at the beginning of year 7 and is expected to cost Rs 1,00,000; it is not to be capitalized but to be expended. At year-end 10, the plant is expected to have a salvage value of Rs 30,000, which is likely to be equivalent to the removal cost of the plant. Plant Y is less expensive to run than Plant X as it requires Rs 2,20,000 per year to operate. Corporate tax rate is 35 per cent; cost of capital is 12 per cent. Assuming straight-line method of depre-ciation as well as the time period of depreciation are acceptable for tax purposes, advise which plant should be purchased by the company.
SolutionDetermination of equivalent annual cost of plants X and Y
Particulars Year COBT COAT PV factor at 0.12 Total PV
Plant X Purchase cost 0 Rs 5,00,000 Rs 5,00,000 1.000 Rs 5,00,000 Operating costs 1–5 2,50,000 1,62,5001 3.605 5,85,812 Tax advantage on depreciation 1–5 — (33,2502) 3.605 (1,19,866) Salvage value 5 40,000 (34,7503) 0.567 (19,703)
Total cost 9,46,243 Divided by annuity PV factor at 12% corresponding to life of plant, 5 years 3.605
Equivalent annual cost 2,62,481Plant Y Purchase costs 0 7,00,000 7,00,000 1.000 7,00,000 Operating costs 1–10 2,20,000 1,43,0004 5.650 8,07,950 Tax advantage on depreciation 1–8 — (30,6255) 4.968 (1,52,145) Overhaul cost 7 1,00,000 65,0006 0.5077 32,955
Total cost 13,88,760 Divided by annuity PV factor at 12% for 10 years 5.650
Equivalent annual cost 2,45,798
1. Rs 2,50,000 (1-tax rate 0.35) = Rs 1,62,500 2. [(Rs 5,00,000 – Rs 25,000)/5 years] 3 tax rate, 0.35 = Rs 33,250 3. Rs 40,000 – Tax payment on gain i.e., Rs 15,000 3 0.35 = Rs 34,750 4. Rs 2,20,000 (1 – 0.35) = Rs 1,43,000 5. (Rs 7,00,000/8 years) 3 0.35 = Rs 30,625 6. Rs 1,00,000 3 0.65 = Rs 65,000 7. PV factor at year-end 6 at 12% (as per Table A-3).
Recommendation Buy plant Y as its EAC is lower.

CHAPTER 11
P.11.21 Mr X an investor, purchases an equity share of a growing company, Y for Rs 210. He expects the company to pay dividends of Rs 10.5, Rs 11.025 and Rs 11.575 in years 1, 2 and 3, respectively. He expects to sell the shares at a price of Rs 243.10 at the end of 3 years. (i) Determine the growth rate in dividend. (ii) Calculate the current dividend yield (iii) What is the required rate of return of Mr X on his equity investments?
Solution (i) Growth rate in dividend = D1(1 + r)n = Dn, that is, Rs 10.50(1 + r)2 = 11.575 = (1 + r)2 = 11.575 4 10.50
= 1.1024 Table A-1 (compounded sum of Re 1) suggests that Re 1 compounds to Rs 1.102 in 2 years at the compound rate of 5 per cent. Therefore, growth rate in dividend is 5 per cent.
(ii) Current dividend yield (Dy) = Expected dividend/Current price = Rs 10.50/210 = 5 per cent (iii) Required rate of return (Ke) = (D1/P0) + g, i.e., Rs 10.50/210 + 0.05 = 10 per cent
P.11.22 (i) If current earning are Rs 2.76 a share, while 10 years earlier, they were Rs 2, what has been
the rate of growth in earnings? (ii) If a company is paying currently a dividend of Rs 6 per share, whereas 5 years before it was paying Rs
5 per share, what has been the rate of growth in dividends? (iii) A company which is not subject to growth expects to pay dividend of Rs 12 per share for ever. Calculate
the value of a share, assuming 10 per cent as the appropriate discount rate for such a company.
Solution
Case Growth (in years) Compound factor Rate of growth
(i) 10 1.38* Rs 1.3441
(ii) 5 1.20** 1.2172
*Rs 2.76/2; **Rs 6/51Nearest factor, 3 per cent; 2 Nearest factor, 4 per cent
The exact rates of growth would be 3.27 per cent and 3.71 per cent in case (i) and (ii) respectively. (iii) P = Cli = Dividend cash flows/Appropriate discount rate = Rs 12/0.10 = Rs 120
P.11.23 A company is contemplating an issue of new equity shares. The firm’s equity shares are currently selling at Rs 125 a share. The historical pattern of dividend payments per share, for the last 5 years is given below:
Year Dividend
1 Rs 10.70 2 11.45 3 12.25 4 13.11 5 14.03
The flotation costs are expected to be 3 per cent of the current selling price of the shares. You are required to determine growth rate in dividends.Solution Growth rate in dividends = D0(1 + r)n = Dn = Rs 10.70(1 + r)4 = Rs 14.03 Table A-1 (Sum of Re 1) suggests that Re 1 compounds to Rs 1.311 in 4 years at the compound rate of
7 per cent. Therefore, growth rate in dividends is 7 per cent.

Additional Solved Problems 45
P.11.24 The following is the capital structure of Simons company Ltd. as on 31st March, current year
Equity share: 10,000 shares (of Rs 100 each) Rs 10,00,00012% Preference shares (of Rs 100 each) 4,00,00010% Debentures 6,00,000
20,00,000
The market price of the company’s share is Rs 110 and it is expected that a dividend of Rs 10 per share would be declared at the end of the current year. The dividend growth rate is 6 per cent. (i) If the company is in the 35 per cent tax bracket, compute the weighted average cost of capital. (iii) Assuming that in order to finance an expansion plan, the company intends to borrow a fund of Rs 10
lakh bearing 12 per cent rate of interest, what will be the company’s revised weighted average cost of capital? This financing decision is expected to increase dividend from Rs 10 to Rs 12 per share. However, the market price of equity share is expected to decline from Rs 110 to Rs 105 per share.
Solution
(i) Statement showing determination of weighted average cost of capital, K0 (market value weights)
Source Amount After tax cost (%) Total cost [1 3 2] (1) (2) (3)
Equity Rs 11,00,000 15.09%1 Rs 1,65,99012% Preference share 4,00,000 12.00 48,00010% Debentures 6,00,000 6.502 39,000
21,00,000 2,52,990
K0 = Rs 2,52,990/Rs 21,00,000 = 12.05 per cent
Satement showing determination of K0 (book-value weights)
Source Amount After-tax cost (%) Total cost [1 3 2] (1) (2) (3)
Equity Rs 10,00,000 15.09 Rs 1,50,900Preference shares 4,00,000 12.00 48,000Debentures 6,00,000 6.50 39,000
20,00,000 2,37,900
K0 = Rs 2,37,900/Rs 20,00,000 = 11.89 per cent
Note: Conceptually, market value weights are preferred.
(ii) Statement showing revised K0 (book value as well as market value weights)
Source Amount After-tax cost (%) Total cost Book value Market value Book value Market value
Equity Rs 10,00,000 10,50,000 17.433 Rs 1,74,300 1,83,01512% Preference shares 4,00,000 4,00,000 12.00 48,000 48,00010% Debentures 6,00,000 6,00,000 6.50 39,000 39,00012% Loan 10,00,000 10,00,000 7.804 78,000 78,000
30,00,000 30,50,000 3,39,300 3,48,015
K0 (market value weights) = Rs 3,48,015/Rs 30,50,000 = 11.41 per centK0 (book value weights) = Rs 3,39,300/Rs 30,00,000 = 11.31 per cent
1. Ke = (Rs 10/Rs 110) + 6% = 15.09 per cent2. Kd = 10%(1 – 0.35) = 6.5 per cent3. Ke (revised) = (Rs 12/Rs 105) + 6% = 17.43 per cent4. Cost of loan = 12% (1 – 0.35) = 7.8 per cent It is assumed that the market values and book values of preference shares and debentures are equal.

46 Financial Management
P.11.25 XYZ company has debentures outstanding with 5 years left before maturity. The debentures are currently selling for Rs 90 (the face value is Rs 100). The debentures are to be redeemed at 5 per cent premium. The interest is paid annually at a rate of interest of 12 per cent. The firm’s tax rate is 35 per cent. Calculate cost of debt.SolutionThe value of kd is to be determined by trial and error.
Determination of PV at 11% and 12% rates of interest
Year Cash outfl ows PV factor at Total PV at after taxes 11% 12% 11% 12%
1-5 Rs 7.8 3.696 3.605 Rs 28.83 Rs 28.12 5 105 0.593 0.567 62.27 59.54 91.10 87.66
By interpolation, the value of kd would be 11% + (Rs 1.10/Rs 3.44 = 0.32) = 11.32 per cent
P.11.26 An investor is contemplating the purchase of equity shares of a company which had paid a dividend of Rs 5 per share last year. The dividends are expected to grow at 6 per cent for ever. The required rate of return on the shares of this company in the capital market is 12 per cent. What will be the maximum price you will recommend the investor to pay for an equity share of the company? Will your answer be different if he wants to hold the equity share for 3 years and 6 years? Solution
0
Rs 5.30Rs 8 8.33
12% 6%P
The maximum price we shall recommend the investor to pay for an equity share of the company is Rs 88.33. The value of the share is not dependent upon the holding period. The value of the share would be the same whether he holds the share for 3 years or 6 years.
P.11.27 A large sized chemical company has been expected to grow at 14 per cent per year for the next 4 years and then to grow indefinitely at the same rate as that of the national economy, that is, 5 per cent. The required rate of return on the equity shares is 12 per cent. Assume that the company paid a dividend of Rs 2 per share last year. Determine the market price of the shares today.
Solution The value of equity share = the sum ofsV of dividend payments during years 1-4 and (ii) PV of expected market price at the end of year 4 based on growth rate of 5 per cent.
Year Dt = D0 (1 + g )t PV factor at 12% Total PV
1 Rs 2(1 + 0.14)1 = 2.28 0.893 Rs 2.036 2 2(1 + 0.14)2 = 2.60 0.797 2.072 3 2(1 + 0.14)3 = 2.96 0.712 2.108 4 2(1 + 0.14)4 = 3.38 0.636 2.150 8.37
5
4
(Rs 3.38 ) ( 1 0.05 )Rs 50.71
( ) 12% 5%e n
DP
k g
gn = normal growth ratePV of market price of the share at the end of year 4 = Rs 50.71 3 PV factor at 12 per cent at the end of year 4 (0.636) = Rs 32.25. P0 = Rs 8.37 + Rs 32.25 = Rs 40.62The market price of the share would be Rs 40.62.
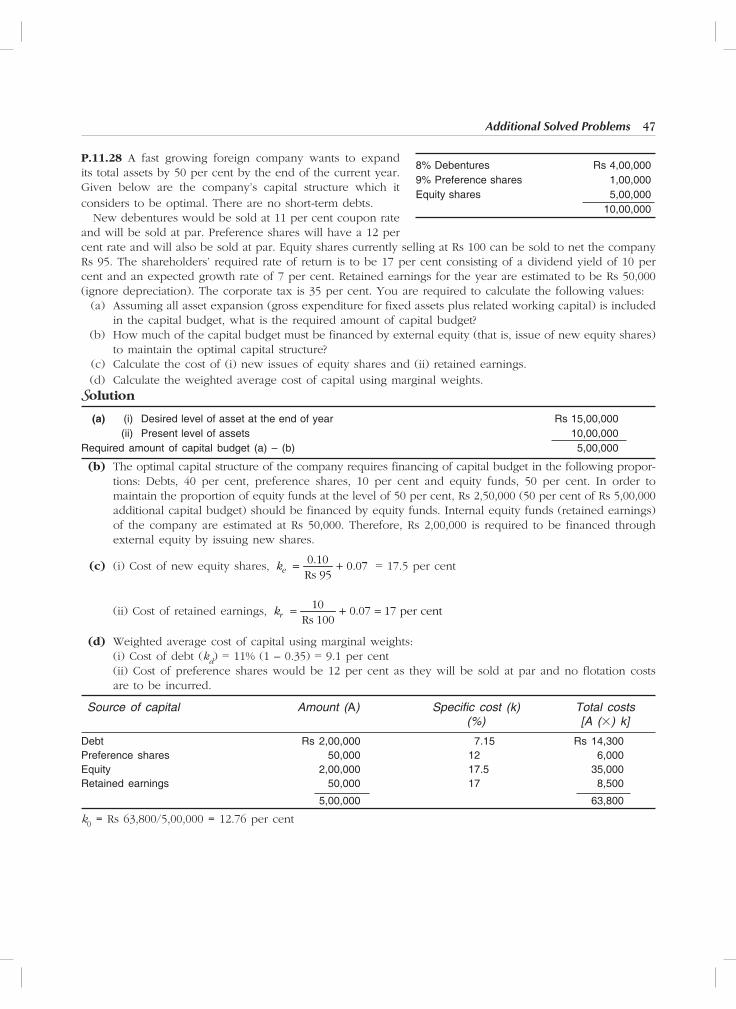
Additional Solved Problems 47
P.11.28 A fast growing foreign company wants to expand its total assets by 50 per cent by the end of the current year. Given below are the company’s capital structure which it considers to be optimal. There are no short-term debts. New debentures would be sold at 11 per cent coupon rate and will be sold at par. Preference shares will have a 12 per cent rate and will also be sold at par. Equity shares currently selling at Rs 100 can be sold to net the company Rs 95. The shareholders’ required rate of return is to be 17 per cent consisting of a dividend yield of 10 per cent and an expected growth rate of 7 per cent. Retained earnings for the year are estimated to be Rs 50,000 (ignore depreciation). The corporate tax is 35 per cent. You are required to calculate the following values: (a) Assuming all asset expansion (gross expenditure for fixed assets plus related working capital) is included
in the capital budget, what is the required amount of capital budget? (b) How much of the capital budget must be financed by external equity (that is, issue of new equity shares)
to maintain the optimal capital structure? (c) Calculate the cost of (i) new issues of equity shares and (ii) retained earnings. (d) Calculate the weighted average cost of capital using marginal weights.Solution
(a) (i) Desired level of asset at the end of year Rs 15,00,000 (ii) Present level of assets 10,00,000 Required amount of capital budget (a) – (b) 5,00,000
(b) The optimal capital structure of the company requires financing of capital budget in the following propor-tions: Debts, 40 per cent, preference shares, 10 per cent and equity funds, 50 per cent. In order to maintain the proportion of equity funds at the level of 50 per cent, Rs 2,50,000 (50 per cent of Rs 5,00,000 additional capital budget) should be financed by equity funds. Internal equity funds (retained earnings) of the company are estimated at Rs 50,000. Therefore, Rs 2,00,000 is required to be financed through external equity by issuing new shares.
(c) (i) Cost of new equity shares, 0.10 0.07Rs 95ek = 17.5 per cent
(ii) Cost of retained earnings, 10 0.07 17 per centRs 100rk
(d) Weighted average cost of capital using marginal weights: (i) Cost of debt (kd) = 11% (1 – 0.35) = 9.1 per cent (ii) Cost of preference shares would be 12 per cent as they will be sold at par and no flotation costs
are to be incurred.
Source of capital Amount (A) Specifi c cost (k) Total costs (%) [A (3) k]
Debt Rs 2,00,000 7.15 Rs 14,300Preference shares 50,000 12 6,000Equity 2,00,000 17.5 35,000Retained earnings 50,000 17 8,500
5,00,000 63,800
k0 = Rs 63,800/5,00,000 = 12.76 per cent
8% Debentures Rs 4,00,0009% Preference shares 1,00,000Equity shares 5,00,000 10,00,000

CHAPTER 12
P.12.11 Skylark Airways is planning to acquire a light commercial aircraft for flying class clients at an investment of Rs 50,00,000. The expected cash flow after tax for the next three years is as follows:
(Amount in Rs lakh)
Year 1 Year 2 Year 3
CFAT Probability CFAT Probability CFAT Probability
14 0.1 15 0.1 18 0.2 18 0.2 20 0.3 25 0.5 25 0.4 32 0.4 35 0.2 40 0.3 45 0.2 48 0.1
The Company wishes to take into consideration all possible risk factors relating to an airline operations. The Company wants to know: (i) The expected NPV of this venture assuming independent probability distribution with 6 per cent risk
free rate of interest. (ii) The possible deviation in expected value (iii) How would standard deviation of the present value distribution help in capital budgeting decisions.Solution
(i) Determination of expected CFAT (Amount in lakh of rupees)
Year 1 Year 2 Year 3
CFAT Pj Cash fl ow CFAT Pj Cash fl ow CF Pj Cash fl ow
(CF 3 Pj) (CF 3 Pj) (CF 3 Pj)
Rs 14 0.1 1.4 Rs 15 0.1 1.5 Rs 18 0.2 3.6 18 0.2 3.6 20 0.3 6 25 0.5 12.5 25 0.4 10 32 0.4 12.8 35 0.2 7 40 0.3 12 45 0.2 9 48 0.1 4.8
Mean 1( )CF 27 2( )CF 29.3 3( )CF 27.9
Determination of expected NPV
CFAT PV factor (0.06) Total PV
27 0.943 25.461 29.3 0.890 26.077 27.9 0.840 23.436Total PV of CFAT 74.974Less: Cash outfl ows 50.000NPV 24.974
(ii) Determination of standard deviation for each year
21 1( )jCF CF (x) Pj1
21 1( )jCF CF Pj1
Year 1
169 x 0.1 16.9 81 x 0.2 16.2 4 x 0.4 1.6 169 x 0.3 50.7 85.4 s1 = 85.4 = 9.24

Additional Solved Problems 49
22 2( )jCF CF (x) Pj2
22 2( )jCF CF Pj2
Year 2
204.49 x 0.1 20.449
86.49 x 0.3 25.947
7.29 x 0.4 2.916
246.49 x 0.2 49.298
98.61 s2 = 98.61 = 9.93
23 3( )jCF CF (x) Pj3
23 3( )jCF CF Pj3
Year 3
98.01 x 0.2 19.602 8.41 x 0.5 4.205 50.41 x 0.2 10.082 404.01 x 0.1 40.401 74.29
s3 = 74.29 = 8.61
Standard deviation about the expected value = 2
21 ( 1 )
nt
tt
s
i
s = 2 4 6
98.61 74.2985.414.37
( 1 0.06 ) ( 1 0.06 ) ( 1 0.06 )
(iii) Standard deviation enables to make use of the normal probability distribution to have more insight about the element of risk in capital budgeting. The use of the normal probability distribution will enable the decision-maker to have an idea of the probability of different expected values of NPV, that is the probability of having the value of zero or less; greater than zero and within the range of two values. The formula is Z = (Expected value – NPV)/s. If the probability of having NPV of zero or less is considerably low, say 0.005, it implies that the risk in the project is negligible and the project is worth accepting.
P.12.12 A company is evaluating three proposed projects. You are required to rank the projects with respect to both risk and returns. The relevant data are given as follows:
A B C
NPV Probability NPV Probability NPV Probability
Rs (3,500) 0.05 (Rs 2,000) 0.01 Rs (4,500) 0.03 (1,000) 0.10 0 0.04 (1,500) 0.07 0 0.15 500 0.15 0 0.10 2,000 0.20 1,500 0.20 3,000 0.50 4,000 0.25 2,000 0.30 4,000 0.25 6,000 0.15 2,500 0.20 5,000 0.05 11,000 0.08 3,000 0.06 — — 17,500 0.02 3,750 0.04 — —

50 Financial Management
SolutionExpected NPV
Project A Project B Project C
NPV NPV NPV NPV Pi (NPV 3 Pi) NPV Pi (NPV 3 Pi) NPV Pi (NPV 3 Pi)
Rs (3,500) 0.05 Rs (175) Rs (2,000) 0.01 Rs (20) Rs (4,500) 0.03 Rs (135) (1,000) 0.10 (100) 0 0.04 0 (1,500) 0.07 (105) 0 0.15 0 500 0.15 75 0 0.10 0 2,000 0.20 400 1,500 0.20 300 3,000 0.50 1,500 4,000 0.25 1,000 2,000 0.30 600 4,000 0.25 1,000 6,000 0.15 900 2,500 0.20 500 5,000 0.05 250 11,000 0.08 880 3,000 0.06 180 — — — 17,500 0.02 350 3,750 0.04 150 — — —
Expected ANPV 3,255 Expected BNPV 1,785 Expected CNPV 2,510
Determination of standard deviation about the expected NPVProject A
NPVi NPV NPVi – NPV (NPVi – NPV )2 Pi (NPVi – NPV )2Pi
Rs (3,500) Rs 3,255 Rs (6,755) Rs 4,56,30,025 Rs 0.15 Rs 22,81,501 (1,000) 3,255 (4,255) 1,81,05,025 0.10 1,81,050 0 3,255 (3,255) 1,05,95,025 0.15 15,89,254 2,000 3,255 (1,255) 15,75,025 0.20 3,15,005 4,000 3,255 745 5,55,025 0.25 1,38,756 6,000 3,255 2,745 75,35,025 0.15 11,30,254 11,000 3,255 7,745 59,98,025 0.08 47,98,602 17,500 3,255 14,245 20,29,20,025 0.02 40,58,400
(NPVi – ANPV )2Pi 144,92,823
Project B
NPVi NPV NPVi – NPV (NPVi – NPV )2 Pi (NPVi – NPV )2Pi
Rs (2,000) Rs 1,785 Rs (3,785) Rs 1,43,26,225 0.01 Rs 1,43,262 0 1,785 (1,785) 31,86,225 0.04 1,27,449 500 1,785 (1,285) 16,51,225 0.15 2,47,684 1,500 1,785 (285) 81,225 0.20 16,245 2,000 1,785 215 46,225 0.30 13,867 2,500 1,785 715 5,11,225 0.20 1,02.245 3,000 1,785 1,215 14,76,225 0.06 8,85,735 3,750 1,785 1,965 38,61,225 0.04 1,54,449
(NPVi – BNPV )2Pi 16,90,936
Project C Rs (4,500) Rs 2,510 Rs (7,010) Rs 4,91,40,100 0.03 Rs 14,74,203 (1,500) 2,510 (4,010) 1,60,80,100 0.07 11,25,607 0 2,510 (2,510) 63,00,100 0.10 6,30,010 3,000 2,510 490 2,40,100 0.50 1,20,050 4,000 2,510 1,490 22,20,100 0.25 5,55,025 5,000 2,510 2,490 62,00,100 0.05 3,10,005
(NPVi – CNPV )2Pi 42,14,900

Additional Solved Problems 51
s1,44 ,92,823A = 3,833
s 16 ,90,936B = 1,300
s42,14 ,900C = 2,053
Determination of coefficient of variation (V) = sStandard deviation ( )
Expected net present value (NPV)
VA = Rs 3,833
1.178Rs 3,255
VB = Rs 1,300
0.730Rs 1,785
VC = Rs 2,053
0.818Rs 2,510
Ranking of projects
Project Return Risk
A 1 3B 3 1C 2 2
P.12.13 What would be the risk-adjusted rates of discount for projects, A, B and C in P.12.6 if the company has gathered the following data to determine the risk-return trade-offs:
Coeffi cient of variation Market discount rate Coeffi cient of variation Market discount rate
0.0 8.0 1.2 14.0 0.2 9.0 1.4 15.0 0.4 10.0 1.6 16.0 0.6 11.0 1.8 17.0 0.8 12.0 2.0 18.0 1.0 13.0
Solution
Project Coeffi cient of variation Market discount rate (%)
A 1.178 14 B 0.730 12 C 0.818 13

CHAPTER 13
P.13.8 A proforma cost sheet of a company provides the following particulars:
Particulars Amount per unit
Elements of cost: Raw materials Rs 80 Direct labour 30 Overhead 60 Total cost 170 Profi t 30 Selling price 200
The following further particulars are available: Raw materials in stock, on average, one month; Materials in process (completion stage, 50 per cent), on average, half a month; Finished goods in stock, on average, one month. Credit allowed by suppliers is one month; Credit allowed to debtors is two months; Average time-lag in payment of wages is 1.5 weeks and one month in overhead expenses; one-fourth of the output is sold against cash; cash in hand and at bank is desired to be mantained at Rs 3,65,000. You are required to prepare a statement showing the working capital needed to finance a level of activity of 1,04,000 units of production. You may assume that production is carried on evenly throughout the year, and wages and overheads accrue similarly. For calculation purposes, 4 weeks may be taken as equivalent to a month.Solution
STATEMENT SHOWING DETERMINATION OF NET WORKING CAPITAL
(A) Current assets: (i) Stock of materials for 1 month: (1,04,000 3 Rs 80 3 4/52) Rs 6,40,000 (ii) Work-in-progress for 0.5 month: (a) Material (1,04,000 3 Rs 80 3 2/52) 3 0.50 1,60,000 (b) Labour (1,04,000 3 Rs 30 3 2/52) 3 0.50 60,000 (c) Overheads (1,04,000 3 Rs 60 3 2/52) 3 0.50 1,20,000 (iii) Finished goods for 1 month: (1,04,000 3 Rs 170 3 4/52) 13,60,000 (iv) Debtors for 2 months (78,000 3 Rs 170 3 8/52) 20,40,000 (v) Cash in hand and at bank 3,65,000 Total investments in current assets 47,45,000 (B) Current liabilities: (i) Creditors, 1 month’s purchase of raw materials, (i.e. 1,04,000 3 Rs.80 3 4/52) 6,40,000 (ii) Average time-lag in payment of expenses (a) Overheads (1,04,000 3 Rs 60 3 4/52) 4,80,000 (b) Labour (1,04,000 3 Rs 30 3 3/104) 90,000 Total estimate of current liabilities 12,10,000 (C) Net working capital = Current assets – Current liabilities (A – B) 35,35,000
Working Notes and Assumptions (i) 26,000 units have been sold for cash. Therefore, credit sales pertain to 78,000 units only. (ii) Year has 52 weeks. (iii) All overheads are assumed to be variable. Presence of depreciation element in overheads will lower the
working capital requirement.

Additional Solved Problems 53
P.13.9 From the following information, extracted from the books of a manufacturing company, compute the operating cycle in days: Period covered: 365 days Average period of credit allowed by suppliers, 16 days Other data are as follows:
(Rs ’000)
Average debtors (outstanding) 480 Raw material consumption 4,400 Total production cost 10,000 Total cost of sales 10,500 Sales for the year 16,000 Value of average stock maintained: Raw material 320 Work-in-process 350 Finished goods 260
Solution
DETERMINATION OF OPERATING CYCLE (AMOUNT IN ’000)
Particulars Days
(i) Raw material holding period (365 days 3 Rs 320/4,400) 27 (ii) Less: Creditors payment period (16) (iii) Work-in-process holding period (365 days 3 Rs 350/Rs 10,000) 13 (iv) Finished goods holding period (365 days 3 Rs 260/Rs 10,000) 9 (v) Debtors collection period (365 days 3 Rs 480/Rs 16,000) (sales given are assumed equal to credit sales) 11Duration of operating cycle 44
P.13.10 Foods Ltd is presently operating at 60 per cent level, producing 36,000 packets of snack foods and proposes to increase its capacity utilisation in the coming year by 33.33 per cent over the existing level of production. The following data has been supplied: (i) Unit cost structure of the product at current level: Raw material Rs 4 Wages (variable) 2 Overheads (variable) 2 Fixed overhead 1 Profit 3 Selling price 12
(ii) Raw materials will remain in stores for 1 month before being issued for production. Material will remain in process for further 1 month. Suppliers grant 3 months credit to the company.
(iii) Finished goods remain in godown for 1 month. (iv) Debtors are allowed credit for 2 months. (v) Average time-lag in wages and overhead payments is 1 month and these expenses accrue evenly
throughout the production cycle. (vi) No increase either in cost of inputs or selling price is envisaged. Prepare a projected profitability statement and a statement showing working capital requirement at the new level, assuming that a minimum cash balance of Rs 19,500 has to be maintained.
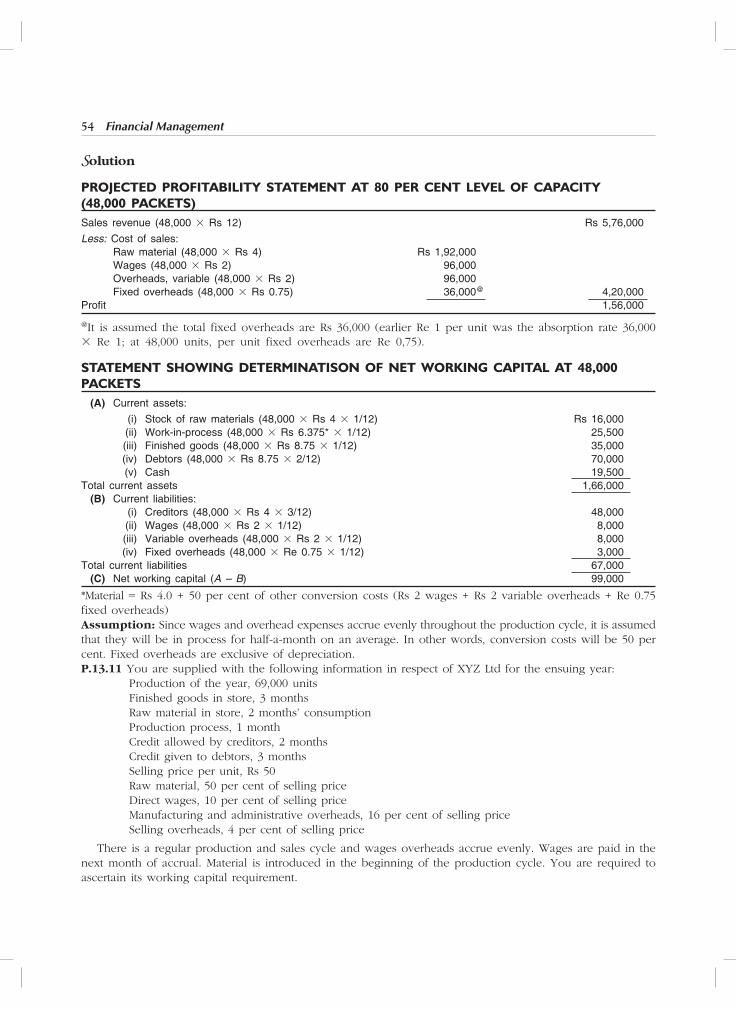
54 Financial Management
Solution
PROJECTED PROFITABILITY STATEMENT AT 80 PER CENT LEVEL OF CAPACITY (48,000 PACKETS)Sales revenue (48,000 3 Rs 12) Rs 5,76,000
Less: Cost of sales: Raw material (48,000 3 Rs 4) Rs 1,92,000 Wages (48,000 3 Rs 2) 96,000 Overheads, variable (48,000 3 Rs 2) 96,000 Fixed overheads (48,000 3 Rs 0.75) 36,000@ 4,20,000Profi t 1,56,000
@It is assumed the total fixed overheads are Rs 36,000 (earlier Re 1 per unit was the absorption rate 36,000 3 Re 1; at 48,000 units, per unit fixed overheads are Re 0,75).
STATEMENT SHOWING DETERMINATISON OF NET WORKING CAPITAL AT 48,000 PACKETS (A) Current assets:
(i) Stock of raw materials (48,000 3 Rs 4 3 1/12) Rs 16,000 (ii) Work-in-process (48,000 3 Rs 6.375* 3 1/12) 25,500 (iii) Finished goods (48,000 3 Rs 8.75 3 1/12) 35,000 (iv) Debtors (48,000 3 Rs 8.75 3 2/12) 70,000 (v) Cash 19,500 Total current assets 1,66,000 (B) Current liabilities: (i) Creditors (48,000 3 Rs 4 3 3/12) 48,000 (ii) Wages (48,000 3 Rs 2 3 1/12) 8,000 (iii) Variable overheads (48,000 3 Rs 2 3 1/12) 8,000 (iv) Fixed overheads (48,000 3 Re 0.75 3 1/12) 3,000 Total current liabilities 67,000 (C) Net working capital (A – B) 99,000
*Material = Rs 4.0 + 50 per cent of other conversion costs (Rs 2 wages + Rs 2 variable overheads + Re 0.75 fixed overheads)Assumption: Since wages and overhead expenses accrue evenly throughout the production cycle, it is assumed that they will be in process for half-a-month on an average. In other words, conversion costs will be 50 per cent. Fixed overheads are exclusive of depreciation.P.13.11 You are supplied with the following information in respect of XYZ Ltd for the ensuing year:
Production of the year, 69,000 unitsFinished goods in store, 3 monthsRaw material in store, 2 months’ consumptionProduction process, 1 monthCredit allowed by creditors, 2 monthsCredit given to debtors, 3 monthsSelling price per unit, Rs 50Raw material, 50 per cent of selling priceDirect wages, 10 per cent of selling priceManufacturing and administrative overheads, 16 per cent of selling priceSelling overheads, 4 per cent of selling price
There is a regular production and sales cycle and wages overheads accrue evenly. Wages are paid in the next month of accrual. Material is introduced in the beginning of the production cycle. You are required to ascertain its working capital requirement.
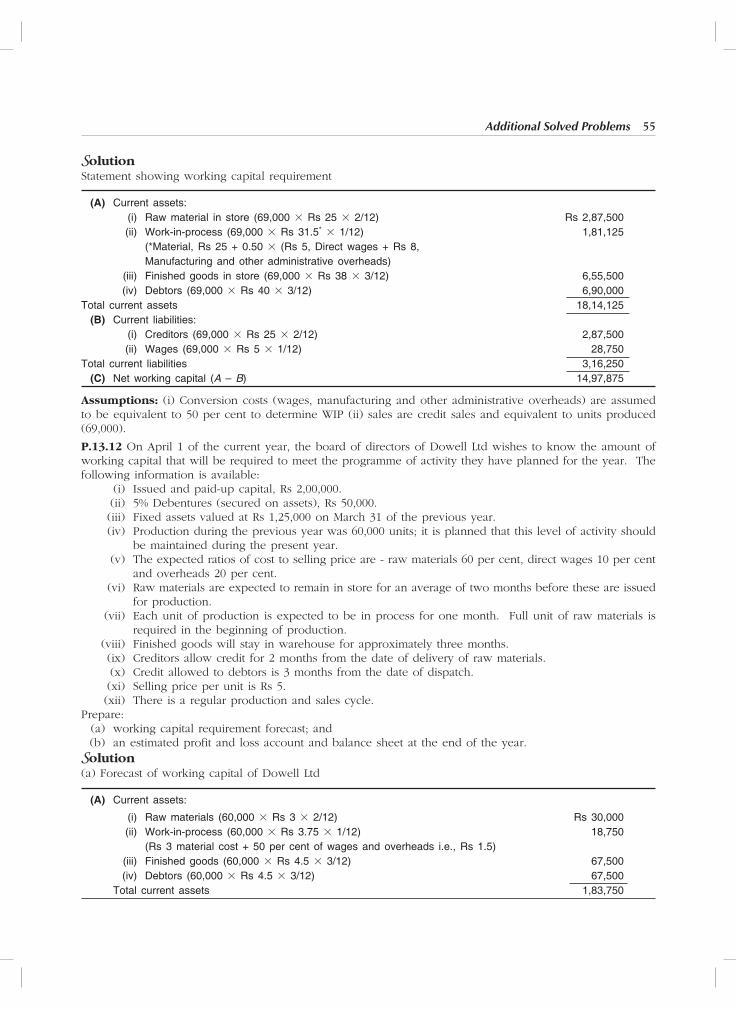
Additional Solved Problems 55
Solution Statement showing working capital requirement
(A) Current assets: (i) Raw material in store (69,000 3 Rs 25 3 2/12) Rs 2,87,500 (ii) Work-in-process (69,000 3 Rs 31.5* 3 1/12) 1,81,125 (*Material, Rs 25 + 0.50 3 (Rs 5, Direct wages + Rs 8, Manufacturing and other administrative overheads) (iii) Finished goods in store (69,000 3 Rs 38 3 3/12) 6,55,500 (iv) Debtors (69,000 3 Rs 40 3 3/12) 6,90,000 Total current assets 18,14,125 (B) Current liabilities: (i) Creditors (69,000 3 Rs 25 3 2/12) 2,87,500 (ii) Wages (69,000 3 Rs 5 3 1/12) 28,750 Total current liabilities 3,16,250 (C) Net working capital (A – B) 14,97,875
Assumptions: (i) Conversion costs (wages, manufacturing and other administrative overheads) are assumed to be equivalent to 50 per cent to determine WIP (ii) sales are credit sales and equivalent to units produced (69,000).
P.13.12 On April 1 of the current year, the board of directors of Dowell Ltd wishes to know the amount of working capital that will be required to meet the programme of activity they have planned for the year. The following information is available: (i) Issued and paid-up capital, Rs 2,00,000. (ii) 5% Debentures (secured on assets), Rs 50,000. (iii) Fixed assets valued at Rs 1,25,000 on March 31 of the previous year. (iv) Production during the previous year was 60,000 units; it is planned that this level of activity should
be maintained during the present year. (v) The expected ratios of cost to selling price are - raw materials 60 per cent, direct wages 10 per cent
and overheads 20 per cent. (vi) Raw materials are expected to remain in store for an average of two months before these are issued
for production. (vii) Each unit of production is expected to be in process for one month. Full unit of raw materials is
required in the beginning of production. (viii) Finished goods will stay in warehouse for approximately three months. (ix) Creditors allow credit for 2 months from the date of delivery of raw materials. (x) Credit allowed to debtors is 3 months from the date of dispatch. (xi) Selling price per unit is Rs 5. (xii) There is a regular production and sales cycle.Prepare: (a) working capital requirement forecast; and (b) an estimated profit and loss account and balance sheet at the end of the year.Solution(a) Forecast of working capital of Dowell Ltd
(A) Current assets:
(i) Raw materials (60,000 3 Rs 3 3 2/12) Rs 30,000 (ii) Work-in-process (60,000 3 Rs 3.75 3 1/12) 18,750 (Rs 3 material cost + 50 per cent of wages and overheads i.e., Rs 1.5) (iii) Finished goods (60,000 3 Rs 4.5 3 3/12) 67,500 (iv) Debtors (60,000 3 Rs 4.5 3 3/12) 67,500 Total current assets 1,83,750

56 Financial Management
(Contd.)
(B) Current liabilities: Creditors (60,000 3 Rs 3 3 2/12) 30,000 (C) Net working capital (A – B) 1,53,750
(b) Projected profit and loss account of the current year
Sales revenue (60,000 3 Rs 5) Rs 3,00,000
Less: Cost of sales: Raw material (0.60 3 Rs 3,00,000) Rs 1,80,000 Direct wages (0.10 3 Rs 3,00,000) 30,000 Overheads (0.20 3 Rs 3,00,000) 60,000 2,70,000Less: Interest (Rs 50,000 3 0.05) 2,500Profi t 27,500
Projected balance sheet at the end of March 31, current year
Liabilities Assets Share capital Rs 2,00,000 Fixed assets Rs 1,25,000Reserves & surplus: Current assets: Profi t of the current year 27,500 Raw material 30,000 Profi t & loss A/c (balancing fi gure) 8,750 Work-in-progress 18,750 5% Debentures 50,000 Finished goods 67,500 Creditors 30,000 Debtors at selling price (15,000 units 3 Rs 5) 75,000 3,16,250 3,16,250
P.13.13 A company is considering its working capital investment and financial policies for the next year. Estimated fixed assets and current liabilities for the next year are Rs 2.60 crore and Rs 2.34 crore respec-tively. Estimated sales and EBIT depend on current assets investment, particularly inventories and book-debt. The financial controller of the company is examining the following alternative working capital policies (Rs crore):
Working capital policy Investment in current assets Estimated sales EBIT
Conservative 4.50 12.30 1.23 Moderate 3.90 11.50 1.15 Aggressive 2.60 10.00 1.00
After evaluating the working capital policy, the financial controller has advised the adoption of the moderate working capital policy. The company is now examining the use of long-term and short-term borrowings for financing its assets. The company will use Rs 2.50 crore of the equity funds. The corporate tax rate is 35 per cent. The company is considering the following debt alternatives:
Financing Policy Short-term debt Long-term debt
Conservative 0.54 1.12 Moderate 1.00 0.66 Aggressive 1.50 0.16 Interest rate-Average (%) 12 16
Required: (1) Working capital investment for each policy. (a) Net working capital position, (b) Rate of return, and (c) Current ratio (2) Financing for each policy. (a) Net working capital position, (b) Rate of return on shareholder equity,and (c) Current ratio
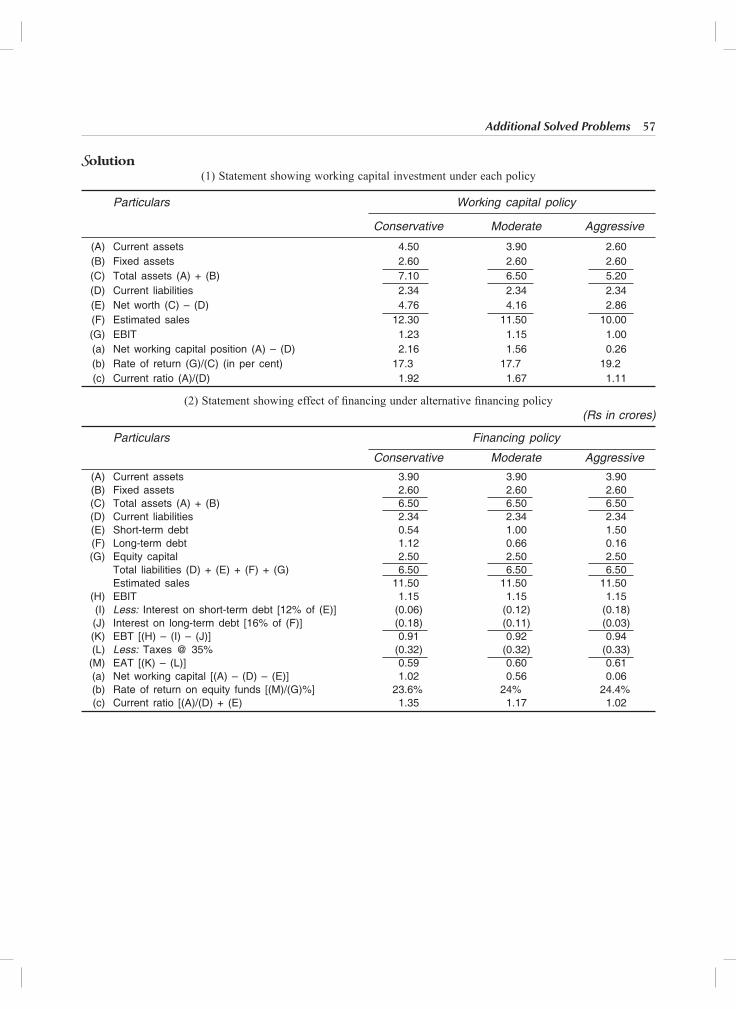
Additional Solved Problems 57
Solution(1) Statement showing working capital investment under each policy
Particulars Working capital policy
Conservative Moderate Aggressive
(A) Current assets 4.50 3.90 2.60 (B) Fixed assets 2.60 2.60 2.60 (C) Total assets (A) + (B) 7.10 6.50 5.20 (D) Current liabilities 2.34 2.34 2.34 (E) Net worth (C) – (D) 4.76 4.16 2.86 (F) Estimated sales 12.30 11.50 10.00 (G) EBIT 1.23 1.15 1.00 (a) Net working capital position (A) – (D) 2.16 1.56 0.26 (b) Rate of return (G)/(C) (in per cent) 17.3 17.7 19.2 (c) Current ratio (A)/(D) 1.92 1.67 1.11
(2) Statement showing effect of fi nancing under alternative fi nancing policy (Rs in crores)
Particulars Financing policy
Conservative Moderate Aggressive
(A) Current assets 3.90 3.90 3.90 (B) Fixed assets 2.60 2.60 2.60 (C) Total assets (A) + (B) 6.50 6.50 6.50 (D) Current liabilities 2.34 2.34 2.34 (E) Short-term debt 0.54 1.00 1.50 (F) Long-term debt 1.12 0.66 0.16 (G) Equity capital 2.50 2.50 2.50 Total liabilities (D) + (E) + (F) + (G) 6.50 6.50 6.50 Estimated sales 11.50 11.50 11.50 (H) EBIT 1.15 1.15 1.15 (I) Less: Interest on short-term debt [12% of (E)] (0.06) (0.12) (0.18) (J) Interest on long-term debt [16% of (F)] (0.18) (0.11) (0.03) (K) EBT [(H) – (I) – (J)] 0.91 0.92 0.94 (L) Less: Taxes @ 35% (0.32) (0.32) (0.33) (M) EAT [(K) – (L)] 0.59 0.60 0.61 (a) Net working capital [(A) – (D) – (E)] 1.02 0.56 0.06 (b) Rate of return on equity funds [(M)/(G)%] 23.6% 24% 24.4% (c) Current ratio [(A)/(D) + (E) 1.35 1.17 1.02
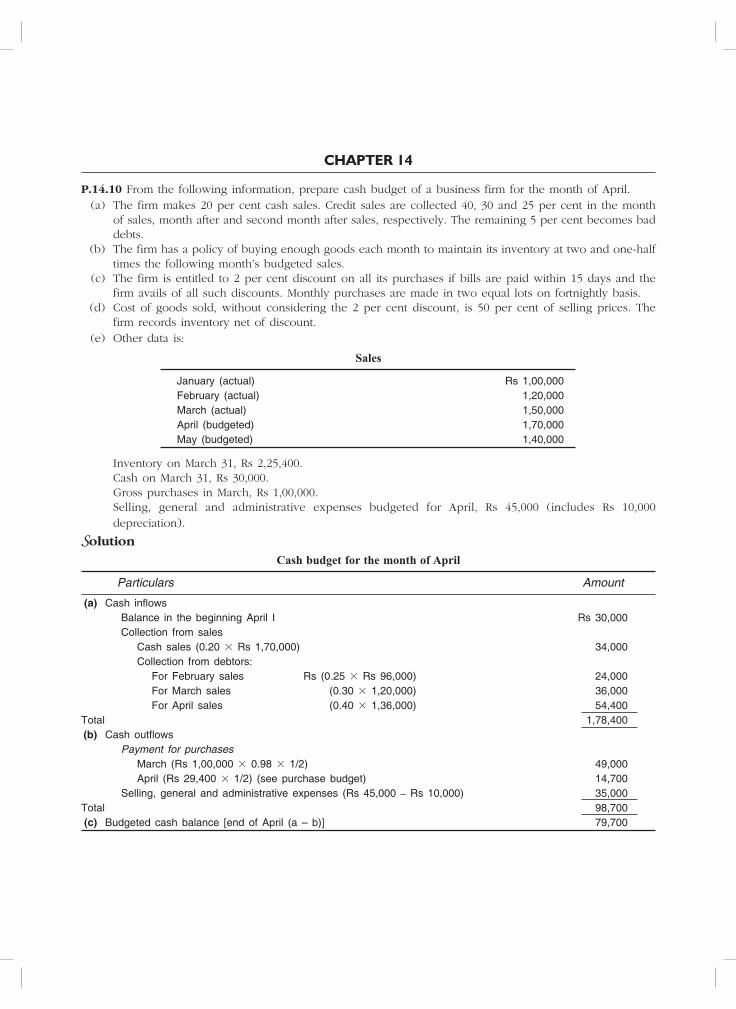
CHAPTER 14
P.14.10 From the following information, prepare cash budget of a business firm for the month of April. (a) The firm makes 20 per cent cash sales. Credit sales are collected 40, 30 and 25 per cent in the month
of sales, month after and second month after sales, respectively. The remaining 5 per cent becomes bad debts.
(b) The firm has a policy of buying enough goods each month to maintain its inventory at two and one-half times the following month’s budgeted sales.
(c) The firm is entitled to 2 per cent discount on all its purchases if bills are paid within 15 days and the firm avails of all such discounts. Monthly purchases are made in two equal lots on fortnightly basis.
(d) Cost of goods sold, without considering the 2 per cent discount, is 50 per cent of selling prices. The firm records inventory net of discount.
(e) Other data is:
Sales
January (actual) Rs 1,00,000 February (actual) 1,20,000 March (actual) 1,50,000 April (budgeted) 1,70,000 May (budgeted) 1,40,000
Inventory on March 31, Rs 2,25,400. Cash on March 31, Rs 30,000. Gross purchases in March, Rs 1,00,000. Selling, general and administrative expenses budgeted for April, Rs 45,000 (includes Rs 10,000
depreciation).
Solution
Cash budget for the month of April
Particulars Amount
(a) Cash infl ows Balance in the beginning April I Rs 30,000 Collection from sales Cash sales (0.20 3 Rs 1,70,000) 34,000 Collection from debtors: For February sales Rs (0.25 3 Rs 96,000) 24,000 For March sales (0.30 3 1,20,000) 36,000 For April sales (0.40 3 1,36,000) 54,400Total 1,78,400 (b) Cash outfl ows Payment for purchases March (Rs 1,00,000 3 0.98 3 1/2) 49,000 April (Rs 29,400 3 1/2) (see purchase budget) 14,700 Selling, general and administrative expenses (Rs 45,000 – Rs 10,000) 35,000Total 98,700 (c) Budgeted cash balance [end of April (a – b)] 79,700

Additional Solved Problems 59
Working Notes
Purchase budget (April) Gross Net
Desired ending inventory—gross (Rs 1,40,000 3 0.50 3 2.5) Rs 1,75,000 Rs 1,71,500 Add: Cost of sales in April—gross (Rs 1,70,000 3 0.50) 85,000 83,300Total requirements 2,60,000 2,54,800 Less: Beginning inventory—gross (Rs 2,25,400 3 100/98) 2,30,000 2,25,400Required purchases 30,000 29,400
P.14.11 Prepare cash budget for January-June from the following information: (i) The estimated sales and expenses are as follows:
Particulars Nov. Dec. Jan. Feb. March April May June
Sales (Rs) 2,00,000 2,20,000 1,20,000 1,00,000 1,50,000 2,40,000 2,00,000 2,00,000Wages and salaries (Rs) 30,000 30,000 24,000 24,000 24,000 30,000 27,000 27,000Miscellaneous expenses (Rs) 27,000 27,000 21,000 30,000 24,000 27,000 27,000 27,000
(ii) 20 per cent of the sales are on cash and balance on credit. (iii) The firm has a gross margin of 25 per cent on sales. (iv) 50 per cent of the credit sales are collected in the month following the sales, 30 per cent in the second
month and 20 per cent in the third month. (v) Material for the sale of each month is purchased one month in advance on a credit for two months. (vi) The time-lag in the payment of wages and salaries is one-third of a month and of miscellaneous expenses,
one month. (vii) Debentures worth Rs 40,000 were sold in January. (viii) The firm maintains a minimum cash balance of Rs 40,000. Funds can be borrowed @ 12 per cent per
annum in the multiples of Rs 1,000, the interest being payable on monthly basis. (ix) Cash balance at the end of December is Rs 60,000.
Solution
Cash budget (January-June) (Amount in thousands of rupees)
Particulars January February March April May June
(a) Cash infl ows Cash sales (20% of total sales) 24 20 30 48 40 40 Collection from debtors: – 50% in the month following 88 48 40 60 96 80 – 30% in the second month 48 52.8 28.8 24 36 57.6 – 20% in the third month — 32.0 35.2 19.2 16 24 Issue of debentures 40 — — — — — Total 200 152.8 134.0 151.2 188 201.6 (b) Cash outfl ows Payment to creditors (working note 2) 165 90 75 112.5 180 150 Wages and salaries 1/3 of last month 10 8 8 8 10 9 2/3 of current month 16 16 16 20 18 18 Miscellaneous expenses (one month’s time-lag) 27 21 30 24 27 27 Total 218 135 129 164.5 235 204
(c) Cash surplus/defi ciency) [a – b] (18) 17.8 5 (13.3) (47) (2.4) Beginning balance 60 42 59.8 64.8 51.5 40.5 Ending balance (indicated) 42 59.8 64.8 51.5 4.5 38.1 Payment of interest (working note 1) — — — — — 0.36 Borrowings required — — — — 36.0 3.0 Ending balance (actual estimated) 42 59.8 64.8 51.5 40.5 40.74
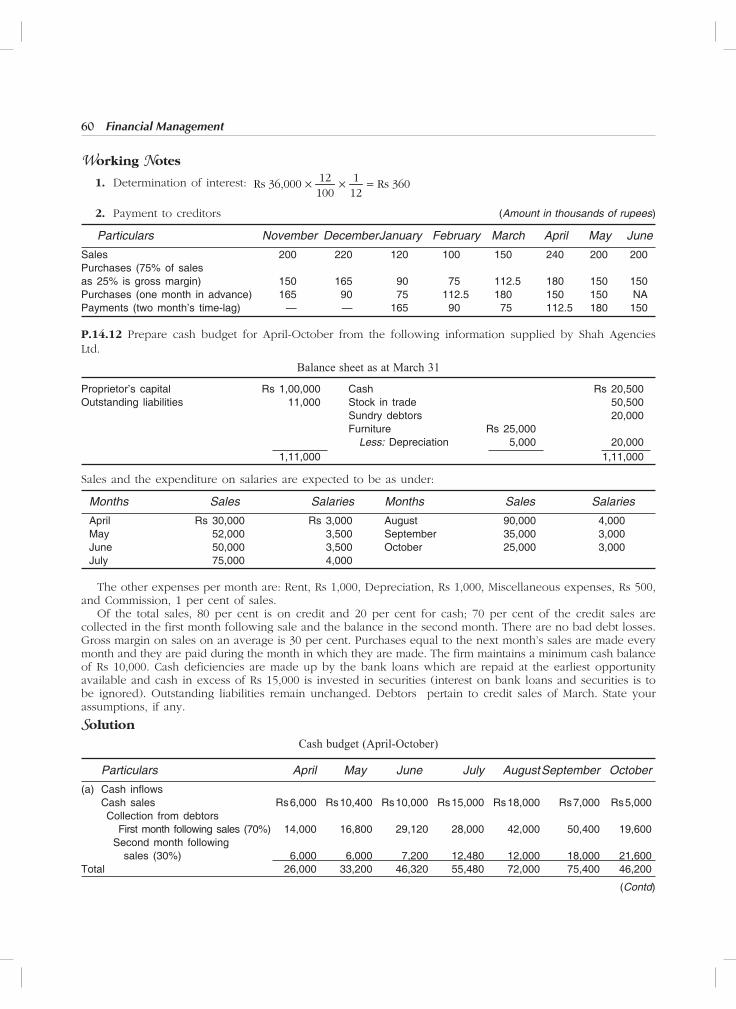
60 Financial Management
Working Notes
1. Determination of interest: 12 1Rs 36,000 Rs 360100 12
2. Payment to creditors (Amount in thousands of rupees)
Particulars November December January February March April May June
Sales 200 220 120 100 150 240 200 200Purchases (75% of salesas 25% is gross margin) 150 165 90 75 112.5 180 150 150Purchases (one month in advance) 165 90 75 112.5 180 150 150 NAPayments (two month’s time-lag) — — 165 90 75 112.5 180 150
P.14.12 Prepare cash budget for April-October from the following information supplied by Shah Agencies Ltd.
Balance sheet as at March 31
Proprietor’s capital Rs 1,00,000 Cash Rs 20,500Outstanding liabilities 11,000 Stock in trade 50,500 Sundry debtors 20,000 Furniture Rs 25,000 Less: Depreciation 5,000 20,000 1,11,000 1,11,000
Sales and the expenditure on salaries are expected to be as under:
Months Sales Salaries Months Sales Salaries
April Rs 30,000 Rs 3,000 August 90,000 4,000 May 52,000 3,500 September 35,000 3,000 June 50,000 3,500 October 25,000 3,000 July 75,000 4,000
The other expenses per month are: Rent, Rs 1,000, Depreciation, Rs 1,000, Miscellaneous expenses, Rs 500, and Commission, 1 per cent of sales. Of the total sales, 80 per cent is on credit and 20 per cent for cash; 70 per cent of the credit sales are collected in the first month following sale and the balance in the second month. There are no bad debt losses. Gross margin on sales on an average is 30 per cent. Purchases equal to the next month’s sales are made every month and they are paid during the month in which they are made. The firm maintains a minimum cash balance of Rs 10,000. Cash deficiencies are made up by the bank loans which are repaid at the earliest opportunity available and cash in excess of Rs 15,000 is invested in securities (interest on bank loans and securities is to be ignored). Outstanding liabilities remain unchanged. Debtors pertain to credit sales of March. State your assumptions, if any.
Solution
Cash budget (April-October)
Particulars April May June July August September October
(a) Cash infl ows Cash sales Rs 6,000 Rs 10,400 Rs 10,000 Rs 15,000 Rs 18,000 Rs 7,000 Rs 5,000 Collection from debtors First month following sales (70%) 14,000 16,800 29,120 28,000 42,000 50,400 19,600 Second month following sales (30%) 6,000 6,000 7,200 12,480 12,000 18,000 21,600Total 26,000 33,200 46,320 55,480 72,000 75,400 46,200
(Contd)

Additional Solved Problems 61
(b) Cash outfl ows Payment to creditors (see working notes) 36,400 35,000 52,500 63,000 24,500 17,500 17,500 Salaries 3,000 3,500 3,500 4,000 4,000 3,000 3,000 Rent 1,000 1,000 1,000 1,000 1,000 1,000 1,000 Miscellaneous expenses 500 500 500 500 500 500 500 Commission (1% of sales) 300 520 500 750 900 350 250Total 41,200 40,520 58,000 69,250 30,900 22,350 22,250 (c) Surplus/(defi ciency) [a – b] (15,200) (7,320) (11,680) (13,770) 41,100 53,050 23,950 Beginning balance 20,500 10,000 10,000 10,000 10,000 13,700 15,000 Ending balance (defi ciency) 5,300 2,680 (1,680) (3,770) 51,100 66,750 38,950 Borrowing required (minimum cash balance + defi ciency – surplus) 4,700 7,320 11,680 13,700 — — — Repayment made — — — — 37,400 — — Investment in securities — — — — — 51,750 23,950 Closing balance (actually now estimated) 10,000 10,000 10,000 10,000 13,700 15,000 15,000
Working Notes
Payment to creditors
Particulars April May June July August Sept. Oct. Nov.
Sales (Rs) Rs 30,000 Rs 52,000 Rs 50,000 Rs 75,000 Rs 90,000 Rs 35,000 Rs 25,000 Rs 25,000 (assumed) Cost of goods to be purchased (70% of next month’s sales and paid) 36,400 35,000 52,500 63,000 24,500 17,500 17,500 —
P.14.13 P Company has to make payment of Rs 2 million on 16th April. It has a surplus money today i.e. 15th January and the company has decided to invest in certificate of deposit (CD’s) of a leading nationalised bank at 8.00 per cent per annum. What money is required to be invested now? Take year as 365 days.
Solution Amount required to make payment on 16th April Rs 2 millionLet amount invested in Certificates of Deposit for 91 days on 15th January be Rs XRate of interest 8 per cent per annumBased on these facts, the equation is
Rs X
0.08 91
1365
= Rs 20,00,000
or 1.0199452 X = Rs 20,00,000or X = Rs 20,00,000/1.10199452 = Rs 19,60,890Therefore, the company is advised to invest Rs 19,60,890 on 15th January in Certificate of Deposit for 91 days in order to receive Rs 20,00,000 on 16th April to make payment.
(Contd)

CHAPTER 15
P.15.11 In order to increase sales from the normal level of Rs 2.4 lakh per annum, the marketing manager submits a proposal for liberalising credit policy as under: Normal sales, Rs 2.4 lakh, Normal credit period, 30 days
Proposed increase in credit period beyond normal 30 days Increase in normal sales
15 Rs 12,000 30 18,000 45 21,000 60 24,000
The contribution to volume/profit-volume ratio is 33.33 per cent. The company expects a pre-tax return of 20 per cent on investment. Evaluate the above 4 alternatives and advise the management (assume 360 days a year).Solution Effect of extending credit period to customers (Amount in lakh of rupees)
Particulars Credit period (days)
30 45 60 75 90
Sales 2.4 2.52 2.58 2.61 2.64Variable costs (2/3) 1.6 1.68 1.72 1.74 1.76Contribution (1/3) 0.8 0.84 0.86 0.87 0.88 Less: Cost of investment in debtors at variable costs (as data related to fi xed cost is not given) 0.027 0.042 0.057 0.0725 0.088
(Total VC/Debtors turnover) 3 0.20
1.612
1.688
1.726
1.744.8
1.764
Profi t 0.773 0.798 0.803 0.7975 0.792
Recommendation The company is advised to extend credit for 60 days.
P.15.12 Pollock Co. Pvt. Ltd, which is operating for the last 5 years, has approached Sudershan industries for grant of credit limit on account of goods bought from the latter, annexing balance sheet and income statement for the last 2 years are as below:
Pollock Co. Pvt. Ltd—balance sheet (Rs ‘000)
Liabilities Current Last Assets Current Last year year year year
Share capital equity (Rs 10 each) 600 600 Plant & equipment 1,500 1,400Share premium 400 400 (less depreciation)Retained earnings 900 700 Land 750 750
Total equity 1,900 1,700 Total fi xed assets 2,250 2,150
First mortgage 200 300 Inventories 580 300Second mortgage — 200 Accounts receivable 350 200Bonds 300 300 Marketable securities 120 120Long-term liabilities 500 800 Cash 100 80
Accounts payable 300 60 Total current assets 1,150 700
Notes payable 600 220Secured liabilities 100 70
Total current liabilities 1,000 350
3,400 2,850 3,400 2,850

Additional Solved Problems 63
Pollock Co. Pvt. Ltd—income statement (Rs ‘000)
Particulars Current year Last year
Sales 5,980 5,780Income from investment 20 6,000 20 5,800
Opening inventory 300 400Total manufacturing Costs 4,200 3,200Ending inventory (580) 3,920 (300) 3,300
2,080 2,500General and administrative expenses 950 750Operating income 1,130 1,750Interest expenses 60 62
Earnings before taxes 1,070 1,688Income-tax 480 674
Net income after taxes 590 1,014
Dividend declared and paid 250
Sudershan industries has established the following broad guidelines for granting credit limits to its customers: (i) Limit credit limit to 10 per cent of net worth and 20 per cent of the net working capital. (ii) Not to give credit in excess of Rs 1,00,000 to any single customer. You are required to detail the steps required for establishing credit limits to Pollock Co. Pvt. Ltd. In this case what you consider to be reasonable credit limit.
SolutionSteps required for establishing the credit limit to be extended by Sudershan Industries to Pollock Co. Pvt. Ltd (i) Maximum credit limit: In this context, the broad guidelines for granting credit limit are as follows: (a) Maximum credit limit restricted to 10 per cent of net worth and 20 per cent of net working
capital. (b) Maximum of Rs 1,00,000 to any single customer.
Net worth of Pollock Co. Pvt. Ltd Rs 19,00,000Net working capital of Pollock Co. Pvt. Ltd. (Rs 11,50,000 – Rs 10,00,000) 1,50,000
Therefore, credit limits possible to be granted are:
Based on net worth (Rs 19,00,000 3 10 per cent) Rs 1,90,000Based on net working capital (Rs 1,50,000 3 20 per cent) 30,000
Based on the above guidelines, maximum credit limit recommended for Pollock Co. is Rs 30,000.Besides, it will be useful for Sudarshan Industries to carry out liquidity analysis. Statement showing major ratios related to liquidity of Pollock company (Amount is Rs ’000)
Particulars Current year Last year
Computation Ratio Computation Ratio
(I) Current ratio (1,150/1,000) 1.15 (700/350) 2.00 (II) Acid-test ratio (570/1,000) 0.57 (400/350) 1.14 (III) Debtors collection period (365 3 350/5,980) 21 Days (365 3 200/5,780) 13 Days (IV) Inventory holding period (365 3 580/3,920) 54 Days (365 3 300/3,300) 33 Days

64 Financial Management
It is apparent that liquidity ratios have shown a market decline in the current year vis-a-vis the previous year. This decrease is primarily attributed to sharp increase in current liabilities. The collection period from debtors seems to be satisfactory. Given the unsatisfactory level of liquidity ratios, the firm should ascertain the reasons for increase in current liabilities from Pollock & Co. and should safeguard against ‘big’ credit sales.
P.15.13 A bank is analysing the receivables of Jackson company in order to identify acceptable collateral for a short-term loan. The company’s credit policy is 2/10 net 30. The bank lends 80 per cent on accounts where customers are not currently overdue and where the average payment period does not exceed 10 days past the net period. A schedule of Jackson’s receivables has been prepared. How much will the bank lend on a pledge of receivables, if the bank uses a 10 per cent allowance for cash discount and returns?
Account Amount Days outstanding Average payment period historically (in days)
74 Rs 25,000 15 20 91 9,000 45 60 107 11,500 22 24 108 2,300 9 10 114 18,000 50 45 116 29,000 16 10 123 14,000 27 48 1,08,000
Solution
Statement showing loan amount on pledge of receivables
Account No. Amount Allowance for cash discount Net amount Loan amount and returns (10% 3 Col. 2) (Col. 2 – Col. 3) @ 80% amount (4)
1 2 3 4 5
74 Rs 25,000 Rs 2,500 Rs 22,500 Rs 18,000 107 11,500 1,150 10,350 8,280 108 2,300 230 2,070 1,656 116 29,000 2,900 26,100 20,880
Total loan amount 48,816
Working Notes 1. Account numbers 91 and 114 are currently overdue by 15 and 20 days respectively, credit policy being
2/10 net 30 days. Also these accounts have average payment period of more than 40 days i.e., 10 days more than credit period allowed. Loan is not available on these accounts as per short-term loan policy of bank.
2. Account number 123, though not currently overdue but has average payment period of more than 40 days. Hence, this account is not eligible for bank loan.
CHAPTER 16
P.16.12 A manufacturer buys casting equipment from outside suppliers @ Rs 30 per unit. Total annual needs are 800 units. The following further data are available:
Annual return on investment, 10 per cent Rent, insurance, taxes per unit per year, Re 1 Cost of placing an order, Rs 100
Determine the economic order quantity.
Solution EOQ
2 800 1002 200 units
4ABC
Total interest cost = 800 Rs 30 10
100 = Rs 2,400
Interest cost per unit = Rs 2,400
800 = Rs 3
Rs 3 + other carrying costs (rent, insurance, taxes) per unit that is, Re 1 per unit.
Carrying cost per unit = Rs 4.
P.16.13 Precision Engineering Factory consumes 50,000 units of a component per year. The ordering, receiving and handling costs are Rs 3 per order while the trucking costs are Rs 12 per order. Further details are as follows: deterioration and obsolescence cost Rs 0.004 per unit per year; interest cost Re 0.06 per unit per year; storage cost Rs 1,000 per year for 50,000 units. Calculate the economic order quality.
Solution
2 50,000 152 4 ,226
0.084ABC
EOQ
Carrying cost per unit: Interest cost Re 0.060 Deterioration and obsolescence cost 0.004
Storage cost Rs 1,000
50,000 0.020
Total 0.084
P.16.14 Shriram Enterprises manufactures a special product “Zed.” The following particulars were collected for the current year.
Monthly demand of Zed, 1000 units Cost of placing an order, Rs 100 Annual carrying cost per unit, Rs 15 Normal usage, 50 units per week Maximum usage, 75 units per week Minimum usage, 25 units per week Reorder period, 4 to 6 weeks
Compute from the above: (a) Reorder quantity, (b) Reorder level, (c) Minimum level, (d) Maximum level, and (e) Average stock level.
66 Financial Management
Solution
(a) Reorder quantity/EOQ = 2 AB/C 2 2,600 * Rs 100/Rs 15 = 187 units
*Annual demand for input unit of (1,000 3 12) 12,000 Zed = 52 weeks 3 Normal usage of inputs per week (52 3 50 units) = 2,600 units
(b) Reorder level = (Maximum usage 3 Maximum delivery time) = (75 units 3 6 weeks) = 450 units (c) Minimum level = Reorder level – (Normal usage 3 Average delivery time in weeks) = 450 units – (50 units 3 5 weeks) = 200 units (d) Maximum level = Reorder level – (Minimum usage 3 Minimum delivery time) + Reorder quantity = 450 units – (25 units 3 4 weeks) + 187 units = 537 units. (e) Average stock level = (Minimum level + Maximum level)/2 = (200 units + 537 units)/2 = 369 units
P.16.15 From the details given below, calculate: (a) Reordering level, (b) Minimum level, (c) Maximum level, and, (d) Danger level:
Reordering quantity is to be calculated on the basis of the following information: Cost of placing a purchase order is Rs 20 Number of units to be purchased during the year is 5,000 Purchase price per unit inclusive of transportation cost is Rs 50. Annual cost of storage per unit is Rs 5. Details of lead time: Average, 10 days; Maximum, 15 days; Minimum, 6 days. For emergency purchases, 4 days. Rate of consumption: Average: 15 units per day; Maximum: 20 units per day.
Solution (a) Reordering level = Maximum usage 3 Maximum delivery time = 20 units 3 15 days = 300 units (b) Minimum level = Reorder level – (Normal usage 3 Average delivery time in days) = 300 units – (15
units 3 10 days) = 150 units (c) Maximum level = Reorder level – (Minimum usage 3 Minimum delivery time) + Reorder quantity =
300 units – (15 3 4 days) + 200 units* = 440 units.
*Reorder quantity = 2 AB/C 2 5000 Rs 20/Rs 5 = 200 units
(d) Danger level = 15 units per day 3 Emergency purchase for 4 days = 60 units
P.16.16 The Complete Gardener is deciding on the economic order quantity for two brands of lawn fertilizer: Super Grow and Nature’s Own. The following information is collected:
Particulars Fertilizer
Super Grow Nature’s Own
Annual demand 2,000 Bags 1,280 Bags Relevant ordering cost per purchase order Rs 1,200 Rs 1,400 Annual relevant carrying cost per bag 480 560
Required: (i) Compute EOQ for Super Grow and Nature’s Own. (ii) For the EOQ, what is the sum of the total annual relevant ordering costs and total annual relevant
carrying costs for Super Grow and Nature’s Own? (iii) For the EOQ, compute the number of deliveries per year for Super Grow and Nature’s Own.
Solution
(i) EOQ =
2 2,000 1,2002 AB
C 480 = 100 bags (Super Grow)
= 2 1,280 1,400
560 = 80 bags (Nature’s Own)

Additional Solved Problems 67
(ii) and (iii) Statement showing total relevant costs for Super Grow and Nature’s Own Fertilizer
Particulars Super Grow Nature’s Own
Annual demand (bags) 2,000 1,280 EOQ (bags) 100 80 Number of orders/deliveries 20 16 Multiplied by ordering cost per order Rs 1,200 Rs 1,400 (a) Total ordering cost 24,000 22,400 Average inventory (1/2 3 EOQ) of bags 50 40 Multiplied by carrying cost per bag 480 560 (b) Total carrying cost 24,000 22,400 (c) Total cost (a) + (b) 48,000 44,800
P.16.17 The following details are available in respect of a firm:
Annual requirement of inventory, 40,000 units Cost per unit (other than carrying and ordering cost), Rs 16 Carrying costs are likely to be 15 per cent per year Cost of placing order, Rs 480 per order
Determine the economic order quantity.
Solution EOQ
2 40,000 Rs 4802 4 ,000 unitsRs 2.40
ABC
C = Rs 16 3 0.15 = Rs 2.40
P.16.18 Good Luck Company estimates its carrying cost at 15 per cent and its ordering cost at Rs 9 per order. The estimated annual requirement is 38,000 units at a price of Rs 4 per unit. What is the most economical number of units to order and how often will an order need to be placed?
Solution
(i)
2 38 ,000 Rs 92EOQ 1,068.
0.6ABC
(ii) Time after which an order is to be placed is given by the following formula (in days):
EOQ
Per day consumption (annual usage 365 days)
1,06810 days
104.11 ( 38 ,000 365 days)
Working Notes
Total carrying cost = 38,000 units 3 Rs 4 3 15/100 = Rs 22,800
Carrying cost per unit = Rs 22,800/38,000 = Re 0.60
P.16.19 A customer has been ordering 5,000 special design metal columns at the rate of 1,000 per order during the past year. The production cost is Rs 12 a unit – Rs 8 for materials and labour and Rs 4 for overheads (fixed cost). It costs Rs 1,500 to set up for one run of 1,000 columns, and inventory carrying cost is 20 per cent. Since this customer may buy at least 5,000 columns this year, the company would like to avoid making five different production runs. Find the most economic production run.
Solution Economic production run is given by the formula of EOQ in which B is setting up costs for one production run in place of buying cost per order. Accordingly, economic production run
2 5,000 Rs 1,500
2,500Rs 2.40

68 Financial Management
P.16.20 PQR Tubes Ltd are the manufacturers of picture tubes for T.V. The following are the details of their operations during the current financial year.
Ordering cost (per order) Rs 100 Inventory carrying cost (per annum) 20% Cost of tubes (per tube) Rs 500 Normal usage (tubes per week) 100 Minimum usage (tubes per week) 50 Maximum usage (tubes per week) 200 Lead time to supply (weeks) 6 – 8
Required: (i) Economic order quantity. If the supplier is willing to supply quarterly 1,500 units at a discount of 5 per
cent, is it worth accepting? (ii) Re-order level (iii) Maximum level of stock (iv) Minimum level of stock
Solution
(i) EOQ =
2 5,200 units Rs 1002 AB
C Rs 100= 101.98 or 102 units
A = 100 tubes per week 3 52 weeks = 5,200 units C = Rs 500 per tube 3 0.2 = Rs 100 per unit per year
(b) Statement showing comparative total cost when order is placed on EOQ basis and when it is placed on quarterly basis, (supplying 1,500 units at 5 per cent discount)
Particulars When order is placed on
EOQ basis 1,500 units
1. Annual requirement (units) 5,200 5,200 2. Order size (in units) 102 1,500 3. Number of order (1 4 2) 50.98 3.47 4. Cost per order Rs 100 Rs 100 5. Total ordering costs (3 3 4) 5,098 347 6. Cost per unit (tube) 500 475 7. Cost of tubes (1 3 6) 26,00,000 24,70,000 8. Average inventory (2/2) (units) 51 750 9. Carrying cost per unit per annum 100 95 10. Total carrying cost (8 3 9) 5,100 71,250 11. Total cost (5 + 7 + 10) 26,10,198 25,41,597
Since total costs are lower when discounts are offered, it is worth accepting to place order of 1,500 units on quarterly basis.
(ii) Re-order level Maximum ordering period (in weeks) 3 Maximum usage per week = 8 weeks 3 200 tubes = 1,600
tubes (ii) Maximum level of stock Re-order level + Re-order quantity – (Minimum usage in weeks 3 Minimum lead time in weeks) = 1,600 tubes + 102 tubes – (50 tubes 3 6 weeks) = 1,702 tubes – 300 tubes = 1402 tubes (iv) Minimum level of stock Re-order level – (Normal usage 3 Average lead time) = 1,600 tubes – (100 tubes 3 7 weeks) = 900
tubes

CHAPTER 17
P17.3 (Factoring) Avon Bijli Ltd deals in electronics goods. The company started business in 1992 as a small electronics sale and repair shop in Delhi with a capital contribution of Rs 5 lakh from its promoters. It recorded impressive growth over the years and is now a significant player with the current annual sales being Rs 200 crore. It currently manages its receivable in-house with the credit terms 3/10 net, 45. Past records have shown that 20 per cent of the customers avail of the discount and the remaining receivables are collected in 60 days. Bad debts amount to 4 per cent of sales. Avon Bijli finances its investments in receivables through a cash credit limit from Yes Bank at an effective rate of 11 per cent. The cost of own funds of the company average 14 per cent. PNB Factor Ltd has approached Amit Goel, the CEO of Avon Bijli Ltd, with a proposal for factoring arrangement for a guaranteed payment within 45 days. They would make advance payment of upto 90 per cent and 85 per cent in case of non-recourse and recourse arrangement respectively. The commission charges payable upfront would be 1.5 per cent in case of recourse arrangement and 3 per cent in case of non-recourse factoring. The discount charge for advance payable upfront for recourse and non-recourse factoring by the factors are at 13 per cent and 14 per cent respectively. Amit Goel seeks the opinion of Ashish Juneja, the CFO of the company, on the proposal. Ashish estimates that if the factoring arrangement is availed of, Avon can save Rs 30 lakh in overheads. He also estimates that with a shift in focus, sales can be expected to increase by 10 per cent. The gross margin on sales of Avon is 25 per cent.Required Evaluate the proposal as the CFO of Avon and make your recommendations to the CEO.
Solution Financial Analysis of Factoring Proposal (Rs crore)
(A) In-house Management of Receivables: 1 Cash discount (Rs 200 3 0.20 3 0.03) Rs 1.20 2 Bad debts (Rs 200 3 0.04) 8.0 3 Avoidable administrative costs 0.30 4 Opportunity cost (lost sales) [200 3 0.10 3 0.21, net of bad debts] 4.2 5 Cost of investment in debtors@ 3.05 16.75@ Average collection period (10 days 3 0.20) + (60 days 3 0.80) = 50 daysCost of investment = Rs 200 crore 3 50/360 3 0.11 = Rs 3.05 crore(B) Cost of Factoring Arrangement: Recourse Non-recourse 1 Factoring commission (Rs 220 crore 3 0.015) 3.3 — (220 3 0.03) — 6.6 2 Discount charge (Rs 184.2* crore 3 0.13 3 45/360) 2.99 — (192.1£ 3 0.14 3 45/360) — 3.363 Cost of extra debt fi nancing [(Rs 220 crore – Rs 184.2 crore) 3 0.14 3 45/360] 0.63 — [(Rs 220 – Rs 192.1) 3 0.14 3 45/360] — 0.49Total cost 6.92 10.45
*Amount of advance = 0.85 3 (Rs 220 – Rs 3.3) = Rs 184.2£Amount of advance = 0.90 3 (Rs 220 – 6.6) = 192.1. Decision Analysis (Recourse Factoring) Amount in Rs crore
Benefi ts (Rs 16.75 – Rs 8.00 Bad debts to be borne by company) Rs 8.75Costs of factoring 6.92Net benefi ts 1.83
70 Financial Management
Decision Analysis (Non-Recourse Factoring) Amount in Rs crore
Benefi ts (Rs 16.75 + 0.8 Bad debts loss to be borne by factor) Rs 17.55Costs of factoring 10.45Net benefi ts 7.10
Decision The net benefits in the case of non-recourse factoring are higher. I would advise the CEO to avail of the non-recourse factoring proposal of PNB Factors Ltd.

CHAPTER 18
P.18.12 Calculate (a) the operating leverage, (b) financial leverage and (c) combined leverage from the following data under situations I and II and financial plans, A and B.Installed capacity, 4,000 unitsActual production and sales, 75 per cent of the capacitySelling price, Rs 30 per unitVariable cost, Rs 15 per unit
Fixed cost: Under situation I, Rs 15,000Under situation II, 20,000Capital structure:
Particulars Financial plan A B
Equity Rs 10,000 Rs 15,000Debt (0.20 interest) 10,000 5,000 20,000 20,000
Solution (a) Determination of operating leverage
Particulars Situations I II
Sales Rs 90,000 Rs 90,000 Less: Variable costs 45,000 45,000Contribution 45,000 45,000 Less: Fixed costs 15,000 20,000EBIT 30,000 25,000
Operating leverage Contribution
EBIT 1.5 1.8
(b) Determination of fi nancial leverage
Particulars Situation I Situation II Financial plans Financial plans
A B A B
EBIT Rs 30,000 Rs 30,000 Rs 25,000 Rs 25,000 Less: Interest on debt 2,000 1,000 2,000 1,000
EBT 28,000 29,000 23,000 24,000Financial leverage (EBIT/EBT) 1.07 1.03 1.09 1.04
(c) Determination of combined leverage
Particulars Financial plans A B
Situation I 1.5 3 1.07 = 1.61 1.5 3 1.03 = 1.54Situation II 1.8 3 1.09 = 1.96 1.8 3 1.04 = 1.87

72 Financial Management
P.18.13 Skyline Software Ltd has appointed you as its finance manager. The comapny wants to implement a project for which Rs 30 lakh is required to be raised from the market as a means of financing the projet. The following financing plans and options are at hand: (Number in thousands)
Particulars Plan A Plan B Plan C
Option 1:
Equity shares 30 30 30
Option 2:
Equity shares 15 20 10 12% Preference shares Nil 10 10 10% Non-convertible debentures 15 Nil 10
Assuming corporate tax to be 35 per cent and the face value of all the shares and debentures to be Rs 100 each, calculate the indifference points and earnings per share (EPS) for each of the financing plans. Which plan should be accepted by the company?
SolutionDetermination of indifference point under plans A, B, C
Plan A:
1 2
(1 ) ( ) (1 ) (1 0.35 ) ( Rs 1.5 lakh ) 0.65;
30 ,000 15 ,000
X t X I t X X
N N
OR X – 0.35X = 2(0.65X – Rs 97,500);
X – 0.35X = 1.3X – Rs 1,95,000
OR 0.65X = Rs 1,95,000 or X = Rs 1,95,000/0.65 = Rs 3,00,000
Plan B:
(1 0.35 )
30 ,000
X
(1 0.35 ) Rs 1,20 ,000
20 ,000
X
OR 0.65
30 ,000
X
0.65 Rs 1,20 ,000;
20 ,000
X
2(0.65X) = 3(0.65X – Rs 1,20,000)
1.3X = 1.95X – Rs 3,60,000
OR X = Rs 3,60,000/0.65 = Rs 5,53,846
Plan C:
1
(1 )X t
N
2
( ) (1 ) 0.65;
30 ,000PX I t D X
N
( Rs 1lakh) 0.65 Rs 1.2 lakh
10,000
X
OR 0.6530 ,000
X 0.65 Rs 65 ,000 Rs 1,20 ,000;
10 ,000
X
OR 0.6530 ,000
X 0.65 Rs 1,85 ,000
10 ,000
X
X = Rs 5,55,000/1.3 = Rs 4,26,923

Additional Solved Problems 73
Determination of EPS under plans A, B and C for options 1 and 2
Particulars Plan A Plan B Plan C
1 2 1 2 1 2
EBIT Rs 3,00,000 Rs 3,00,000 Rs 5,53,846 Rs 5,53,846 Rs 4,26,923 Rs 4,26,923 Less: Interest — 1,50,000 — — — 1,00,000EBT 3,00,000 1,50,000 5,53,846 5,53,846 4,26,923 3,26,923 Less: Taxes 1,05,000 52,500 1,93,846 1,93,846 1,49,423 1,14,423EAT 1,95,000 97,500 3,60,000 3,60,000 2,77,500 2,12,500 Less: Dividend on preference shares — — — 1,20,000 — 1,20,000Earnings available for equity-holders 1,95,000 97,500 3,60,000 2,40,000 2,77,500 92,500Number of equity 4 30,000 4 15,000 4 30,000 4 20,000 4 30,000 4 10,000 shares (N)EPS 6.5 6.5 12 12 9.25 9.25
P.18.14 The capital structure of the Progressive Corporation Ltd consists of an ordinary share capital of Rs 10,00,000 (shares of Rs 100 par value) and Rs 10,00,000 of 10% debentures. The unit sales increased by 20 per cent from 1,00,000 units to 1,20,000 units, the selling price is Rs 10 per unit, variable costs amount to Rs 6 per unit and fixed expenses amount to Rs 2,00,000. The income tax rate is assumed to be 35 per cent. (a) You are required to calculate the following: (i) The percentage increase in earnings per share. (ii) The degree of financial leverage at 1,00,000 units and 1,20,000 units. (iii) The degree of operating leverage at 1,00,000 units and 1,20,000 units. (b) Comment on the behaviour of operating and financial leverage in relation to increase of production from
1,00,000 to 1,20,000 units.
Solution (a) Determination of earnings per share (EPS)
Sales level (units) 1,00,000 1,20,000Sales revenue Rs 10,00,000 Rs 12,00,000 Less: Variable costs 6,00,000 7,20,000 Less: Fixed costs 2,00,000 2,00,000EBIT 2,00,000 2,80,000 Less: Interest 1,00,000 1,00,000Earnings after interest 1,00,000 1,80,000 Less: Taxes 35,000 63,000EAT 65,000 1,17,000Number of equity shares 10,000 10,000EPS (EAT 4 N) 6.5 11.7
(i) Percentage increase per share
EPS
100EPS
Rs 5.2
100 80 per centRs 6.5
(ii) DFL (at 1,00,000 units) Rs 2,00,000
2.0Rs 1,00,000
(at 1,20,000 units) Rs 2,80,000
1.56Rs 1,80,000
(iii) DOL (at 1,00,000 units) Rs 4,00,000
2.0Rs 2,00,000
(at 1,20,000 units) Rs 4,80,000
1.71Rs 2,80,000
74 Financial Management
(b) As a result of increase in production and sales from 1,00,000 units to 1,20,000 units, EPS has gone up by 80 per cent. Moreover, there has been a decrease in both types of leverages–operating as well as financial–reflecting a decline in the total risk of the company.
P.18.15 X Ltd, a widely held company, is considering a major expansion of its production facilities and the following alternatives are available:
Particulars Alternatives (Rs lakh)
A B C
Share capital 50 20 1014% Debentures — 20 15Loan from a fi nancial institution @ 18 per cent — 10 25
The expected rate of return before interest and tax is 25 per cent. The rate of dividend of the comapny is not less than 20 per cent. The company at present has no debt. The corporate tax rate is 35 per cent. Which of the alternative would you choose, assuming maximising ROR on equity capital as the objective of the firm?
Solution Rate of return (ROR) on equity capital under proposed fi nancial alternatives
Particulars Financing alternatives (Rs lakh)
A B C
EBIT (Rs 50 lakh 3 0.25) 12.5 12.5 12.5 Less: Interest on debentures — 2.8 2.1 Less: Interest on loan — 1.8 4.5EBT 12.5 7.9 5.9 Less: Taxes (0.35) 4.375 2.765 2.065EAT 8.125 5.135 3.835ROR on equity capital (%) 16.25 25.675 38.35
Alternative C is the best.P.18.16 Consider the following information for Strong Ltd: (Rs in lakh)
EBIT 1,120EBT 320Fixed cost 700
Calculate the percentage of change in EPS, if sales increase by 5 per cent.
Solution Degree of combined leverage (DCL) = (Degree of operating leverage 3 Degree of financial leverage)
= Percentage change in EBIT Percentage change in EPS
Percentage change in sales Percentage change in EBIT
DCL = Percentage change in EPS
Percentage change in sales
Alternatively, DCL can be determined as
DCL =
Sales Variable costs* EBIT
EBIT EBT
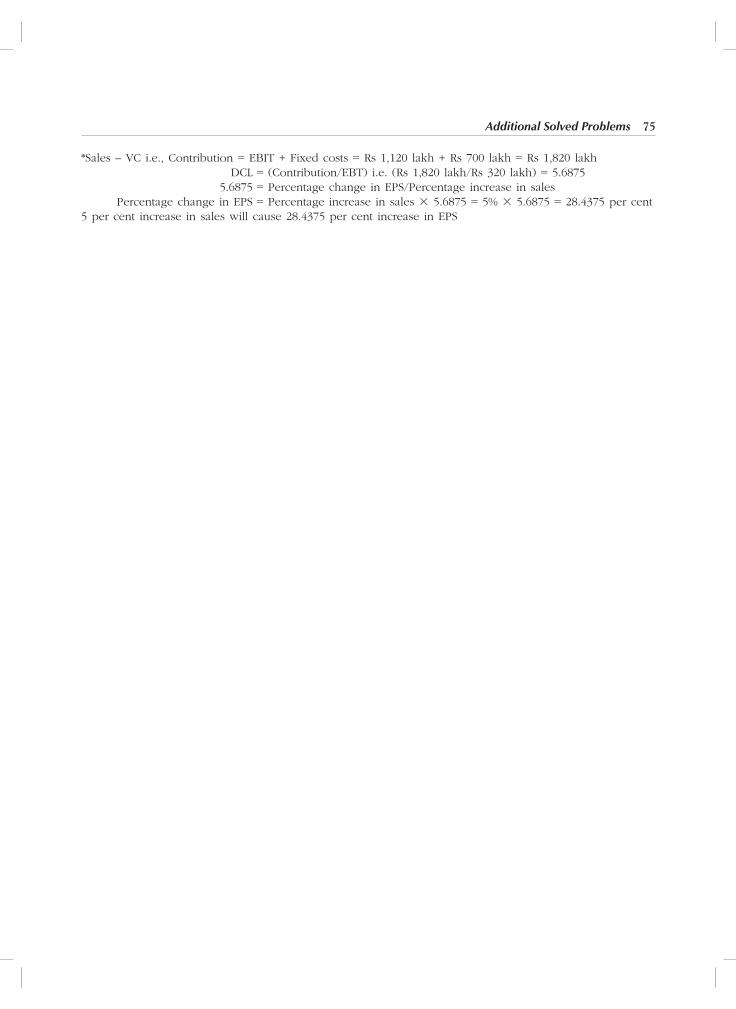
Additional Solved Problems 75
*Sales – VC i.e., Contribution = EBIT + Fixed costs = Rs 1,120 lakh + Rs 700 lakh = Rs 1,820 lakh DCL = (Contribution/EBT) i.e. (Rs 1,820 lakh/Rs 320 lakh) = 5.6875 5.6875 = Percentage change in EPS/Percentage increase in sales Percentage change in EPS = Percentage increase in sales 3 5.6875 = 5% 3 5.6875 = 28.4375 per cent5 per cent increase in sales will cause 28.4375 per cent increase in EPS

CHAPTER 20
P.20.6 The Modern Chemicals Ltd requires Rs 25,00,000 for a new plant. This plant is expected to yield earnings before interest and taxes of Rs 5,00,000. While deciding about the financial plan, the company considers the objective of maximising earnings per share. It has three alternatives to finance the project—by raising debt of Rs 2,50,000 or Rs 10,00,000 or Rs 15,00,000 and the balance, in each case, by issuing equity shares. The company’s share is currently selling at Rs 150, but is expected to decline to Rs 125 in case the funds are borrowed in excess of Rs 10,00,000. The funds can be borrowed at the rate of 10 per cent uptoRs 2,50,000, at 15 per cent over Rs 2,50,000 and upto Rs 10,00,000 and at 20 per cent over Rs 10,00,000. The tax rate applicable to the company is 50 per cent. Which form of financing should the company choose?
Solution Earnings Per Share (EPS) under proposed fi nancial alternatives
Particulars Financial alternatives to raise Rs 25 lakh
I (Raising debt of II (Raising debt of III (Raising debt of Rs 2.5 lakh + Equity Rs 10 lakh + Equity Rs 15 lakh + Equity of Rs 22.5 lakh) of Rs 15 lakh) of Rs 10 lakh)
Expected EBIT Rs 5,00,000 Rs 5,00,000 Rs 5,00,000 Less: Interest1 25,000 1,37,500 2,37,500Earnings before taxes 4,75,000 3,62,500 2,62,500 Less: Taxes 2,37,500 1,81,250 1,31,250Earnings after taxes (EAT) 2,37,500 1,81,250 1,31,250Number of shares2 15,000 10,000 8,000Earnings per share (EPS) 15.833 18.125 16.406
Recommendation Financing option II (raising debt of Rs 10 lakh and issue of equity share capital of Rs 15 lakh) is the best option as it maximises the EPS.
Working Notes
(1) Determination of interest: Plan I (Rs 2,50,000 3 0.10) Rs 25,000 Plan II (Rs 2,50,000 3 0.10) Rs 25,000 (Rs 7,50,000 3 0.15) 1,12,500 1,37,500 Plan III (Rs 2,50,000 3 0.10) 25,000 (Rs 7,50,000 3 0.15) 1,12,500 (Rs 5,00,000 3 0.20) 1,00,000 2,37,500 (2) Number of equity shares to be issued Plan I (Rs 22,50,000/Rs 150 Market price per share) 15,000 Plan II (Rs 15,00,000/Rs 150 Market price per share) 10,000 Plan III (Rs 10,00,000/Rs 125 Market price per share) 8,000
P.20.7 Harbour company, is a medium-sized producer of chemicals and vinyl coatings used in a variety of industrial processes.Last year, the company recorded over Rs 1,500 lakh in sales, showed net income after tax of Rs 250 lakh and concluded a very successful year. For the year coming up, the firm expects a 10 per cent improvement in its sales and operating income figures. Other relevant details—total assets Rs 2,200 lakh, debt assets ratio (i.e. total debts including current liabilities) 31.8 per cent, earnings per share Rs 3.16 (No. of equity shares of Rs 10 paid up 80 lakh); dividend per share Rs 1.50 (These all relate to the last year).
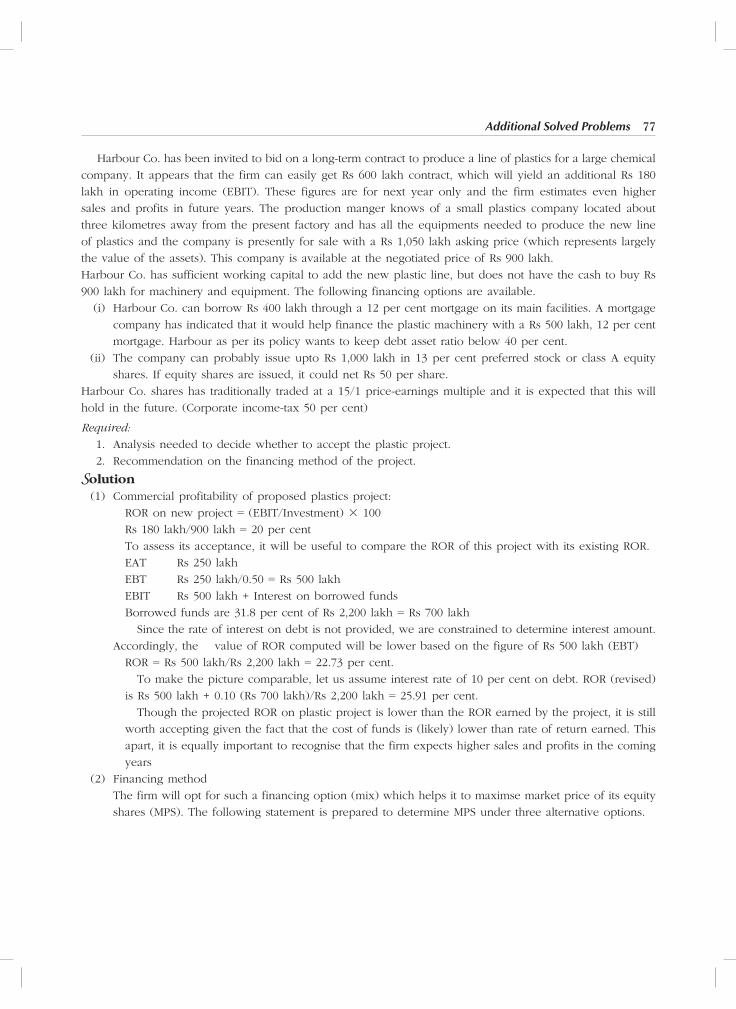
Additional Solved Problems 77
Harbour Co. has been invited to bid on a long-term contract to produce a line of plastics for a large chemical
company. It appears that the firm can easily get Rs 600 lakh contract, which will yield an additional Rs 180
lakh in operating income (EBIT). These figures are for next year only and the firm estimates even higher
sales and profits in future years. The production manger knows of a small plastics company located about
three kilometres away from the present factory and has all the equipments needed to produce the new line
of plastics and the company is presently for sale with a Rs 1,050 lakh asking price (which represents largely
the value of the assets). This company is available at the negotiated price of Rs 900 lakh.
Harbour Co. has sufficient working capital to add the new plastic line, but does not have the cash to buy Rs
900 lakh for machinery and equipment. The following financing options are available.
(i) Harbour Co. can borrow Rs 400 lakh through a 12 per cent mortgage on its main facilities. A mortgage
company has indicated that it would help finance the plastic machinery with a Rs 500 lakh, 12 per cent
mortgage. Harbour as per its policy wants to keep debt asset ratio below 40 per cent.
(ii) The company can probably issue upto Rs 1,000 lakh in 13 per cent preferred stock or class A equity
shares. If equity shares are issued, it could net Rs 50 per share.
Harbour Co. shares has traditionally traded at a 15/1 price-earnings multiple and it is expected that this will
hold in the future. (Corporate income-tax 50 per cent)
Required:
1. Analysis needed to decide whether to accept the plastic project.
2. Recommendation on the financing method of the project.
Solution (1) Commercial profitability of proposed plastics project:
ROR on new project = (EBIT/Investment) 3 100
Rs 180 lakh/900 lakh = 20 per cent
To assess its acceptance, it will be useful to compare the ROR of this project with its existing ROR.
EAT Rs 250 lakh
EBT Rs 250 lakh/0.50 = Rs 500 lakh
EBIT Rs 500 lakh + Interest on borrowed funds
Borrowed funds are 31.8 per cent of Rs 2,200 lakh = Rs 700 lakh
Since the rate of interest on debt is not provided, we are constrained to determine interest amount.
Accordingly, the value of ROR computed will be lower based on the figure of Rs 500 lakh (EBT)
ROR = Rs 500 lakh/Rs 2,200 lakh = 22.73 per cent.
To make the picture comparable, let us assume interest rate of 10 per cent on debt. ROR (revised)
is Rs 500 lakh + 0.10 (Rs 700 lakh)/Rs 2,200 lakh = 25.91 per cent.
Though the projected ROR on plastic project is lower than the ROR earned by the project, it is still
worth accepting given the fact that the cost of funds is (likely) lower than rate of return earned. This
apart, it is equally important to recognise that the firm expects higher sales and profits in the coming
years
(2) Financing method
The firm will opt for such a financing option (mix) which helps it to maximse market price of its equity
shares (MPS). The following statement is prepared to determine MPS under three alternative options.

78 Financial Management
Determination of MPS under various fi nancing options(Amount in Rs lakh)
Particulars Financing options to raise Rs 900 lakh
12% Debt 13% Preference Shares 18 lakh Equity shares
Expected EBIT 180 180 180 Less: Interest on debt 108 — — Earnings before taxes 72 180 180 Less: Taxes (50%) 36 90 90 Earnings after taxes 36 90 90 Add: Existing EAT 250 250 250 Profi ts available to shareholders 286 340 340 Less: Preference dividends — 117 — Earnings for equityholders 286 223 340 Number of equityshares 80 80 98 EPS 3.575 2.7875 3.4934 P/E ratio (times) 15 15 15 Market price per share Rs 53.625 Rs 41.8125 Rs 52.401
Debt option is the best alternative as it maximises MPS. However, the company cannot opt for Rs 900 lakh debt as it causes an increase in debt-asset ratio of the company to 51.6 per cent [(Rs 700 lakh + Rs 900 lakh) 4 (Rs 2,200 lakh + Rs 900 lakh) vis-à-vis its policy of having its debt-asset ratio below 40 per cent. Accord-ingly, the maximum debt possible to be tapped is (40% 3 Rs 3,100 lakh assets after plastic project – Existing debt of Rs 700 lakh) = Less than Rs 540 lakh. In such circumstances the firm is to opt for hybrid type of financing. The feasible mix may be Rs 500 lakh debt and Rs 400 lakh equity consist of 8 lakh shares @ Rs 50 per share (preference option is not considered as it has minimum EPS as well as minimum MPS).
Statement showing MPS under debt + equity fi nancing options(Amount in Rs lakh)
Particulars Amount
Expected EBIT 180Less: Interest on debt (Rs 500 lakh 3 12%) 60EBT 120Less: Taxes 60EAT 60Add: Existing EAT 250Total EAT available to equityholders 310Divided by number of equity shares (80 lakh + 8 lakh) 88EPS (Rs 310 lakh/88 lakh shares) 3.5227Multiply by P/E ratio (times) 15MPS 52.84Current MPS (Rs 3.16 3 15 times) 47.4Current issue price indicated 50
Recommendation The statement clearly demonstrates the financial viability of the proposed plastic project as it enhances its current market price of the share. The proposed project should be financed by debt-equity mix of Rs 500 lakh and Rs 400 lakh respectively.
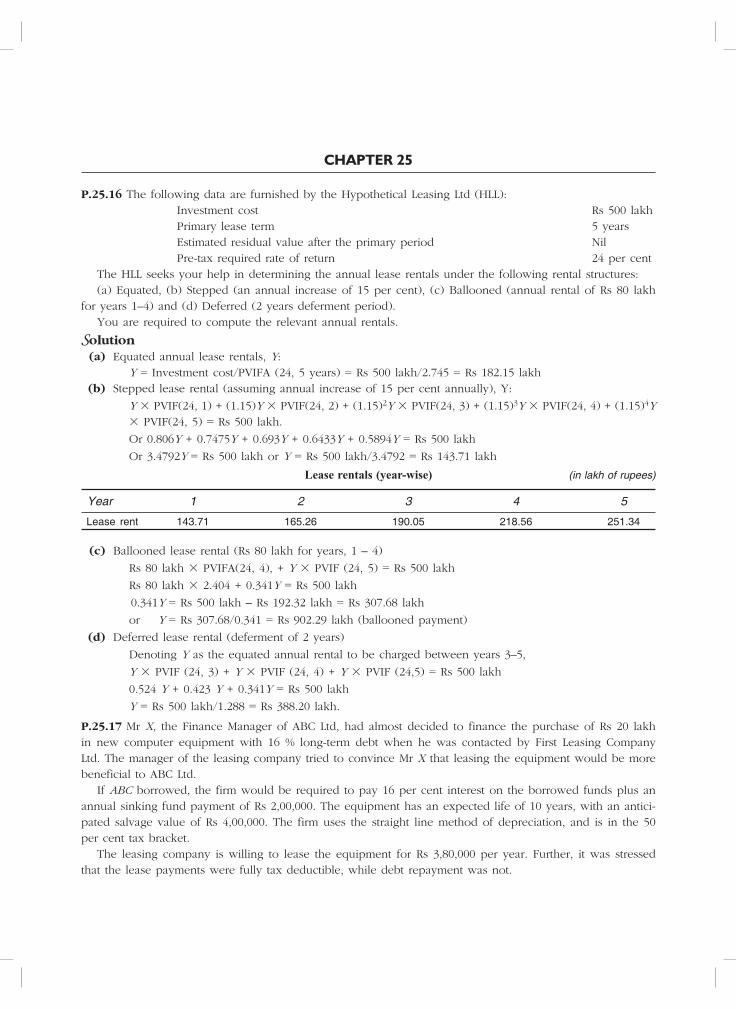
CHAPTER 25
P.25.16 The following data are furnished by the Hypothetical Leasing Ltd (HLL): Investment cost Rs 500 lakh Primary lease term 5 years Estimated residual value after the primary period Nil Pre-tax required rate of return 24 per cent The HLL seeks your help in determining the annual lease rentals under the following rental structures: (a) Equated, (b) Stepped (an annual increase of 15 per cent), (c) Ballooned (annual rental of Rs 80 lakh for years 1–4) and (d) Deferred (2 years deferment period). You are required to compute the relevant annual rentals.
Solution (a) Equated annual lease rentals, Y: Y = Investment cost/PVIFA (24, 5 years) = Rs 500 lakh/2.745 = Rs 182.15 lakh (b) Stepped lease rental (assuming annual increase of 15 per cent annually), Y:
Y 3 PVIF(24, 1) + (1.15)Y 3 PVIF(24, 2) + (1.15)2Y 3 PVIF(24, 3) + (1.15)3Y 3 PVIF(24, 4) + (1.15)4Y 3 PVIF(24, 5) = Rs 500 lakh.
Or 0.806Y + 0.7475Y + 0.693Y + 0.6433Y + 0.5894Y = Rs 500 lakh
Or 3.4792Y = Rs 500 lakh or Y = Rs 500 lakh/3.4792 = Rs 143.71 lakh
Lease rentals (year-wise) (in lakh of rupees)
Year 1 2 3 4 5
Lease rent 143.71 165.26 190.05 218.56 251.34
(c) Ballooned lease rental (Rs 80 lakh for years, 1 – 4)
Rs 80 lakh 3 PVIFA(24, 4), + Y 3 PVIF (24, 5) = Rs 500 lakh
Rs 80 lakh 3 2.404 + 0.341Y = Rs 500 lakh
0.341Y = Rs 500 lakh – Rs 192.32 lakh = Rs 307.68 lakh
or Y = Rs 307.68/0.341 = Rs 902.29 lakh (ballooned payment)
(d) Deferred lease rental (deferment of 2 years)
Denoting Y as the equated annual rental to be charged between years 3–5,
Y 3 PVIF (24, 3) + Y 3 PVIF (24, 4) + Y 3 PVIF (24,5) = Rs 500 lakh
0.524 Y + 0.423 Y + 0.341Y = Rs 500 lakh
Y = Rs 500 lakh/1.288 = Rs 388.20 lakh.
P.25.17 Mr X, the Finance Manager of ABC Ltd, had almost decided to finance the purchase of Rs 20 lakh in new computer equipment with 16 % long-term debt when he was contacted by First Leasing Company Ltd. The manager of the leasing company tried to convince Mr X that leasing the equipment would be more beneficial to ABC Ltd. If ABC borrowed, the firm would be required to pay 16 per cent interest on the borrowed funds plus an annual sinking fund payment of Rs 2,00,000. The equipment has an expected life of 10 years, with an antici-pated salvage value of Rs 4,00,000. The firm uses the straight line method of depreciation, and is in the 50 per cent tax bracket. The leasing company is willing to lease the equipment for Rs 3,80,000 per year. Further, it was stressed that the lease payments were fully tax deductible, while debt repayment was not.
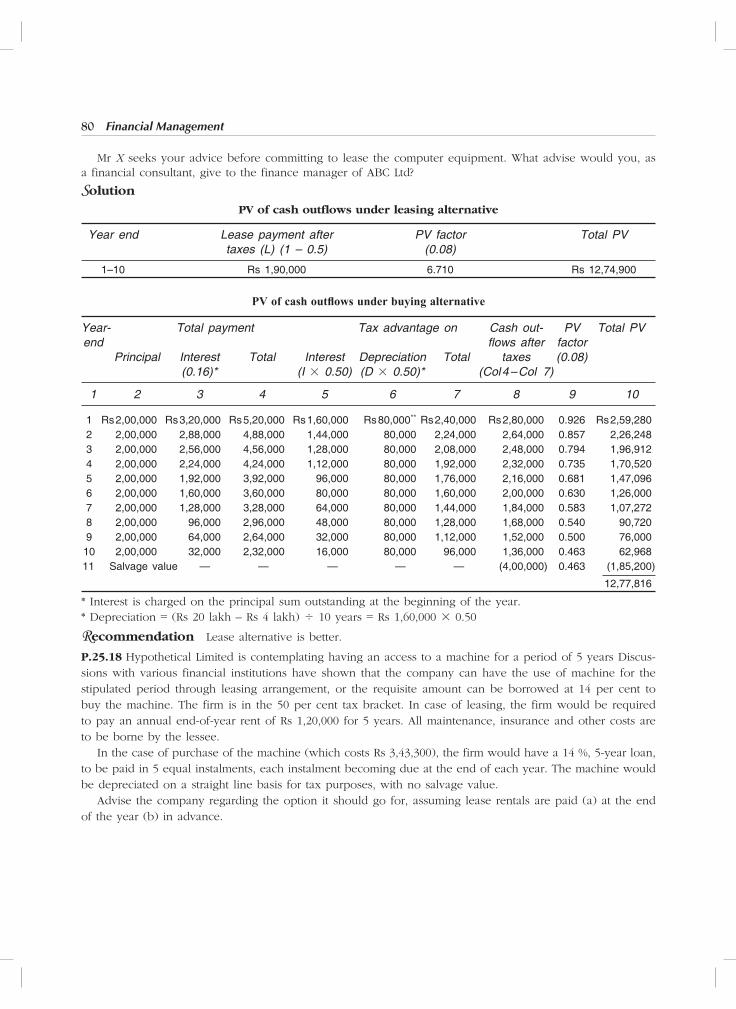
80 Financial Management
Mr X seeks your advice before committing to lease the computer equipment. What advise would you, as a financial consultant, give to the finance manager of ABC Ltd?
Solution
PV of cash outflows under leasing alternative
Year end Lease payment after PV factor Total PV taxes (L) (1 – 0.5) (0.08)
1–10 Rs 1,90,000 6.710 Rs 12,74,900
PV of cash outfl ows under buying alternative
Year- Total payment Tax advantage on Cash out- PV Total PV end fl ows after factor Principal Interest Total Interest Depreciation Total taxes (0.08) (0.16)* (I 3 0.50) (D 3 0.50)* (Col 4 – Col 7)
1 2 3 4 5 6 7 8 9 10
1 Rs 2,00,000 Rs 3,20,000 Rs 5,20,000 Rs 1,60,000 Rs 80,000** Rs 2,40,000 Rs 2,80,000 0.926 Rs 2,59,280 2 2,00,000 2,88,000 4,88,000 1,44,000 80,000 2,24,000 2,64,000 0.857 2,26,248 3 2,00,000 2,56,000 4,56,000 1,28,000 80,000 2,08,000 2,48,000 0.794 1,96,912 4 2,00,000 2,24,000 4,24,000 1,12,000 80,000 1,92,000 2,32,000 0.735 1,70,520 5 2,00,000 1,92,000 3,92,000 96,000 80,000 1,76,000 2,16,000 0.681 1,47,096 6 2,00,000 1,60,000 3,60,000 80,000 80,000 1,60,000 2,00,000 0.630 1,26,000 7 2,00,000 1,28,000 3,28,000 64,000 80,000 1,44,000 1,84,000 0.583 1,07,272 8 2,00,000 96,000 2,96,000 48,000 80,000 1,28,000 1,68,000 0.540 90,720 9 2,00,000 64,000 2,64,000 32,000 80,000 1,12,000 1,52,000 0.500 76,000 10 2,00,000 32,000 2,32,000 16,000 80,000 96,000 1,36,000 0.463 62,968 11 Salvage value — — — — — (4,00,000) 0.463 (1,85,200)
12,77,816
* Interest is charged on the principal sum outstanding at the beginning of the year.* Depreciation = (Rs 20 lakh – Rs 4 lakh) 4 10 years = Rs 1,60,000 3 0.50
Recommendation Lease alternative is better.
P.25.18 Hypothetical Limited is contemplating having an access to a machine for a period of 5 years Discus-sions with various financial institutions have shown that the company can have the use of machine for the stipulated period through leasing arrangement, or the requisite amount can be borrowed at 14 per cent to buy the machine. The firm is in the 50 per cent tax bracket. In case of leasing, the firm would be required to pay an annual end-of-year rent of Rs 1,20,000 for 5 years. All maintenance, insurance and other costs are to be borne by the lessee. In the case of purchase of the machine (which costs Rs 3,43,300), the firm would have a 14 %, 5-year loan, to be paid in 5 equal instalments, each instalment becoming due at the end of each year. The machine would be depreciated on a straight line basis for tax purposes, with no salvage value. Advise the company regarding the option it should go for, assuming lease rentals are paid (a) at the end of the year (b) in advance.

Additional Solved Problems 81
Solution
(a) PV of cash outfl ows under leasing alternative (year-end payment of lease rentals)
Year-end Lease payment (L) PV factor at after tax Total PV of after tax cost of debt (0.07) lease payments Col (2) 3 Col (3)
1 2 3 4
1–5 Rs 60,000 4.100 Rs 2,46,000
Determination of the interest and principal components of loan instalment
Year-end Loan Loan at the Payment Principal out- instalment beginning Interest Principal standing at the of the year on loan re-payment end of the year (Col 3 3 0.14) (Col 2–Col 4) (Col 3 – Col 5)
1 2 3 4 5 6
1 Rs 1,00,000* Rs 3,43,300 Rs 48,062 Rs 51,938 Rs 2,91,362 2 1,00,000 2,91,362 40,791 59,209 2,32,153 3 1,00,000 2,32,153 32,501 67,499 1,64,654 4 1,00,000 1,64,654 23,052 76,948 87,706 5 1,00,000 87,706 12,294 87,706 —
*Determination of loan instalment: Amount of loan/PVIFA(14,5) = Rs 3,43,300/3.433 = Rs 1,00,000
PV of cash outfl ows after tax under buying (borrowing) alternative
Year-end Loan Tax Tax Net cash PV factor PV of instalment advantage advantage on outfl ows at after- buying on interest depreciation (Col 2 – tax cost alternative payment (Col 3 + 4) of debt (0.07)
1 2 3 4 5 6 7
1 Rs 1,00,000 Rs 24,031 Rs 34,330 Rs 41,639 0.935 Rs 38,932 2 1,00,000 20,395 34,330 45,275 0.873 39,525 3 1,00,000 16,250 34,330 49,420 0.816 40,327 4 1,00,000 11,526 34,330 54,144 0.763 41,312 5 1,00,000 6,147 34,330 59,523 0.713 42,440
m Total 2,02,536
Recommendation Since the PV of cash outflows for buying/borrowing (Rs 2,02,536) is lower than that of leasing (Rs 2,46,000), the buying alternative is preferred.
(b) PV of cash outfl ows under leasing alternative, when lease rental is paid in advance
Year-end Lease payment Tax shield Cash outfl ows PV factor Total PV after taxes (0.07)
1 2 3 4 5 6
0 Rs 1,20,000 — Rs 1,20,000 1.000 Rs 1,20,000 1–4 1,20,000 Rs 60,000 60,000 3.387 2,03,220 5 — 60,000 (60,000) 0.713 (42,780)
2,80,440
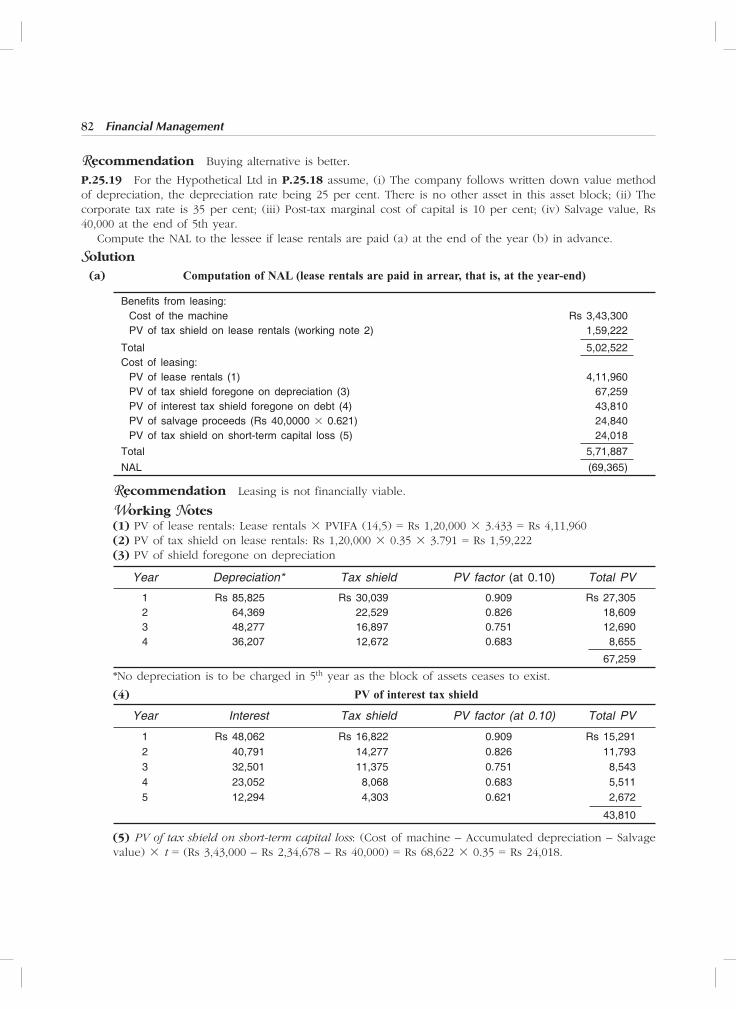
82 Financial Management
Recommendation Buying alternative is better.
P.25.19 For the Hypothetical Ltd in P.25.18 assume, (i) The company follows written down value method of depreciation, the depreciation rate being 25 per cent. There is no other asset in this asset block; (ii) The corporate tax rate is 35 per cent; (iii) Post-tax marginal cost of capital is 10 per cent; (iv) Salvage value, Rs 40,000 at the end of 5th year. Compute the NAL to the lessee if lease rentals are paid (a) at the end of the year (b) in advance.
Solution
(a) Computation of NAL (lease rentals are paid in arrear, that is, at the year-end)
Benefi ts from leasing: Cost of the machine Rs 3,43,300 PV of tax shield on lease rentals (working note 2) 1,59,222
Total 5,02,522 Cost of leasing: PV of lease rentals (1) 4,11,960 PV of tax shield foregone on depreciation (3) 67,259 PV of interest tax shield foregone on debt (4) 43,810 PV of salvage proceeds (Rs 40,0000 3 0.621) 24,840 PV of tax shield on short-term capital loss (5) 24,018
Total 5,71,887
NAL (69,365)
Recommendation Leasing is not financially viable.
Working Notes(1) PV of lease rentals: Lease rentals 3 PVIFA (14,5) = Rs 1,20,000 3 3.433 = Rs 4,11,960(2) PV of tax shield on lease rentals: Rs 1,20,000 3 0.35 3 3.791 = Rs 1,59,222(3) PV of shield foregone on depreciation
Year Depreciation* Tax shield PV factor (at 0.10) Total PV
1 Rs 85,825 Rs 30,039 0.909 Rs 27,305 2 64,369 22,529 0.826 18,609 3 48,277 16,897 0.751 12,690 4 36,207 12,672 0.683 8,655
67,259
*No depreciation is to be charged in 5th year as the block of assets ceases to exist.
(4) PV of interest tax shield
Year Interest Tax shield PV factor (at 0.10) Total PV
1 Rs 48,062 Rs 16,822 0.909 Rs 15,291 2 40,791 14,277 0.826 11,793 3 32,501 11,375 0.751 8,543 4 23,052 8,068 0.683 5,511 5 12,294 4,303 0.621 2,672
43,810
(5) PV of tax shield on short-term capital loss: (Cost of machine – Accumulated depreciation – Salvage value) 3 t = (Rs 3,43,000 – Rs 2,34,678 – Rs 40,000) = Rs 68,622 3 0.35 = Rs 24,018.

Additional Solved Problems 83
(b) Computation of NAL (lease rentals are paid in advance) Benefi ts from leasing: Cost of the machine Rs 3,43,300 PV of tax shield on lease rentals 1,59,222
Total 5,02,522 Cost of leasing: PV of lease rentals (1) 4,69,680 PV of tax shield foregone on depreciation 67,259 PV of interest tax shield foregone on debt 43,810 PV of salvage proceeds 24,840 PV of tax shield on short-term capital loss 24,018 Total 6,29,607
NAL (1,27,085)
Recommendation Leasing is not financially viable.
Working Notes
(1) PV of lease rentals
Year Lease payment PV factor (at 0.14) Total PV
0 Rs 1,20,000 1.000 Rs 1,20,000 1–4 1,20,000 2.914 3,49,680
4,69,680
P.25.20 For the facts in P.25.18, determine the break even lease rental (BELR) for the lessee in both the situations.
Solution
(a) Computation of BELR (lease rents are paid at the end of the year) Benefi ts from leasing: Cost of the machine Rs 3,43,300 PV of tax shield on lease rentals (2) 1.20155L Cost of leasing: PV of lease rentals (1) 3.433L PV of tax shield foregone on depreciation Rs 67,259 PV of interest tax shield foregone on debt 43,810 PV of salvage proceeds 24,840 PV of tax shield on short-term capital loss 24,018 1,59,927 BELR (L) = Rs 3,43,300 + 1.20155L = 3.433L + Rs 1,59,927 2.23145L = Rs 1,83,373 L = Rs 82,177
Working Notes (1) PV of lease rentals: L 3 PVIFA (14,5) = 3.433 3 L = 3.433L (2) PV of tax shield on lease rentals: 3.433L 3 tax rate = 3.433L 3 0.35 = 1.20155L
(b) BELR (lease rents paid in advance) Benefi ts from leasing Cost of the machine Rs 3,43,300 PV of tax shield on lease rentals (2) 1.3699L Cost of leasing PV of lease rentals (1) 3.914L Other costs (already computed) 1,59,927 BELR(L) = Rs 3,43,300 + 1.3699L = 3.914L + Rs 1,59,927 2.5441L = Rs 1,83,373 L = Rs 1,83,373/2.5441 = Rs 72,078

84 Financial Management
Working Notes (1) PV of lease rentals = 3.914 3 L = 3.914L, PVIFA = 2.914 (years, 1–4) + 1 (year 0) = 3.914 (2) PV of tax shield on lease rentals: 3.914L 3 0.35 = 1.3699L
P.25.21 Agrani Ltd. is in the business of manufacturing bearings. Some more product lines are being planned to be added to the existing system. The machinery required may be bought or may be taken on lease. The cost of machine is Rs 40,00,000 having a useful life of 5 years with the salvage value of Rs 8,00,000. The full purchase value of machine can be financed by 20 per cent loan repayable in five equal instalments falling due at the end of each year. Alternatively, the machine can be procured on a 5 years lease, year-end lease rentals being Rs 12,00,000 per annum. The Company follows the written down value method of depreciation at the rate of 25 per cent. Company’s tax rate is 35 per cent and cost of capital is 16 per cent. (i) Advise the company which option it should choose lease or borrow. (ii) Assess the proposal from the lessor’s point of view examining whether leasing the machine is financially
viable at 14 per cent cost of capital (Detailed working notes should be given).
Solution
(i) PV of cash outfl ows under leasing alternative
Year-end Lease rent after taxes PVIFA at 13 per cent Total PV [LR (1-t)] [Rs 12,00,000 (1 – 0.35)] [20% (1 – 0.35)]
1 - 5 Rs 7,80,000 3.517 Rs 27,43,260
(ii) Borrowing/Buying option Equivalent annual loan instalment = Rs 40,00,000/2.991 (PVIFA for 5 years at 20 per cent) = Rs
13,37,345.
PV of cash outfl ows under buying alternative
Year- Loan Tax advantage on Net cash outfl ows PVIF Total PV end instalment on Interest Depreciation at 13% (I 3 0.35) (D 3 0.35) (Col. 2 – Col. 3 + 4)
1 2 3 4 5 6 7
1 Rs 13,37,345 Rs 2,80,000 Rs 3,50,000 Rs 7,07,345 0.885 Rs 6,26,000 2 13,37,345 2,42,386 2,62,500 8,32,459 0.783 6,51,815 3 13,37,345 1,97,249 1,96,875 9,43,221 0.693 6,53,652 4 13,37,345 1,43,084 1,47,656 10,46,605 0.613 6,41,569 5 13,37,345 77,635 1,10,742 11,48,968 0.543 6,23,890
Total PV of cash outfl ows 31,96,926 Less: PV of salvage value (Rs 8,00,000 3 0.543) (4,34,400) Less: PV of tax savings on short-term capital loss (9,49,279 – 8,00,000) 3 0.35 = (52,226 3 0.543) (28,358)
NPV of cash outfl ows 27,34,168

Additional Solved Problems 85
Working Notes
Schedule of debt payment
Year- Loan Loan at the Payments Loan outstanding end instalment beginning of Interest Principal at the year the year (Col. 3 3 20%) repayment (Col. 3 – Col. 5)
1 2 3 4 5 6
1 Rs 13,37,345 Rs 40,00,000 Rs 8,00,000 Rs 5,37,345 Rs 34,62,655 2 13,37,345 34,62,655 6,92,531 6,44,814 28,17,841 3 13,37,345 28,17,841 5,63,568 7,73,777 20,44,064 4 13,37,345 20,44,064 4,08,813 9,28,532 11,15,532 5 13,37,345 11,15,532 2,21,813* 11,15,532 —
*Difference between loan instalment and loan outstanding.
Schedule of Depreciation
Year Depreciation Balance at the end of the year
1 Rs 40,00,000 3 0.25 = Rs 10,00,000 Rs 30,00,000
2 30,00,000 3 0.25 = 7,50,000 22,50,000
3 22,50,000 3 0.25 = 5,62,500 16,87,500
4 16,87,500 3 0.25 = 4,21,875 12,65,625
5 12,65,625 3 0.25 = 3,16,406 9,49,219
Recommendation The Company is advised to go for borrowing as the PV of cash outflows under borrowing option is lower than under leasing alternative.
Assumption The machine is sold after the expiry of its useful of 5 years; for this reason, the depre-ciation is charged in 5th year and there is no other asset in this block.
(ii) Determination of NPV of cash infl ows
Particulars Years
1 2 3 4 5
Lease rent Rs 12,00,000 Rs 12,00,000 Rs 12,00,000 Rs 12,00,000 Rs 12,00,000
Less: Depreciation 10,00,000 7,50,000 5,62,500 4,21,875 3,16,406
Earnings before taxes 2,00,000 4,50,000 6,37,500 7,78,125 8,83,594
Less: Taxes (0.35) 70,000 1,57,500 2,23,125 2,72,344 3,09,258
Earnings after taxes 1,30,000 2,92,500 4,14,375 5,05,781 5,74,336
Cash infl ows after taxes 11,30,000 10,42,500 9,76,875 9,27,656 8,90,742
(x) PV factor at (0.14) 0.877 0.769 0.675 0.592 0.519
Present value 9,91,010 8,01,682 6,59,391 5,49,172 4,62,295
Total PV of operating CFAT 34,63,550
Add: PV of salvage value of machine (8,00,000 3 0.519) 4,15,200
Add: PV of tax savings on short-term capital loss (52,226 3 0.519) 27,105
Gross PV 39,05,855
Less: Cost of machine (40,00,000)
NPV (94,145)

86 Financial Management
Recommendation It is not financially profitable to let out the machine on lease by the leasing Company, as NPV is negative.
Assumption The machine is to be sold after the expiry of 5 years. There is no other asset in the block of 25 per cent of the lessee.
P.25.22 From the given facts relating to the Hypothetical Leasing Ltd, calculate the annual rentals under the following rental structure for the 6-year period; (a) Equated, (b) Stepped (annual increase of 12 per cent), (c) Ballooned (annual rental of Rs 15 lakh for year 1 and 2) (d) Deferred (deferment period of 1 year).Investment cost Rs 96 lakhPrimary lease term 3 yearsResidual value NilPre-tax required rate of annual return 22 per centAssume that the lease can be renewed for an additional period of 3 years (secondary lease period). The lease rental for the secondary period will be 5 per cent of the rental charged during the primary period.
Solution (a) Equated annual lease rentals, Y Y 3 PVIFA (22, 3) + 0.05Y 3 PVIFA (22, 4–6) = Rs 96 lakh 2.042Y + 0.05625Y = Rs 96 lakh Y = Rs 96 lakh/2.09825 = Rs 45.75 lakh (primary lease period); Rs 2.29 lakh (secondary lease
period). (b) Stepped lease rentals (annual increase of 12 per cent) Y 3 PVIF (22, 1) + 1.12Y 3 PVIF (22, 2) + (1.12)2Y 3 PVIF (22, 3) + (1.12)3Y 3 PVIF (22, 4) +
(1.12)4Y 3 PVIF (22, 5) + (1.12)5Y 3 PVIF (22, 6) = Rs 96 lakh Or 0.820Y + 0.7526Y + 0.6912Y + 0.6336Y + 0.5822Y + 0.534Y = Rs 96 lakh Or Y = Rs 96 lakh/4.0136 = Rs 23.92 lakh (c) Ballooned lease rentals (Rs 15 lakh for years 1–2) Rs 15 lakh 3 PVIFA (22, 2) + Y 3 PVIF (22, 3) + 0.05Y 3 PVIFA (22, 4–6) = Rs 96 lakh Rs 22.38 lakh + 0.658Y + 0.05625Y = Rs 96 lakh Y = Rs 96 lakh – Rs 22.38 lakh/0.71425 = Rs 103.07 lakh (d) Deferred lease rentals (deferment of 1 year), Y Y 3 PVIF (22, 2) + Y 3 PVIF (22, 3) + 0.05Y 3 PVIF (22, 4–6) = Rs 96 lakh 0.672Y + 0.551Y + 0.05625Y = Rs 96 lakh Y = Rs 96 lakh/1.2795 = Rs 75.04 lakh
P.25.23 Hypothetical Ltd is expanding its facilities. In the coming year, the company will either purchase or lease equipment which it plans to use for 4 years and then replace it with a new one. Its current tax bracket is 50 per cent. The other data are as follows:Purchase: (i) The purchase price of the equipment is Rs 40,00,000, (ii) The expected salvage value after 4
years is Rs 10,00,000, (iii) The equipment is subject to the straight line method of depreciation, (iv) Funds to finance the equipment can be obtained at 16 per cent, (v) The loan is to be repaid in four equal annual instalments due at the end of each year, (vi) The equipment will increase the annual revenues by Rs 30,00,000, and increase annual cash operating costs by Rs 20,00,000.
Leasing: (i) The annual lease is Rs 10,00,000, (ii) The lease rent is payable at the end of each year for 4 years, (iii) The equipment will increase annual revenues by Rs 30,00,000 and increase annual non-depreciation operating costs by Rs 19,00,000, as the lessor will pay Rs 1,00,000 for the mainte-nance costs associated with the equipment.
Determine whether the company should purchase or lease the equipment.

Additional Solved Problems 87
Solution
PV of cash outfl ows under leasing alternative
Year- Effective lease payment PV factor Total end Gross Savings Net Tax Cash (0.08) PV in main- (Col 2 – shield outfl ows tenance costs Col 3) (Col 4 3 0.50) after taxes
1 2 3 4 5 6 7 8
1–4 Rs 10,00,000 Rs 1,00,000 Rs 9,00,000 Rs 4,50,000 Rs 4,50,000 3.312 Rs 14,90,400
Determination of interest and principal components of loan instalment
Year- Loan Loan at Payment of Principal end instalment the beginning out-standing Interest Principal at the end (Col 3 3 0.16) (Col 2 – Col 4) of the year
1 2 3 4 5 6
1 Rs 14,29,593* Rs 40,00,000 Rs 6,40,000 Rs 7,89,593 Rs 32,10,407 2 14,29,593 32,10,407 5,13,665 9,15,928 22,94,497 3 14,29,593 22,94,479 3,67,117 10,62,476 12,32,003 4 14,29,593 12,32,003 1,97,590 12,32,003 — *Rs 40,00,000 4 2.798 that is, PV annuity factor of 4 years at 16 per cent.
PV of cash outfl ows under buying alternative
Year Loan Interest Depreciation Cash outfl ows PV factor Total PV instalment (I 3 t) (D 3 t) after taxes (0.08) [Col 2 – (Col 3 + Col 4)]
1 2 3 4 5 6 7
1 Rs 14,29,593 Rs 3,20,000 Rs 3,75,000 Rs 7,34,593 0.926 Rs 6,80,233 2 14,29,593 2,56,832 3,75,000 7,97,761 0.857 6,83,681 3 14,29,593 1,83,558 3,75,000 8,71,035 0.794 6,91,602 4 14,29,593 98,795 3,75,000 9,55,798 0.735 7,02,512 4 Salvage value — — (10,00,000) 0.735 (7,35,000)
20,23,028
Recommendation The lease alternative is better, as it is a cheaper source of finance than debt in terms of the NPV of the cash outflows.

CHAPTER 27
P.27.15 Prashant is bullish about the index. Spot Nifty stands at Rs 1,100. He decides to buy one three-month Nifty call option contract (having a market lot of 200) with a strike price of Rs 1,160 at a premium of Rs 15 per call. Three months later, the index closes at Rs 1,195. Determine the amount of profit (or loss) to Prashant.
Solution Prashant gains as on the date of maturity the Nifty Index is higher than the exercise price. His gain gets reduced by the option premium paid. Accordingly, his gain is (Rs 1,195 – Rs 1,160 – Rs 15) 3 200 lot size = Rs 20 3 200 = Rs 4,000.
P.27.16 Akram is bearish about the index. Spot Nifty stands at Rs 1,240. He decides to buy one three-month Nifty put option contract with a strike price of Rs 1,225, at Rs 34.50 a put. Three months later the index closes at Rs 1,280. Compute his payoff on the position.
Solution The put option expires out-of-the money as the exercise price at which Akram can sell is lower (Rs 1,225) than the market price (Rs 1,280) on the date of maturity. So, he loses the put premium he paid, that is (Rs 34.50 3 200) = Rs 6,900 at the time of contract.
P.27.17 Mohan is bearish about the index. Spot Nifty stands at Rs 1,150. He decides to sell one three-month Nifty call option contract with a strike of Rs 1,175 for a premium of Rs 28.60. Three months later, the index closes at Rs 1,195. What is his net payoff on the position?
Solution Since the index closes above the strike price of Rs 1,275, the call option buyer exercises the option. As a result, he loses. (Rs 1195 – Rs 1,175 = Rs 20). But he has received an up-front premium Rs 28.60. Therefore, his net profits are Rs 8.6 3 200 = Rs 1,720.

CHAPTER 33
P.33.17 The following information is provided related to the acquiring firm A Ltd. and the target firm T Ltd:
Particulars Firm A Firm T
EAT (Rs lakh) 1,000 200 Number of shares outstanding (in lakh) 100 50 EPS (Rs) 10 4 P/E ratio (times) 10 5 MPS (Rs) 100 20
(a) What is the swap ratio based on current market prices? (b) What is the EPS of A Ltd after acquisition? (c) What is the expected market price per share (MPS) of A Ltd after acquisition, assuming P/E ratio of Firm
A remains unchanged. (d) Determine the market value of the merged firm. (e) Calculate gain/loss for shareholders of the two independent companies, after acquisition. (f) Determine the upper and lower limits for swap ratio beyond which the two firms would not go for the
acquisition/merger.
Solution (a) Exchange ratio based on market prices = Rs 20/Rs 100 = 0.2:1. For every one share of Firm T, 0.2 share
will be issued in Firm A. Based on this ratio, the number of new shares issued by Firm T will be = 50 lakh 3 0.2 = 10 lakh.
(b) EPS after the merger (EPSc) =Rs 1,000 lakh + Rs 200 lakh
100 lakh shares + 10 lakh shares = Rs 10.91
(c) Expected MPS after merger = Rs 10.91 3 10 = Rs 109.10 (d) Market value of merged firm = Rs 109.10 MPS 3 110 lakh shares = Rs 120.01 crore.
(e) Gains from the merger (Rs crore)
Post-merger market value of the fi rm Rs 120.01 Less: Pre-merger market value: Firm A (100 lakh shares 3 Rs 100 MPS) Rs 100 Firm T (50 lakh shares 3 Rs 20 MPS) 10 110.00Gains from merger 10.01
Apportionment of gains from merger among shareholders (Rs crore)
Firm A: Post-merger market value (100 lakh shares 3 Rs 109.10 MPS) 109.10 Less: Pre-merger market value 100.00 Gains to the shareholders of Firm A 9.10
Firm B: Post-merger market value (10 lakh shares 3 Rs 109.10) 10.91 Less: Pre-merger market value 10.00 Gain to the shareholders of Firm T 0.91
90 Financial Management
(f) Determination of upper limit and lower limit of share exchange ratio (Rs crore)
(i) Lower limit (based on total gains accruing to shareholders of Firm A) Total market value of the merger fi rm Rs 120.01 Less: Pre-merger (or minimum post-merger) value acceptable to shareholders of Firm T 10.00 Maximum acceptable post-merger market value of Firm A (in lakh) 110.01 Divided by the number of equity shares outstanding in Firm A 100 Post-merger MPS (Rs 110.01 crore/100 lakh) 110.01 Number of equity shares required to be issued in Firm A to have the desired MPS of Rs 110.01 and to have a post-merger value of Rs 10 crore of Firm T, that is, (Rs 10 crore/Rs 110.01) = 9,09,008.27 9,09,009 shares Existing number of equity shares of Firm T 50 Share exchange ratio (9,09,009/50 lakh) = 0.1818: 1 or 1: 5.5 For every 5.5 shares of Firm T, 1 share in Firm A will be issued. This is the lowest exchange ratio acceptable
to shareholders of Firm T. Any ratio lower than this will decrease their existing wealth of Rs 10 crore. (ii) Upper limit (based on total gains accruing to shareholders of Firm T) Total market value of the merged fi rm Rs 120.01 Less: Pre-merger (or minimum post-merger) value acceptable to the shareholders of Firm A 100.00 Maximum acceptable post-merger market value of Firm T 20.01 Since post-merger market value of Firm A remains unchanged at Rs 100 crore
(and so the number of its shares (100 lakh) and MPS of Rs 100), number ofequity shares required to be issued in Firm A to have a MPS of Rs 100 and tohave a post-merger value of Rs 20.01 crore of Firm T (Rs 20.01 crore/
Rs 100 MPS) 20,01,000 shares Existing number of equity shares outstanding in Firm T 50 lakh Share exchange ratio (20,01,000/50 lakh) = 0.4002:1 or 1: 2.5 For every 2.5 shares of Firm T, 1 share in Firm A will be issued. This is the upper most exchange ratio accept-
able to shareholders of Firm A as any ratio higher than this will dilute their existing wealth of Rs 100 crore.
P.33.18 Company X is contemplating the purchase of Company Y. Company X has 3,00,000 shares having a market price of Rs 30 per share while Company Y has 2,00,000 shares selling at Rs 20 per share. The EPS are Rs 4.00 and Rs 2.25 for Company X and Y, respectively. Managements of both companies are discussing two alternative proposals for exchange of shares as indicated below: (i) in proportion to the relative earnings per share of two companies. (ii) 0.5 share of Company X for one share of Company Y (.5 :1). You are required: (i) to calculate the Earnings Per Share (EPS), after merger, under two alternatives and(ii) to show the impact on the EPS for the shareholders of two companies under both the alternatives.
Solution
(i) (a) Determination of post-merger earnings
Company Original number of shares EPS Total earnings after taxes (2 3 3) 1 2 3 4
X 3,00,000 Rs 4.00 Rs 12,00,000 Y 2,00,000 2.25 4,50,000Total post-merger earnings 16,50,000

Additional Solved Problems 91
(b) Post-merger EPS when share exchange ratio is in relative proportion topre-merger EPS, 0.5625 that is Rs 2.25/4.00
Total post-merger earnings (with no synergy assumed) Rs 16,50,000Divided by total number of shares after the merger (3,00,000 + 1,12,500 i.e., 2,00,000 3 0.5625) 4,12,500Combined EPS after merger (Rs 16,50,000/4,12,500 shares) 4
(c) Post-merger EPS when share exchange ratio is 0.5
Total post-merger earnings Rs 16,50,000Divided by total number of shares after the merger (3,00,000 + 1,00,000 i.e., 2,00,000 3 0.5) 4,00,000Combined EPS after merger (Rs 16,50,000/4,00,000 shares) 4.125
(ii) (a) Impact on EPS of the shareholders of Company X and Company Y when share exchange ratio is 0.5625
Shareholders of company X: EPS before the merger Rs 4.00 EPS after the merger (Rs 16,50,000/4,12,500 shares) 4.00Shareholders of Company Y: EPS before the merger 2.25 Equivalent EPS after the merger (EPS after the merger 3 shares exchange ratio, i.e., Rs 4 3 0.5625) 2.25There is no change in EPS for shareholders of Company X or Company Y
(b) Impact of EPS on the shareholders of Companies X and Y when share exchange ratio is 0.5
Shareholders of Company X: EPS after the merger (Rs 16,50,000/4,00,000 shares) Rs 4.125 EPS before the merger 4.000Accretion in EPS 0.125Shareholders of Company Y: EPS before the merger Rs 2.25 Equivalent EPS after the merger (Rs 4.125 3 0.5) 2.0625Dilution in EPS (0.1875)While the shareholders of Company X gain, the shareholders of Company Y lose.
P.33.19 Nelson Electronic Company acquires Borton Electronic Company on ‘share for share exchange’ basis. The position before takeover was as under:
Particulars Nelson Electronic company Borton Electronic company
Number of shares 20,000 10,000Total earnings (Rs) 2,00,000 1,00,000Market price of share, MPS (Rs) 20 15
The shareholders of Borton Electronic Company are offered 7,500 shares of Nelson Electronic Company for 10,000 shares (i.e. each shareholder of Borton Electronic Company gets 0.75 shares of Nelson Electronic Company for 1 share of Borton Electronic Company). You are required to calculate the EPS of the amalgamated company vis-a-vis before takeover position of the two companies and the gain/loss of the shareholders of the two independent companies consequent to amalgamation.

92 Financial Management
Solution
(a) EPS of companies before and after takeover
Particulars Before takeover After takeover
Nelson Borton Combined
Total earnings (Rs) 2,00,000 1,00,000 3,00,000Divided by Number of shares (N) 20,000 10,000 27,500EPS (Rs) 10 10 10.91
(b) Gain/loss to shareholders (i) In terms of EPS: Nelson Electronic (Rs 10.91 – Rs 10) = Re 0.91 (Gain) Borton Electronic: EPS before merger Rs 10.00 Less: Equivalent EPS after merger (Rs 10.91 3 0.75, share exchange ratio) 8.18 Loss (1.82) (ii) In terms of valuation: Valuation after merger (27,500 shares 3 Rs 240/11) (assuming Nelson maintains its existing P/E ratio of 2 i.e. Rs 20 4 Rs 10) Rs 6,00,000 Less: Pre-merger market value: Nelson (20,000 3 Rs 20) 4,00,000 Borton (10,000 3 Rs 15) 1,50,000 5,50,000 Total gain from the merger 50,000 Apportionment of gains: Nelson Borton Post-merger value 4,36,363.63@ 1,63,636.37 @@
Less: Pre-merger value 4,00,000.00 1,50,000.00 Gain 36,363.63 13,636.37
@20,000 shares 3 Rs 240/11; @@ 7,500 shares 3 Rs 240/11 (market price of share)
P.33.20 From the following data, calculate the cost of merger.
Particulars Firm A Firm B
Market price per share Rs 60 Rs 15Number of shares 1,00,000 50,000Market value of the fi rm 6,00,000 7,50,000
Firm A intends to pay Rs 10,00,000 cash for acquisition of Firm B.
Solution Cost = Cash – PVB = Rs 10,00,000 – Rs 7,50,000 = Rs 2,50,000
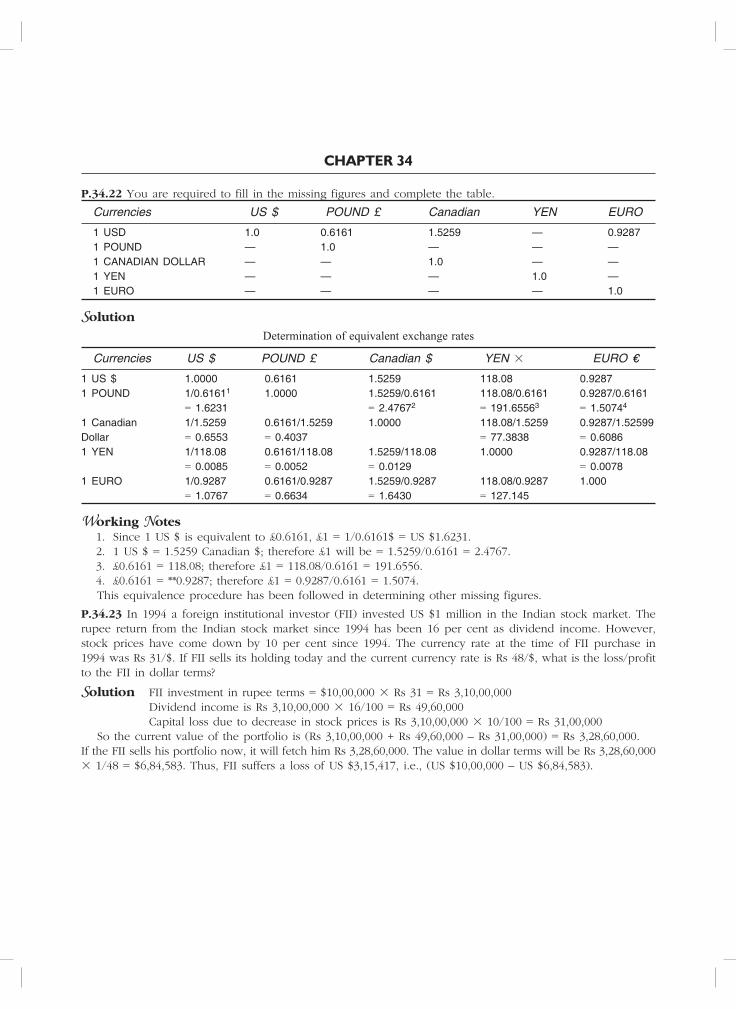
CHAPTER 34
P.34.22 You are required to fill in the missing figures and complete the table.
Currencies US $ POUND £ Canadian YEN EURO
1 USD 1.0 0.6161 1.5259 — 0.9287 1 POUND — 1.0 — — — 1 CANADIAN DOLLAR — — 1.0 — — 1 YEN — — — 1.0 — 1 EURO — — — — 1.0
Solution
Determination of equivalent exchange rates
Currencies US $ POUND £ Canadian $ YEN 3 EURO €
1 US $ 1.0000 0.6161 1.5259 118.08 0.92871 POUND 1/0.61611 1.0000 1.5259/0.6161 118.08/0.6161 0.9287/0.6161 = 1.6231 = 2.47672 = 191.65563 = 1.50744
1 Canadian 1/1.5259 0.6161/1.5259 1.0000 118.08/1.5259 0.9287/1.52599Dollar = 0.6553 = 0.4037 = 77.3838 = 0.60861 YEN 1/118.08 0.6161/118.08 1.5259/118.08 1.0000 0.9287/118.08 = 0.0085 = 0.0052 = 0.0129 = 0.00781 EURO 1/0.9287 0.6161/0.9287 1.5259/0.9287 118.08/0.9287 1.000 = 1.0767 = 0.6634 = 1.6430 = 127.145
Working Notes 1. Since 1 US $ is equivalent to £0.6161, £1 = 1/0.6161$ = US $1.6231. 2. 1 US $ = 1.5259 Canadian $; therefore £1 will be = 1.5259/0.6161 = 2.4767. 3. £0.6161 = 118.08; therefore £1 = 118.08/0.6161 = 191.6556. 4. £0.6161 = **0.9287; therefore £1 = 0.9287/0.6161 = 1.5074. This equivalence procedure has been followed in determining other missing figures.
P.34.23 In 1994 a foreign institutional investor (FII) invested US $1 million in the Indian stock market. The rupee return from the Indian stock market since 1994 has been 16 per cent as dividend income. However, stock prices have come down by 10 per cent since 1994. The currency rate at the time of FII purchase in 1994 was Rs 31/$. If FII sells its holding today and the current currency rate is Rs 48/$, what is the loss/profit to the FII in dollar terms?
Solution FII investment in rupee terms = $10,00,000 3 Rs 31 = Rs 3,10,00,000 Dividend income is Rs 3,10,00,000 3 16/100 = Rs 49,60,000 Capital loss due to decrease in stock prices is Rs 3,10,00,000 3 10/100 = Rs 31,00,000 So the current value of the portfolio is (Rs 3,10,00,000 + Rs 49,60,000 – Rs 31,00,000) = Rs 3,28,60,000.If the FII sells his portfolio now, it will fetch him Rs 3,28,60,000. The value in dollar terms will be Rs 3,28,60,000 3 1/48 = $6,84,583. Thus, FII suffers a loss of US $3,15,417, i.e., (US $10,00,000 – US $6,84,583).

CHAPTER 35
P.35.20 Prepare a table of the profit profile of the buyer of a call option with the following infor-mation:
Current spot rate Rs 51.49/HExercise price 52.10/HCall premium 2 per cent
Solution The profit resulting from a call option is given by the following equation Profit = ST – X – C for ST > X = –C for ST < X
Where ST is current spot rate (Rs 51.49/H), X is exercise price (Rs 52.10/H) and C is call premium (2 per cent). Let us assume that the amount is H 1. So, the amount of the premium to be paid up-front is (Rs 1 3 0.02 3 Rs 51.49) = Rs 1.0298. The call option will be exercised if the spot rate (ST) on the date of exercise is more than Rs 52.10. Otherwise, it will be allowed to lapse. The reason is that at an exchange rate lower than Rs 52.10, it will be profitable to buy from the spot market itself. The table below contains the profit data corresponding to various ST values.
ST (Rs/H) Option value Premium already paid Net profi t
1 49.0 0.00 Rs 1.0298 (–) Rs 1.0298 2 50.0 0.00 1.0298 –1.0298 3 51.0 0.00 1.0298 –1.0298 4 51.49 0.00 1.0298 –1.0298 5 52.10 0.00 1.0298 –1.0298 6 53.0 0.90 1.0298 –0.1298 7 54.0 1.90 1.0298 +0.8702 8 55.0 2.90 1.0298 +1.8702 9 56.0 3.90 1.0298 +2.8702
P.35.21 For a value date of 1 July 2000, a company entered into a five year interest rate swap with its bank under which it has contracted to pay 9 per cent and receive a six month MIBOR, settled semi-annually, on a principal amount of Rs 1,00,00,000. On 1 July of the current year, with the swap payment of exactly three years is remaining, the bank offers to unwind the swap at the rate of 6.5 per cent. If the company agrees to the bank’s offer, the transaction will be cancelled today by means of a settlement. (a) Set out the underlying fixed-rate cash flow that would take place if instead of canceling the existing deal
a new deal were made and the two deals were to exist till maturity. (b) What sum of money would be paid today to cancel the transaction? And in case of cancellation who
will pay to whom? (c) What assumptions are implicit in the above calculation?
Solution Under the old swap agreement the company is paying 4.5 per cent on Rs 1,00,00,000, every six months. But under the new swap agreement the swap rate is 3.25 per cent on Rs 1,00,00,000 every six months. (a) So, the fixed-rate cash flow that would take place if both the deals co-exist is Rs 1,00,00,000 3 (0.045 – 0.0325) = Rs 1,25,000 per six months. (b) The sum to be paid to cancel the transaction would be the present value of equivalent future cash flows
of Rs 1,25,000 discounted at 3.25 per cent for every six month period = 1,25,000 [1/1.0325 + 1/(1.0325)2 + 1/(1.0325)3 + 1/(1.0325)4 + 1 (1.0325)5 + 1/(1.0325)6] = Rs 1,25,000 3 5.3726 = Rs 6,71,575.
As the company will be enjoying these benefits due to the fall in interest rate, under the cancellation, the company will be paying this amount to the bank.

Additional Solved Problems 95
(c) All the future cash flows have been discounted at same rate (3.25 per cent per six months). So it implicitly assumes that the yield curve is flat. If the yield curve were not flat then different discount rates should be applied to each cash flow.
P.35.22 In the year 1990 an Indian importer was required to pay Rs 21 to receive 1 US dollar. In the year 1997 it was Rs 31 and in the year 2002 the importer is required to pay Rs 48 to buy one dollar. (i) How much has the rupee appreciated or depreciated during 1990 – 1997 and between 1997 – 2002
vis-à-vis the US $? (ii) What has been the corresponding appreciation/depreciation in the dollar during these periods, in relation
to Indian rupee?
Solution Appreciation/depreciation in dollar terms:
Period 1990–97, appreciation = Rs 31 Rs 21
Rs 21 3 100 = Rs 47.62%
Period 1997 –2002, appreciation = Rs 48 Rs 31
Rs 31 3 100 = Rs 54.84%
Appreciation/depreciation in rupee terms:
Period 1990–97, depreciation = 1 1
21 31
1/ 21 3 100 = 32.25%
Period 1997–2002, depreciation = 1 1
31 48
1/ 31 3 100 = 35.42%
P. 35.23 Romesh Sharma is a currency trader for a large currency trading firm of US, based in New Jersey. He expects the US dollar to depreciate against the euro. The current spot rate of the euro is US $1.0768/H and the premium on call and put options are as follows:
Strike: US $1.1000/H 30 days 60 days
Call option on the euro 0.085 0.100Put option on the euro 0.110 0.135
(a) What should Romesh Sharma do to profit from his anticipation? (b) What will the profit or loss be, if the rate on settlement date, after 30 days, is US $1.220/Î, and (i)
Romesh Sharma has bought a 30 day call, (ii) Romesh Sharma has sold a 30 day put.
Solution (a) As Romesh Sharma anticipates the US dollar to depreciate against the euro (appreciation of euro against
the US dollar), he can be benefited either by buying a call option on euros or selling a put option on euros.
(b) (i) Profit from purchase of call Profit from purchase of call for a strike price of US $1.1000/H, premium US $0.085/H and settlement
rate (expiration rate) of US $1.220/H = US $(1.220 – 1.1000)/H – US $0.085/H = US $0.035/H As the settlement rate is higher than the strike rate, Romesh Sharma will exercise the option. (ii) Profit from sell of put As the settlement rate (US $1.220/H) is higher than the strike rate, this put option will not be exercised.
So, for Romesh Sharma the premium that he received on selling (writing) the put option is his profit (US $0.110/H).
Selling an option entails high risk, but is used as a strategy by the currency trader when he is confident of his anticipation.