Embed Size (px)
DESCRIPTION
This Six Sigma Project submitted by Advance Innovation Group student intended for the improvement in first call resolution. The objective to increase overall FCR% without compromising on quality. Process is performing at 77% against the target of 95% FCR. Process is not able to meet client specified SLA which could be a contributor of huge business loss. First call resolution is the primary aspect that customer seeks. Data of project Y is Non-normal and non-random. Identified contributing factors which might impact Y. Additionally, it is advisable that you also visit and subscribe Advance Innovation Group Blog (http://advanceinnovationgroup.com/blog) for more Lean Six Sigma Projects, Case Studies on Lean Six Sigma, Lean Six Sigma Videos, Lean Six Sigma Discussions, Lean Six Sigma Jobs etc.
Citation preview
04/14/231 04/14/231
Project Name : improving first call resolutionProject Owner : mithlesh nautiyal
DMAIC
04/14/232
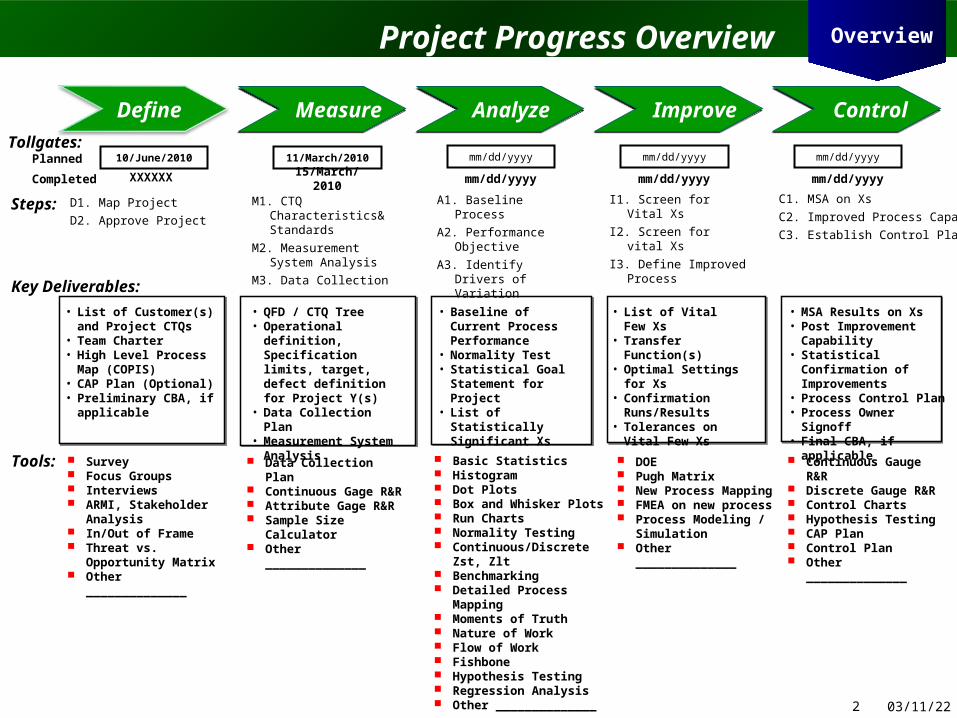
Project Progress Overview
D1. Map Project
D2. Approve Project
M1. CTQ Characteristics& Standards
M2. Measurement System Analysis
M3. Data Collection
A1. Baseline Process
A2. Performance Objective
A3. Identify Drivers of Variation
I1. Screen for Vital Xs
I2. Screen for vital Xs
I3. Define Improved Process
C1. MSA on Xs
C2. Improved Process Capability
C3. Establish Control Plan
Key Deliverables: • List of Customer(s) and
Project CTQs• Team Charter• High Level Process Map
(COPIS)• CAP Plan (Optional)• Preliminary CBA, if
applicable
• QFD / CTQ Tree• Operational definition,
Specification limits, target, defect definition for Project Y(s)
• Data Collection Plan• Measurement System
Analysis
• Baseline of Current
Process Performance• Normality Test • Statistical Goal
Statement for Project• List of Statistically
Significant Xs
• List of Vital Few Xs• Transfer Function(s)• Optimal Settings for
Xs• Confirmation
Runs/Results• Tolerances on Vital
Few Xs
• MSA Results on Xs• Post Improvement
Capability• Statistical Confirmation
of Improvements • Process Control Plan• Process Owner Signoff• Final CBA, if applicable
Tollgates:Planned
Completed
10/June/2010 11/March/2010 mm/dd/yyyy mm/dd/yyyy mm/dd/yyyy
XXXXXX 15/March/2010 mm/dd/yyyy mm/dd/yyyy mm/dd/yyyy
Steps:
Tools: Survey Focus Groups Interviews ARMI, Stakeholder
Analysis In/Out of Frame Threat vs. Opportunity
Matrix Other ______________
Data Collection Plan Continuous Gage R&R Attribute Gage R&R Sample Size Calculator Other ______________
Basic Statistics Histogram Dot Plots Box and Whisker Plots Run Charts Normality Testing Continuous/Discrete Zst, Zlt Benchmarking Detailed Process Mapping Moments of Truth Nature of Work Flow of Work Fishbone Hypothesis Testing Regression Analysis Other ______________
DOE Pugh Matrix New Process Mapping FMEA on new process Process Modeling /
Simulation Other ______________
Continuous Gauge R&R Discrete Gauge R&R Control Charts Hypothesis Testing CAP Plan Control Plan Other ______________
Define Measure Measure Analyze Analyze Improve Improve Control Control
Overview
04/14/233
Define
1. Blank2. Project Charter3. Terms and Acronyms Used4. ARMI & Communication Plan5. COPIS6. Process Map
04/14/234
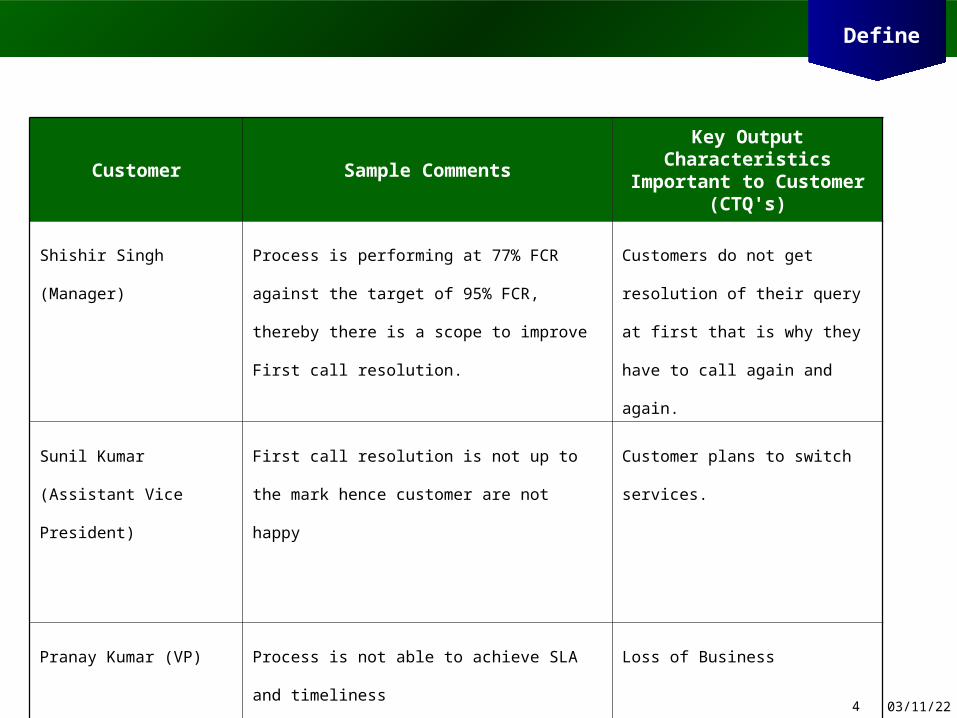
Customer Sample CommentsKey Output Characteristics
Important to Customer (CTQ's)
Shishir Singh (Manager) Process is performing at 77% FCR against the
target of 95% FCR, thereby there is a scope to
improve First call resolution.
Customers do not get resolution of
their query at first that is why they
have to call again and again.
Sunil Kumar (Assistant
Vice President)
First call resolution is not up to the mark hence
customer are not happy
Customer plans to switch services.
Pranay Kumar (VP) Process is not able to achieve SLA and
timeliness
Loss of Business
Define
04/14/235
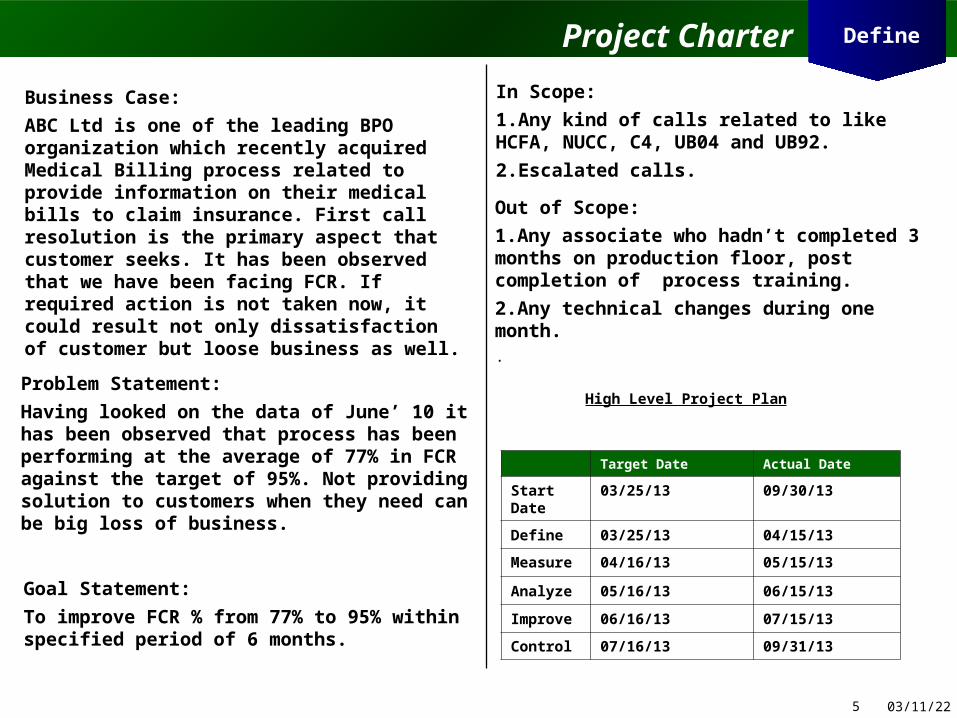
In Scope:
1.Any kind of calls related to like HCFA, NUCC, C4, UB04 and UB92.
2.Escalated calls.
Out of Scope:
1.Any associate who hadn’t completed 3 months on production floor, post completion of process training.
2.Any technical changes during one month..
Business Case:
ABC Ltd is one of the leading BPO organization which recently acquired Medical Billing process related to provide information on their medical bills to claim insurance. First call resolution is the primary aspect that customer seeks. It has been observed that we have been facing FCR. If required action is not taken now, it could result not only dissatisfaction of customer but loose business as well.
Problem Statement:
Having looked on the data of June’ 10 it has been observed that process has been performing at the average of 77% in FCR against the target of 95%. Not providing solution to customers when they need can be big loss of business.
Goal Statement:
To improve FCR % from 77% to 95% within specified period of 6 months.
Project Charter
Target Date Actual Date
Start Date 03/25/13 09/30/13
Define 03/25/13 04/15/13
Measure 04/16/13 05/15/13
Analyze 05/16/13 06/15/13
Improve 06/16/13 07/15/13
Control 07/16/13 09/31/13
High Level Project Plan
Define
04/14/236
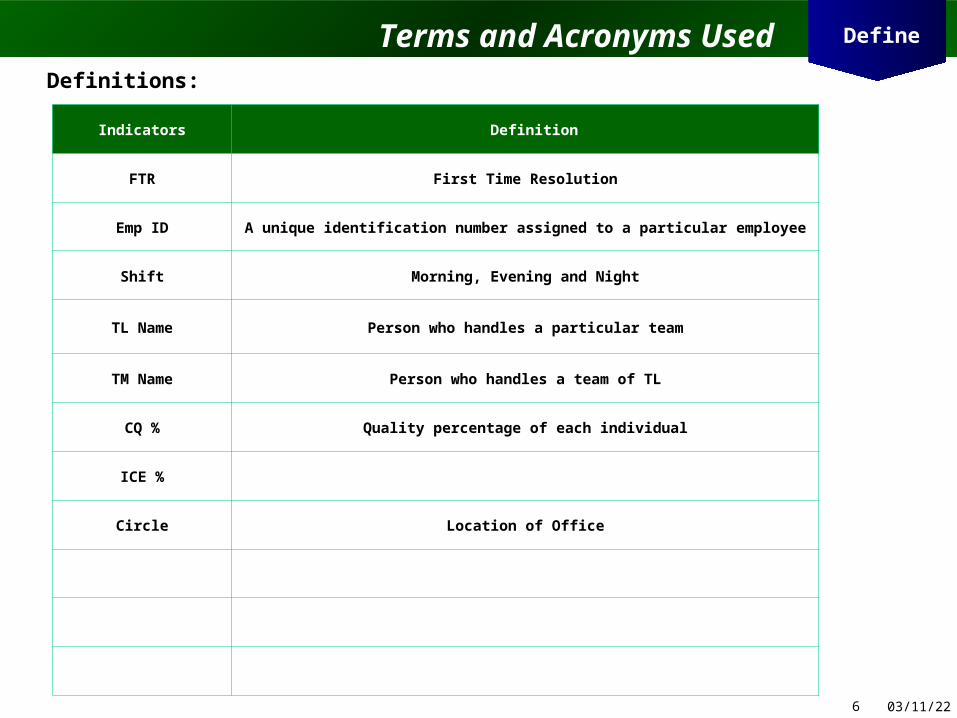
Definitions:
Indicators Definition
FTR First Time Resolution
Emp ID A unique identification number assigned to a particular employee
Shift Morning, Evening and Night
TL Name Person who handles a particular team
TM Name Person who handles a team of TL
CQ % Quality percentage of each individual
ICE %
Circle Location of Office
Terms and Acronyms Used Define
04/14/237
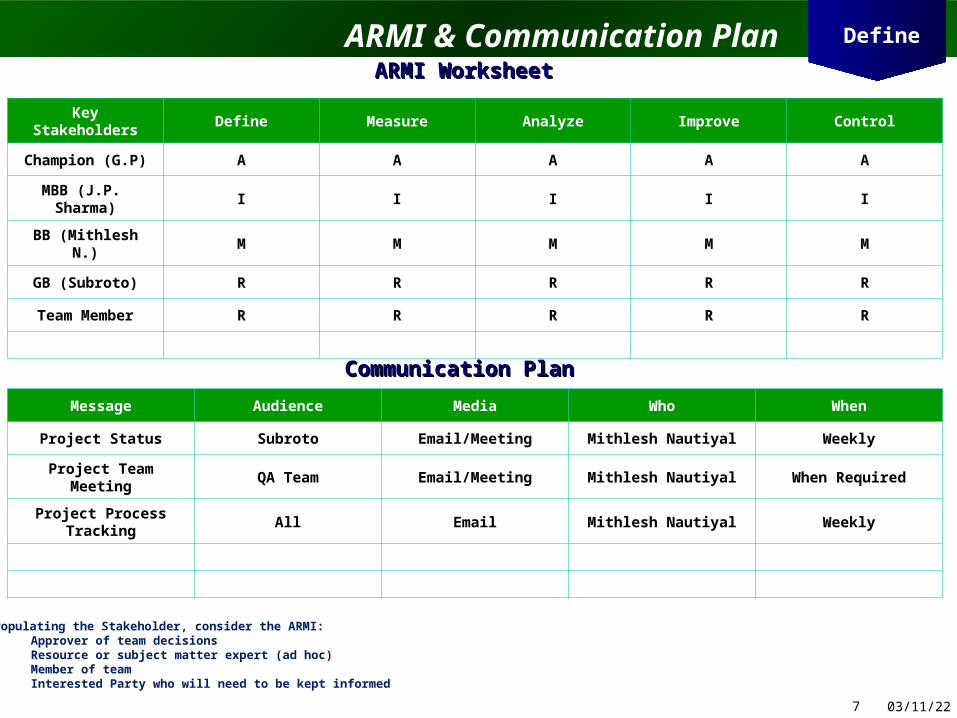
Key Stakeholders Define Measure Analyze Improve Control
Champion (G.P) A A A A A
MBB (J.P. Sharma) I I I I I
BB (Mithlesh N.) M M M M M
GB (Subroto) R R R R R
Team Member R R R R R
Message Audience Media Who When
Project Status Subroto Email/Meeting Mithlesh Nautiyal Weekly
Project Team Meeting QA Team Email/Meeting Mithlesh Nautiyal When Required
Project Process Tracking
All Email Mithlesh Nautiyal Weekly
When Populating the Stakeholder, consider the ARMI:• A= Approver of team decisions• R= Resource or subject matter expert (ad hoc)• M= Member of team• I= Interested Party who will need to be kept informed
Communication PlanCommunication Plan
Define
ARMI WorksheetARMI WorksheetARMI & Communication Plan
04/14/238
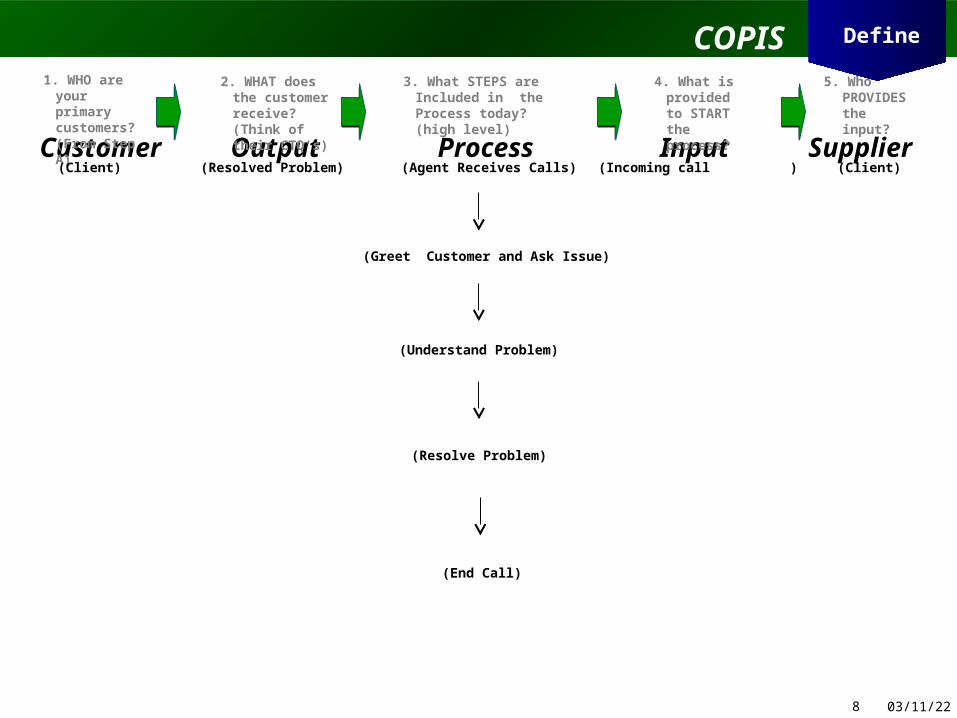
Customer Output Process
Input Supplier
1. WHO are your primary customers?(From Step A)
2. WHAT does the customer receive? (Think of their CTQ’s)
3. What STEPS are Included in the Process today? (high level)
4. What is provided to START the process?
5. Who PROVIDES the input?
(Client) (Resolved Problem) (Agent Receives Calls) (Incoming call ) (Client)
COPIS Define
(Greet Customer and Ask Issue)
(Understand Problem)
(Resolve Problem)
(End Call)
04/14/239
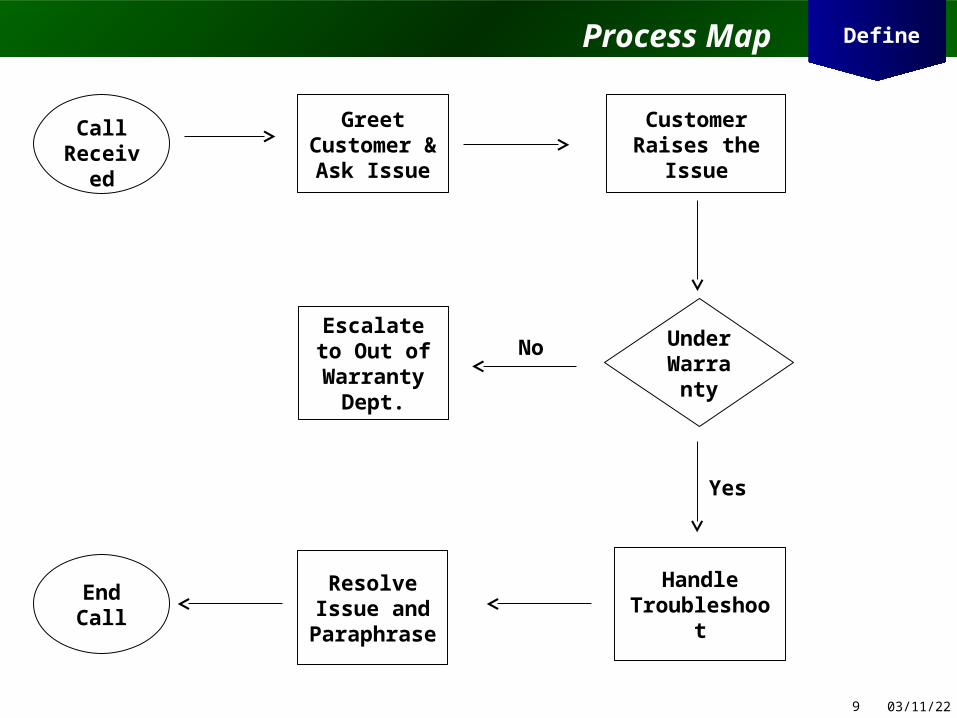
Process Map Define
Call Received
Greet Customer & Ask Issue
Customer Raises the Issue
Under Warrant
y
Escalate to Out of Warranty
Dept.
No
Yes
Handle Troubleshoot
Resolve Issue and Paraphrase
End Call
04/14/2310
Measure
1. Data Collection Plan2. Measurement System Analysis3. Process Capability
04/14/2311
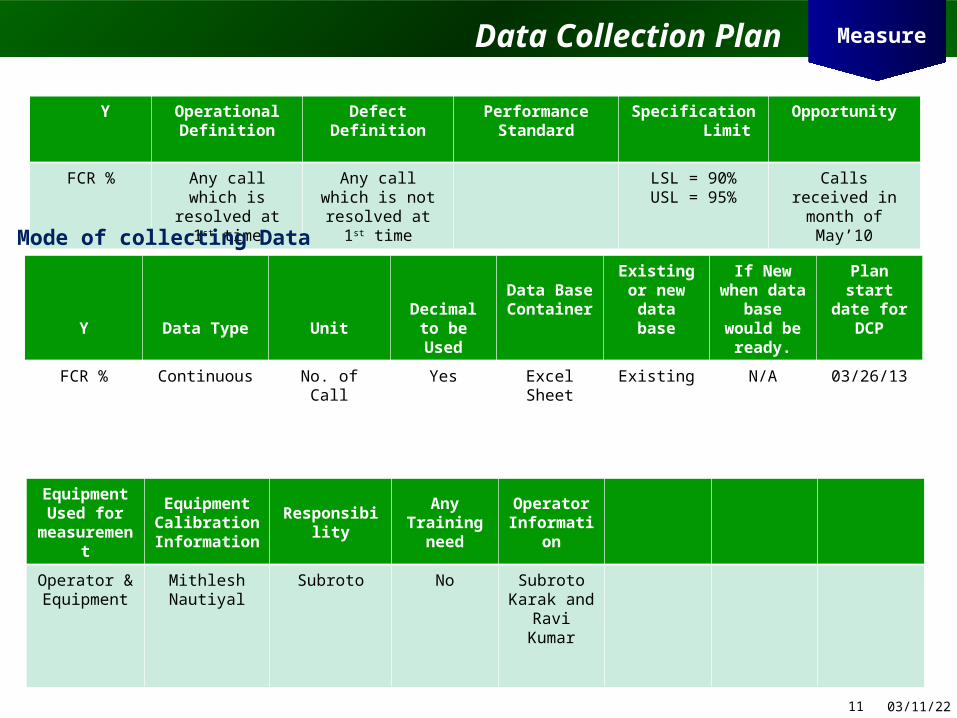
Y OperationalDefinition
DefectDefinition
PerformanceStandard
Specification Limit
Opportunity
FCR % Any call which is resolved at 1st time
Any call which is not resolved at 1st
time
LSL = 90%USL = 95%
Calls received in month of May’10
Mode of collecting Data
Y Data Type UnitDecimal to
be Used
Data Base Container
Existing or new data
base
If New when data base would be
ready.
Plan start date for
DCP
FCR % Continuous No. of Call Yes Excel Sheet Existing N/A 03/26/13
Data Collection Plan
Equipment Used for
measurement
Equipment Calibration Information
ResponsibilityAny
Training need
Operator Information
Operator & Equipment
Mithlesh Nautiyal
Subroto No Subroto Karak and
Ravi Kumar
Measure
04/14/2312
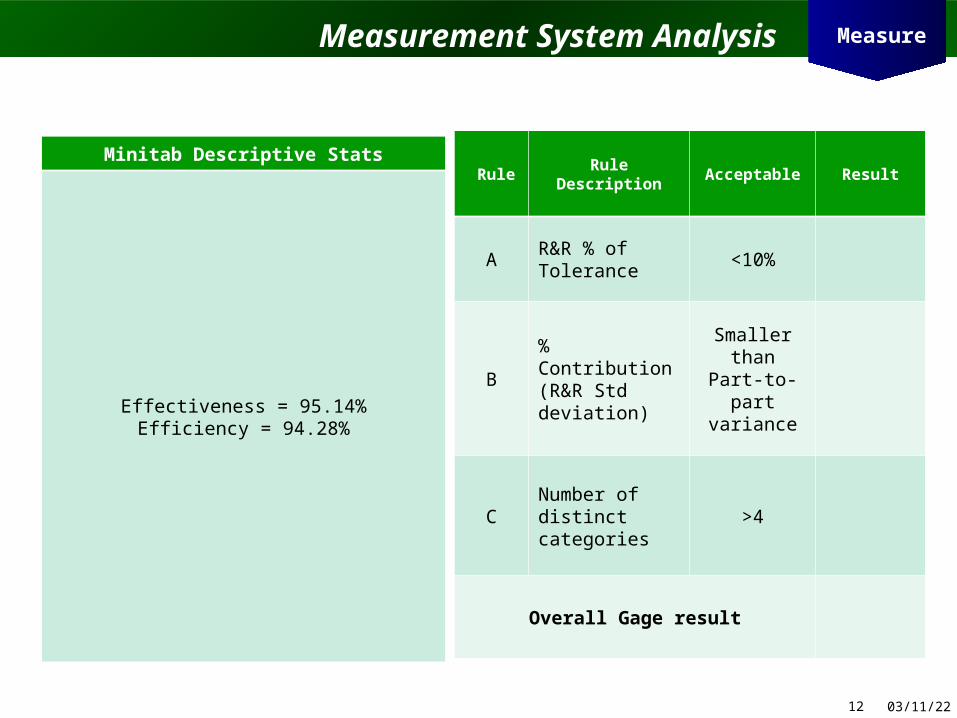
Measurement System Analysis
Rule Rule Description Acceptable Result
AR&R % of Tolerance
<10%
B% Contribution (R&R Std deviation)
Smaller than Part-to-part
variance
CNumber of distinct categories
>4
Overall Gage result
Minitab Descriptive Stats
Effectiveness = 95.14%Efficiency = 94.28%
Measure
04/14/2313
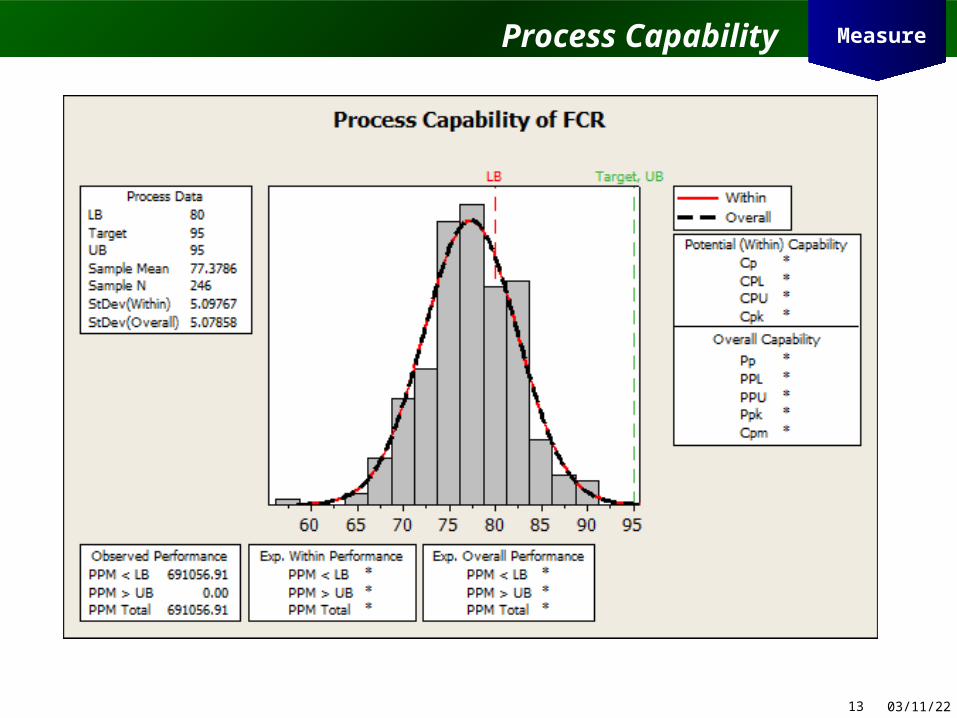
Process Capability Measure
04/14/2314
1. DCP for Potential Xs2. Identify Potential Xs3. DCP for Potential Xs4. Basic Analysis for Project Y5. Checking for Impact of ...... on Y6. Hypothesis Summary7. MSA results of Impacting Factors
Analyse
04/14/2315
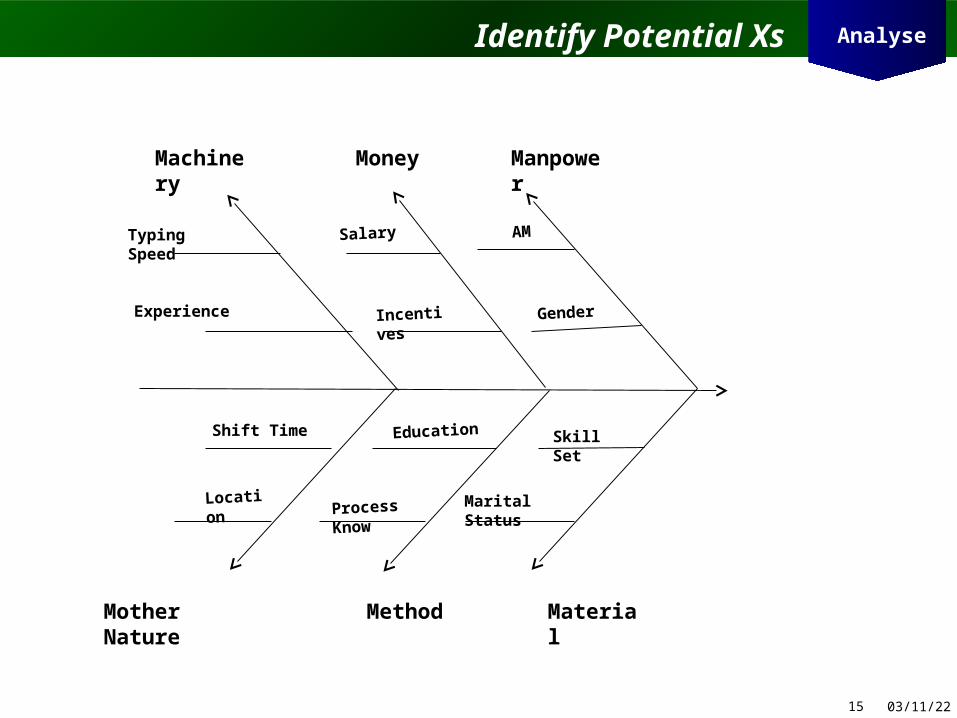
Identify Potential Xs Analyse
Method
Machinery Money
Material
Manpower
Mother Nature
Gender
AMSalary
Incentives
Shift Time
LocationProcess Know
Education
Typing Speed
Experience
Skill Set
Marital Status
04/14/2316
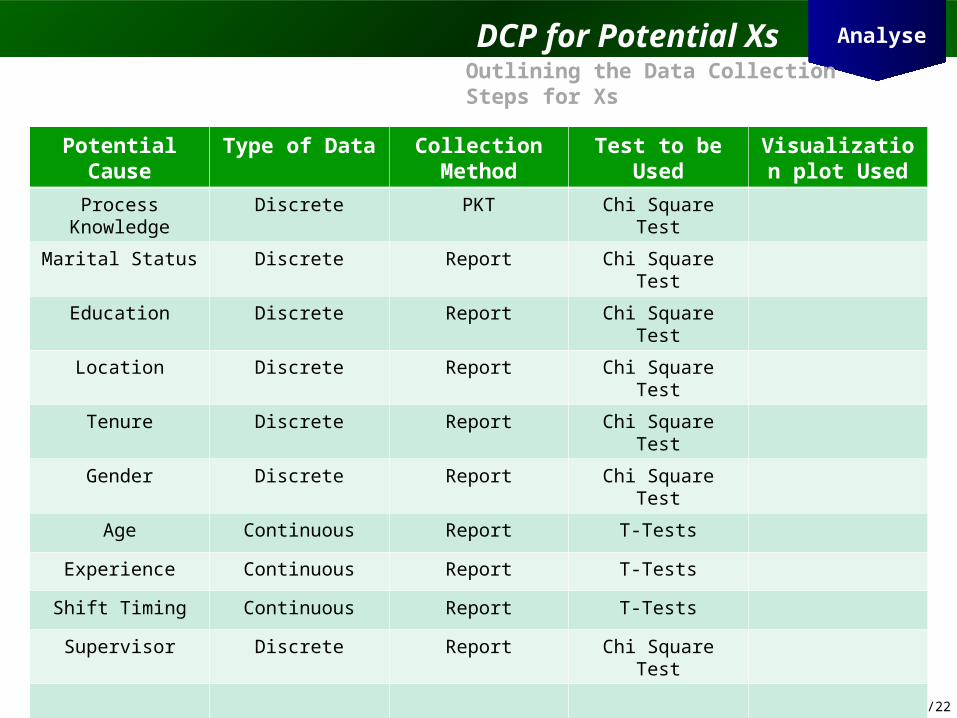
DCP for Potential Xs
Potential Cause Type of Data Collection Method
Test to be Used Visualization plot Used
Process Knowledge Discrete PKT Chi Square Test
Marital Status Discrete Report Chi Square Test
Education Discrete Report Chi Square Test
Location Discrete Report Chi Square Test
Tenure Discrete Report Chi Square Test
Gender Discrete Report Chi Square Test
Age Continuous Report T-Tests
Experience Continuous Report T-Tests
Shift Timing Continuous Report T-Tests
Supervisor Discrete Report Chi Square Test
Outlining the Data Collection Steps for Xs
Analyse
04/14/2317
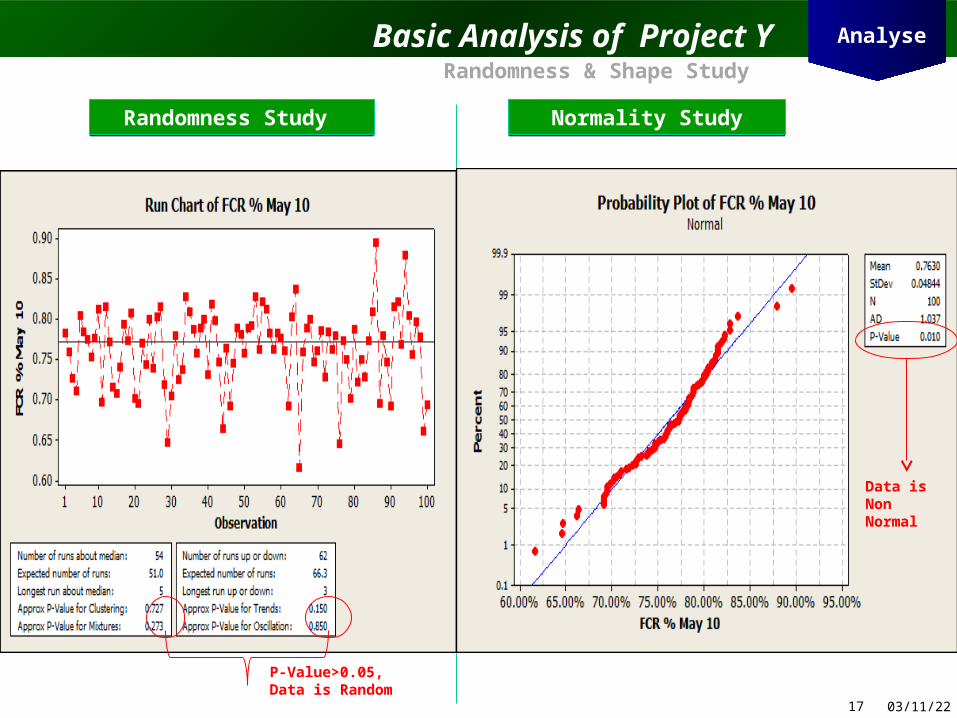
Basic Analysis of Project Y
Randomness Study Randomness Study Normality StudyNormality Study
Randomness & Shape Study
Analyse
Data is Non Normal
P-Value>0.05, Data is Random
04/14/2318
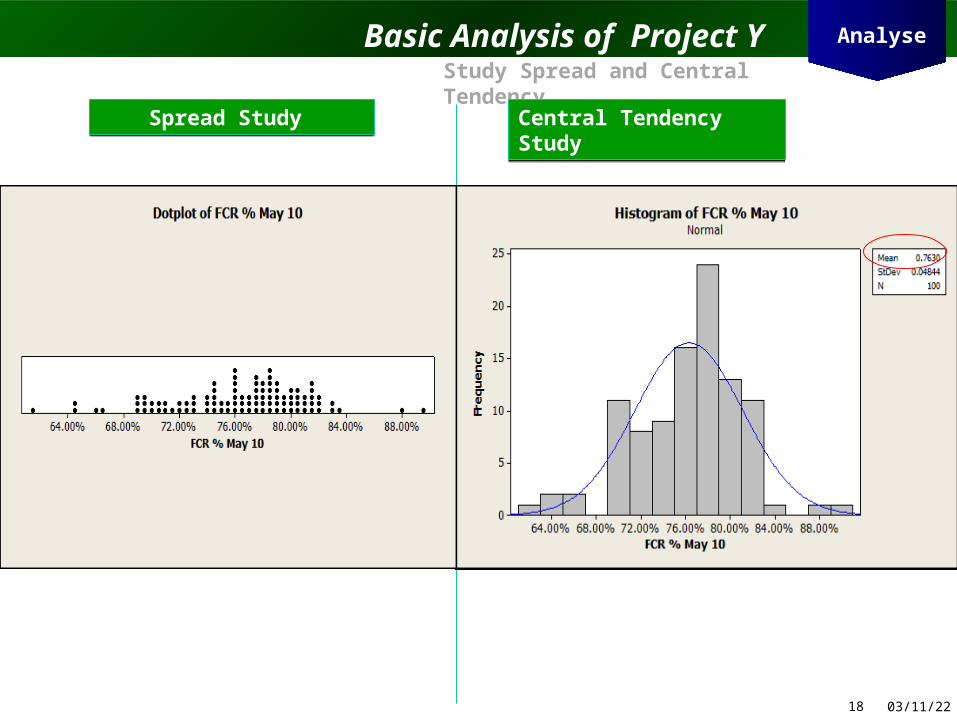
Basic Analysis of Project YStudy Spread and Central Tendency
Spread Study Spread Study Central Tendency StudyCentral Tendency Study
Analyse

04/14/2319
Statistical Interpretation of relationship
Graphical DepictionGraphical Depiction Hypothesis ResultHypothesis Result
Inference :Inference :
Checking for Impact of ……on Y Analyse
04/14/2320
Statistical Interpretation of relationship
Graphical DepictionGraphical Depiction Hypothesis ResultHypothesis Result
Inference :Inference :
Checking for Impact of ……on Y Analyse

04/14/2321
Statistical Interpretation of relationship
Graphical DepictionGraphical Depiction Hypothesis ResultHypothesis Result
Checking for Impact of ……on Y
Inference :Inference :
Analyse

04/14/2322
Statistical Interpretation of relationship
Graphical DepictionGraphical Depiction Hypothesis ResultHypothesis Result
Inference :Inference :
Checking for Impact of ……on Y Analyse

04/14/2323
Statistical Interpretation of relationship
Graphical DepictionGraphical Depiction Hypothesis ResultHypothesis Result
Inference :Inference :
Checking for Impact of ……on Y Analyse
04/14/2324
Hypothesis Summary
Sl. No.
Factor P Value Graphical Tool Used
Inference Next Steps
Summary of Impacting Factors
Analyse
04/14/2325
MSA Results of Impacting FactorsChecking the Validity of the data of the impacting factors
Sl. No.
FactorMSA
Method Used
ResultRCA for Problems
Next Steps
Analyse
04/14/2326
Improve
1. Screening of the Impacting Factors
2. Action Plan for Improving the Factors
3. Basic Analysis of Improved Y
4. Pre–Post Analysis of Project Y
5. Pre-Post Analysis of Factor
6. Improve Summary – Take Aways

04/14/2327
Screening of the Impacting FactorsPrioritize the Impacting Factors
Improve
04/14/2328
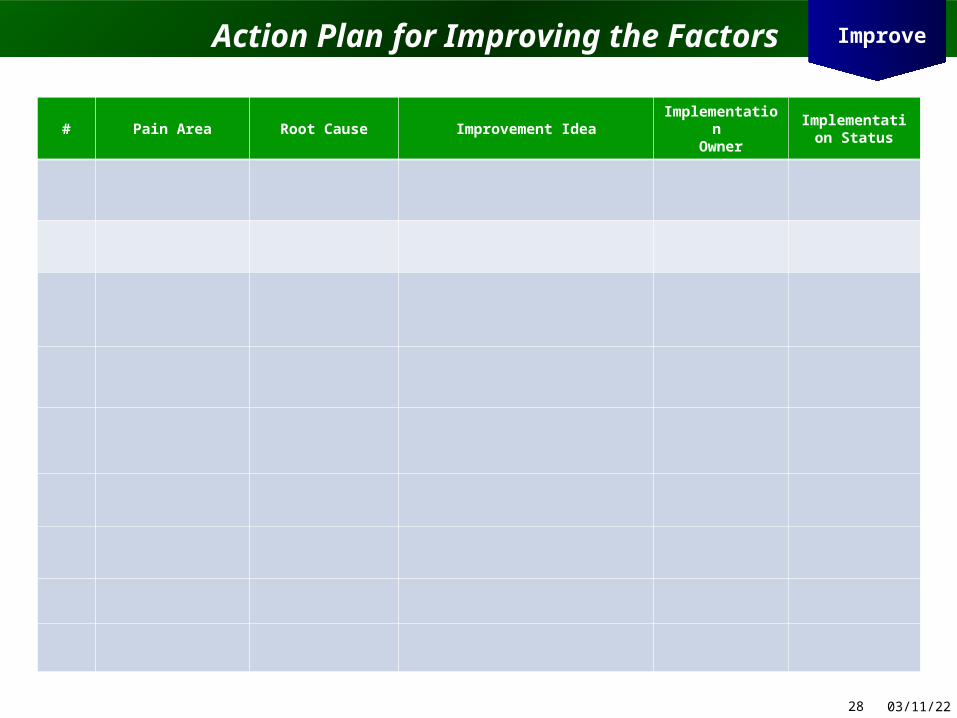
Action Plan for Improving the Factors
# Pain Area Root Cause Improvement IdeaImplementati
on Owner
Implementation Status
Improve
04/14/2329
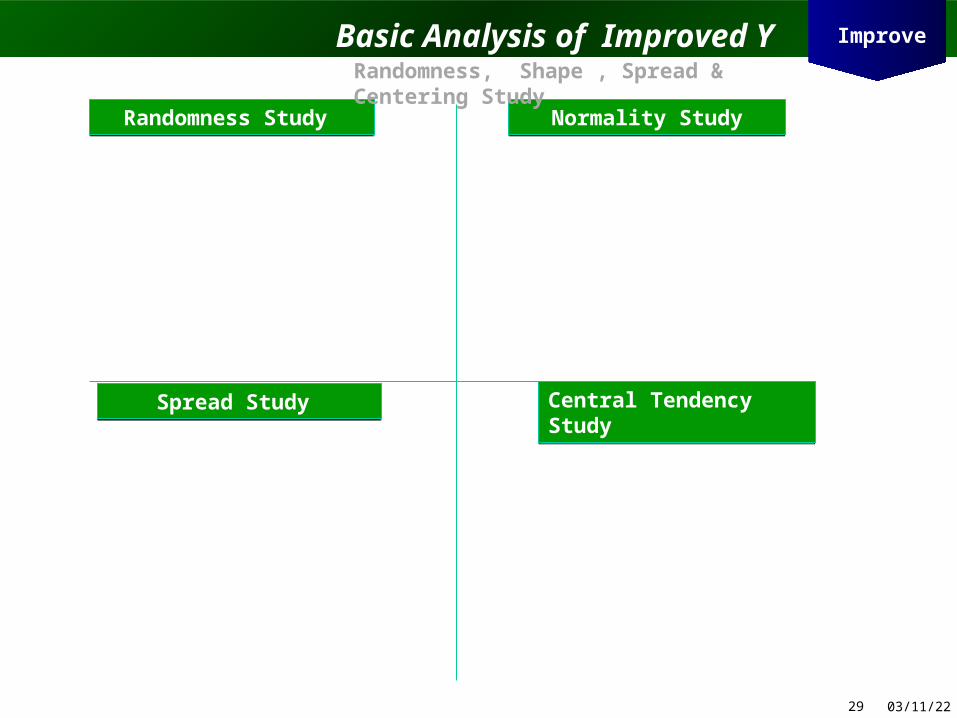
Basic Analysis of Improved Y
Randomness Study Randomness Study Normality StudyNormality Study
Randomness, Shape , Spread & Centering Study
Spread Study Spread Study Central Tendency StudyCentral Tendency Study
Improve
04/14/2330
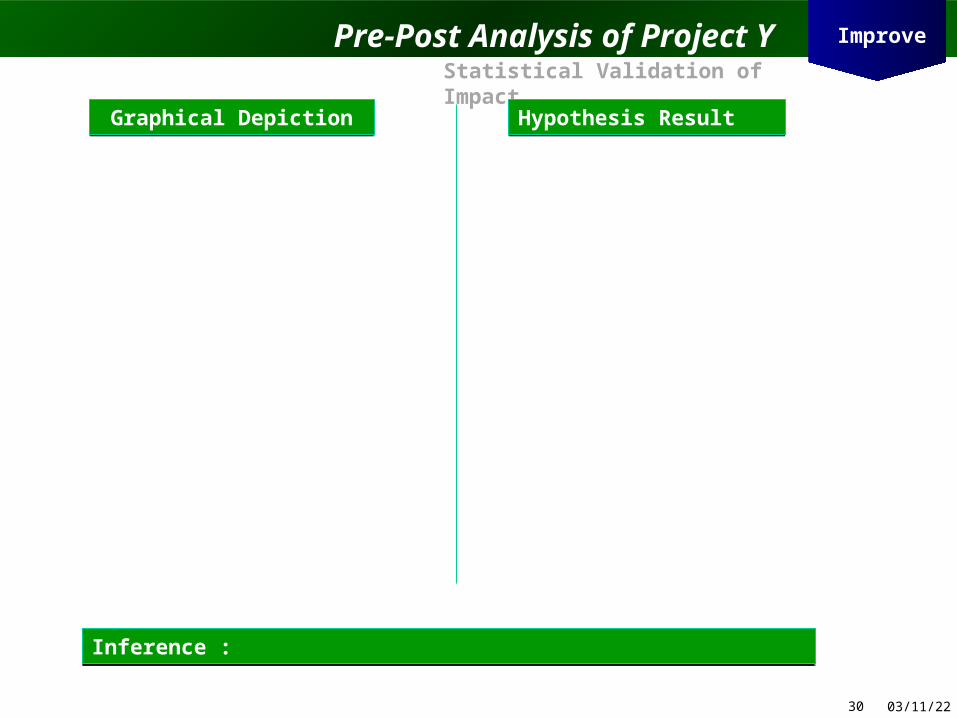
Pre-Post Analysis of Project YStatistical Validation of Impact
Graphical DepictionGraphical Depiction Hypothesis ResultHypothesis Result
Inference :Inference :
Improve

04/14/2331
Pre-Post Analysis of Project YStatistical Validation of Impact
Graphical DepictionGraphical Depiction Hypothesis ResultHypothesis Result
Inference :Inference :
Improve
04/14/2332
Pre-Post Analysis of FactorStatistical Validation of Impact
Graphical DepictionGraphical Depiction Hypothesis ResultHypothesis Result
Inference :Inference :
Improve

04/14/2333
Pre-Post Analysis of FactorStatistical Validation of Impact
Graphical DepictionGraphical Depiction Hypothesis ResultHypothesis Result
Inference :Inference :
Improve

04/14/2334
Pre-Post Analysis of FactorStatistical Validation of Impact
Graphical DepictionGraphical Depiction Hypothesis ResultHypothesis Result
Inference :Inference :
Improve

04/14/2335
Pre-Post Analysis of FactorStatistical Validation of Impact
Graphical DepictionGraphical Depiction Hypothesis ResultHypothesis Result
Inference :Inference :
Improve
04/14/2336
Improve Summary – Take Aways Improve
04/14/2337
1. Control Plan & FMEA on Control Plan2. Time Series Study of Y – Pre & Post3. Control Charts & Inference for Y – Pre & Post4. Basic Analysis of Improved Y5. Establish Process Capability6. Control Charts & Inference (for X1)7. Control Charts & Inference (for X2)8. Cost Benefit Analysis and Sign Off
Control
04/14/2338
Control Plan & FMEA on Control Plan
What’s Controlled Goal/Spec Limits Control MethodWho/What Measures
Where Recorded
Decision Rule /
Corrective Action
SOP
Control

04/14/2339
Time Series Study of Y – Pre & Post Control
04/14/2340
Control Charts & Inference For Y – Pre & Post Control
04/14/2341
Basic Analysis of Improved Y
Randomness Study Randomness Study Normality StudyNormality Study
Randomness, Shape , Spread & Centering Study
Spread Study Spread Study Central Tendency StudyCentral Tendency Study
Control
04/14/2342
Z Bench (Long Term Sigma)
Short Term Sigma(Long Term Sigma +1.5)
Process Capability – Post Implementation
Establish Process Capability Control
04/14/2343
Control Charts & Inference (For X1) Control

04/14/2344
Control Charts & Inference (For X2) Control
04/14/2345
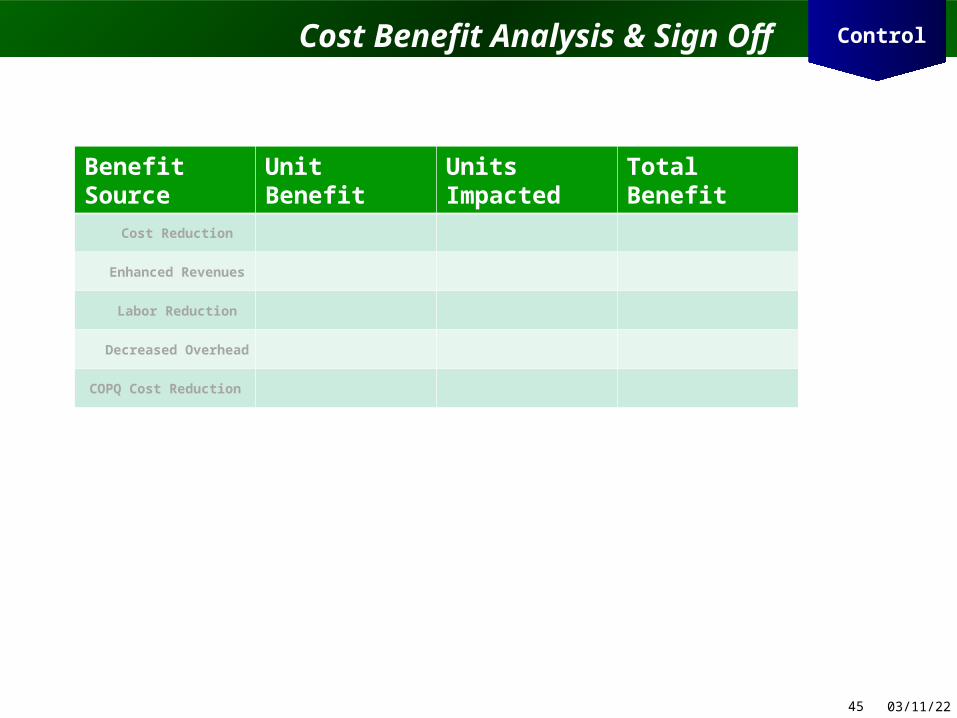
Cost Benefit Analysis & Sign Off
Benefit Source Unit Benefit Units Impacted Total Benefit
Cost Reduction
Enhanced Revenues
Labor Reduction
Decreased Overhead
COPQ Cost Reduction
Control

04/14/2346
04/14/2347
What to see more of Want to see less of
Stakeholder Analysis
04/14/2348
Indicators Definition
Terms & Definitions Used
04/14/2349
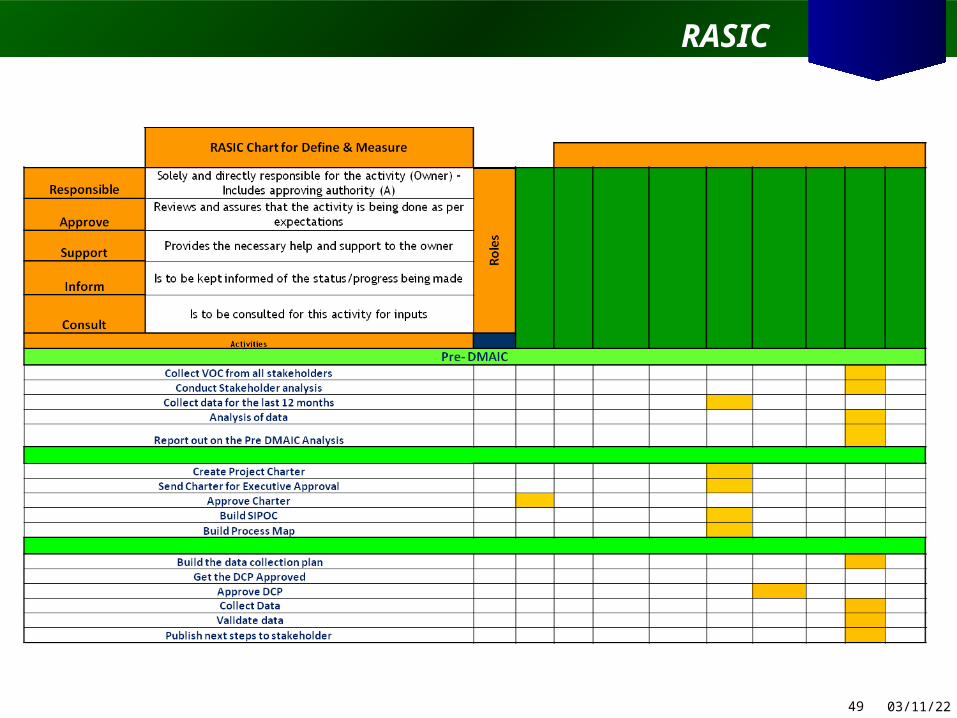
RASIC

04/14/2350

04/14/2351

04/14/2352

04/14/2353