Embed Size (px)
Citation preview

In the name of god

SJR
Scimago
Journal and country
Ranking
The SCI mago Journal & Country Rank is a portal that includes the journals and country scientific indicators developed from the information contained in the Scopus database (Elsevier ). These indicators can be used to assess and analyze scientific domains.
SCImago is a research group from the Consejo Superior de Investigaciones Cientificas (CSIC), University of Granada
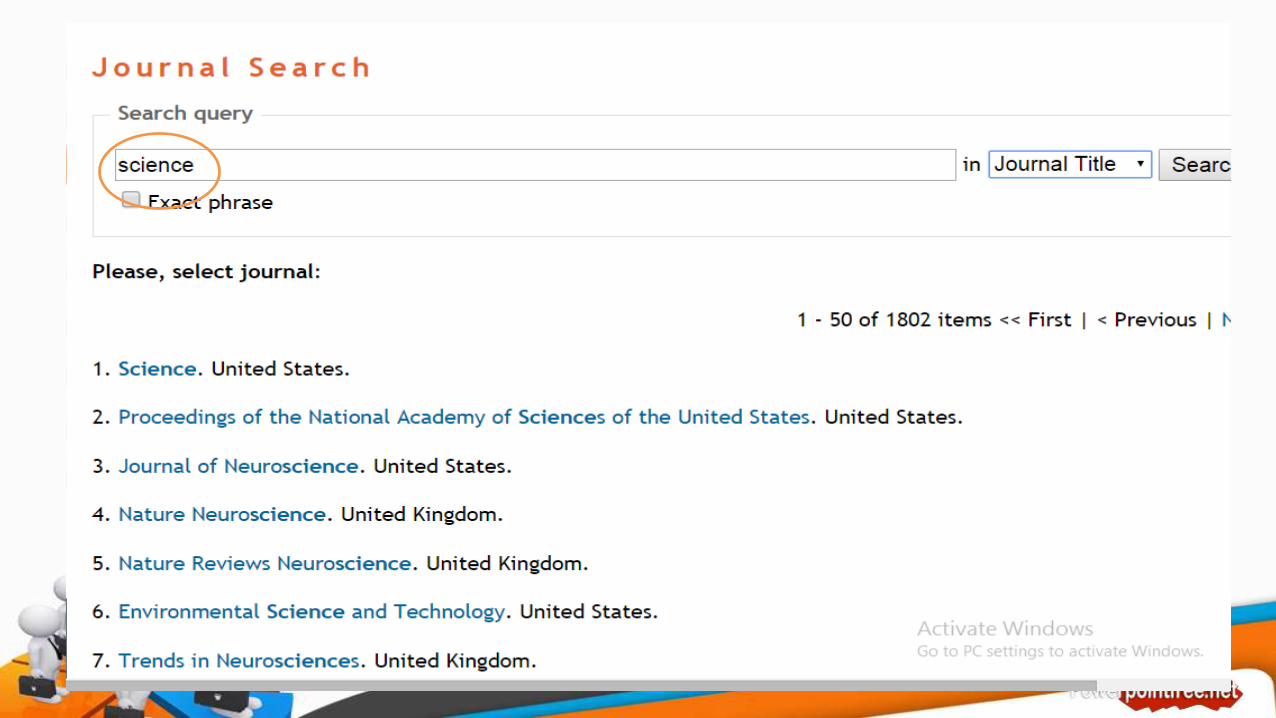
Find a Journal. Journal Search
Journals can be searched by journal title, ISSN or publisher.1) When searching by ISSN do not include hyphens2) When searching by journal title or journal publisher, individual words or exact wording/phrase can be used.

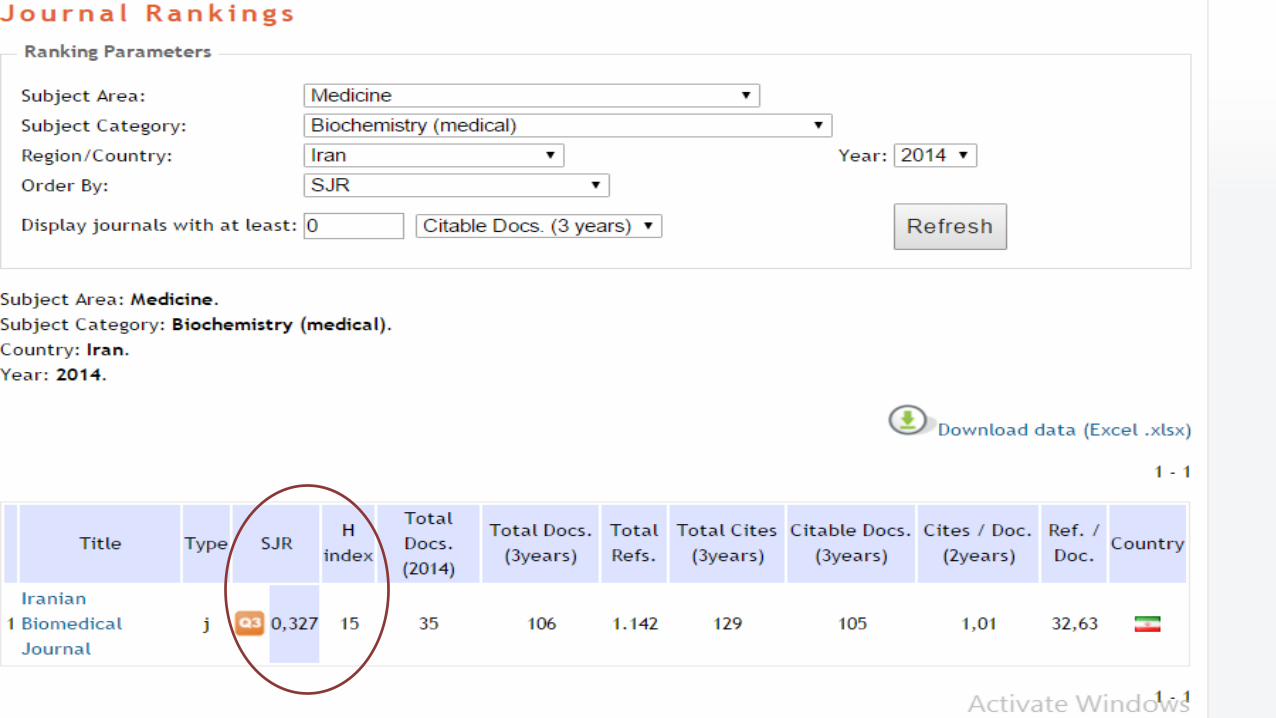
Rank Journals. Journal IndicatorsJournal sets listed in rankings can be customized by filtering and
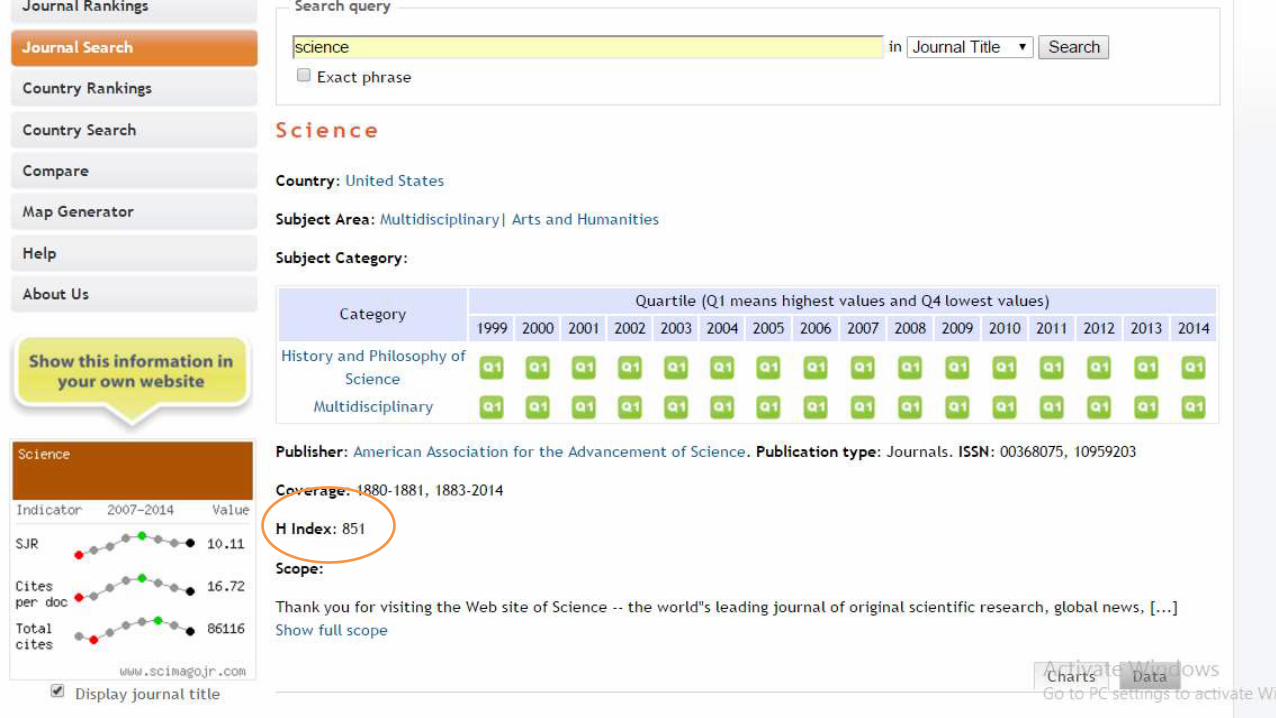
ranking criteria and applying a lower threshold to the ranking. Every journal can be analyzed separately, just click the journal title's link to obtain an individual profile including time series tables and charts to analyze significative metrics of journal performance.
Ranking journal According to:
1) Scopus Subject Areas and Subject Categories
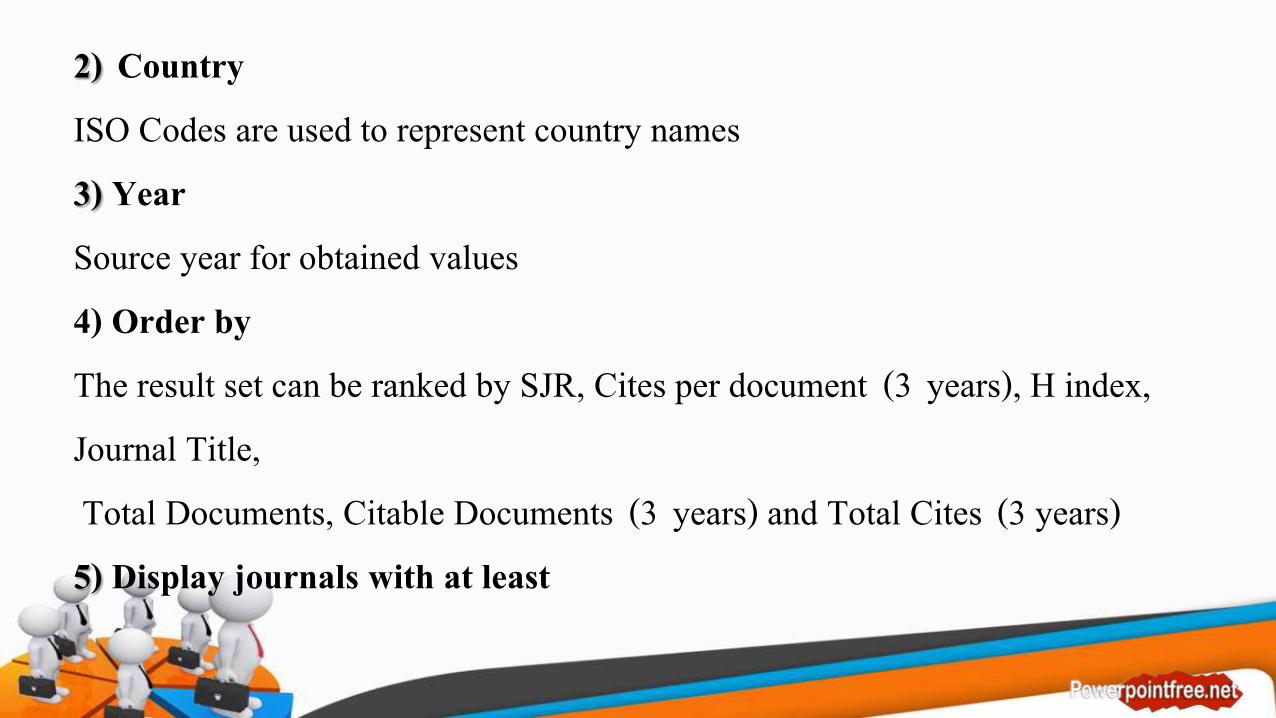
2) CountryISO Codes are used to represent country names3) YearSource year for obtained values4) Order byThe result set can be ranked by SJR, Cites per document (3 years), H index, Journal Title,Total Documents, Citable Documents (3 years) and Total Cites (3 years)
5) Display journals with at least

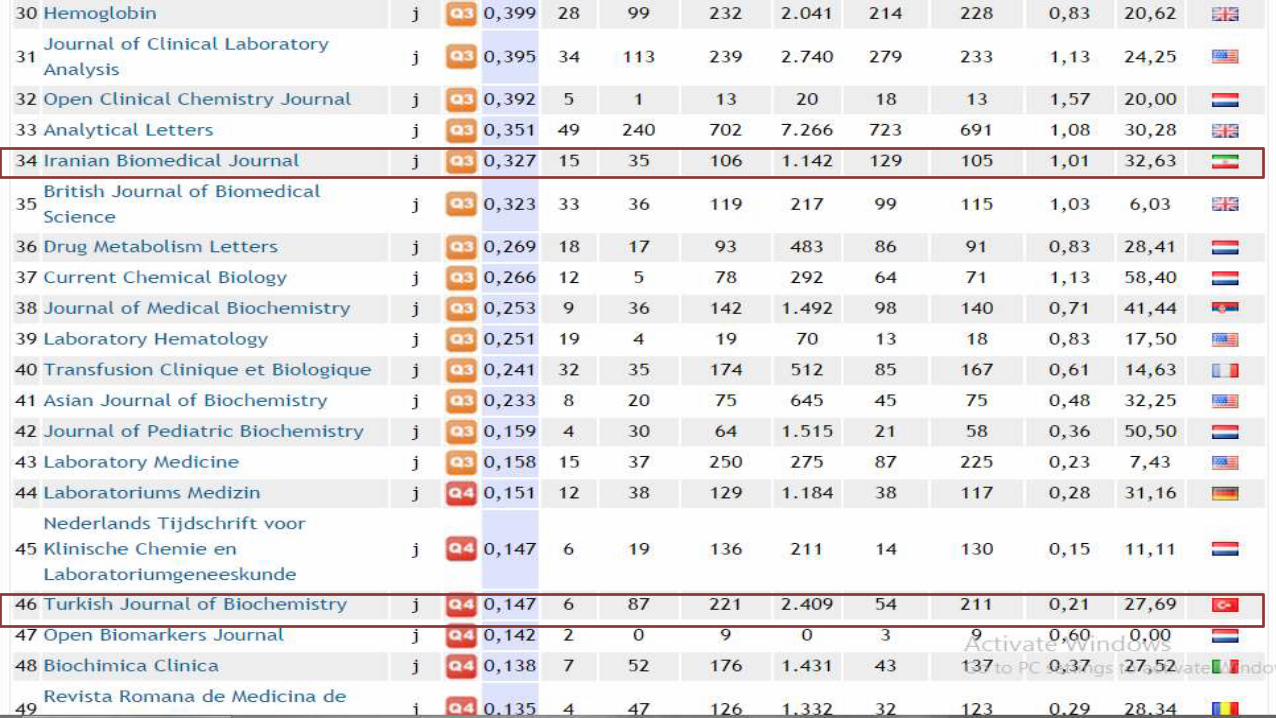
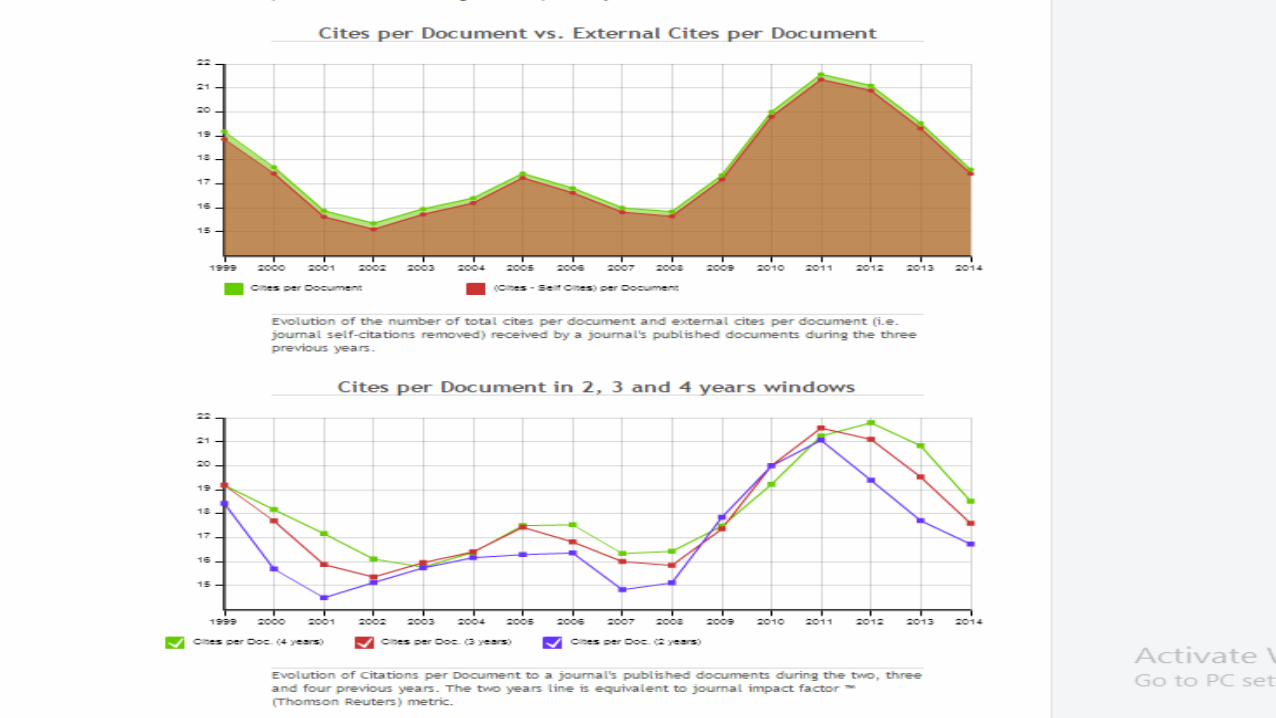
Understand tables and charts

SJR (SCImago Journal Rank) indicatorIt expresses the average number of weighted
Citations received in the selected year
by the documents published in the selected
journal in the three previous years,
H Index
The h index expresses the journal's number
of articles (h) that have received at least h
citations. It quantifies both journal scientific
productivity and scientific impact and it is
also applicable to scientists, countries, etc.
• Total Docs./Total DocumentsOutput of the selected period.
• Total Docs. (3years)• Total References.• Total Cites (3years).• Citable Documents.• Cites per Documents (2 years).• Cites per Doc (3 years).
• Cites per Doc (4 years)
• Ref. / Doc.
Average number of references per document in the
selected year.• Self Cites.• Non-citable documents (Available in the
graphics).• Cited Documents (Cited Doc.)• Uncited Documents (Uncited Doc.)

• Countries and World Regions
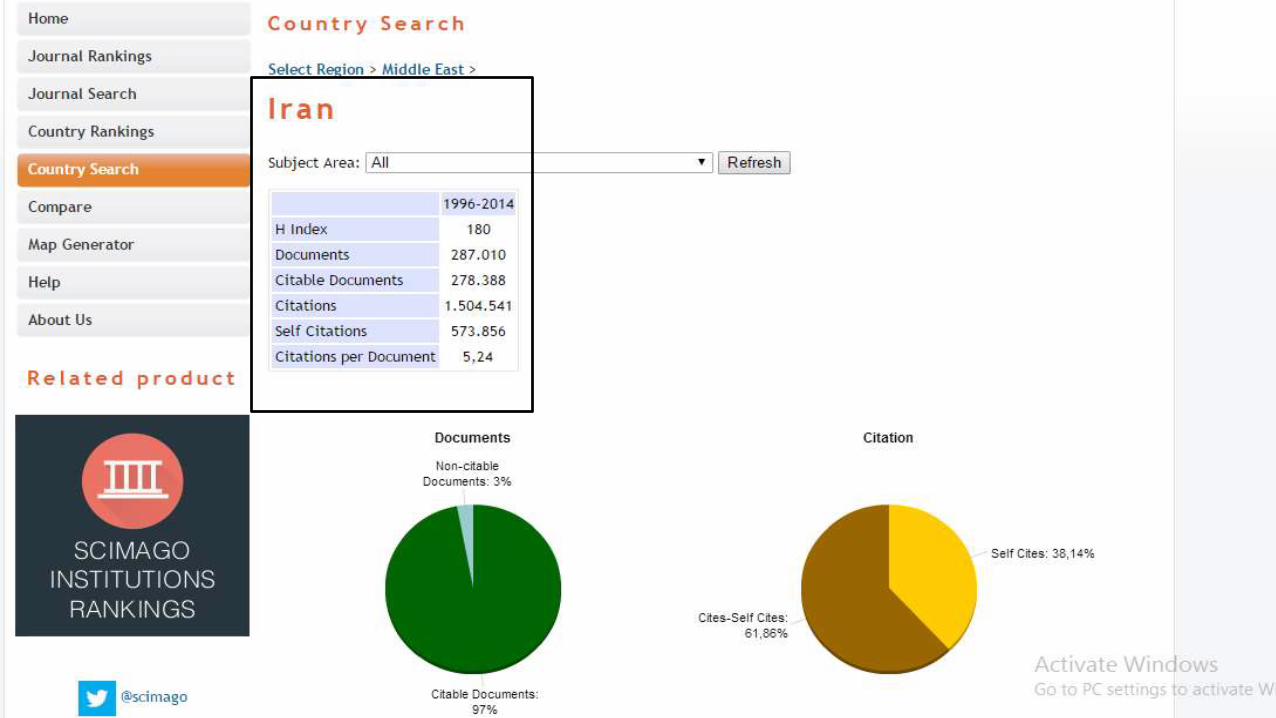
• Find a Country
• Finding a country to be analyzed is a rather intuitive task through the interactive. Countries are easily browsable through the world regions list and the interactive map.
• Rank Countries and World Regions
• Country ranks can be customized by filtering and ranking criteria and applying a lower threshold to the ranking.
• Subject Areas and Subject Categories.
• Region.
• Year.
• Order by.• Display countries with at least.
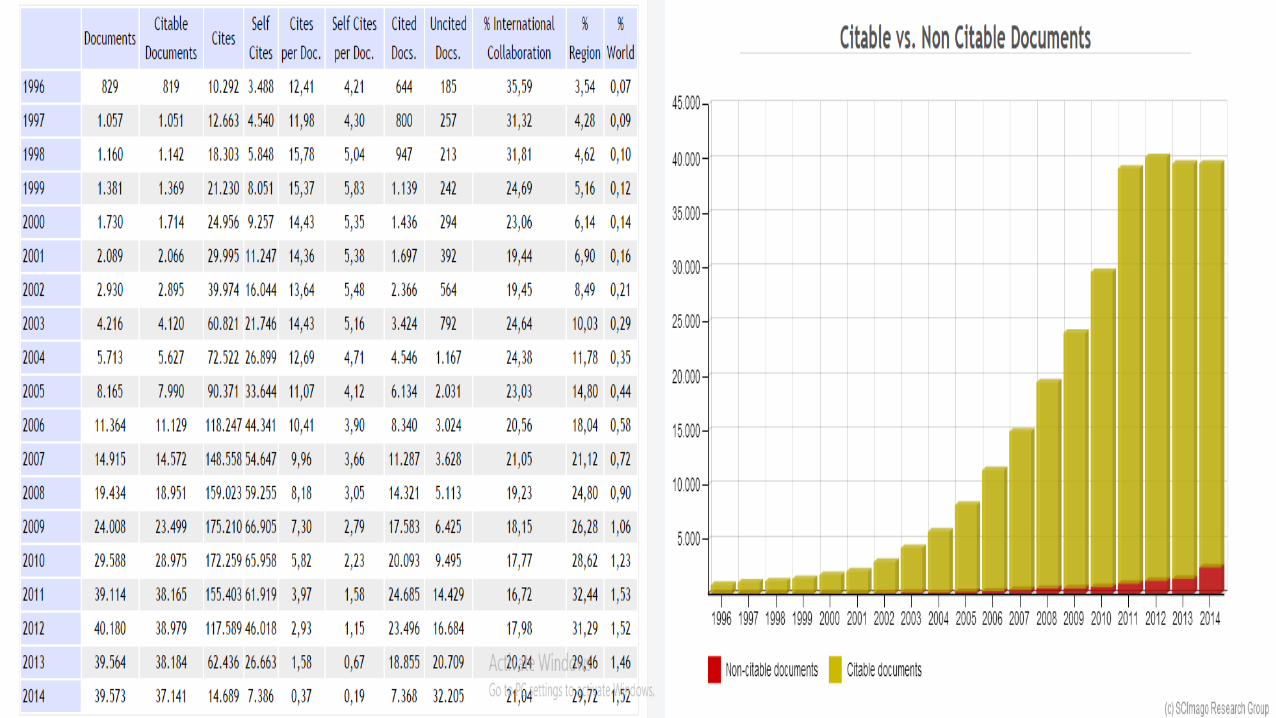
Understand tables and charts
• Documents
• Citable Documents
• Cites
• Self Cites
• H index
• Self Cites per Doc.
• H index
• Self Cites per Doc.
• Non-citable Documents (Available in the graphics)
• Cited Documents (Cited Doc.)
• Uncited Documents (Uncited Doc.)
• International Collaboration
• Region
• World
Compare
Comparative analysis of journals, countries and
world regions can be performed. To this, metrics
for up to 4 journals, and for up to 4 countries
and/or world regions can be displayed together.
Result sets can be filtered by 27 major thematic
categories and 313 specific subject categories
according to Scopus Classification. Coverage spans
from 1996 to 2015.

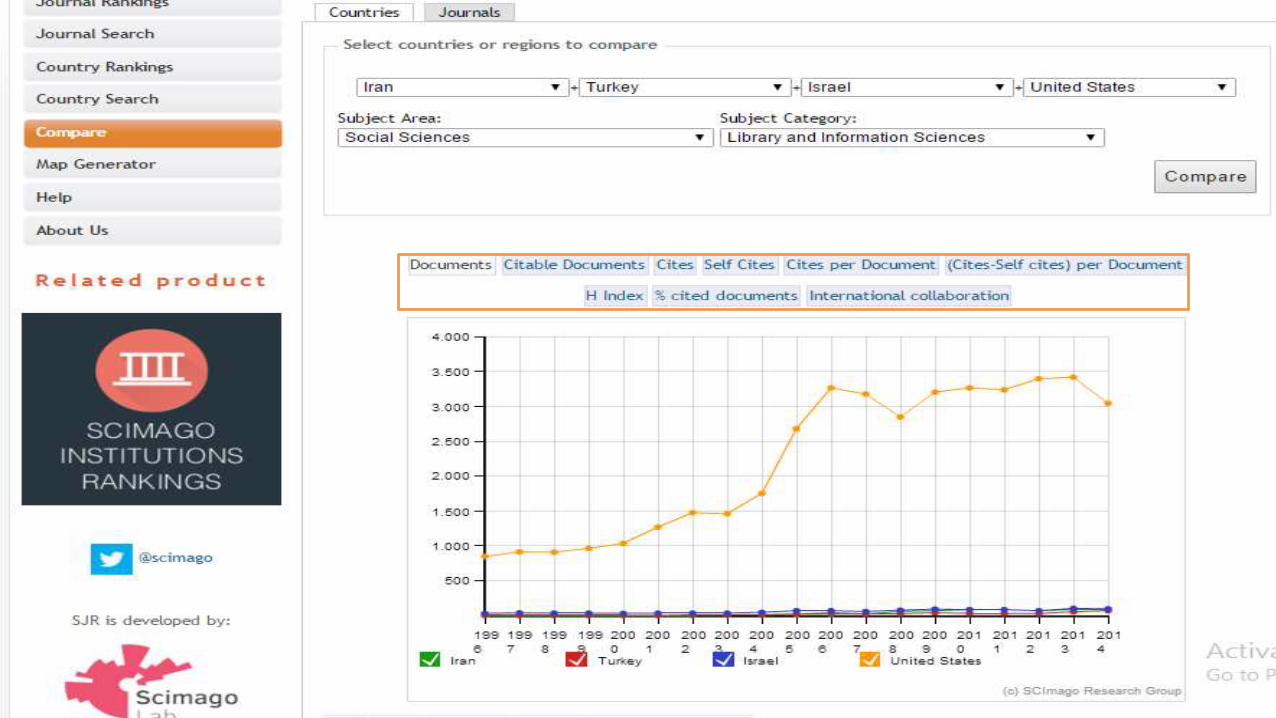
Countries and Geographic Regions
Country-country, country-region and region-region
comparative analysis can be performed. These can be
selected from the drop-down lists included in the four
input fields. Displayed metrics include tables and
charts for the following indices: Documents, Citable
Documents, Cites, Self-Cites, Cites per Document,
Cites- Self Cites per Document and Cited Document
Rate.
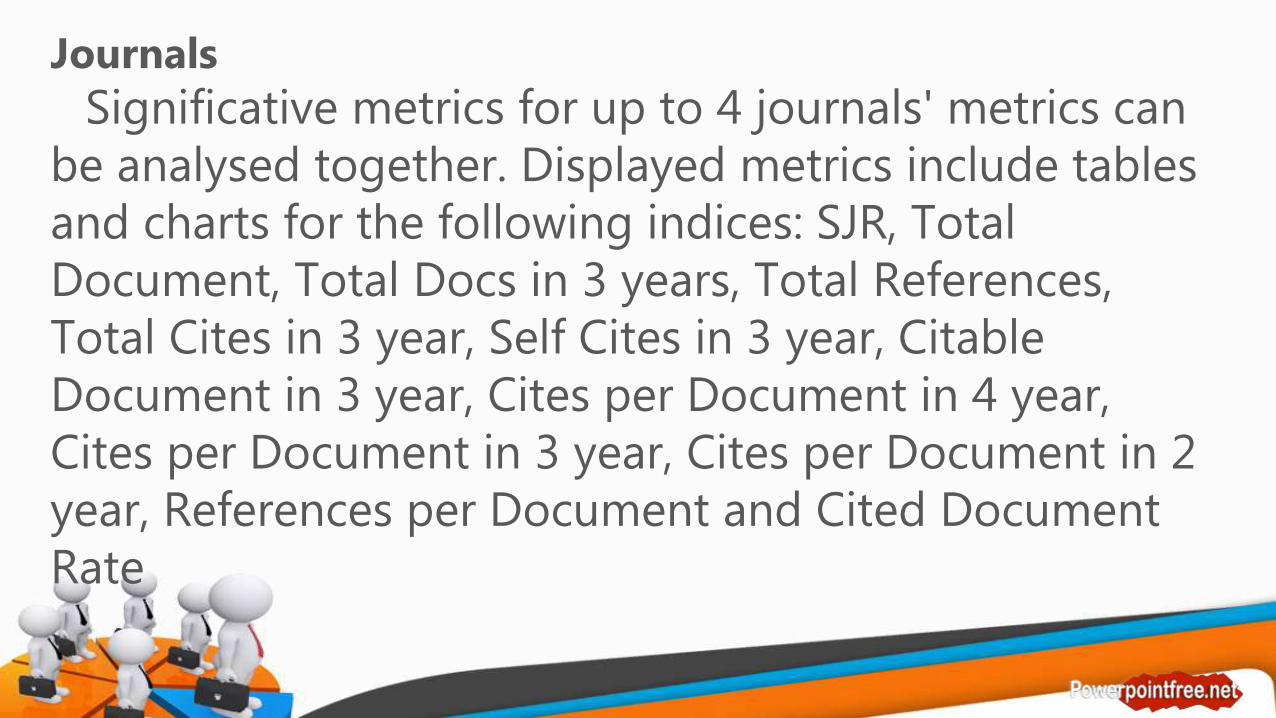
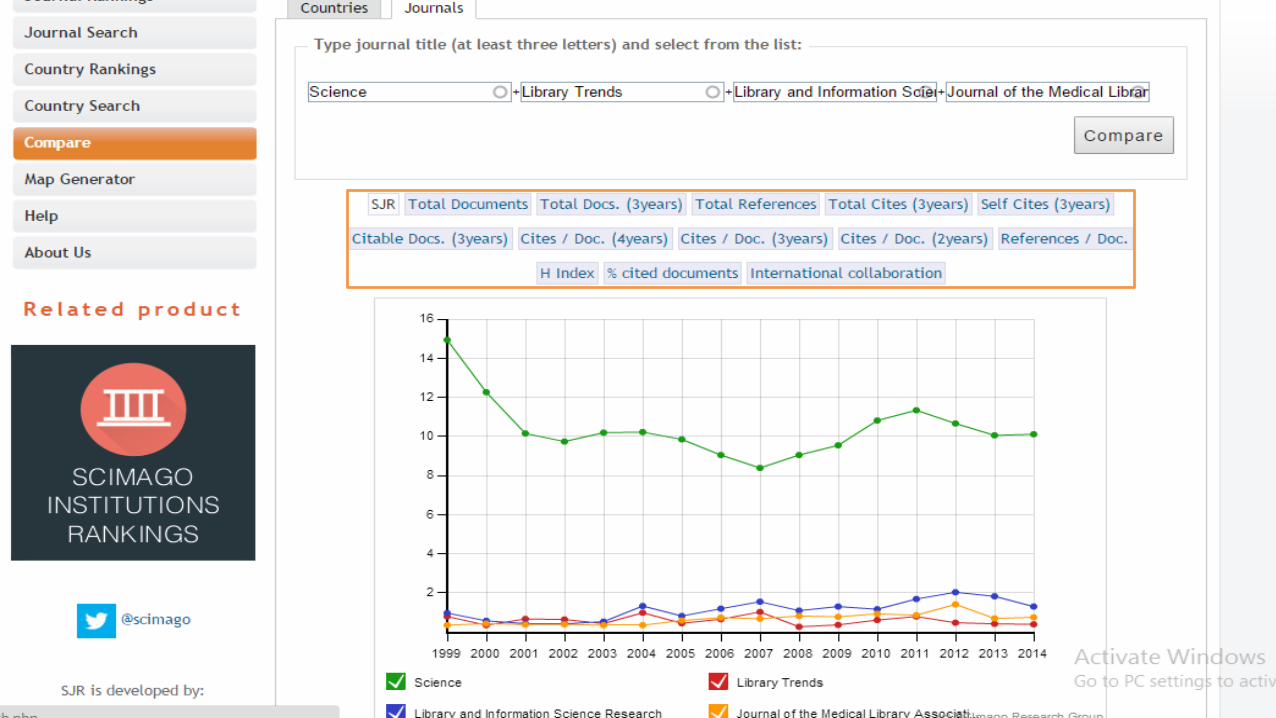
Journals
Significative metrics for up to 4 journals' metrics can be analysed together. Displayed metrics include tables and charts for the following indices: SJR, Total Document, Total Docs in 3 years, Total References, Total Cites in 3 year, Self Cites in 3 year, Citable Document in 3 year, Cites per Document in 4 year, Cites per Document in 3 year, Cites per Document in 2 year, References per Document and Cited Document Rate

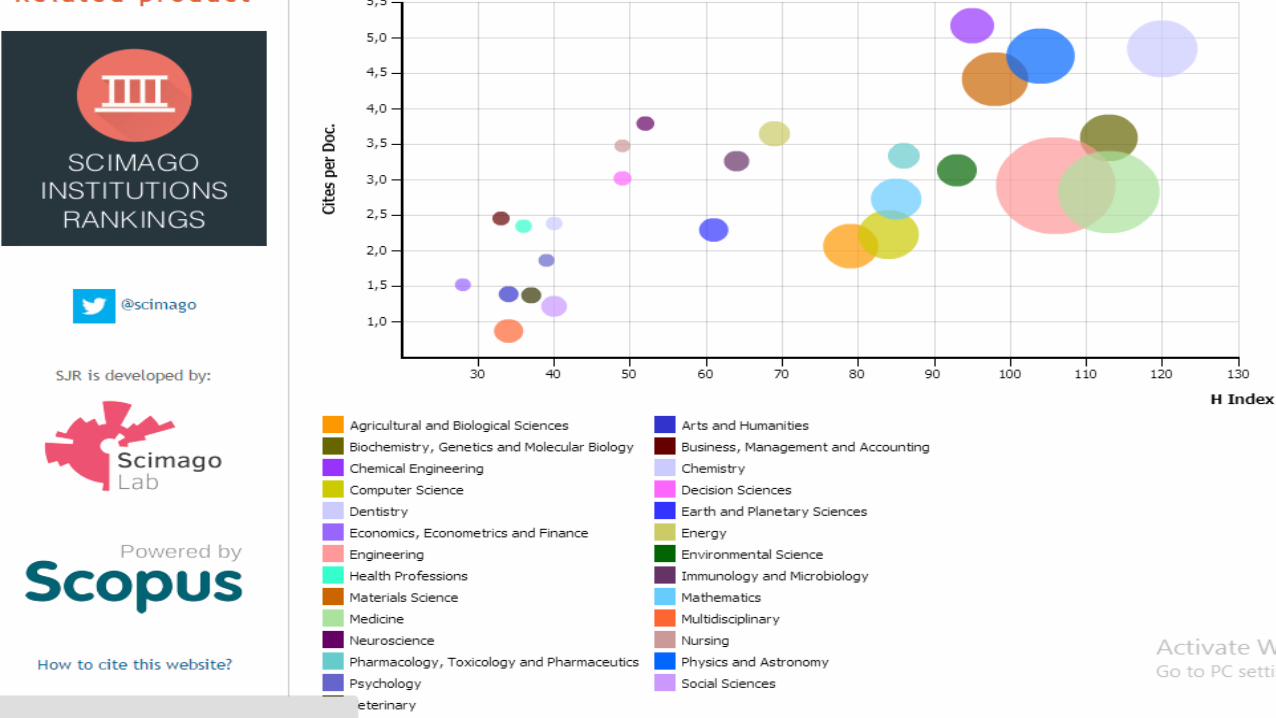
Bubble charts
National scientific output can be analyzed through customizable Bubble Charts for a richness of performance metrics. These charts also offer two levels of detail based on Scopus Classification's Science Areas (27 major fields) and Subject Categories (313 narrower thematic categories). Bubble charts features includes:
Default view plots H index (on X axis) versus Cites per Documents (on Y axis), corresponding the bubble size to the field publication size.
Indicators choice and arrangement is customizable through the Change Variable Buttons.
Available indicators to be plotted are: Documents, Citable Documents, Cites, Self Cites, Cites per Document, H index.
THE END
THANKS PAY ATTENTION ME
MOHAMMADZADEH.MOHAMMADSALEH