Embed Size (px)
Citation preview
International Journal of Sciences: Basic and Applied Research
(IJSBAR)
ISSN 2307-4531 (Print & Online)
http://gssrr.org/index.php?journal=JournalOfBasicAndApplied
---------------------------------------------------------------------------------------------------------------------------
179
Study on Appropriate Technology–Based Local Economic
Development in Biak Regency, Papua Province, Indonesia
Suwandia*, Yanuarius Resubunb
aLecturer and Head of Master Program of Urban and Regional Planning in University of Cenderawasih,
Jayapura-Papua, Indonesia bLecturer in Master Program of Urban and Regional Planning in University of Cenderawasih, Jayapura-Papua,
Indonesia aEmail: [email protected]
bEmail: [email protected]
Abstract
This research is conducted in Biak Regency under the following objectives: (1) to find out the economic
performance of Biak Regency with Regencies/ Cities in Papua viewed from economic growth aspect and the
contribution of regional economic sector, (2) to identify potential sectors in the economy of Biak Regency, and
(3) to analyze the leading sector in the economy of Biak Regency viewed from the economic structure of Papua
Province. This research uses primary and secondary data. The primary data is obtained from the result of
interview with BPS staffs of Papua Province and Biak Regency concerning PDRB. Meanwhile, the secondary
data is collected from any documents related to the Analytical Tools used in this research, namely Analysis of
Klassen Typology, Location Quotient (LQ) and Shift Share. The result of this research shows that there are
economic potentials based on appropriate technology which can be developed in Biak Regency, and one of them
is sea fishery. The fish production which mainly produced is tuna fish and cekalang fish. The center of capture
fisheries in Biak Regency is located in the District of Biak Utara, Timur, Barat, and Biak Kota.
Keywords: PDRB; Klassen Typology; Location Quotient (LQ); Shift Share.
-----------------------------------------------------------------------------------
* Corresponding author
International Journal of Sciences: Basic and Applied Research (IJSBAR) (2016) Volume 29, No 2, pp 179-192
180
1. Introduction
Papua Province is included in one of the Provinces whose poor people is relatively high, which is 40.78% in
2012, going beyond Indonesia’s average poverty level in the same year, namely 16.58%. In the meantime, this
Province has a largest region in Indonesia, namely 309,934.4 km2 or including 16.66% of the entire regions in
Indonesia (BPS 2012), as compared to East Kalimantan as the second largest province as much as 194,849.08
km2 (10.47%), and East Java with 46,689.4 km2 (2.51%).
Seeing such large region, obviously, there are much potential of resources hidden in it. But, one question may
arise, though: why the poverty level in this region is high? Perhaps, the existing potentials in this region have
not been maximally utilized. In order to increase the people’s welfare, it is necessary to encourage the growth of
its economic rate. This can be done by utilizing any potentials available in that region more efficiently.
However, the problems may still be found, such as in how to determine which potentials that are necessarily
prioritized in its development, how to utilize those potentials, and how to distribute the results obtained.
Local economic potential is something that is possible and feasible to be developed until it will be growing
sustainably to be the source of living for local people, as well as it will be able to encourage the development of
regional economy. Regional potential can develop when there are efforts conducted, either by the government,
private institution, and local people. Like a ball that stays still at a corner, it will never move if there is nothing
to it. If there is no power touching it, the said ball will be still in its place. The problem is how we can read the
potential. First of all, we have to do observation on data. For example, region A has potential for producing salt,
because its geographical location is in the middle of the ocean. Region B has its potential for producing oil,
because it has so many oil contents in its region. Economic potentials can be seen from the content of natural
resources, regional topography, climate, population number, geographical location, and so on.
If the potentials have been able to be described, the next step is selecting potential sectors that necessarily to be
prioritized for its development, so it can increase the people’s welfare. In order to select which sectors that will
be prioritized, it requires an economic analysis concerning the impacts upon value-added, revenue, job
opportunity, environment and its sustainability. The economic development can be achieved more quickly by
tracing any sources of development existing in related region. Those are sectors that show its excellence of
having better prospect for development and expected to be able to encourage the development of other sectors.
There are some analytical tools which can be used for determining the relative potentials of economy in a
region, such as lain location quotient (LQ) and shift-share analysis. After determining the leading sectors, the
next step is reviewing on the management of those sectors; how to gain its inputs, equipment, production and
marketing methods, as well as how to process the production results.
In order to reduce poverty and to improve welfare for the majority of people in Papua Province, the local
potentials, mainly in villages, need to be explored and developed. This development will be more efficient if it is
supported with the use of appropriate technology, namely a technology that is suitable with the condition of
each region; not only measuring the manufacturer’s economic rationality individually, but also taking the
interest of entire community members into account.
International Journal of Sciences: Basic and Applied Research (IJSBAR) (2016) Volume 29, No 2, pp 179-192
181
Based on above description, it is necessarily to do a study regarding the way the local society develops their
economy on the basis of appropriate technology in Biak Regency as to increase the community’s living
standard.
2. Literature Review
Concept of Development
A development can be understood in three important elements [12], namely: first, a development is meant to be
a process of change; second, a development is a form of an effort; third, a development grows sustainably in a
long term. The success of a development is determined by the community’s welfare. In the conceptual
approach, a development is not only measuring on the revenue, but it is also considering the quality of life as a
description and “civilization improvement” of human species, as the ruler and preserver of the universe. As
stated by Sen in Berenger and [1], the people welfare can be seen from their social and economic capability. It
means that the prosperity is a realization of freedom and human right. Then, the question is: for whom such
individual human right is designated? Socio-economic transformation that brings social entity to social change
of the higher level of progress can be done through two methods [4]. namely (1) revolutionary method which
tends to unfriendly and resulting in many unexpected effects; and (2) more evolutionary method through a
staging that takes a longer time. Modernization in the style of westernization (western developmentalism) means
a process of development that takes any forms or patterns, as well as normative standards and orientation of
cultural values, from the western countries as the parameter of single “progress” [7]. The phenomenon of
cultural-shock borne by local people as a result of the introduction of western values is a plural picture which
often becomes the main claim on Western approach in the development. Such cultural shock occurs in three
realms [4] which are: the realm of “thinking pattern or the realm of ideas”; “attitude pattern or the realm of
attitude”; and facility pattern on the realm of “social supporting system” (technology, institution, law, economic
system, political system, and many others). In the field of socio-economy, the concept of Western-style
modernization gets a critical criticism from unsatisfied community. The said dissatisfaction is rooted in some
facts: first, a development patterned on Western-style modernization has apparently set aside the economic
position of local people, known as the development of underdevelopment [9]. Secondly, Western-style
modernization denies the existence of socio-cultural system within local community, thus it is not resulted in its
progress, but its stagnation instead. In this case, the scholars call it as modernization without development [1].
Thirdly, Western-style modernization is very beneficial for the capital growth and expansion, as well as for the
capital accumulation process of Western and Global economy [6]. Fourth, Western-style modernization is in
fact triggering the processes of social disintegration within the developing community where the spirit of
collectivity (for example: mutual aid) as the essential sociological character is dramatically decaying (missing)
[5].
Human Development
Human capital with high productivity and supported by physical capital with high technical efficiency will be
able to enhance the economic output. Through equitable economic system, the output will be distributed evenly
International Journal of Sciences: Basic and Applied Research (IJSBAR) (2016) Volume 29, No 2, pp 179-192
182
according to the contribution of human capital. Furthermore, through a number of policies, the government will
distribute to groups of individuals or some other communities. However, according to the government’s
obligation to provide access for business and people’s right to get a reasonable work for a decent life, the
government is responsible for guaranteeing the fairness system of business as the foundation in achieving social
guarantee [10].
In economic development, human is acting as the subject which means that the goal of development must be
focused on improving the quality of human life. Although this standard is not the same at first, but people in the
world then agree on the universal value and standard of prosperity. World Bank (UNDP) in its report in 1990
introduced human development index (HDI). This HDI is then translated into Indonesian language to be Indeks
Pembangunan Manusia (1PM). IPM is developed from three components, namely: length of life as measured
with life expectation when firstly born; education level as measured with the combination between literacy rate
within population aged in 15 years old or over (by the weight of 2/3) and average school length (by weight of
1/3); and a decent life level as measured by expenditure per capita which has been adjusted with purchasing
power parity (PPP rupiah).
A successful human development can improve the life quality, which can be indicated from health and
education aspect. Reference [4] have proven that literacy rate, infant mortality, poverty and inequality can
influence economic development in East Asia and Southeast Asia. In addition, human development is also
relating to social and political development. High literacy rate, good health, and equality in opportunity allow
community’s participation in political process and in building a consensus or goals of development.
Participative democracy can enhance social and political stability, thus it improves the efficiency in selecting
investment and service provision.
Local Economic Development (Pengembangan Ekonomi Lokal/ PEL)
The concept of economic development or improvement must be distinguished strictly from economic growth.
According to [13], economic growth which generally measured with gross domestic product (produk domestik
bruto/ PDB) or gross national product (produk nasional bruto/PNB) can be defined as an increase in long-term
capacity and the related state must provide various economic goods for its people. Technology development is
believed to be the basis for sustainable economic growth. In order to realize the potential of growth contained in
a new technology, it must have an “adjustment” regarding the institution, behavior and ideology [5]. Institution
is made as a facility for behaving and thinking, which refers to community’s organization or some of its parts,
and to the behavior of person related with economic-and non-economic activities. Institution with technology of
production refers to the capability to integrate many resources for producing certain goods [9]. Local economic
development (PEL) is not only a new rhetoric, but it represents a fundamental change on the actor and activity
related to economic development, as it is defined below:
Local Economic Development is the process by which actors within cities and towns - “our communities “ -
work collectively with public, business and non-governmental sector partners to create better conditions for
economic growth and employment generation. Through this process they establish and maintain a dynamic
International Journal of Sciences: Basic and Applied Research (IJSBAR) (2016) Volume 29, No 2, pp 179-192
183
entrepreneurial culture and create new community and business wealth in order to enhance the quality of life
for all in the community [14].
In formulating the pattern of regional economic development policy, it needs to conduct an analysis about
economic sectors which are reliable for accelerating regional economic development as the basis of
consideration. The products resulted in this sector are products with comparative excellences, either from the
side of its supply or demand [4]. Meanwhile, from the side of its demand, a leading product is characterized by
its strong demand from the region itself or from other regions [11].
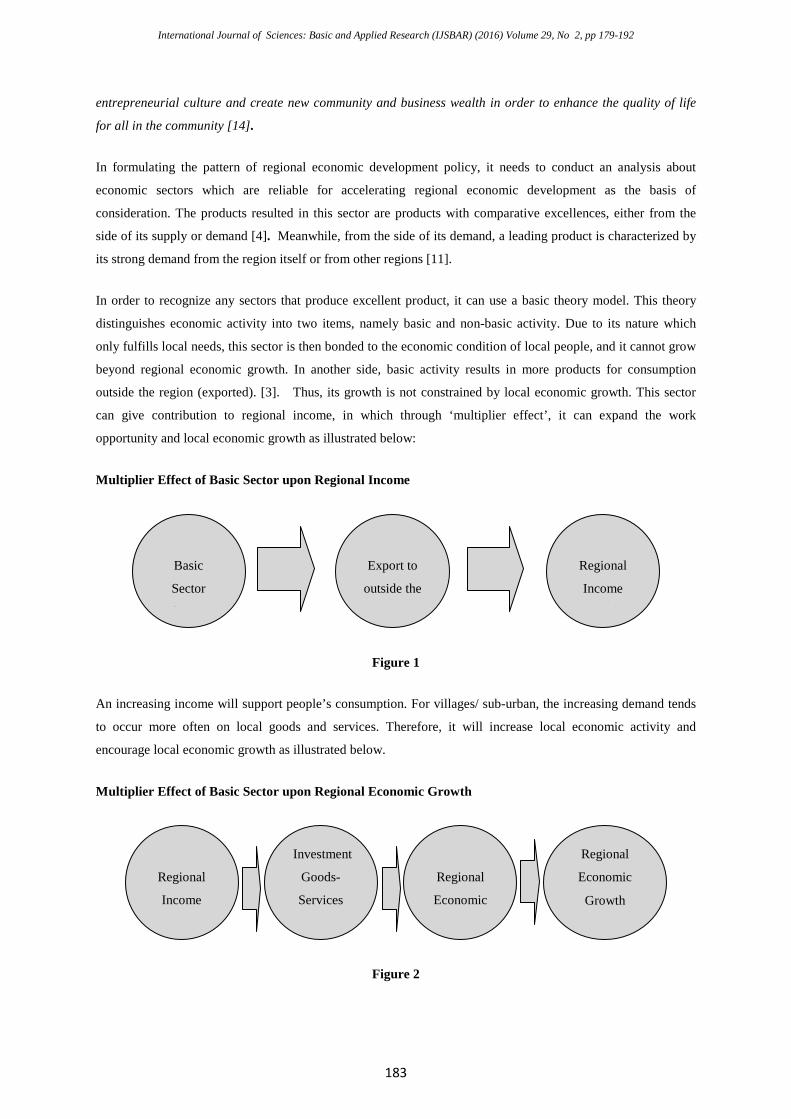
In order to recognize any sectors that produce excellent product, it can use a basic theory model. This theory
distinguishes economic activity into two items, namely basic and non-basic activity. Due to its nature which
only fulfills local needs, this sector is then bonded to the economic condition of local people, and it cannot grow
beyond regional economic growth. In another side, basic activity results in more products for consumption
outside the region (exported). [3]. Thus, its growth is not constrained by local economic growth. This sector
can give contribution to regional income, in which through ‘multiplier effect’, it can expand the work
opportunity and local economic growth as illustrated below:
Multiplier Effect of Basic Sector upon Regional Income
Figure 1
An increasing income will support people’s consumption. For villages/ sub-urban, the increasing demand tends
to occur more often on local goods and services. Therefore, it will increase local economic activity and
encourage local economic growth as illustrated below.
Multiplier Effect of Basic Sector upon Regional Economic Growth
Figure 2
Regional
Income
I i
Regional
Economic
Growth
Regional
Economic
A i i
Investment
Goods-
Services
D d
Basic
Sector
O
Regional
Income
I i
Export to
outside the
i
International Journal of Sciences: Basic and Applied Research (IJSBAR) (2016) Volume 29, No 2, pp 179-192
184
The determination of basic sector which can be used as regional economic growth machine will be in the future
conducted with location quotient (LQ) and shift-share (SS) methods.
Poverty and Productivity
In most developing countries, including Indonesia, poverty has become a major issue in economic development.
Mostly, poor people lives in villages. The consequences from poverty are the absence of choices for poor people
(poverty giving most people no option) to access basic needs, such as the need of (1) education; (2) health; and
(3) economy, limited ownership of production tools, less mastering on technology and lack of skills [2].
Such conditions cause a set of strength that influences each other, in such a way, until it triggers a condition
where a country will live in poverty and experience any difficulties to reach a higher development level [12]
states that a country is poor because it is poor. He explained it with a concept in ‘vicious’ circles of poverty as
illustrated in Figure 3.
Vicious Circles of Poverty
Figure 3
A statement said that “a country is poor because it is poor” is really depressing. It is a statement without ending,
stating that he or she is poor because he or she does not have anything, and due to not having anything, he or she
suffers from poverty.
There are several solutions offered by a number of experts in order to “cut” the vicious circle of poverty. They
People still
underdeveloped
Natural
resources are
less developed
Lack of capital
Low
productivity
Low real
income
Low savings
Low capital
formation
International Journal of Sciences: Basic and Applied Research (IJSBAR) (2016) Volume 29, No 2, pp 179-192
185
are:
1. Exploring the potentials of natural resources;
2. Encouraging people to save;
3. Providing loan for business capital;
4. Enhancing the work productivity.
3. Research Methods
Research Approach
According to the most of technical objectives and for this activity, it applies quantitative approach (positivist) in
order to achieve those objectives. The analytical tools used in this approach are descriptive statistic, location
quotient (LQ), and shift-share (SS).
Analysis Methods
1. Location Quotient (LQ) Analysis
By means of this Location Quotient (LQ) analysis, it can be found out about the leading regional economic sub-
sectors and sector in Biak Regency from the contribution of PQRB, compared to the contribution of same
economic sub-sectors and sectors in Papua Province. The formulation from this analytical tool is as follow:
LQ (x) Regency/ City = q (x) Biak Regency / PDRB Biak Regency
Q (x) Papua /PDRB Papua
From the result of Q calculation, it can be known that if:
1. LQ of a sector is > 1, it can be said as leading sector
2. LQ of a sector is < 1, it can be said as non-leading sector
3. LQ of a sector is = 1, it can be said as the same level with provincial sector
Shift-share analysis
By using shift-share analysis, it will know the changes of regional economic structure in Jayapura Regency, as
compared it with Papua. From the result of said comparison, it can find how much the economic performance in
Biak Regency is based on the excellence of competitive sector in a region. This research is using modification of
notation as used by [9]. The formulation of classical model is as follow.
Dij = Rij + Mij + Cij ............................................................................................................. (1)
Dij = Y*ij – Yij ............................................................................................................................................................................... (2)
International Journal of Sciences: Basic and Applied Research (IJSBAR) (2016) Volume 29, No 2, pp 179-192
186
Rij = Yij-rR ........................................................................................................................... (3)
Mij = Yij (riR – rR) ................................................................................................................ (4)
Cij = Yij (rij – r iR) ................................................................................................................ (5)
In which r ij, r iR and rR represent the regional growth rate as defined each as follow:
rij = (Y*ij – Yij) / Y ij) ......................................................................................................... (6)
riR = (Y*iR – YiR) / Y iR) ....................................................................................................... (7)
rR = (Y*R = YR) / YR) ........................................................................................................ (8)
Afterwards, from the modification of Estaban – Marquillas (E-M), it calculates the influence of its formulation
allocation as follow:
Y’ij = Y j (YiR-YR) ............................................................................................................... (9)
C’ij = Y’ ij (r ij – r iR) .......................................................................................................... (10)
Aij = (Y ij – Y’ ij) (r ij – r iR) ............................................................................................... (11)
Dij = Y ij (rR) + Y ij (r ij – r iR) + Y’ ij – r iR) = (Y ij – Y’ij) (rij – riR) ................................... (12)
Meanwhile, from modification of notation by Arcelus that distinguishes the influence of regional economic
growth, the formulation will be as follow:
K ij = Y’ ij (r j – r R) = (Y ij – Y’ ij) (r j – r R) ...................................................................... (13)
And the diffusion component of regional industry is formulated below:
KI ij = Y’ ij / (r ij – r j) – (r iR - rR) = (Y ij – Y’ij) / (r ij – r j) – (r iR – r R) ............................. (14)
Notes:
Dij = PDRB Growth Changes of Sector I in Biak Regency
Rij = PDRB Growth Changes of Sector I in Papua
Mij = PDRB Growth Changes of Sector I in Biak Regency that influences diffusion of regional
industry
Сij = Competitive Excellence of Sector I that influenced by the growth rate in Biak Regency
International Journal of Sciences: Basic and Applied Research (IJSBAR) (2016) Volume 29, No 2, pp 179-192
187
Yij = PDRB Sector I of Biak Regency in the beginning year of analysis
Y*ij = PDRB Sector I of Biak Regency in the last year of analysis
Yr = Total PDRB in Papua in the year (t)
r iR = Sector I Growth Rate of PDRB in Papua
r R = Growth Rate of PDRB in Papua
rij = Sector I Growth Rate of PDRB in Biak Regency
r j = PDRB Growth Rate in Biak Regency
Y'ij = PDRB in Biak Regency if the growth rate is equalized with the growth rate in Papua
С’ij = Competitive Excellence of Sector I that is influenced by growth rate in Papua = Specialization
level in Biak Regency for each sector
Kij = Achievement of sector I that is influenced by the difference of growth in the city and province
KIij = Achievement of Sector I that is influenced by industrial diffusion in Biak Regency, PDRB
growth of sector I in Biak Regency
4. Result
Location Quotient (LQ) Analysis
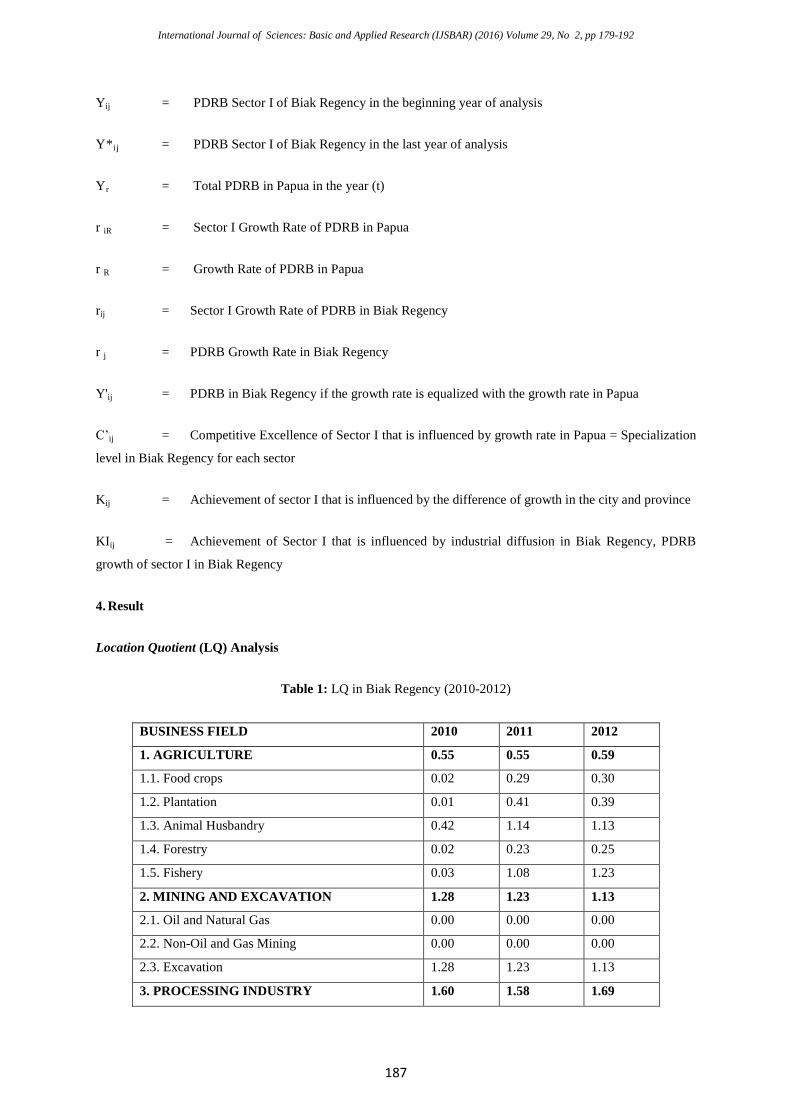
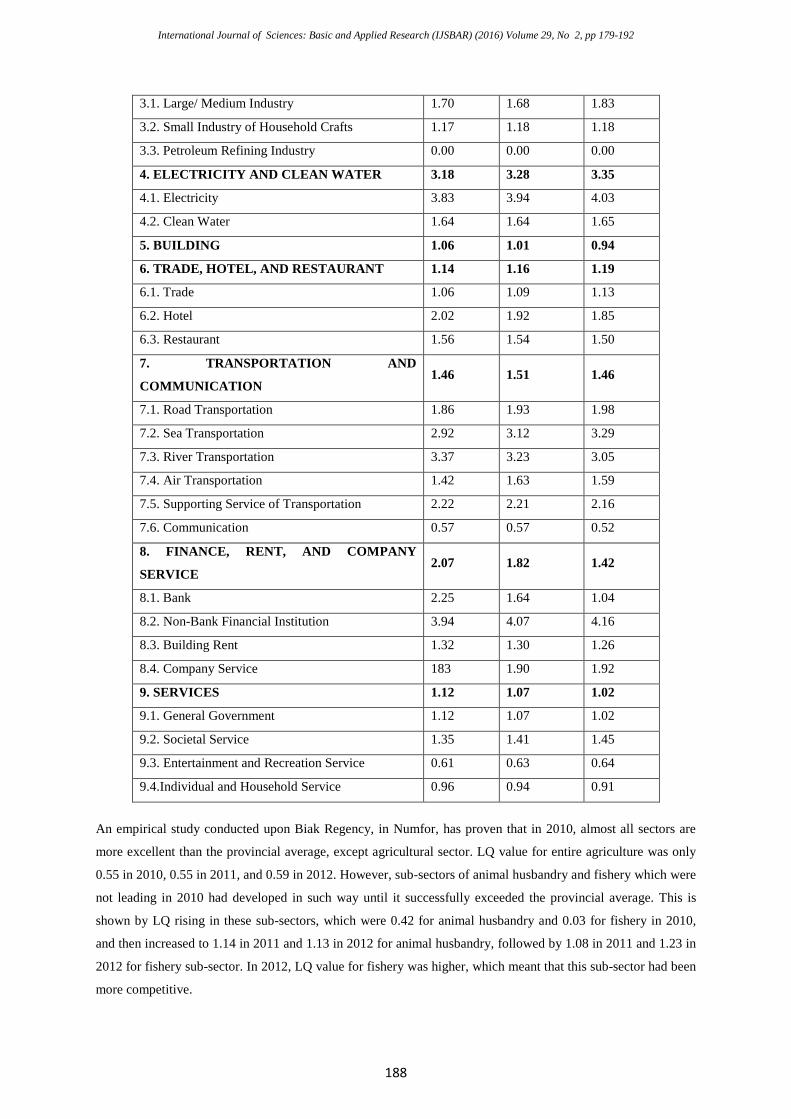
Table 1: LQ in Biak Regency (2010-2012)
BUSINESS FIELD 2010 2011 2012
1. AGRICULTURE 0.55 0.55 0.59
1.1. Food crops 0.02 0.29 0.30
1.2. Plantation 0.01 0.41 0.39
1.3. Animal Husbandry 0.42 1.14 1.13
1.4. Forestry 0.02 0.23 0.25
1.5. Fishery 0.03 1.08 1.23
2. MINING AND EXCAVATION 1.28 1.23 1.13
2.1. Oil and Natural Gas 0.00 0.00 0.00
2.2. Non-Oil and Gas Mining 0.00 0.00 0.00
2.3. Excavation 1.28 1.23 1.13
3. PROCESSING INDUSTRY 1.60 1.58 1.69
International Journal of Sciences: Basic and Applied Research (IJSBAR) (2016) Volume 29, No 2, pp 179-192
188
3.1. Large/ Medium Industry 1.70 1.68 1.83
3.2. Small Industry of Household Crafts 1.17 1.18 1.18
3.3. Petroleum Refining Industry 0.00 0.00 0.00
4. ELECTRICITY AND CLEAN WATER 3.18 3.28 3.35
4.1. Electricity 3.83 3.94 4.03
4.2. Clean Water 1.64 1.64 1.65
5. BUILDING 1.06 1.01 0.94
6. TRADE, HOTEL, AND RESTAURANT 1.14 1.16 1.19
6.1. Trade 1.06 1.09 1.13
6.2. Hotel 2.02 1.92 1.85
6.3. Restaurant 1.56 1.54 1.50
7. TRANSPORTATION AND
COMMUNICATION 1.46 1.51 1.46
7.1. Road Transportation 1.86 1.93 1.98
7.2. Sea Transportation 2.92 3.12 3.29
7.3. River Transportation 3.37 3.23 3.05
7.4. Air Transportation 1.42 1.63 1.59
7.5. Supporting Service of Transportation 2.22 2.21 2.16
7.6. Communication 0.57 0.57 0.52
8. FINANCE, RENT, AND COMPANY
SERVICE 2.07 1.82 1.42
8.1. Bank 2.25 1.64 1.04
8.2. Non-Bank Financial Institution 3.94 4.07 4.16
8.3. Building Rent 1.32 1.30 1.26
8.4. Company Service 183 1.90 1.92
9. SERVICES 1.12 1.07 1.02
9.1. General Government 1.12 1.07 1.02
9.2. Societal Service 1.35 1.41 1.45
9.3. Entertainment and Recreation Service 0.61 0.63 0.64
9.4.Individual and Household Service 0.96 0.94 0.91
An empirical study conducted upon Biak Regency, in Numfor, has proven that in 2010, almost all sectors are
more excellent than the provincial average, except agricultural sector. LQ value for entire agriculture was only
0.55 in 2010, 0.55 in 2011, and 0.59 in 2012. However, sub-sectors of animal husbandry and fishery which were
not leading in 2010 had developed in such way until it successfully exceeded the provincial average. This is
shown by LQ rising in these sub-sectors, which were 0.42 for animal husbandry and 0.03 for fishery in 2010,
and then increased to 1.14 in 2011 and 1.13 in 2012 for animal husbandry, followed by 1.08 in 2011 and 1.23 in
2012 for fishery sub-sector. In 2012, LQ value for fishery was higher, which meant that this sub-sector had been
more competitive.
International Journal of Sciences: Basic and Applied Research (IJSBAR) (2016) Volume 29, No 2, pp 179-192
189
Shift Share Analysis (SSA)
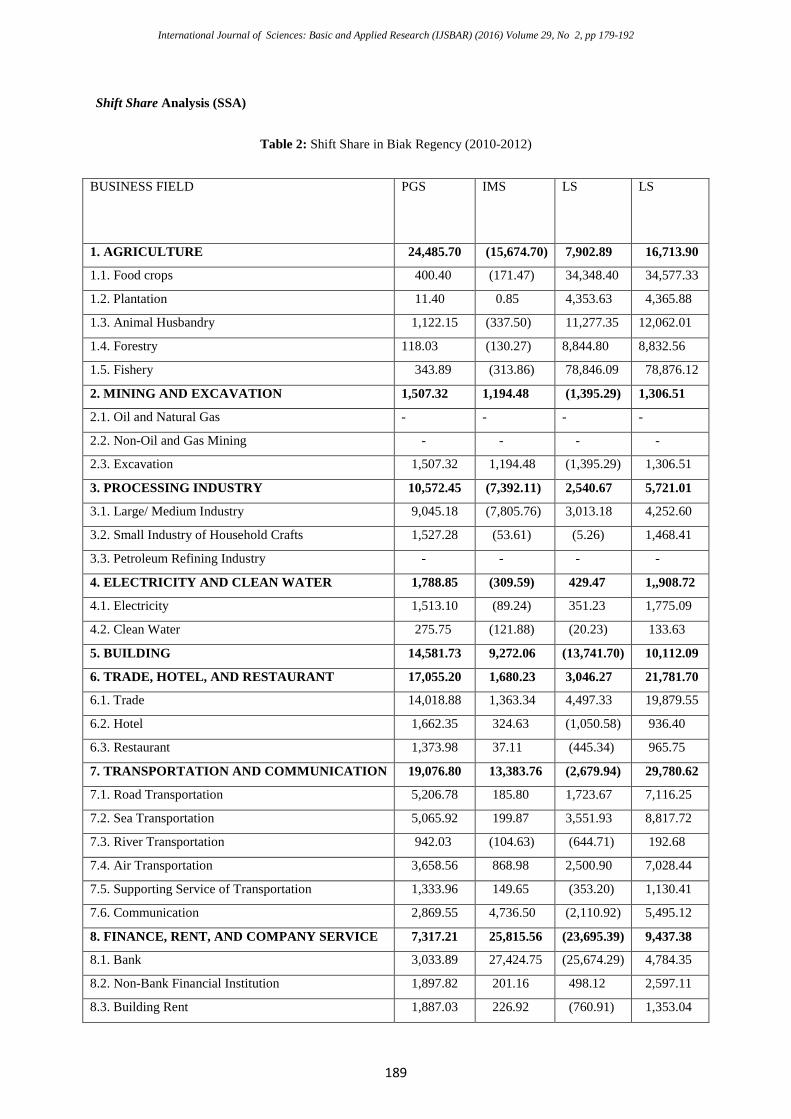
Table 2: Shift Share in Biak Regency (2010-2012)
BUSINESS FIELD
PGS
IMS
LS
LS
1. AGRICULTURE 24,485.70 (15,674.70) 7,902.89 16,713.90
1.1. Food crops 400.40 (171.47) 34,348.40 34,577.33
1.2. Plantation 11.40 0.85 4,353.63 4,365.88
1.3. Animal Husbandry 1,122.15 (337.50) 11,277.35 12,062.01
1.4. Forestry 118.03 (130.27) 8,844.80 8,832.56
1.5. Fishery 343.89 (313.86) 78,846.09 78,876.12
2. MINING AND EXCAVATION 1,507.32 1,194.48 (1,395.29) 1,306.51
2.1. Oil and Natural Gas - - - -
2.2. Non-Oil and Gas Mining - - - -
2.3. Excavation 1,507.32 1,194.48 (1,395.29) 1,306.51
3. PROCESSING INDUSTRY 10,572.45 (7,392.11) 2,540.67 5,721.01
3.1. Large/ Medium Industry 9,045.18 (7,805.76) 3,013.18 4,252.60
3.2. Small Industry of Household Crafts 1,527.28 (53.61) (5.26) 1,468.41
3.3. Petroleum Refining Industry - - - -
4. ELECTRICITY AND CLEAN WATER 1,788.85 (309.59) 429.47 1,,908.72
4.1. Electricity 1,513.10 (89.24) 351.23 1,775.09
4.2. Clean Water 275.75 (121.88) (20.23) 133.63
5. BUILDING 14,581.73 9,272.06 (13,741.70) 10,112.09
6. TRADE, HOTEL, AND RESTAURANT 17,055.20 1,680.23 3,046.27 21,781.70
6.1. Trade 14,018.88 1,363.34 4,497.33 19,879.55
6.2. Hotel 1,662.35 324.63 (1,050.58) 936.40
6.3. Restaurant 1,373.98 37.11 (445.34) 965.75
7. TRANSPORTATION AND COMMUNICATION 19,076.80 13,383.76 (2,679.94) 29,780.62
7.1. Road Transportation 5,206.78 185.80 1,723.67 7,116.25
7.2. Sea Transportation 5,065.92 199.87 3,551.93 8,817.72
7.3. River Transportation 942.03 (104.63) (644.71) 192.68
7.4. Air Transportation 3,658.56 868.98 2,500.90 7,028.44
7.5. Supporting Service of Transportation 1,333.96 149.65 (353.20) 1,130.41
7.6. Communication 2,869.55 4,736.50 (2,110.92) 5,495.12
8. FINANCE, RENT, AND COMPANY SERVICE 7,317.21 25,815.56 (23,695.39) 9,437.38
8.1. Bank 3,033.89 27,424.75 (25,674.29) 4,784.35
8.2. Non-Bank Financial Institution 1,897.82 201.16 498.12 2,597.11
8.3. Building Rent 1,887.03 226.92 (760.91) 1,353.04
International Journal of Sciences: Basic and Applied Research (IJSBAR) (2016) Volume 29, No 2, pp 179-192
190
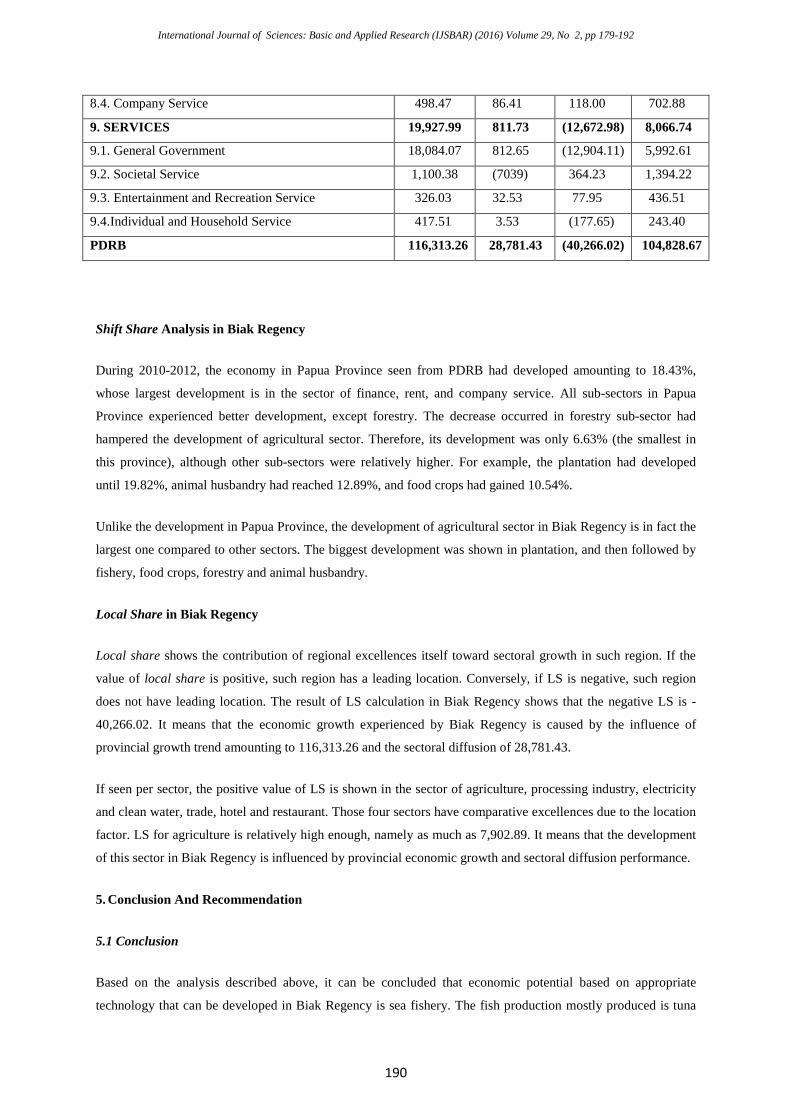
8.4. Company Service 498.47 86.41 118.00 702.88
9. SERVICES 19,927.99 811.73 (12,672.98) 8,066.74
9.1. General Government 18,084.07 812.65 (12,904.11) 5,992.61
9.2. Societal Service 1,100.38 (7039) 364.23 1,394.22
9.3. Entertainment and Recreation Service 326.03 32.53 77.95 436.51
9.4.Individual and Household Service 417.51 3.53 (177.65) 243.40
PDRB 116,313.26 28,781.43 (40,266.02) 104,828.67
Shift Share Analysis in Biak Regency
During 2010-2012, the economy in Papua Province seen from PDRB had developed amounting to 18.43%,
whose largest development is in the sector of finance, rent, and company service. All sub-sectors in Papua
Province experienced better development, except forestry. The decrease occurred in forestry sub-sector had
hampered the development of agricultural sector. Therefore, its development was only 6.63% (the smallest in
this province), although other sub-sectors were relatively higher. For example, the plantation had developed
until 19.82%, animal husbandry had reached 12.89%, and food crops had gained 10.54%.
Unlike the development in Papua Province, the development of agricultural sector in Biak Regency is in fact the
largest one compared to other sectors. The biggest development was shown in plantation, and then followed by
fishery, food crops, forestry and animal husbandry.
Local Share in Biak Regency
Local share shows the contribution of regional excellences itself toward sectoral growth in such region. If the
value of local share is positive, such region has a leading location. Conversely, if LS is negative, such region
does not have leading location. The result of LS calculation in Biak Regency shows that the negative LS is -
40,266.02. It means that the economic growth experienced by Biak Regency is caused by the influence of
provincial growth trend amounting to 116,313.26 and the sectoral diffusion of 28,781.43.
If seen per sector, the positive value of LS is shown in the sector of agriculture, processing industry, electricity
and clean water, trade, hotel and restaurant. Those four sectors have comparative excellences due to the location
factor. LS for agriculture is relatively high enough, namely as much as 7,902.89. It means that the development
of this sector in Biak Regency is influenced by provincial economic growth and sectoral diffusion performance.
5. Conclusion And Recommendation
5.1 Conclusion
Based on the analysis described above, it can be concluded that economic potential based on appropriate
technology that can be developed in Biak Regency is sea fishery. The fish production mostly produced is tuna
International Journal of Sciences: Basic and Applied Research (IJSBAR) (2016) Volume 29, No 2, pp 179-192
191
and cekalang. The center for capture fishery in Biak Regency is located in the District of Biak Utara Timur.
Barat and Biak Kota.
5.2 Recommendation
Appropriate capture technology done by fishermen in Biak is traditional capture by using nets and hooks, as not
destructing the marine ecosystem. Thus, the sustainability of fish reproduction can be preserved. However, for
optimizing their capture, they need large and strong nets and hooks, as well as basing on the information about
weather forecasts and fish movements (it can be supplied by the government).
In order to be more optimizing the fishery production, the fishermen shall establish a group of fishermen, in
which the capitalization can be put together in order to be bigger and more capable in providing stronger
equipment and tools, such as bigger boat and having wider range.
The improvement of fish production, especially demersal fish, can be attempted by marine fish cultivation with
floating net cage, as long as it fulfills technical requirements, such as its wave and wind condition is not too
harsh, free of pollution, and other technical aspects.
References
[1]. Anonymous, 2003. Using employment data to Better Understand Your Local economy, Tool 4: Shift
Share Analysis Help Identify Local Growth Engines. Pennsylvania State University;
[2]. Aswandi, Hairul and Mudrajad Kuncoro., 2002. Evaluation Determination Leading Region: Empirical
Study from 1993 to 1999 in South Kalimantan in Indonesia Journal of Economics and Business, Vol.
17, No. 1 .; Department of Marine and Fisheries of the Republic of Indonesia., 2003, News: Monitoring
Sumberdava, VMS. Means Oversight In SDKP Utilization Control;
[3]. Djoyohadikusumo, Sumitro., 1994. Development of Economic Thought; Basic Theory of Economic
Growth and Economic Development. LP3ES, Jakarta;
[4]. Hendayana, Rachmat., 2003. Application Methods Location Quotient (LP) in the determination of the
National Commodities. In the Journal of Agricultural Informatics, Vol. 12. December;
[5]. Kuncoro, Mudrajad., 2003. Economic Development; Theory. Problems and Policies. UPP AMP
YKPN. Yogyakarta;
[6]. Malpuzzi, Stephen., 2002. Local Economic Development and Its Finance: An Introduction. The Center
for Urban Land Economics Research. The University Avenue Madison, March 19;
[7]. Perkins, Dwight H; Steven Radelet, et. al., 2001. Economics of Development. W.W. Norton &
Company;
International Journal of Sciences: Basic and Applied Research (IJSBAR) (2016) Volume 29, No 2, pp 179-192
192
[8]. Prasetyo Soepono (2001). Teori Pertumbuhan Berbasis Ekonomi (eksport) Posisi dan Sumbangannya
bagi Perbendaharaan Alat-alat Analisis Regional. Jurnal Ekonomi dan Bisnis Indonesia. Vol.16 No.1.
[9]. Sicat, Gerardo P. & Arndt., 1991. Economics for Context Indonesia. LP3ES;
[10]. Sjafrizal. 2008. Regional Economy; Theory and Applications. Baduose Media;
[11]. Syafaat, N dan Supena Friyatno. 2000. Analisis Dampak Krisis Ekonomi Terhadap Kesempatan Kerja
dan Identifikasi Komoditas Andalan Sektor Pertanian Di Wilayah Sulawesi: Pendekatan Input-Output,
Ekonomi Dan Keungan Indonesia, Vol, XLVIII No.4.
[12]. Sadono Sukirno, 1997, Pengantar Teori Mikro Ekonomi, PT. Rajawali Grafindo Persada, Jakarta.
[13]. Todaro.,M.P. (2000). Economic Development (7th ed.) New York; Addition Wesley Longman, Inc.
[14]. World Bank, 2003, Doing Business Survey 2004, www.doin