Embed Size (px)
Citation preview

The learner is not a black box: Measuring emotion, engagement and learning while playing
Prof. Pierre-Majorique Léger, Ph.D.Co-director Tech3Lab
Prof. Patrick Charland,Ph.D.Co-directeur NeuroLab
#uxt3l @tech3lab_hec
Billund, Denmark. May 5th 2015
© Copyright Tech3Lab 2015
The learner is not a black box
PIERRE-MAJORIQUE LÉGER, Ph.D.Co-director Tech3Lab HEC Montreal
PAtRICk ChARLAnD, Ph.D.Co-director NeuroLabUQAM
© Copyright Tech3Lab 2015
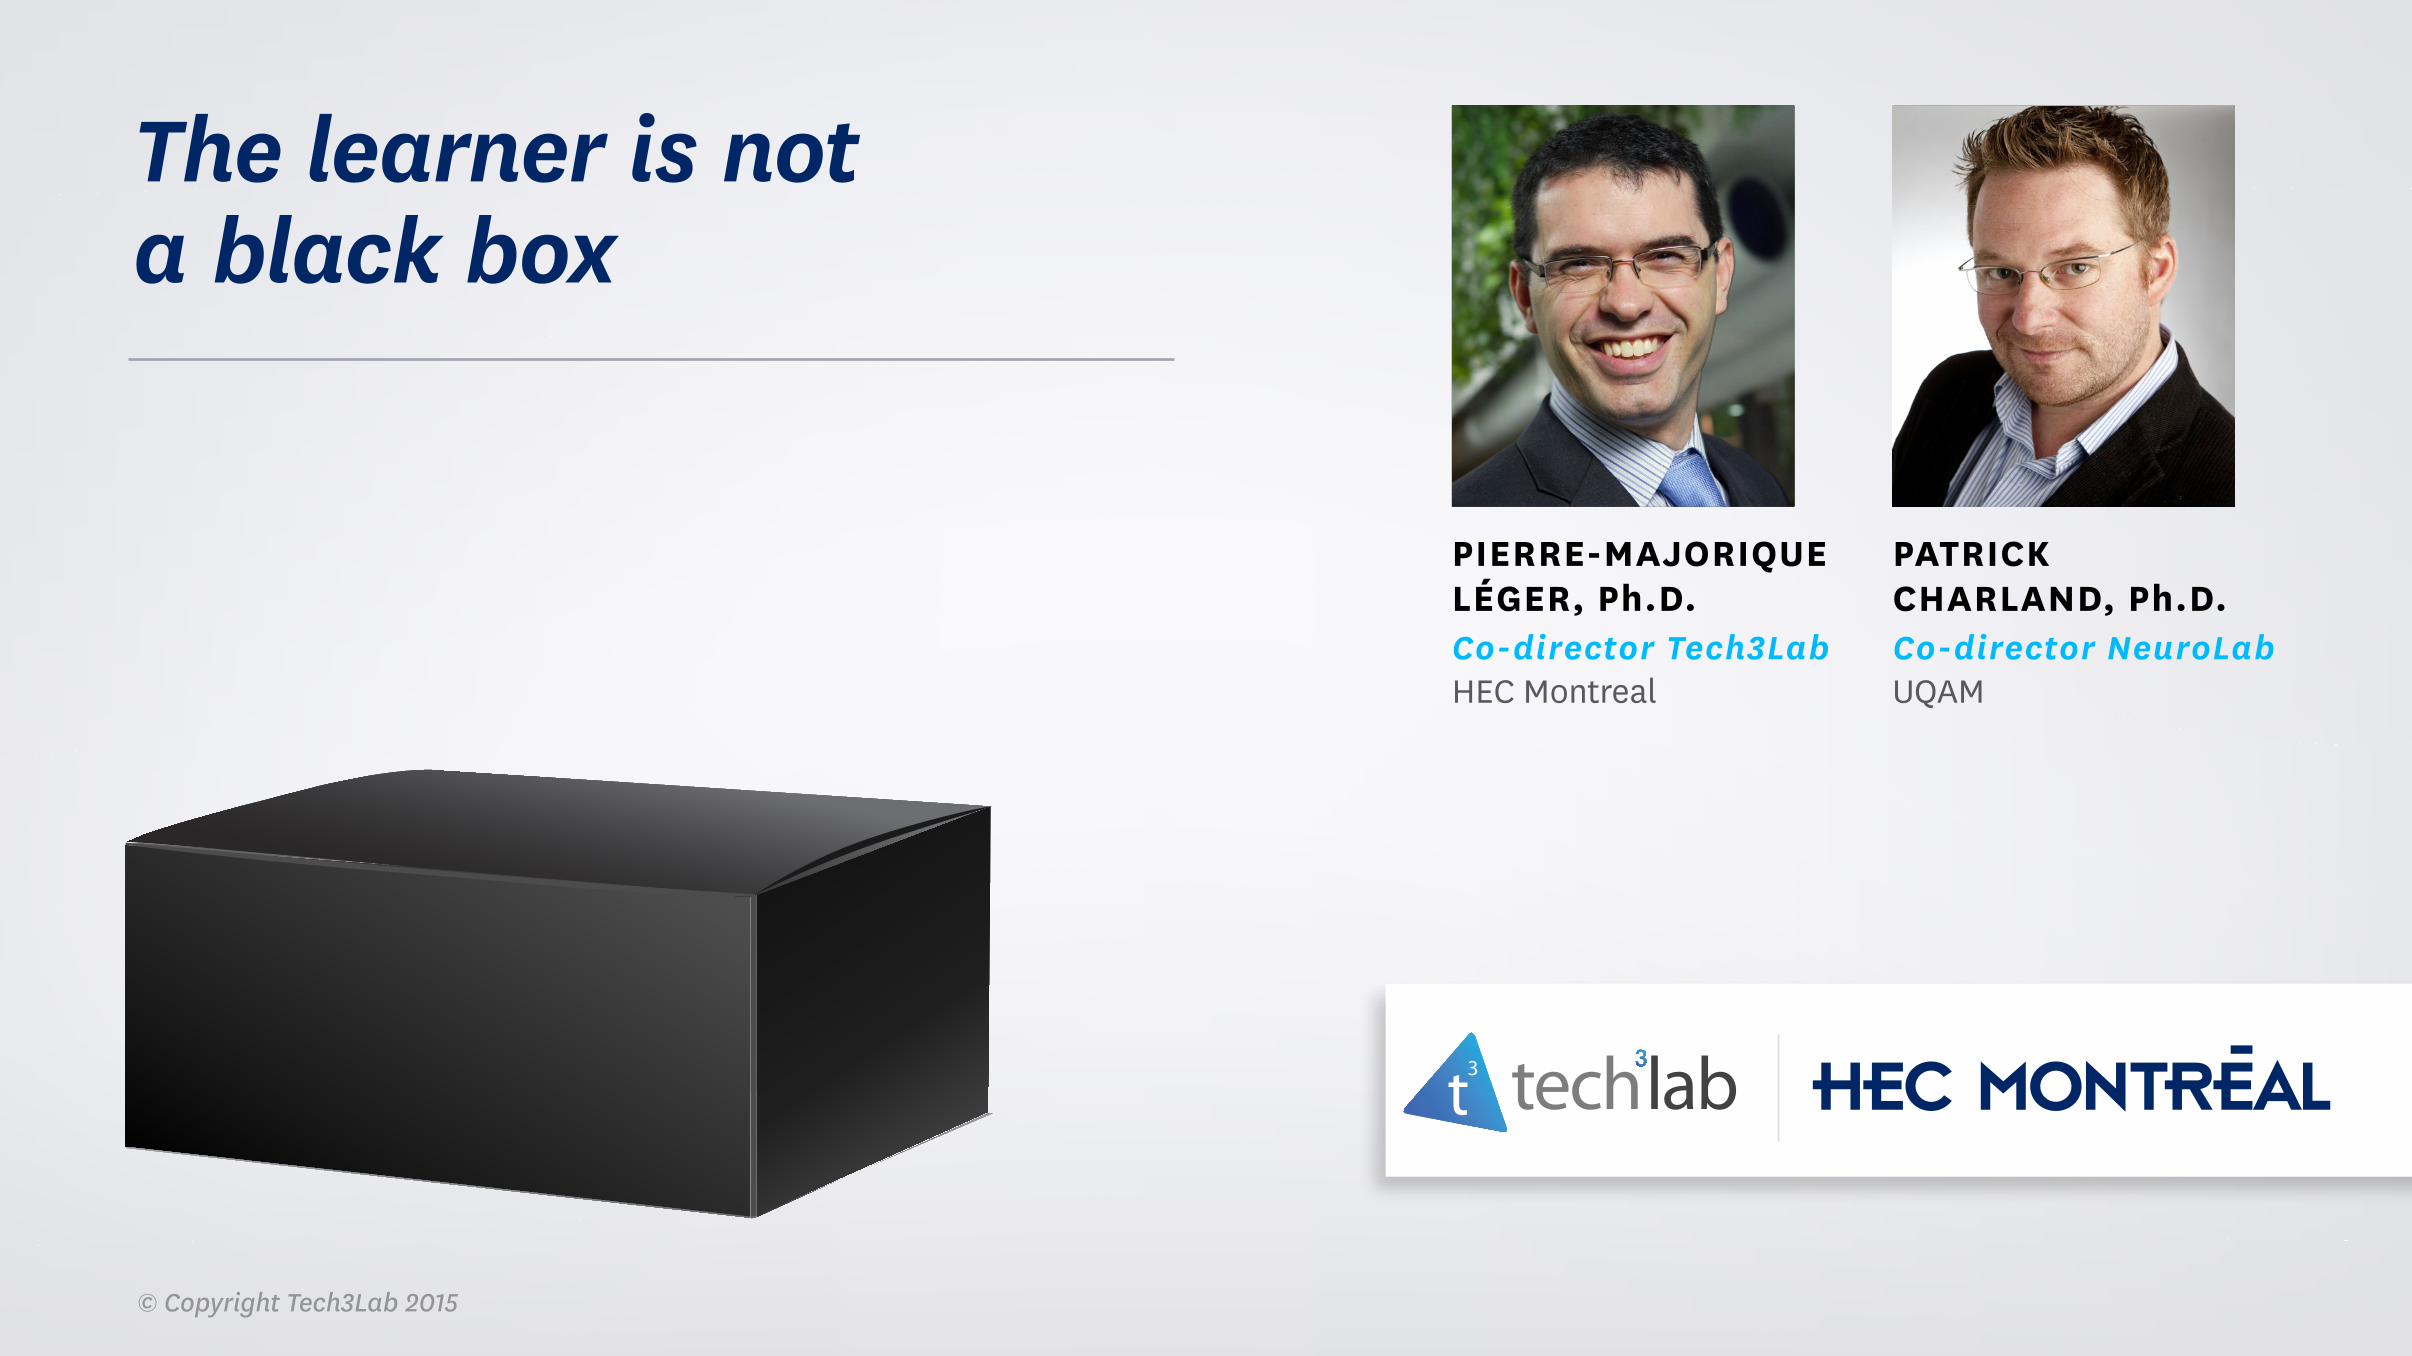
Prof. Pierre-Majorique Léger, Ph.D.
Full ProfessorDirector ERPsim LabCo-director Tech3Lab [email protected]
GRAD stUDIEs
POst-DOCtORAtE
LAbs VIsItInG PROfEssOR
Lab Serious games to learn enterprise systems and business analytics
https://www.researchgate.net/profile/Pierre-Majorique_Leger
© Copyright Tech3Lab 2015
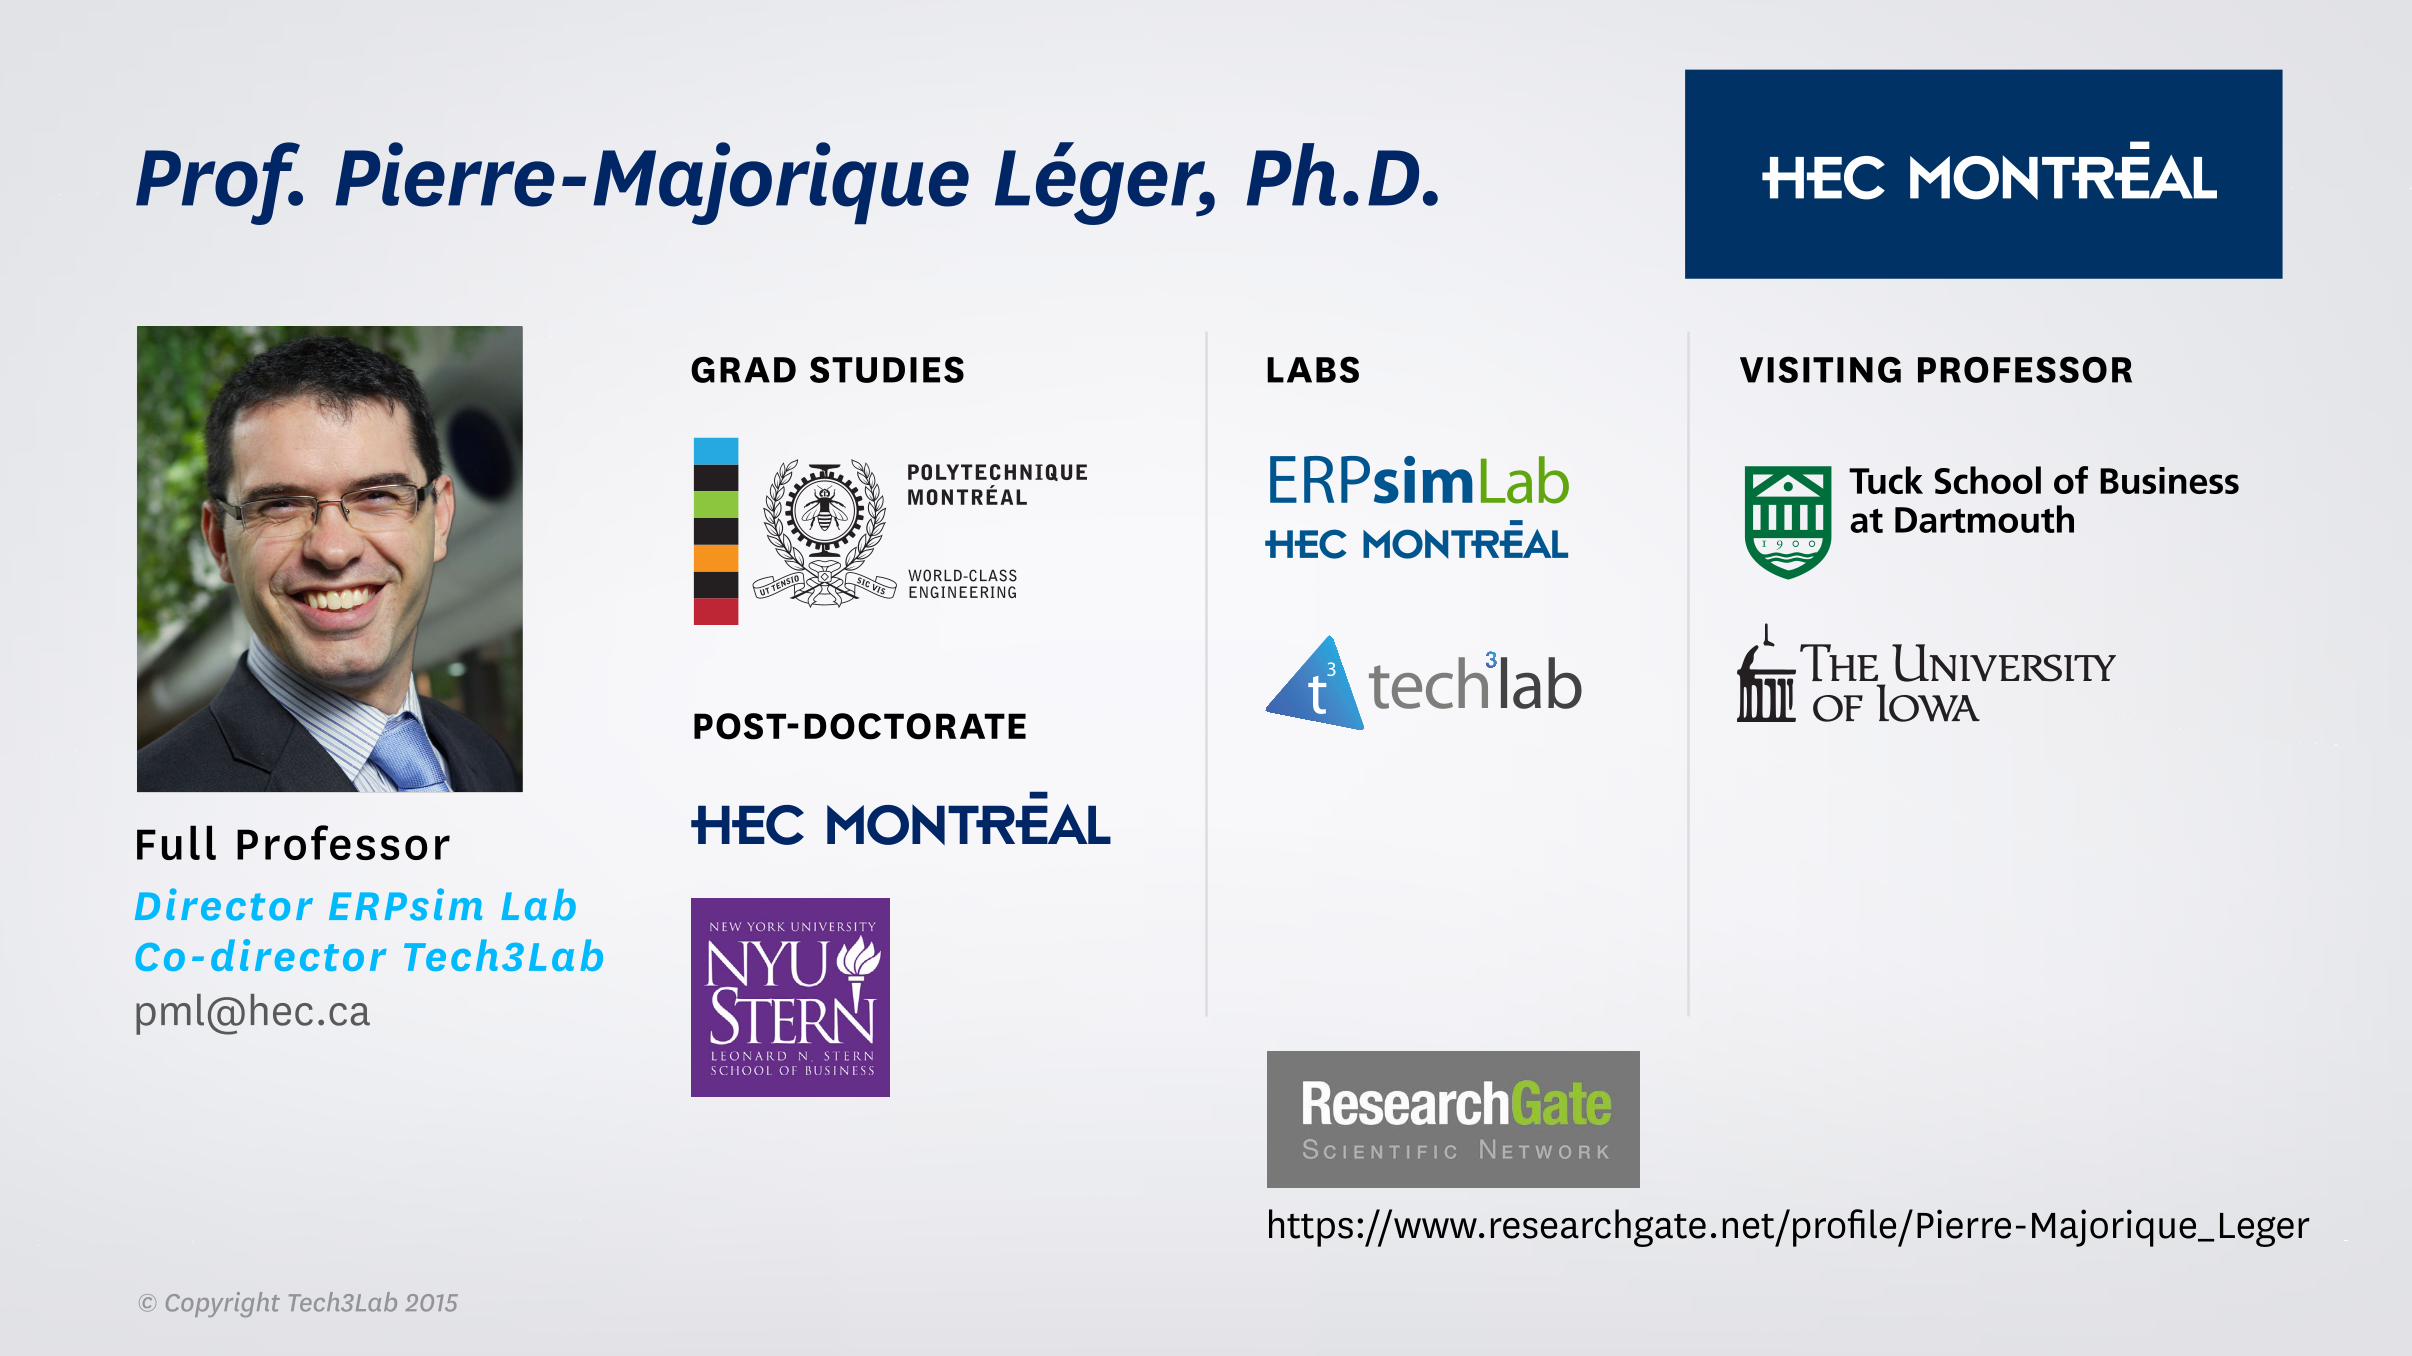
ERPsim: A simulation game to learn business analytics
Since 2009, more than
17000 simulations in 225 universities around the world.
22 000 students used ERPsim in 2014
1000 facultytrained on ERPsim worldwide
ACADEMIC COMMERCIAL RESEARCHSeveral researchers have started using ERPsim to run experimental protocol in IS.
Visit http://erpsim.hec.ca/en/cite
Many large organizations, such as Boeing, Coca-Cola, 3M, Kraft, Caterpillar, Pfizer and SAP, are using ERPsim to train their end-users on ERP systems.
stAtIstICs On ERPsIM In thE ACADEMIC wORLD
© Copyright Tech3Lab 2015
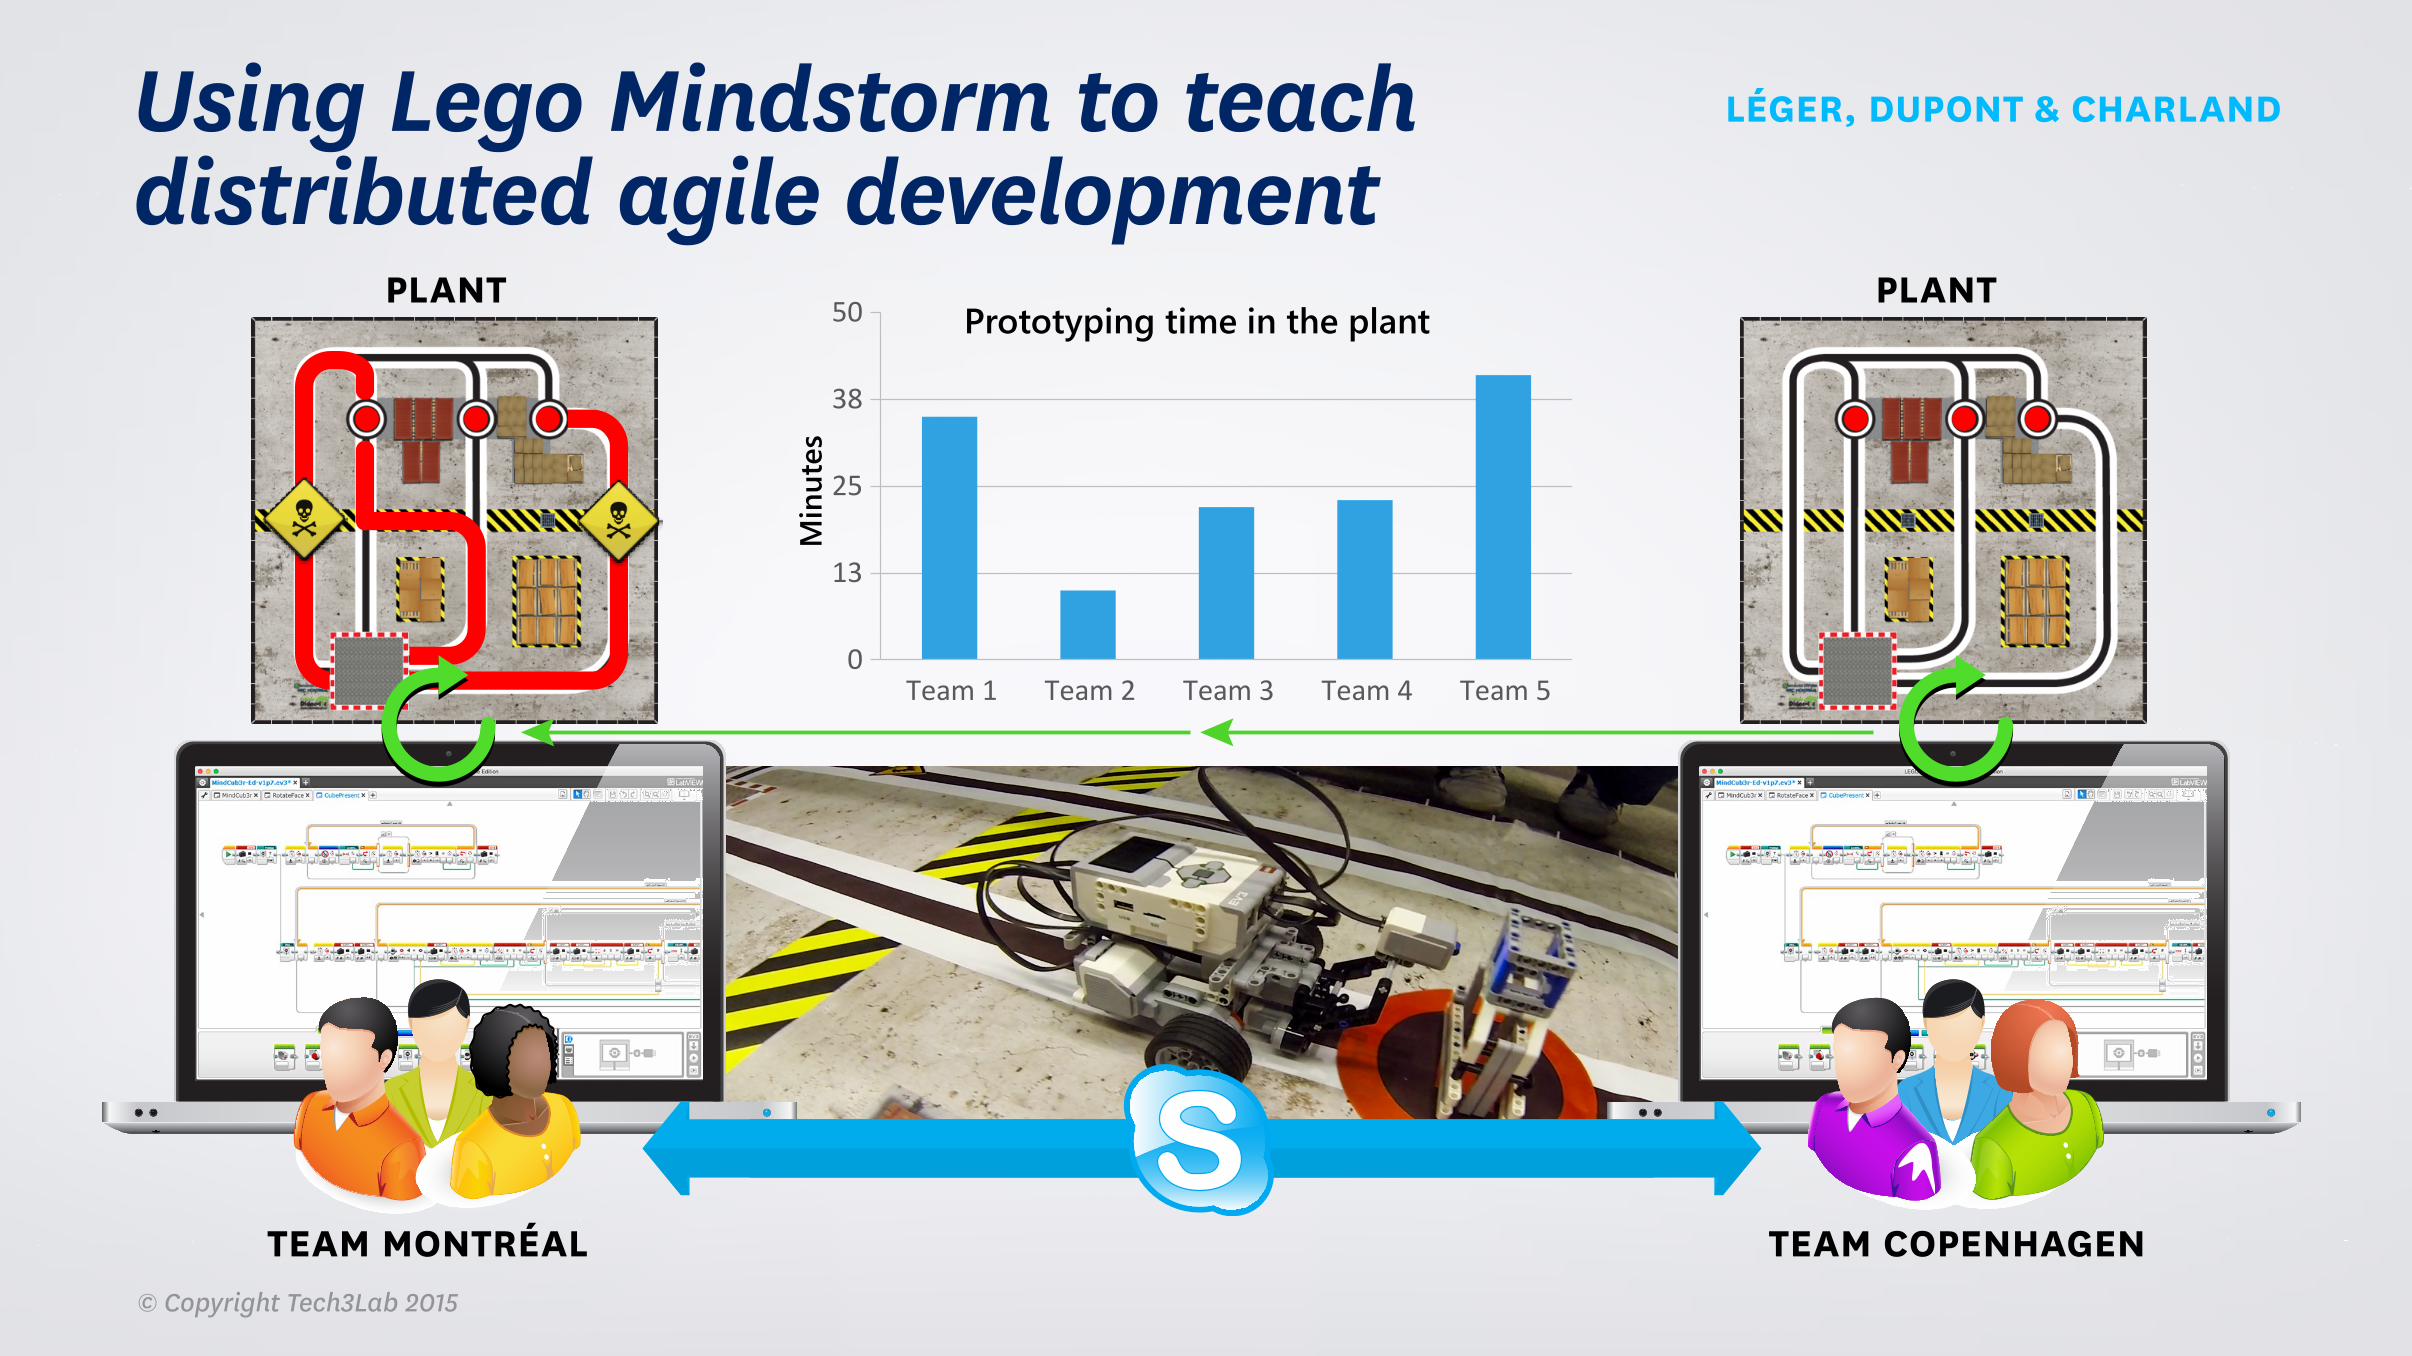
0
13
25
38
50
Team 1 Team 2 Team 3 Team 4 Team 5
Min
utes
Prototyping time in the plant
Using Lego Mindstorm to teach distributed agile development
PLAnt
tEAM MOntRÉAL tEAM COPEnhAGEn
PLAnt
LÉGER, DUPOnt & ChARLAnD
© Copyright Tech3Lab 2015
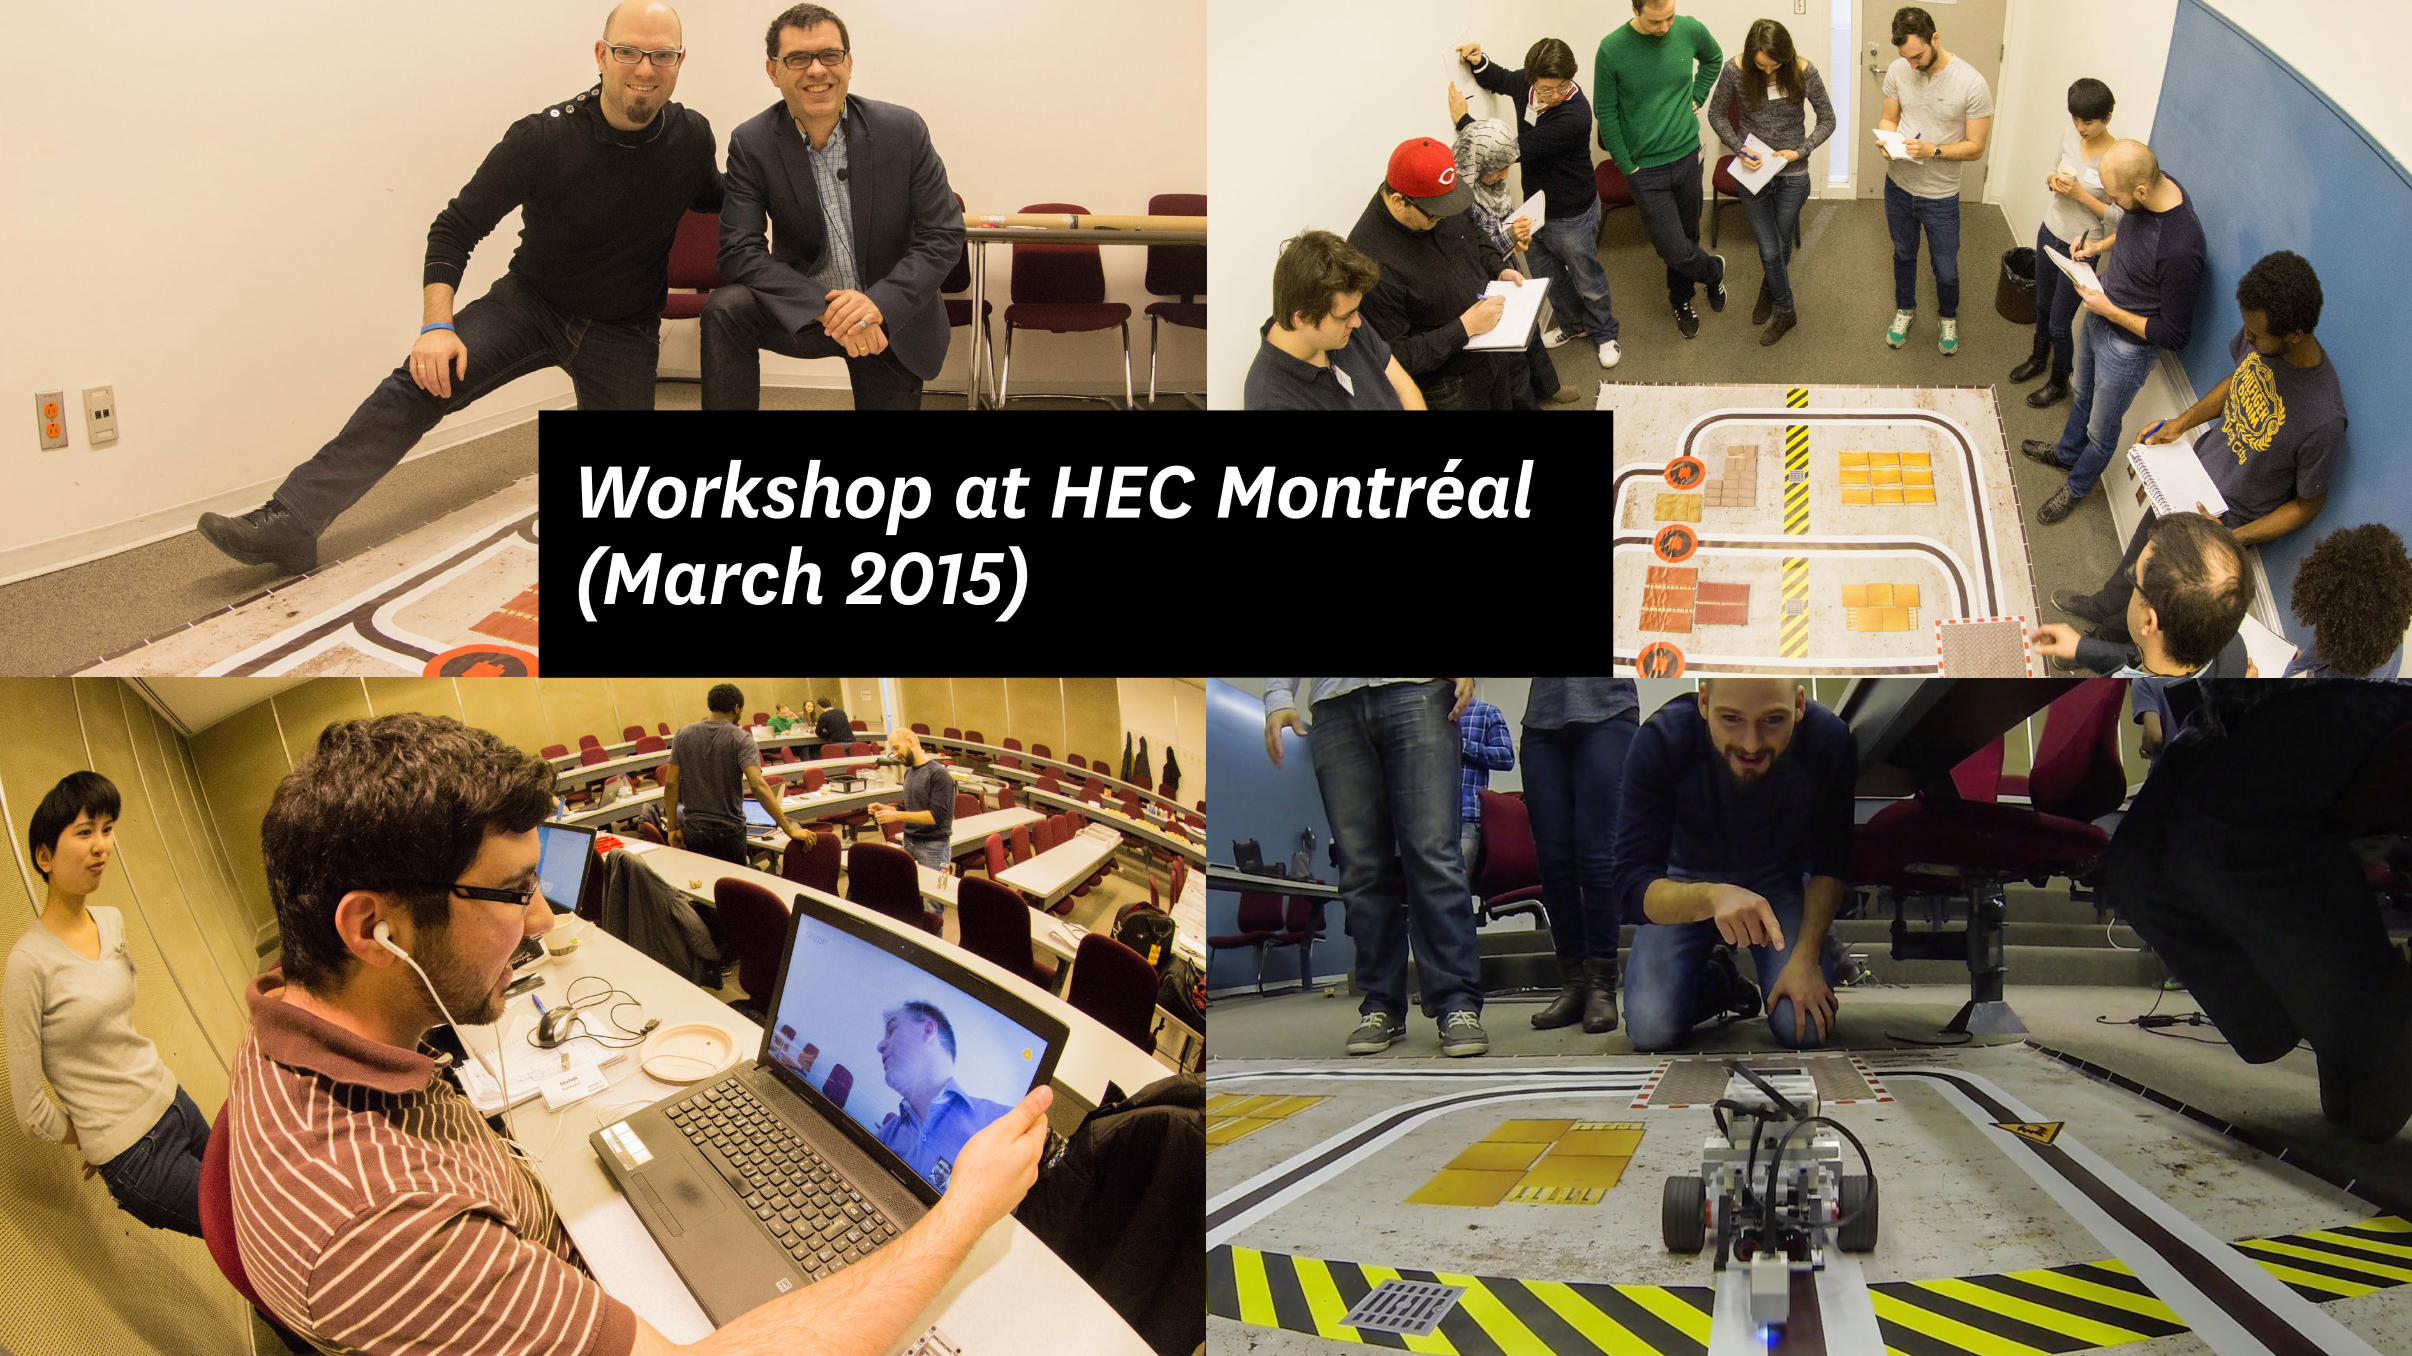
Workshop at HEC Montréal (March 2015)
© Copyright Tech3Lab 2015
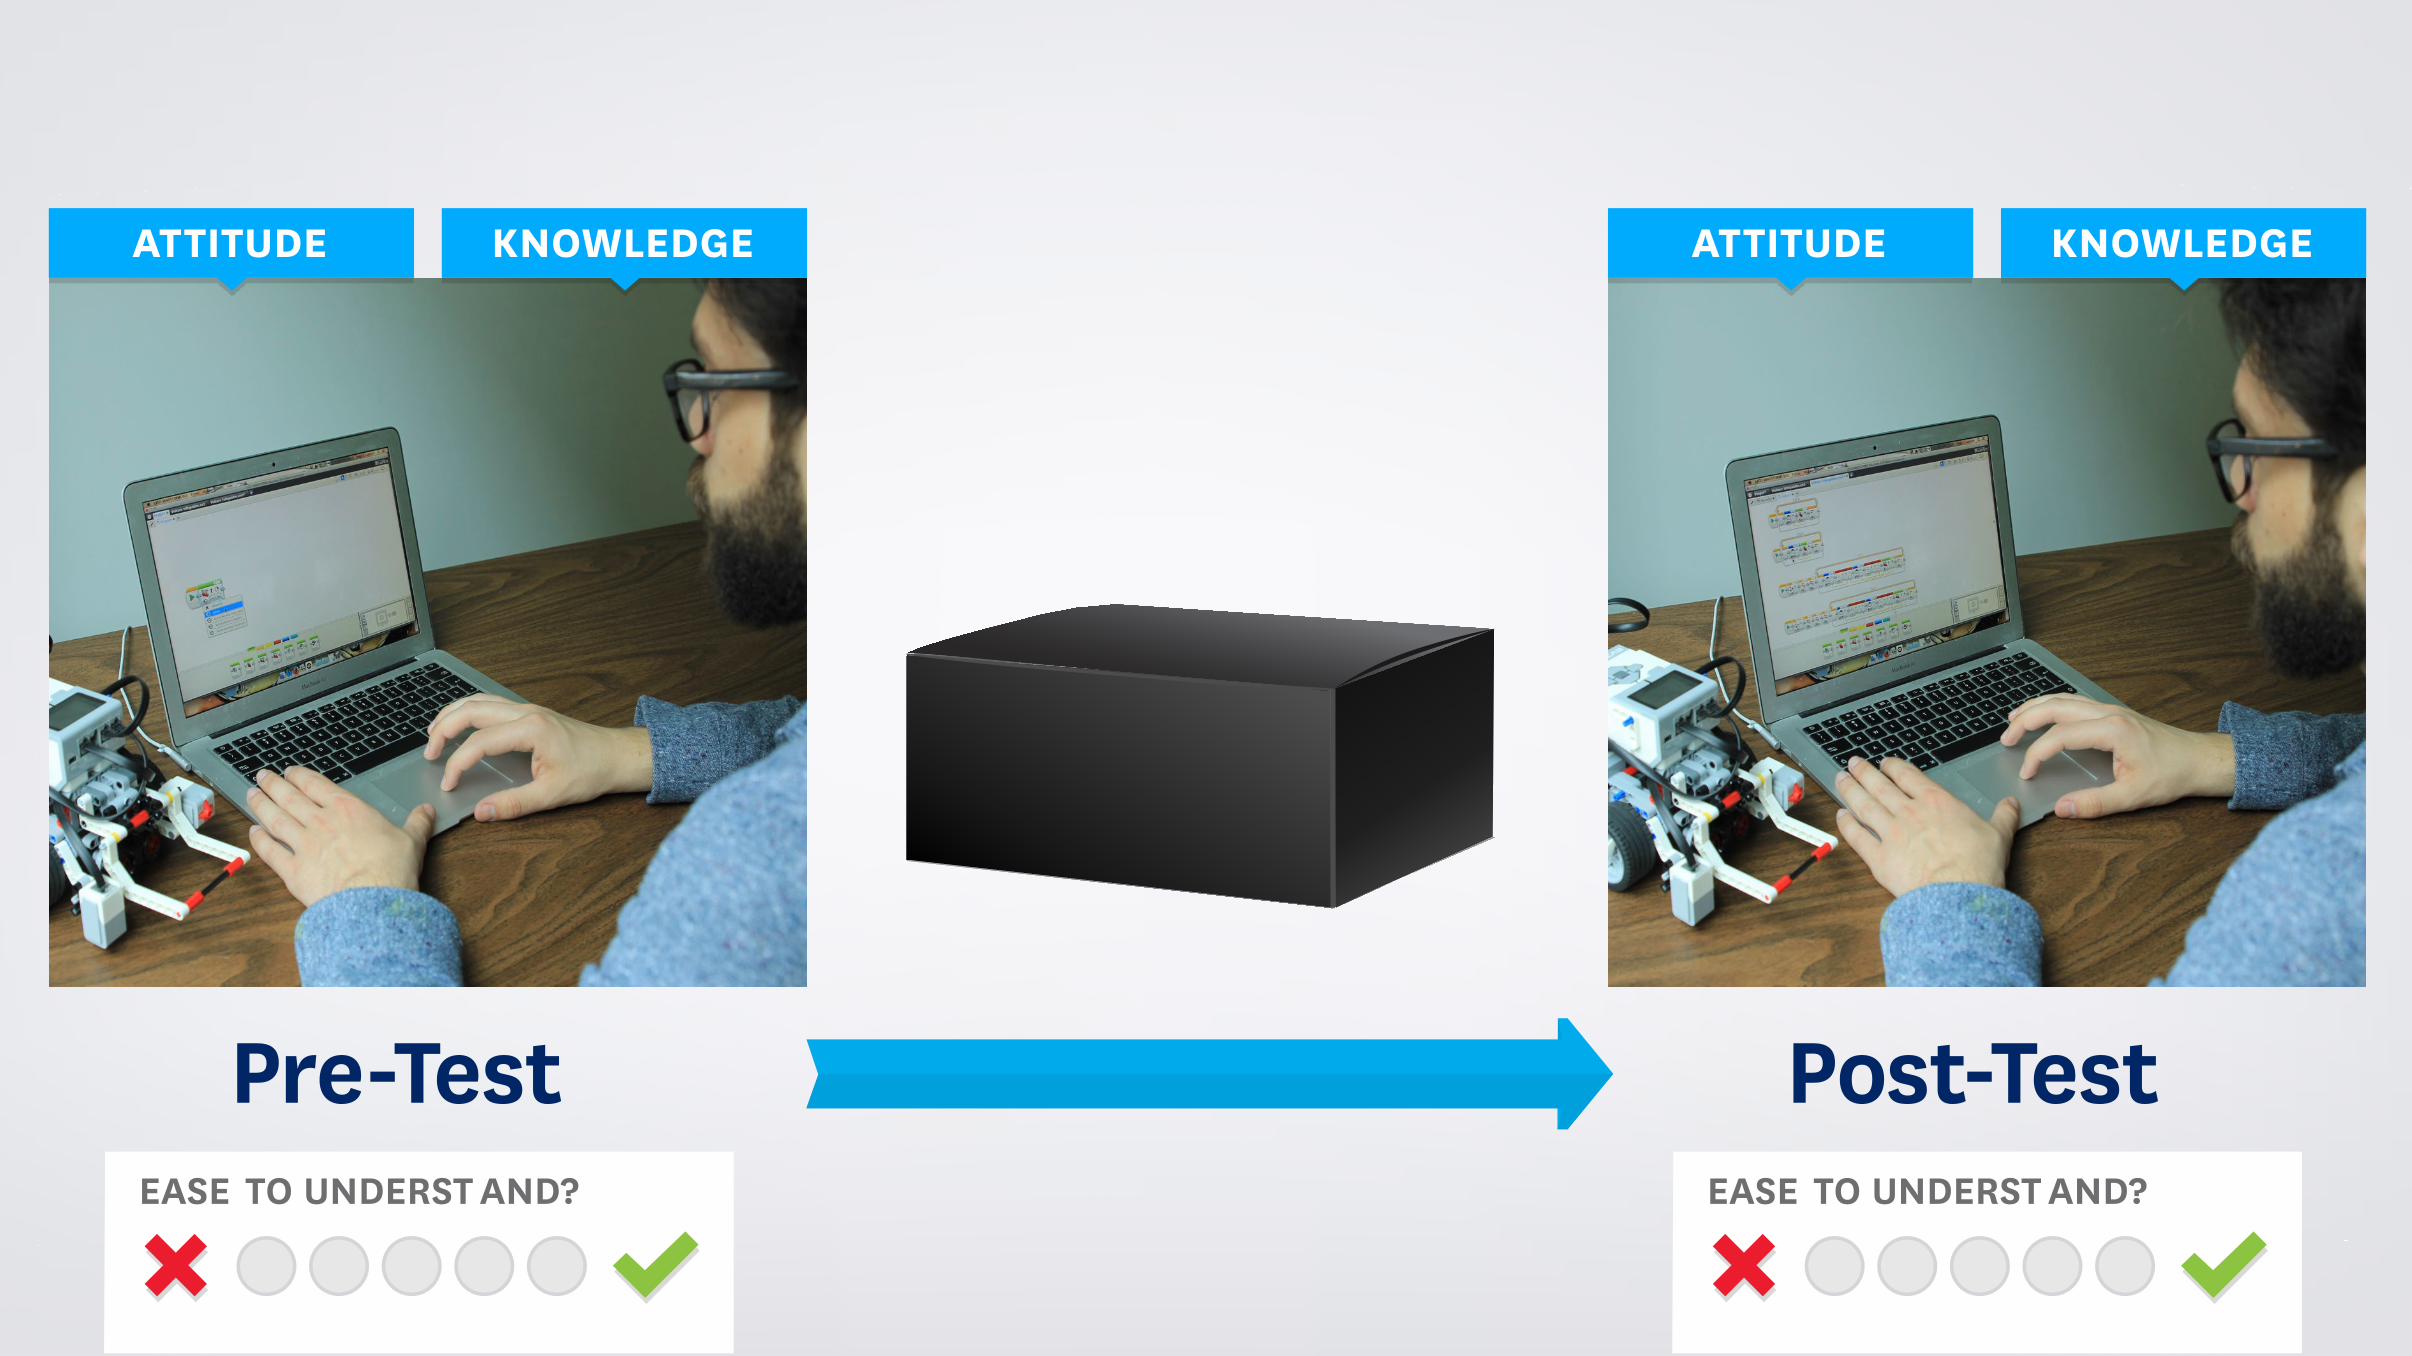
EASE TO UNDERST AND? EASE TO UNDERST AND?
Pre-Test Post-Test
AttItUDE knOwLEDGE AttItUDE knOwLEDGE
© Copyright Tech3Lab 2015
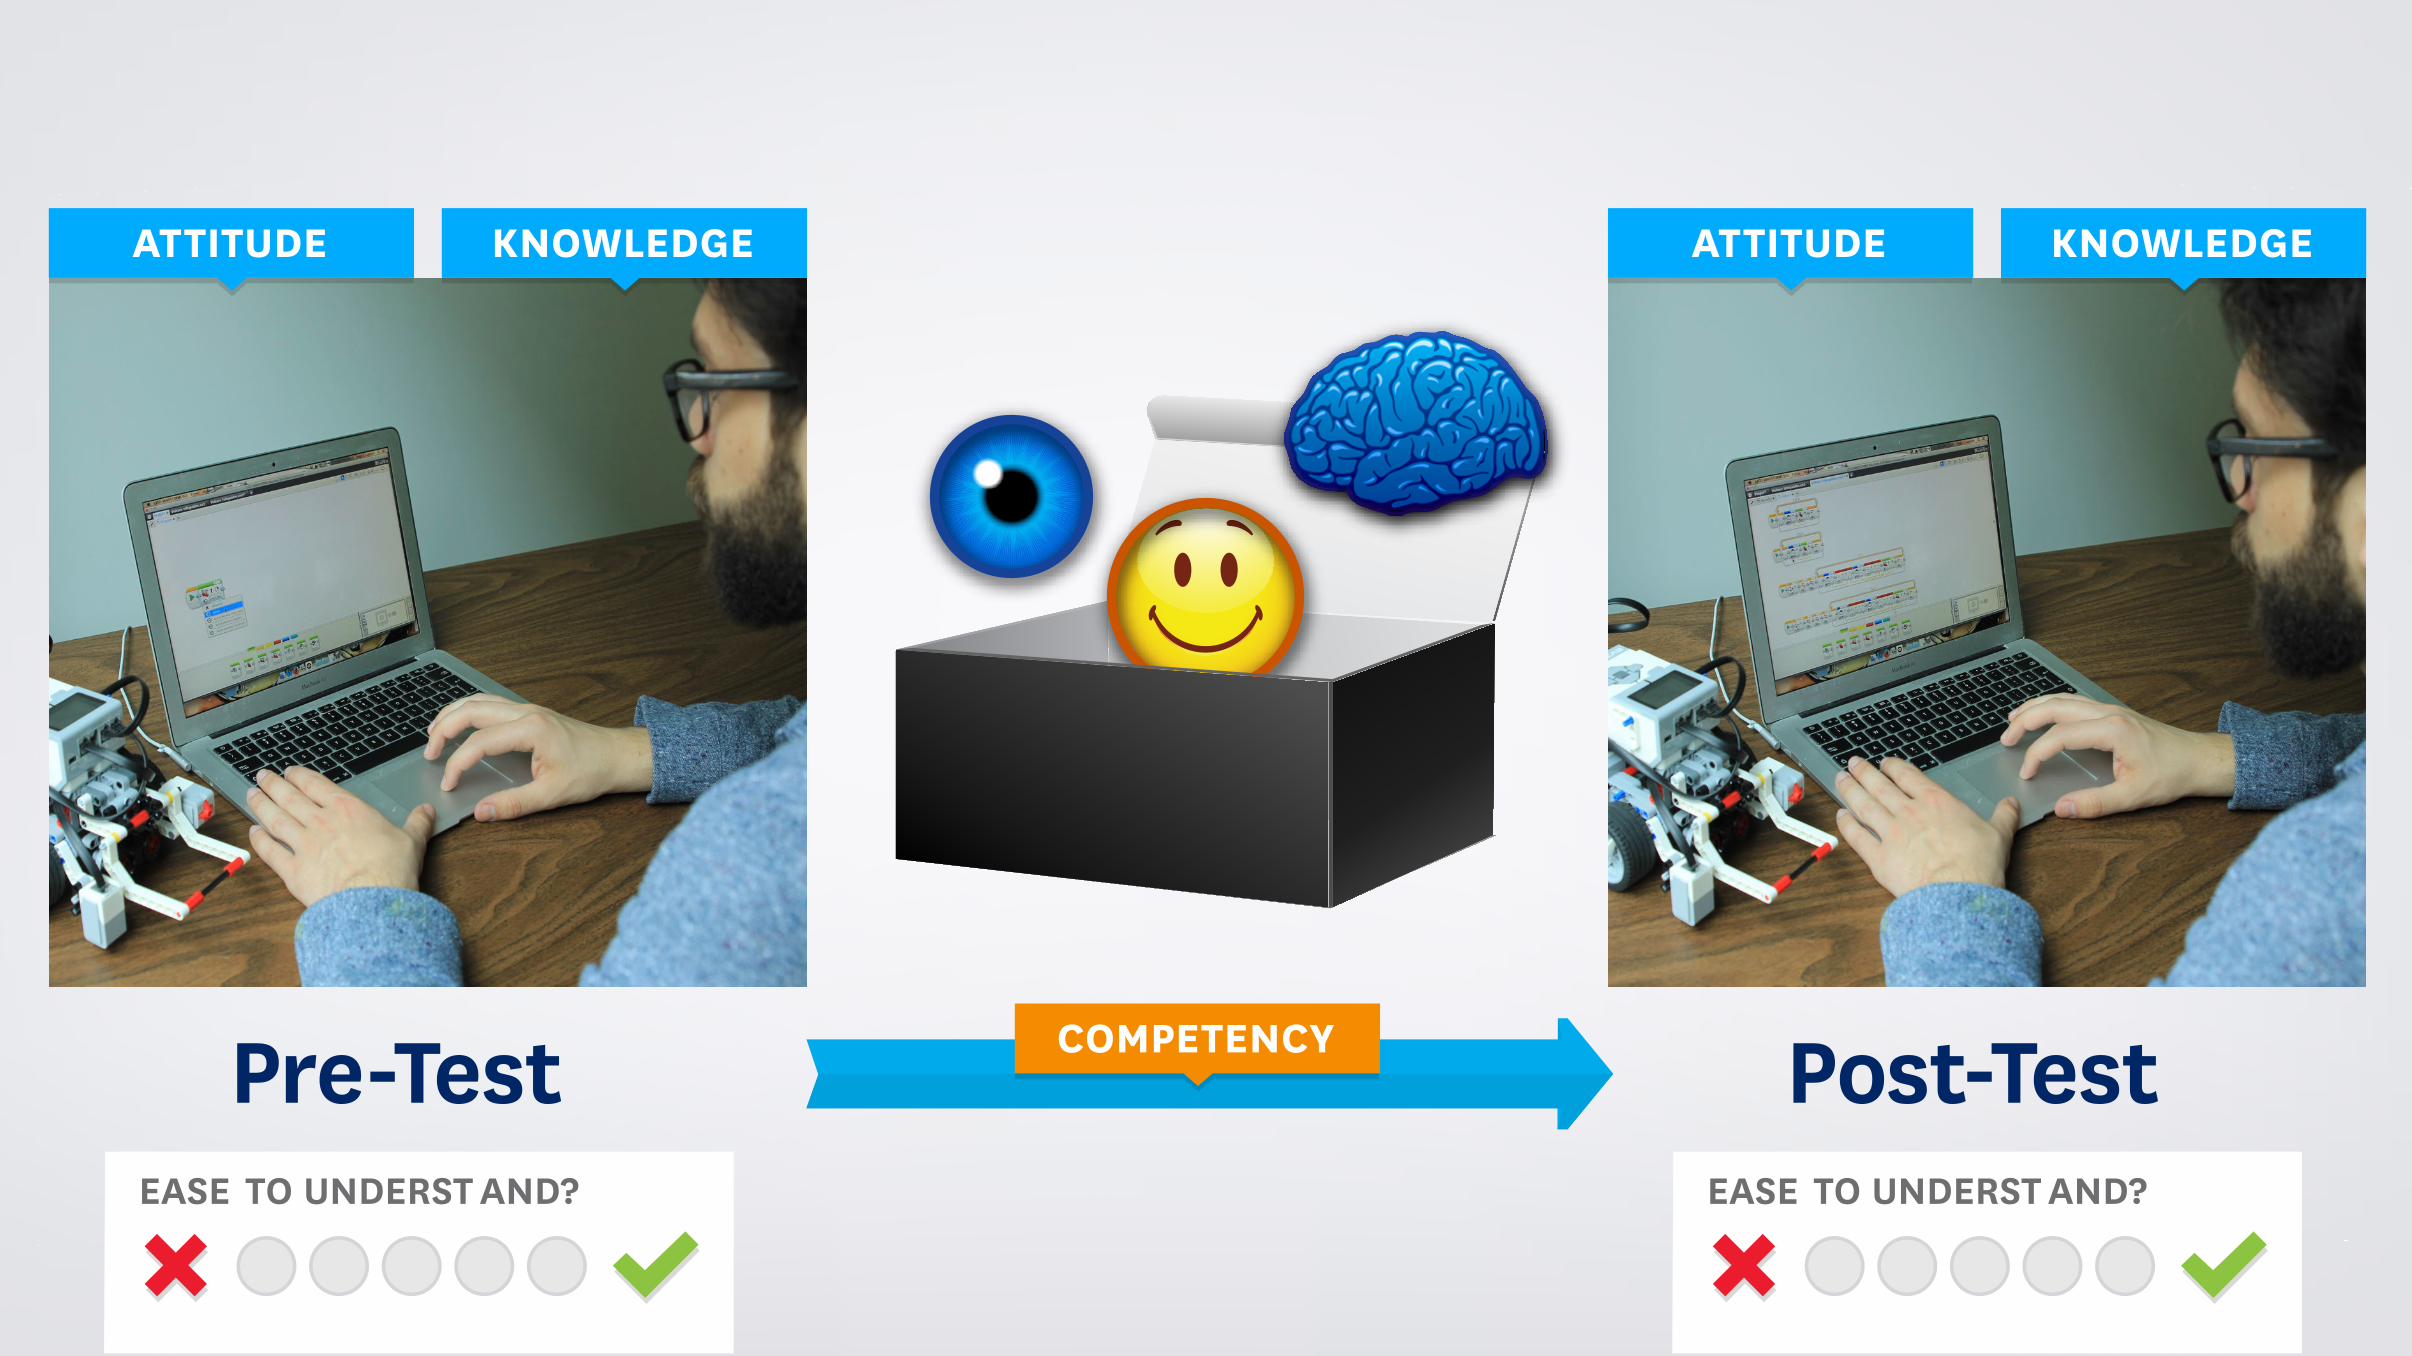
EASE TO UNDERST AND? EASE TO UNDERST AND?
Pre-Test Post-Test
AttItUDE knOwLEDGE AttItUDE knOwLEDGE
COMPEtEnCy
© Copyright Tech3Lab 2015
EASE TO UNDERSTAND?
© Copyright Tech3Lab 2015
EASE TO UNDERSTAND?
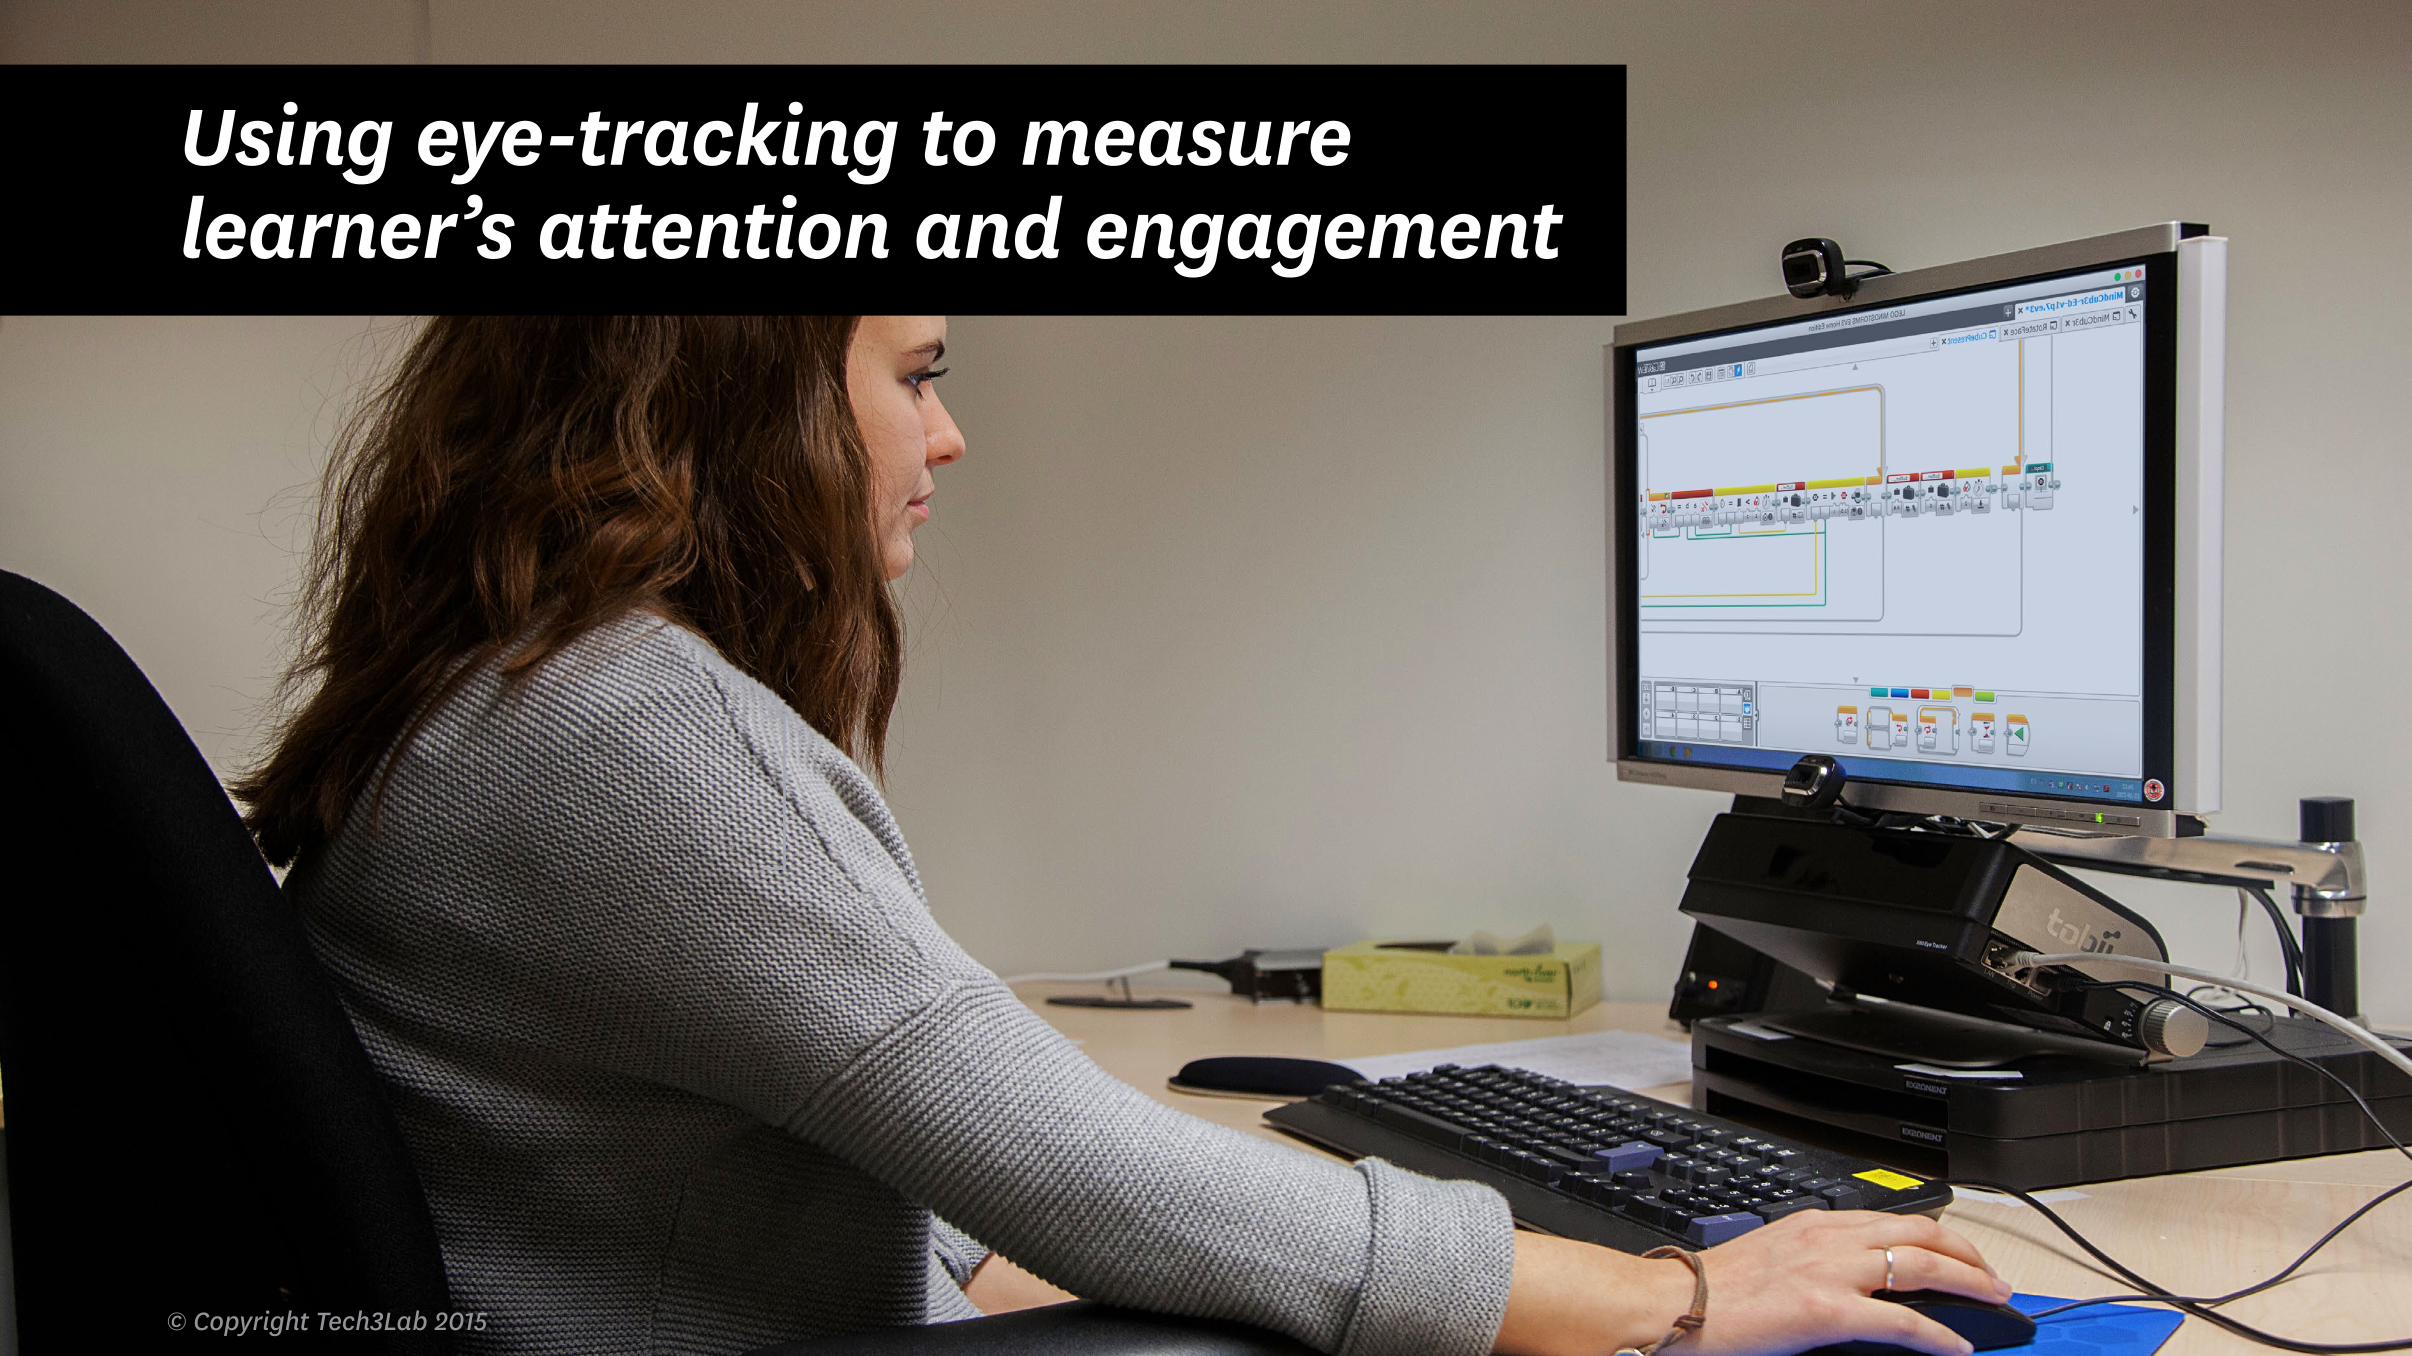
Using eye-tracking to measure learner’s attention and engagement
© Copyright Tech3Lab 2015
What is eye-tracking?
© Copyright Tech3Lab 2015

tobii Eyetracker X60
© Copyright Tech3Lab 2015

tobii Eyetracker X60
© Copyright Tech3Lab 2015
© Copyright Tech3Lab 2015
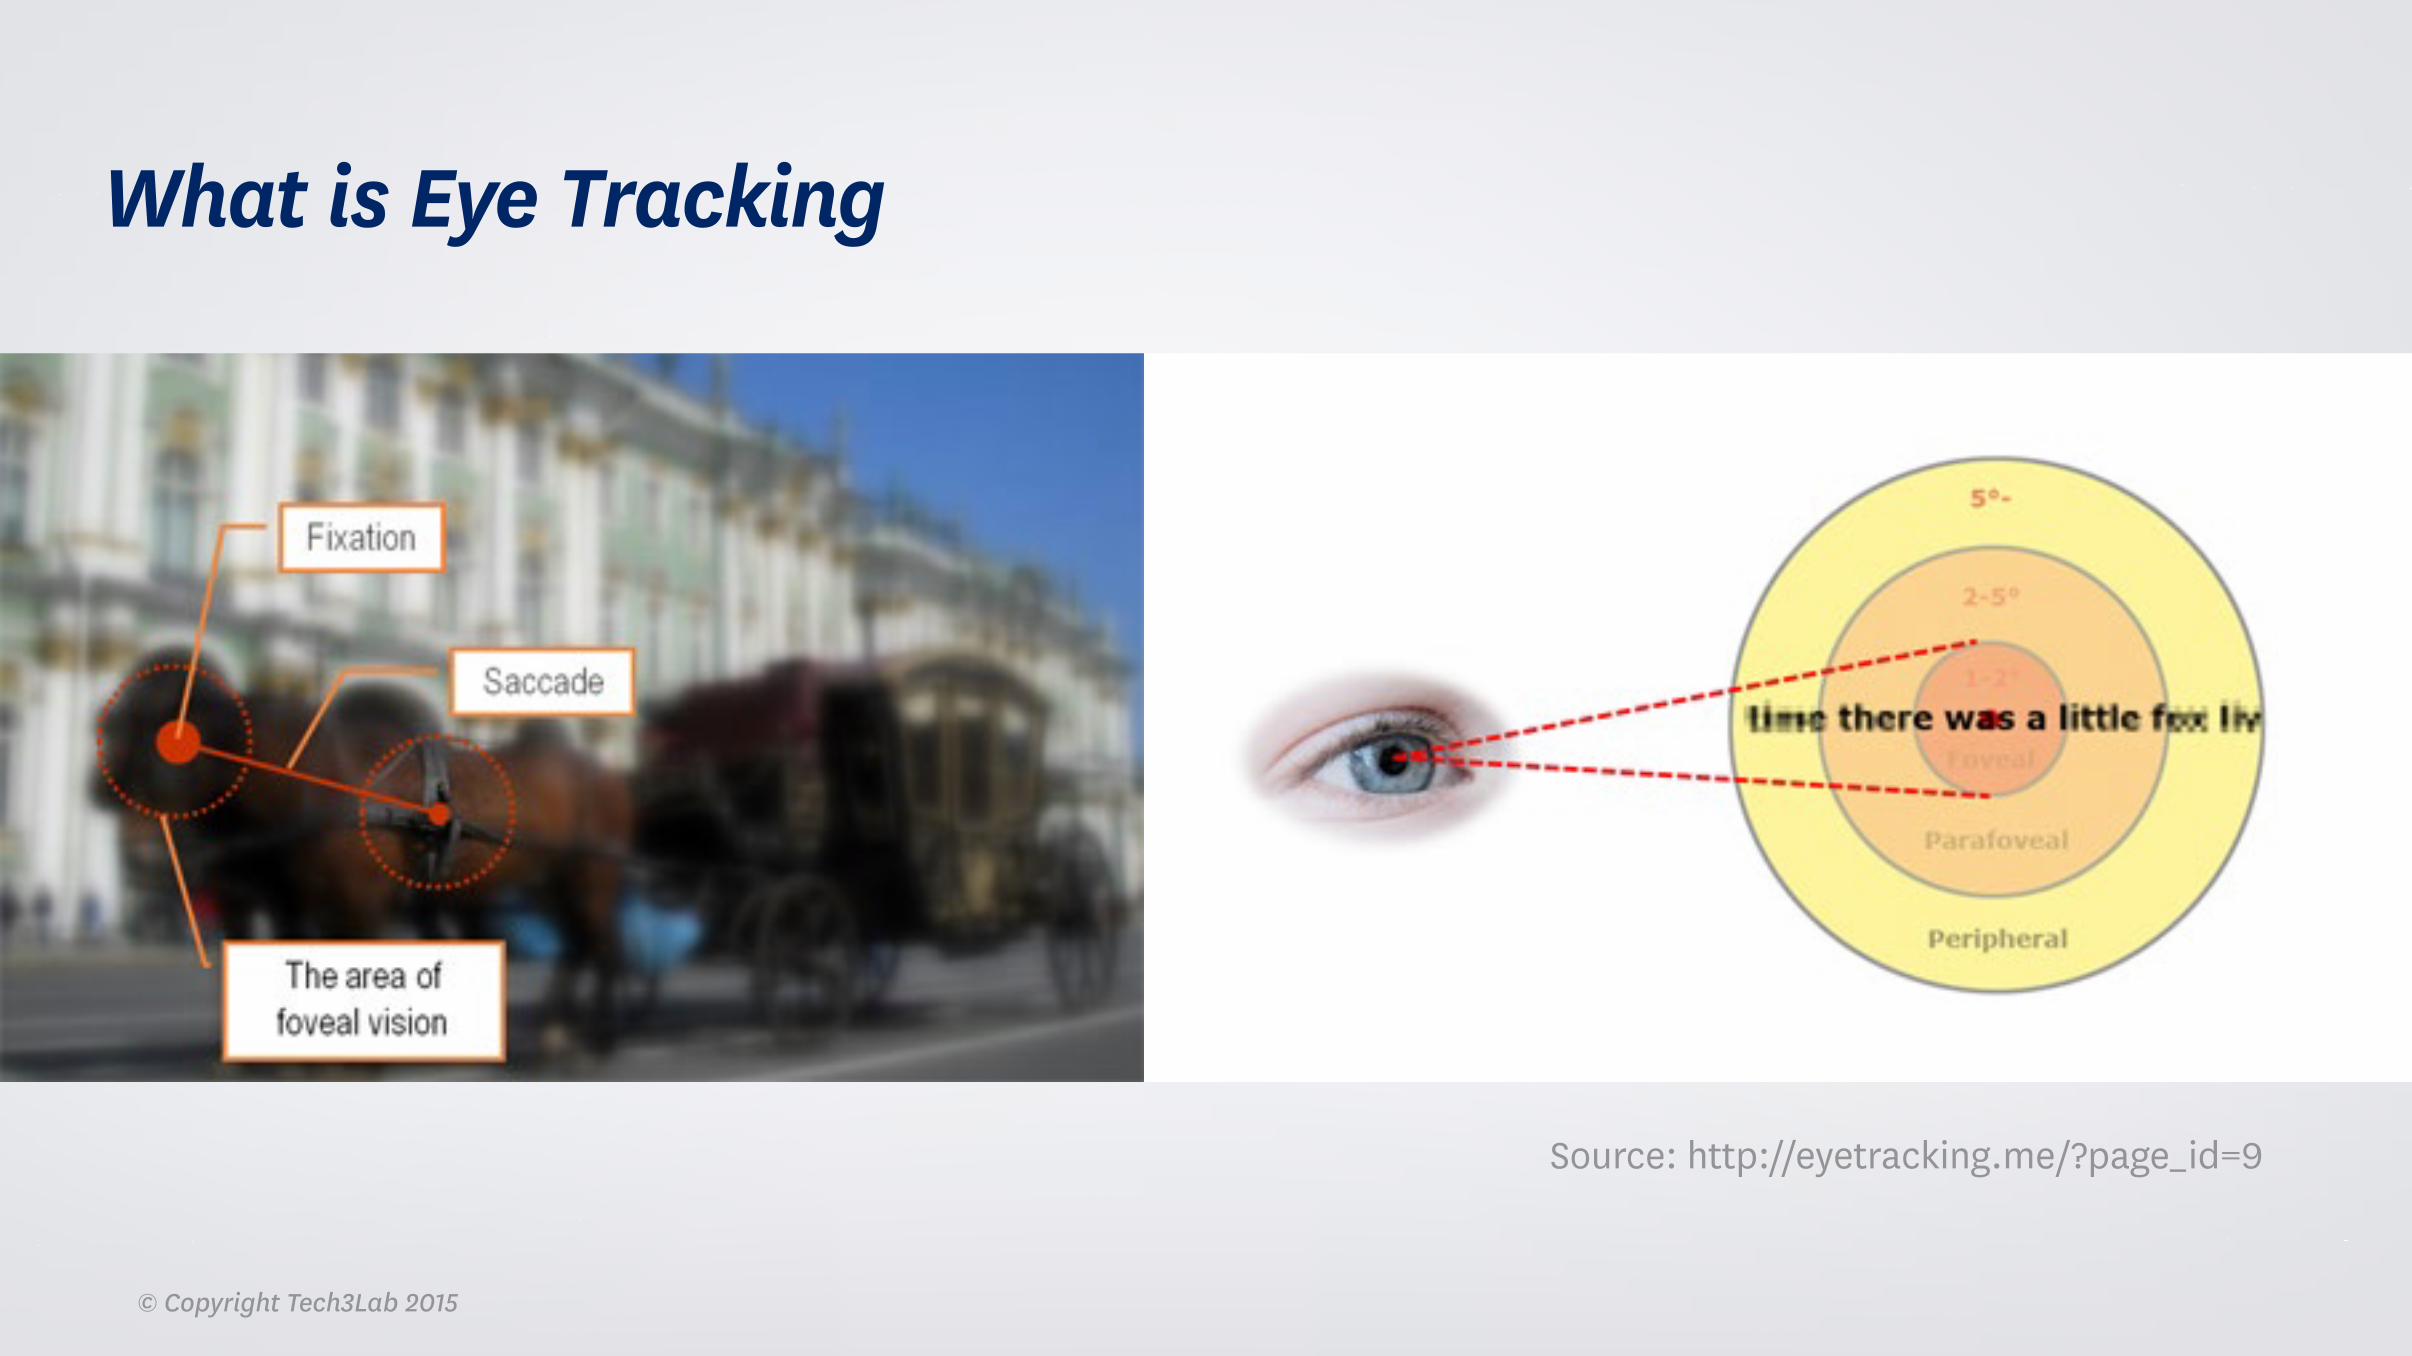
Source: http://eyetracking.me/?page_id=9
What is Eye Tracking
(A)
(B)
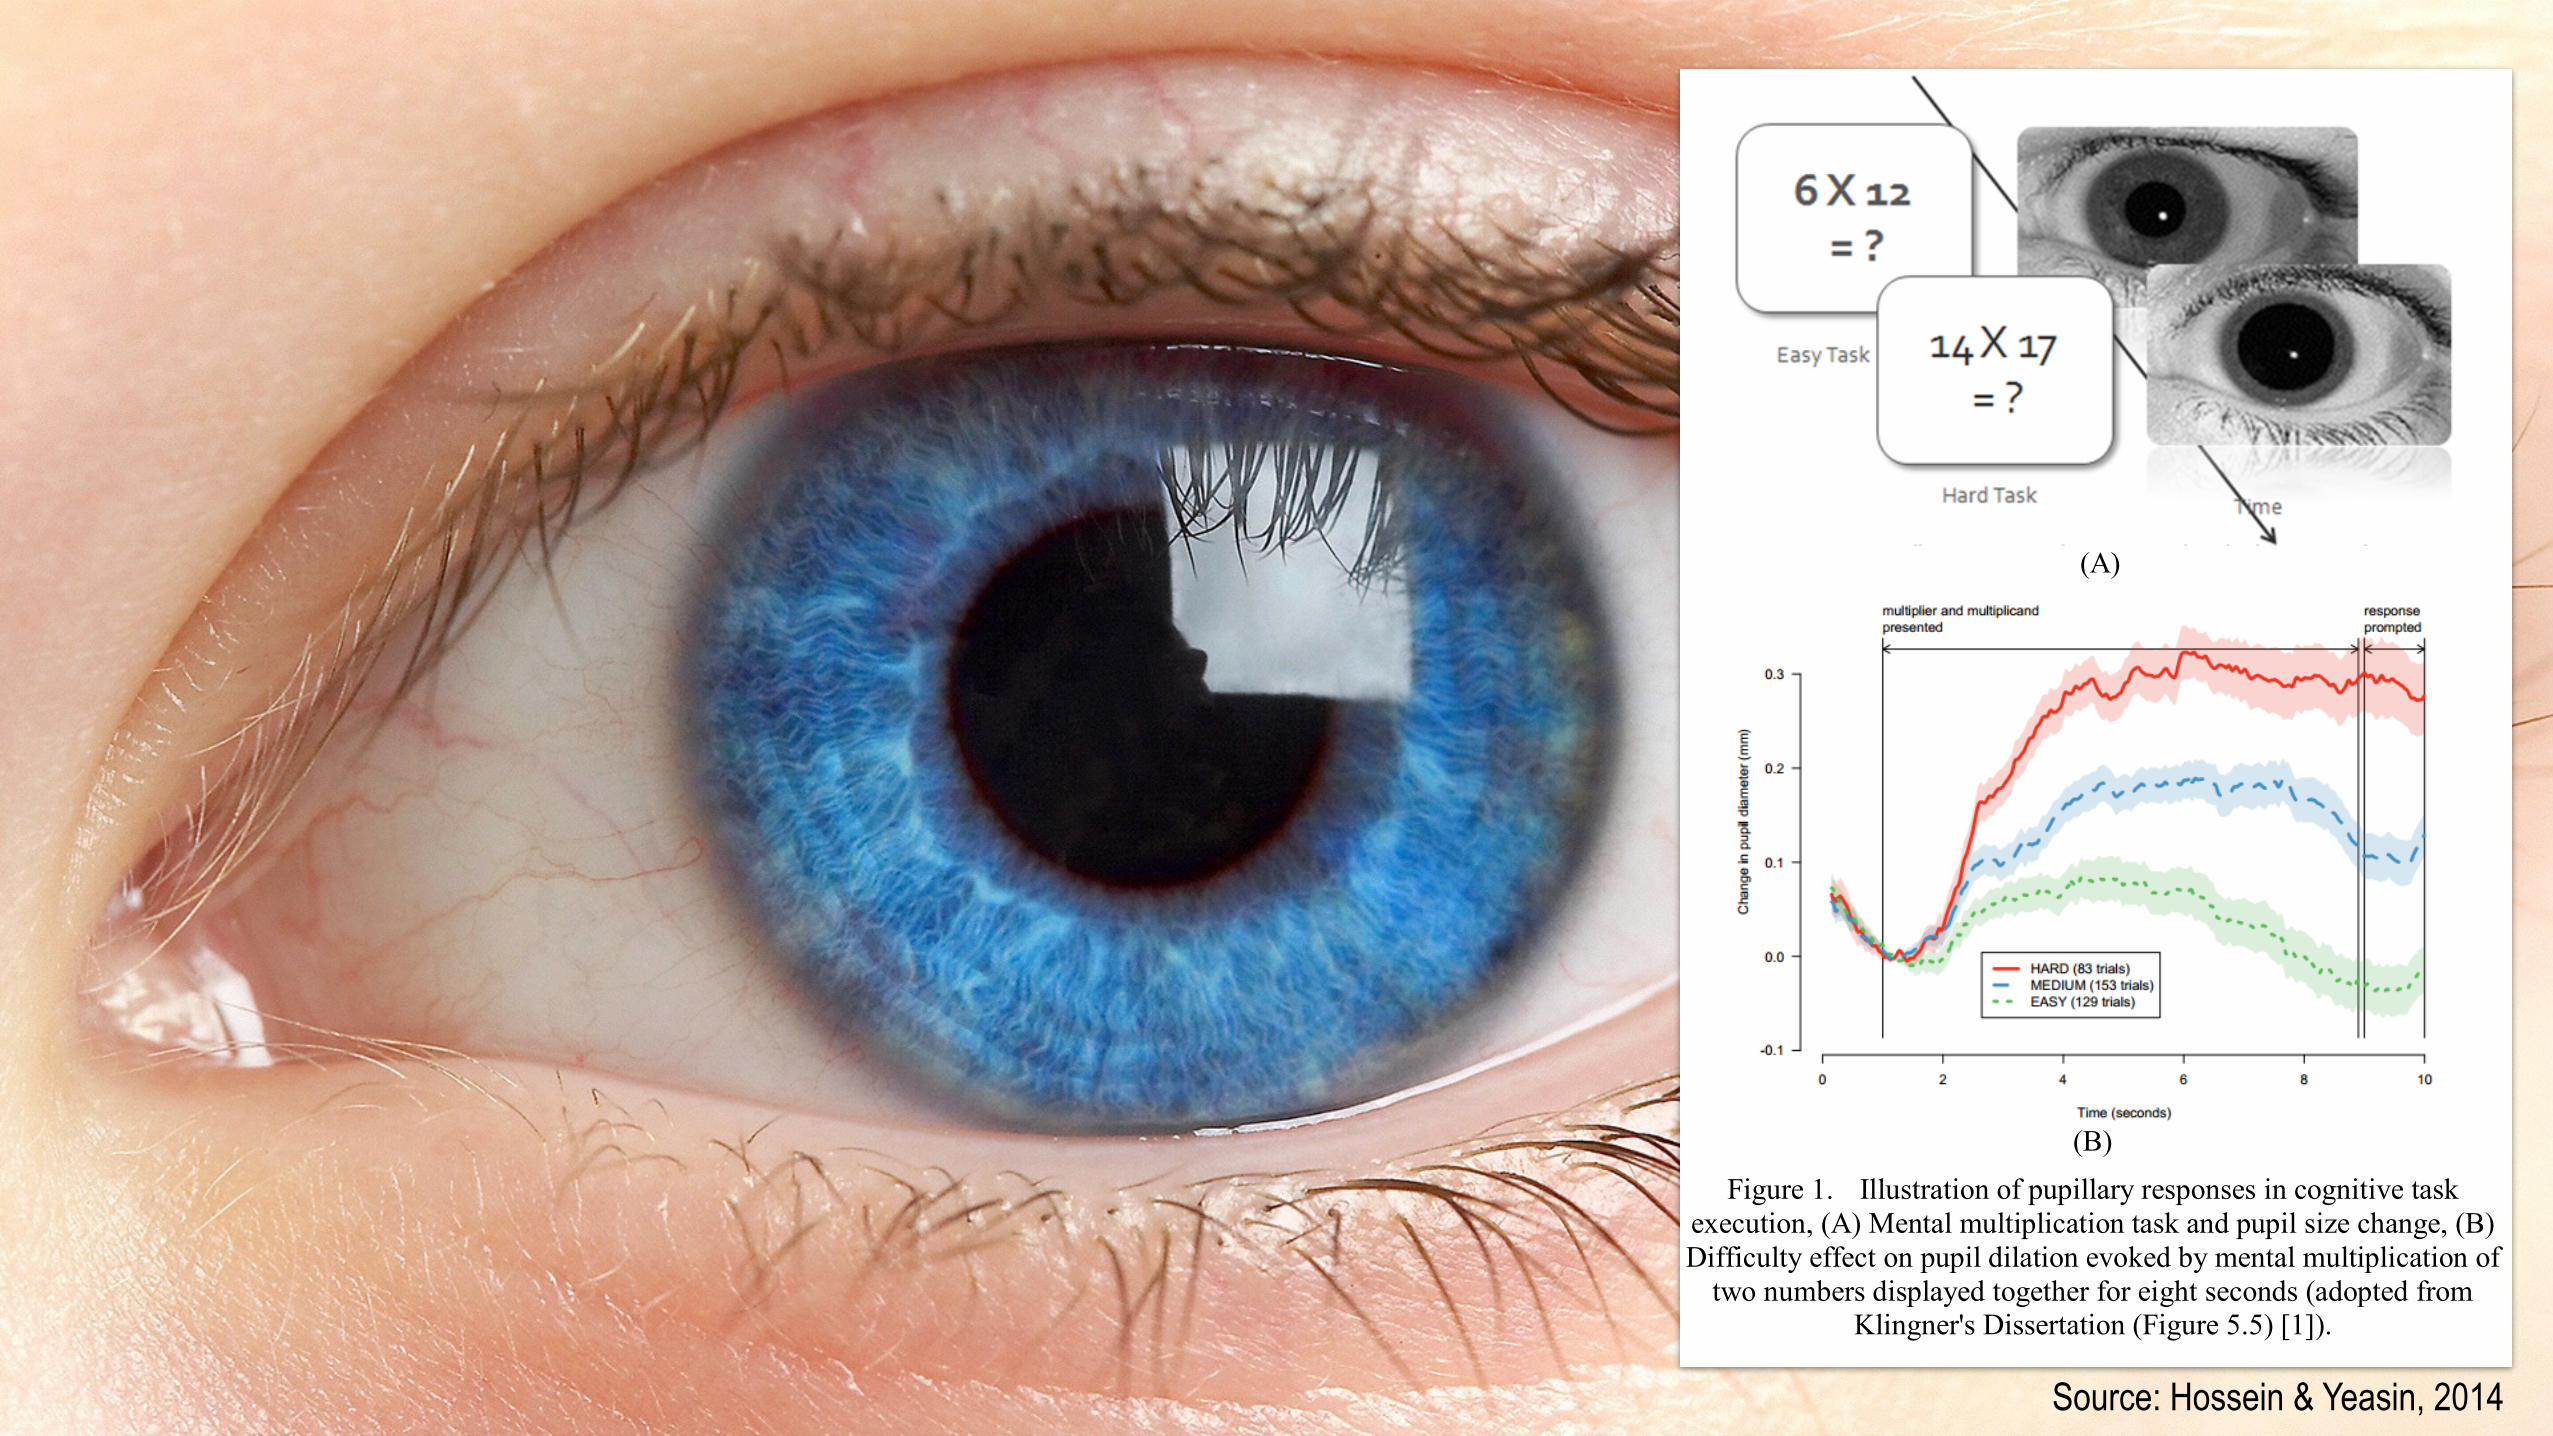
Figure 1. Illustration of pupillary responses in cognitive task execution, (A) Mental multiplication task and pupil size change, (B) Difficulty effect on pupil dilation evoked by mental multiplication of
two numbers displayed together for eight seconds (adopted from Klingner's Dissertation (Figure 5.5) [1]).
cognitive tasks. Figure 1(A) illustrates cognitive tasks (easy, hard) with respect to pupil dilations. The change of pupil diameter was shown in [1, 32] with three curves representing easy (black), medium (blue) and hard (red) with time (Figure 1B).
Cognitive load dynamics is considered as the change of cognitive load over time. It may manifest in one of the two forms: cognitive dissonance and cognitive overload. The cognitive psychology defines cognitive dissonance as inconsistency or psychologically uncomfortable situation [12, 13]. More specifically, cognitive dissonance states the uncomfortable feeling by holding two contradictory ideas simultaneously in working memory. For example, the differences between “how we should act” and “how we act” in a particular situation may cause dissonance. Cognitive dissonance [or lock-up] acts as a key factor mediating conceptual change in response to human-machine interactions [4]. Psychologists explain two hypothesis of cognitive dissonance: (1) The existence of dissonance [or conflict / inconsistency], being psychologically uncomfortable, will motivate the person to try to reduce the dissonance and achieve consonance [or consistency]. (2) When dissonance is present, in addition to trying to reduce it, the person will actively avoid situations and information which would likely increase the dissonance [13]. Cognitive
overload may arise in the context of a goal oriented, time bound and complex task interaction.
TABLE II. CATEGORIZATION OF COGNITIVE LOAD MEASUREMENT [29, 21]
Objectivity Causal RelationshipIndirect Direct
Subjective Self-reported invested mental effort [21, 23]
Self-reported stress level Self-reported difficulty of
materials [24] Objective Physiological measure
[25] Behavioral measure [24]
Learned outcome measure [ 22]
Brain activity measure (e.g., EEG, fMRI) [25] Dual-task performance
[27, 22]
Cognitive overload may arise in the context of a goal
oriented, time bound and complex task interaction. Complex (hard) mental multiplication task, used in [1] is an example. In the context of human-computer (device/machine/system) interaction, load can be measures with the number of ways categorized as subjective/objective or direct/indirect which is shown in Table II.
III. RESEARCH METHOD
Highly precise pupillimetry data collection depends on a good setup in which the pupil spans many pixels in the camera image. To avoid data integrity issues we analyzed a sample from a benchmark dataset [1] for secondary evaluation. Pupil size variation logs are averaged and matched with task performance to identify cognitive load, dissonance and overload. Figure 2 shows two stages of processing: cognitive load assessment and cognitive load effect assessment. This study emphasizes on the later part of the study, considering the result of the first part as a baseline. Initially, the data was passed through some pre-processing steps (e.g., averaging both left and right pupil size, management of missing values, and interpolation) to have a form of time series data. As the main goal of this work is to study dynamics in terms of overload and dissonance, we applied Hilbert transform to see cognitive load effects.
A. The Hilbert Transform Hilbert transform returns a complex sequence sometimes
called the analytic signal, from a real data sequence. It is useful in calculating instantaneous attributes of time series, especially the amplitude and frequency.
The instantaneous amplitude is the amplitude of the complex Hilbert transform; the instantaneous frequency is the time rate of change of the instantaneous phase angle[15].
Let us consider ( )tx is a real-valued time domain signal. The
Hilbert Transform of ( )tx is another real-valued time
domain signal, can be denoted by ( )tx~ , such that ( ) )(~)( txjtxtz += is an analytic signal [12].
376
Source: Hossein & Yeasin, 2014
© Copyright Tech3Lab 2015
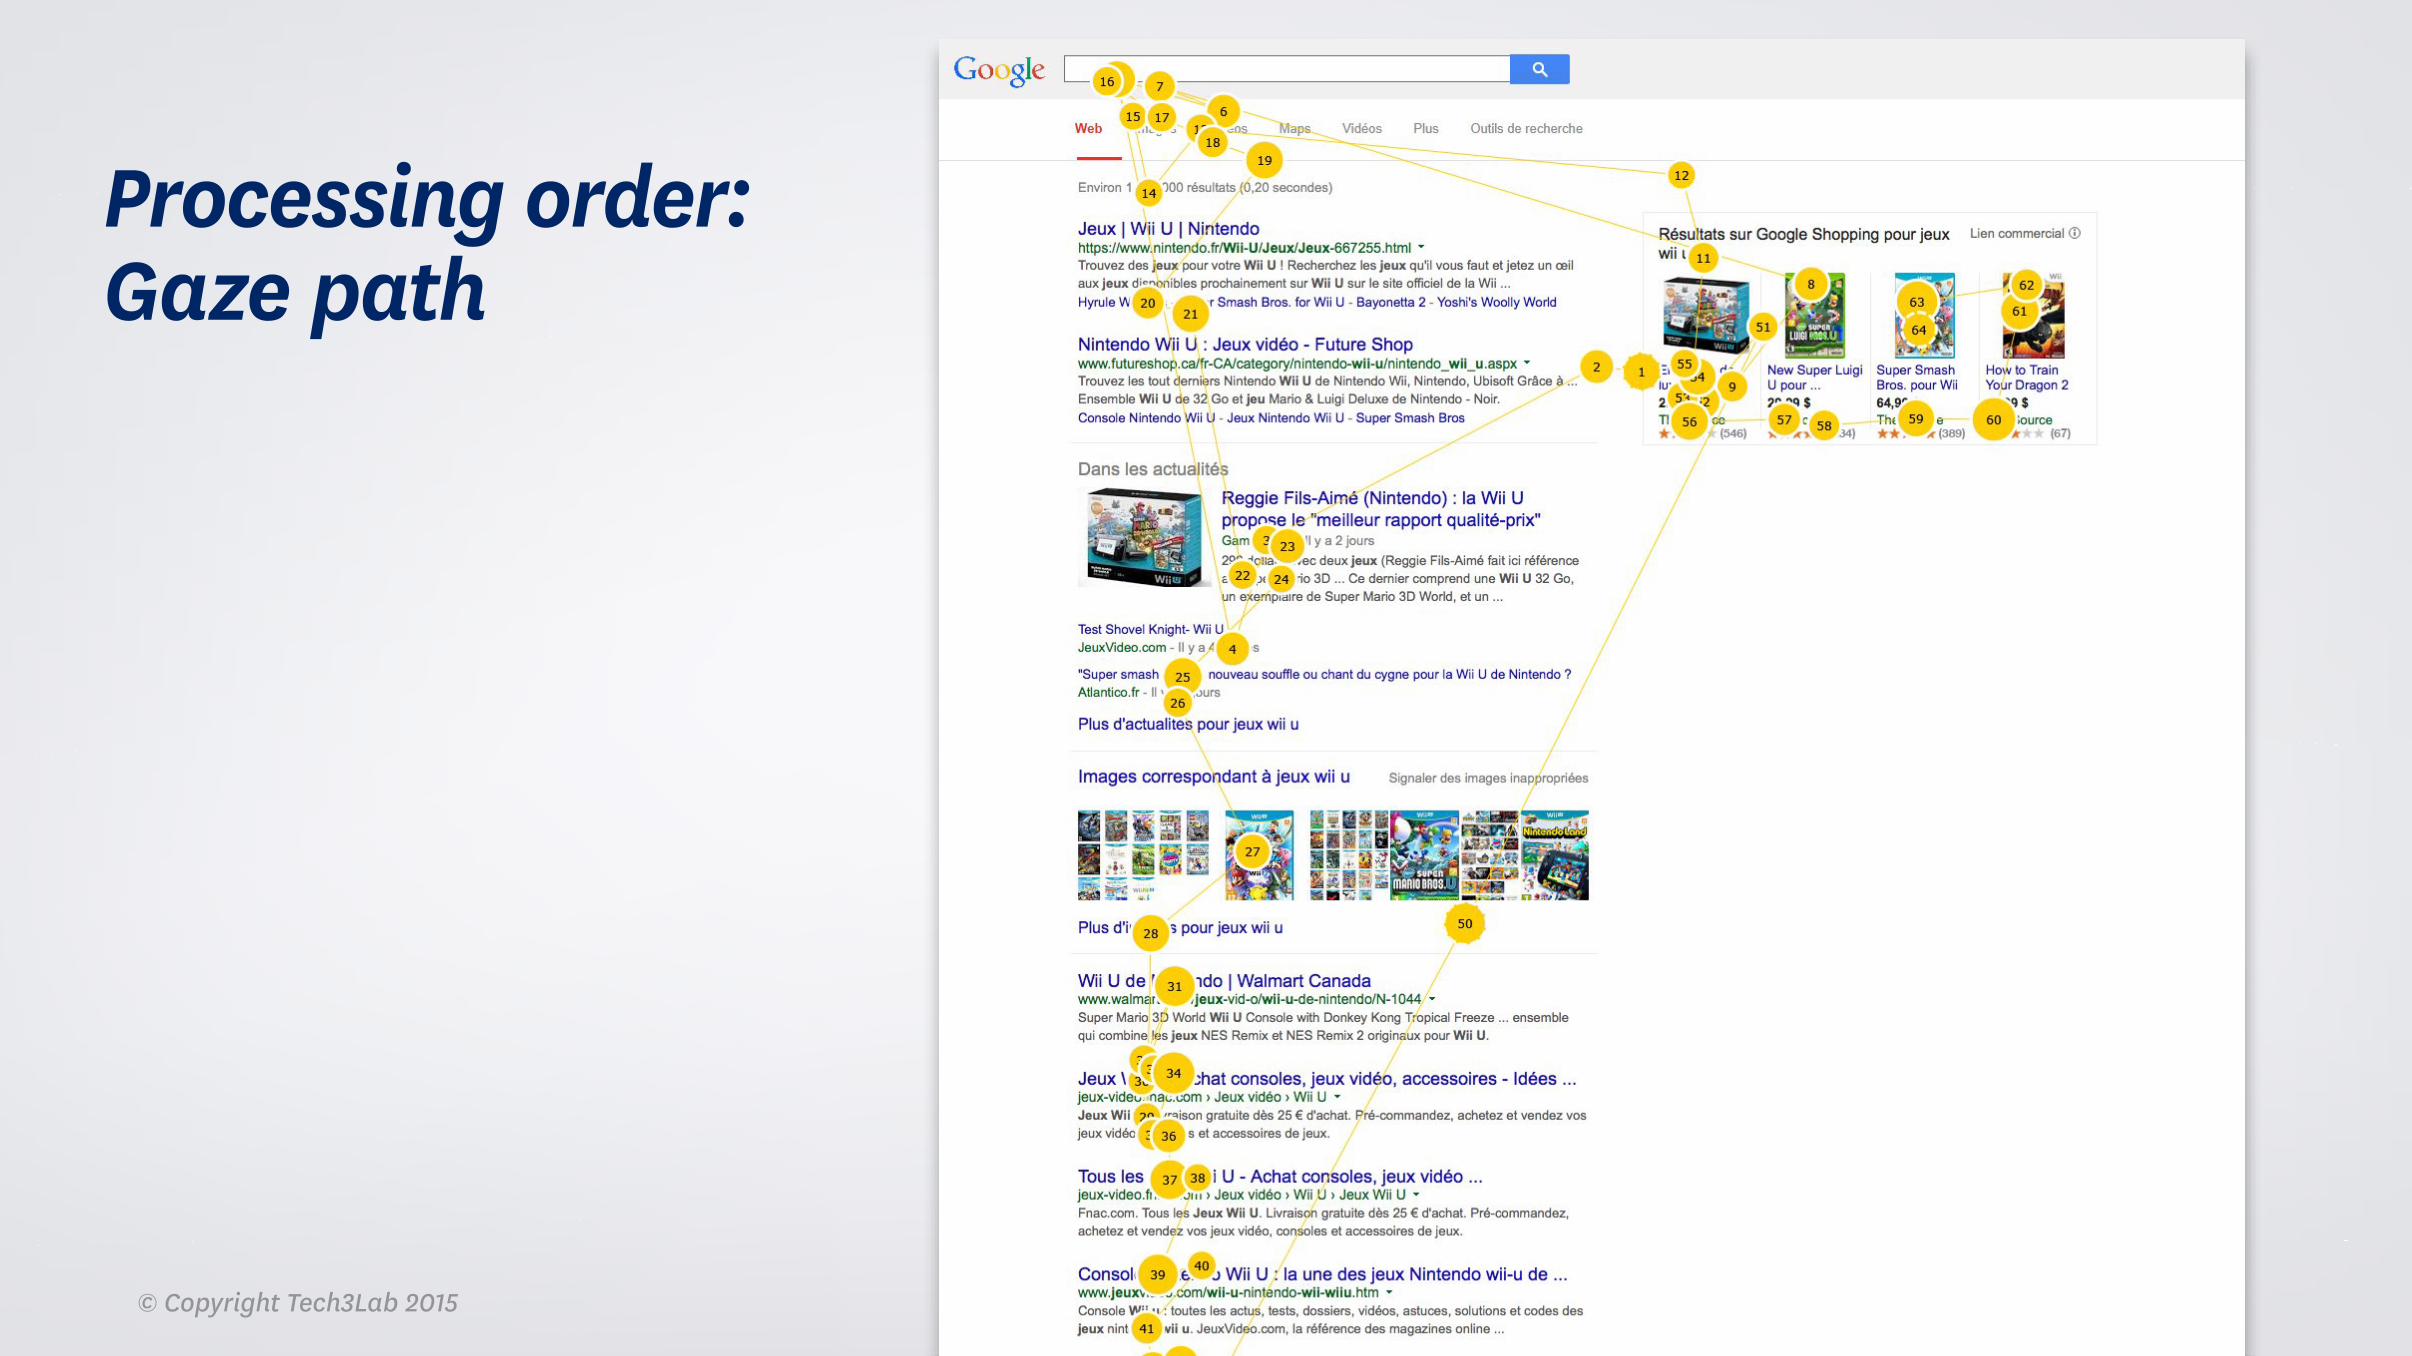
Processing order: Gaze path
© Copyright Tech3Lab 2015
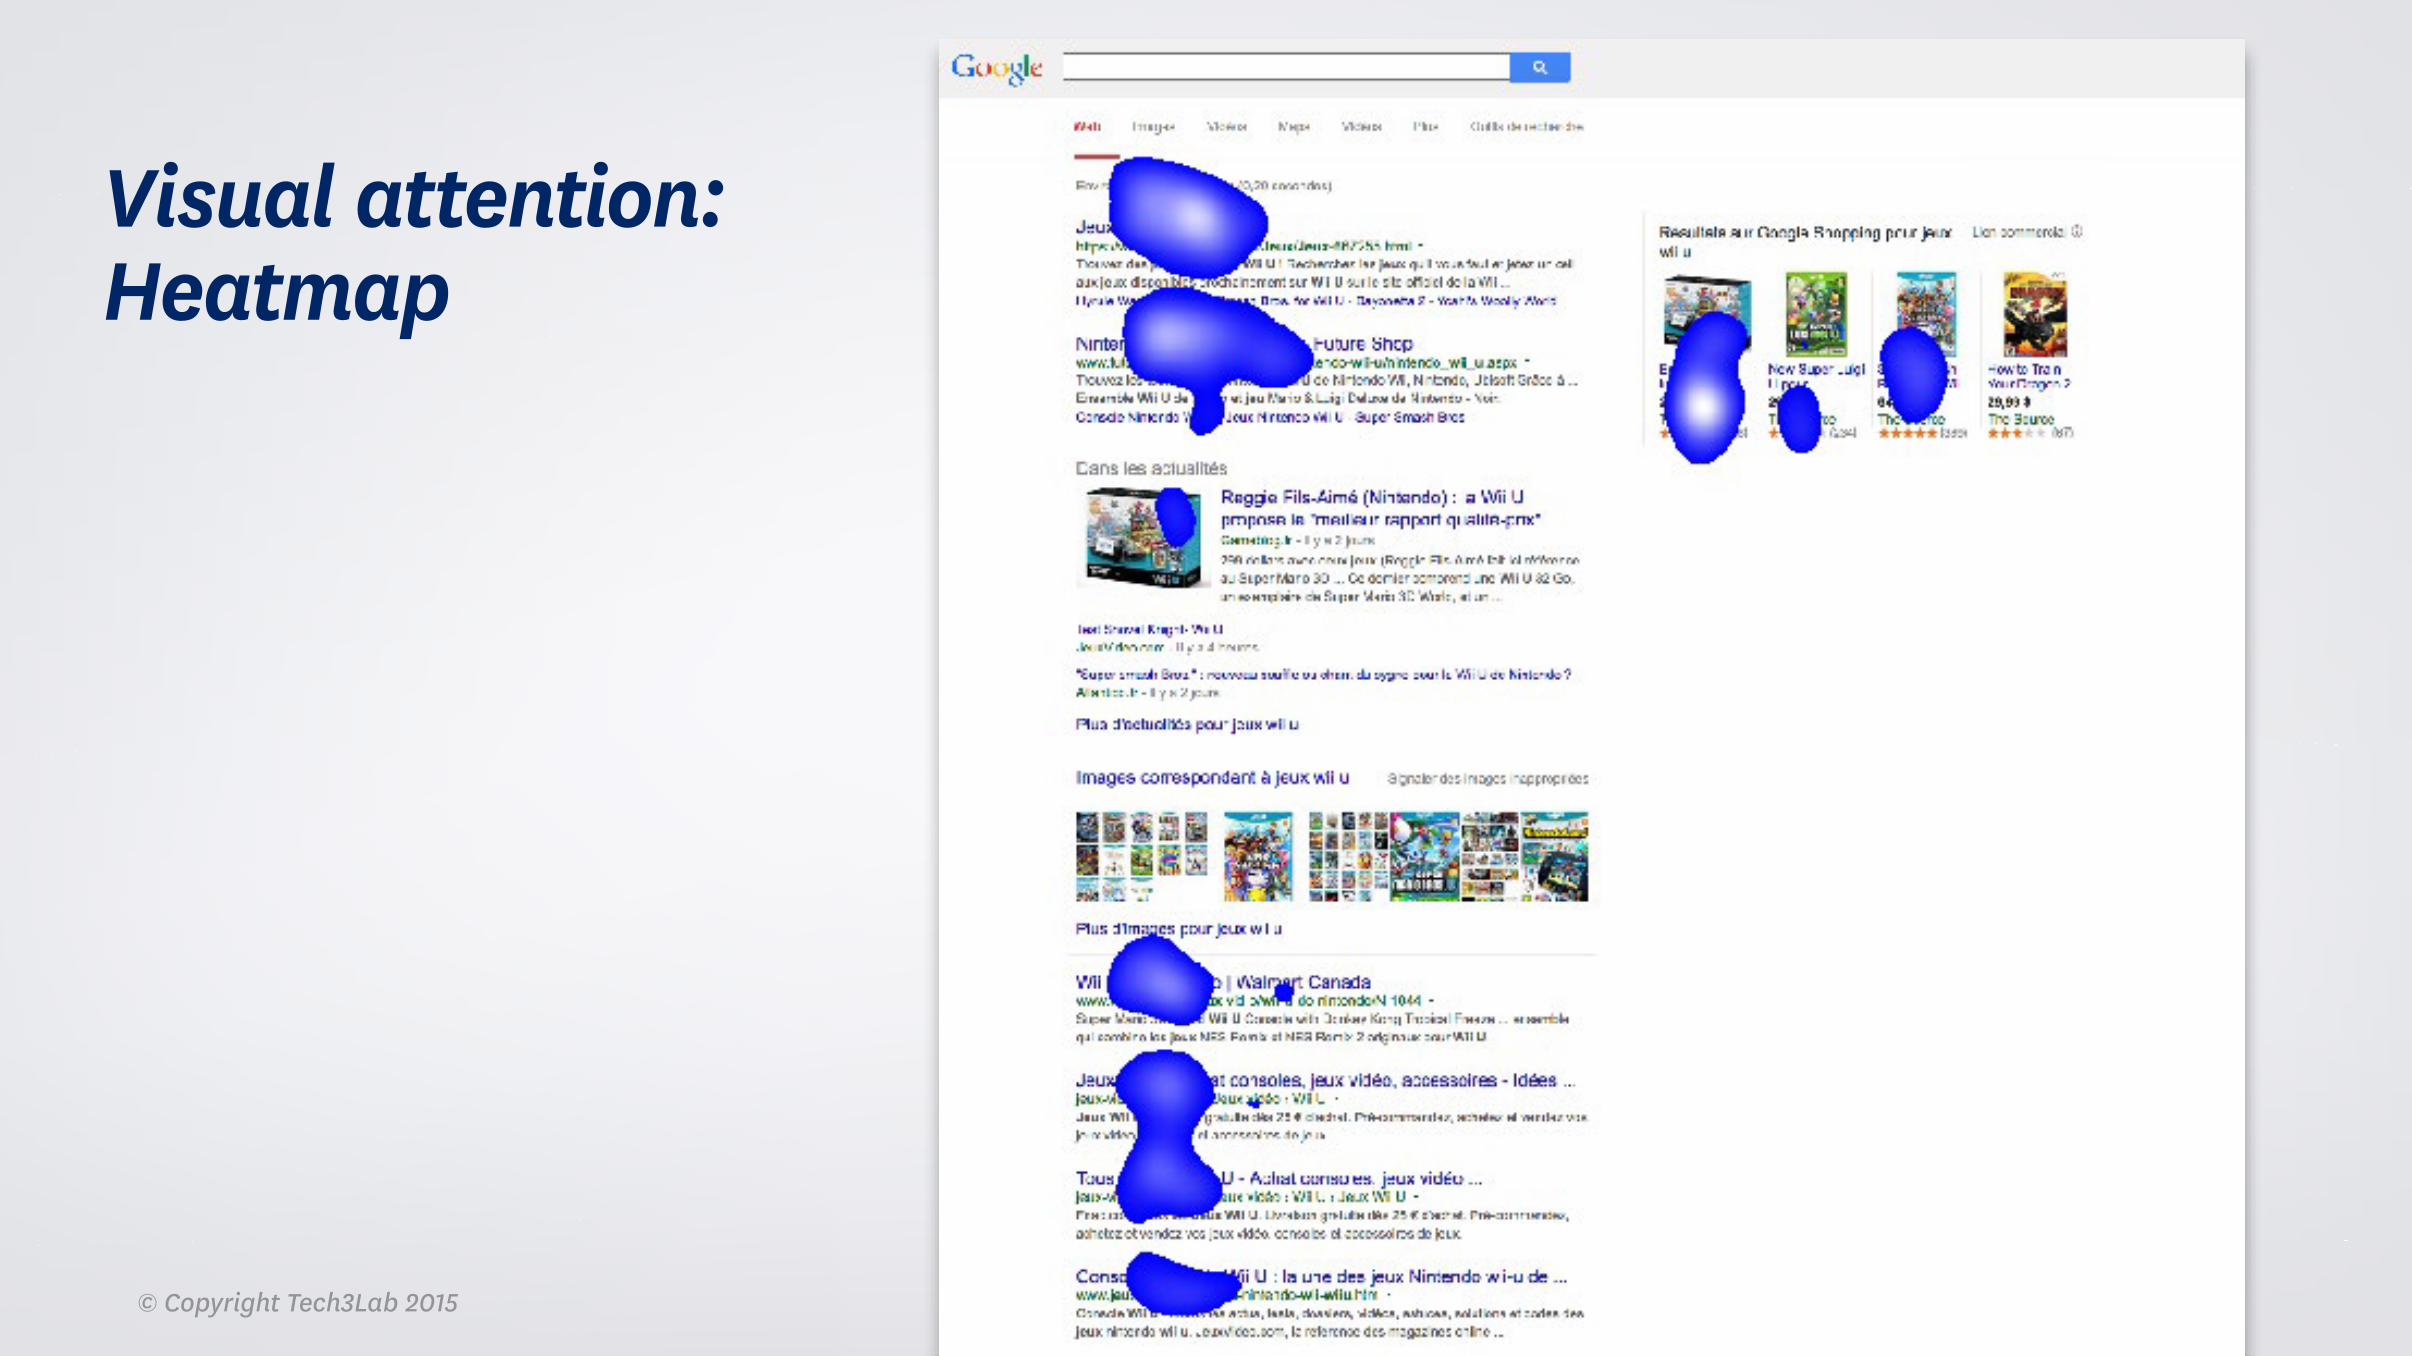
Visual attention: Heatmap
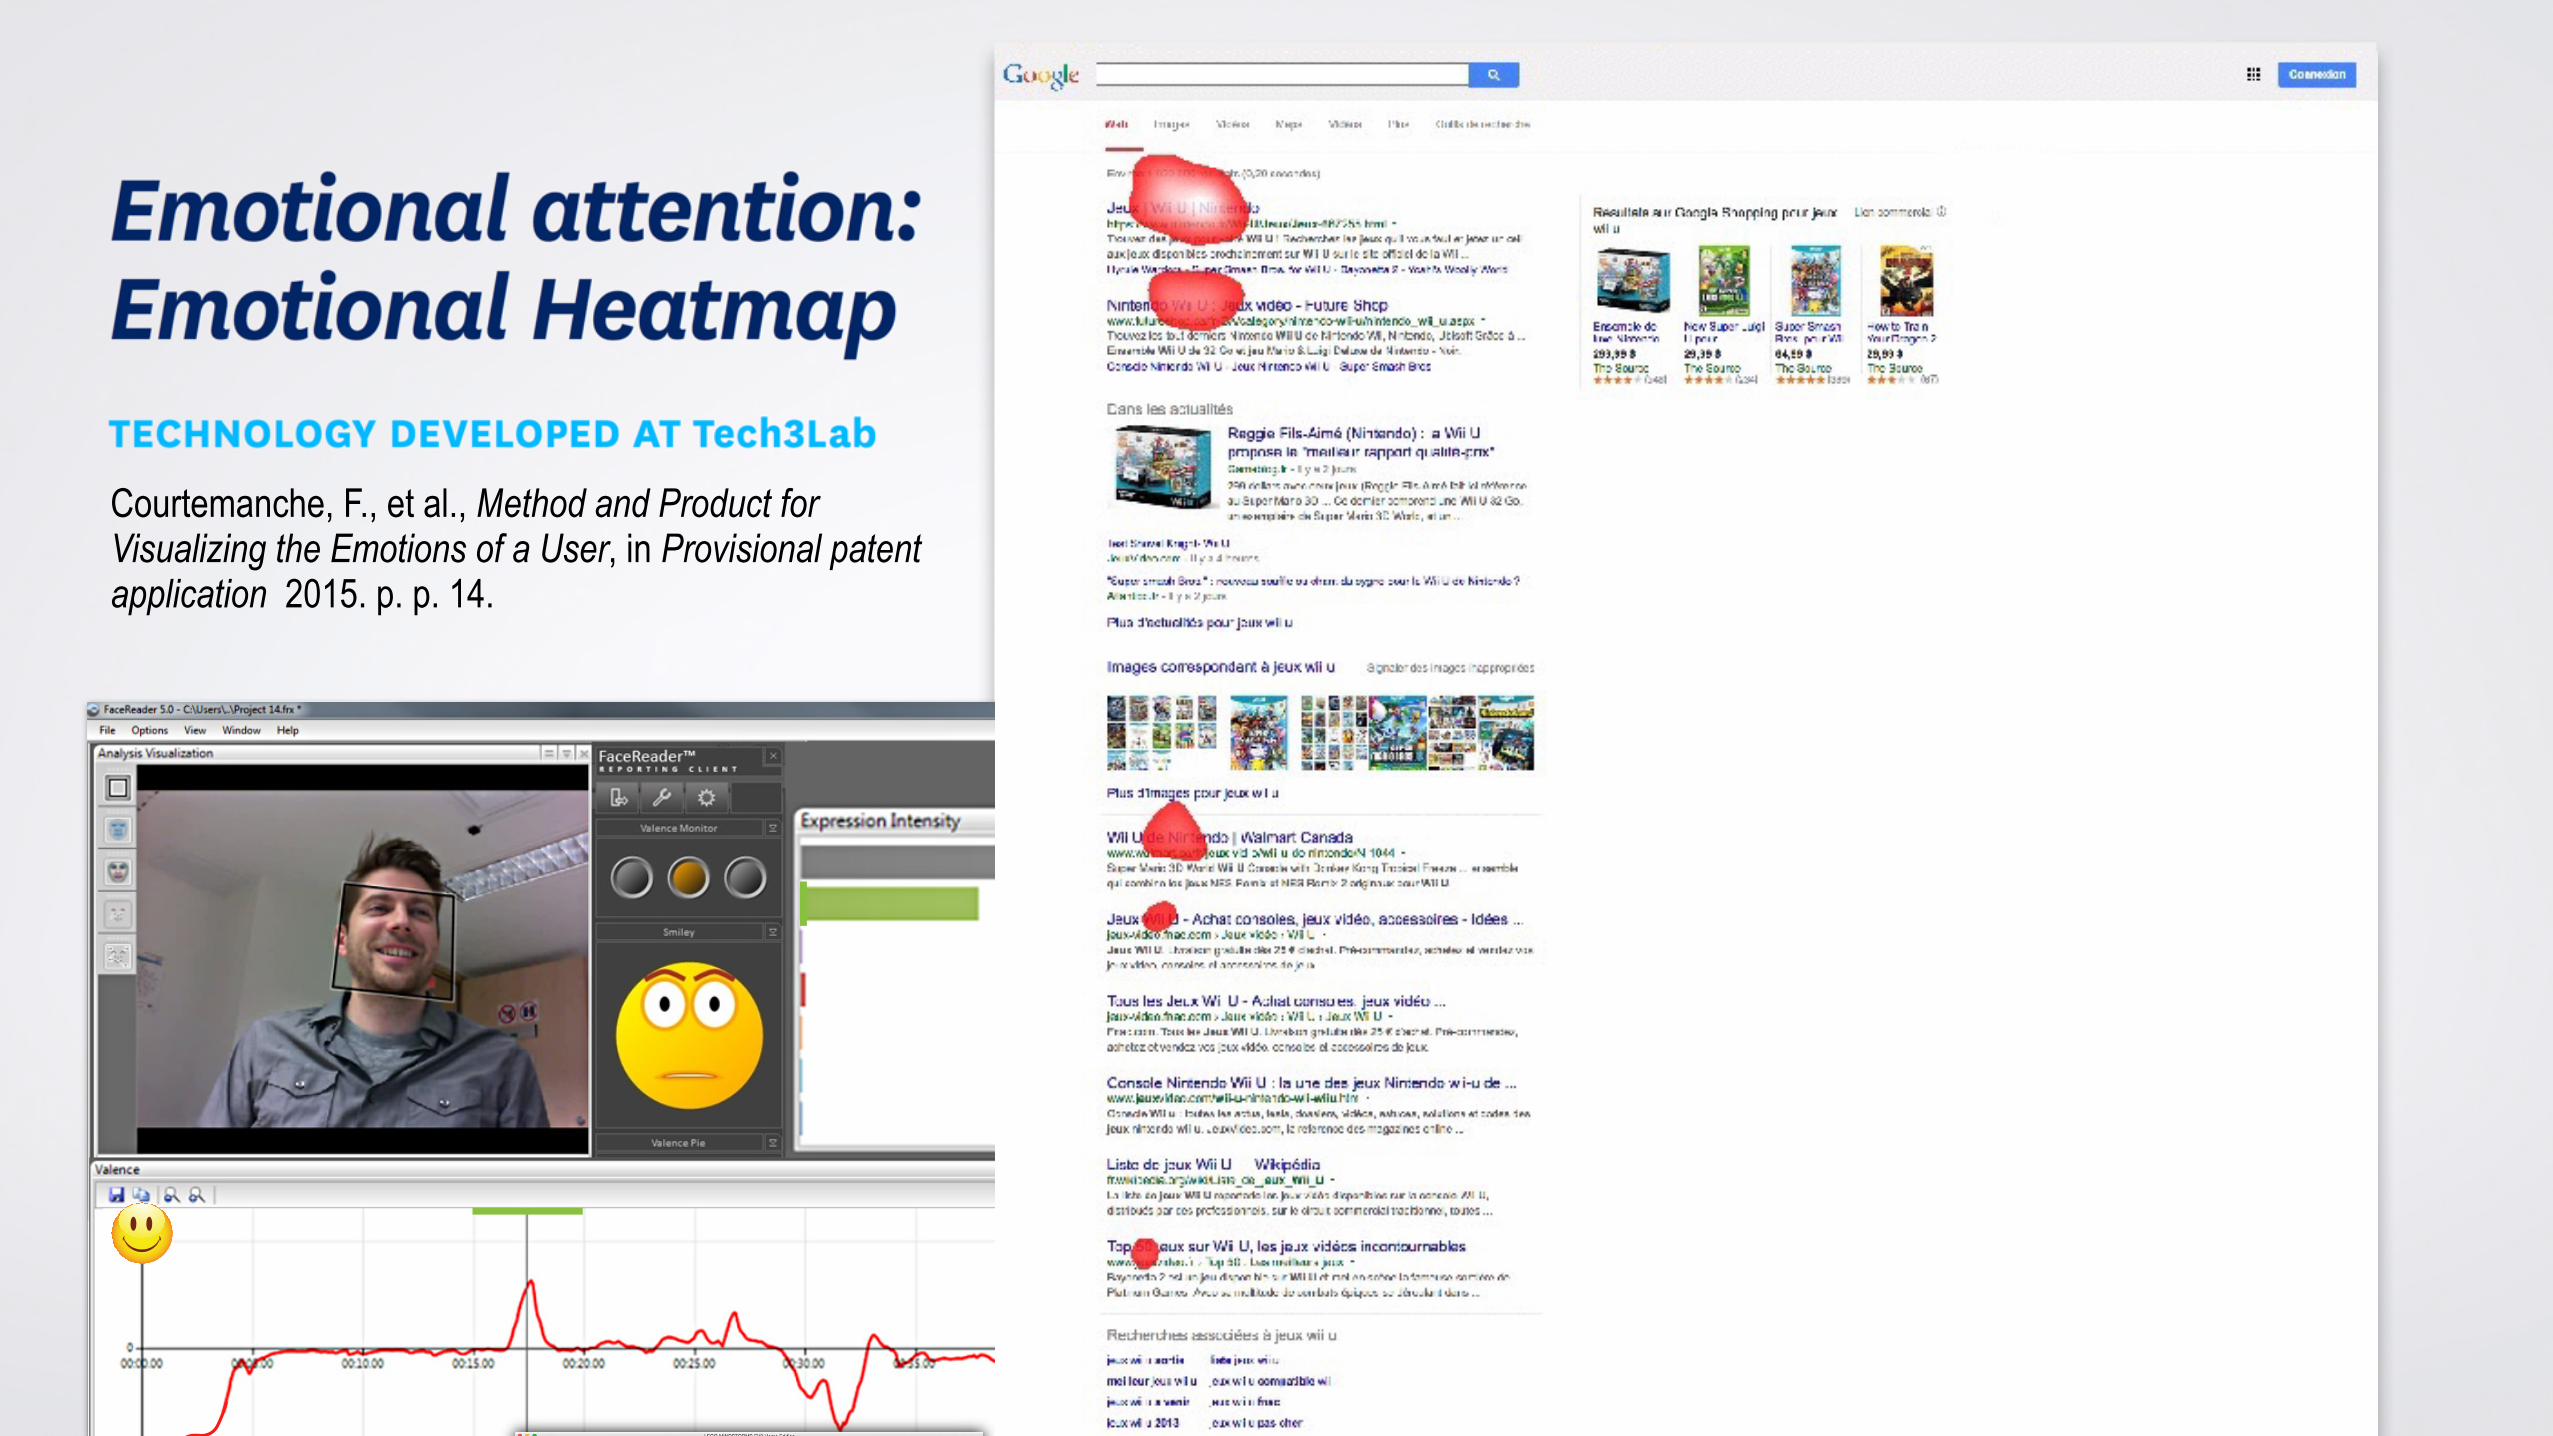
Courtemanche, F., et al., Method and Product for Visualizing the Emotions of a User, in Provisional patent application 2015. p. p. 14.

© Copyright Tech3Lab 2015
Visual & Emotional attention
© Copyright Tech3Lab 2015
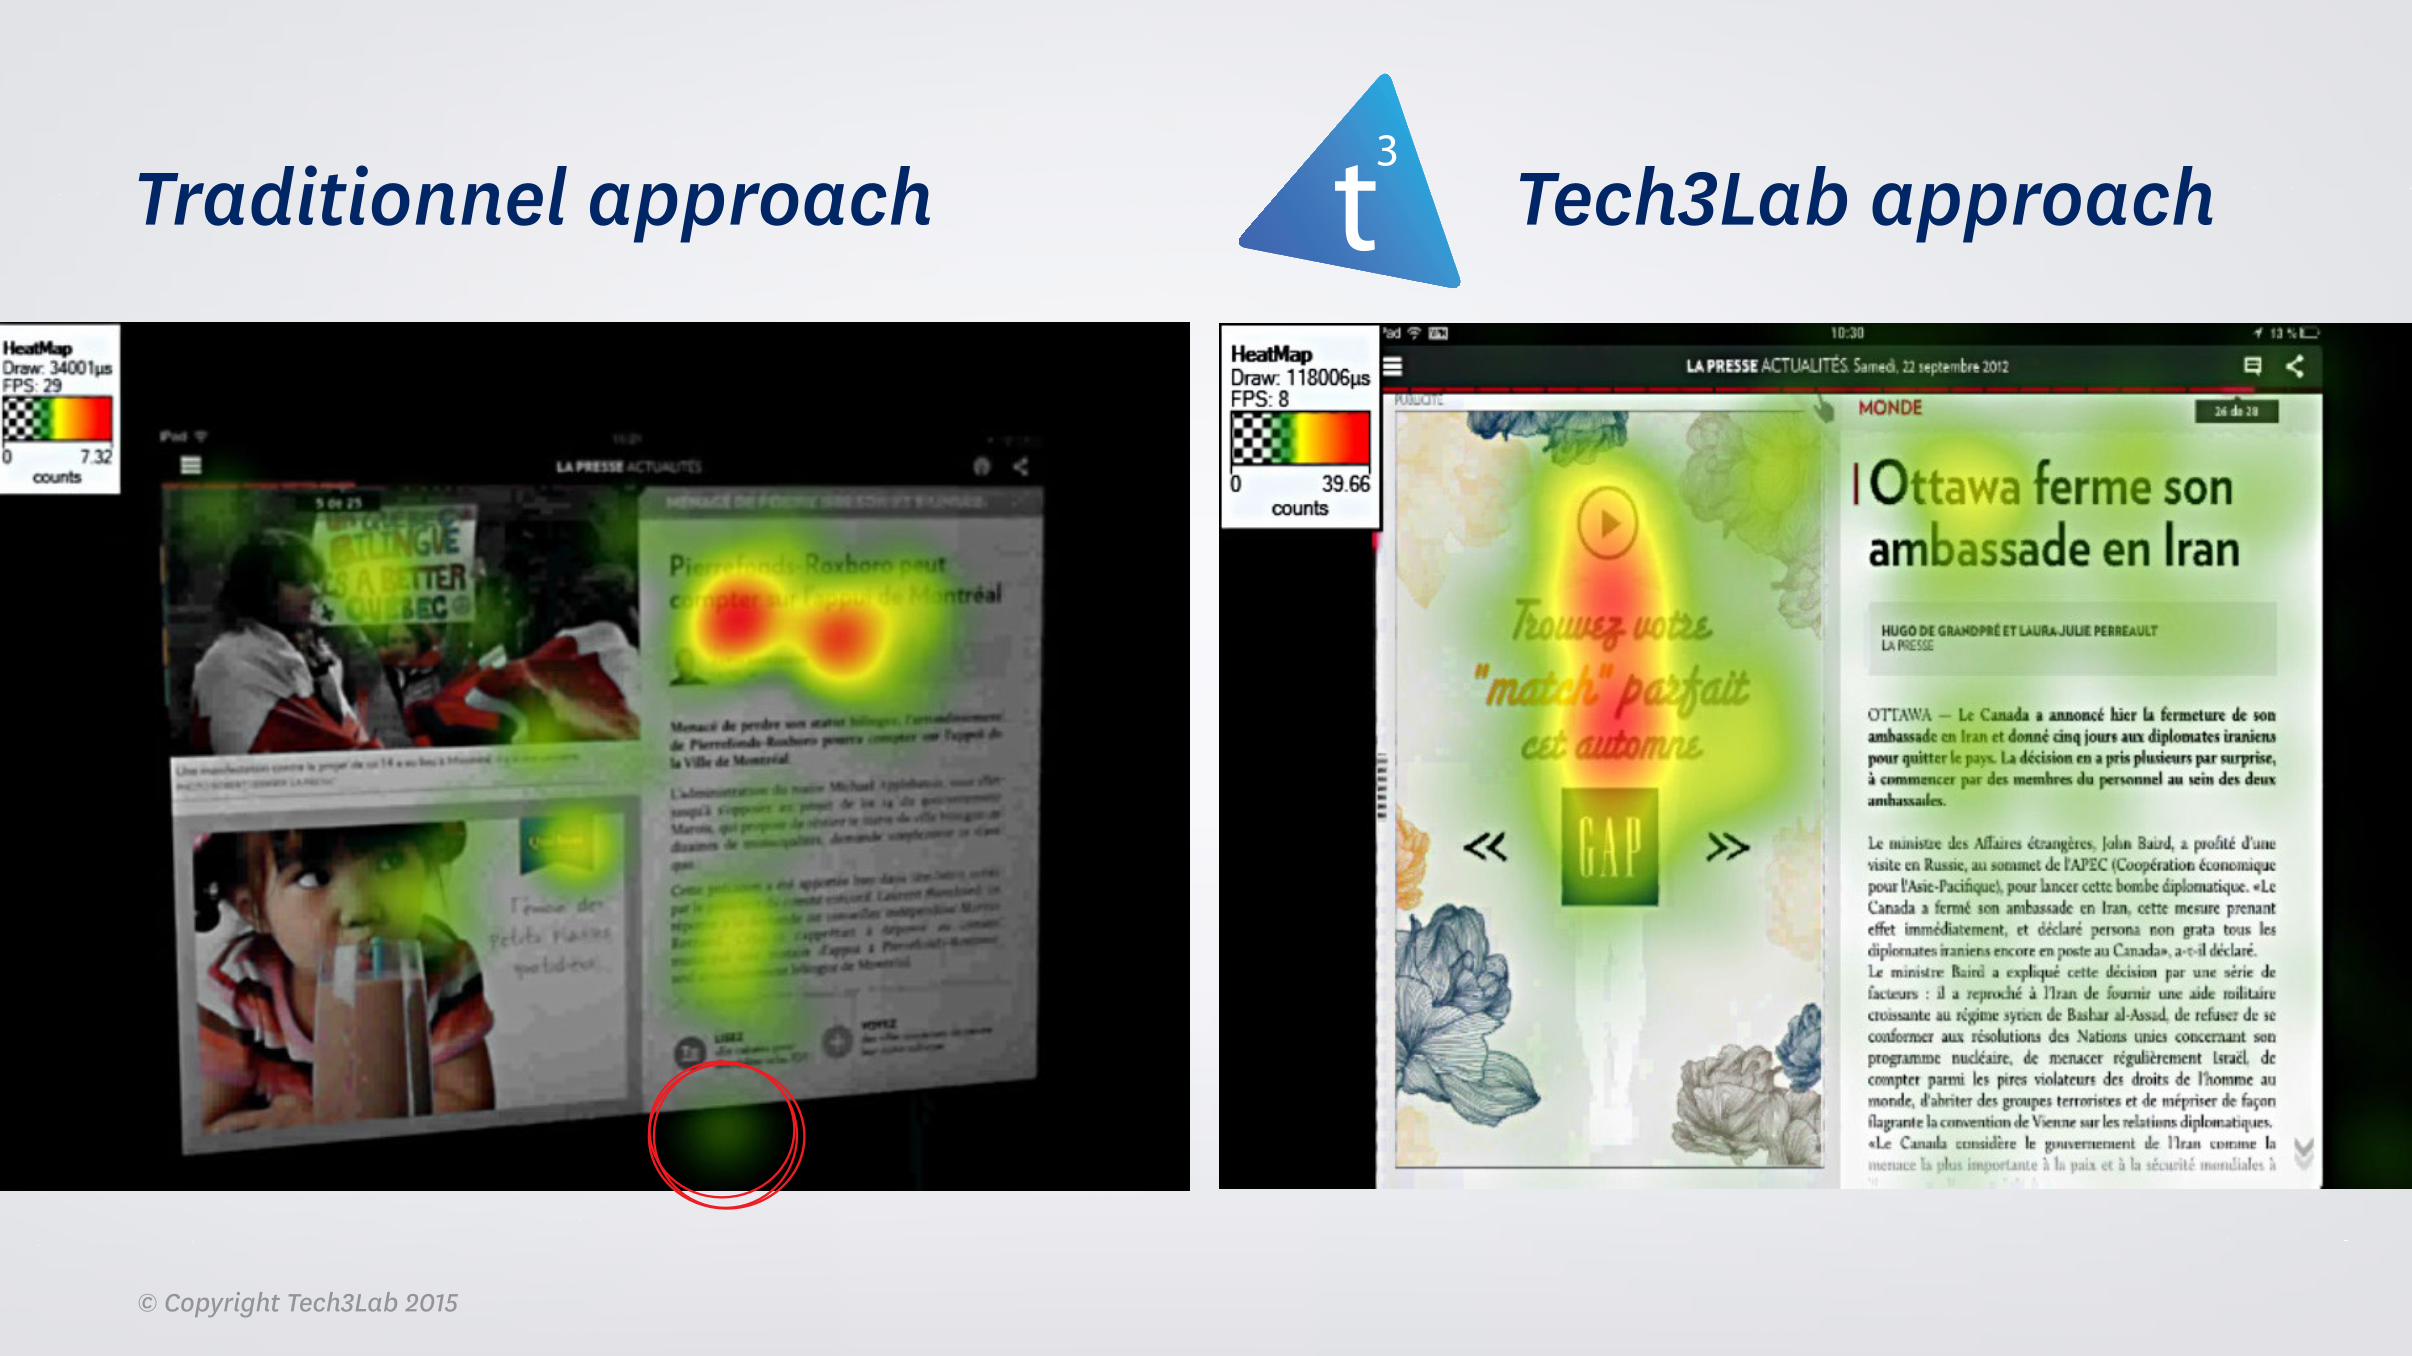
Traditionnel approach Tech3Lab approach
© Copyright Tech3Lab 2015
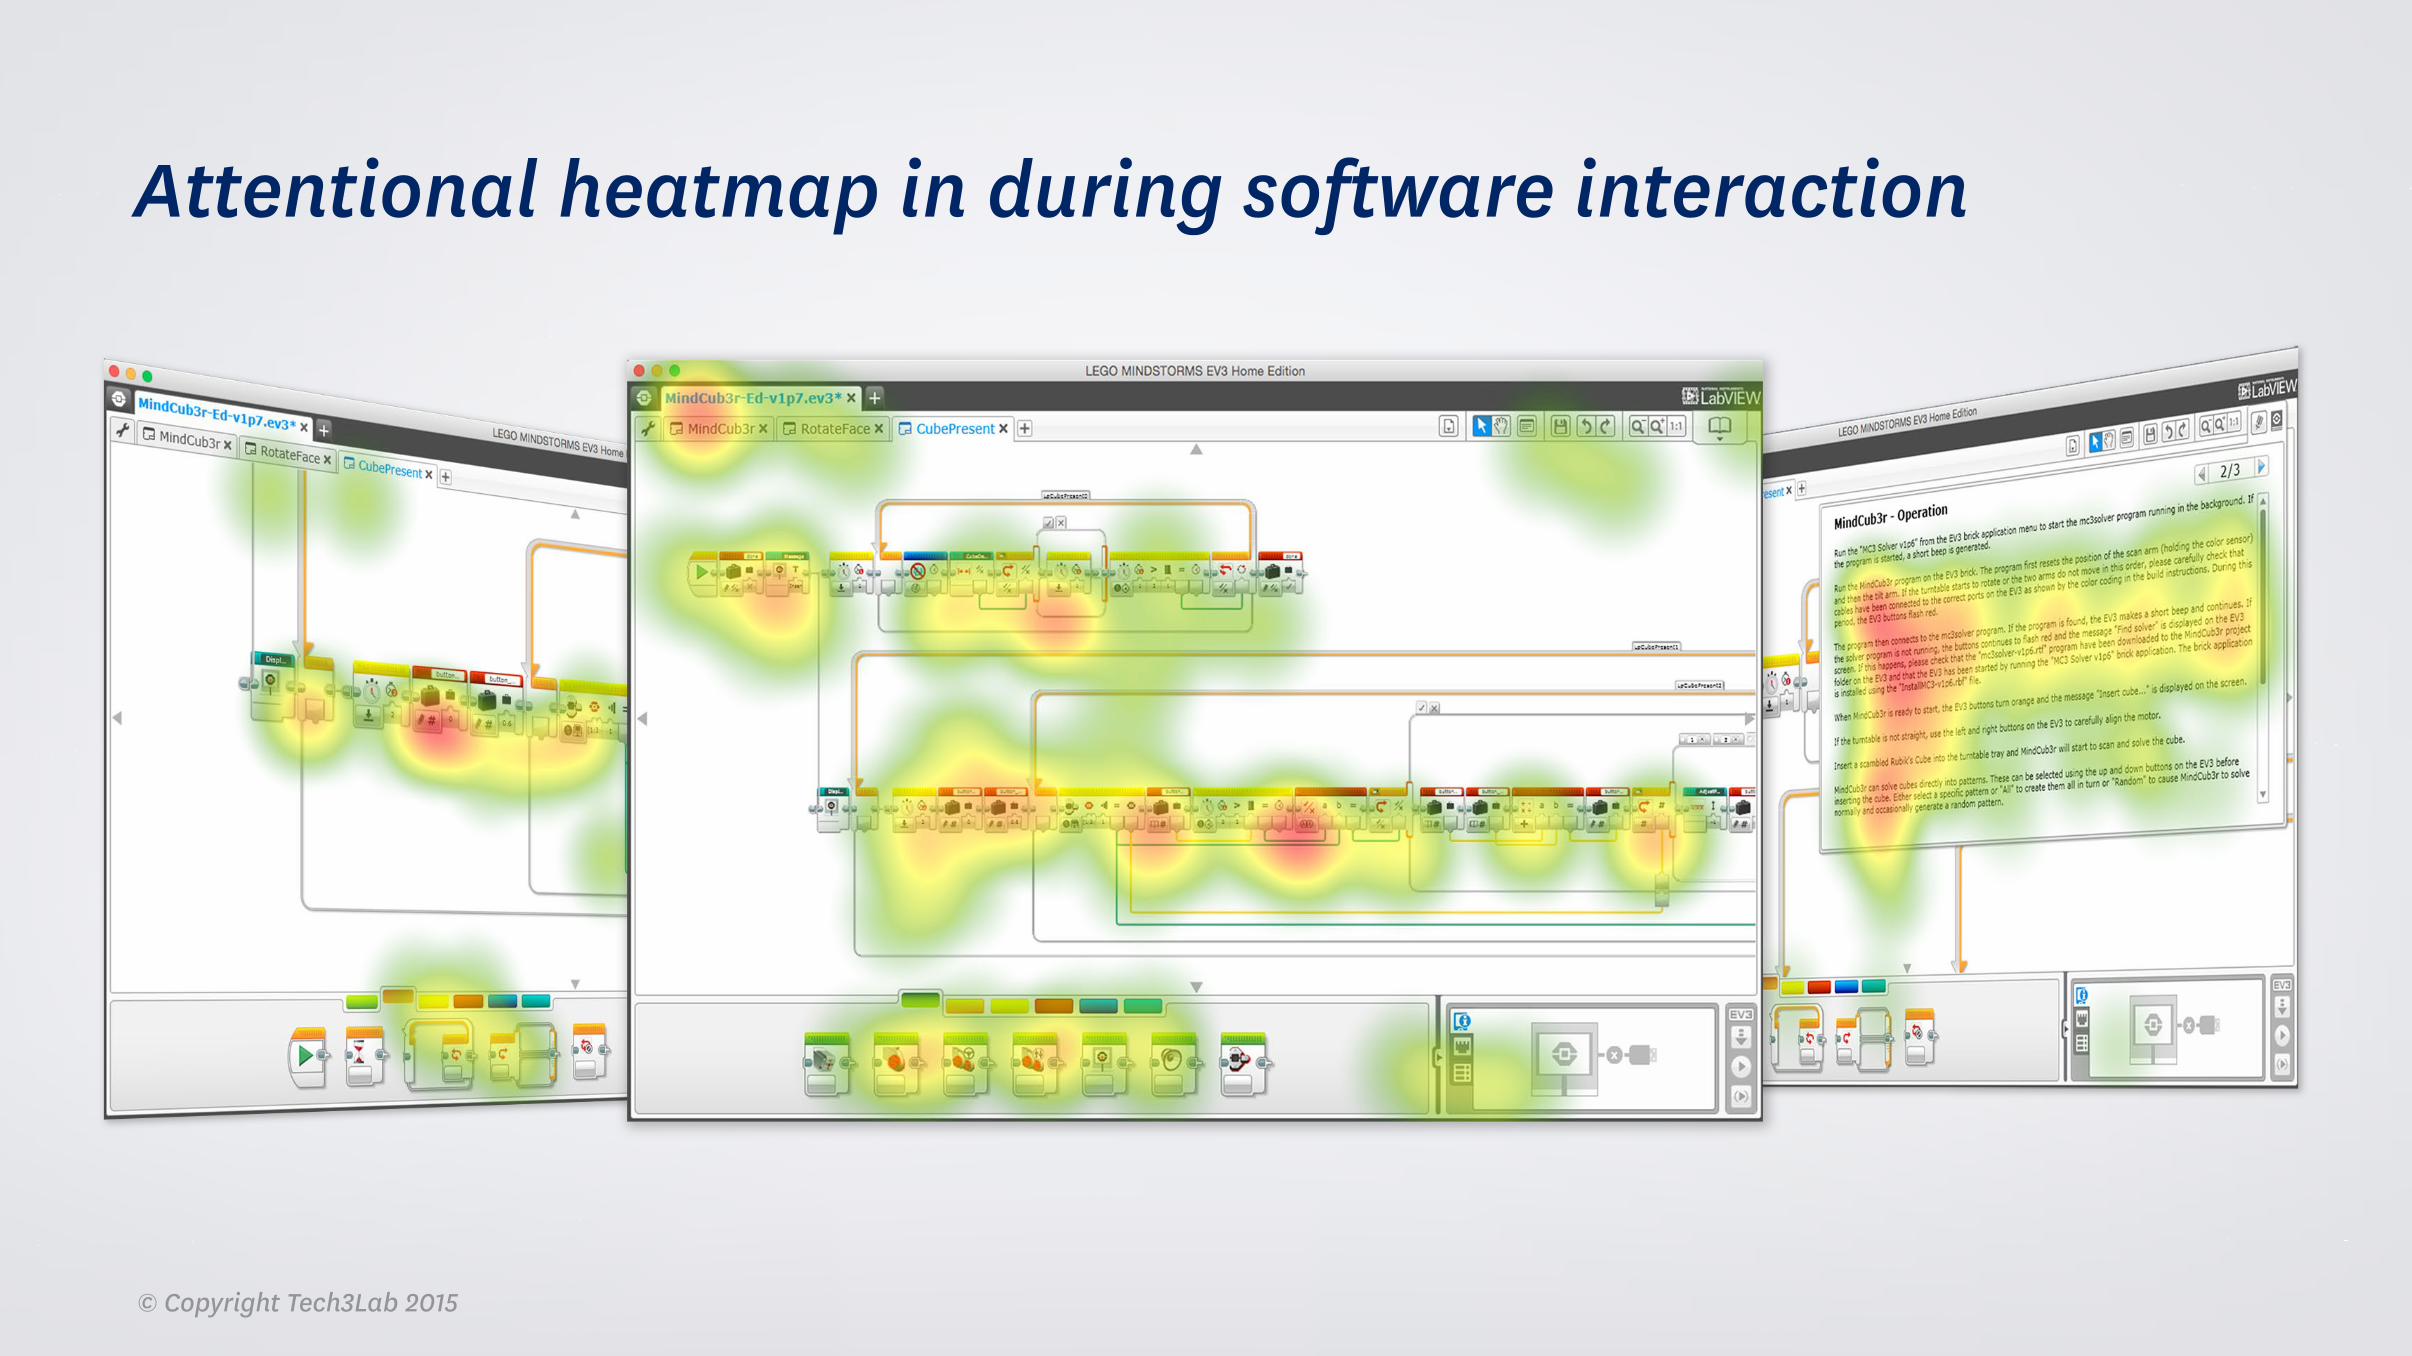
Attentional heatmap in during software interaction

Successful problem solvers are able to shift their visual attention from irrelevant factors and to concentrate on relevant cues
Source: Tsai et al, 2011
Author's personal copy
on Temperature, the only irrelevant factor for this problem, which merits a further examination for explanations. Now that differentproblem solving performances were observed among the participants, we further explored the group differences by carefully looking intoHot Zone image for each participant.
4.3. Hot Zone images
In order to describe an entire picture of a participant’s visual attention on the stimuli image, we analyzed the Hot Zone images (shown inFig. 5 and Fig. 6) produced byMATLAB programming. In the image, the mapped color varied from individuals’ total fixation duration at eachpixel on the screen. The darker the red color was, the longer the total fixation duration accumulated on a pixel. Therefore, the red or orangespots (i.e., Hot Zones) represented locations where the information had been processed longer and more deeply by participants while bluecolors represented locations where the information had been minimally processed.
By examining each participant’s Hot Zone image, one interesting thing was found that individual differences existed in students’attention allocations among factors and options. For example, participant #4 (Fig. 5) and participant #6 (Fig. 6) paid most attention tooptions AB and AD, respectively, while participant #4 and participant #6 selected option B and D respectively. This was, to some degree,consistent with the results of the post-hoc comparison between chosen and rejected options, suggesting that while solving a multiple-
Table 2Performance evaluation of students’ multiple-choice problem solving.
Subject ID Answer Reasons from verbal reporting Correctness (B/AB: Yes;otherwise: No)
# of relevant factorreported properly (factorsa)
Levelof performance
#1 C “.because of the heavy rainfall and the arecasare not good for water and soil conservation.”
No 1(R) Low
#2 B “.because of the heavy rainfall and no treesbut rocks anywhere.”
Yes 2(R, D) High
#3 BC “.because no trees in B and arecas are not goodfor water and soil conservation in C.”
No 0(none) Low
#4 B “.because the slide angle is large enough andno trees but rocks on the slide.”
Yes 2(S, D) High
#5 B “..because of the higher rainfall and no treesbut rocks on the slide.”
Yes 2(R, D) High
#6 D “.because it is in a city with a normal rainfall.” No 0(R, not properly) Low
a R ¼ Rainfall, D ¼ Debris, S¼Slope.
Fig. 5. The Hot Zone image for participant #4 (categorized in high-score performance group, with a response of B) showed that the participant paid most attention on option A andB, especially on factor R, D and T. The Chinese title states that “Please select the image(s) inferring a landslide would occur (single/multiple selection) and justify your selection(s).”
M.-J. Tsai et al. / Computers & Education 58 (2011) 375–385 381
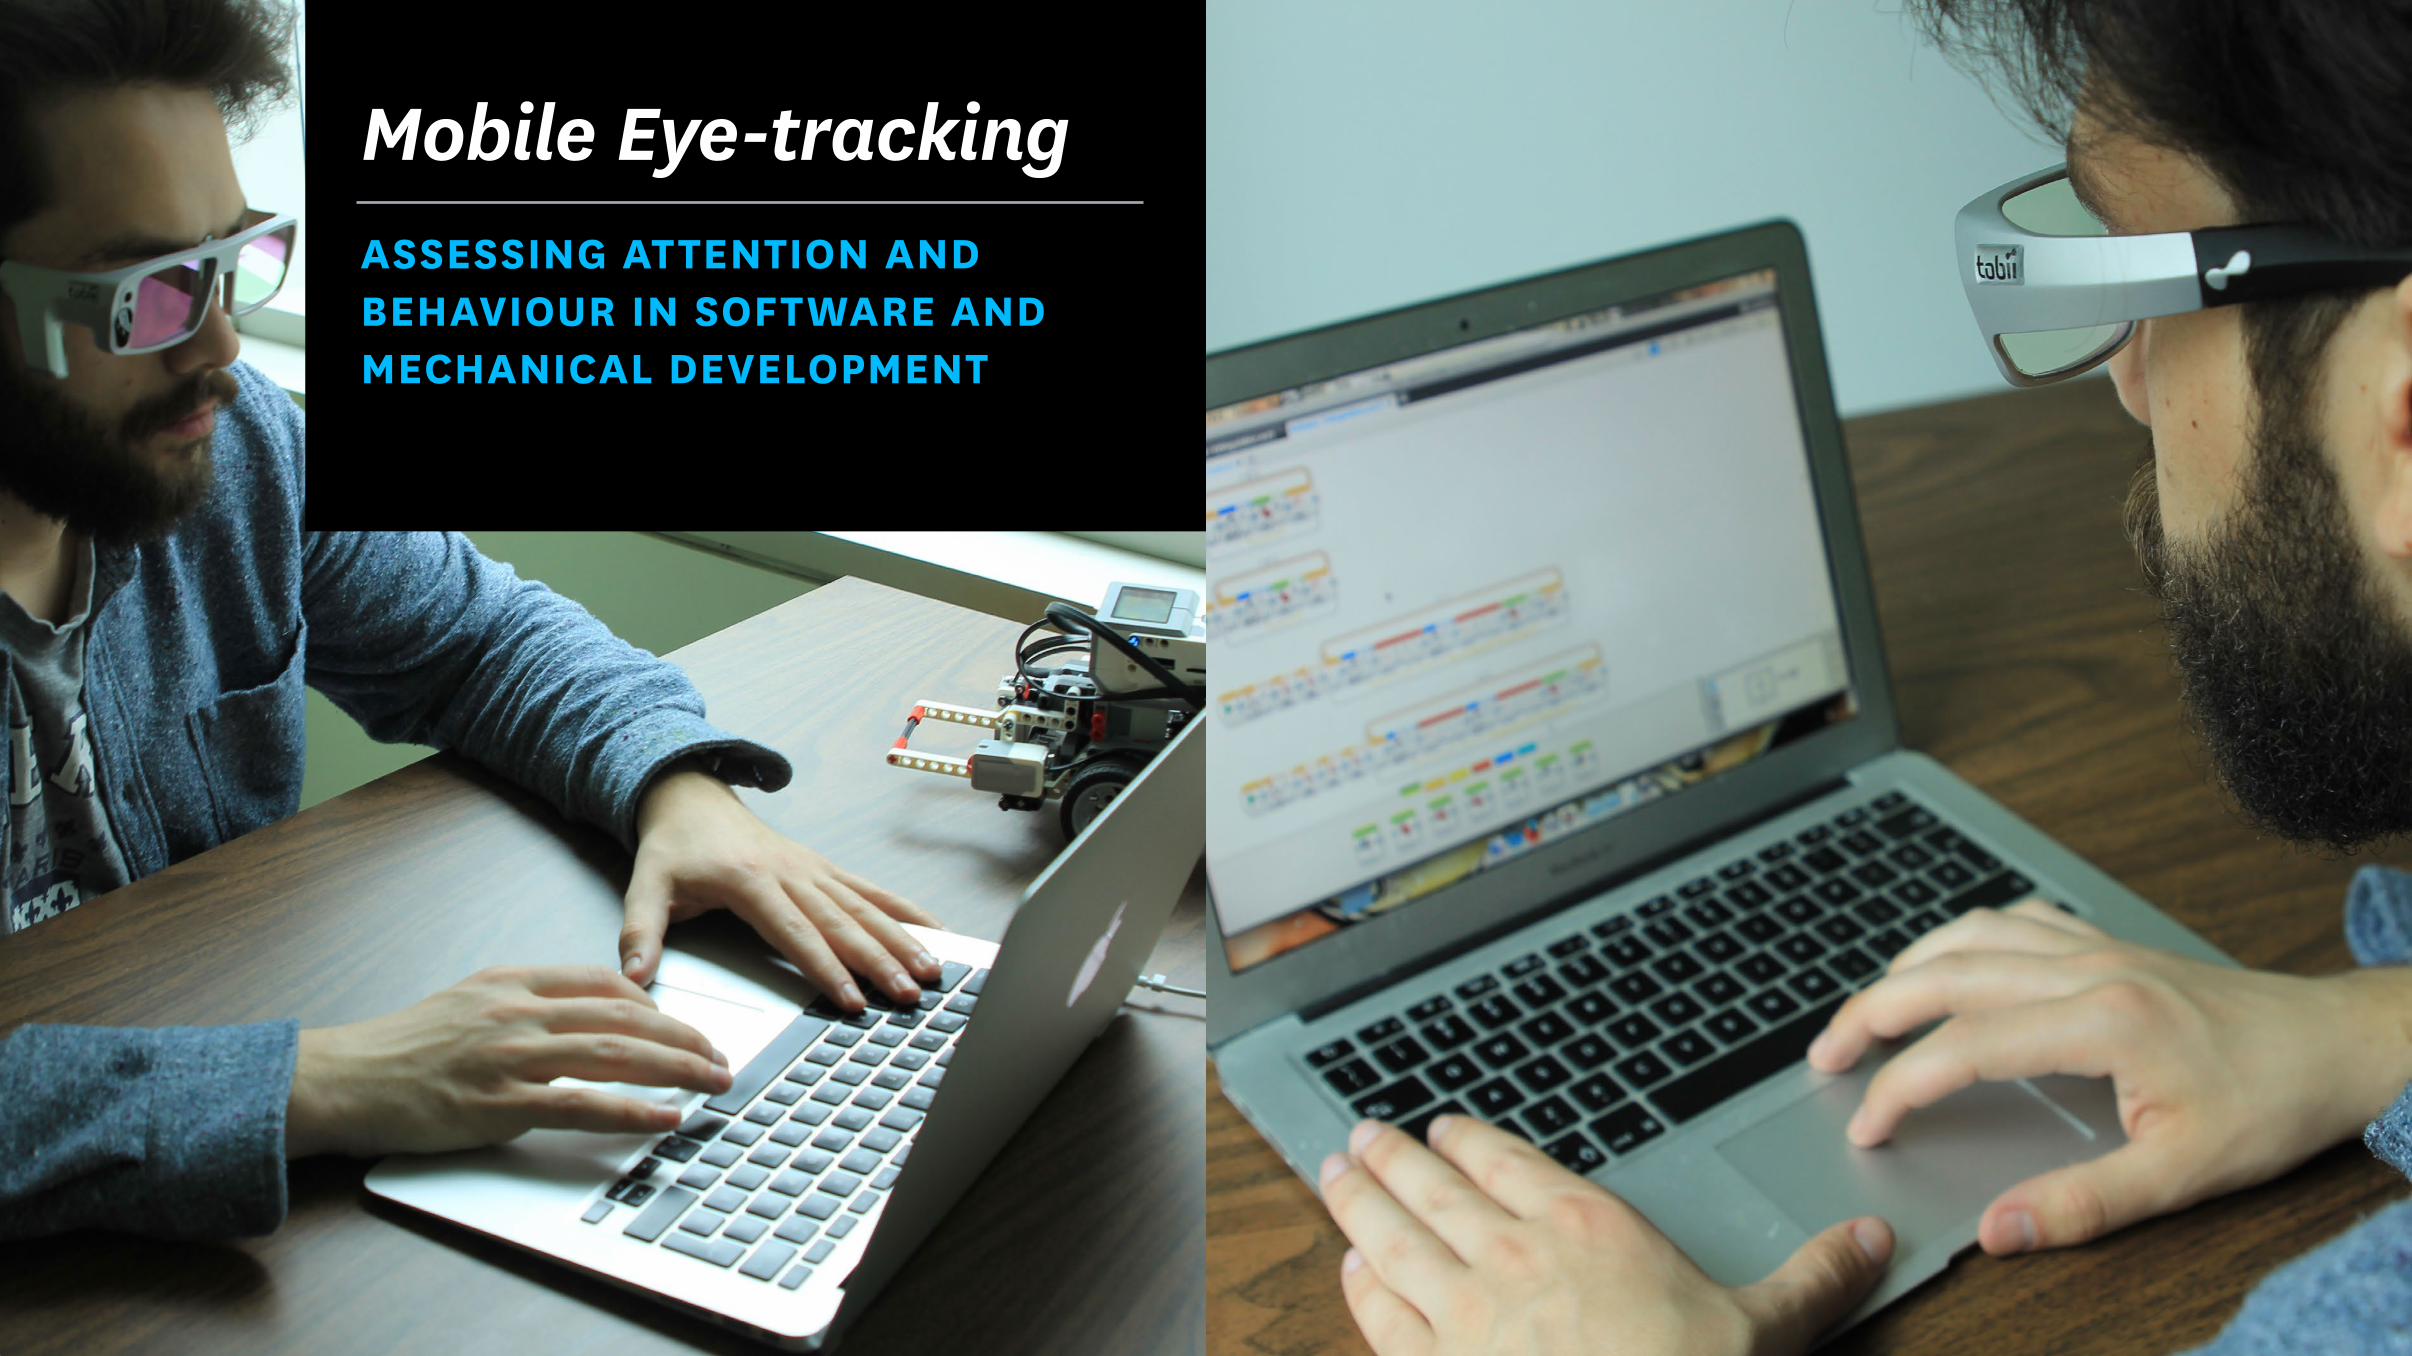
Mobile Eye-tracking AssEssInG AttEntIOn AnD bEhAVIOUR In sOftwARE AnD MEChAnICAL DEVELOPMEnt
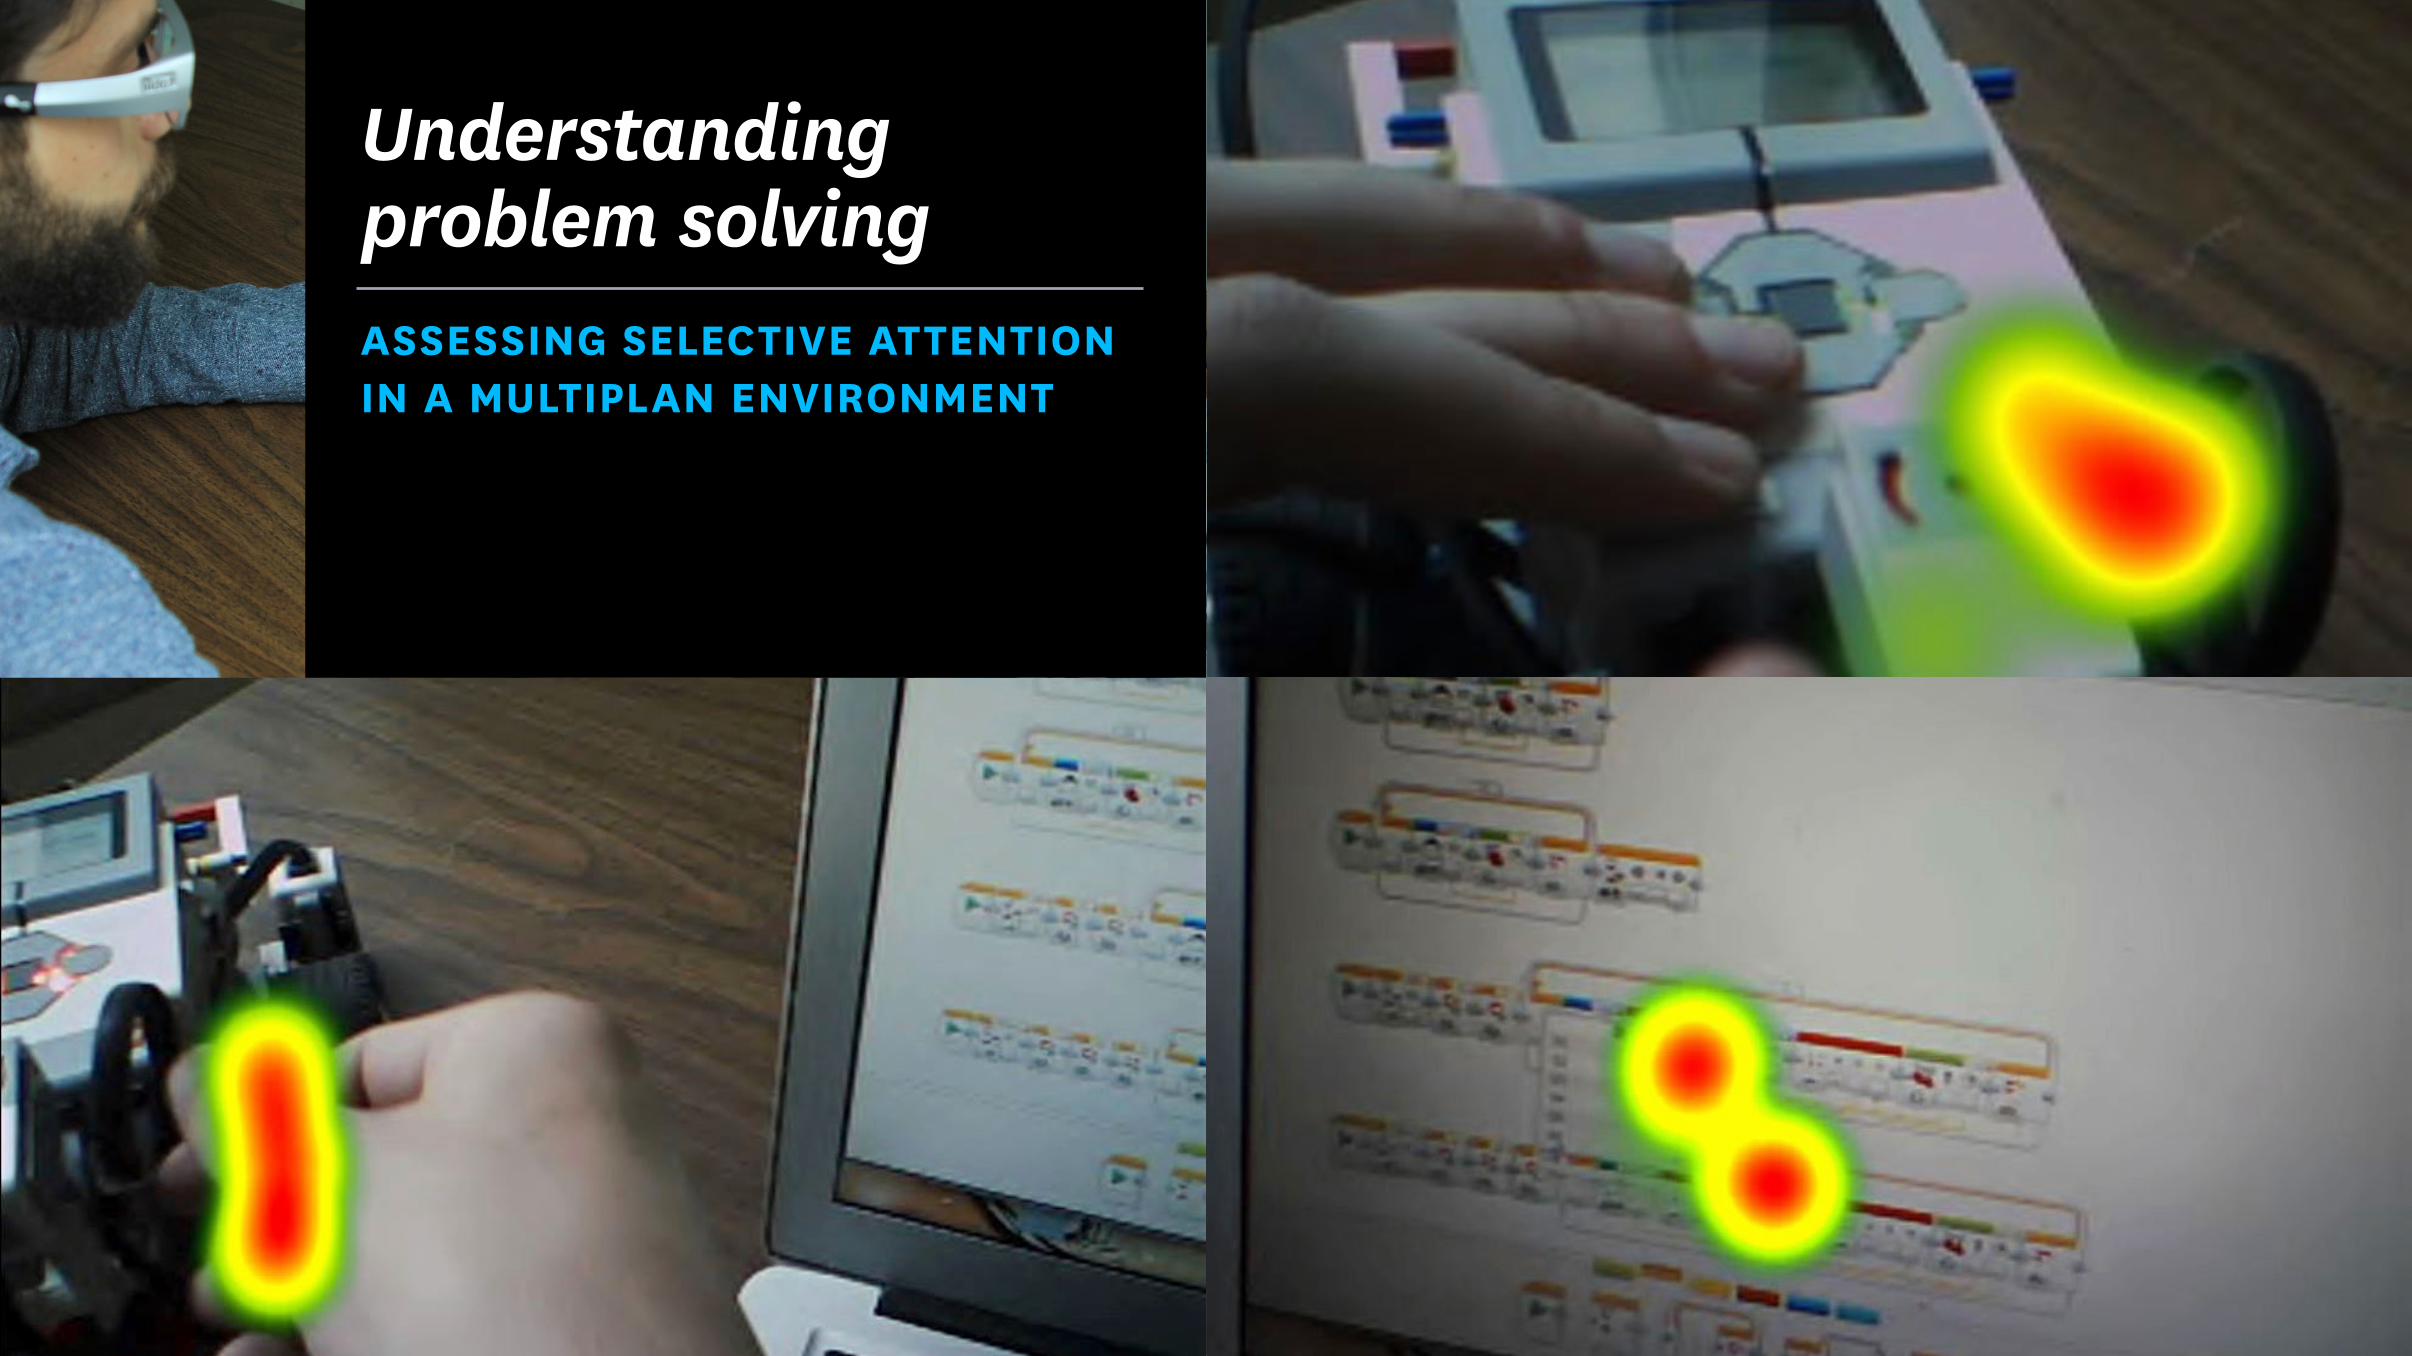
Understanding problem solvingAssEssInG sELECtIVE AttEntIOn In A MULtIPLAn EnVIROnMEnt
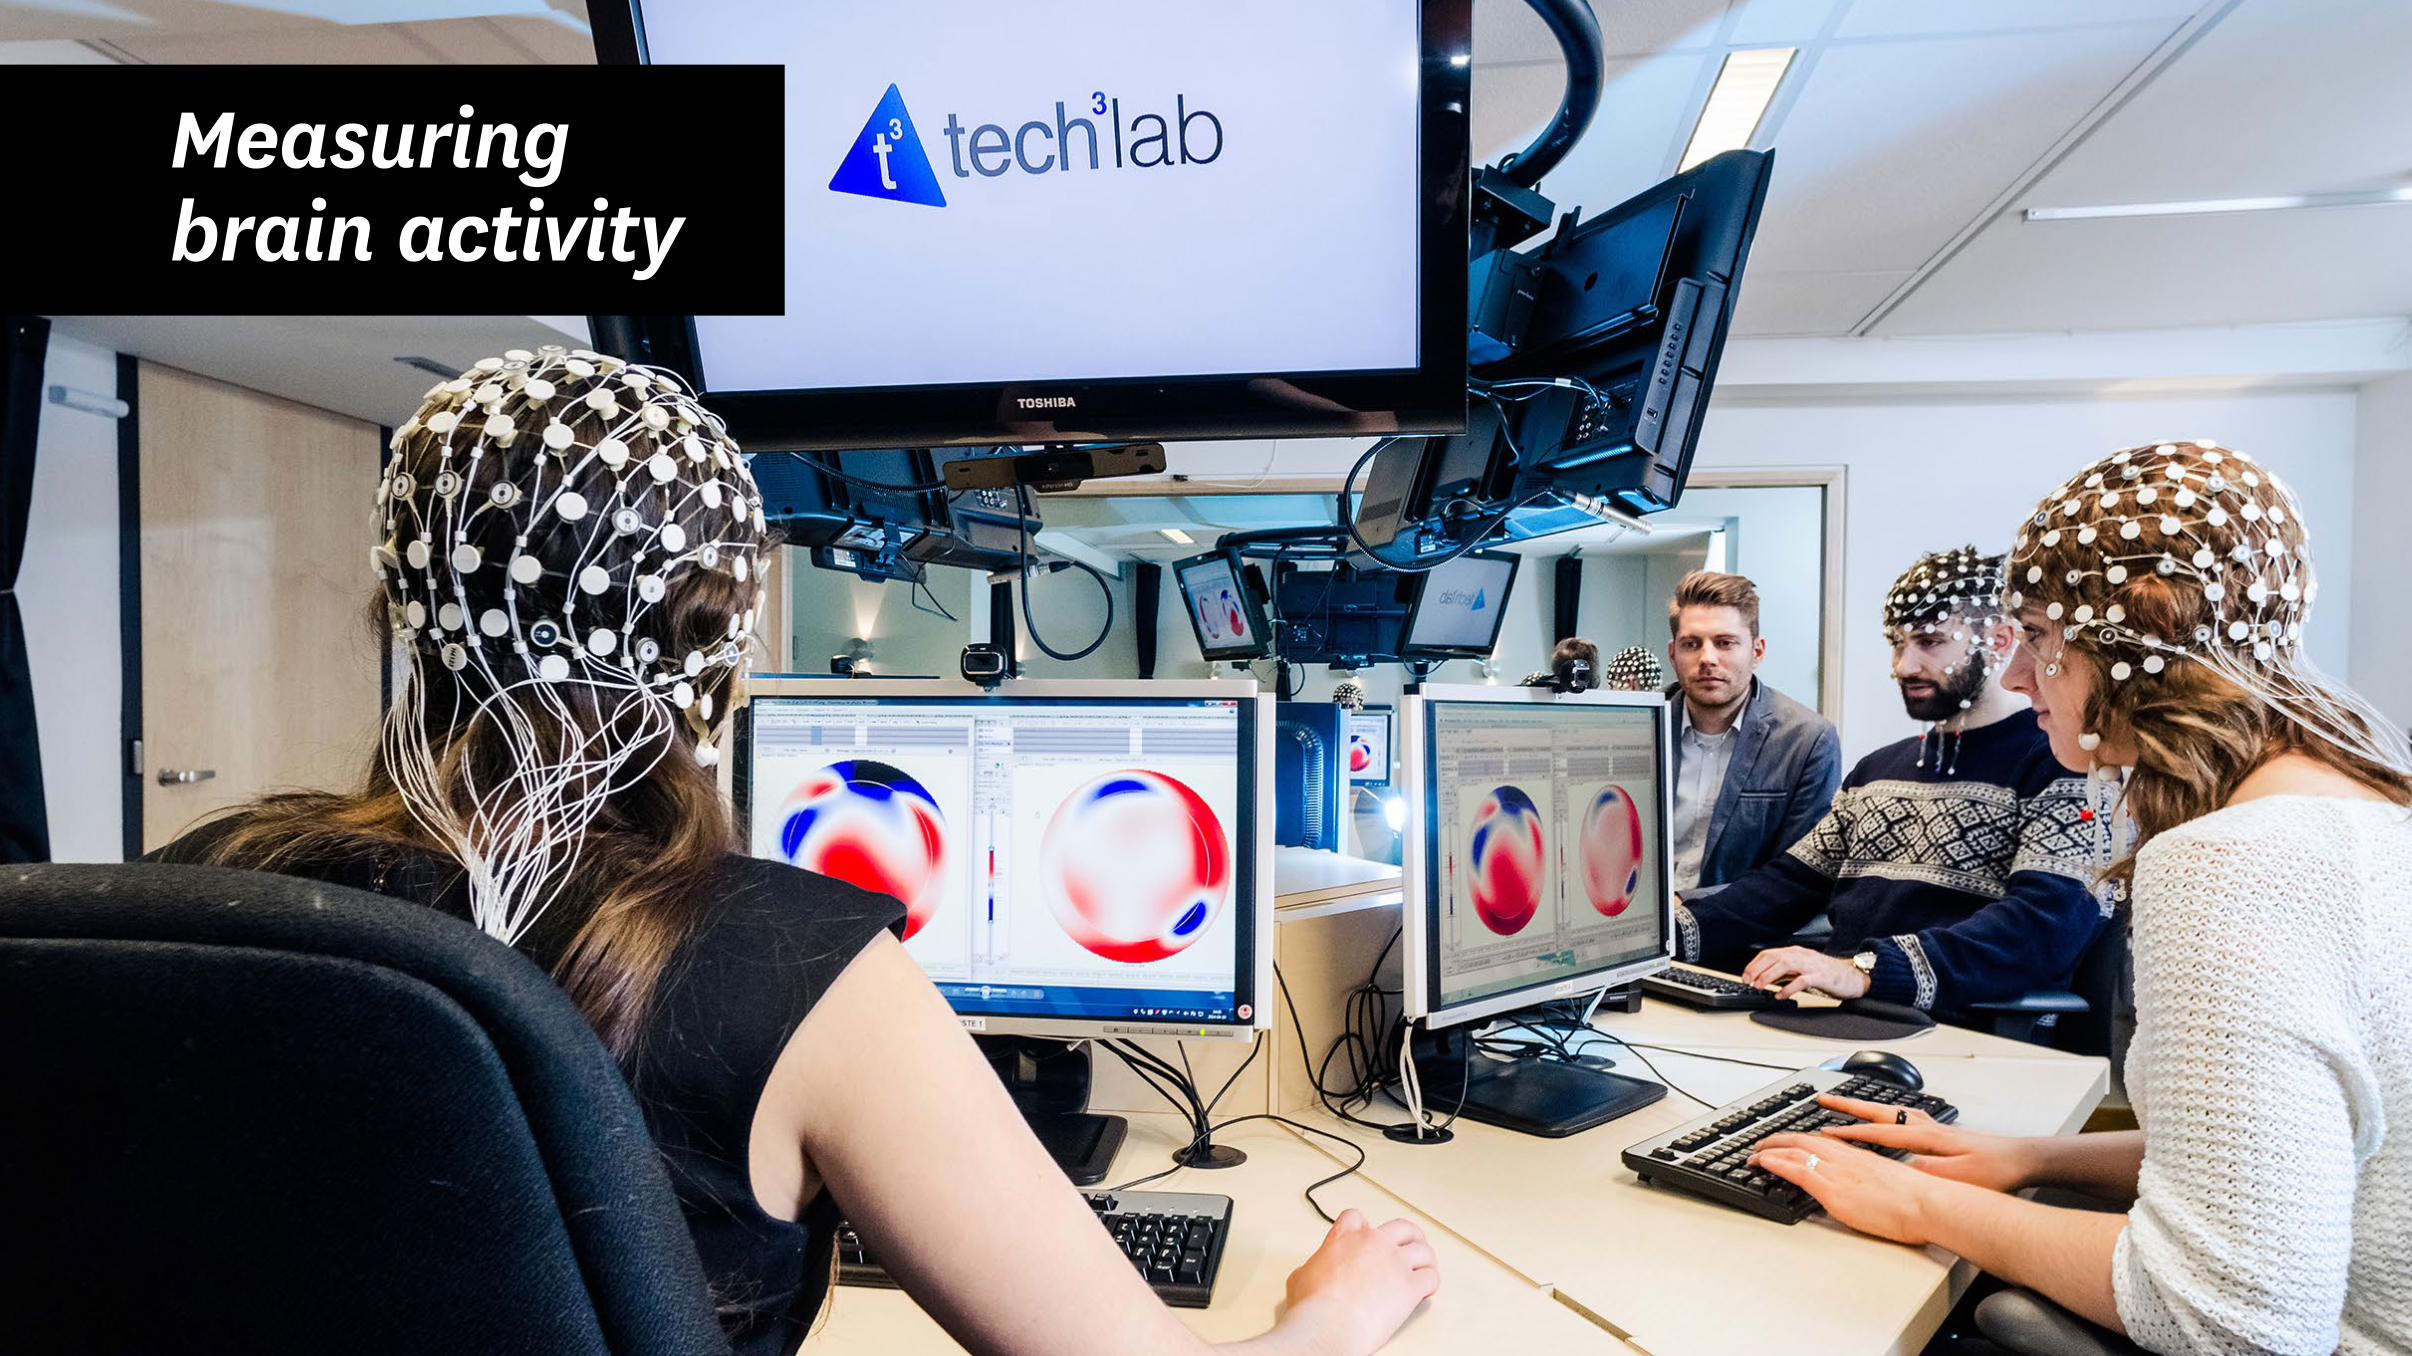
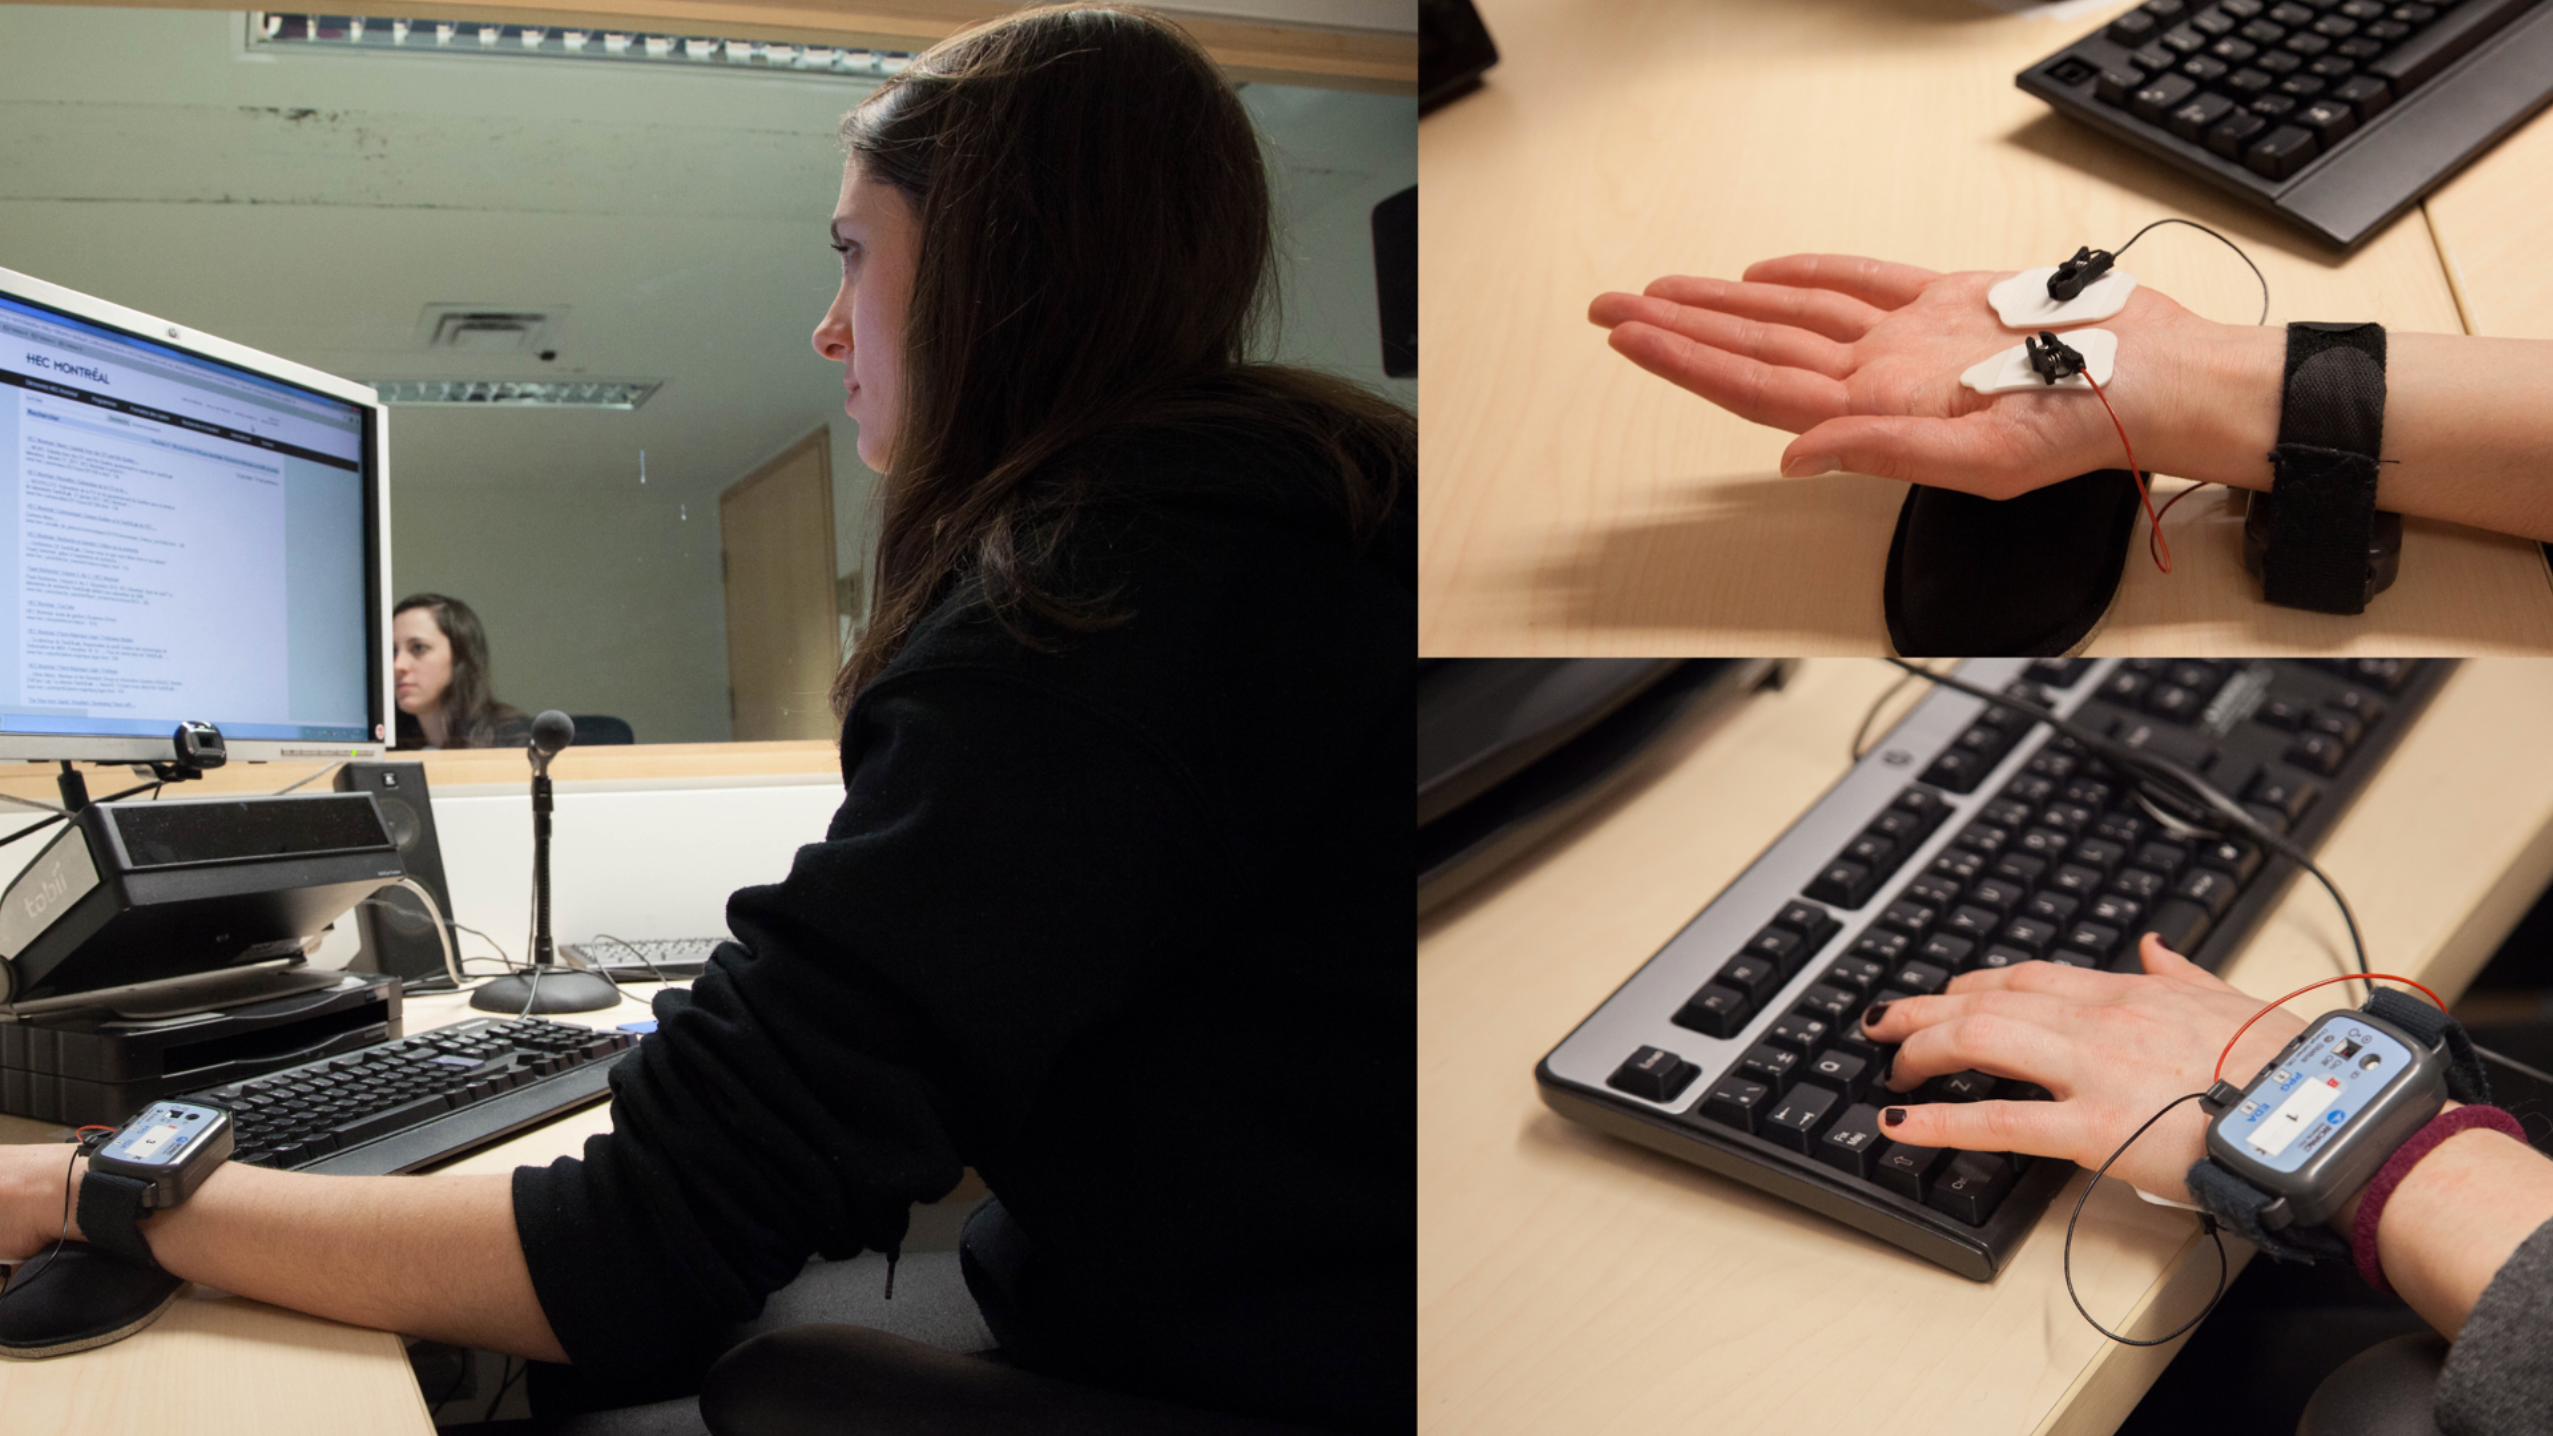
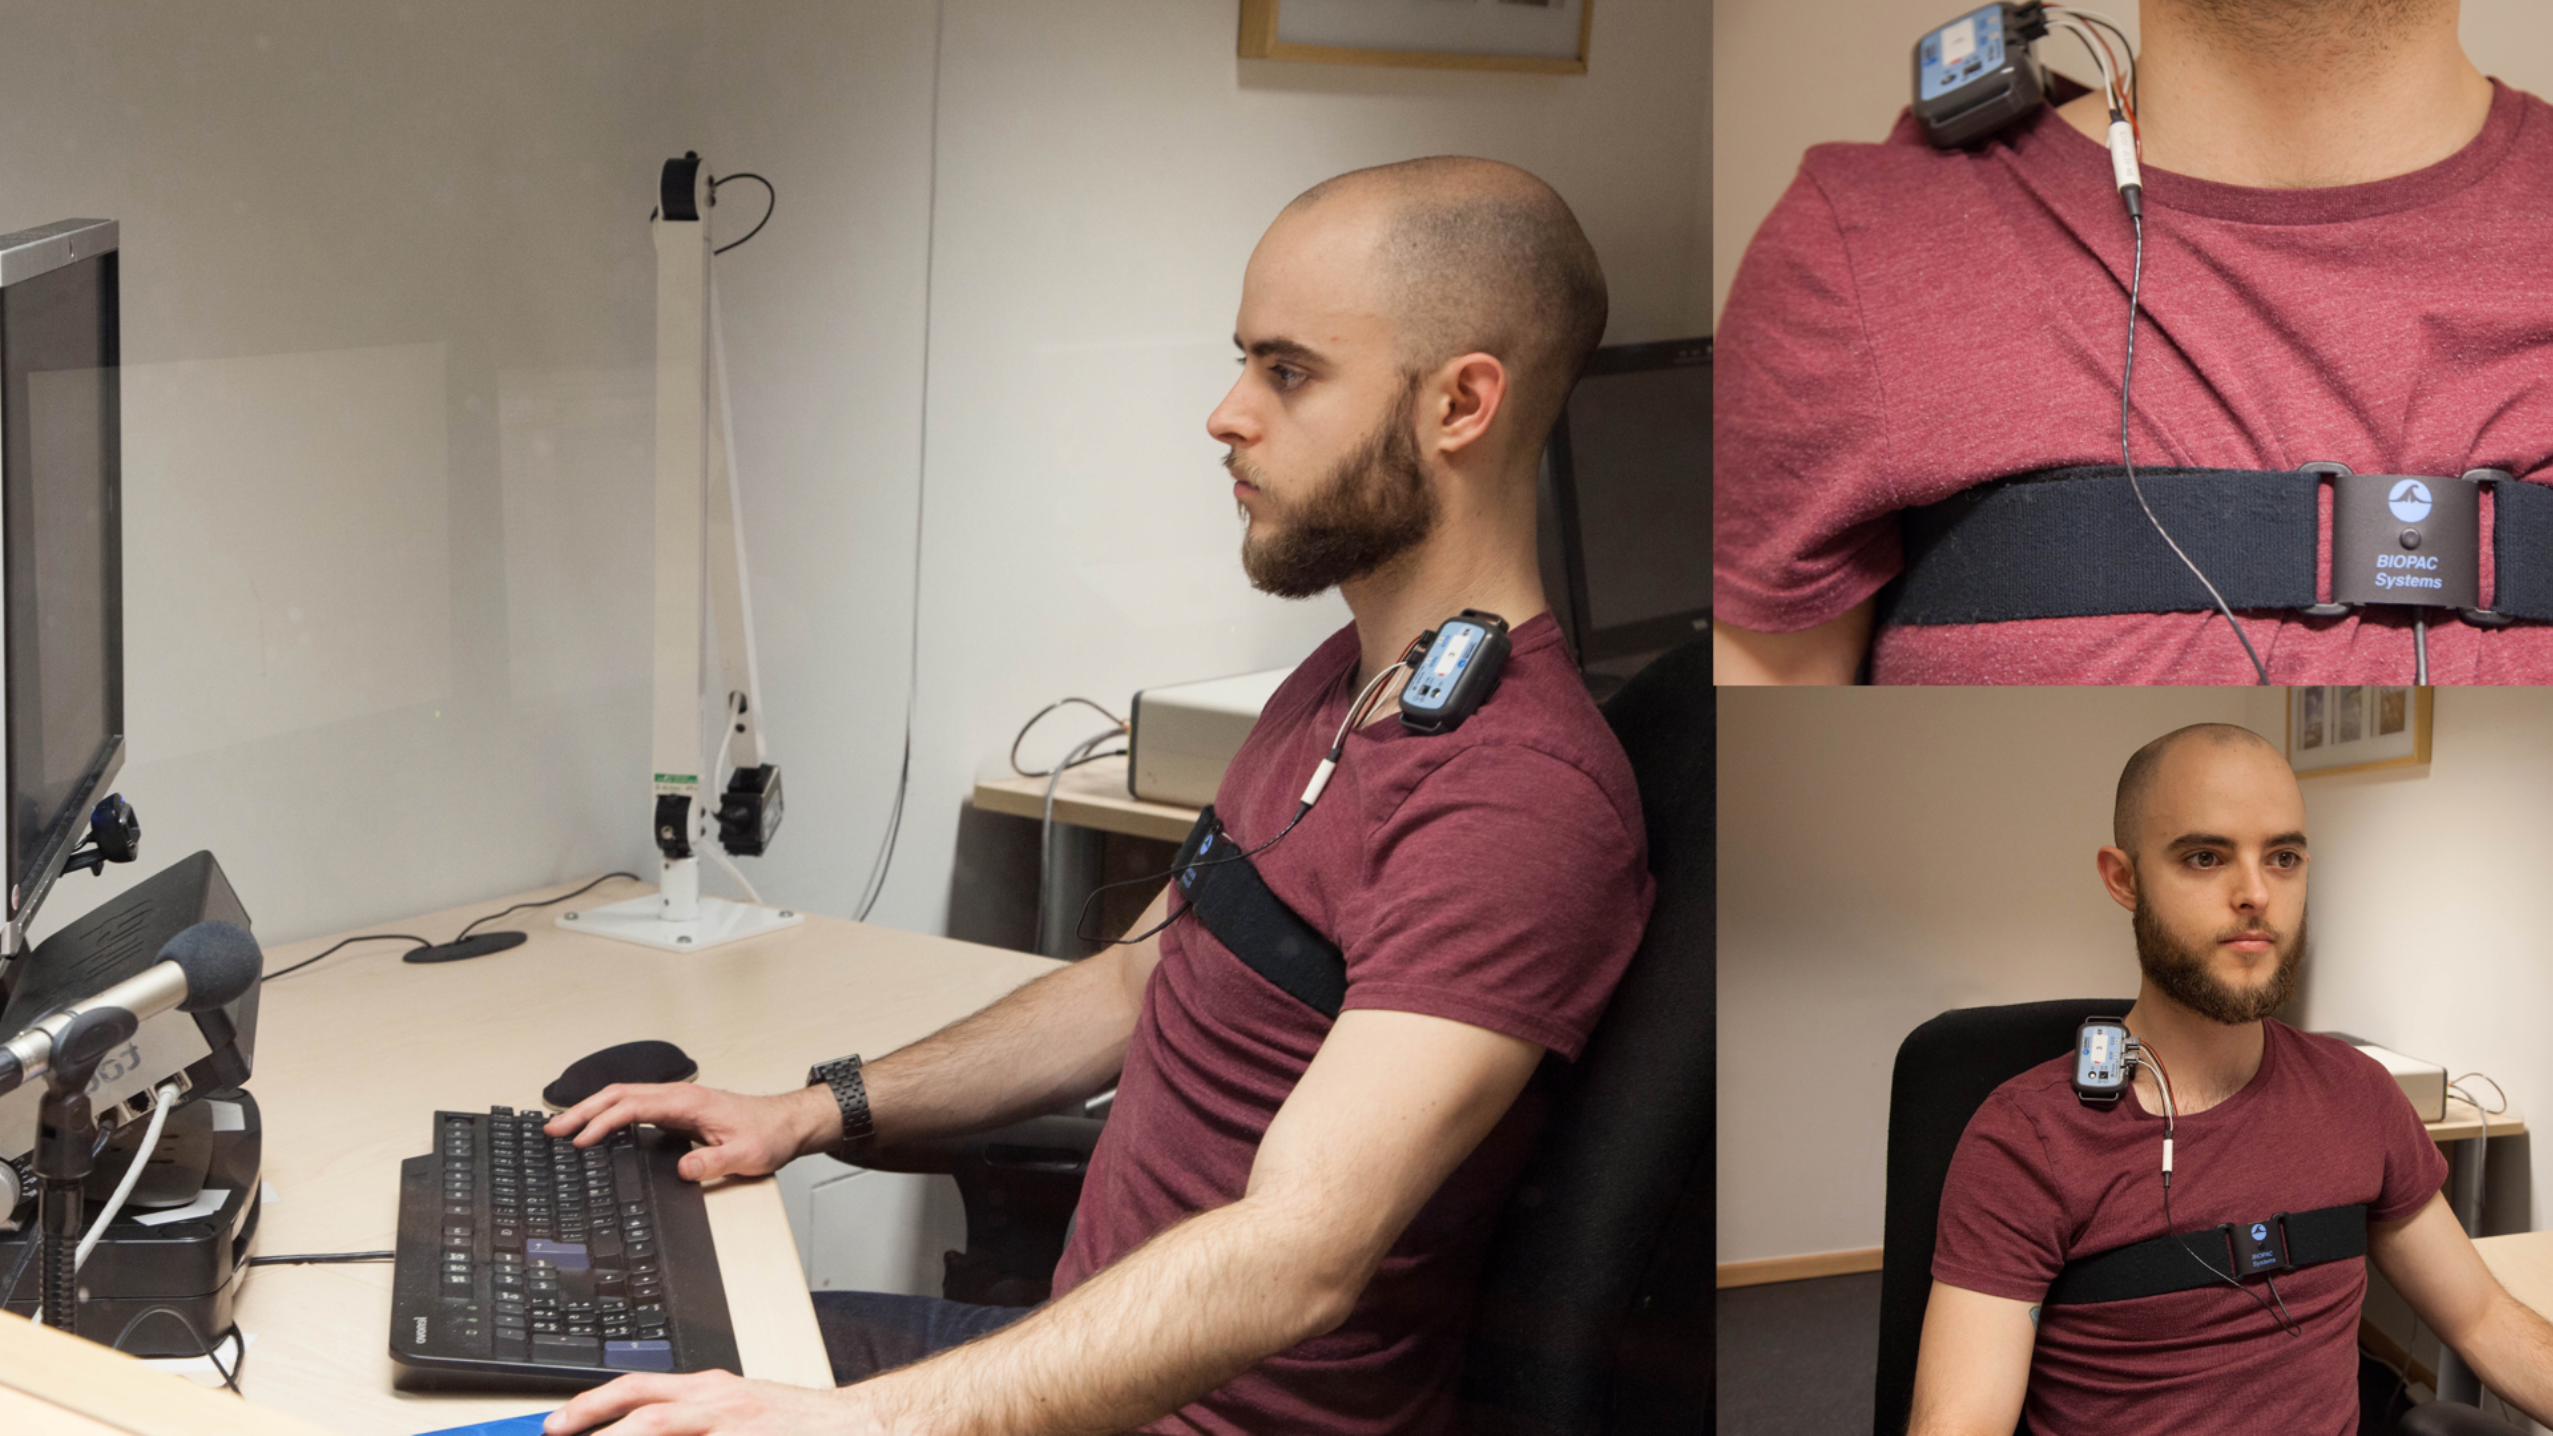
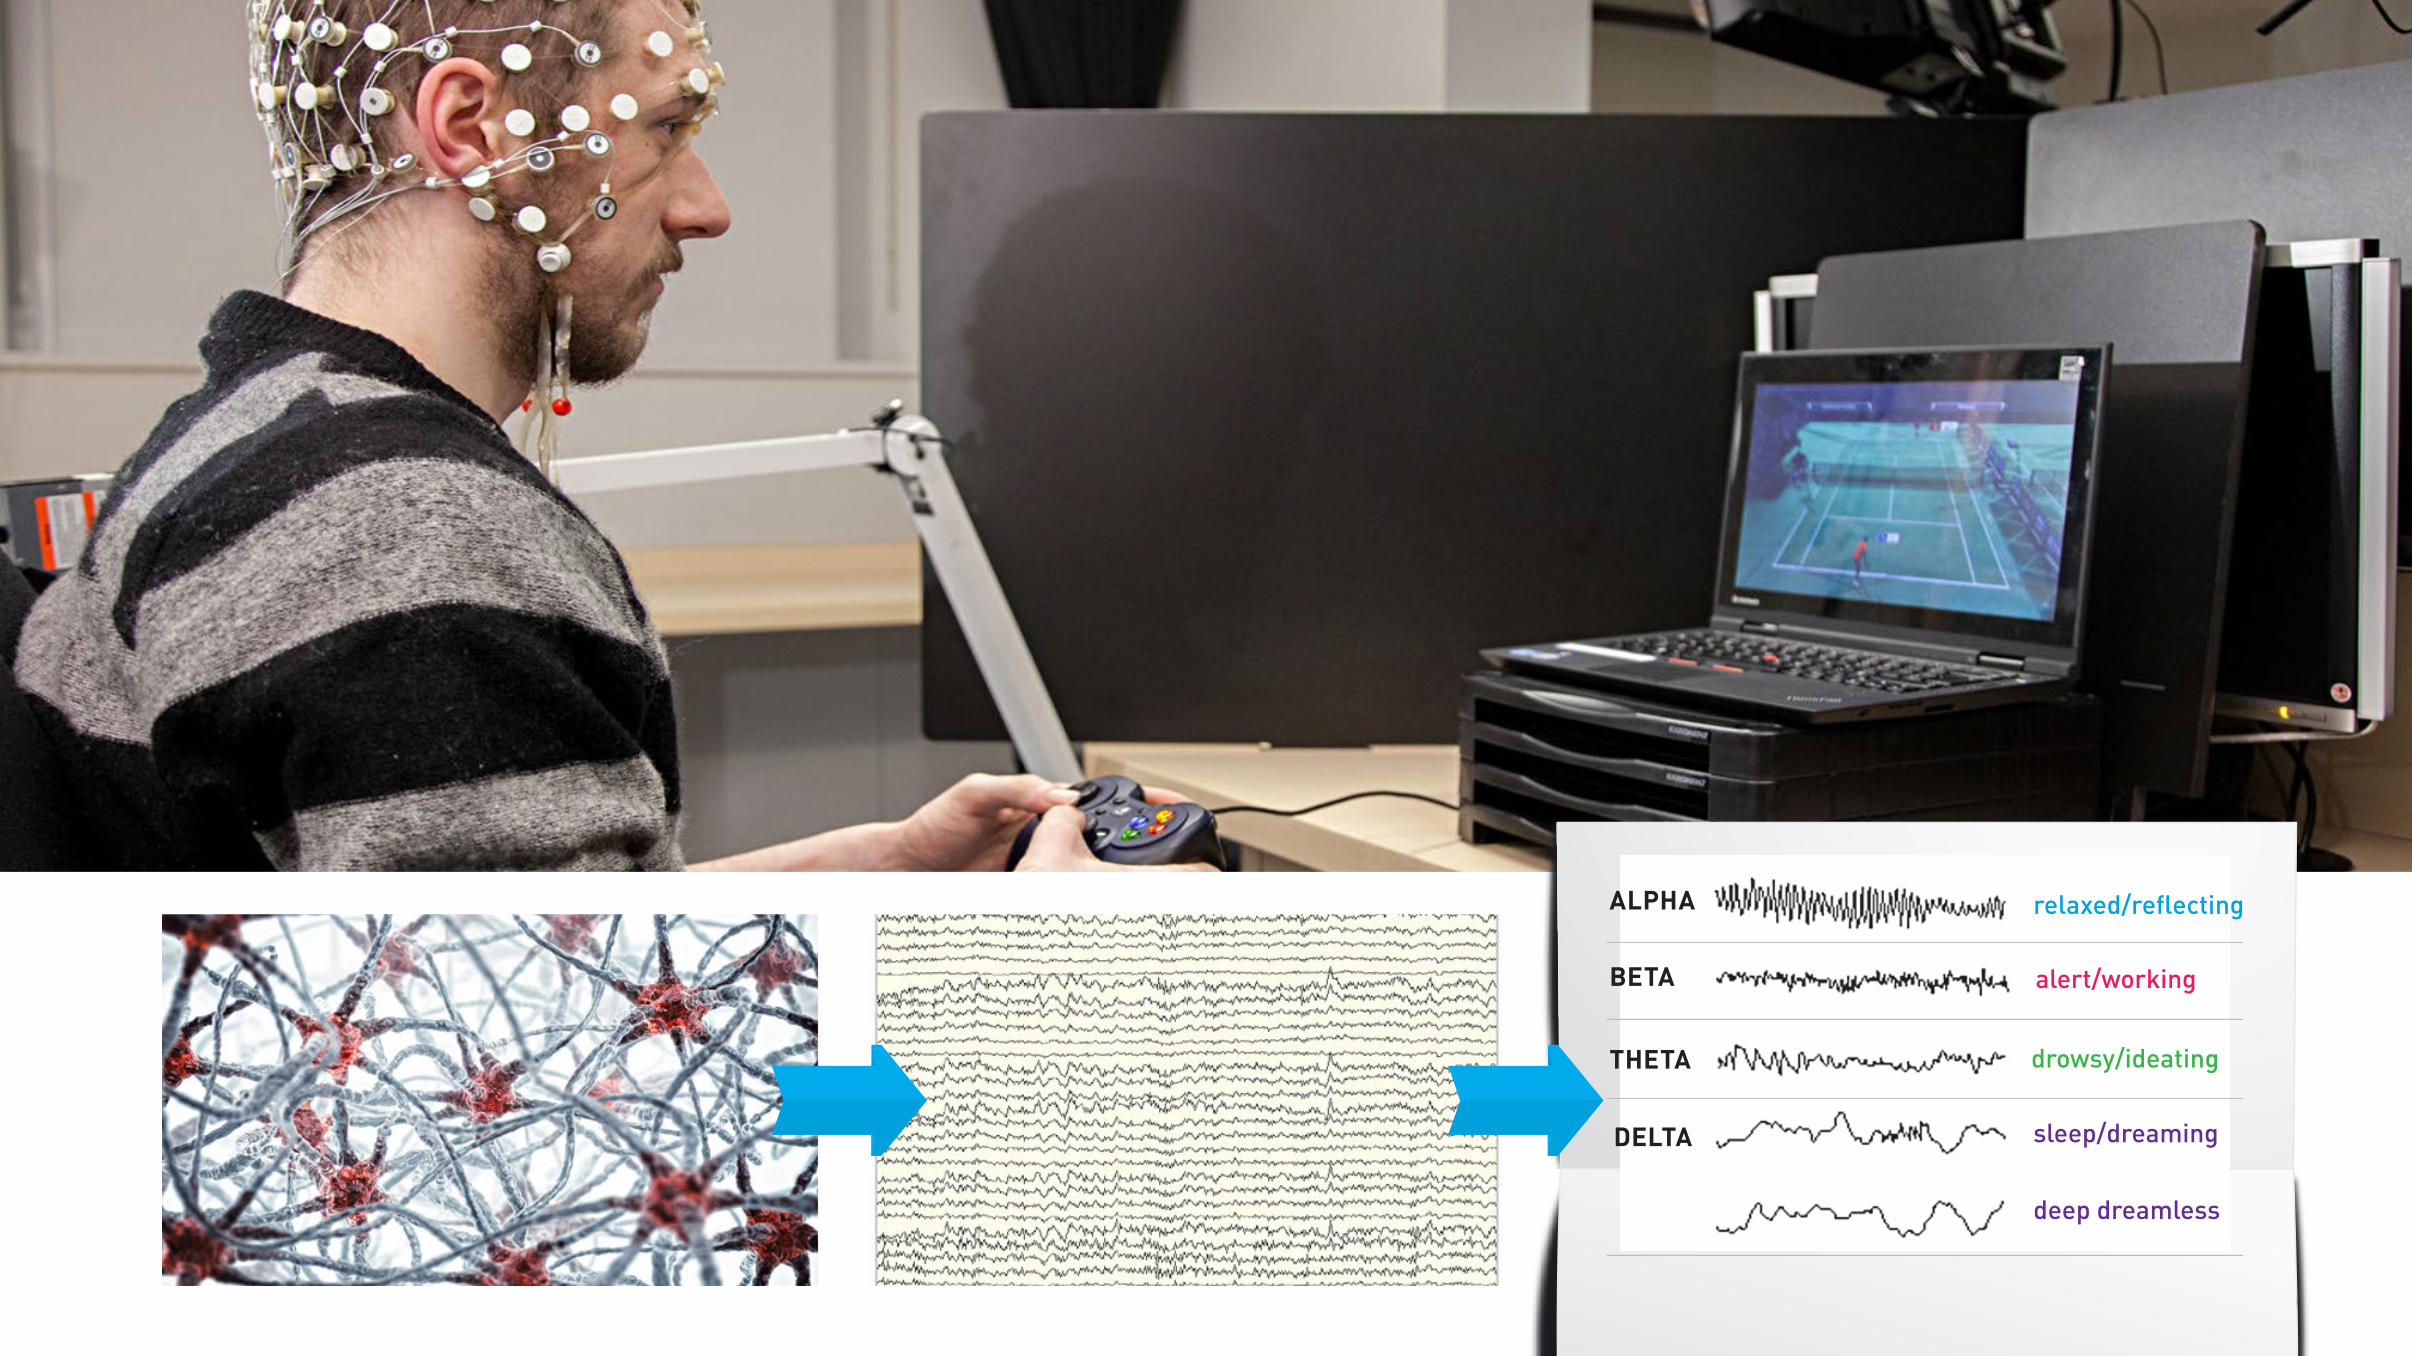
Measuring brain activity
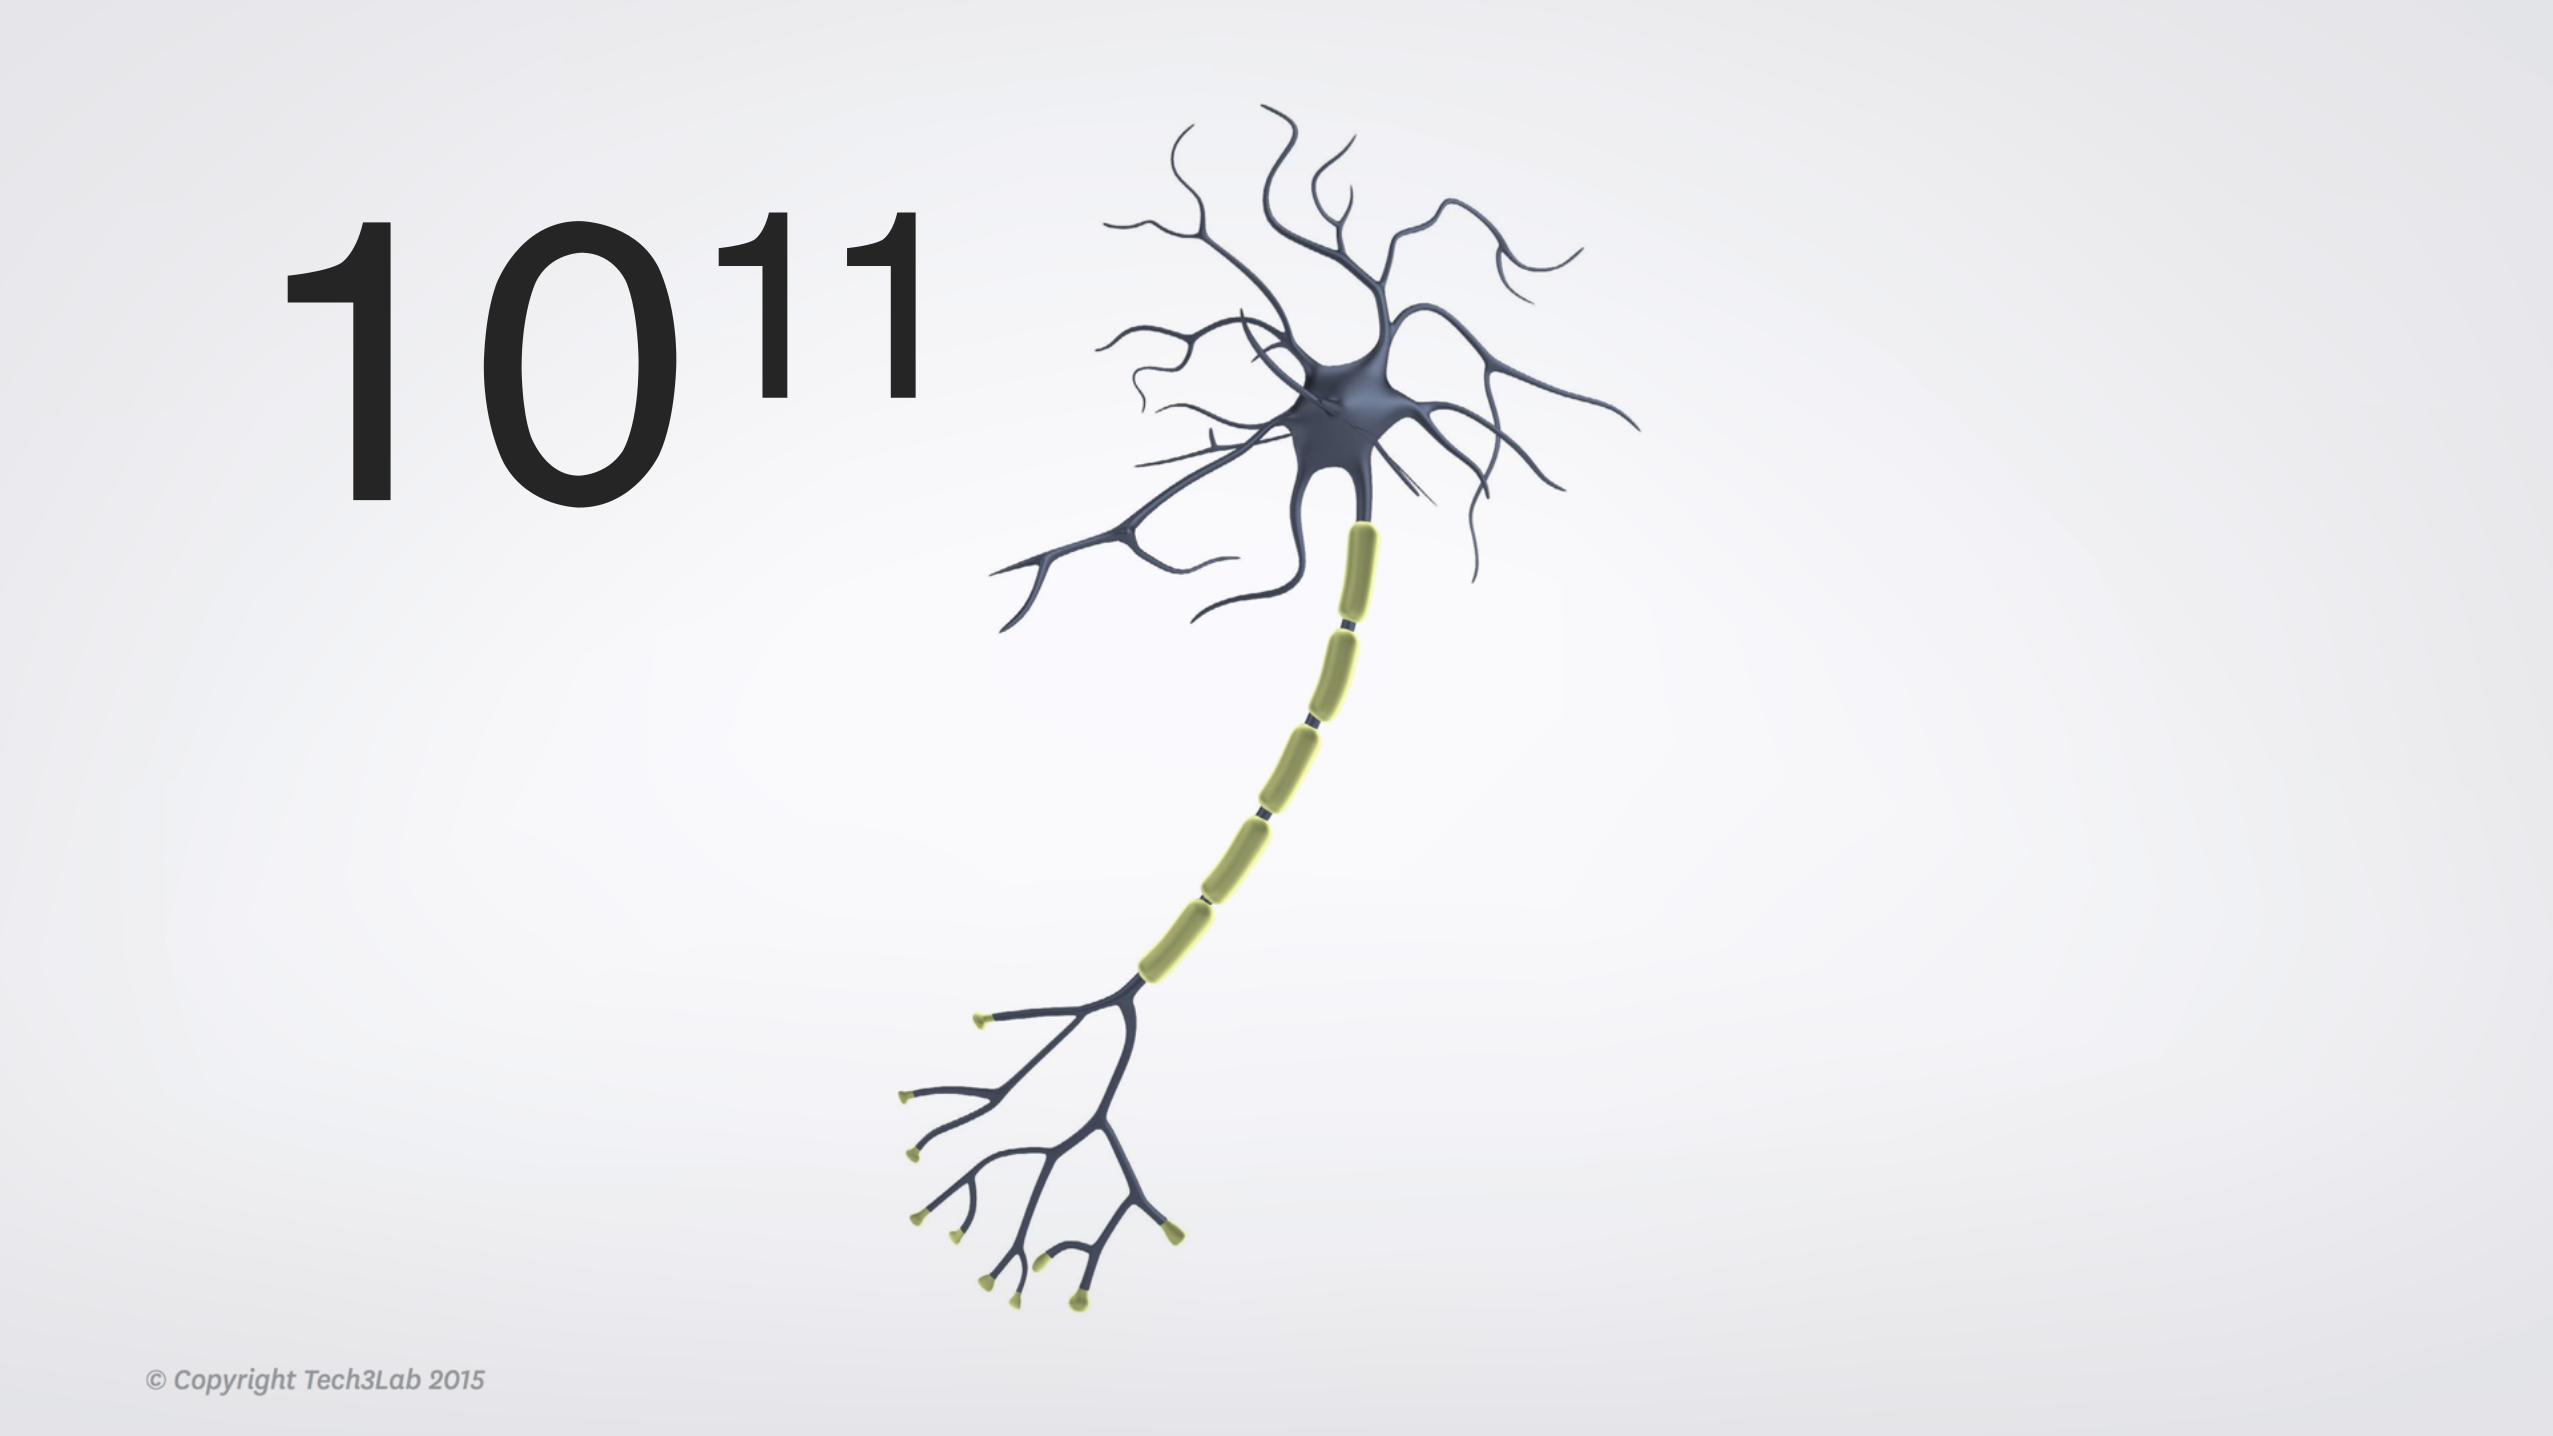
1011

© Copyright Tech3Lab 2015
http://upload.wikimedia.org/wikipedia/en/e/e4/Tetris_DOS_19 http://upload.wikimedia.org/wikipedia/en/e/e4/Tetris_DOS_1986.png 86.png
http://upload.wikimedia.org/wikipedia/en/e/e4/Tetris_DOS_19 http://upload.wikimedia.org/wikipedia/en/e/e4/Tetris_DOS_1986.png 86.png
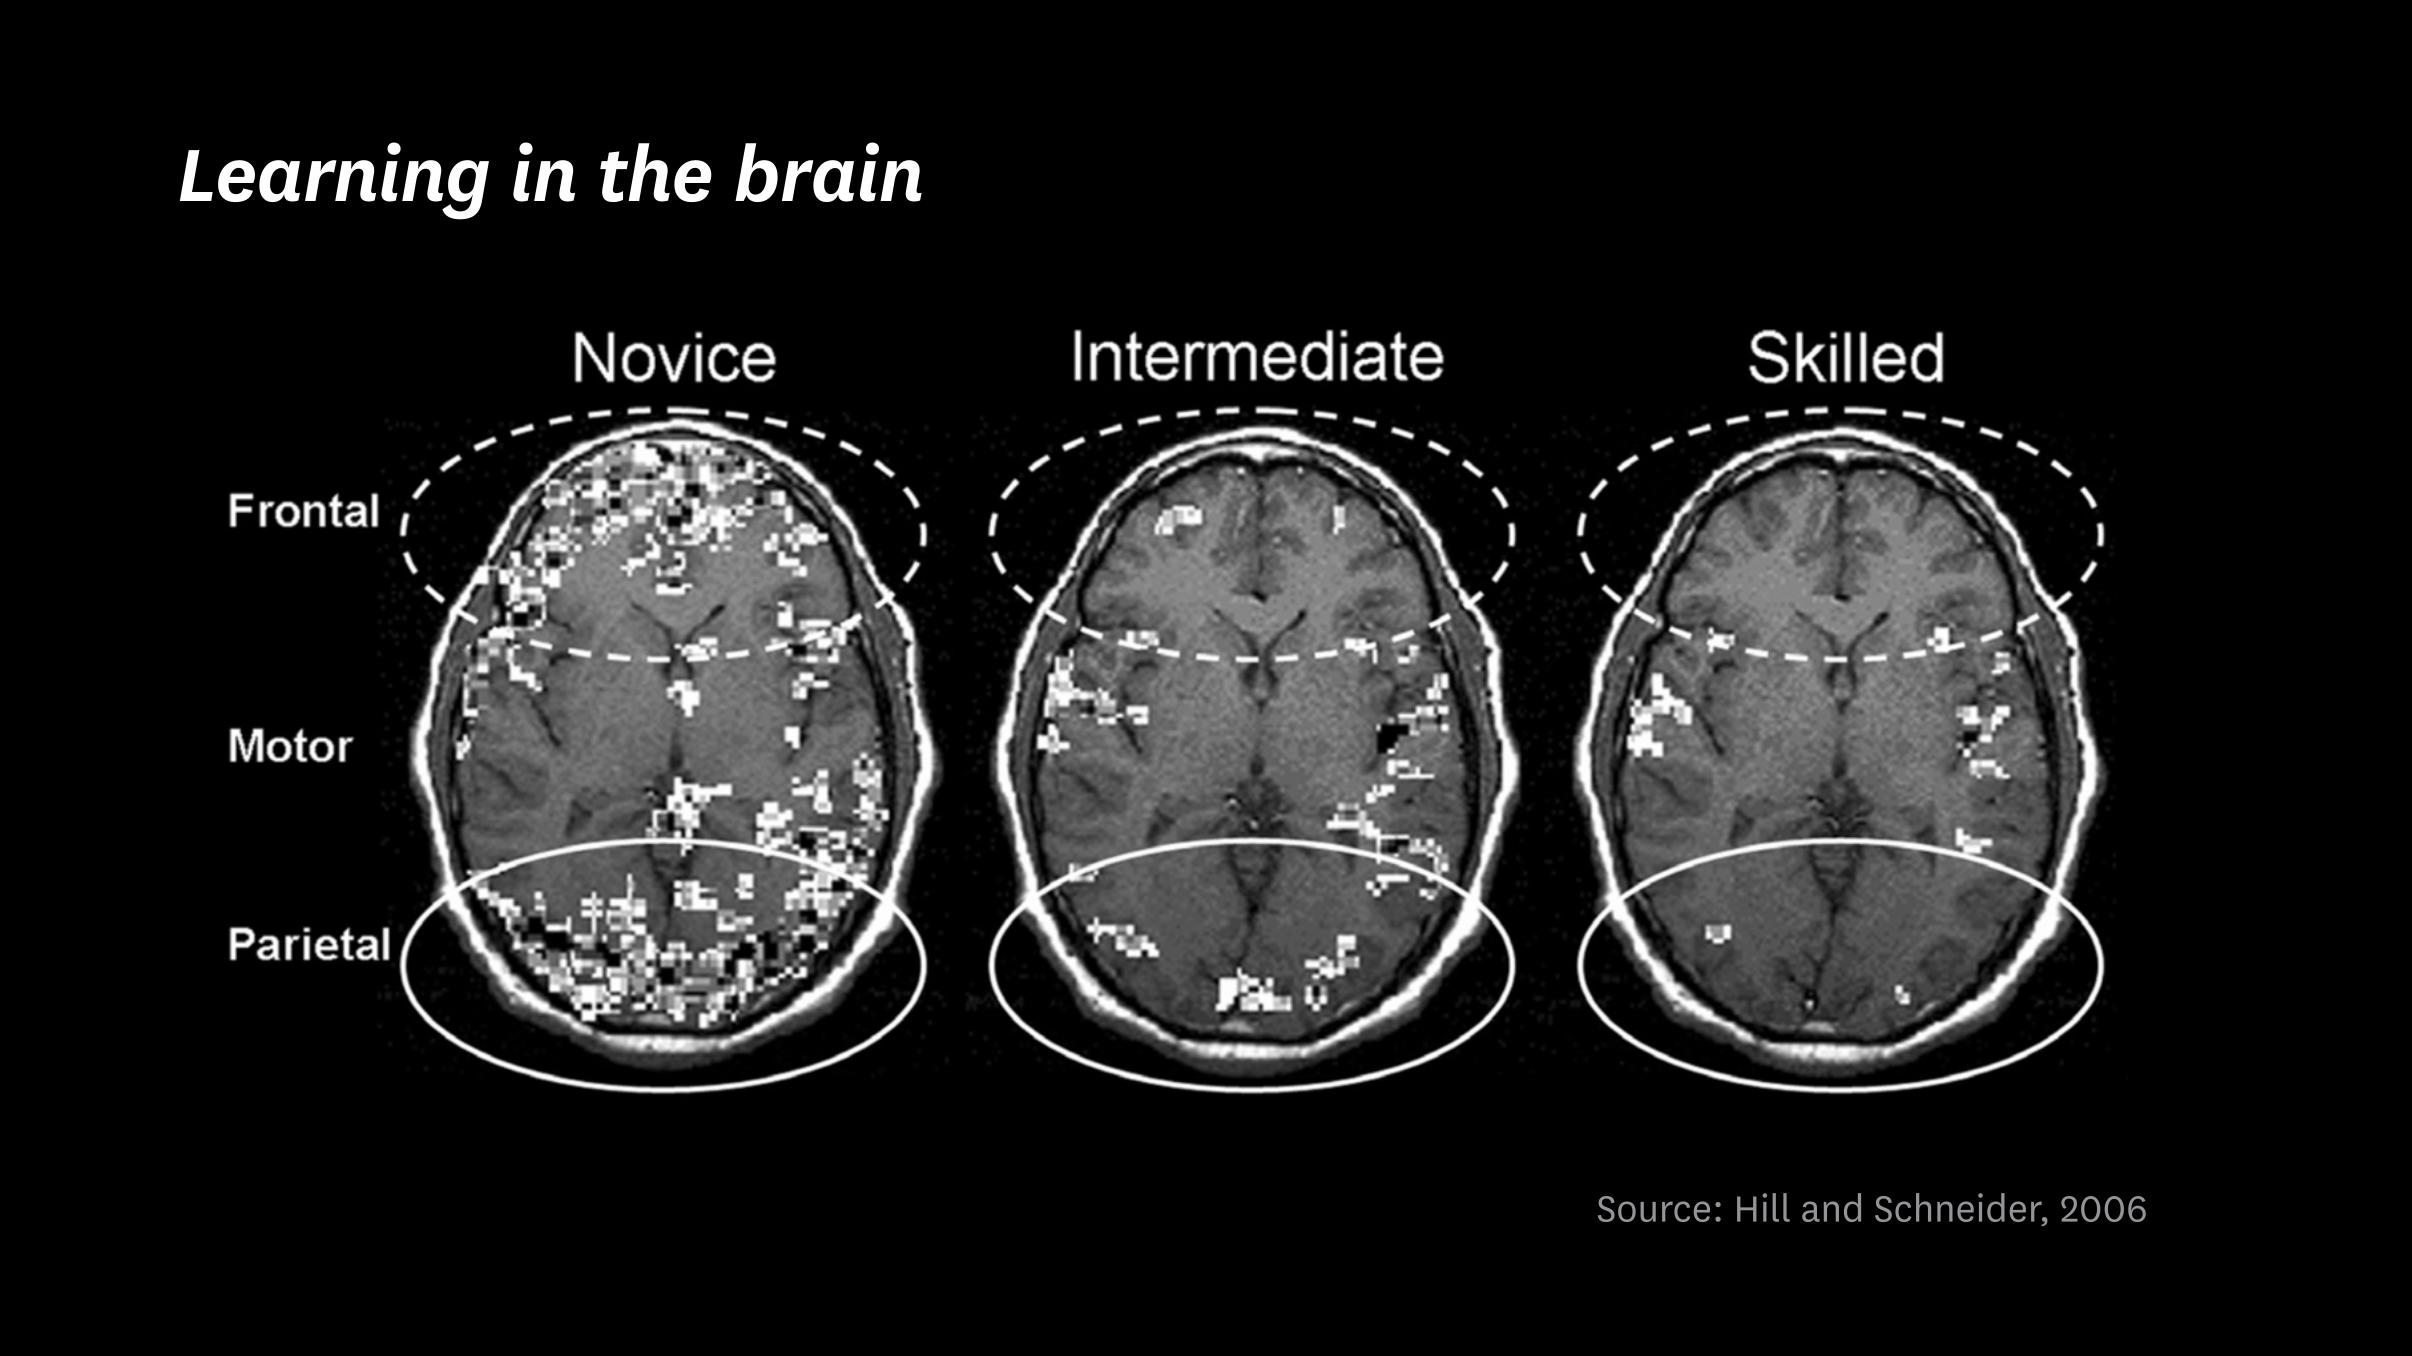
Learning in the brain
Source: Hill and Schneider, 2006
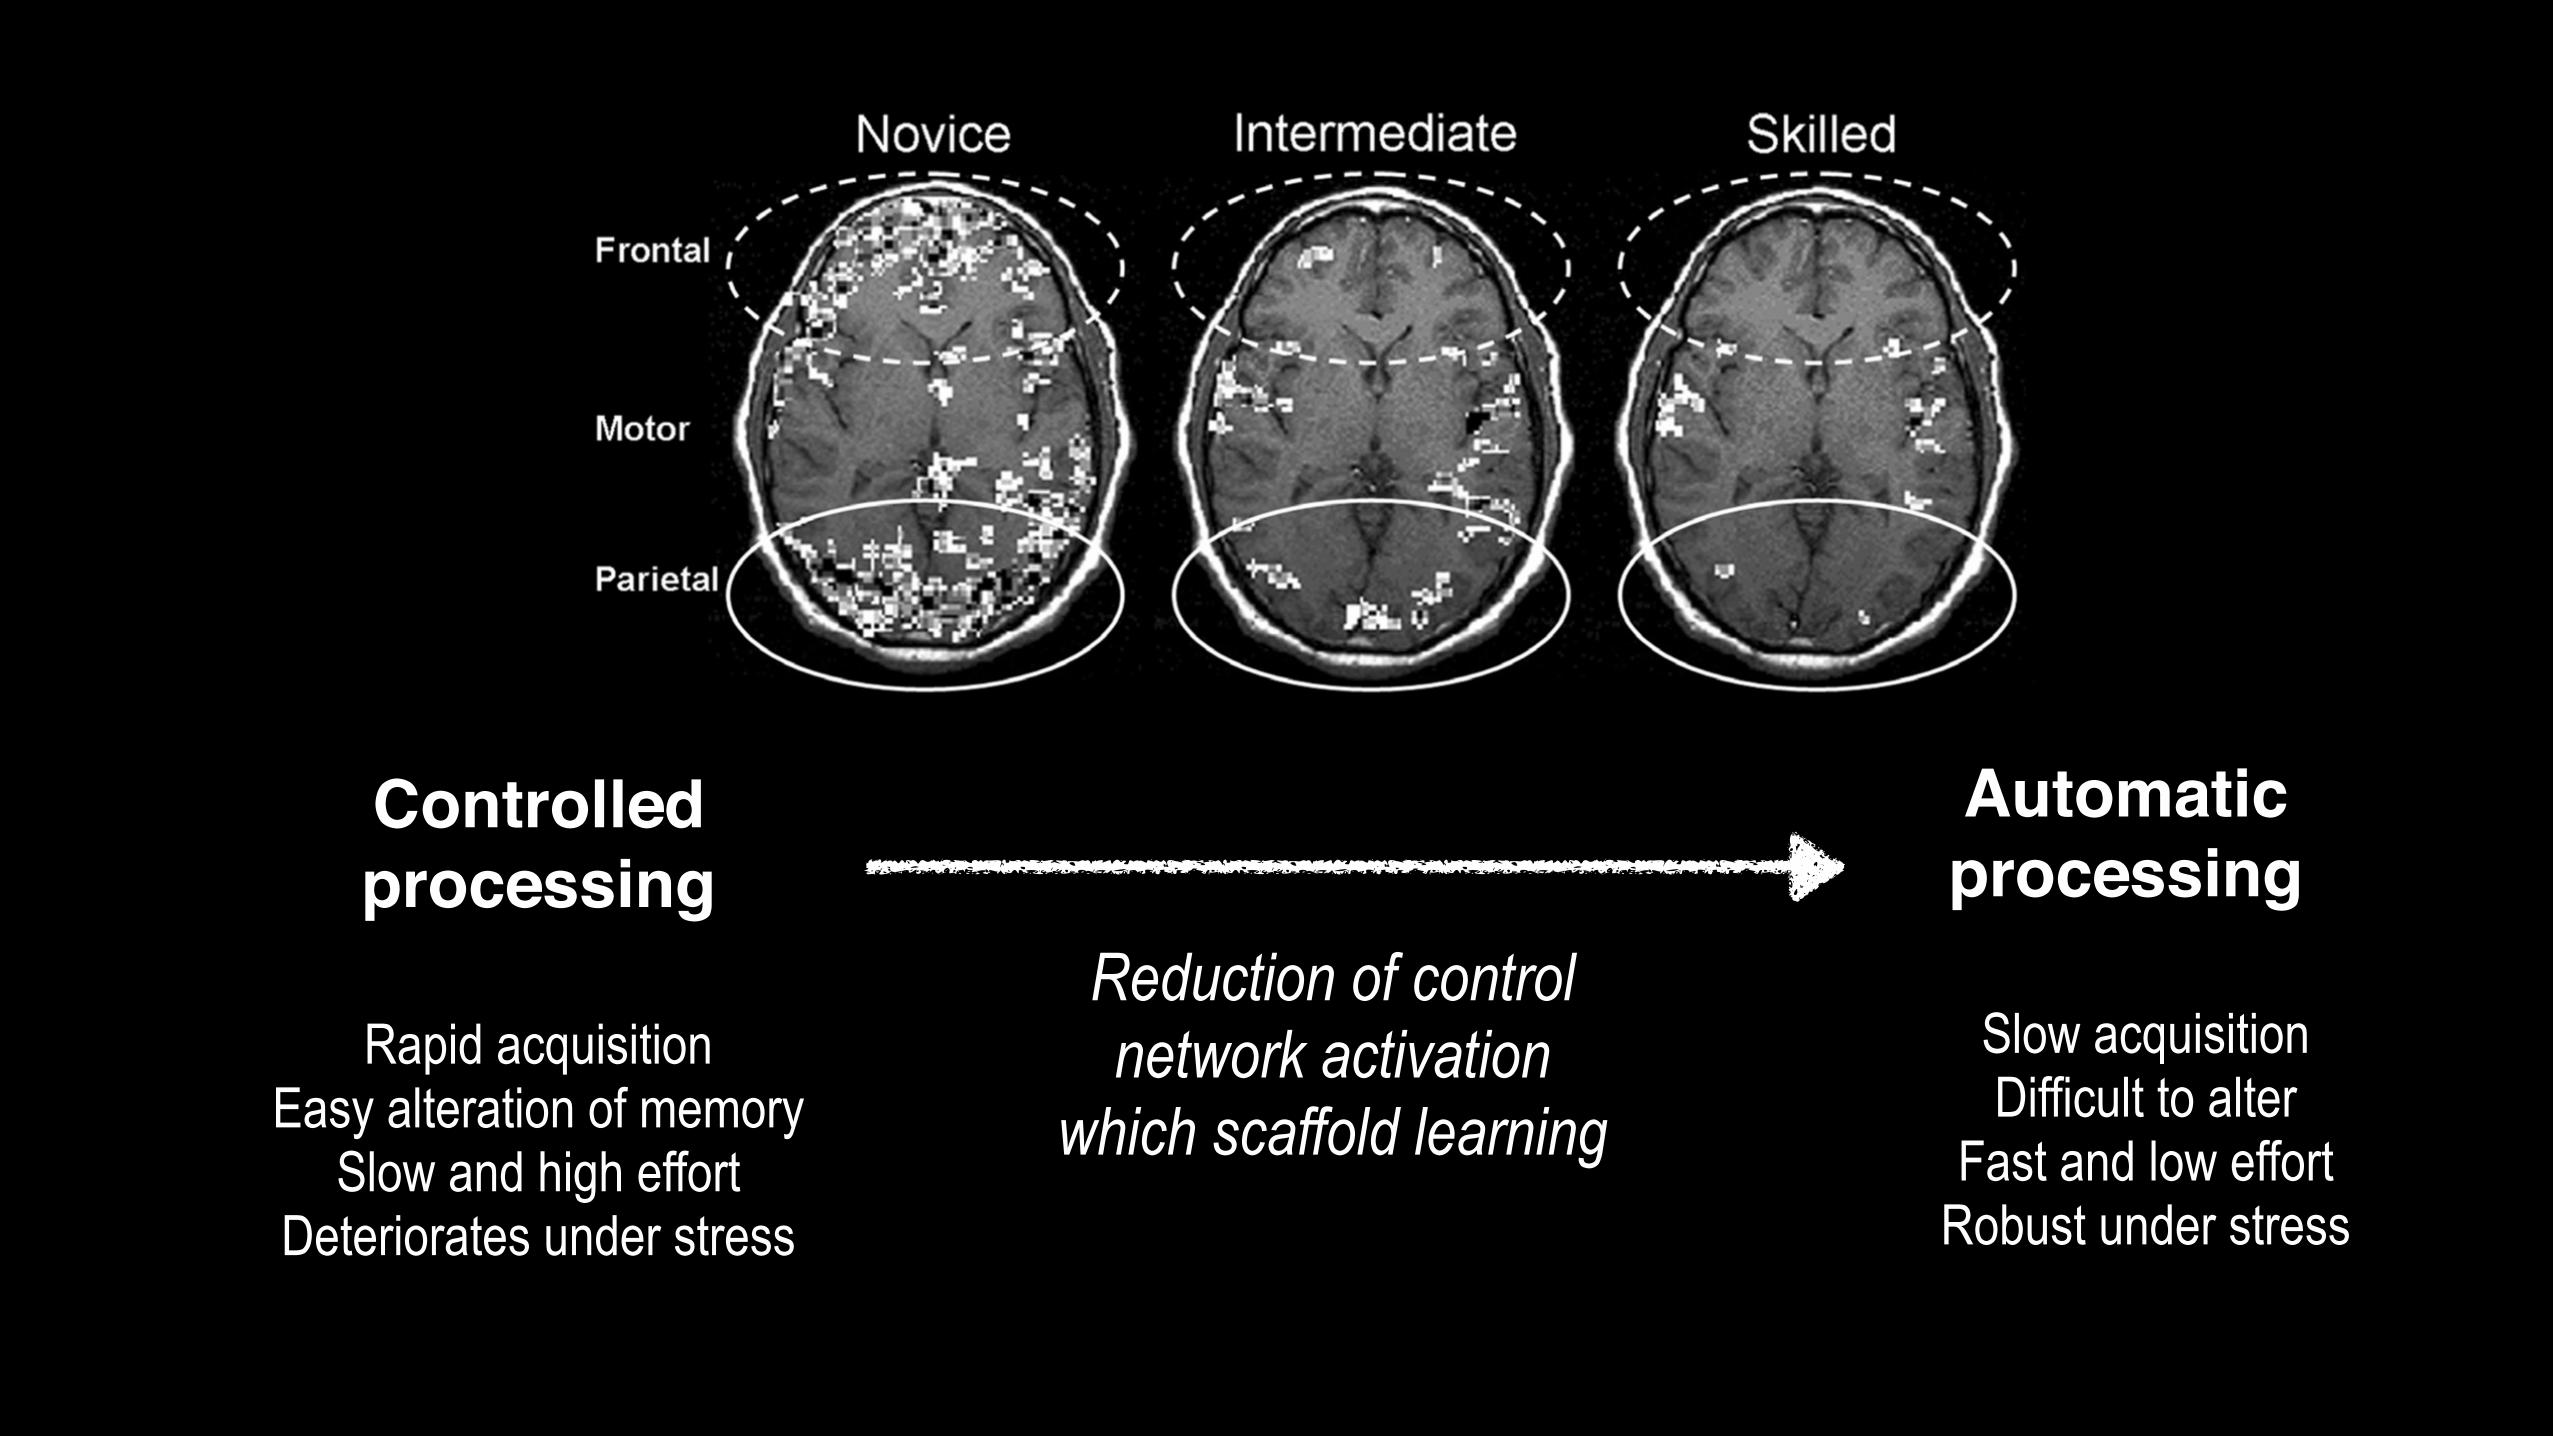
Controlled processing
Automatic processing
Learning in the brain
Source: Hill and Schneider, 2006
Rapid acquisition Easy alteration of memory
Slow and high effort Deteriorates under stress
Slow acquisition Difficult to alter
Fast and low effort Robust under stress
Reduction of control network activation
which scaffold learning
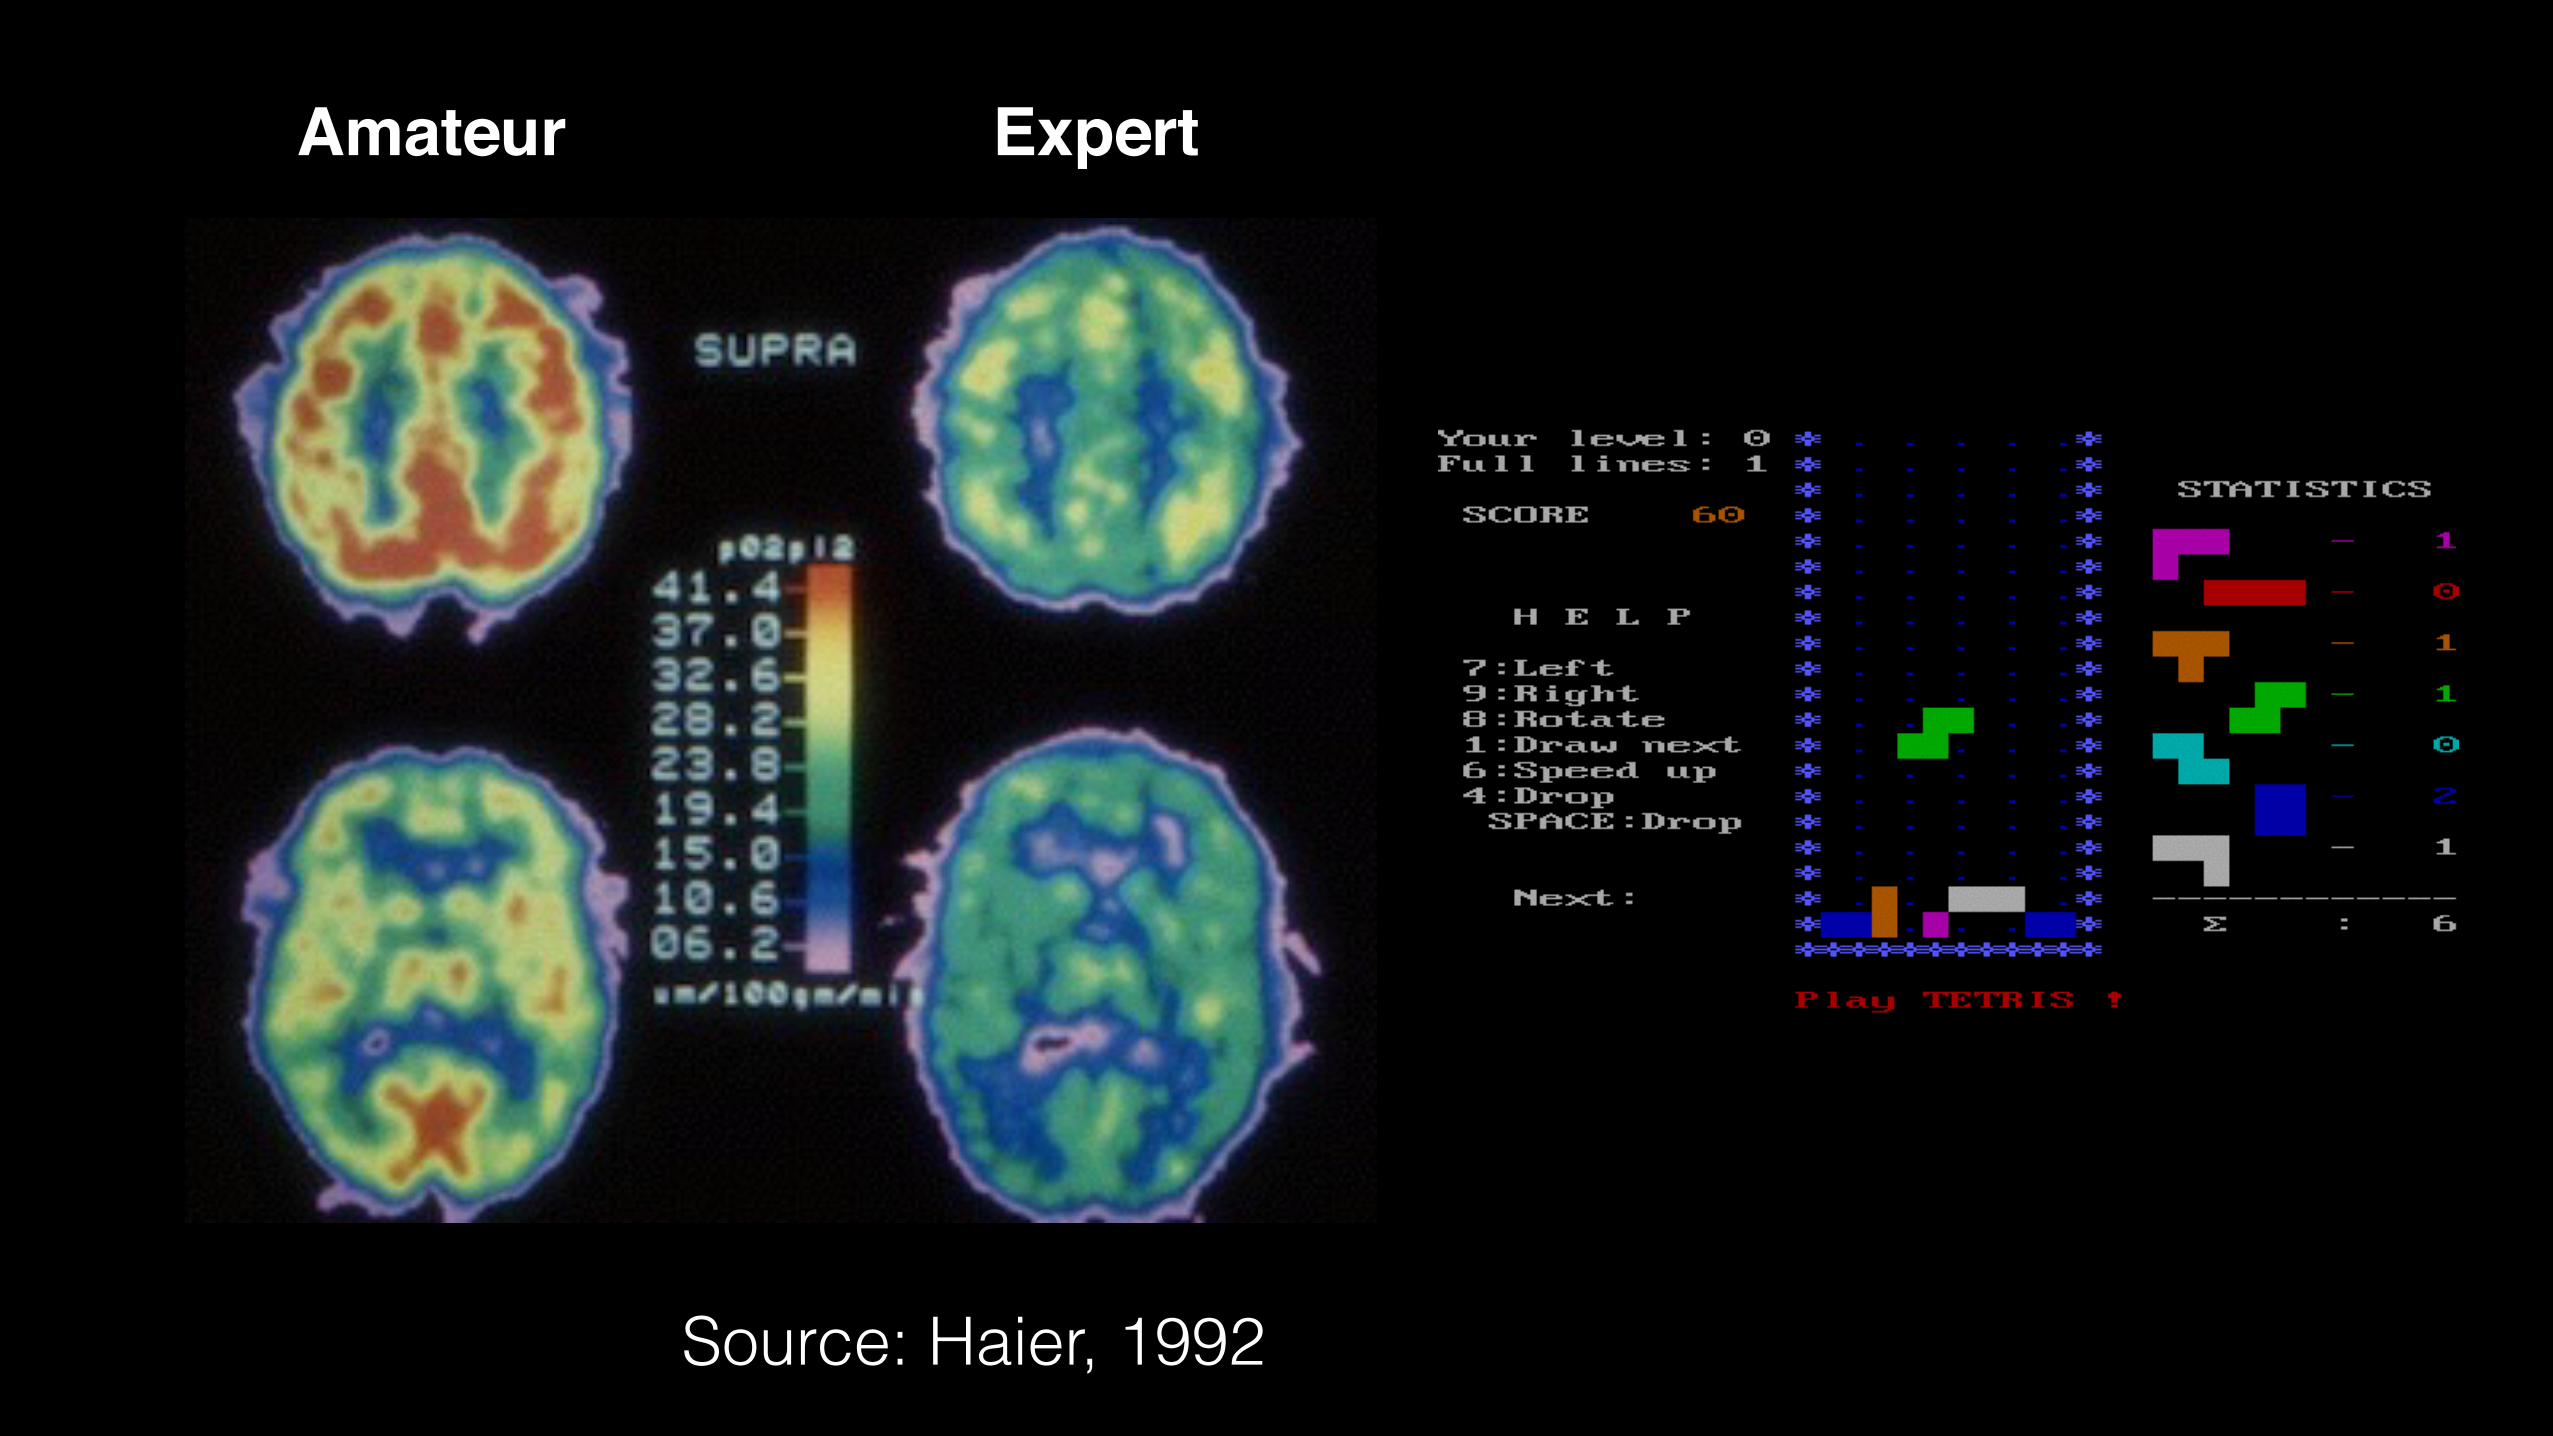
http://upload.wikimedia.org/wikipedia/en/e/e4/Tetris_DOS_19 http://upload.wikimedia.org/wikipedia/en/e/e4/Tetris_DOS_1986.png 86.png
Source: Haier, 1992
Amateur Expert
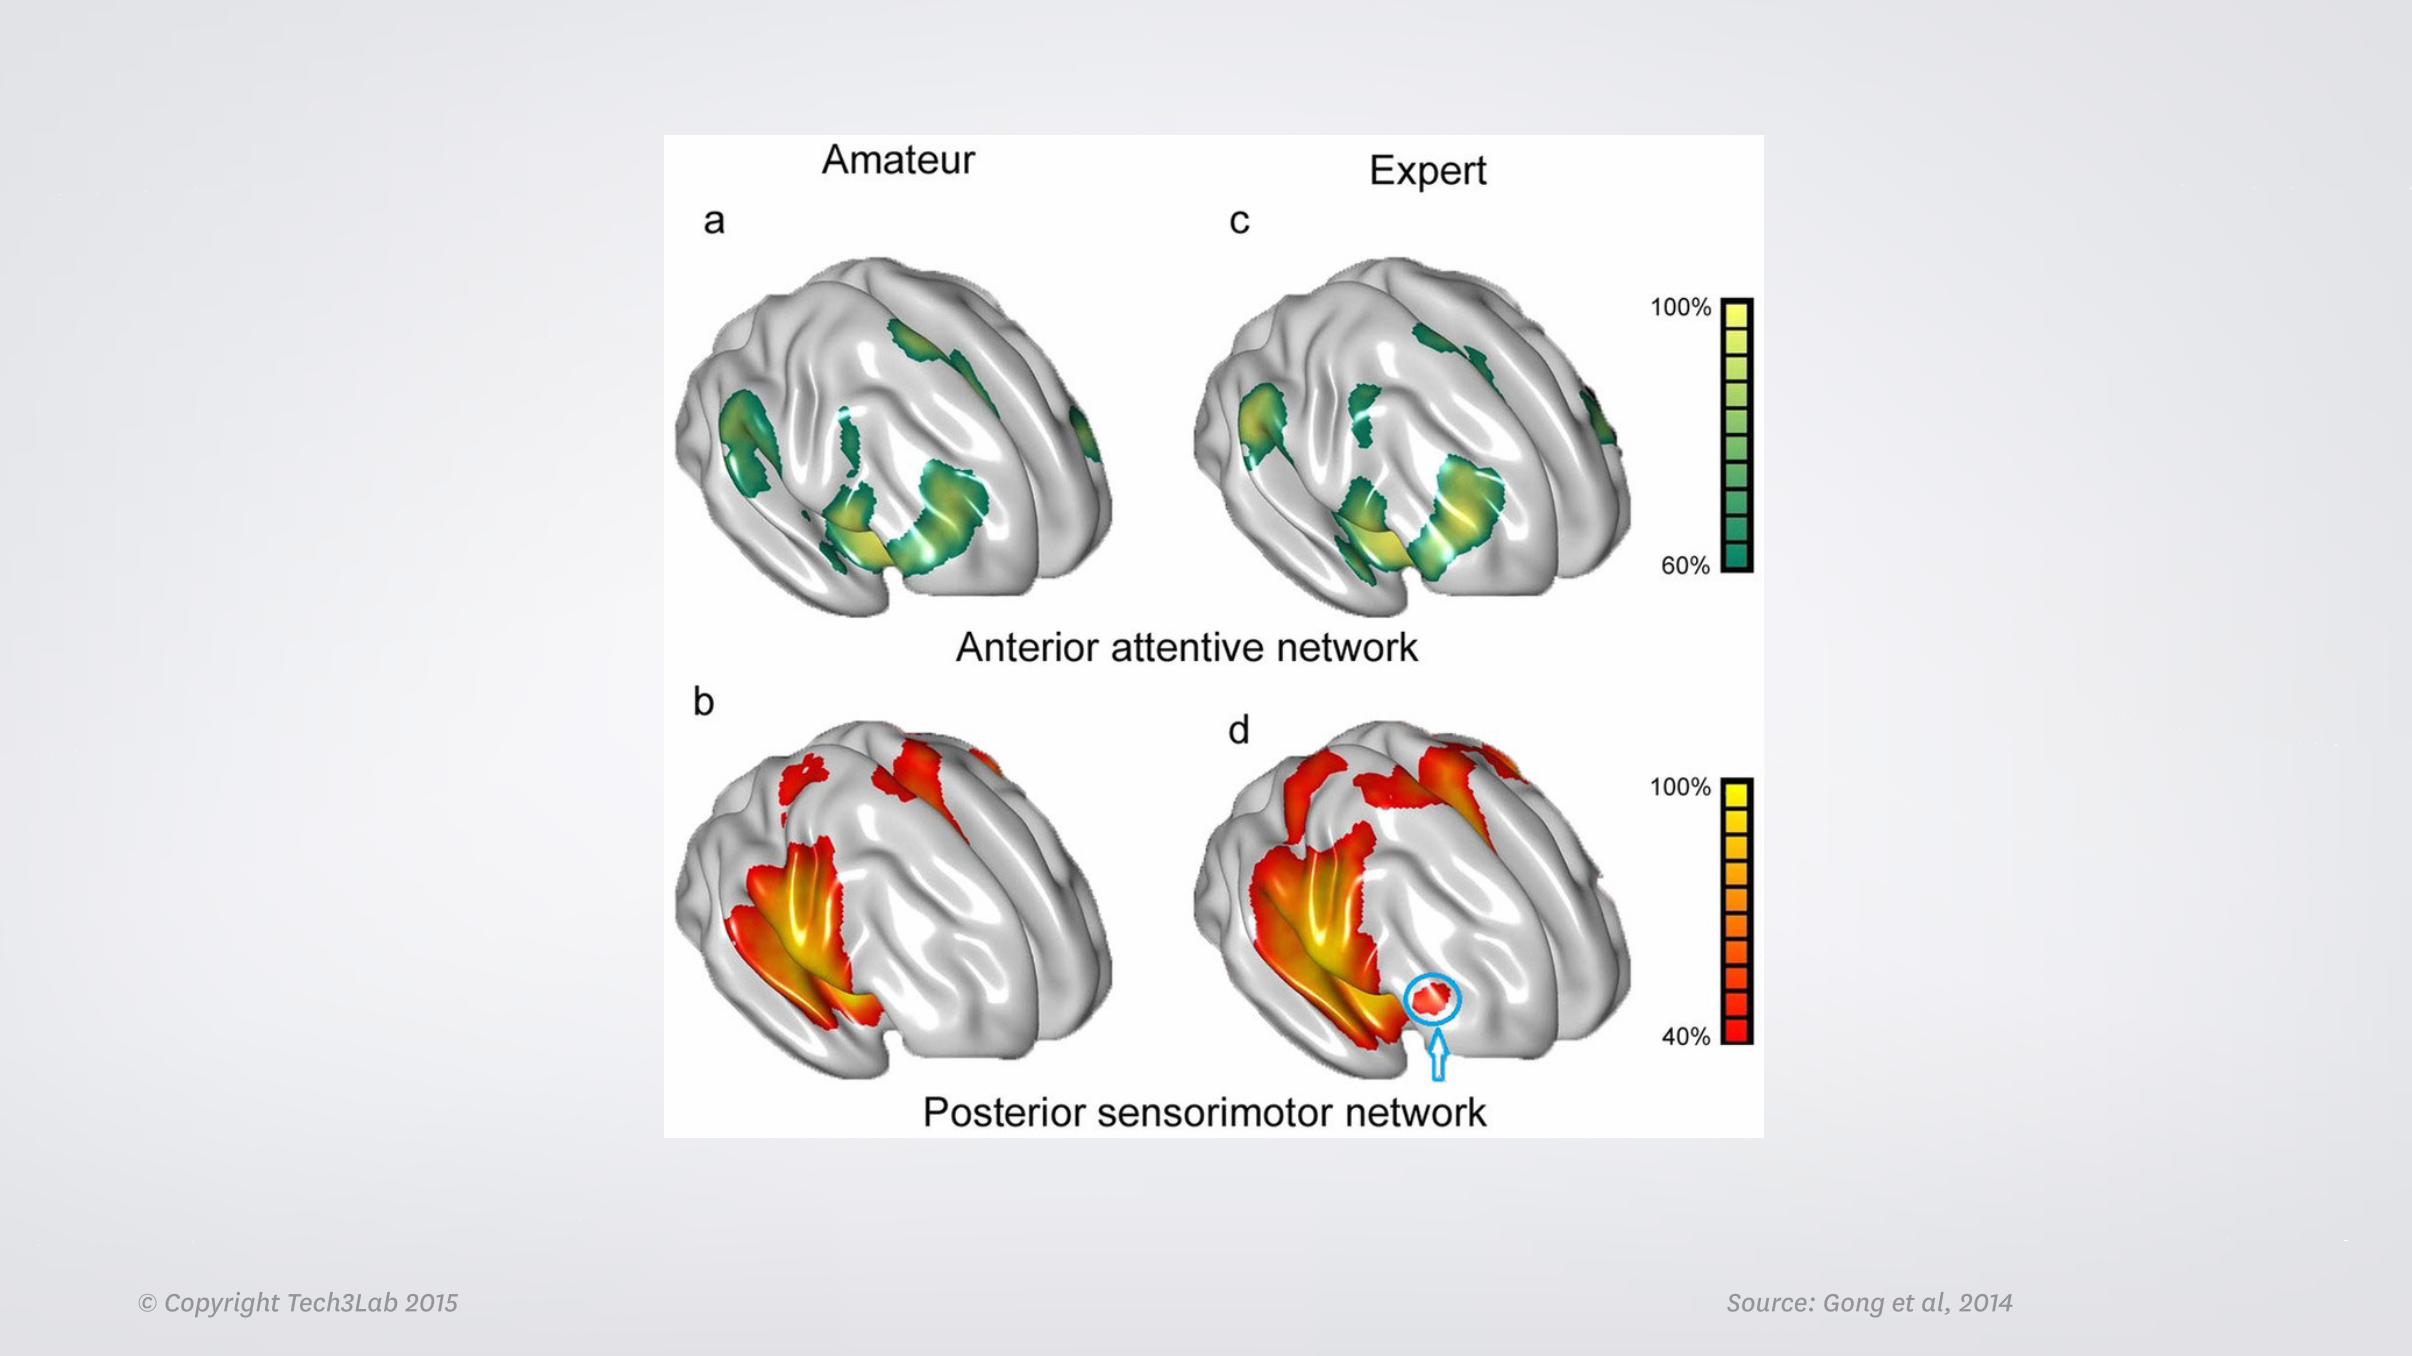
© Copyright Tech3Lab 2015 Source: Gong et al, 2014
© Copyright Tech3Lab 2015
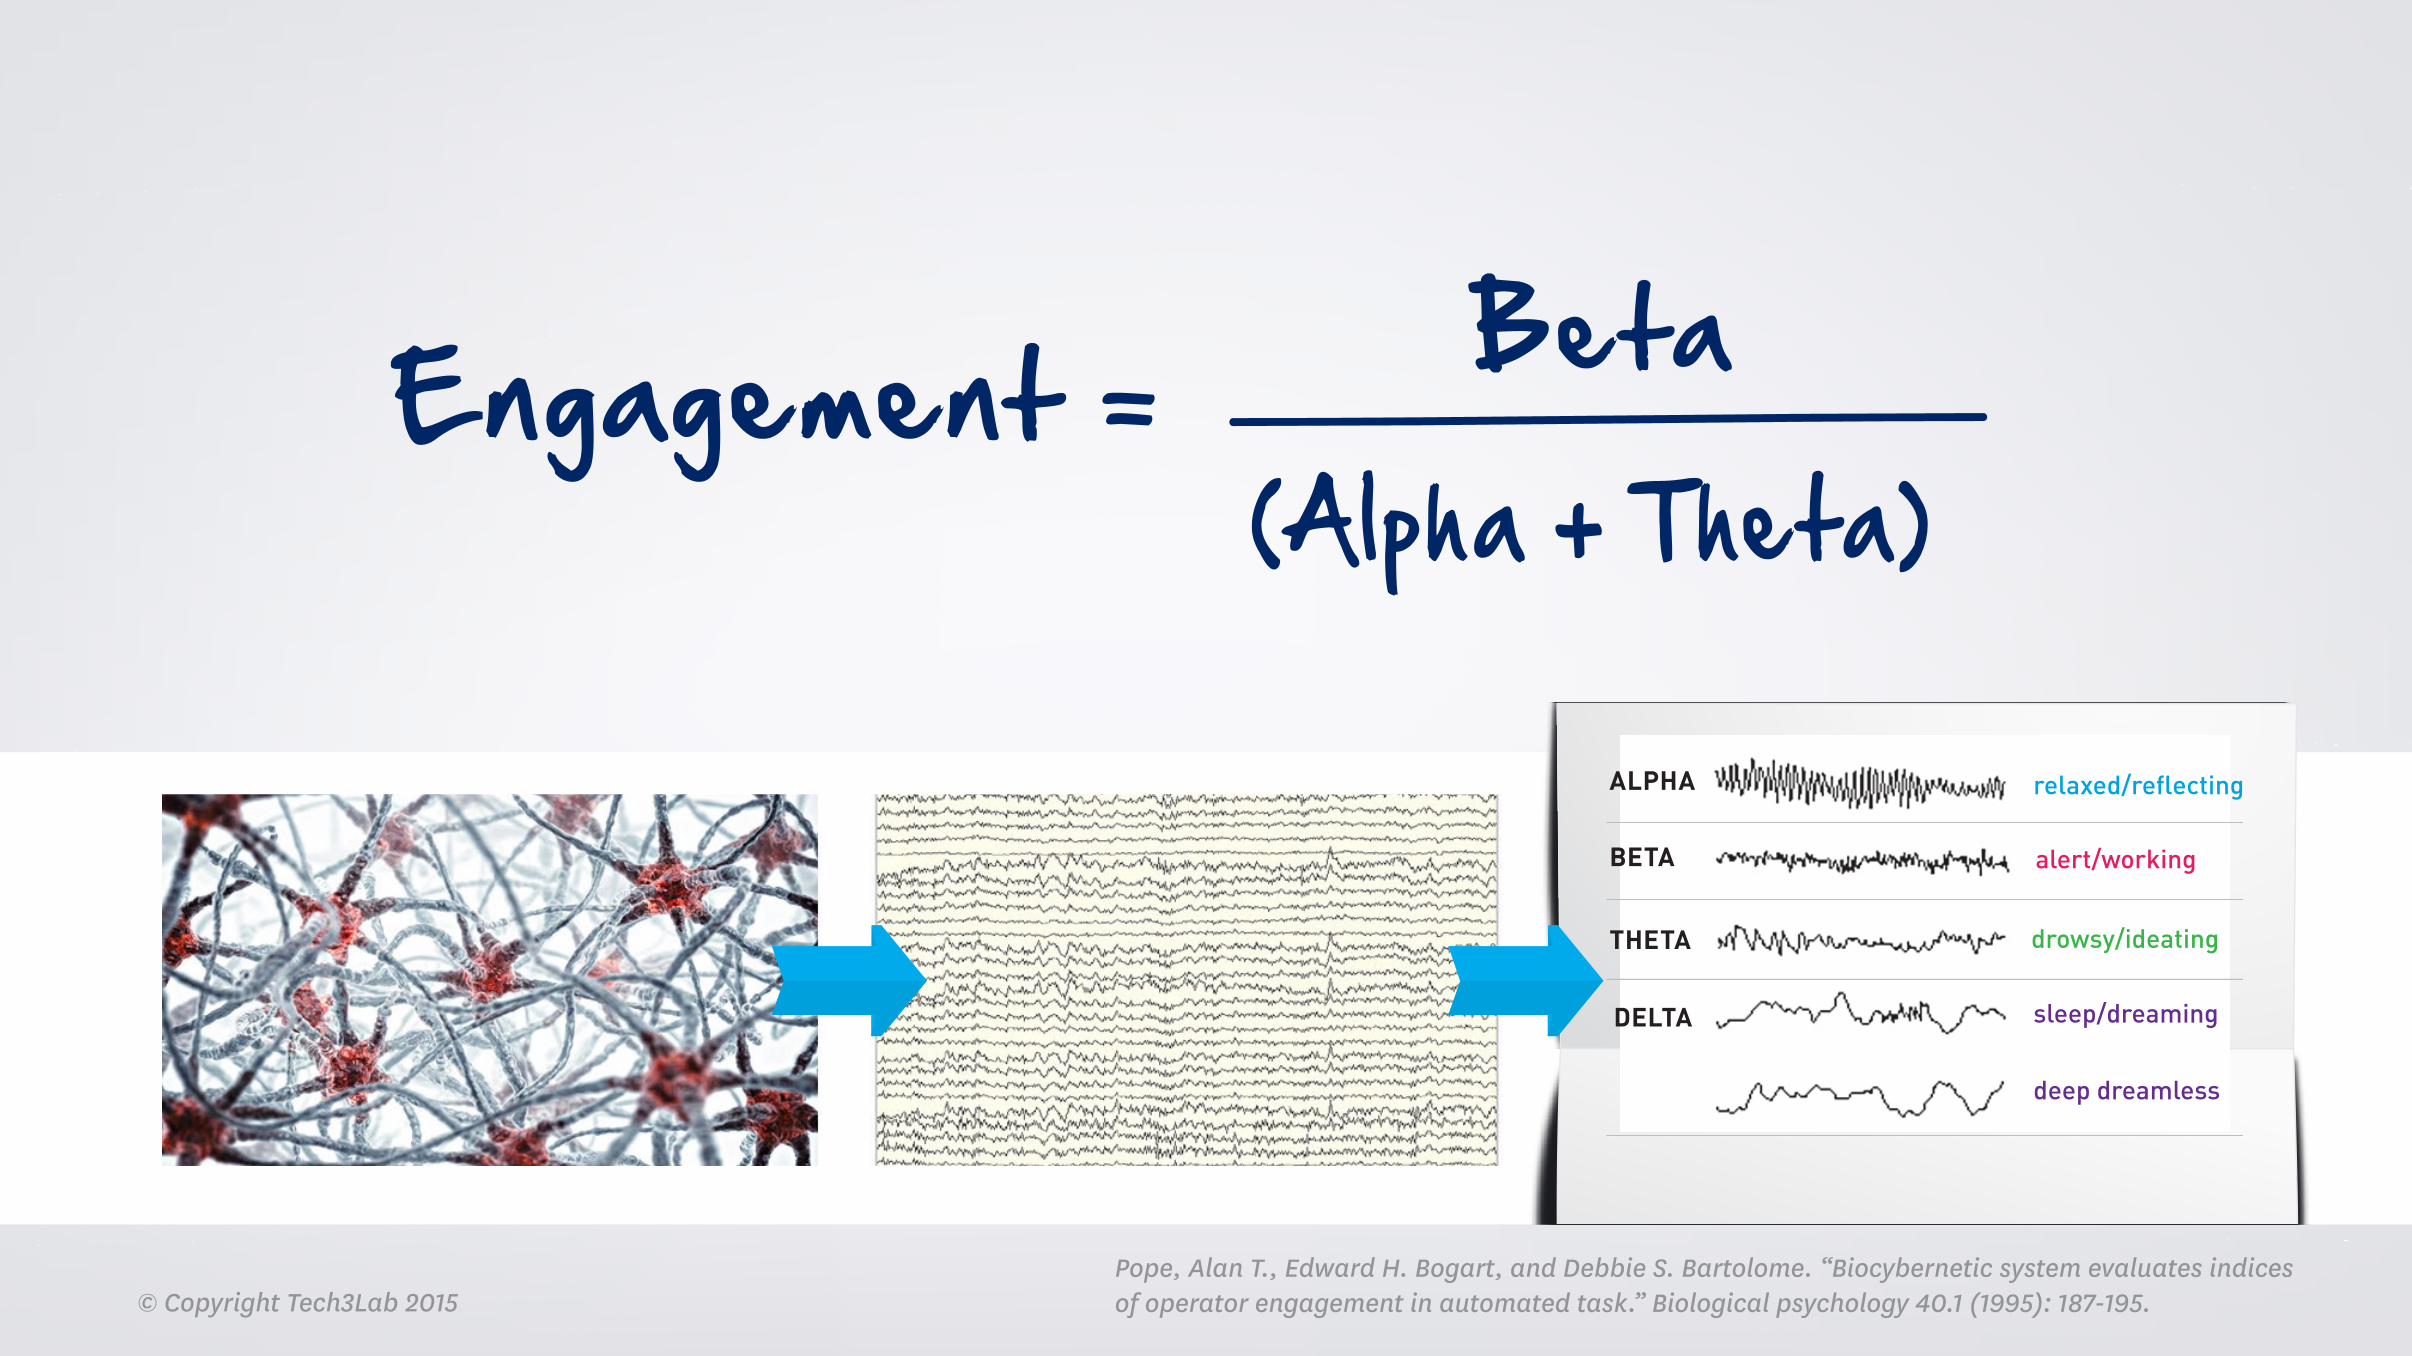
ALPHA relaxed/reflecting
alert/working
drowsy/ideating
sleep/dreaming
deep dreamless
BETA
THETA
DELTA

Astronaut/aquanaut Nicole P. Stott and Ross Hein, a professional aquanaut from the University of North Carolina at Wilmington (UNCW), assist University of Cincinnati physician Tim Broderick apply a net with electrodes for an electroencephalogram (EEG) study
© Copyright Tech3Lab 2015
ALPHA relaxed/reflecting
alert/working
drowsy/ideating
sleep/dreaming
deep dreamless
BETA
THETA
DELTA
Pope, Alan T., Edward H. Bogart, and Debbie S. Bartolome. “Biocybernetic system evaluates indices of operator engagement in automated task.” Biological psychology 40.1 (1995): 187-195.
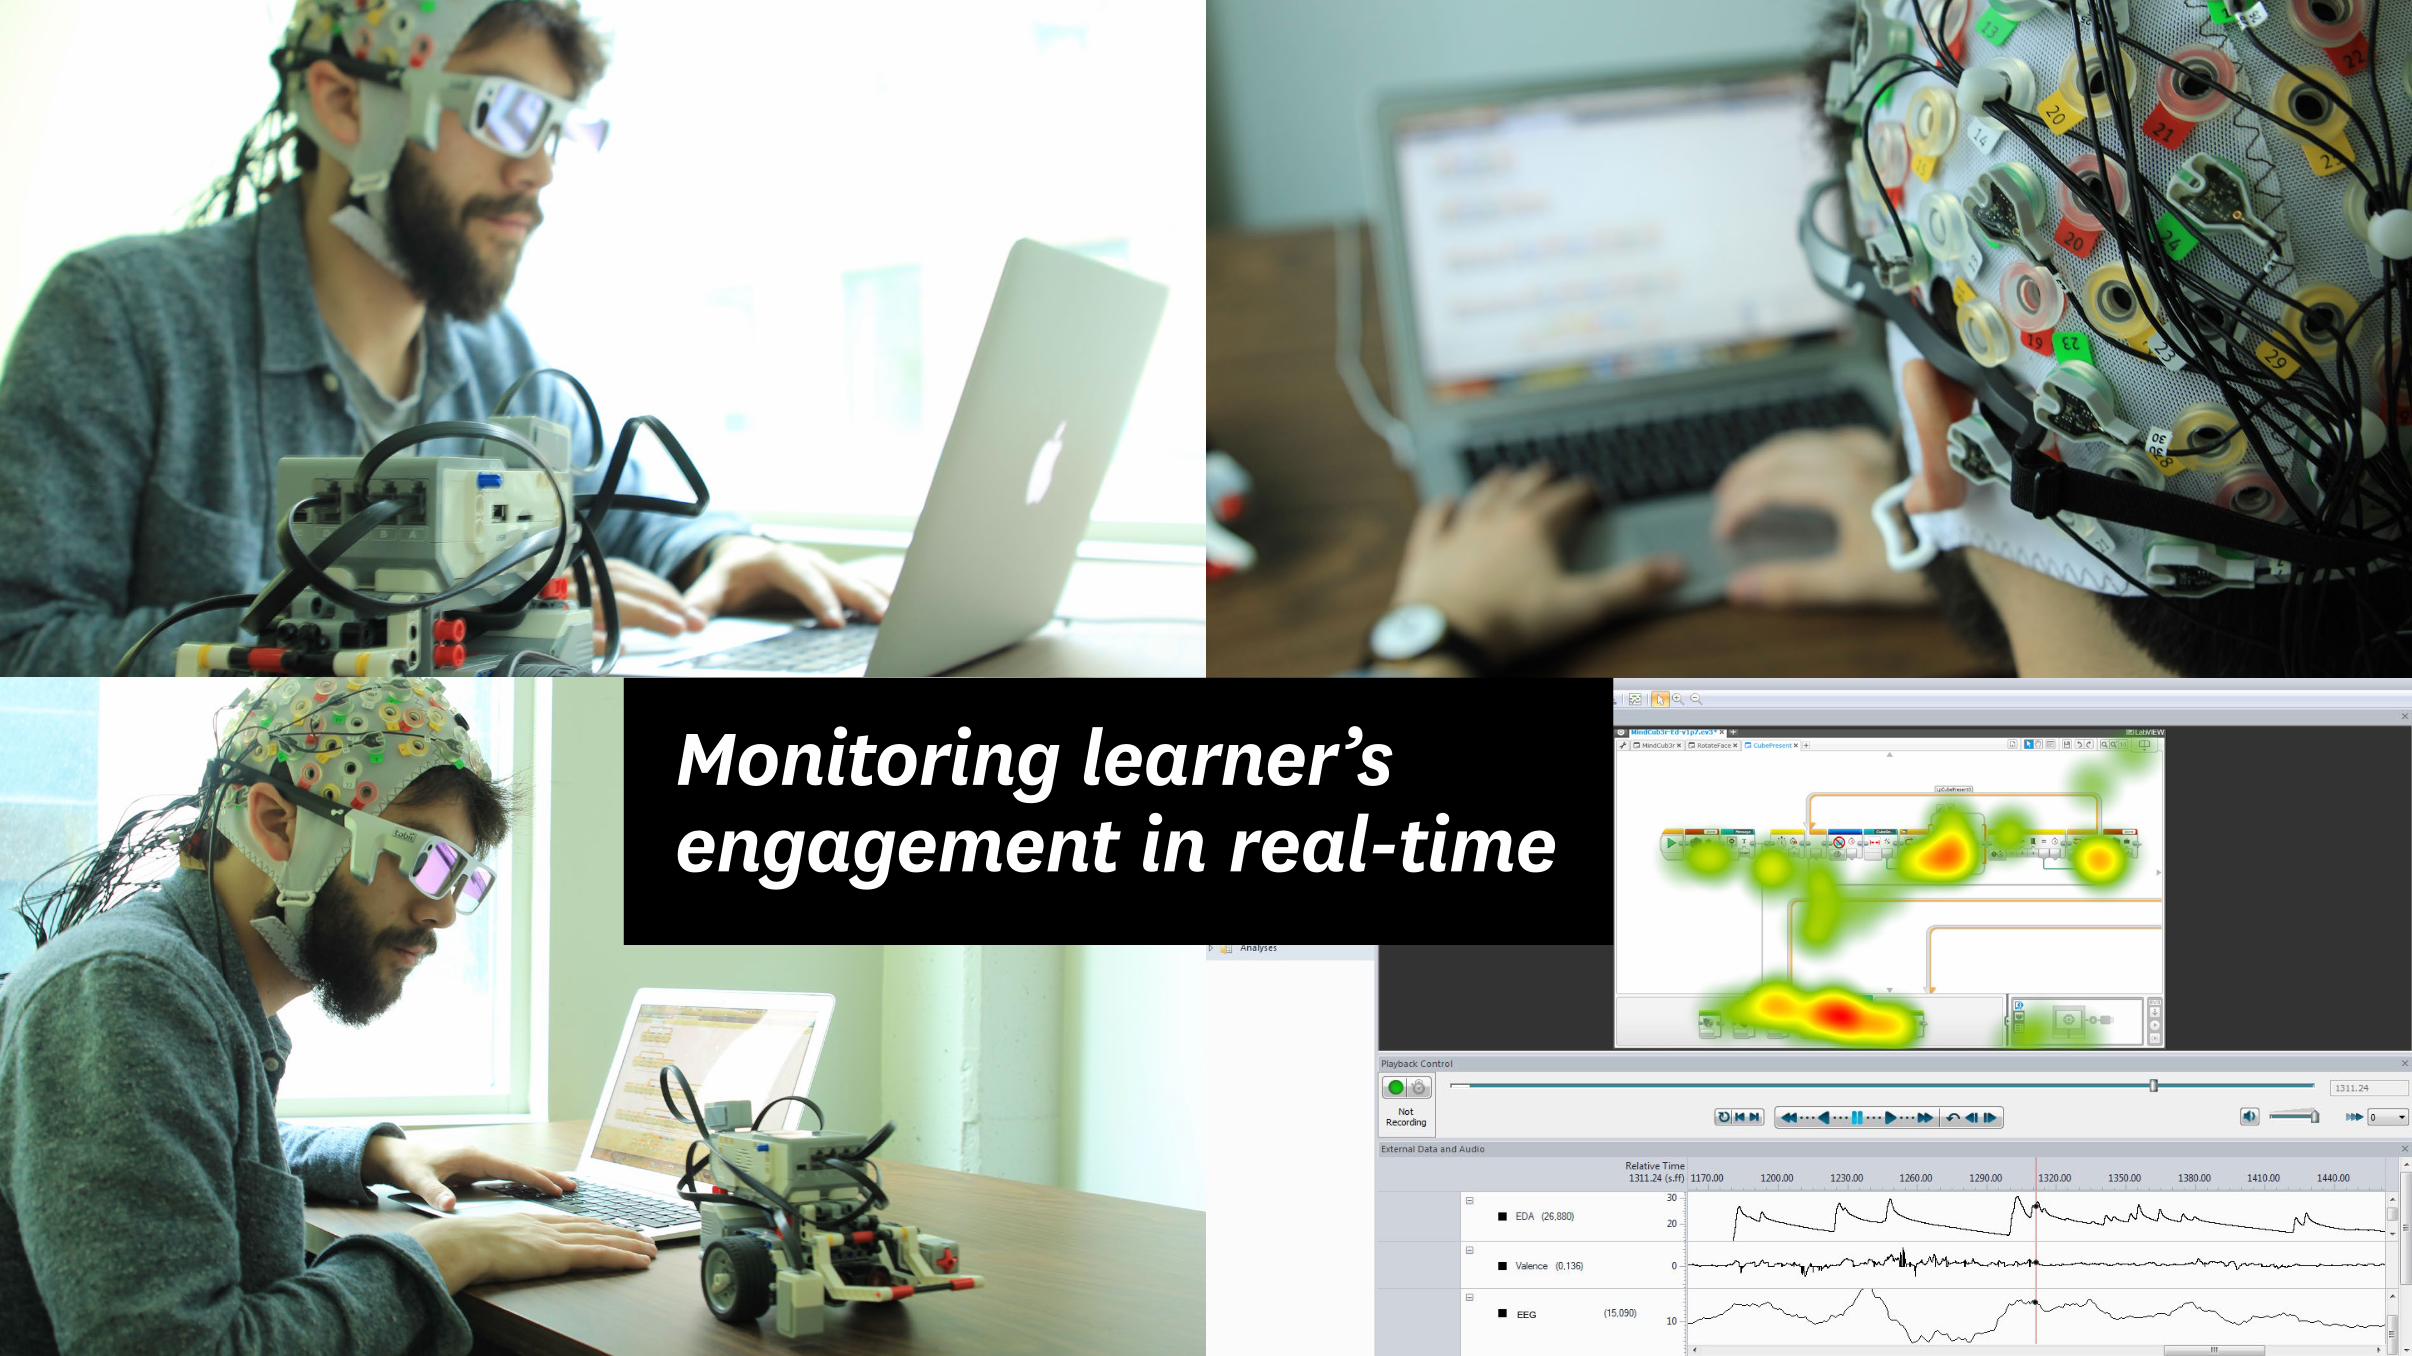
Monitoring learner’s engagement in real-time
© Copyright Tech3Lab 2015
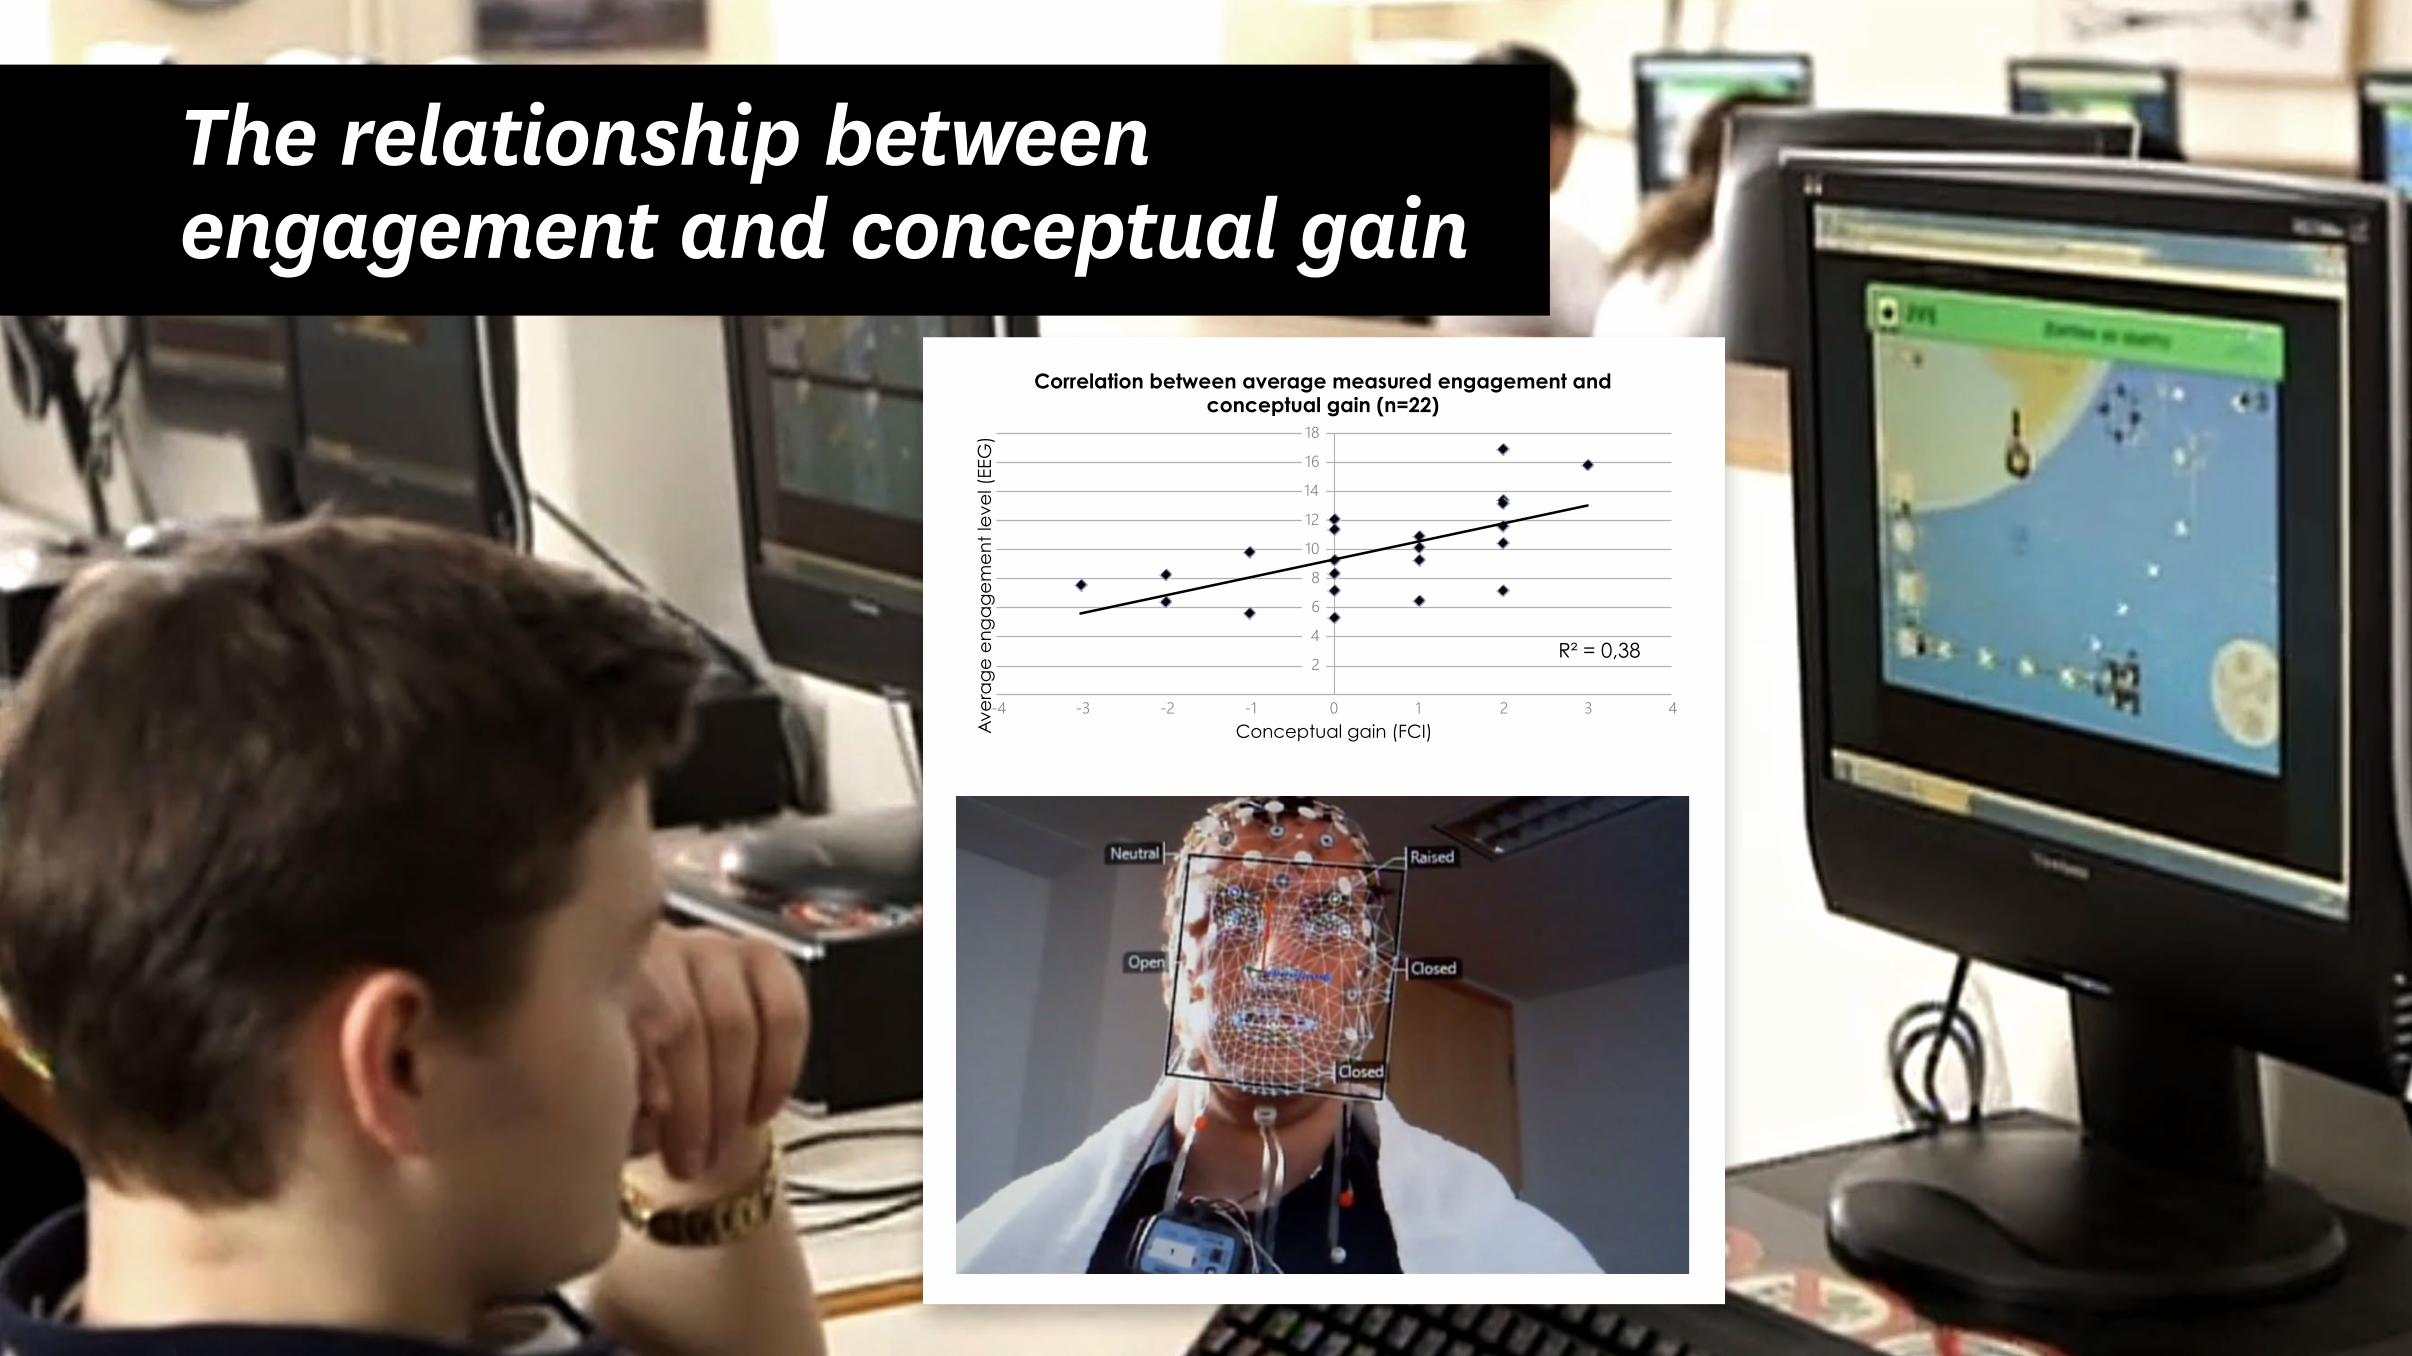
The relationship between engagement and conceptual gain
R = 0,38
2
4
6
8
10
12
14
16
18
-4 -3 -2 -1 0 1 2 3 4
Aver
age
enga
gem
ent l
evel
(EEG
)
Conceptual gain (FCI)
Correlation between average measured engagement and conceptual gain (n=22)
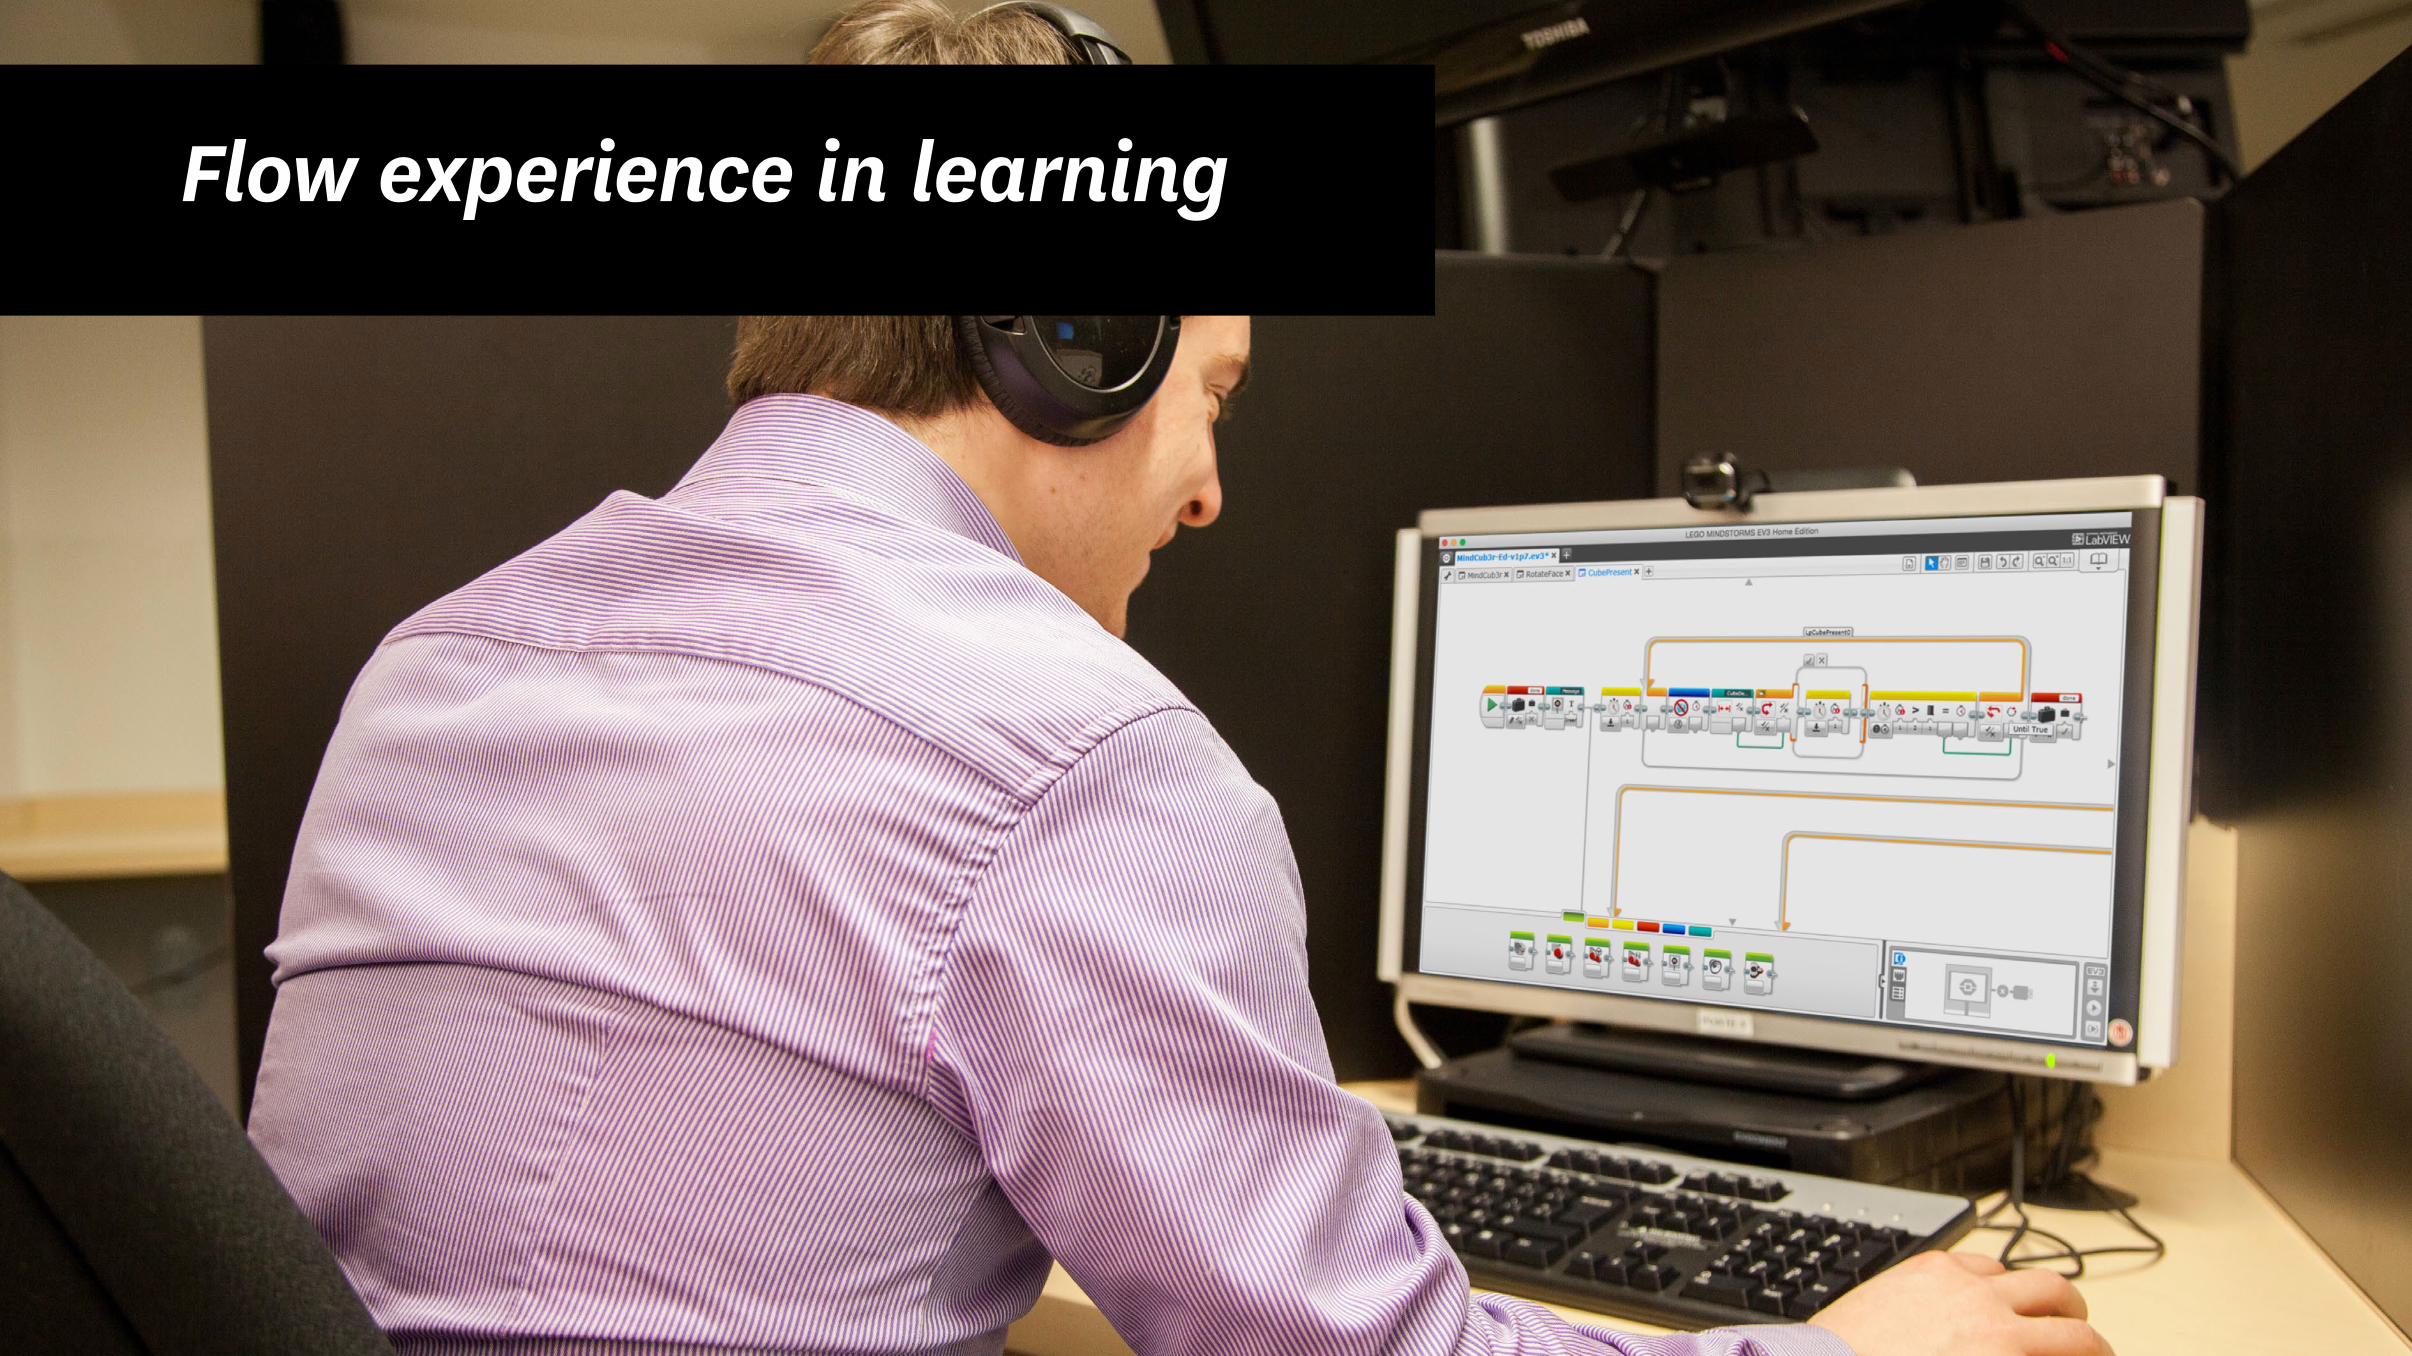
Flow experience in learning
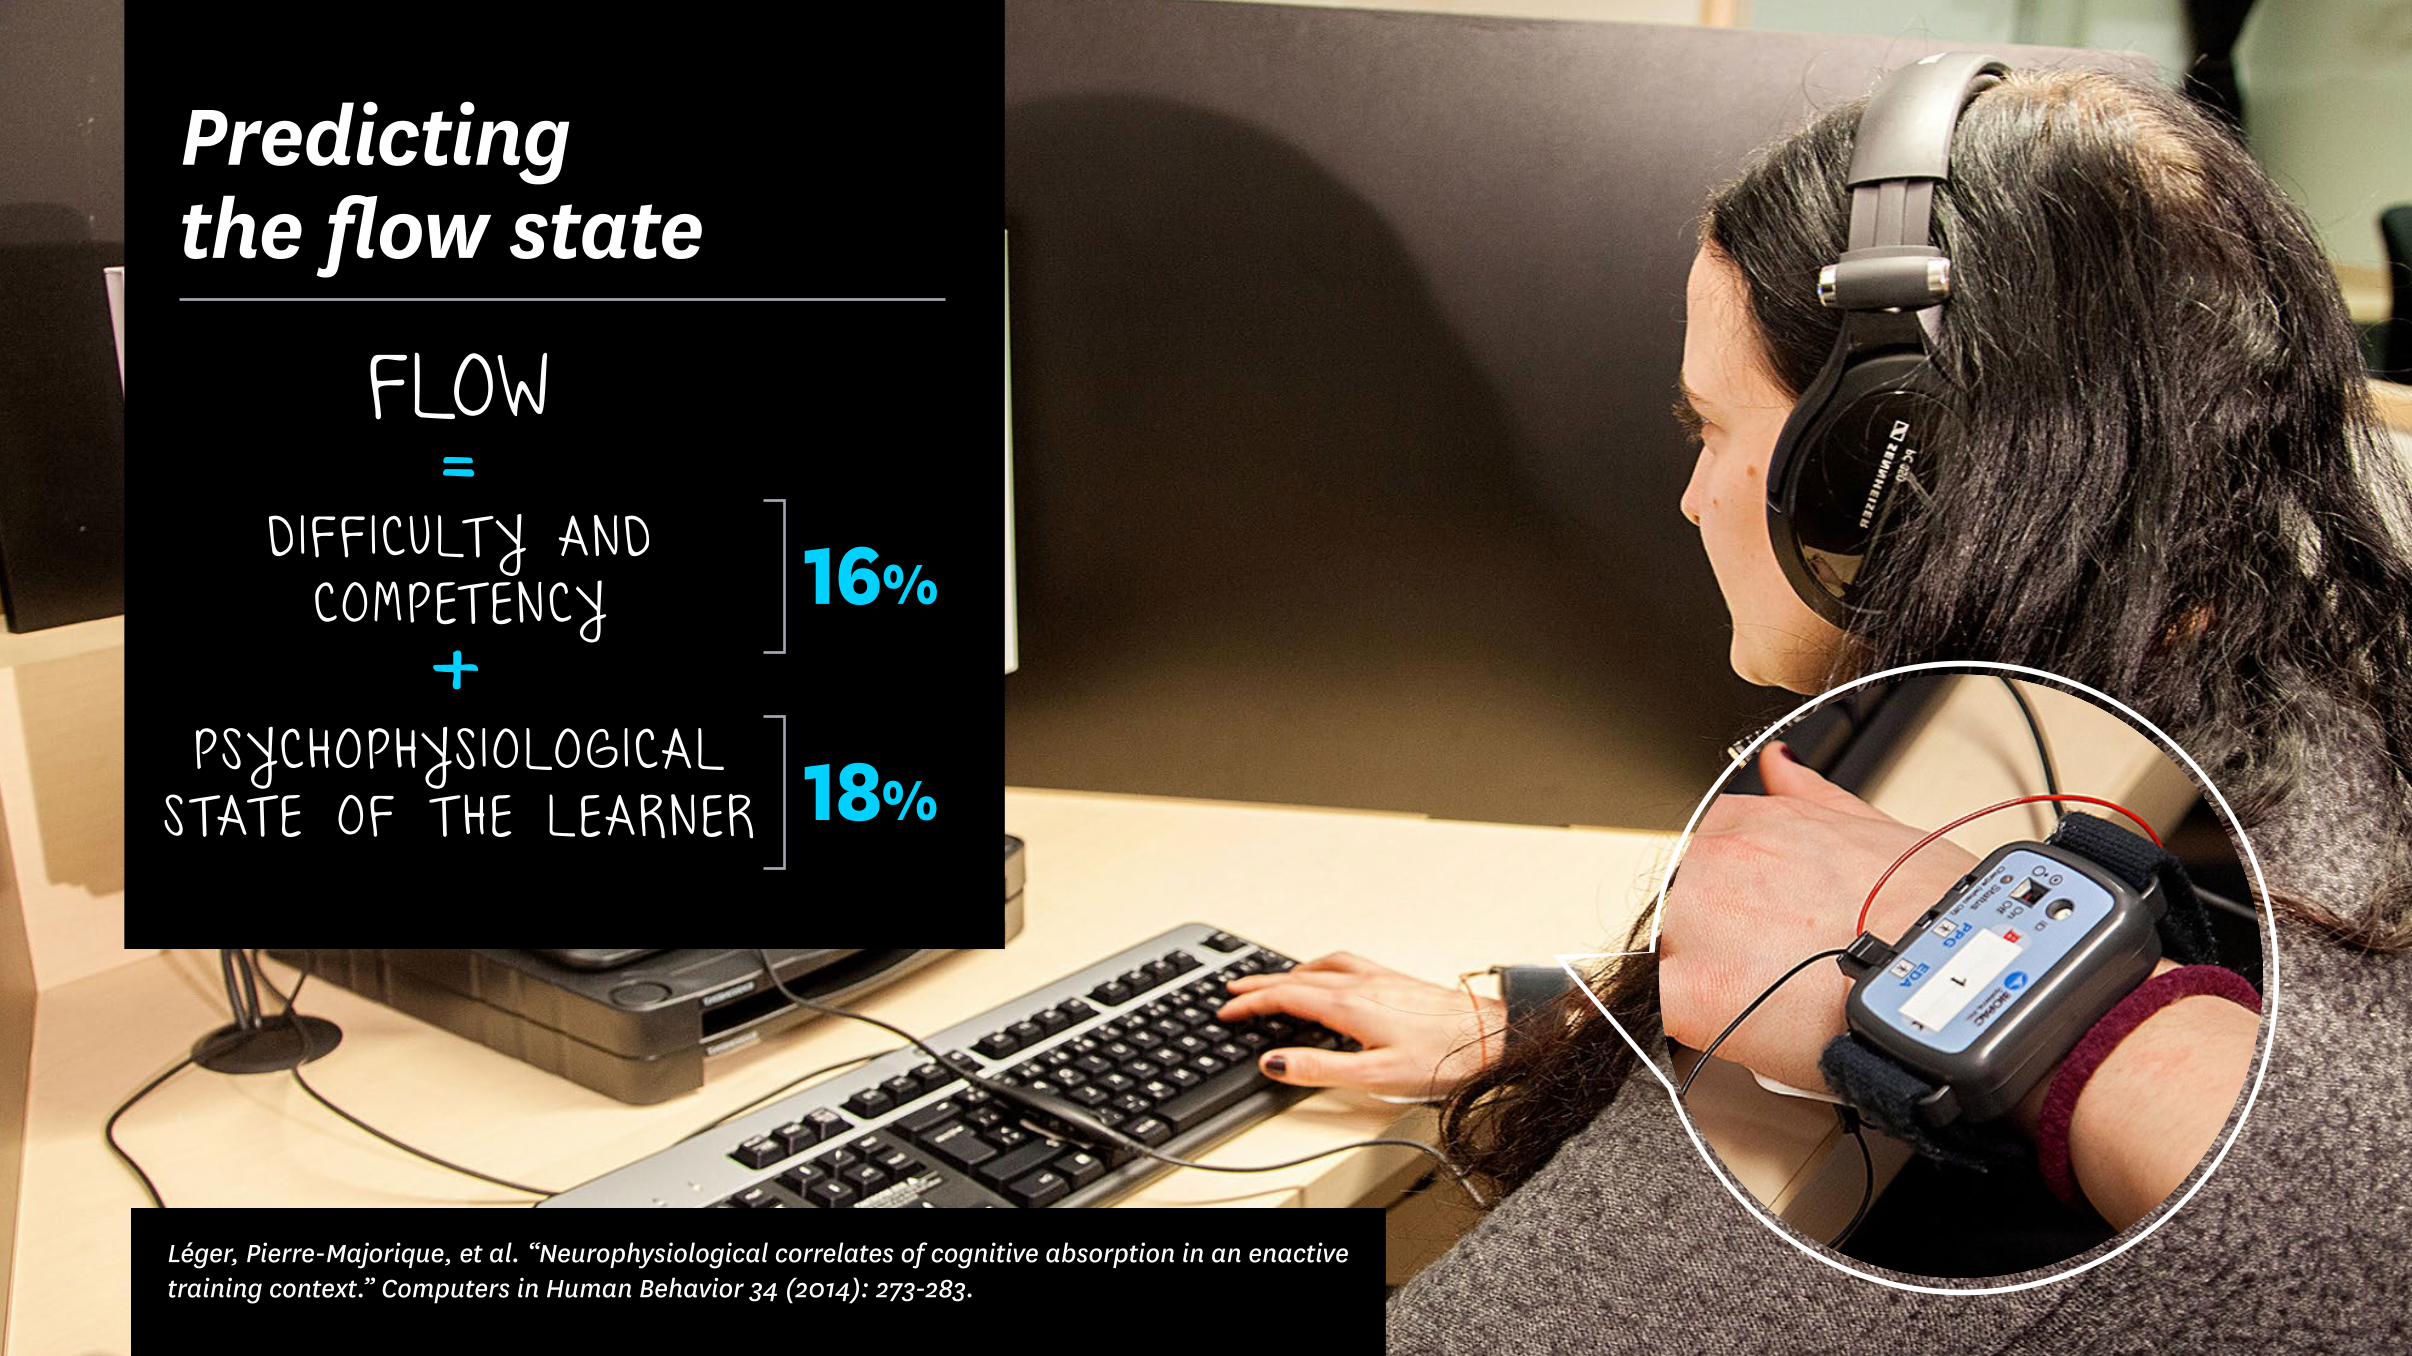
FLOW = DiFF icuLty anD cOmpet ency+
psychOphys iOLOgicaL stat e OF t he Learner
Predicting the flow state
16%
18%
© Copyright Tech3Lab 2015
Léger, Pierre-Majorique, et al. “Neurophysiological correlates of cognitive absorption in an enactive training context.” Computers in Human Behavior 34 (2014): 273-283.

FLOW OF pLayer (a)= DiFF icuLty + cOmpet ency+
pLayer (a)+pLayer (B)
Predicting flow in multiplayer context
66%
Bastarache, Léger, Courtemanche, Sénécal and Fredette (2015) Measuring Flow Using Psychophysiological Data in a Multiplayer Gaming Context, Information Systems and Neuroscience, Lecture Notes in Information Systems and Organisation.
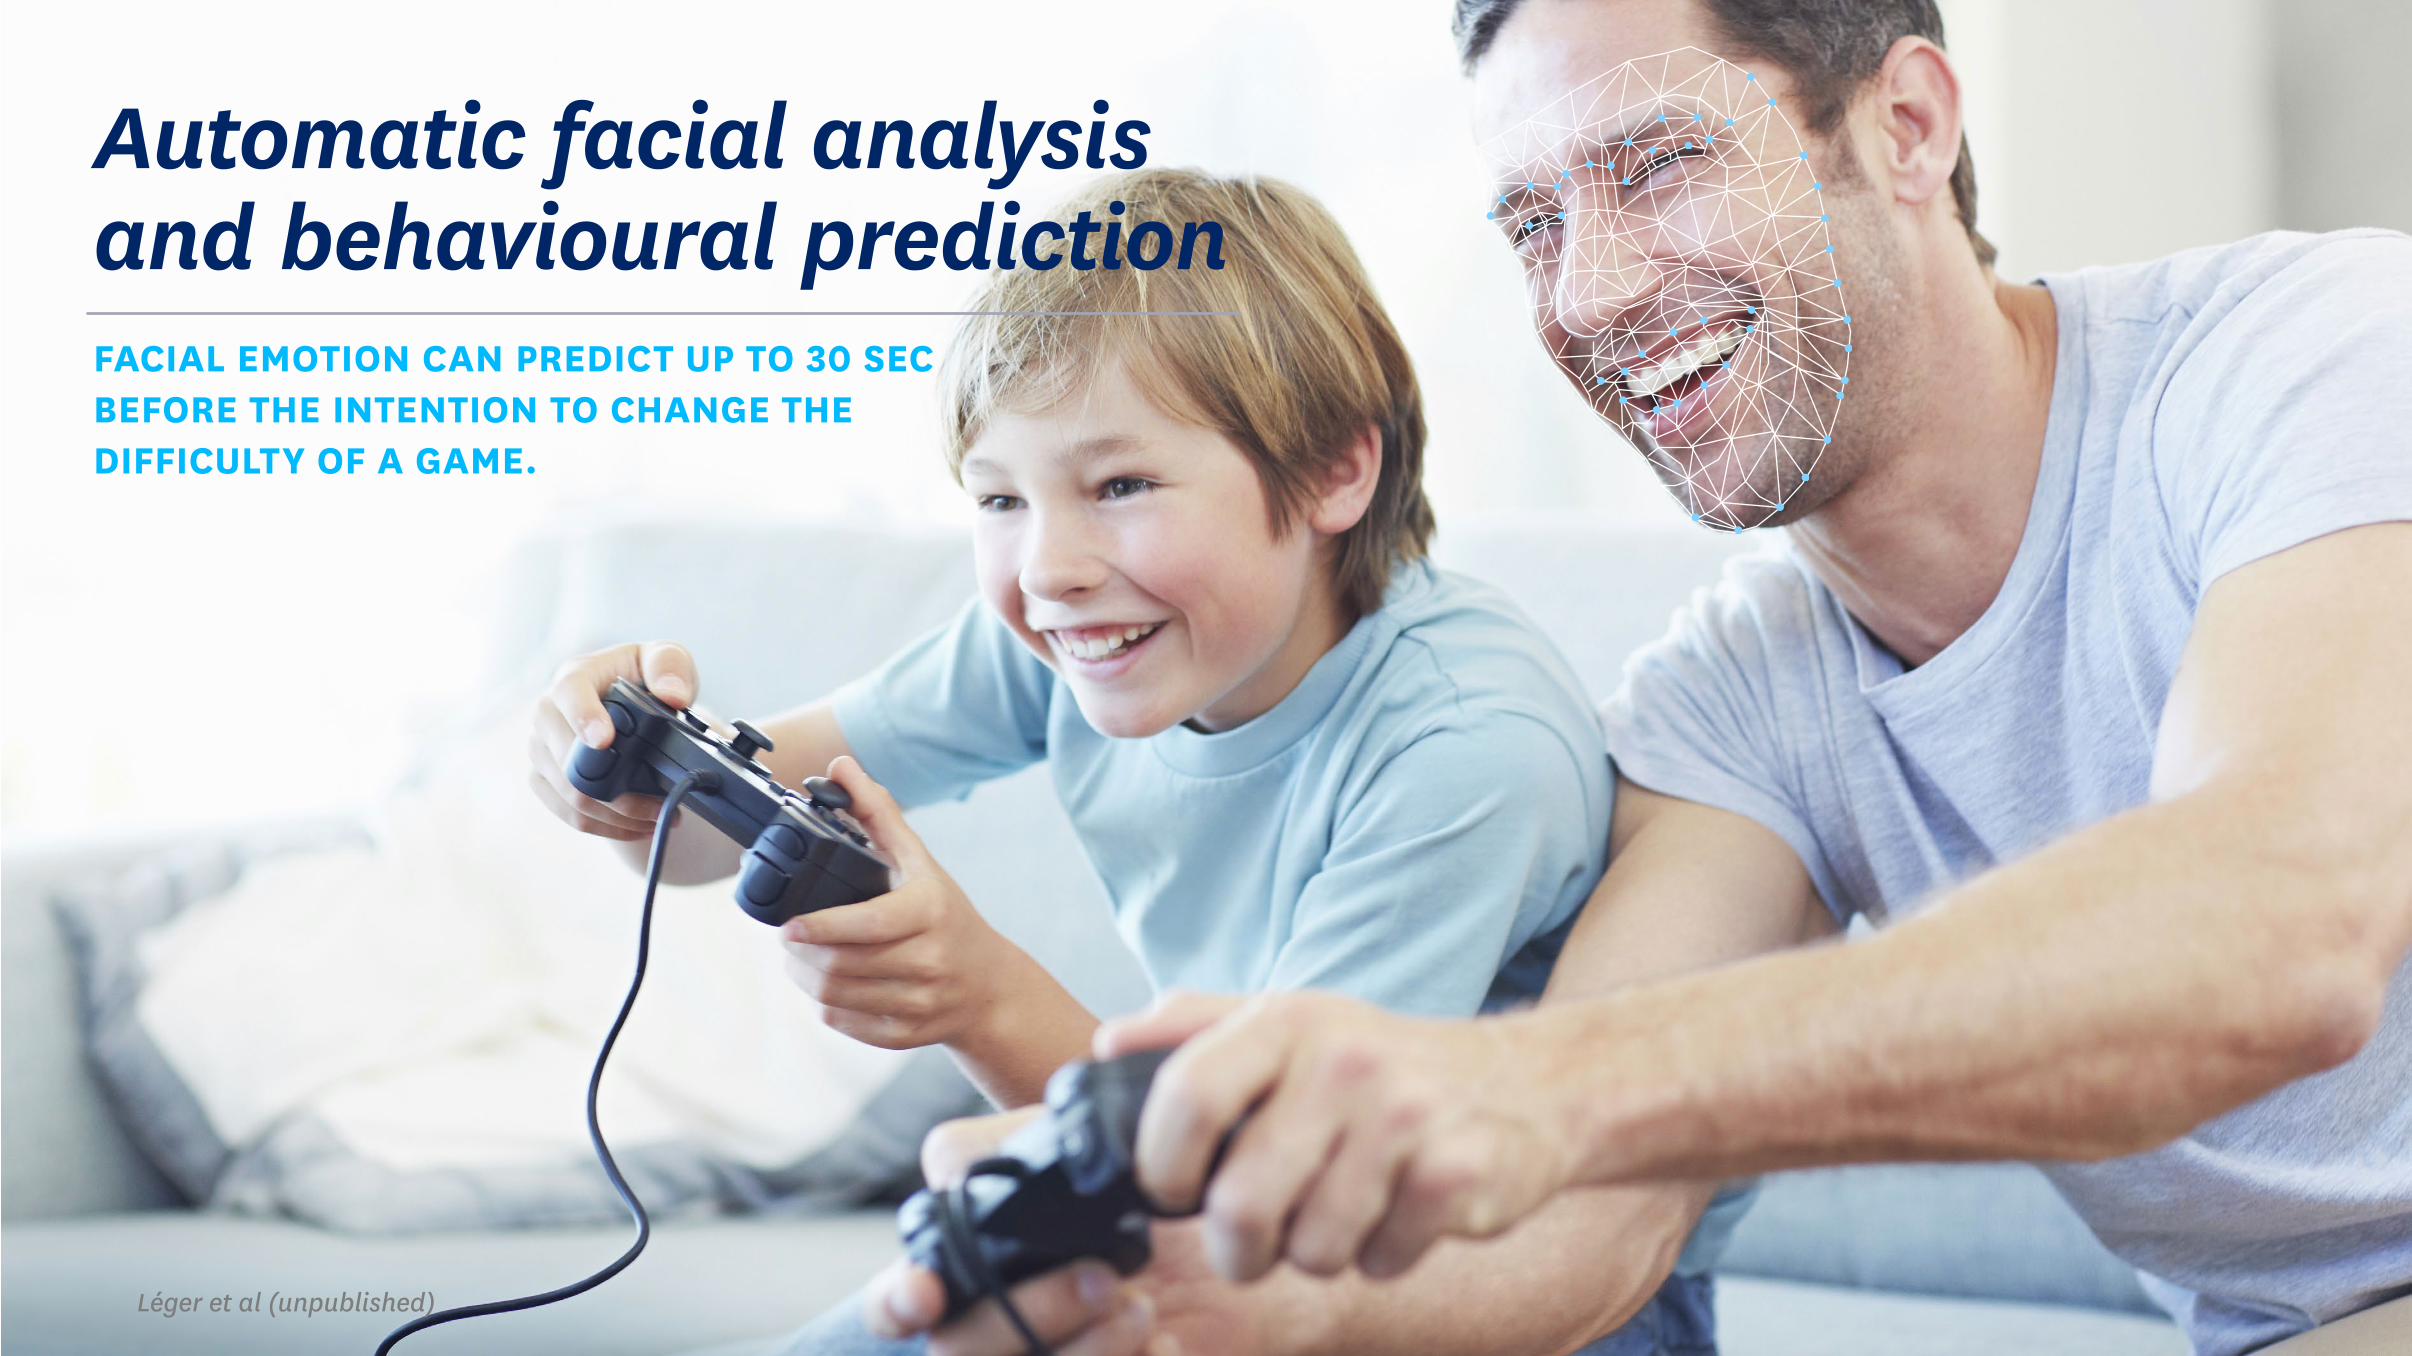
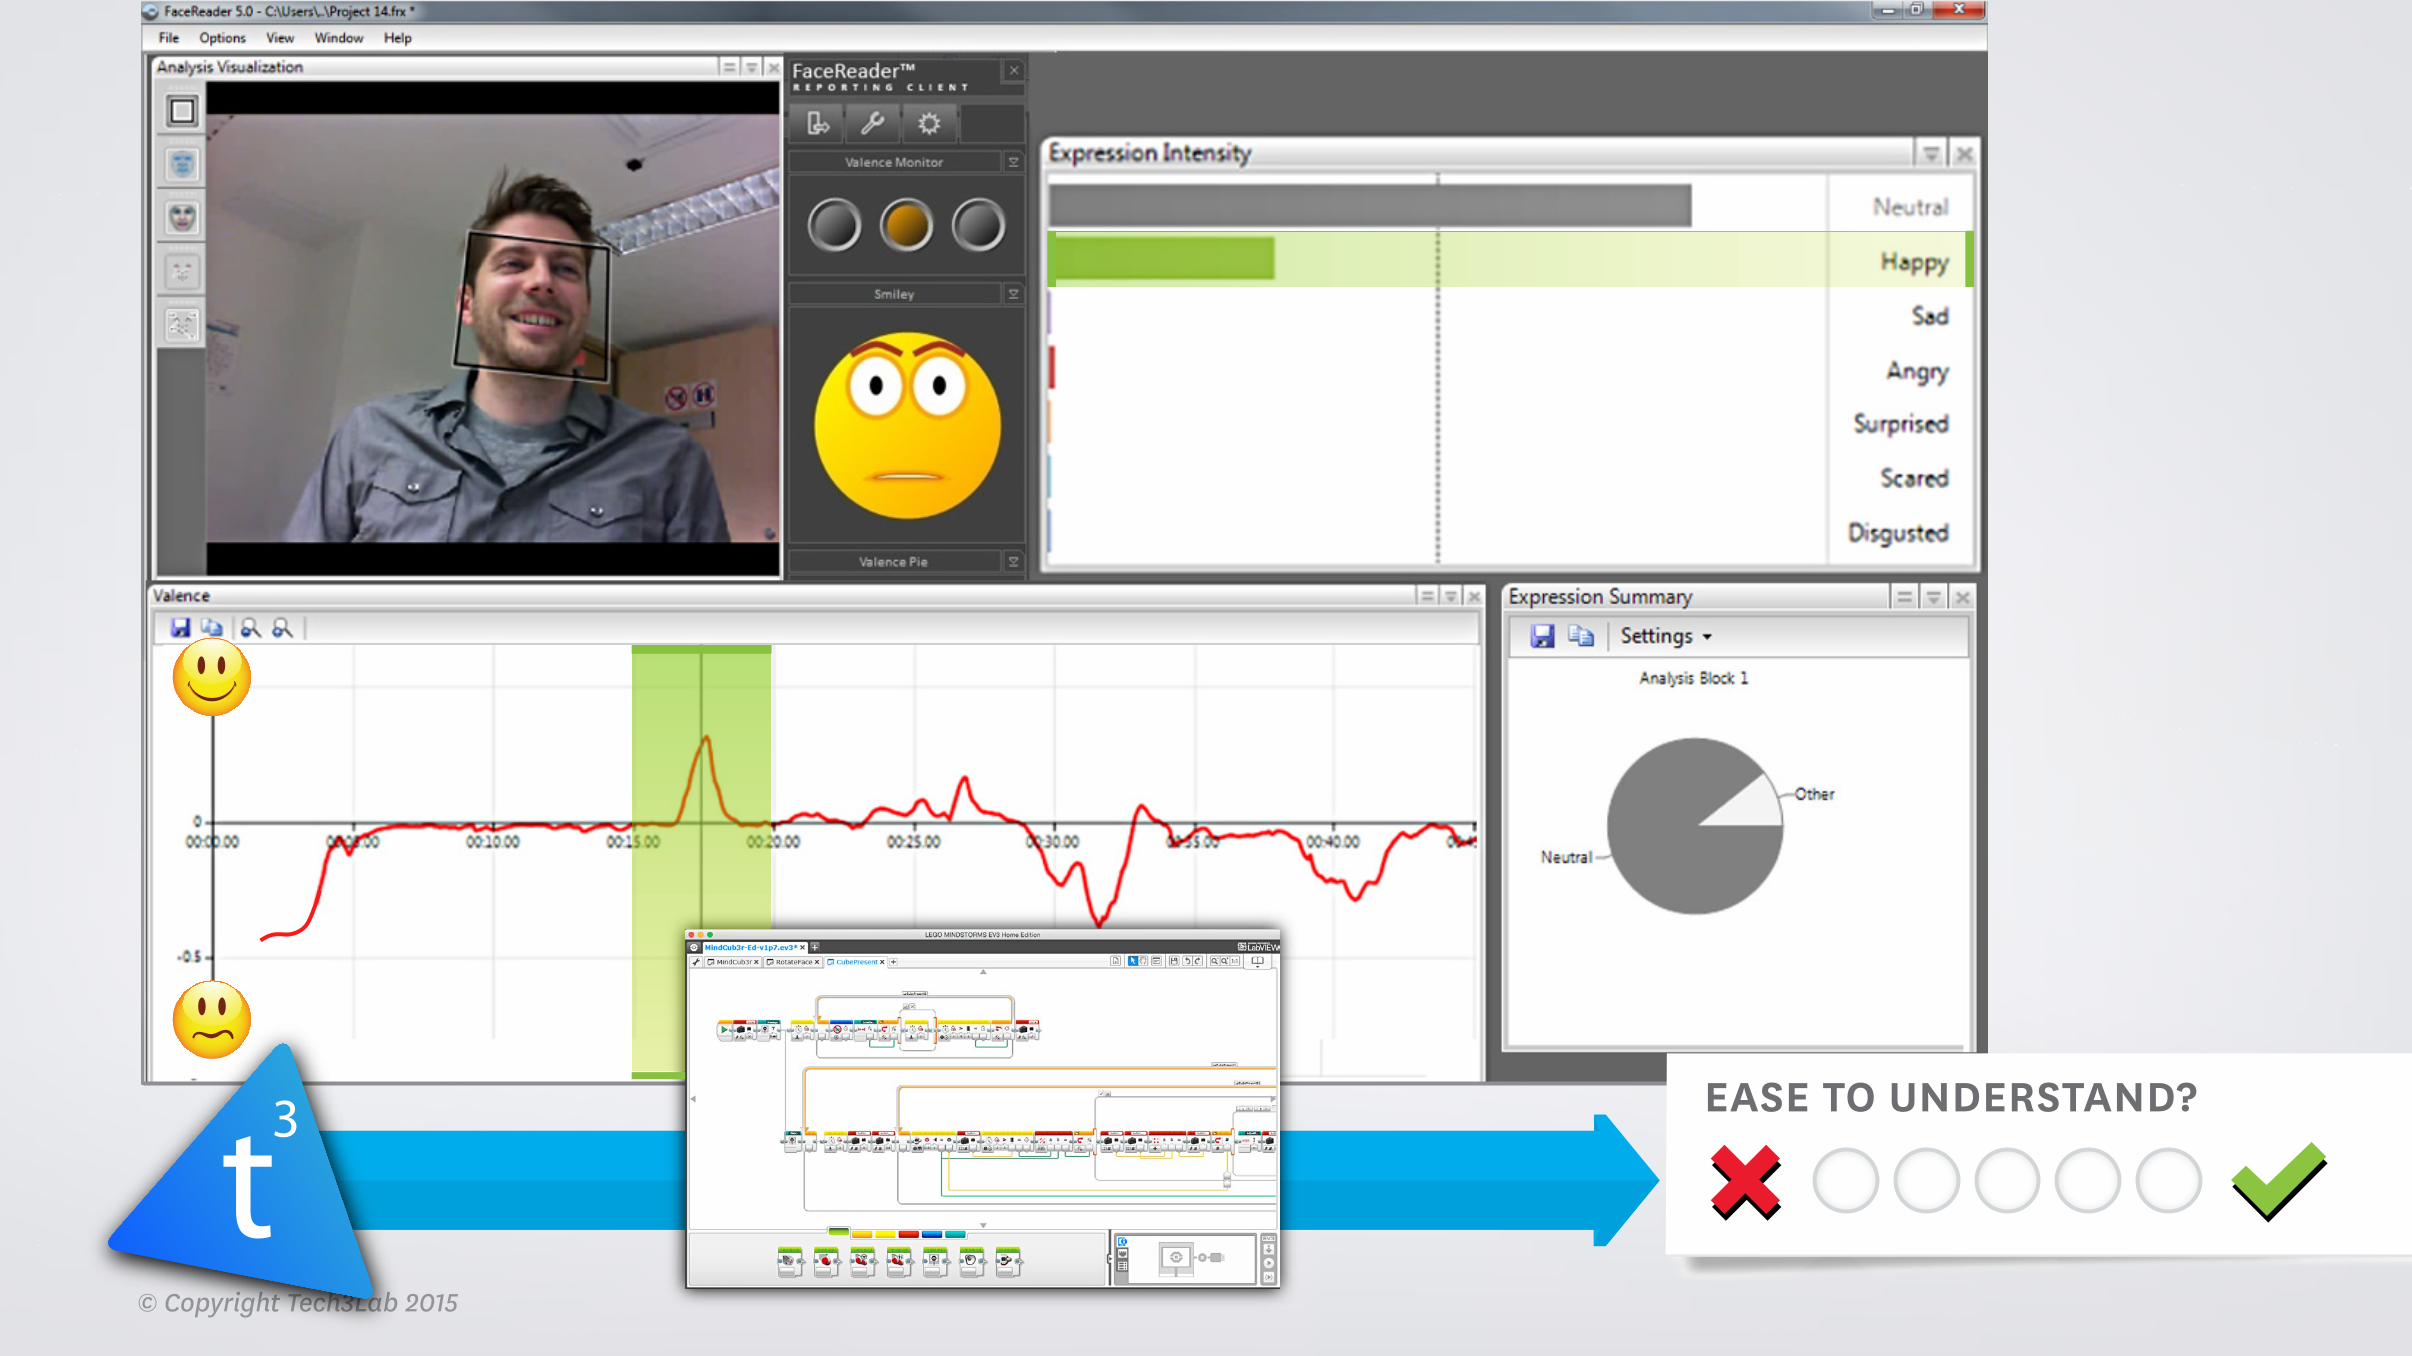
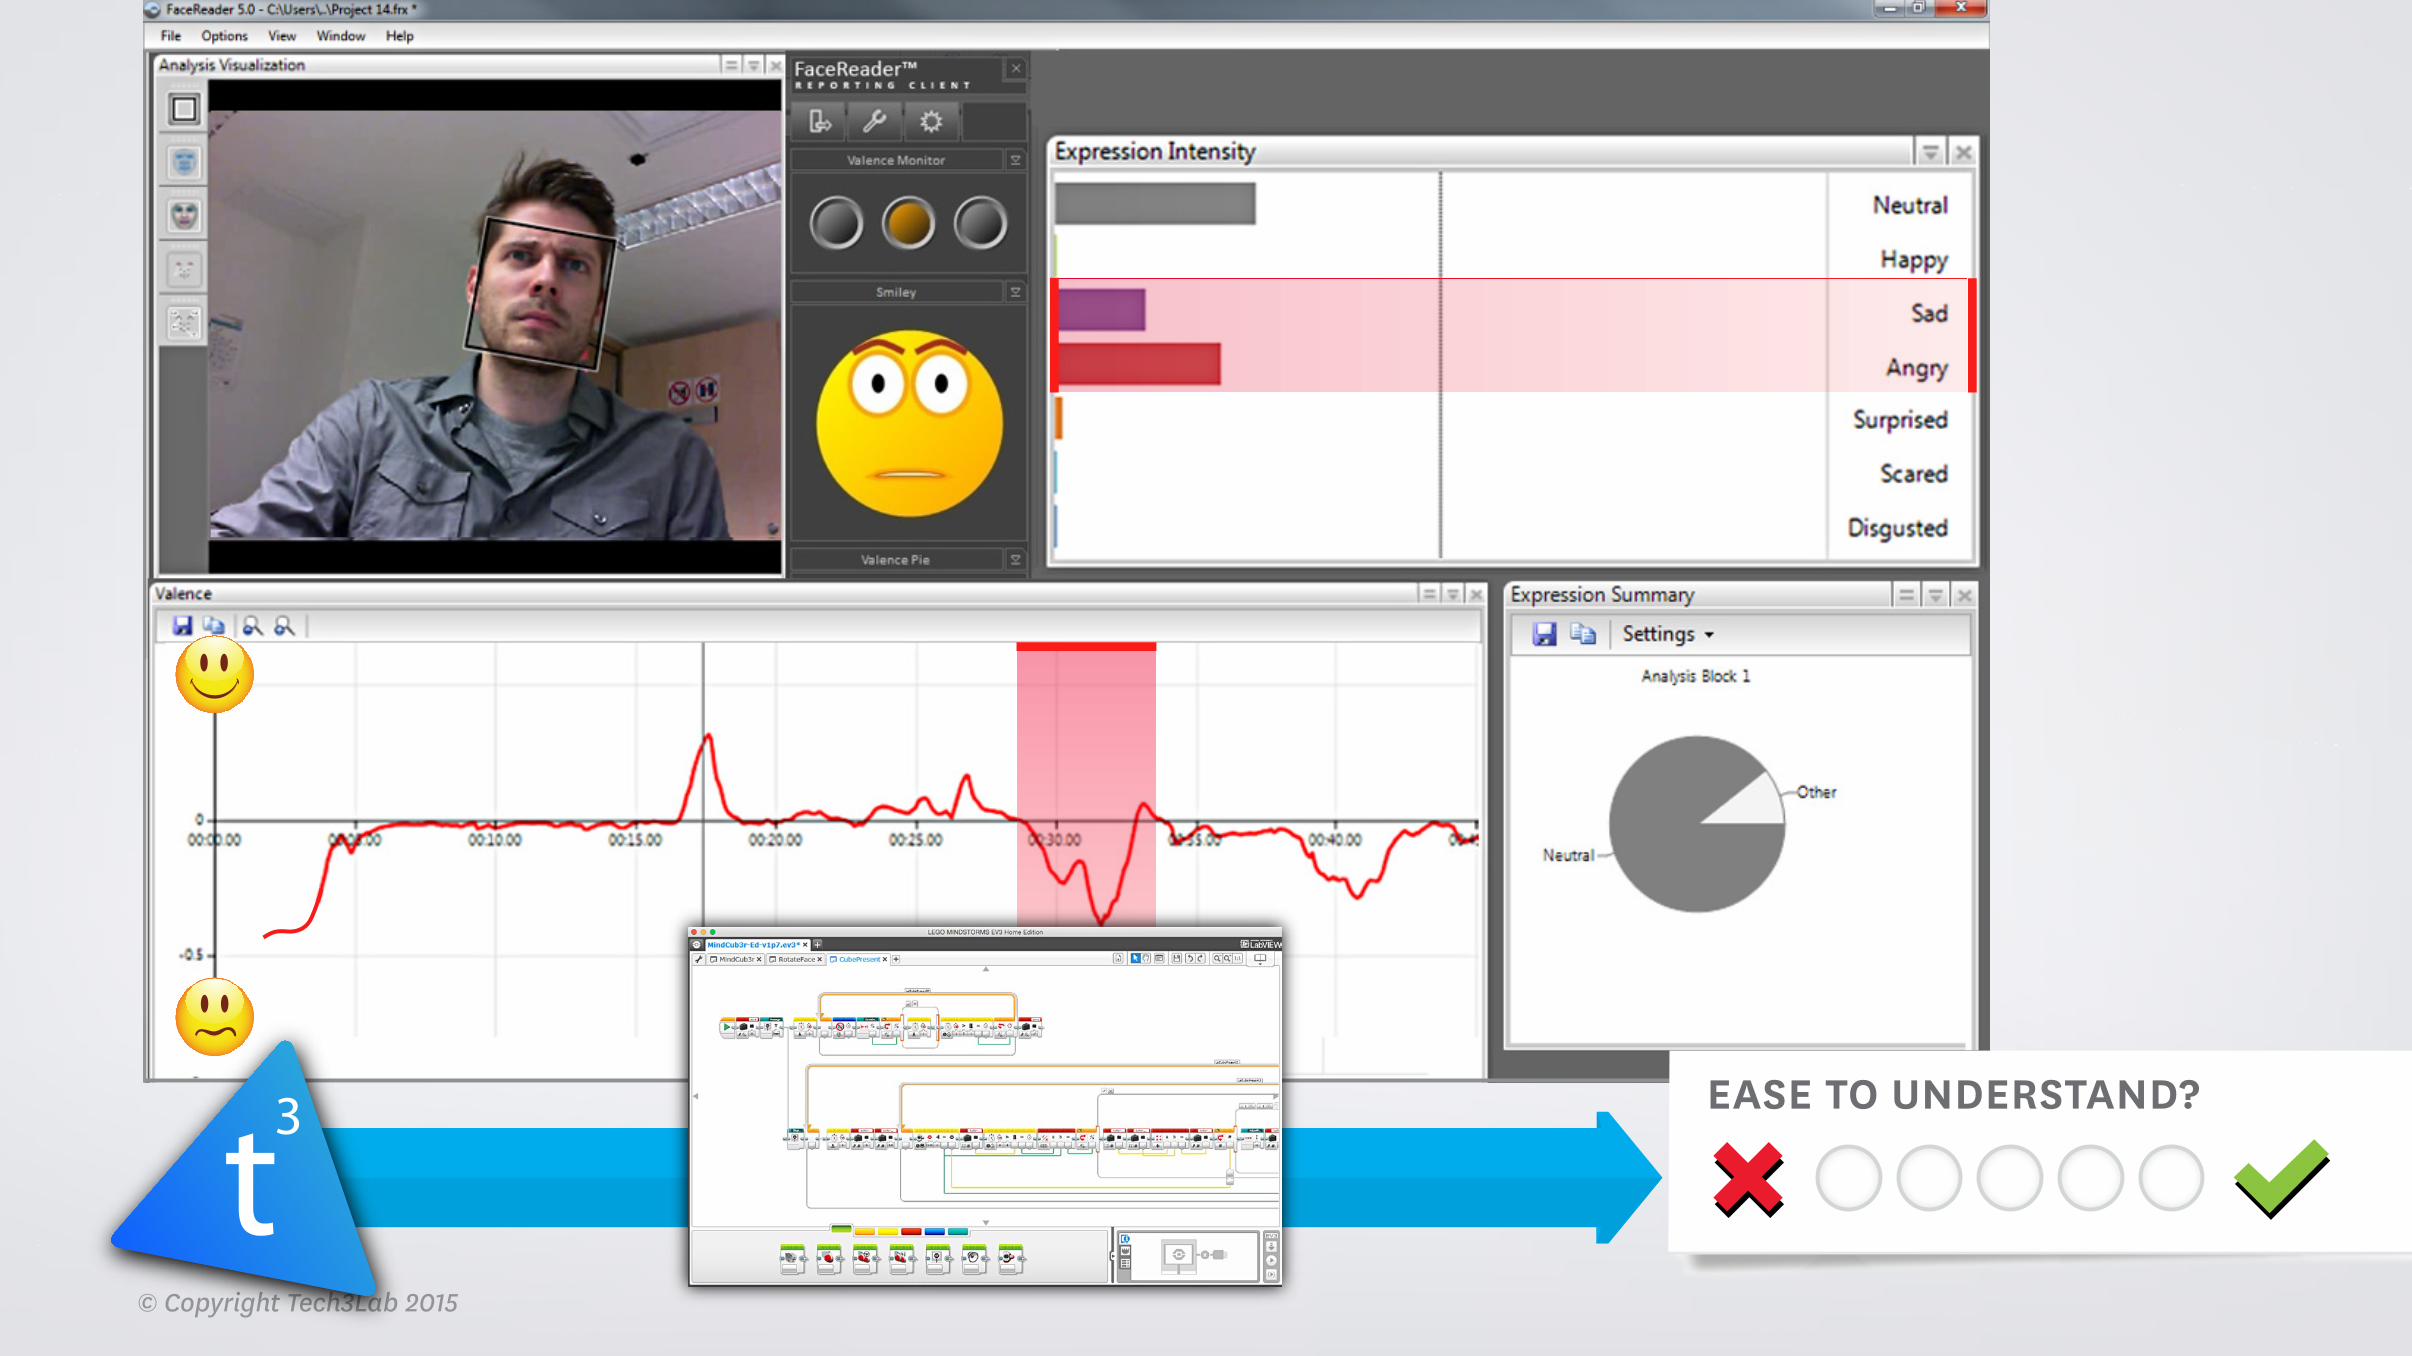
Automatic facial analysis and behavioural predictionfACIAL EMOtIOn CAn PREDICt UP tO 30 sEC bEfORE thE IntEntIOn tO ChAnGE thE DIffICULty Of A GAME.
Léger et al (unpublished)
© Copyright Tech3Lab 2015
EASE TO UNDERST AND? EASE TO UNDERST AND?
Pre-Test Post-Test
AttItUDE knOwLEDGE AttItUDE knOwLEDGE
COMPEtEnCy
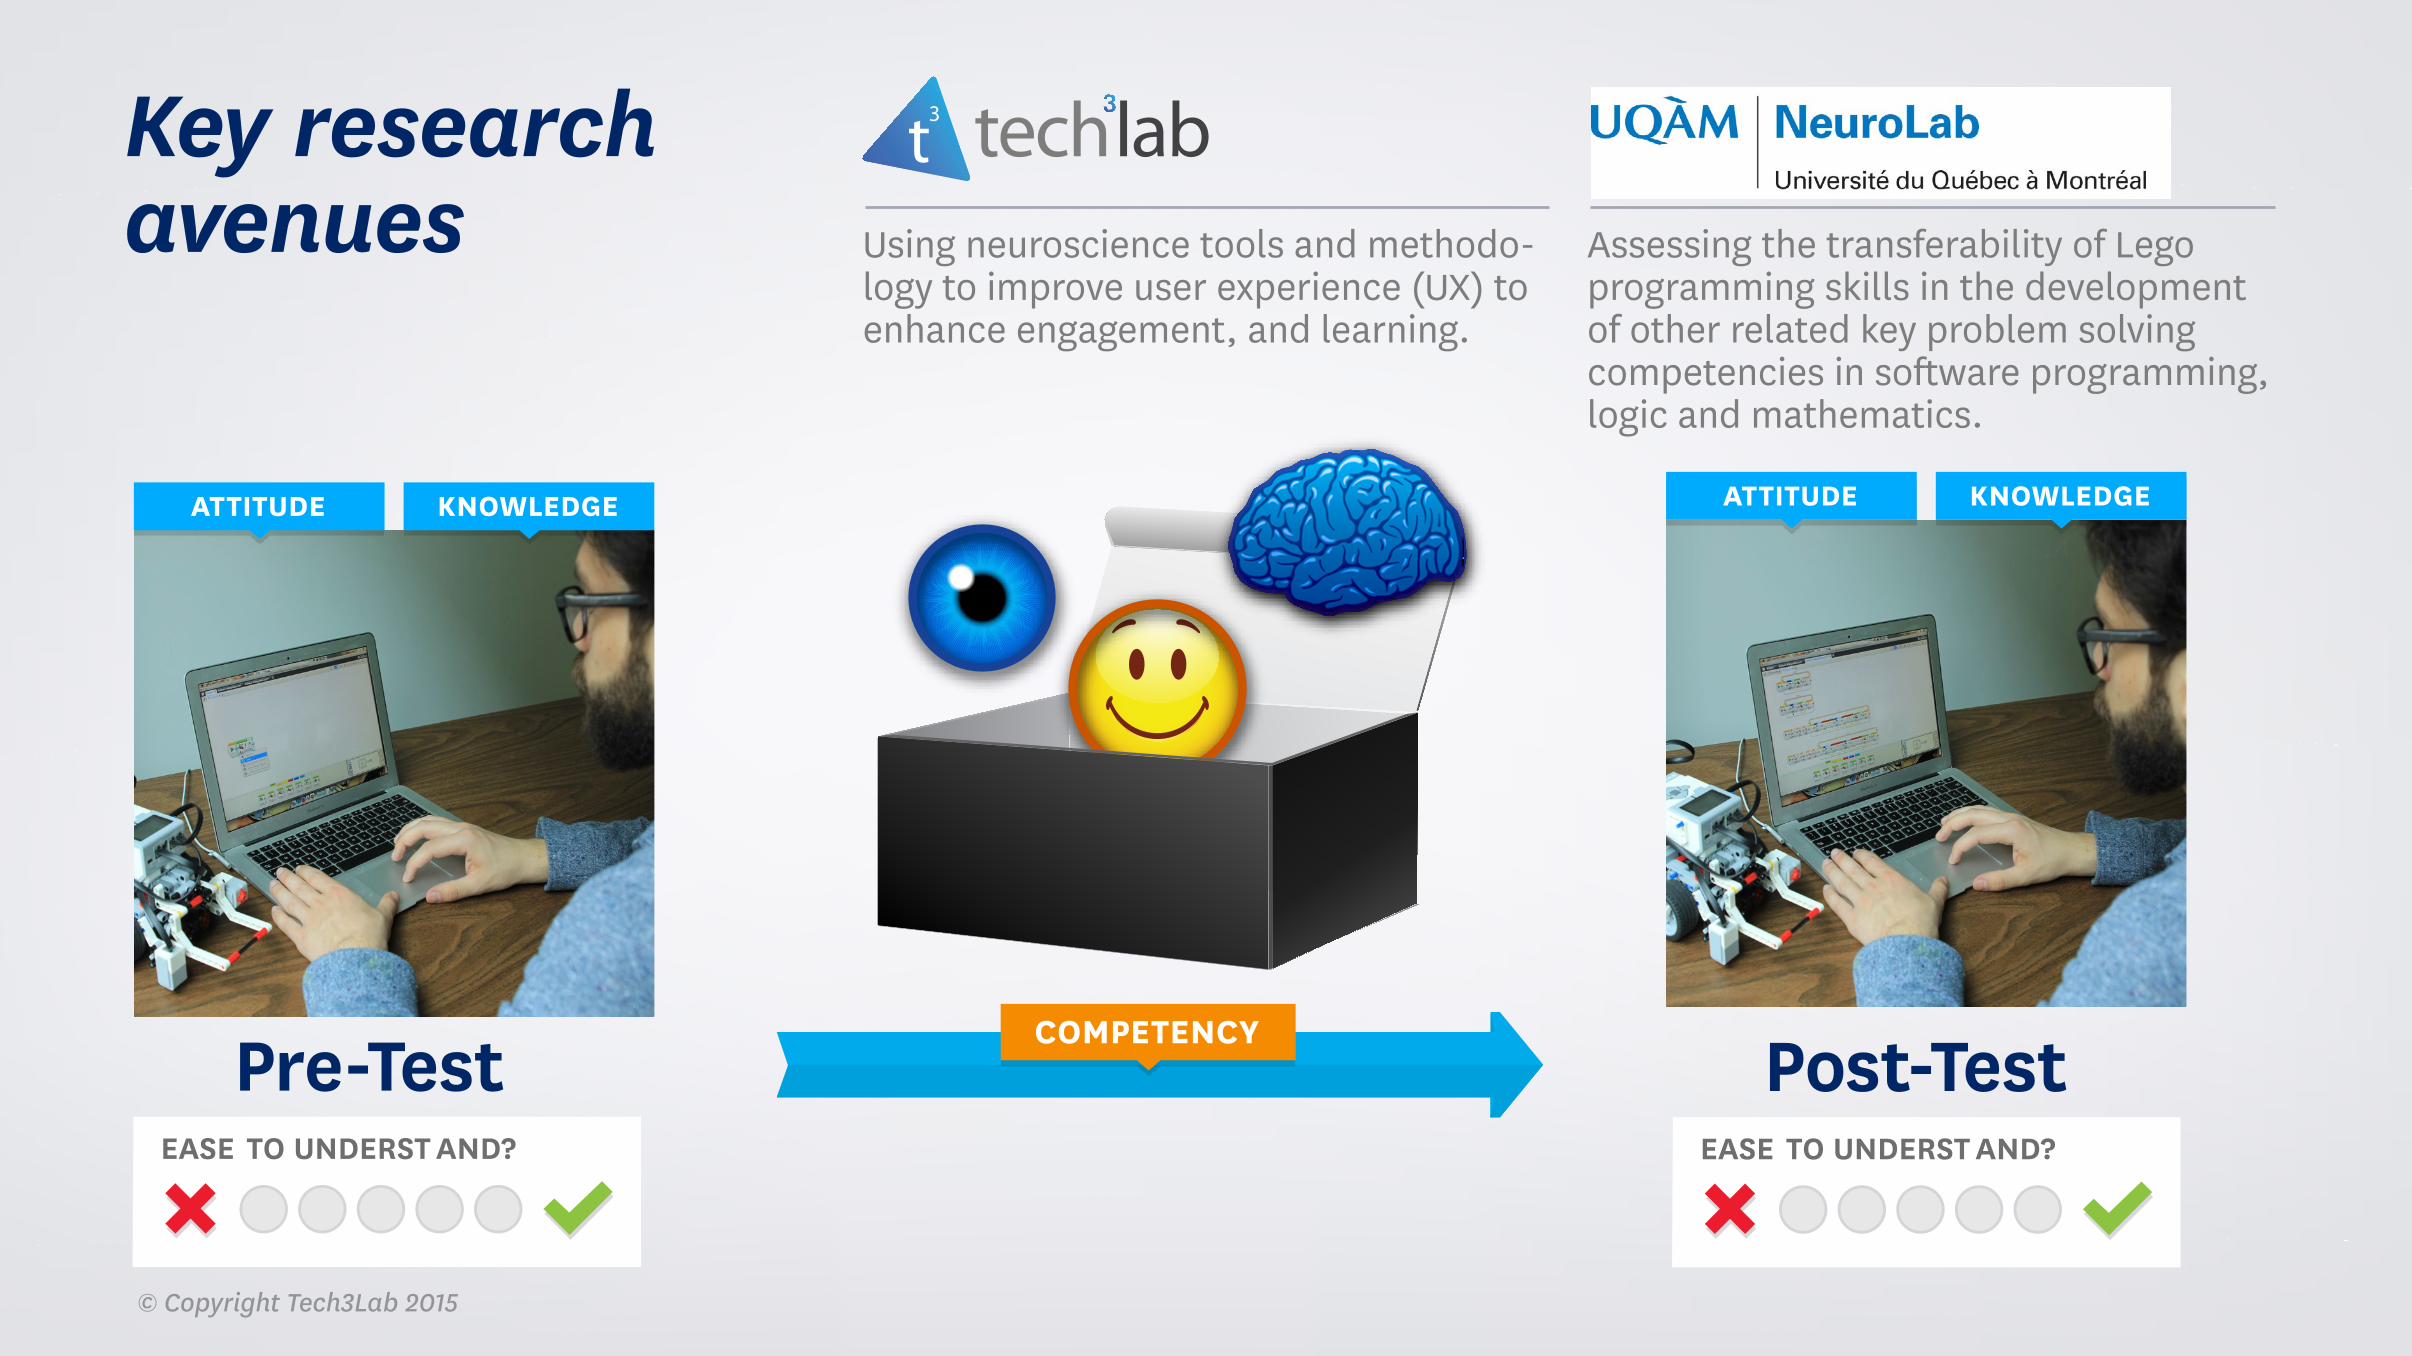
Key research avenues Using neuroscience tools and methodo-
logy to improve user experience (UX) to enhance engagement, and learning.
Assessing the transferability of Lego programming skills in the development of other related key problem solving competencies in software programming, logic and mathematics.

The learner is not a black box: Measuring emotion, engagement and learning while playing
Prof. Pierre-Majorique Léger, Ph.D.Co-director Tech3Lab
Prof. Patrick Charland,Ph.D.Co-directeur NeuroLab
#uxt3l @tech3lab_hec
Billund, Denmark. May 5th 2015