Embed Size (px)
Citation preview

1
Using ExamSoft Data for Faculty DevelopmentMisty M Stutz, PharmD and Kimberly K Daugherty, PharmD BCPS
Sullivan University College of Pharmacy
Thank you for joining.
The webinar will begin shortly.
2
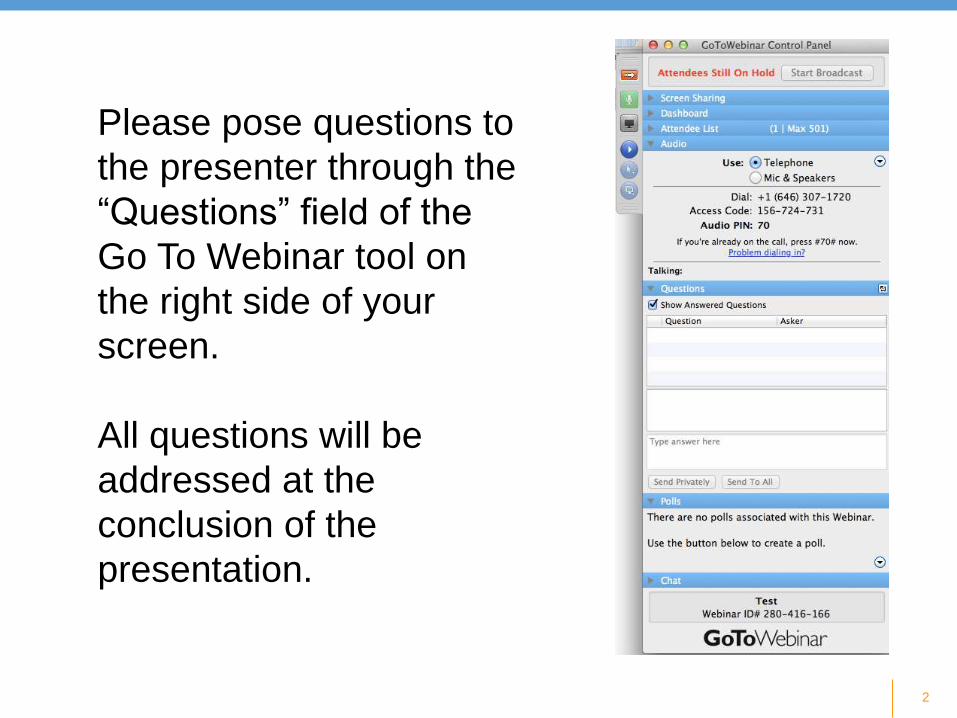
Please pose questions to
the presenter through the
“Questions” field of the
Go To Webinar tool on
the right side of your
screen.
All questions will be
addressed at the
conclusion of the
presentation.
Using ExamSoft Data for
Faculty Development
Misty M Stutz, PharmD
Chair, Clinical and Administrative Sciences
Kimberly K Daugherty, PharmD BCPS
Assistant Dean, Academic Affairs and Assessment
Objectives
Describe how to use ExamSoft reports to pull data needed for a faculty teaching scorecard
Explain how faculty scorecards can be used to help faculty identify how their item writing compares to their peers
Discuss how the report cards can be interpreted and how they can be used
Describe how the report cards are organized and presented to the faculty member
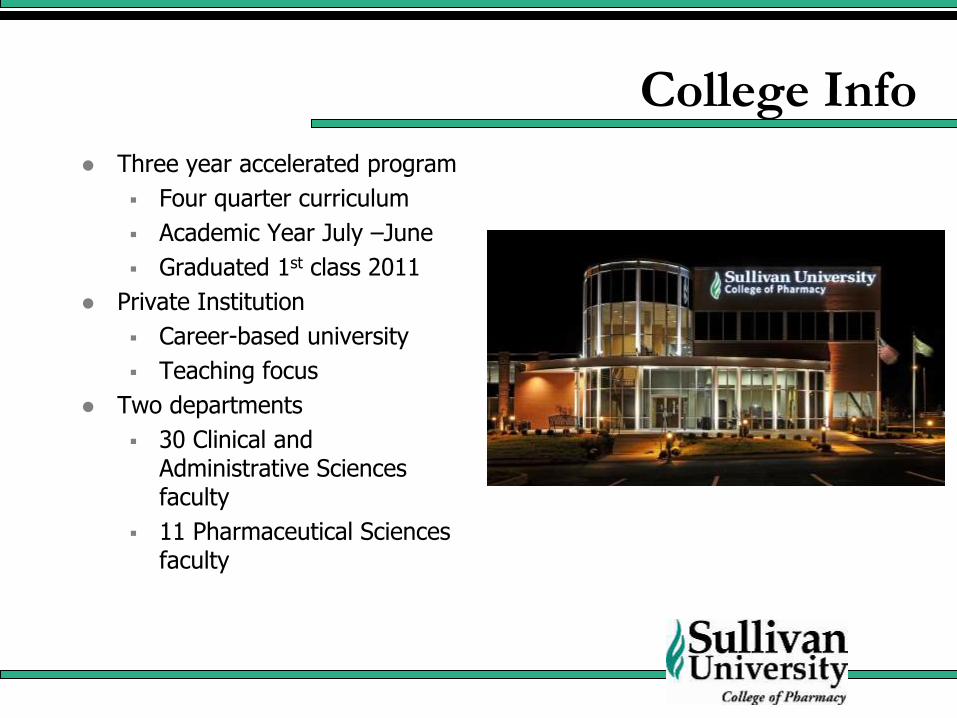
College Info
Three year accelerated program
Four quarter curriculum
Academic Year July –June
Graduated 1st class 2011
Private Institution
Career-based university
Teaching focus
Two departments
30 Clinical and Administrative Sciences faculty
11 Pharmaceutical Sciences faculty
FACULTY EVALUATION
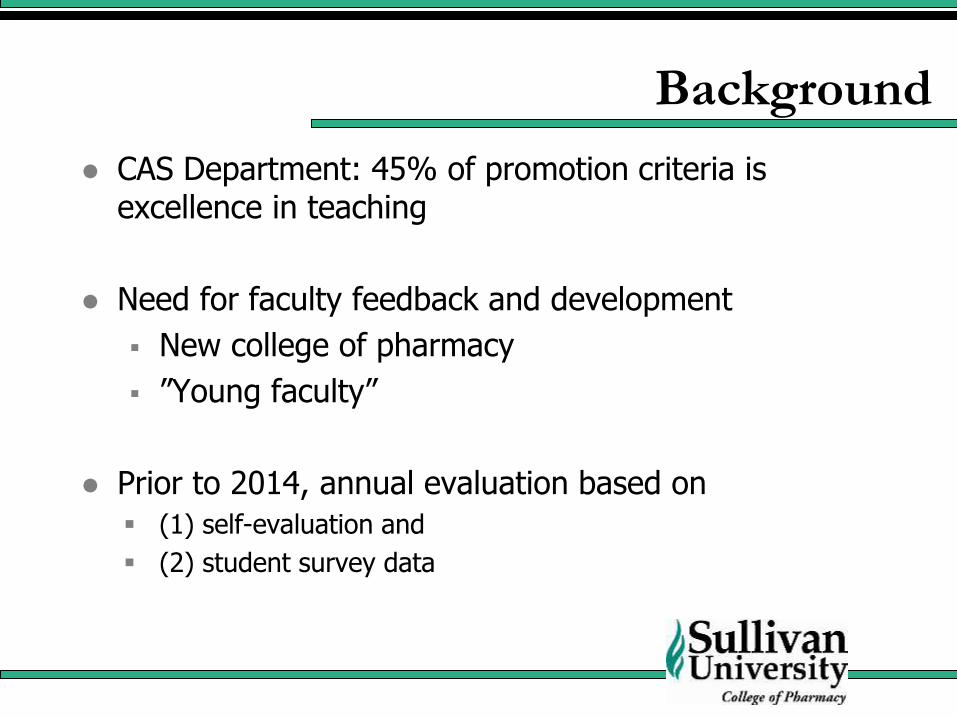
Background
CAS Department: 45% of promotion criteria is excellence in teaching
Need for faculty feedback and development
New college of pharmacy
”Young faculty”
Prior to 2014, annual evaluation based on
(1) self-evaluation and
(2) student survey data
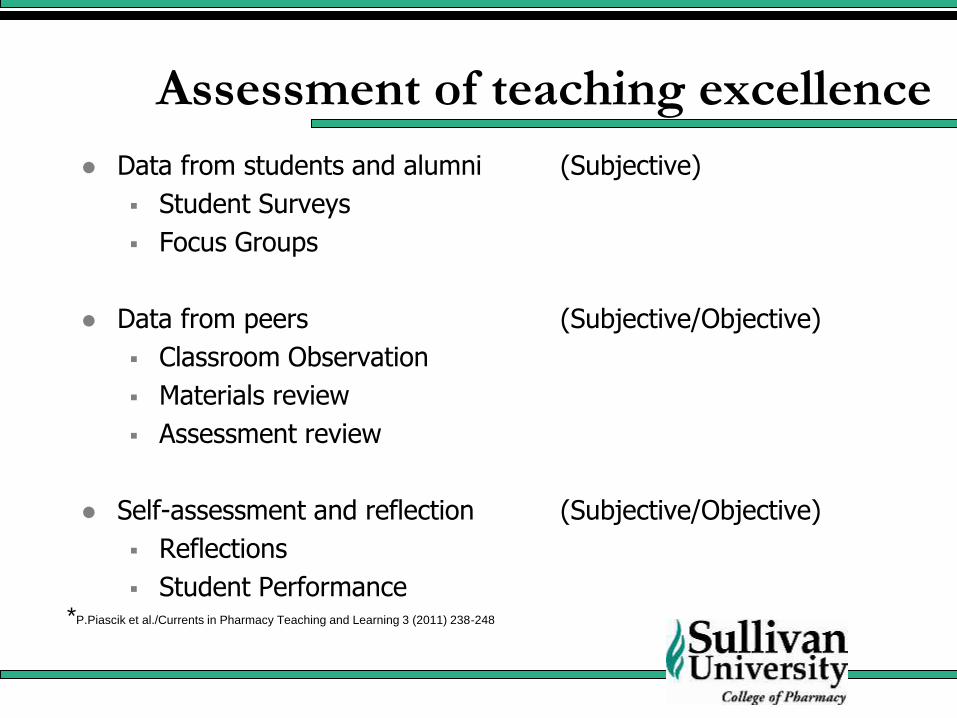
Assessment of teaching excellence
Data from students and alumni (Subjective)
Student Surveys
Focus Groups
Data from peers (Subjective/Objective)
Classroom Observation
Materials review
Assessment review
Self-assessment and reflection (Subjective/Objective)
Reflections
Student Performance*P.Piascik et al./Currents in Pharmacy Teaching and Learning 3 (2011) 238-248
Faculty Teaching
Scorecard
Strongly Agree
Agree DisagreeStrongly Disagree
Unable to Comment
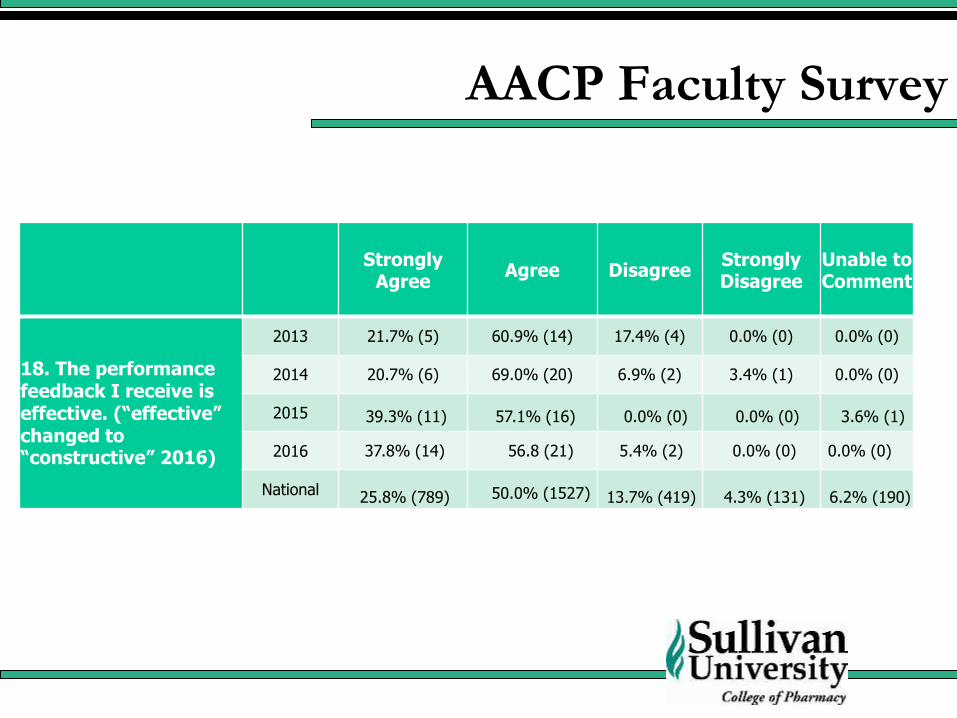
18. The performance feedback I receive is effective. (“effective” changed to “constructive” 2016)
2013 21.7% (5) 60.9% (14) 17.4% (4) 0.0% (0) 0.0% (0)
2014 20.7% (6) 69.0% (20) 6.9% (2) 3.4% (1) 0.0% (0)
2015 39.3% (11) 57.1% (16) 0.0% (0) 0.0% (0) 3.6% (1)
2016 37.8% (14) 56.8 (21) 5.4% (2) 0.0% (0) 0.0% (0)
National 25.8% (789) 50.0% (1527) 13.7% (419) 4.3% (131) 6.2% (190)
AACP Faculty Survey

Using ExamSoft to create objective data
All quizzes and examinations in Examsoft are tagged by:
SUCOP outcome
Curriculum topic
Faculty Name
Blooms taxonomy
Item analysis is conducted after each examination to determine if questions should be rescored:
Exam Average
Low and high exam scores
Point biscerals
Difficulty index
Item analysis data can also be used to help develop faculty exam writing skills.
http://university.examsoft.com/h/i/218895432-evaluating-the-statistics/233580
Item analysis
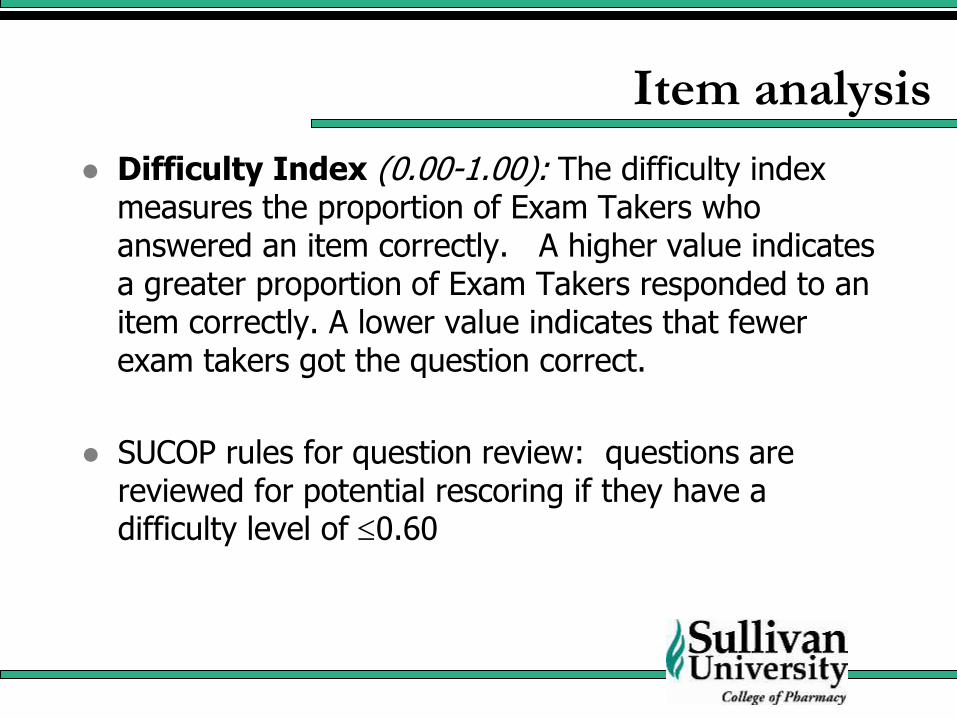
Difficulty Index (0.00-1.00): The difficulty index measures the proportion of Exam Takers who answered an item correctly. A higher value indicates a greater proportion of Exam Takers responded to an item correctly. A lower value indicates that fewer exam takers got the question correct.
SUCOP rules for question review: questions are reviewed for potential rescoring if they have a difficulty level of 0.60
Item analysis
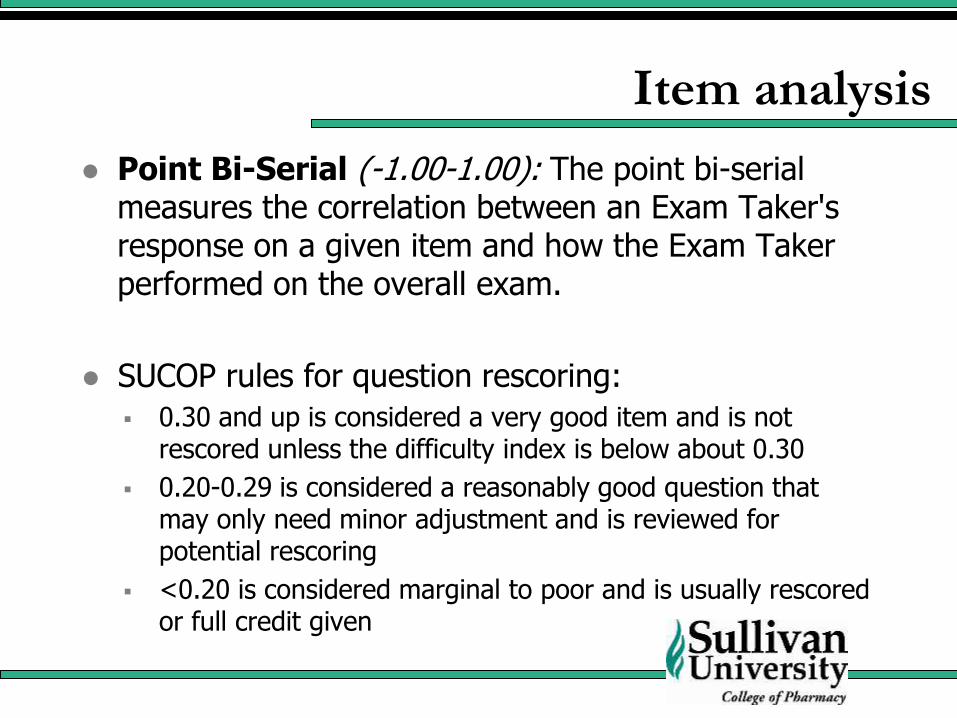
Point Bi-Serial (-1.00-1.00): The point bi-serial measures the correlation between an Exam Taker's response on a given item and how the Exam Taker performed on the overall exam.
SUCOP rules for question rescoring:
0.30 and up is considered a very good item and is not rescored unless the difficulty index is below about 0.30
0.20-0.29 is considered a reasonably good question that may only need minor adjustment and is reviewed for potential rescoring
<0.20 is considered marginal to poor and is usually rescored or full credit given

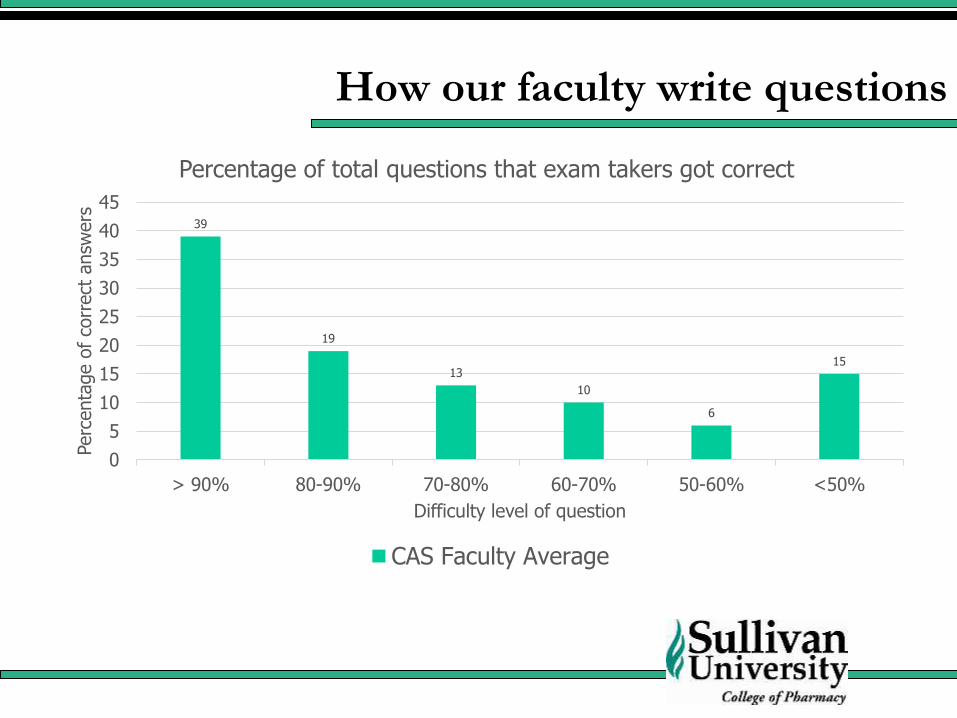
39
19
13
10
6
15
0
5
10
15
20
25
30
35
40
45
> 90% 80-90% 70-80% 60-70% 50-60% <50%
Perc
enta
ge o
f co
rrect
answ
ers
Difficulty level of question
Percentage of total questions that exam takers got correct
CAS Faculty Average
How our faculty write questions
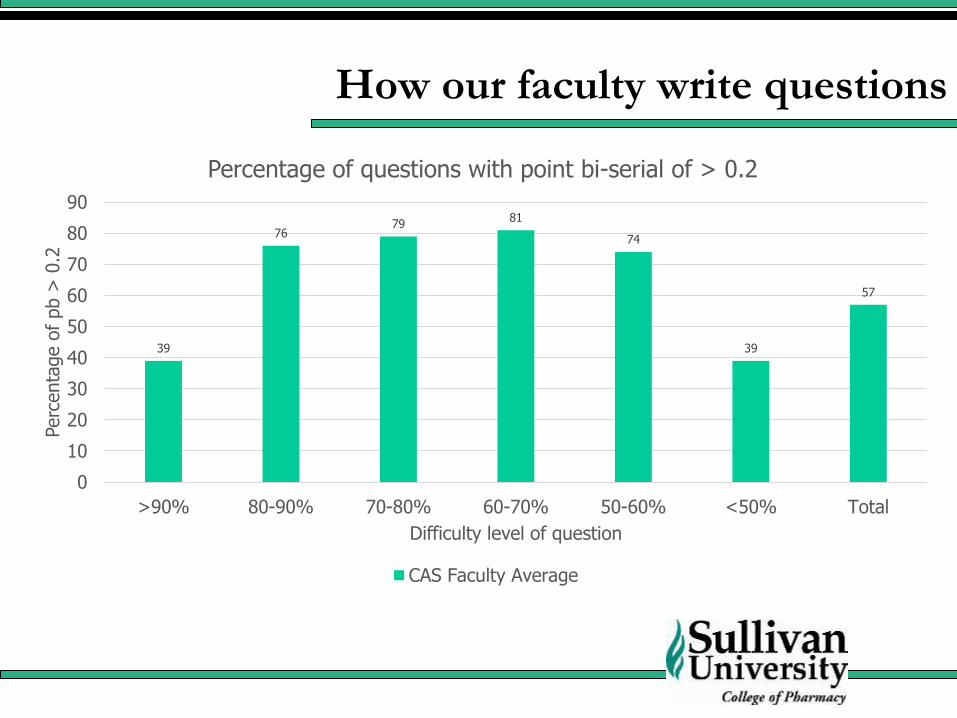
39
7679
81
74
39
57
0
10
20
30
40
50
60
70
80
90
>90% 80-90% 70-80% 60-70% 50-60% <50% Total
Perc
enta
ge o
f pb >
0.2
Difficulty level of question
Percentage of questions with point bi-serial of > 0.2
CAS Faculty Average
How our faculty write questions

26
18
13
18
11
19
39
19
13
10
6
14
0
5
10
15
20
25
30
35
40
45
> 90% 80-90% 70-80% 60-70% 50-60% <50%
Perc
enta
ge o
f co
rrect
answ
ers
Difficulty level of question
Percentage of total questions that exam takers got correct
"Hard" Item Writer Average
“Hard” item writer
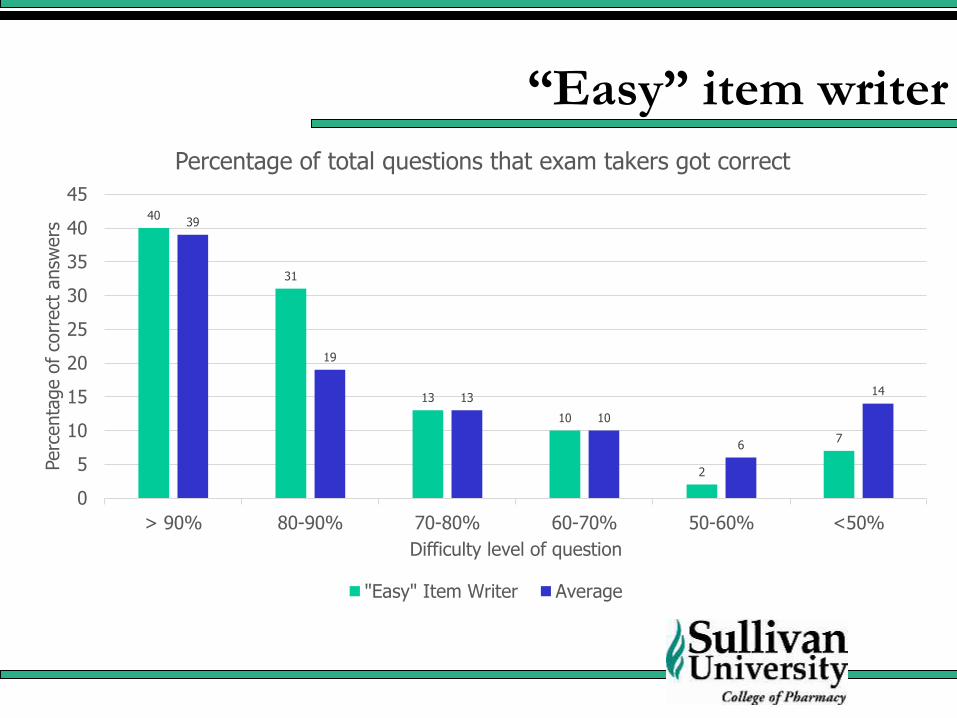
40
31
13
10
2
7
39
19
13
10
6
14
0
5
10
15
20
25
30
35
40
45
> 90% 80-90% 70-80% 60-70% 50-60% <50%
Perc
enta
ge o
f co
rrect
answ
ers
Difficulty level of question
Percentage of total questions that exam takers got correct
"Easy" Item Writer Average
“Easy” item writer
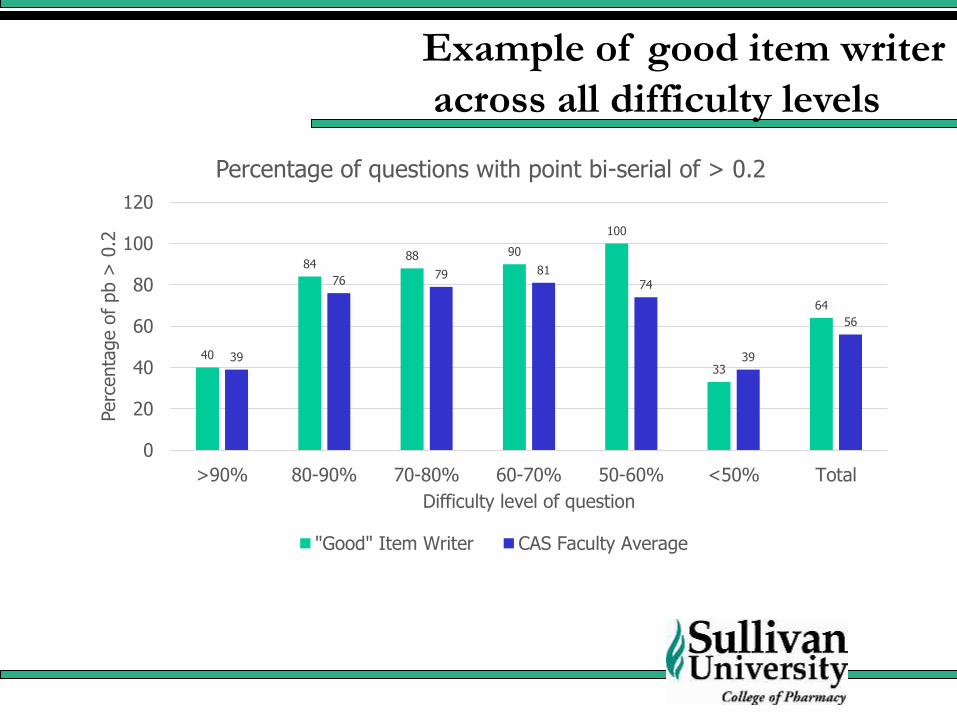
40
8488 90
100
33
64
39
7679 81
74
39
56
0
20
40
60
80
100
120
>90% 80-90% 70-80% 60-70% 50-60% <50% Total
Perc
enta
ge o
f pb >
0.2
Difficulty level of question
Percentage of questions with point bi-serial of > 0.2
"Good" Item Writer CAS Faculty Average
Example of good item writer
across all difficulty levels
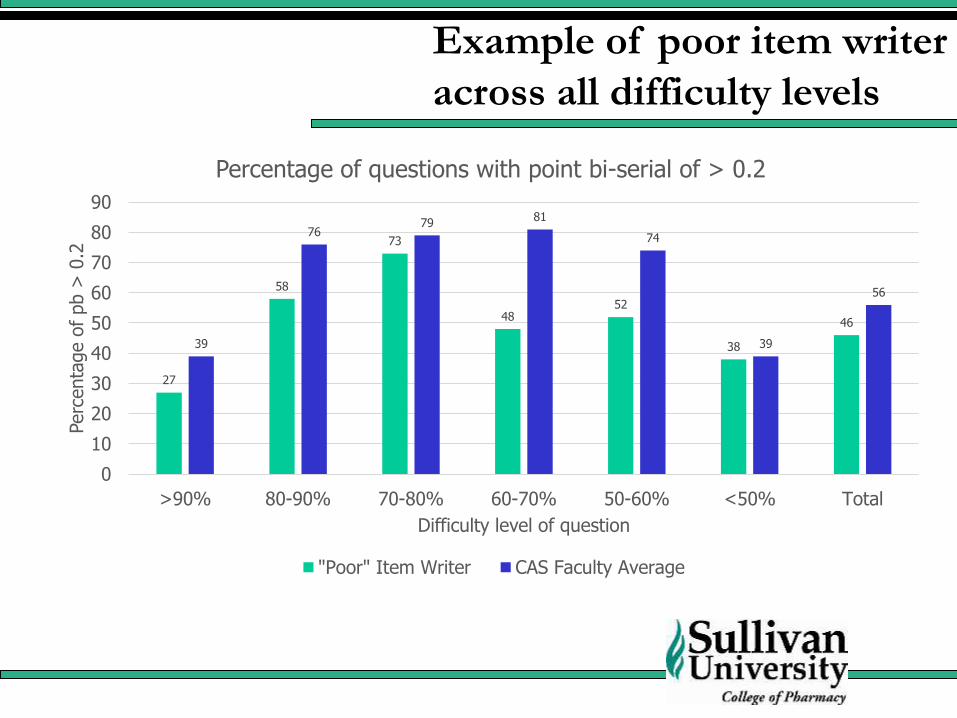
27
58
73
4852
38
46
39
7679
81
74
39
56
0
10
20
30
40
50
60
70
80
90
>90% 80-90% 70-80% 60-70% 50-60% <50% Total
Perc
enta
ge o
f pb >
0.2
Difficulty level of question
Percentage of questions with point bi-serial of > 0.2
"Poor" Item Writer CAS Faculty Average
Example of poor item writer
across all difficulty levels
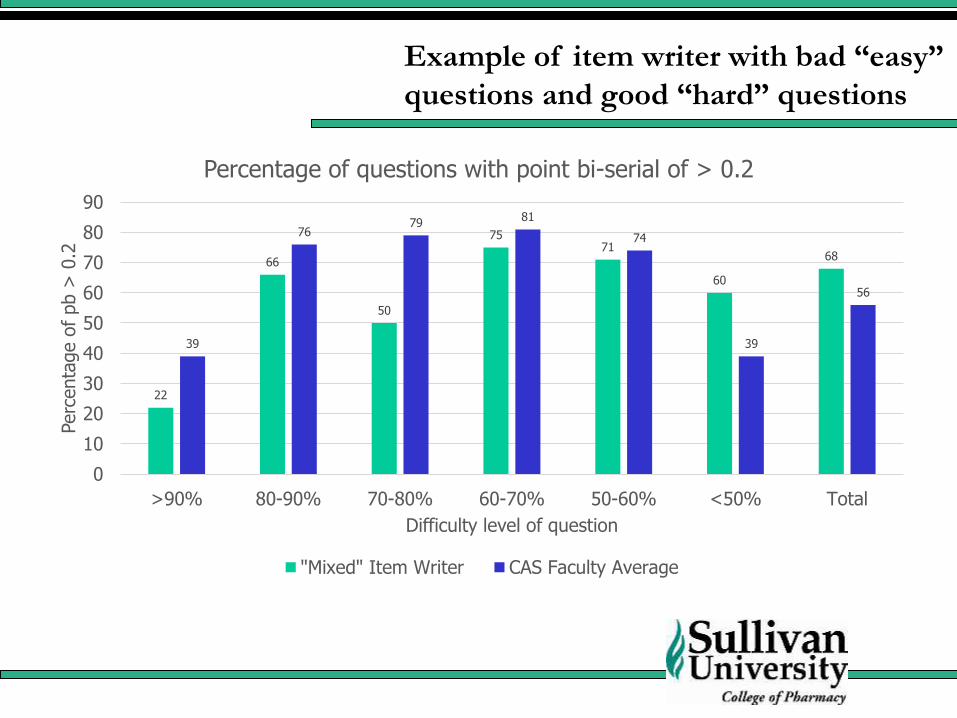
22
66
50
7571
60
68
39
7679
81
74
39
56
0
10
20
30
40
50
60
70
80
90
>90% 80-90% 70-80% 60-70% 50-60% <50% Total
Perc
enta
ge o
f pb >
0.2
Difficulty level of question
Percentage of questions with point bi-serial of > 0.2
"Mixed" Item Writer CAS Faculty Average
Example of item writer with bad “easy”
questions and good “hard” questions
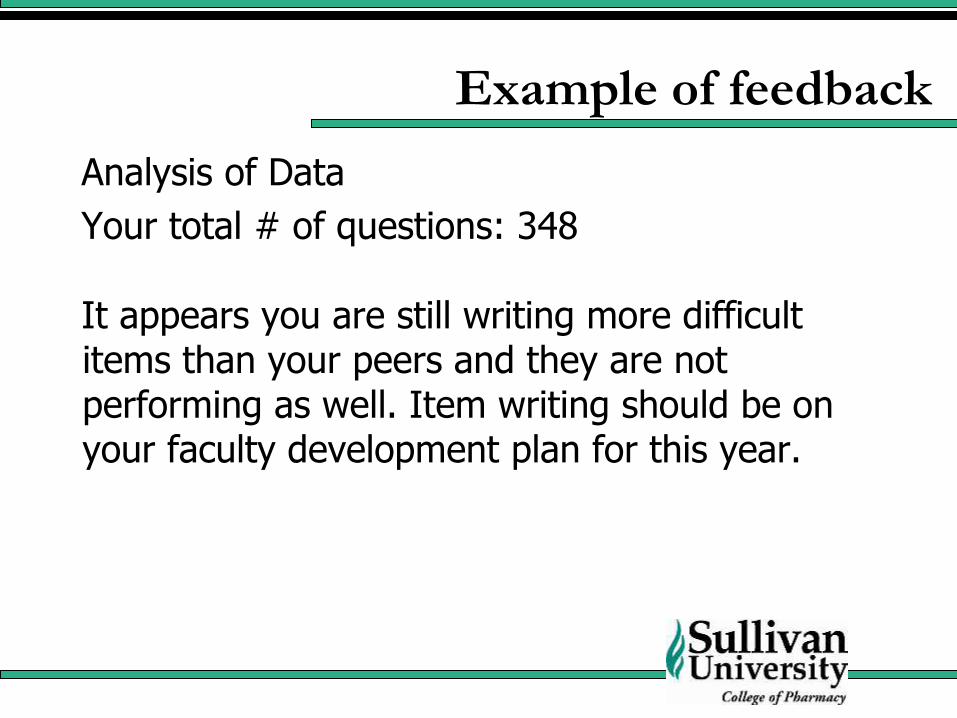
Example of feedback
Analysis of Data
Your total # of questions: 348
It appears you are still writing more difficult items than your peers and they are not performing as well. Item writing should be on your faculty development plan for this year.
HOW TO RETRIEVE DATA IN
EXAMSOFT
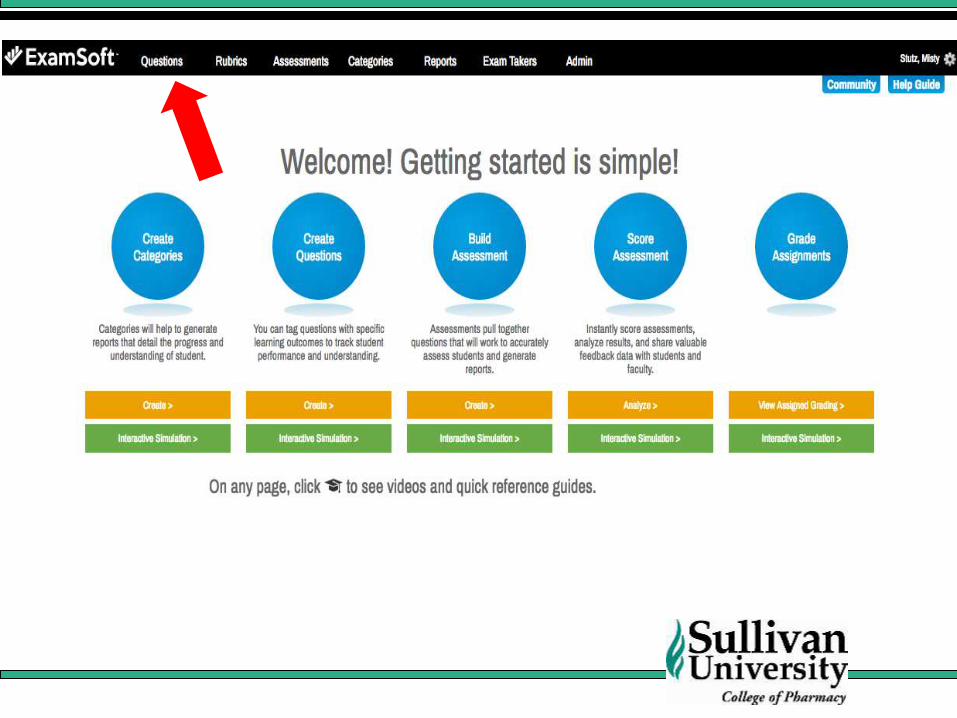
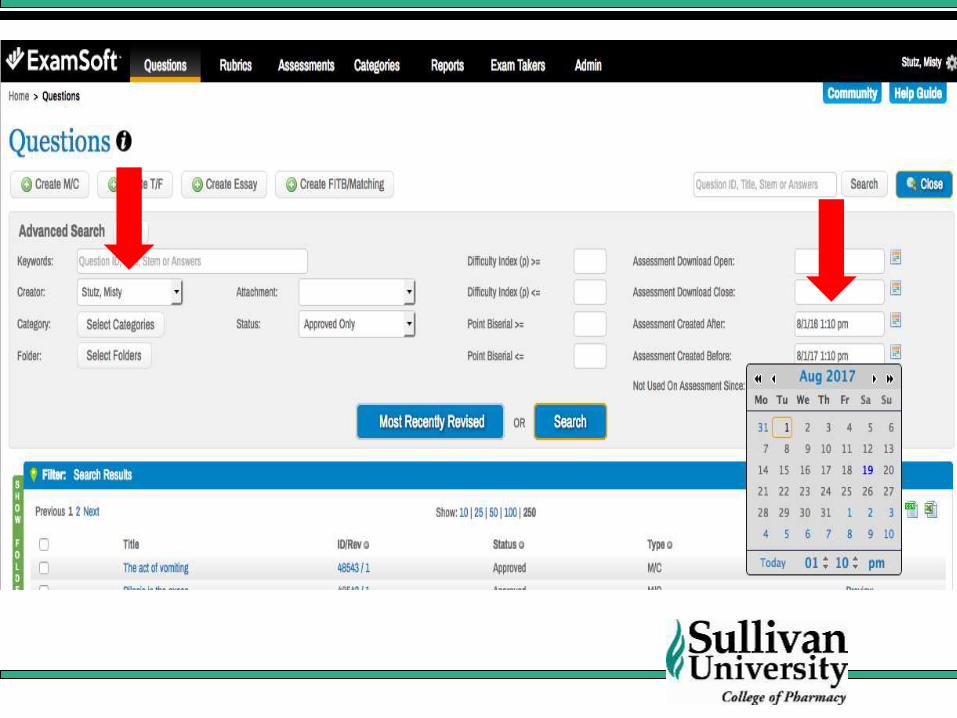

Total number of items written
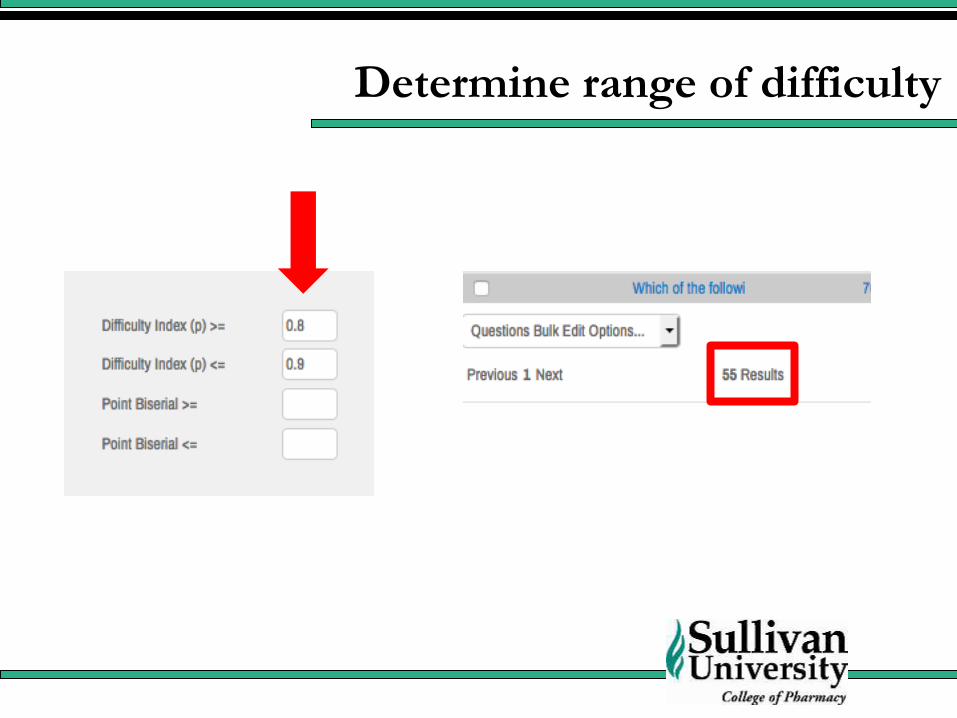
Determine range of difficulty
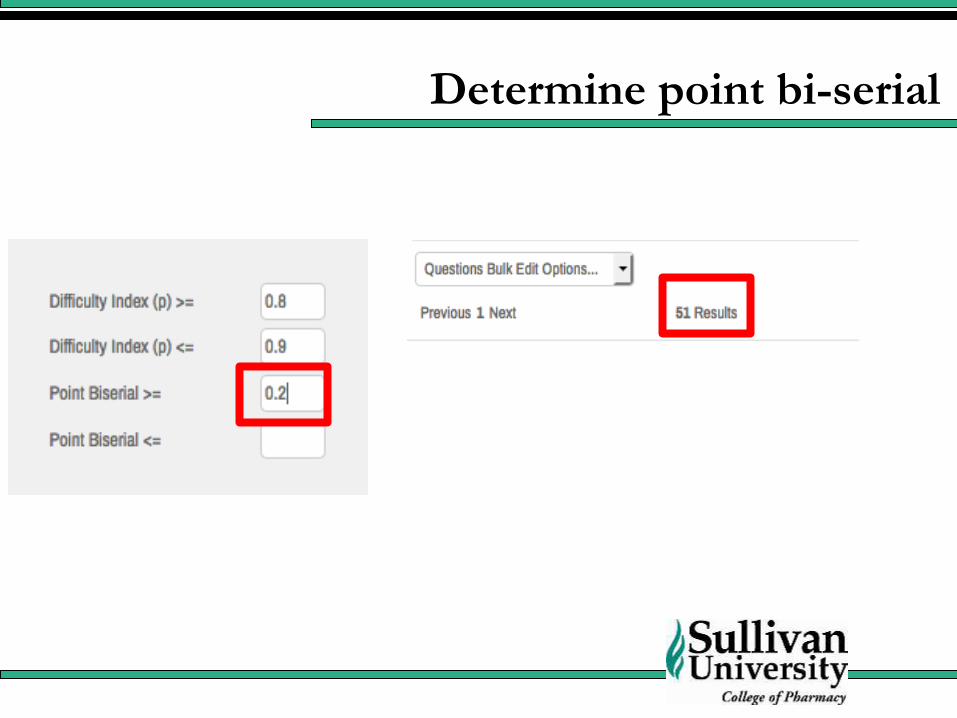
Determine point bi-serial
For this faculty
• 20% of total items range in 80-90% difficulty
• 93% of those questions are >0.2 point bi-serial

LIMITATONS
Limitations
Tag questions appropriately
Entering questions for another writer
Limited number of questions for some faculty
Items that are not analyzed. (Fill in blank, essay, etc.)
Mix of summative and formative assessments
Future Scorecards
Tie questions to Blooms Taxonomy
Faculty self-assessment to create faculty development plan

Questions