Embed Size (px)
Citation preview

Artifact Detection & Removal
What i s Ar t i fac t
Sources o f Ar t i fac t
Proper t ies o f Ar t i fac t
Problems w i th Ar t i fac t
Art i fac t Detect ion
Poss ib le Ar t i f ac t Remova l Techn iques
Some Observat ions
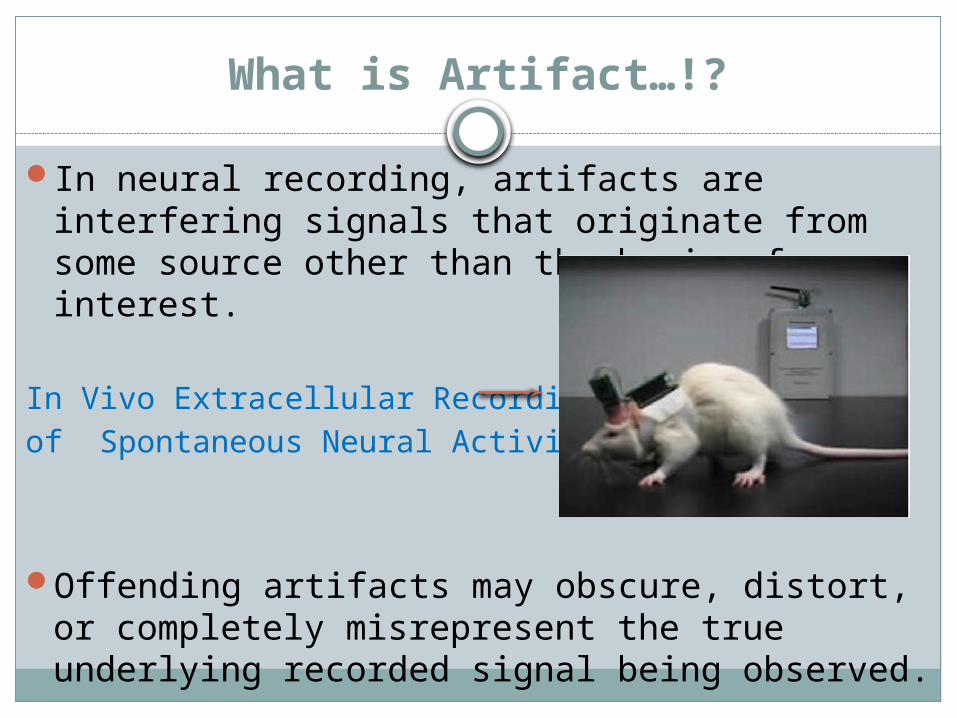
What is Artifact…!?
In neural recording, artifacts are interfering signals that originate from some source other than the brain of interest.
In Vivo Extracellular Recording of Spontaneous Neural Activity
Offending artifacts may obscure, distort, or completely misrepresent the true underlying recorded signal being observed.
Possible Artifact Sources
During in vivo extracellular neural recording, animal’s movements causes motion artifacts in the recorded neural signal.
In addition to artifacts generated by the body, many artifacts originate from outside the body. Movement by the animal, or even just settling of the electrodes, may cause electrode pops, spikes originating from a momentary change in the impedance of a given electrode.
The length of the interconnect between the high-impedance recording sites (1–3 MΩ at 1,000 Hz) and the preamplifier input is critical because it serves as an "antenna" and introduces large slow-frequency artifacts, originating from movement of the electrically charged whiskers, cable movements, fast head movement-associated "microphonia," and other environmental noise sources.
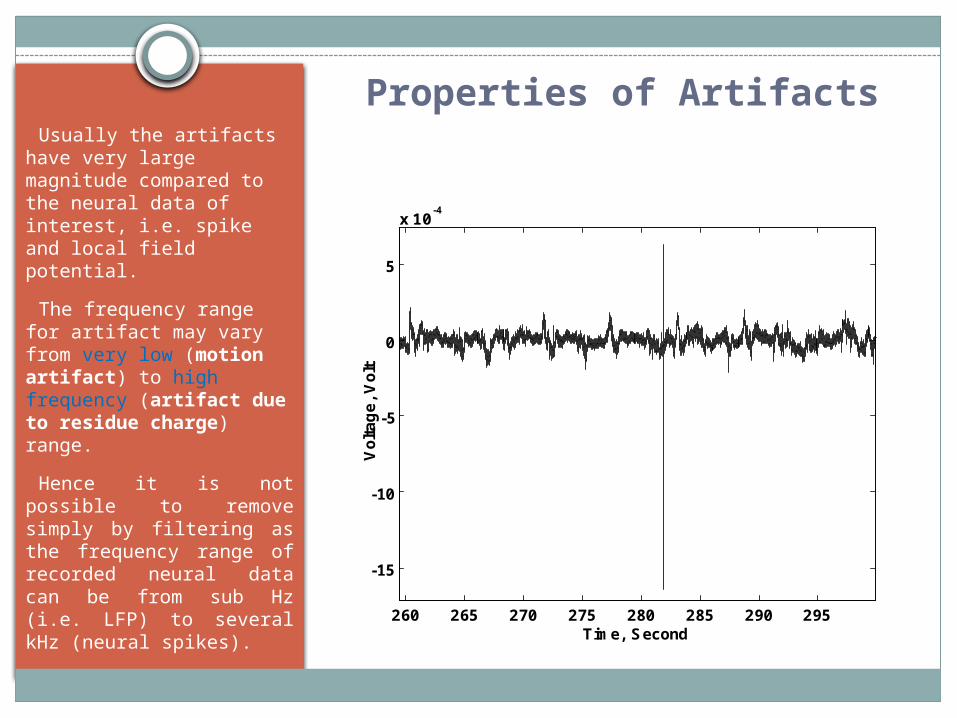
Properties of ArtifactsUsually the artifacts have very large magnitude compared to the neural data of interest, i.e. spike and local field potential.
The frequency range for artifact may vary from very low (motion artifact) to high frequency (artifact due to residue charge) range.
Hence it is not possible to remove simply by filtering as the frequency range of recorded neural data can be from sub Hz (i.e. LFP) to several kHz (neural spikes).
260 265 270 275 280 285 290 295
-15
-10
-5
0
5
x 10-4
Time, Second
Vo
lta
ge
, V
olt
Problems with Artifacts
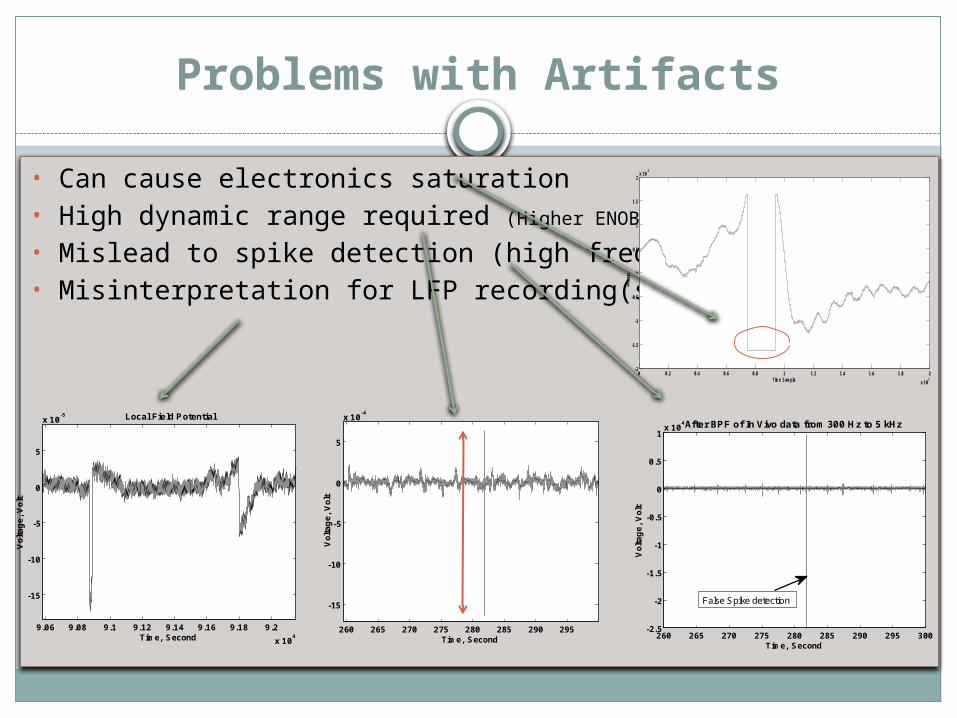
• Can cause electronics saturation• High dynamic range required (Higher ENOB in ADC)
• Mislead to spike detection (high freq)• Misinterpretation for LFP recording(slow freq)
260 265 270 275 280 285 290 295
-15
-10
-5
0
5
x 10-4
Time, Second
Vo
lta
ge
, V
olt
260 265 270 275 280 285 290 295 300-2.5
-2
-1.5
-1
-0.5
0
0.5
1x 10
4
Time, SecondV
olt
ag
e,
Vo
lt
After BPF of In Vivo data from 300 Hz to 5 kHz
False Spike detection
0 0.2 0.4 0.6 0.8 1 1.2 1.4 1.6 1.8 2
x 105
-2
-1.5
-1
-0.5
0
0.5
1
1.5
2x 10
-3
Time Sample
Volta
ge, V
9.06 9.08 9.1 9.12 9.14 9.16 9.18 9.2
x 104
-15
-10
-5
0
5
x 10-5
Time, Second
Vo
lta
ge
, V
olt
Local Field Potential
Artifact Detection
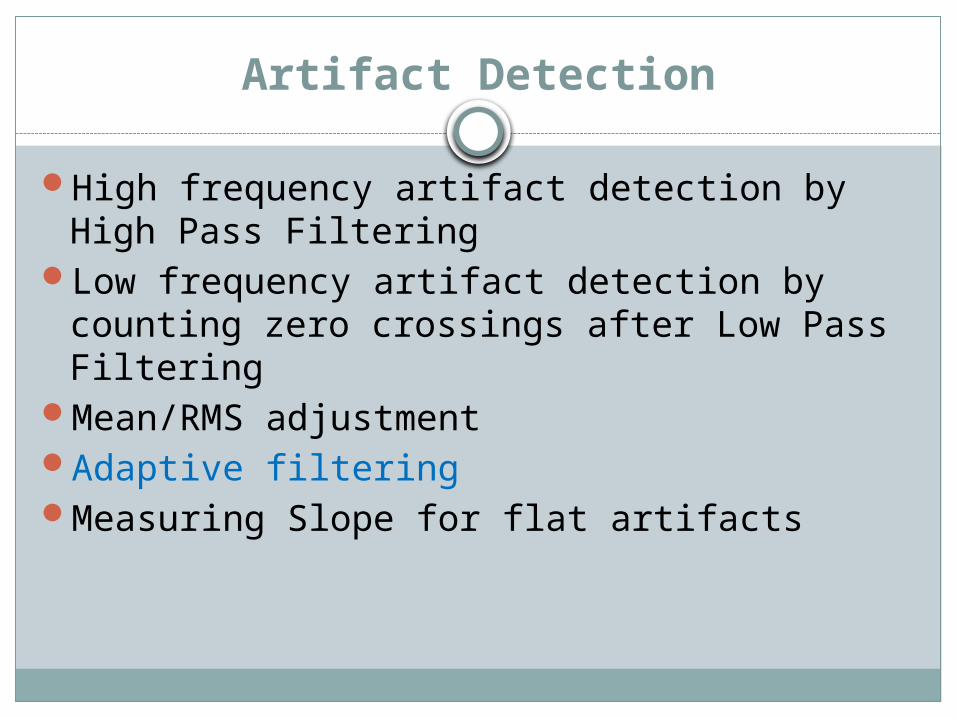
High frequency artifact detection by High Pass Filtering
Low frequency artifact detection by counting zero crossings after Low Pass Filtering
Mean/RMS adjustmentAdaptive filteringMeasuring Slope for flat artifacts
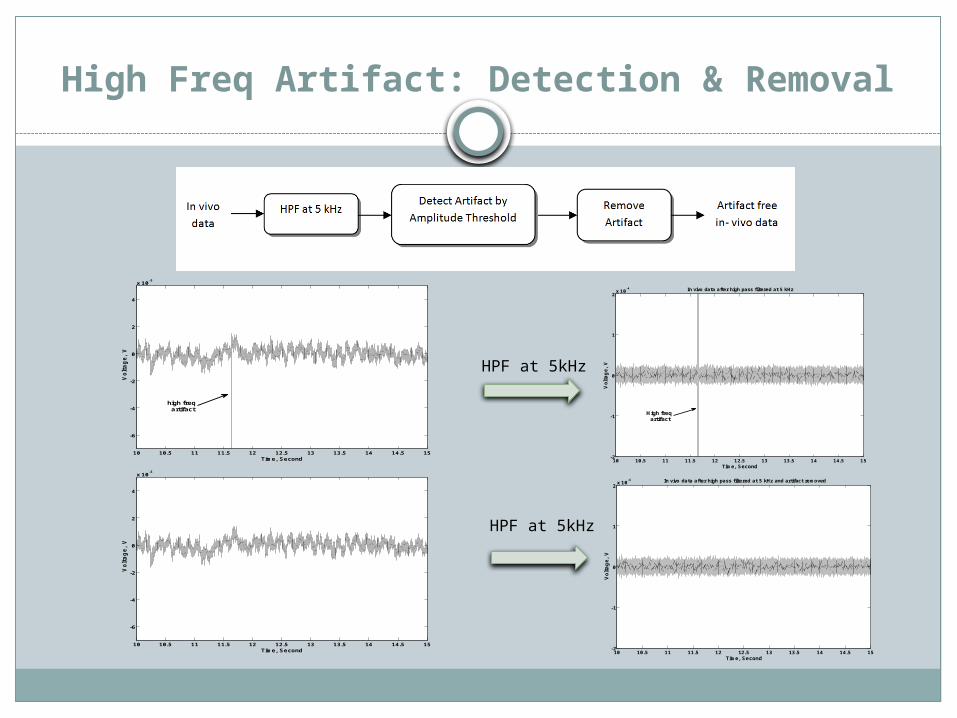
High Freq Artifact: Detection & Removal
10 10.5 11 11.5 12 12.5 13 13.5 14 14.5 15
-6
-4
-2
0
2
4
x 10-3
Time, Second
Vo
lta
ge
, V
high freq artifact
10 10.5 11 11.5 12 12.5 13 13.5 14 14.5 15
-6
-4
-2
0
2
4
x 10-3
Time, Second
Vo
lta
ge
, V
10 10.5 11 11.5 12 12.5 13 13.5 14 14.5 15-2
-1
0
1
2x 10
-4
Time, Second
Vo
lta
ge
, V
In vivo data after high pass filtered at 5 kHz
High freq artifact
10 10.5 11 11.5 12 12.5 13 13.5 14 14.5 15-2
-1
0
1
2x 10
-4
Time, Second
Vo
lta
ge
, V
In vivo data after high pass filtered at 5 kHz and artifact removed
HPF at 5kHz
HPF at 5kHz
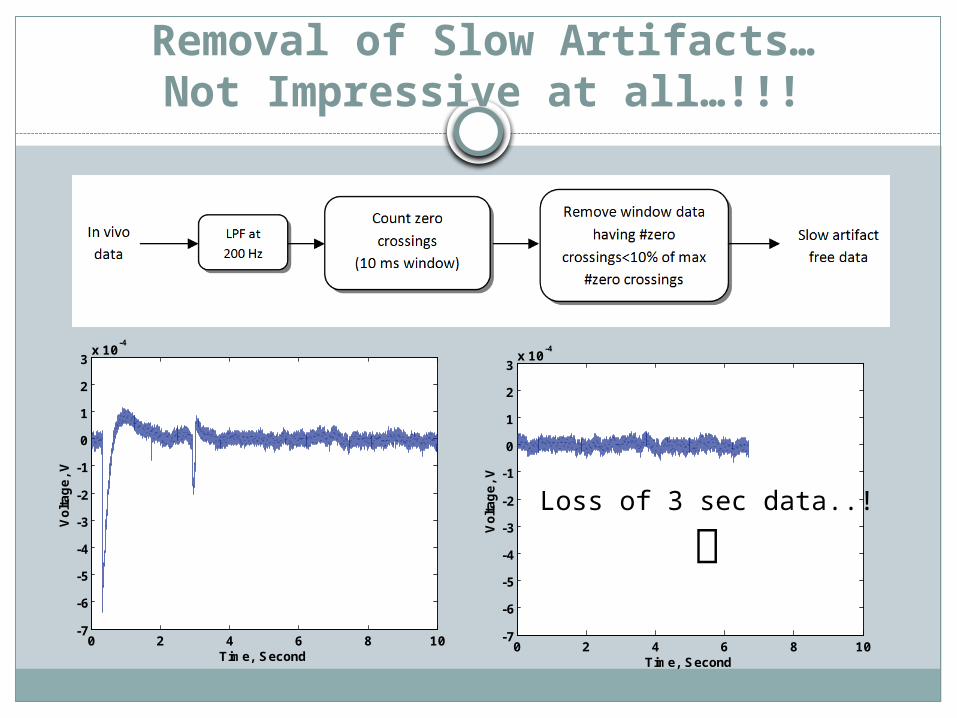
Removal of Slow Artifacts…Not Impressive at all…!!!
0 2 4 6 8 10-7
-6
-5
-4
-3
-2
-1
0
1
2
3x 10
-4
Time, Second
Vo
lta
ge
, V
0 2 4 6 8 10-7
-6
-5
-4
-3
-2
-1
0
1
2
3x 10
-4
Time, Second
Vo
lta
ge
, V
Loss of 3 sec data..!
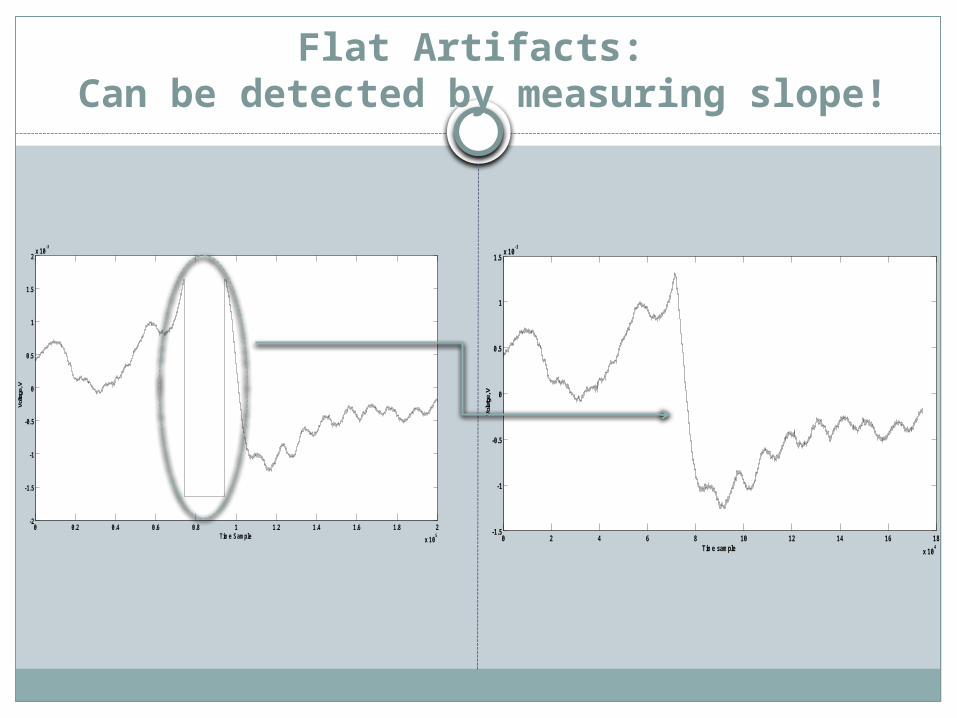
Flat Artifacts: Can be detected by measuring slope!
0 0.2 0.4 0.6 0.8 1 1.2 1.4 1.6 1.8 2
x 105
-2
-1.5
-1
-0.5
0
0.5
1
1.5
2x 10
-3
Time Sample
Volta
ge, V
0 2 4 6 8 10 12 14 16 18
x 104
-1.5
-1
-0.5
0
0.5
1
1.5x 10
-3
Time sample
Vola
tge,
V
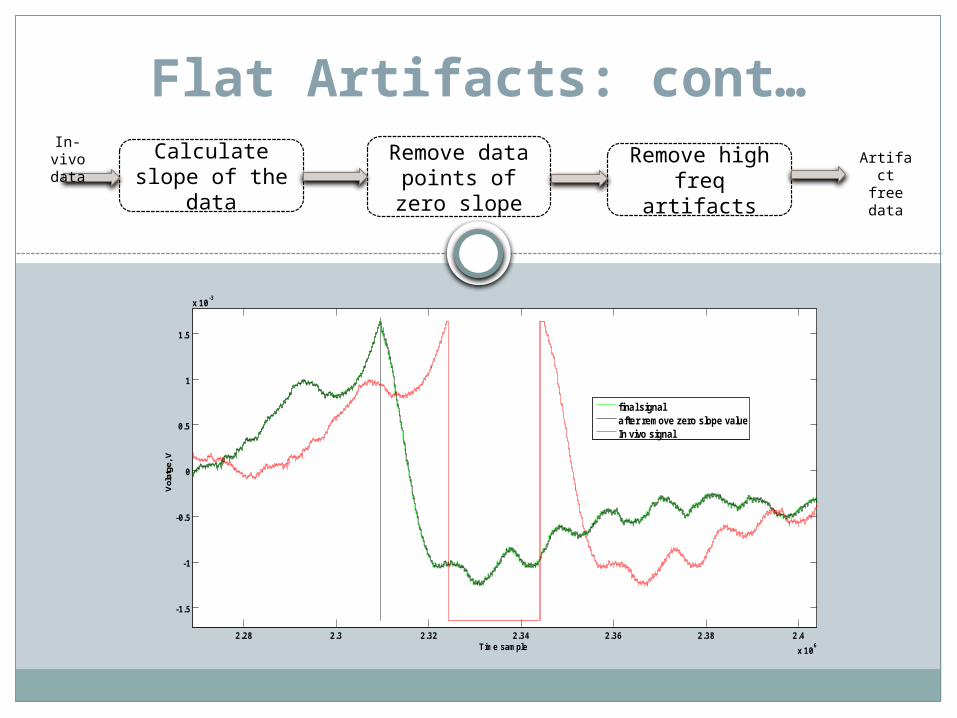
Flat Artifacts: cont…
2.28 2.3 2.32 2.34 2.36 2.38 2.4
x 106
-1.5
-1
-0.5
0
0.5
1
1.5
x 10-3
Time sample
Vol
atge
, V
final signalafter remove zero slope valueIn vivo signal
Calculate slope of the
data
Remove data points of zero
slope
Remove high freq artifacts
Artifact free data
In-vivo data
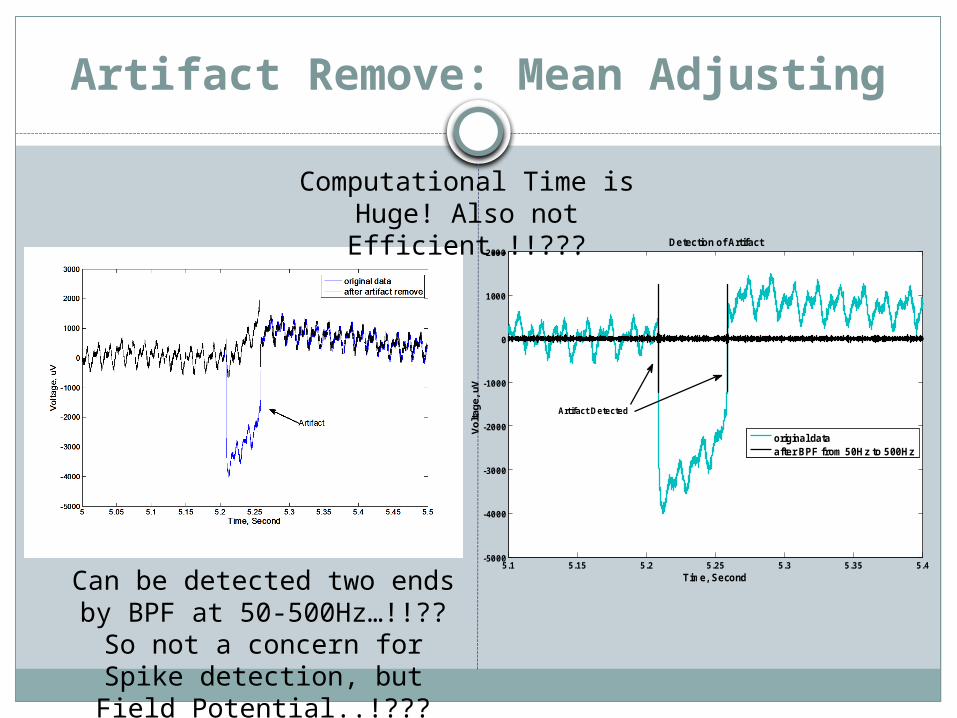
Artifact Remove: Mean Adjusting
5.1 5.15 5.2 5.25 5.3 5.35 5.4-5000
-4000
-3000
-2000
-1000
0
1000
2000
Time, Second
Vo
ltag
e, u
V
Detection of Artifact
original dataafter BPF from 50Hz to 500Hz
Artifact Detected
Computational Time is Huge! Also not Efficient…!!???
Can be detected two ends by BPF at 50-500Hz…!!?? So not a concern for Spike
detection, but Field Potential..!???
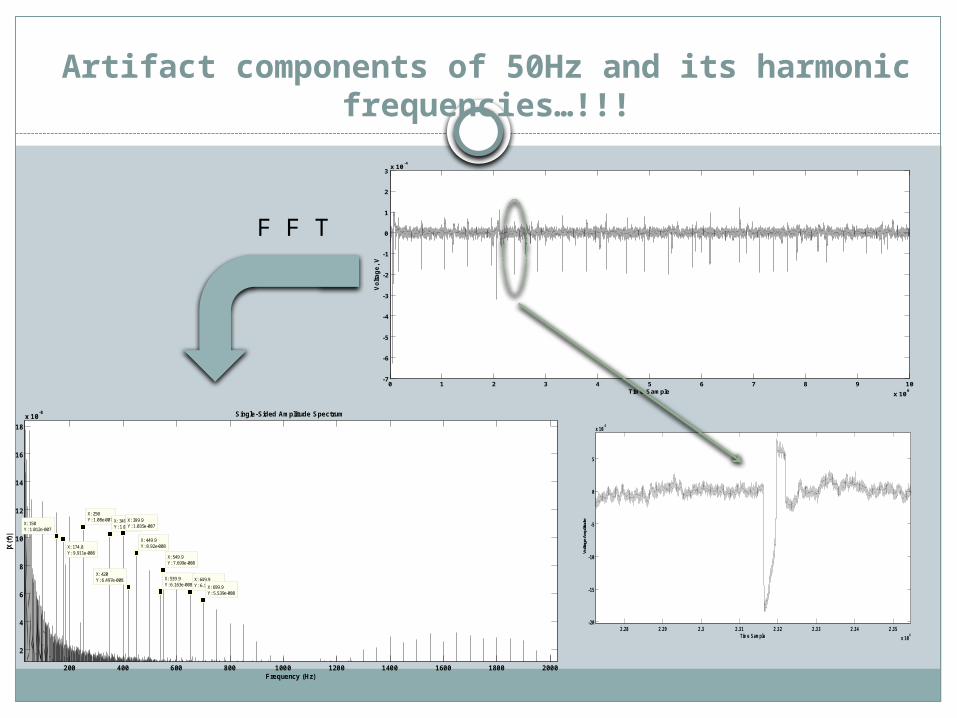
Artifact components of 50Hz and its harmonicfrequencies…!!!
0 1 2 3 4 5 6 7 8 9 10
x 106
-7
-6
-5
-4
-3
-2
-1
0
1
2
3x 10
-4
Time Sample
Vo
lta
ge
, V
200 400 600 800 1000 1200 1400 1600 1800 2000
2
4
6
8
10
12
14
16
18
x 10-8
X: 150Y: 1.012e-007
Single-Sided Amplitude Spectrum
Frequency (Hz)
|X(f
)|
X: 174.8Y: 9.911e-008
X: 250Y: 1.08e-007 X: 349.9
Y: 1.03e-007
X: 399.9Y: 1.035e-007
X: 420Y: 6.497e-008
X: 449.9Y: 8.92e-008
X: 539.9Y: 6.163e-008
X: 549.9Y: 7.699e-008
X: 649.9Y: 6.105e-008X: 699.9
Y: 5.539e-008
F F T
2.28 2.29 2.3 2.31 2.32 2.33 2.34 2.35
x 106
-20
-15
-10
-5
0
5
x 10-5
Time Sample
Volta
ge A
mpl
itude
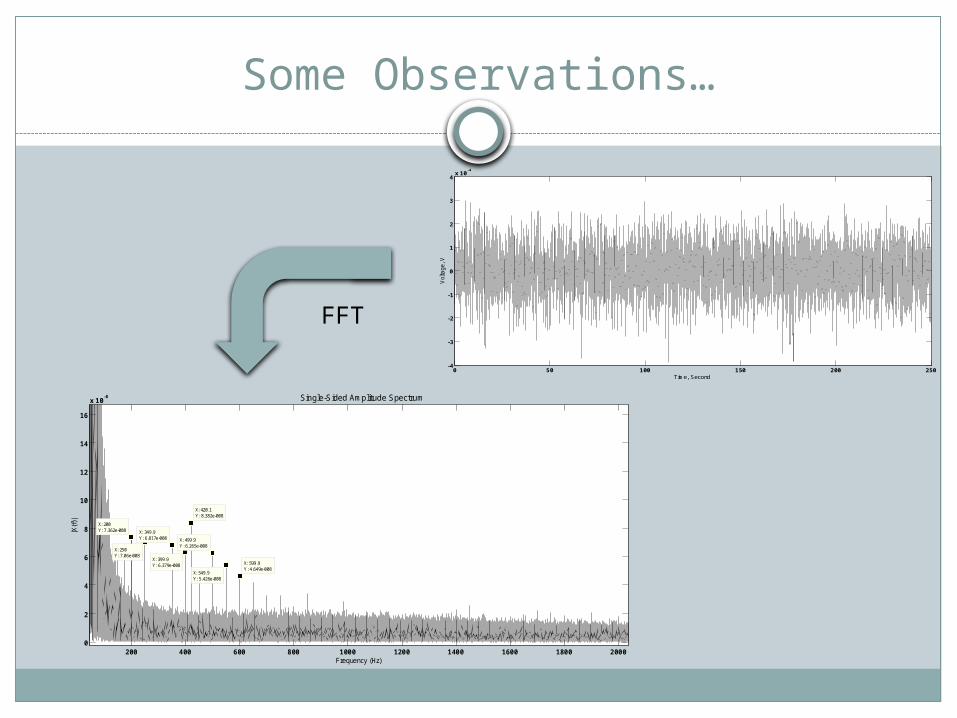
Some Observations…
0 50 100 150 200 250-4
-3
-2
-1
0
1
2
3
4x 10
-4
Time, Second
Volta
ge, V
200 400 600 800 1000 1200 1400 1600 1800 20000
2
4
6
8
10
12
14
16
x 10-8
X: 250Y: 7.06e-008
Single-Sided Amplitude Spectrum
Frequency (Hz)
|X(f
)| X: 200Y: 7.362e-008 X: 349.9
Y: 6.817e-008
X: 399.9Y: 6.379e-008
X: 499.9Y: 6.265e-008
X: 549.9Y: 5.426e-008
X: 420.1Y: 8.382e-008
X: 599.9Y: 4.649e-008
FFT
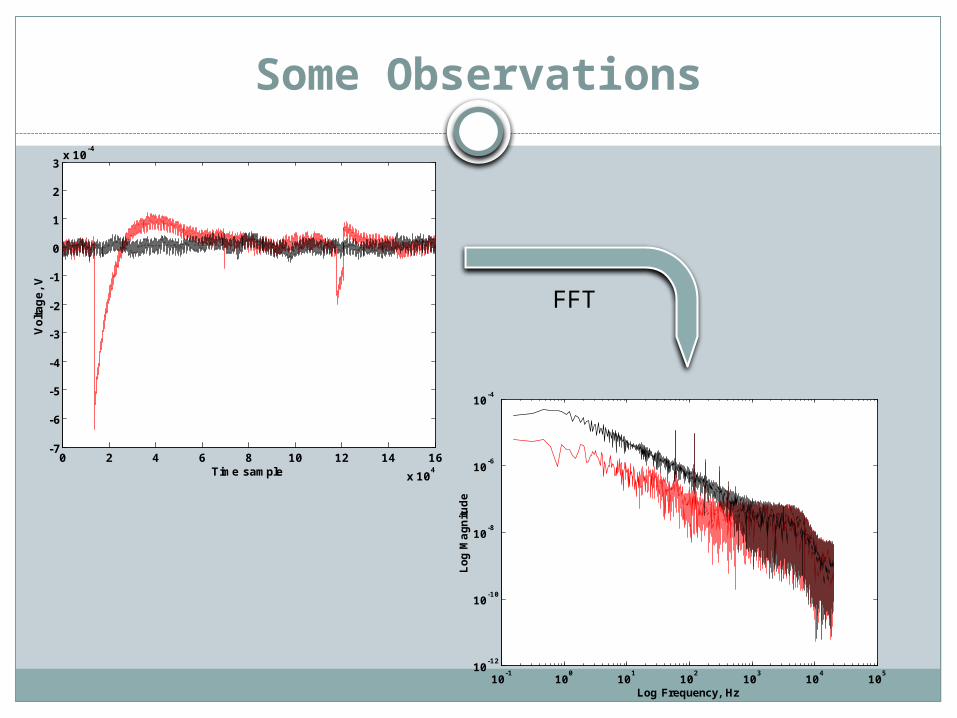
Some Observations
0 2 4 6 8 10 12 14 16
x 104
-7
-6
-5
-4
-3
-2
-1
0
1
2
3x 10
-4
Time sample
Vo
lta
ge
, V
FFT
10-1
100
101
102
103
104
105
10-12
10-10
10-8
10-6
10-4
Log Frequency, Hz
Lo
g M
ag
nitu
de
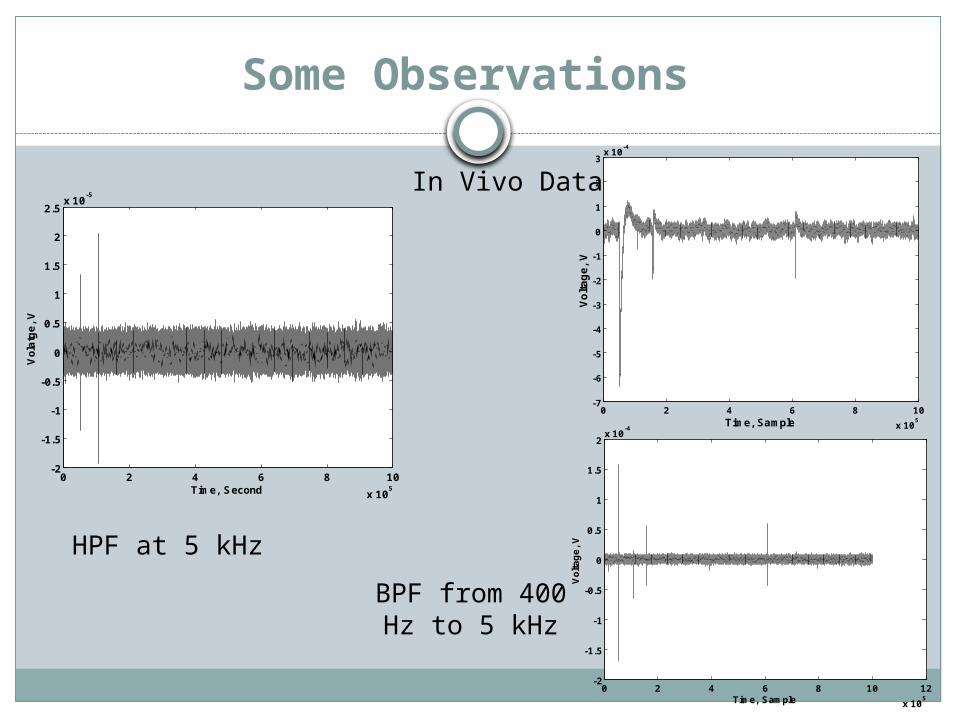
Some Observations
BPF from 400 Hz to 5 kHz
In Vivo Data
0 2 4 6 8 10
x 105
-7
-6
-5
-4
-3
-2
-1
0
1
2
3x 10
-4
Time, Sample
Vo
lta
ge
, V
0 2 4 6 8 10 12
x 105
-2
-1.5
-1
-0.5
0
0.5
1
1.5
2x 10
-4
Time, Sample
Vo
lta
ge
, V
0 2 4 6 8 10
x 105
-2
-1.5
-1
-0.5
0
0.5
1
1.5
2
2.5x 10
-5
Time, Second
Vo
latg
e,
V
HPF at 5 kHz
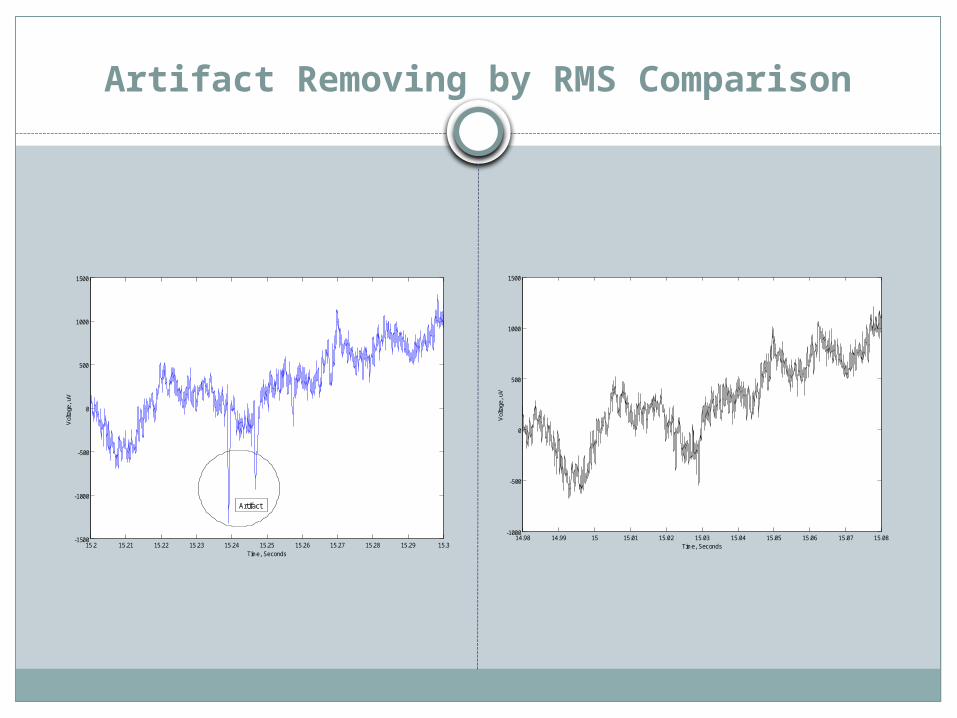
Artifact Removing by RMS Comparison
15.2 15.21 15.22 15.23 15.24 15.25 15.26 15.27 15.28 15.29 15.3-1500
-1000
-500
0
500
1000
1500
Time, Seconds
Vol
tage
, uV
Artifact
14.98 14.99 15 15.01 15.02 15.03 15.04 15.05 15.06 15.07 15.08-1000
-500
0
500
1000
1500
Time, Seconds
Vol
tage
, uV
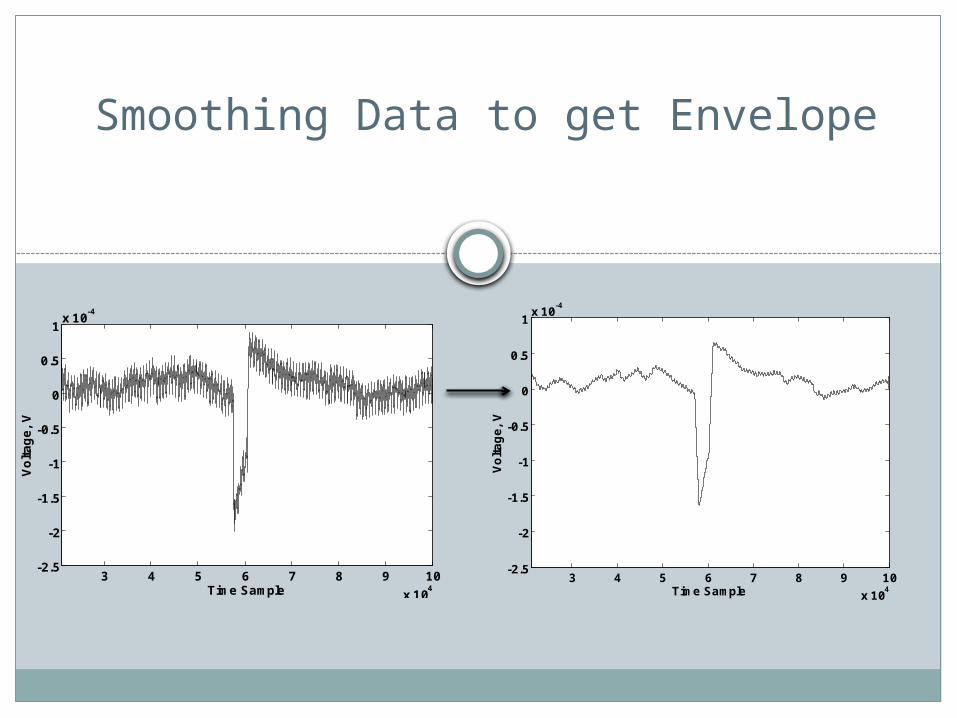
Smoothing Data to get Envelope
3 4 5 6 7 8 9 10
x 104
-2.5
-2
-1.5
-1
-0.5
0
0.5
1x 10
-4
Time Sample
Vo
lta
ge
, V
3 4 5 6 7 8 9 10
x 104
-2.5
-2
-1.5
-1
-0.5
0
0.5
1x 10
-4
Time Sample
Vo
lta
ge
, V
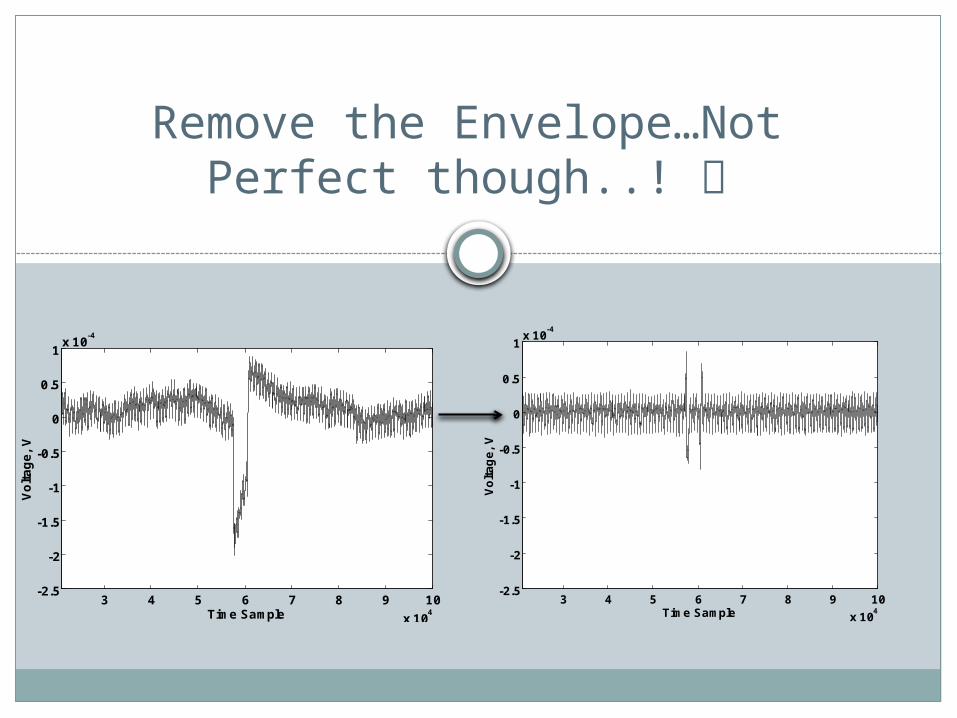
Remove the Envelope…Not Perfect though..!
3 4 5 6 7 8 9 10
x 104
-2.5
-2
-1.5
-1
-0.5
0
0.5
1x 10
-4
Time Sample
Vo
lta
ge
, V
3 4 5 6 7 8 9 10
x 104
-2.5
-2
-1.5
-1
-0.5
0
0.5
1x 10
-4
Time Sample
Vo
lta
ge
, V
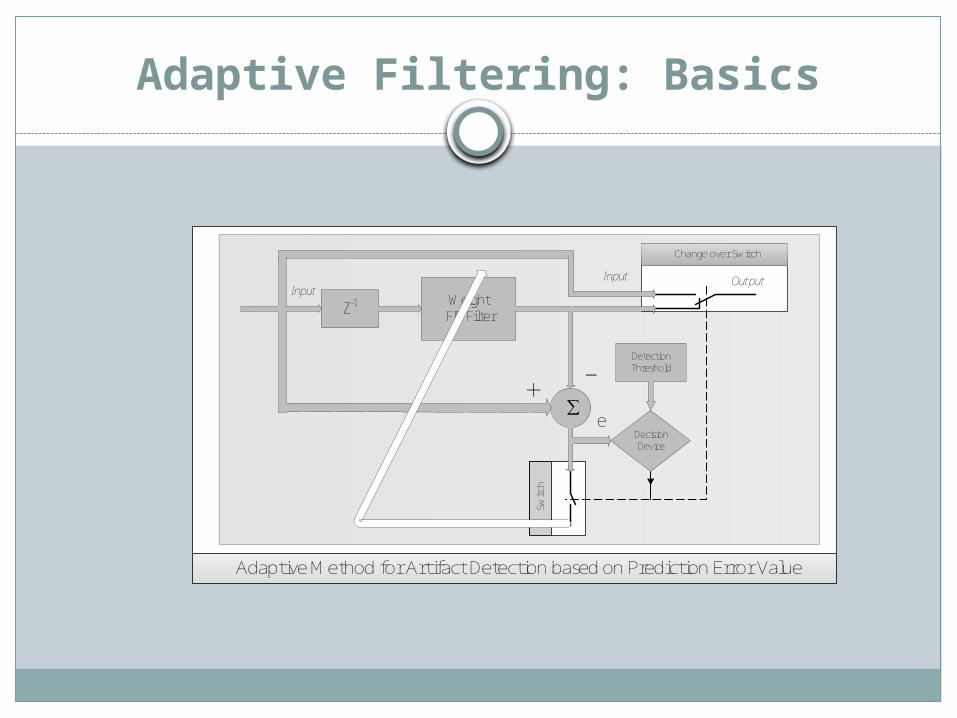
Adaptive Filtering: Basics
Adaptive Method for Artifact Detection based on Prediction Error Value
Change over Switch
Swit
ch
Z-1Input
Weight FIR Filter
∑
-
Output
+
Input
Decision Device
Detection Threshold
e
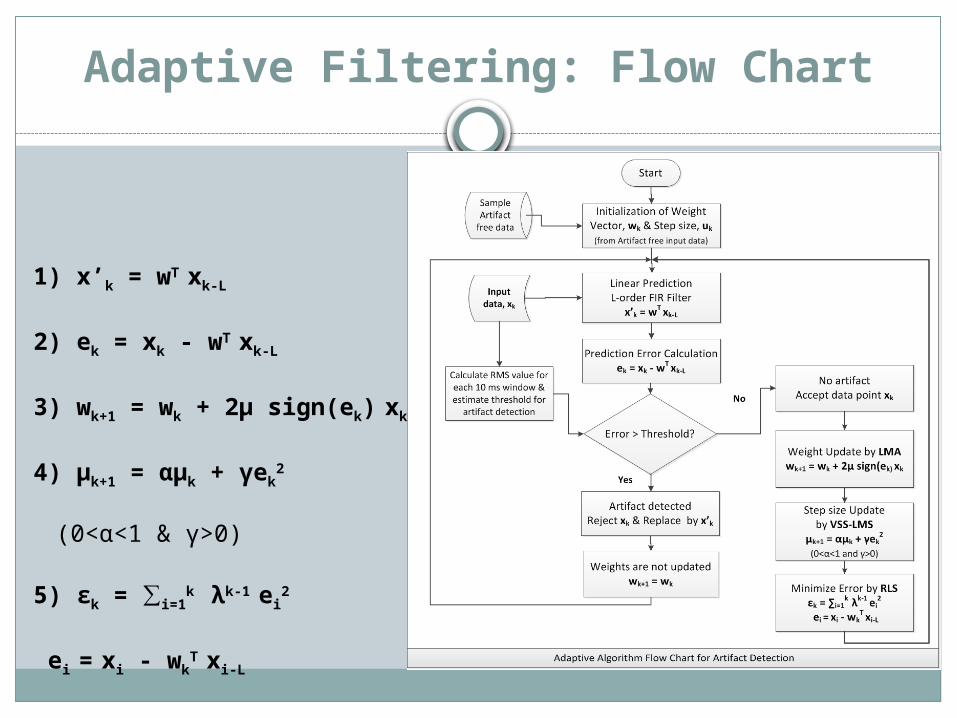
Adaptive Filtering: Flow Chart
1) x’k = wT xk-L
2) ek = xk - wT xk-L
3) wk+1 = wk + 2µ sign(ek) xk
4) µk+1 = αµk + γek2
(0<α<1 & γ>0)
5) εk = ∑i=1k λk-1 ei
2
ei = xi - wkT xi-L
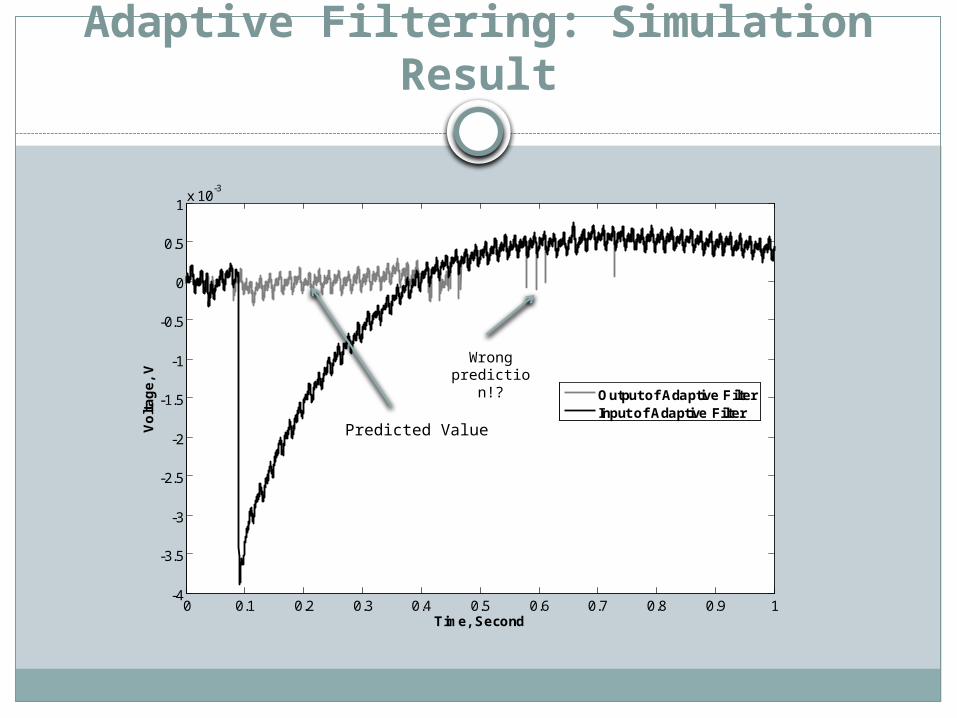
Adaptive Filtering: Simulation Result
0 0.1 0.2 0.3 0.4 0.5 0.6 0.7 0.8 0.9 1-4
-3.5
-3
-2.5
-2
-1.5
-1
-0.5
0
0.5
1x 10
-3
Time, Second
Vo
lta
ge
, V
Output of Adaptive FilterInput of Adaptive Filter
Predicted Value
Wrong prediction!
?