Embed Size (px)
Citation preview
http://www.iaeme.com/IJCIET/index.asp 17 [email protected]
International Journal of Computer Engineering & Technology (IJCET)
Volume 6, Issue 10, Oct 2015, pp. 17-33, Article ID: IJCET_06_10_003
Available online at
http://www.iaeme.com/IJCET/issues.asp?JType=IJCET&VType=6&IType=10
ISSN Print: 0976-6367 and ISSN Online: 0976–6375
© IAEME Publication
___________________________________________________________________________
A NOVEL BIO-COMPUTATIONAL MODEL
FOR MINING THE DENGUE GENE
SEQUENCES
T. Marimuthu
1Research Scholar, Manonmaniam Sundaranar University,
Tirunelveli, Tamilnadu, India
V. Balamurugan
Department of Information Technology, AMET University,
Chennai, Tamilnadu, India
ABSTRACT
The evolution of dengue viruses has a major impact on the causes of dengue
disease around the world. The analysis and interpretation of relationship among
the dengue viruses have become a tedious problem due to the lack of
computational models. Although, the biological models available like
phylogenetic analysis which reveals the association between the dengue viruses,
the computational techniques are required for further analysis such as to find the
classification of new evolutionary virus type, DNA and RNA variation, protein
structure prediction, protein-protein interaction. In this paper, we propose a bio-
computational model called ‘Sequence Miner’ to interpret the relationship among
the dengue viruses. In addition to that, the proposed model performs the
classification among the given set of gene sequences based on novel periodic
association rules and visualizing the results through the interactive tool. If the
structure of a protein is known, it would be easier for the biologist to infer the
function of the protein. However, it is still costly to decide the structure of a
protein via biological models. On the contrary, protein sequences are relatively
easy to obtain. Therefore, it is desirable that a protein’s structure can be decided
from its sequence through computational models. The accuracy of the proposed
model is 96.74 % which is calculated by giving the 10,735 varying length of the
sequences as the input, 10, 198 sequences are correctly classified.
Key words: DNA, RNA, Protein, classification, periodic association rules,
phylogenetic tree and dengue virus.
Cite this Article: Marimuthu, T.
and Balamurugan, V. A Novel Bio-
Computational Model for Mining the Dengue Gene Sequences. International
Journal of Computer Engineering and Technology, 6(10), 2015, pp. 17-33.
http://www.iaeme.com/IJCET/issues.asp?JType=IJCET&VType=6&IType=10
T. Marimuthu and V. Balamurugan
http://www.iaeme.com/IJCIET/index.asp 18 [email protected]
1. INTRODUCTION
Bioinformatics has evolved and expanded continuously over the past four decades and
has grown into a very important bridging discipline in life science research. With the
advent of high-throughput biotechnologies, biological data like DNA, RNA, and
protein data are generated faster than ever. Huge amounts of data are being produced
and collected. The biologist needs computational models to help manage and analyze
such large and complex data sets. Database and Web technologies are used to build
plenty of online data banks for data storage and sharing. Most of the data collected
have been put on the World Wide Web and can be shared and accessed online. To
know the updated numbers of complete genomes, nucleotides, and protein coding
sequences, the reader can check the Genome Reviews of EMBL-EBI
(http://www.ebi.ac.uk/GenomeReviews/stats/). The researcher is also referred to
Protein Data Bank for the number of known protein structures. As for the analysis of
the data, data mining technologies can be utilized. The mystery of life hidden in the
biological data might be decoded much faster and more accurately with the data
mining technologies. To follow the scientific output produced regarding a single
disease, such as dengue, a scientist would have to scan more than a hundred different
journals and read a few dozen papers per day. Currently different biological types of
data, such as sequences, protein structures and families, proteomics data, gene
ontologies, gene expression and other experimental data are stored in distinct
databases [1]. Existing databases or data collection can be very specialized and often
they store the information using specific data formats [11].
The challenge lies in the analysis of a huge amount of data to extract meaningful
information and use them to answer some of the fundamental biological questions. So,
there is the need to develop an interactive tool to visualize the representation of
information together with data analysis techniques to simplify the interpretation of data.
The incidence of dengue has grown dramatically around the world in recent decades.
Over 2.5 billion people, 40% of the world's population, are now at risk on account of
Dengue. World Health Organization (WHO) currently estimates that there may be 50–
100 million Dengue infections worldwide every year. As per the medical record of
Government of TamilNadu, India, 15,535 persons were affected and 96 were expired in
the year 2009. The outbreak of dengue in India in the year 2012 was the worst in the
previous six years. In the months of December 2014 and January 2015 alone, nearly 20
persons including children, expired in the Virudhunagar District of TamilNadu [9].
Under these circumstances, the work on the genome sequence of dengue virus
plays a vital role in the diagnosis of the disease. Therefore, it is necessary to predict
the presence of co-occurrence patterns which are the similar elements present in
dengue gene sequences. The dengue virus belongs to Flavi viridae family that is
transmitted to people through the bite of the mosquitoes named Aedes aegypti or
Aedes albopictus. Serotype refers to the subdivisions of a virus that are classified
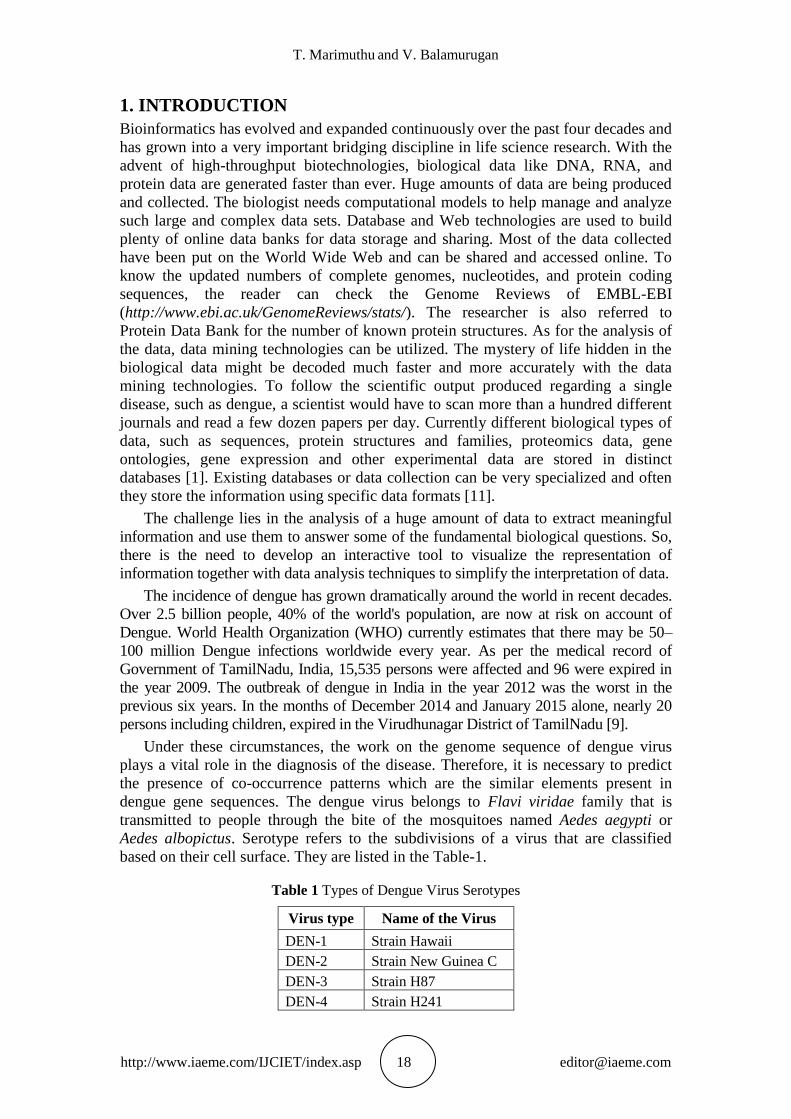
based on their cell surface. They are listed in the Table-1.
Table 1 Types of Dengue Virus Serotypes
Virus type Name of the Virus
DEN-1 Strain Hawaii
DEN-2 Strain New Guinea C
DEN-3 Strain H87
DEN-4 Strain H241
A Novel Bio-Computational Model for Mining the Dengue Gene Sequences
http://www.iaeme.com/IJCIET/index.asp 19 [email protected]
There are three main types of dengue infection viz. Classic Dengue Fever (CD),
Dengue Hemorrhagic (DH) fever and Dengue Shock Syndrome (DSS). All the types
of dengue fever begin with noticeable symptoms within four to seven days after the
Aedes aegypti mosquito’s bite. The symptoms of CD include headache, pain behind
the eyes, joints and muscles, vomiting and body rash. It also reduces the count of
White Blood Cells (WBC). DH fever includes all the classic symptoms with higher
fever and sharp decrease in the number of platelets in the blood. Platelets are small,
disk shaped fragments that are the natural source of growth factors. They are
circulated in the blood and involved in the formation of blood clots. As a result of
this, victims bleed from the nose, gums and skin. DSS is the most severe form of the
disease that causes massive bleeding and fall in the blood pressure [14]. Each virus
type has its own characteristics.
In Section 2, the work related to bio-computational tools is outlined. Section 3
demonstrates the methodologies related to the proposed sequence miner tool. Section
4 exhibits the experimental results that were obtained using dengue virus serotype
dataset. Finally, Section 5 describes conclusion.
2. RELATED WORK
Basic biological research includes a wide range of studies focused on learning how
the dengue virus is transmitted, how it infects cells and causes disease. Further many
research works investigate several aspects of dengue viral biology that includes
exploration of the interactions between the virus and humans as well as the repetition
of dengue virus serotypes. Researchers have also been studying the dengue viruses to
understand the factors that are responsible for transmitting the virus to humans. They
found that specific viral sequences are associated with other severe dengue symptoms
[5]. Therefore, the literature on dengue fever viewed as three aspects viz. biological,
computational and bio-computational. For this paper, the related work focused on bio-
computational aspect.
There are several computational biology tools that have been developed over the
last two decades. These tools are selected to cover the range of different
functionalities and features for data analysis and visualization [2]. Some of the tools
are reviewed here.
Medusa [8] is a Java application oriented and is available as an applet. It is an
open source product under the General Public License (GPL). The visualization is
based on the Fruchterman-Reingold [6] algorithm and it provides two dimensional
representations of networks of medium size for up to a few hundred nodes and edges.
It is less suited for the visualization of big datasets. Medusa uses non-directed, multi-
edge connections, which allow the simultaneous representation of more than one
connection between two bio-entities. Additional nodes can be fixed in order to
facilitate pattern recognition and the spring embedded layout algorithms help the
relaxation of the network. It supports weighted graphs and represents the significance
and importance of a connection by varying line thickness. The compatibility of
Medusa has its own text file format that is not compatible with other visualization
tools or integrated with other data sources. The input file format allows the user to
annotate each node or connection. It allows the selection and analysis of subsets of
nodes. A text search, which supports regular expressions, can be applied to find
nodes. The status of a network can be saved and reloaded at any time when Medusa is
not currently connected to any data source.
T. Marimuthu and V. Balamurugan
http://www.iaeme.com/IJCIET/index.asp 20 [email protected]
Cytoscape [13] is a standalone Java application. It is an open source project under
LesserGPL (LGPL) license. It mainly provides two dimensional representations and is
suitable for large-scale network analysis with hundredth thousands of nodes and
edges. It can support directed, undirected and weighted graphs and comes with
powerful visual styles that allow the user to change the properties of nodes or edges.
The tool provides a variety of layout algorithms including cyclic and spring-
embedded layouts. Furthermore, expression data can be mapped as node color, label,
border thickness, or border color. Cytoscape comes with various data parsers or filters
that make it compatible with other tools. The file formats that are supported to save or
load the graphs are Setup InFormation (SIF), Geography Markup Language (GML),
eXtensible Graph Markup and Modeling Language (XGMML) and Biology
PAthaway eXchange (BioPAX). It also allows the user to import messengerRNA
(mRNA) expression profiles and gene functional annotations from the Gene Ontology
(GO). Users can also directly import GO Terms and annotations from gene
association files. It is highly interactive and the user can zoom in or out and browse
the network. The status of the network as well as the edge or node properties can be
saved and reloaded. In addition, Cytoscape comes with a network manager to easily
organize multiple networks. The user can have many different panels that hold the
status of the network at different time points which makes it an efficient tool to
compare networks between each other. It also comes with efficient network filtering
capabilities. Users can select subsets of nodes and/or interactions and search for active
sub networks or pathway modules. It incorporates statistical analysis of the network
and makes it easy to cluster or detect highly interconnected regions. The main purpose
of this tool is the visualization of molecular interaction networks and their integration
with gene expression profiles and other data. It also allows the user to manipulate and
compare multiple networks. Many plug-ins created by users are available and allow
more specialized analysis of networks and molecular profiles.
Osprey [3] is a standalone application running under a wide range of platforms. It
can be licensed for non-commercial use and the source code is currently not available.
Osprey provides two dimensional representations of directed, undirected and
weighted networks. It is not efficient for large scale network analysis, various layout
options and ways to arrange nodes in various geometric distributions. The layouts
range from the relax algorithm over a simple circular layout to a more advanced dual
spiked ring layout that displays up to 1500 – 2000 nodes in a easily manageable
format. The user can change the size and the colors of most Osprey objects such as
edges, nodes, labels, and arrow heads. Data can be loaded into the tool either using
different text formats or by connecting directly to several databases, such as the
General Repository of Interaction Datasets (GRID) or BioGRID [15] database. In
addition to its own Osprey file format, the tool can also load custom gene network and
gene list formats, making Osprey compatible with other tools relying on the same file
formats. Osprey networks can be saved in Scalable Vector Graphics (SVG), Portable
Network Graphics (PNG) and Joint Photographic Experts Group (JPEG) format. The
tool provides several features for functional assessment and comparative analysis of
different networks together with network and connectivity filters and dataset
superimposing. Osprey also has the ability to cluster genes by GO Processes. Network
filters can extract biological information that is supplied to Osprey either by the user
or by instructions inside the GRID dataset. Connectivity filters identify nodes based
on their connectivity levels. Finally, Osprey includes basic functions such as selecting
and moving individual nodes or groups of nodes or removing nodes and edges. With
its various filtering capabilities, Osprey is a powerful tool for network manipulation.
A Novel Bio-Computational Model for Mining the Dengue Gene Sequences
http://www.iaeme.com/IJCIET/index.asp 21 [email protected]
The ability to incorporate new interactions into an already existing network might be
considered the tool's biggest asset.
ProViz [10] is a standalone open source application under the GPL license. It
comes with both two dimensional and pseudo- three dimensional display support to
render data. It can manipulate single graphs in large-scale dataset with millions of
nodes or connections. It generates appealing 3-Dimensional (3D) visualizations. In
addition, the tool also offers a circular and a hierarchical layout, which improve the
detection of metabolic pathways or gene regulation networks in large datasets. ProViz
is ideal to gain a first overview of networks because it allows fast navigation through
graphs. Graphs are saved and loaded in Tulip format which is a drawing package.
Networks can also be exported in PNG format. Subgraphs are produced by selection,
filtering or clustering methods and can be automatically organized into views. With
ProViz it is possible to annotate each node and each edge with comments or merge
different datasets into a single graph. Users can also enrich the networks by querying
available online databases. ProViz uses a controlled vocabulary on bio-molecules and
interactions, described in eXtensible Markup Language (XML) format. It has its
strength in the area of protein – protein interaction networks and their analysis using
arbitrary properties and taxonomic identifier. Its plug-in architecture allows a
diversification of function according to the user's needs.
Ondex [7] is a standalone freely available open source application. It provides two
dimensional representations of directed, undirected and weighted networks. It can
handle large scale networks of hundred thousands of nodes and edges. It also supports
bidirectional connections, which are represented as curves. Moreover, different types
of data are separated by placing them in different disk-circles interconnected between
each other. Data may be imported through a number of 'parsers' for public-domain
and other databases, such as TRANScription FACtor (TRANSFAC), TRANScription
PATH (TRANSPATH), CHEmical Entities of Biological Interest (CHEBI), GO, Kyto
Encyclopedia of Genes and Genomes (KEGG), Drastic, Enzyme Nomenclature,
Expert Protein Analysis System (ExPASy), Pathway Tools, Pathway Genome
DataBases (PGDBs), Plant Ontology and Medical Subject Headings Vocabulary
(MeSH). Graph objects can be exported to Cell Illustrator and XML formats. To
reload or feed into other applications graph objects may be saved as ONDEX XML or
an XGMML form. Ondex integrates various filters that selectively add or remove
connected nodes from the display according to user selectable rules of connectivity
type like distance, level or equivalence [12].
Pathway Analysis Tools for Integration and Knowledge Acquisition (PATIKA)
[4] is a web based non-open source application publicly available for non-commercial
use. It has its own license. It provides 2D representations of single or directed graphs.
There are no limitations regarding the size of the graphs. It offers a very intuitive and
widely accepted representation for cellular processes using directed graphs where
nodes correspond to molecules and edges correspond to interactions between them.
Even though the implemented variety of layout algorithms is rather limited, PATIKA
is able to support bipartite graph of states and transitions. It represents different types
of edges: product edges, where the source and target nodes of a product edge define
the transition and a product of this transition, activator edges, where the source and
target nodes of an activator edge define the activating state and the transition that is
activated by this state, inhibitor edges where the source and target nodes of an
activator edge define the inhibiting state and the transition that is inhibited by this
state and substrate edges where the target and source nodes of a substrate edge define
T. Marimuthu and V. Balamurugan
http://www.iaeme.com/IJCIET/index.asp 22 [email protected]
the transition and a substrate of this transition respectively. It integrates data from
several sources, including Entrez Gene, Universal Protein Resource (UniProt), GO,
Human Protein Reference Database (HPRD) and Reactome pathway databases. Users
can query and access data using PATIKA's web query interface, and save their results
in XML format or export them as common picture formats. BioPAX and Systems
Biology Markup Language (SBML) exporters can be used as part of Patikas Web
service. The user can connect to the server and query the database to construct the
desired pathway. Pathways are created on the fly, and drawn automatically. The user
can manipulate a pathway through operations such as add new state or remove an
existing transition, edit its contents such as the description of a state or transition or
change the graphical view of a pathway component. PATIKA is a tool for data
integration and pathway analysis. It is an integrated software environment designed to
provide researchers a complete solution for modeling and analyzing cellular
processes. It is one of the few tools that allow visualizing transitions efficiently.
Though, there are various tools available to perform the sequence analysis, the
works related to find all the periodicities are very limited. Further the existing works
concentrate mainly on sequence alignment. Therefore there is a need for holistic
approach that computes all kinds of periodicities and their associations. In the current
work, we propose a tool called ‘Sequence Miner’ to classify the given sequence and
visualize the structure of the protein.
3. METHODOLOGY
The following steps are involved in the development of the bio-computational model
named ‘Sequence Miner’ for classifying the evolution of dengue virus serotypes. The
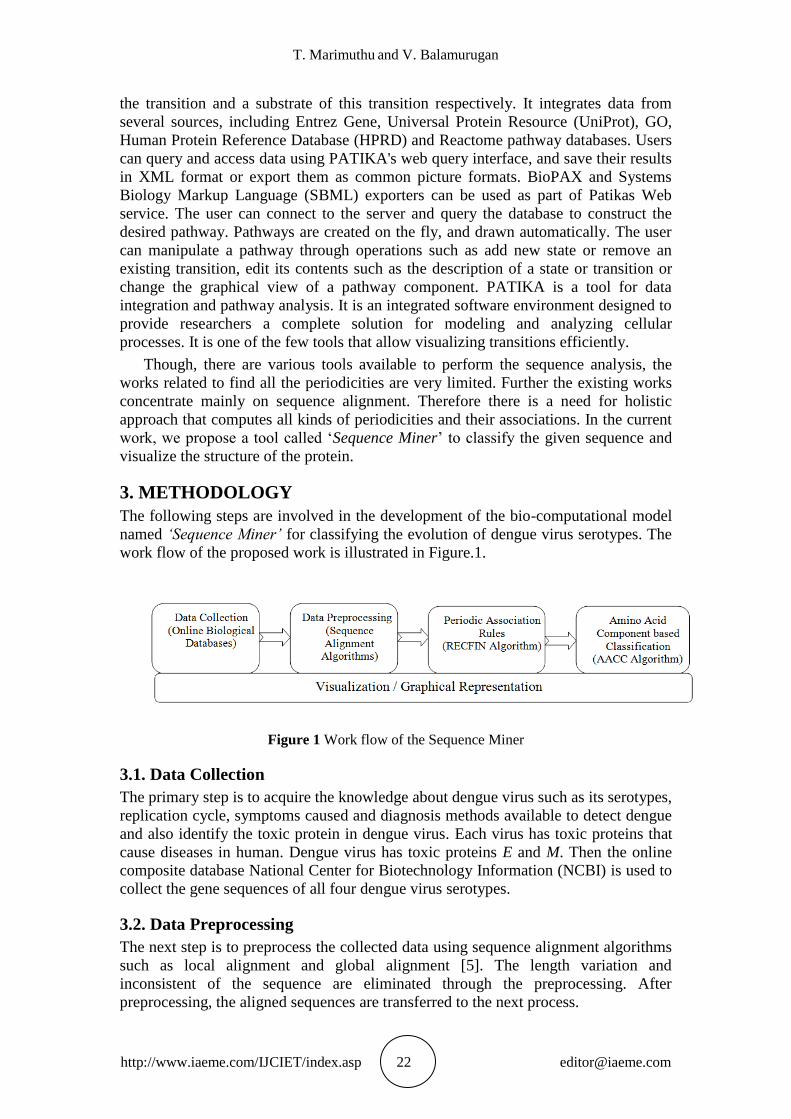
work flow of the proposed work is illustrated in Figure.1.
Figure 1 Work flow of the Sequence Miner
3.1. Data Collection
The primary step is to acquire the knowledge about dengue virus such as its serotypes,
replication cycle, symptoms caused and diagnosis methods available to detect dengue
and also identify the toxic protein in dengue virus. Each virus has toxic proteins that
cause diseases in human. Dengue virus has toxic proteins E and M. Then the online
composite database National Center for Biotechnology Information (NCBI) is used to
collect the gene sequences of all four dengue virus serotypes.
3.2. Data Preprocessing
The next step is to preprocess the collected data using sequence alignment algorithms
such as local alignment and global alignment [5]. The length variation and
inconsistent of the sequence are eliminated through the preprocessing. After
preprocessing, the aligned sequences are transferred to the next process.
A Novel Bio-Computational Model for Mining the Dengue Gene Sequences
http://www.iaeme.com/IJCIET/index.asp 23 [email protected]
3.3. Periodic Association Rules
A further step in this direction is the prediction of co-occurrence patterns among the
dengue gene sequences. This can be done by evaluating the rules that can reveal the
occurrence of an element or subsequence. Such rules are called Periodic Association
Rules, and the corresponding technique is called Periodic Association Rule Mining
(PARM). The PARM is similar to market basket analysis. In PARM terminology, the
nucleic or amino acids may be considered as items and the gene subsequences as the
baskets that contain the items. In the traditional association rules, only the number of
frequent items is calculated whereas PARM calculates the occurrence order of
frequent item sets along with its periodic position.
To obtain periodic association rule, the frequencies of nucleic or amino-acids are
computed in each dengue gene sequence. The rule can be expressed as A! C, where
A and C are the associated items. The rules state that if a nucleic acid A is present in a
given sequence with f1 periodicity then there will be another nucleic acid C that will
have similar periodicity with respect to their respective initial positions. The PARM
procedure enables to find the periodicity f1 along with their starting positions.
Let I = {i1, ...., ik} be a set of k elements, called items. Let Is = {b1, ...., bn} be a set
of n subsets of I. We call each bi as a set of transaction. In the market basket
application [6], the set I denotes the items stocked by a retail outlet and each basket bi
is the set of items of a transaction. Similarly, in case of gene sequence the set I denote
the elements of nucleic or amino acid and the basket bi is the orderly subsequences.
The order and frequency of the elements can be evaluated using the suffix tree. The
PAR is intended to capture the orderly dependence among the elements of dengue
virus dataset and the rule can be represented as i1 ! i2 along with the period and
starting position of i1 and i2, provided the following conditions hold good:
1. i1 and i2 occur at regular intervals in the sequence for at least s% of the n baskets
where s is the support and n is the number of subsequences.
2. For all the subsequences containing i1, at least c% of subsequences contains i2 where
c is the confidence.
The above definition can be extended to form multidimensional periodic
association rule such as AC ! GT, where AC and GT are element of nucleic acid
with periodic dependence. The association rules are considered interesting if they
satisfy both minimum support and confidence thresholds. The threshold values are set
by users based on their domain expertise.
To evaluate the PAR we propose the RECurrence FINder (RECFIN) algorithm.
The following steps are involved in the RECFIN algorithm:
1. Based on the occurrence positions the elements are mapped into integers.
2. Based on the support threshold the element periodicity is found. The set of elements
that satisfies the minimum support threshold is called the frequent item set.
3. The frequent item sets are used to generate association rules. For example, consider
the item set {A, C, G}. The following rules can be evaluated using the given
item set:
Rule 1: A ^ C ! G
Rule 2: C ^ G ! A
Rule 3: A ^ G ! C
T. Marimuthu and V. Balamurugan
http://www.iaeme.com/IJCIET/index.asp 24 [email protected]
Rule 4: G ^ A ! C
Rule 5: C ^ A ! G
Rule 6: G ^ C ! A
In the above rules the element that appears in left hand side is called antecedent and
that of the right hand side is called consequent. The confidence is computed using the
conditional probability of antecedent. For example, the confidence of the rule 1 is
computed as follows:
Confidence = support {A, C, G}/support{A,C}]
If the confidence is equal to or greater than a given confidence threshold, the rule is
considered as interesting rule.
4. Based on the support and confidence the PAR is generated.
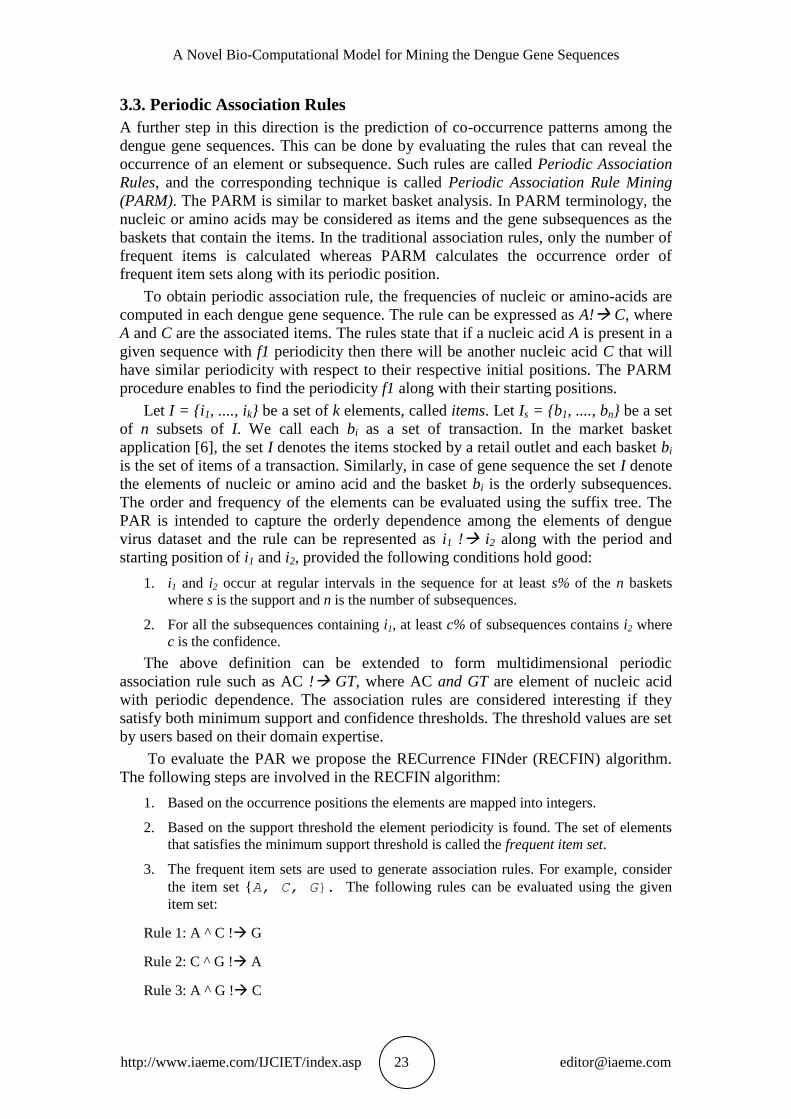
3. 4. Amino Acid Component based Classification (AACC)
The AACC algorithm is based on the ID3 classifier. Based on PAR the given
sequence may be classified into six components such as Sulfur, Aromatic, Alphatic,
Acidic, Basic and Neutral. The classifier model has two phases viz. i) model
construction ii) model usage as illustrated in Figure.2. (a) and (b)
Neutral component produces the Asparagine, Serine, Threonine and Glutamine.
Sulfur component produces the Cytosine and Methoine. Alphatic component produces
the Leucine, Isoleucine, Glycine, Valine and Alanine. The Basic component produces
the amino acids Arginine and Lysine. Acidic component produces Glutamic and
Aspartic acids. Aromatic component produces the Phenylalanine, Tryptophan and
Tyrosine.
Figure 2(a) Model Construction
A Novel Bio-Computational Model for Mining the Dengue Gene Sequences
http://www.iaeme.com/IJCIET/index.asp 25 [email protected]
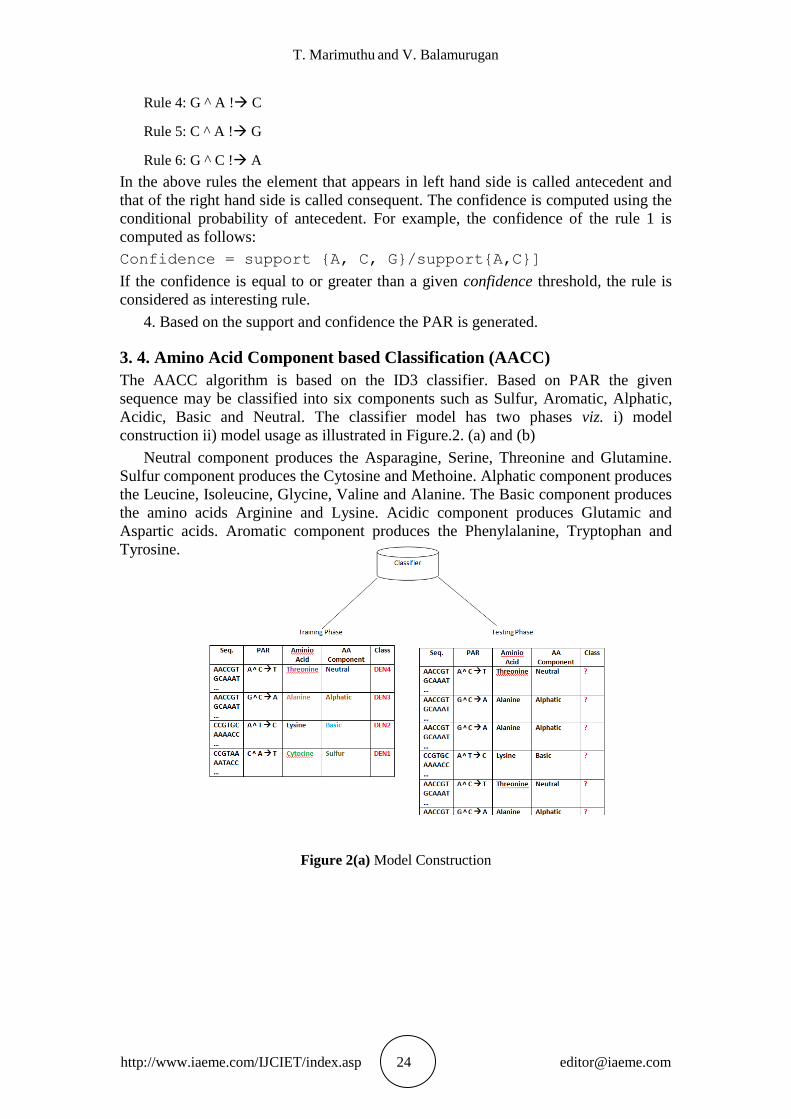
Figure 2(b) Model Usage
The classification model was trained by 10,735 sequences and the testing phase
was conducted by 10,198 sequences through this model.
Apart from these, a new dengue virus serotype was recently found by the
scientists that also creates the DH fever. DEN5 is the Non-Structural (NS) Protein
which indicates the new type of serotypes emerged from the existing serotypes.
Therefore, the proposed bio-computational model aims to predict the future evolution
of dengue virus serotype by analyzing the existing sequence of dengue virus
serotypes. Also this model is helpful to analyze the different kinds of gene sequences
like Nucleic acid (DNA, RNA) and Amino acid (Protein) sequences and visualize
them.
In fact, dengue provides to the drug designer significant difficulties that may not
be found for other virus infections like malaria, yellow fever, bird flu fever, etc. The
proposed tool aims to detect all other infections which are caused by various virus
serotypes.
3.5. Visualization / Graphical Representation
Bio-computational tools are the software programs for analyzing the biological data
and extracting the patterns from them. In addition to that tools must be user friendly,
even beginners can also be benefited by using them. The tool “Sequence Miner” will
be suitable for both the experts and the beginners to get knowledge about different
organisms via sequence analysis.
All the processes are graphically visualized in the sequence miner tool. It has the
interactive feature to classify the given sequence along with its structure. The
following are the effective features of the proposed tool: i) data collection through the
online ii) sequence alignment iii) generation of periodic association rules iv)
classification based on the amino acids and v) visualize the structure of the protein.
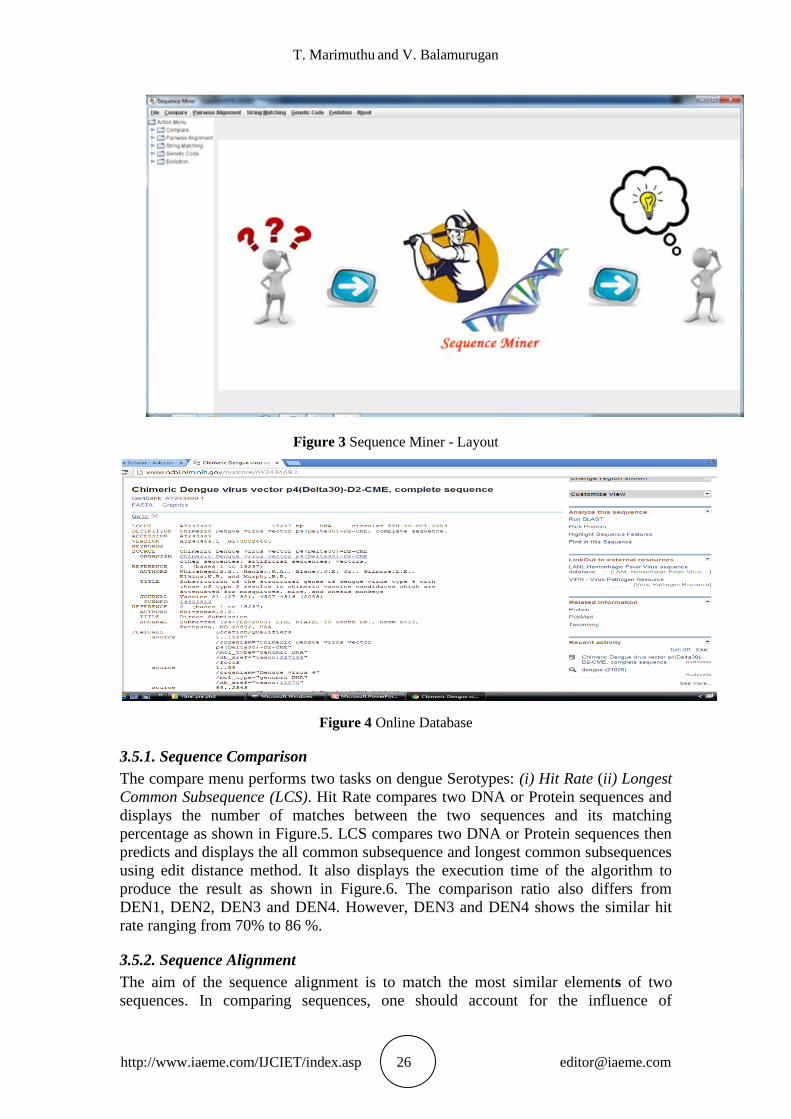
The layout of the sequence miner tool is illustrated in Figure.3.
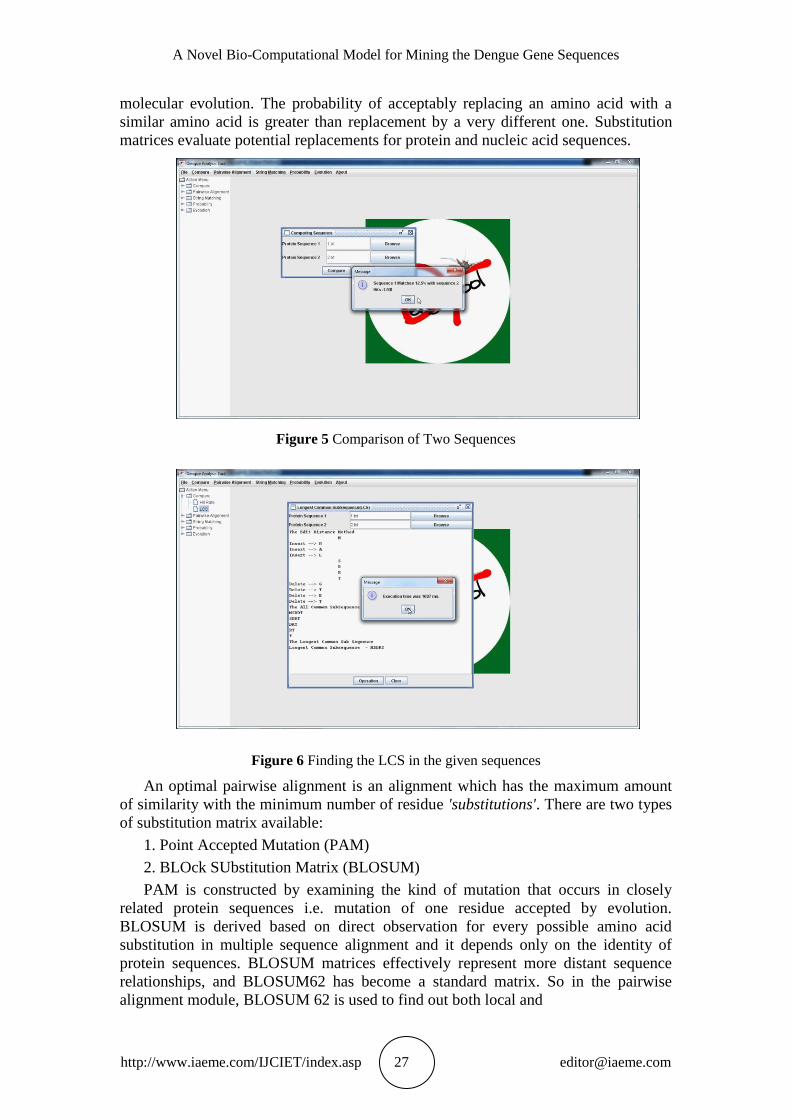
The input sequences are collected from various online data repositories such as
NCBI, GenBank and related web sites as illustrated in Figure.4. The file format of the
input sequence may be text file or access number of the whole sequence.
T. Marimuthu and V. Balamurugan
http://www.iaeme.com/IJCIET/index.asp 26 [email protected]
Figure 3 Sequence Miner - Layout
Figure 4 Online Database
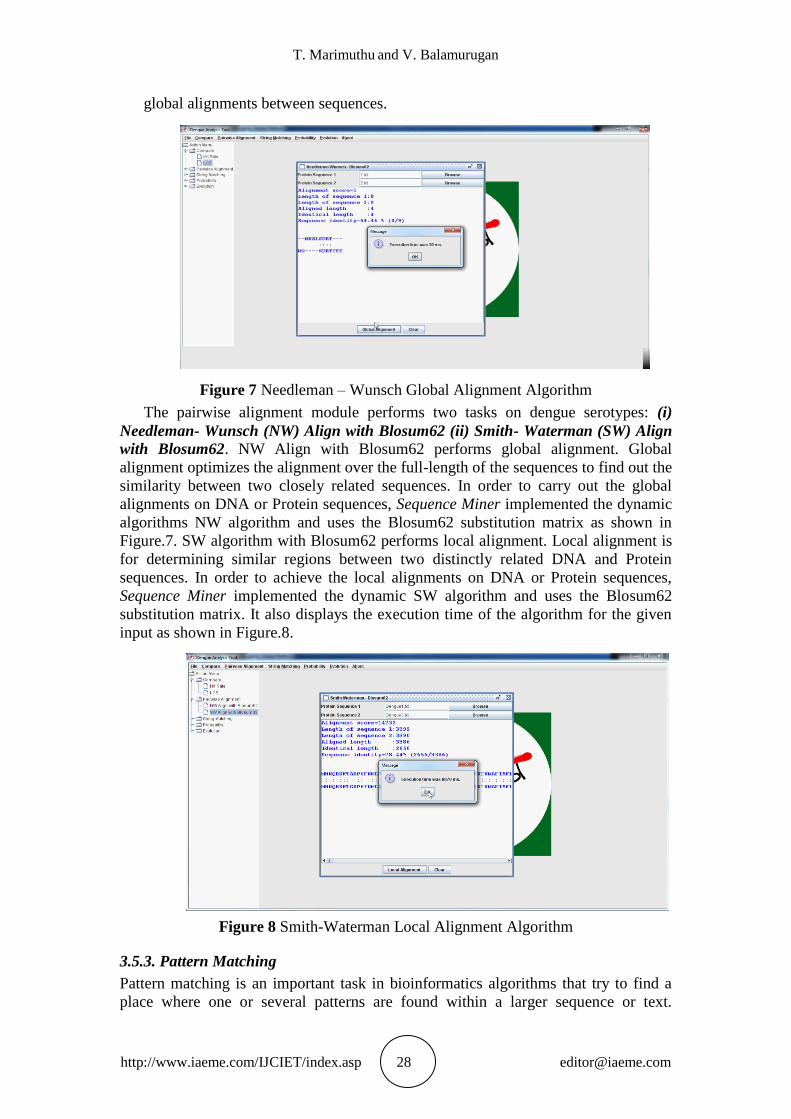
3.5.1. Sequence Comparison
The compare menu performs two tasks on dengue Serotypes: (i) Hit Rate (ii) Longest
Common Subsequence (LCS). Hit Rate compares two DNA or Protein sequences and
displays the number of matches between the two sequences and its matching
percentage as shown in Figure.5. LCS compares two DNA or Protein sequences then
predicts and displays the all common subsequence and longest common subsequences
using edit distance method. It also displays the execution time of the algorithm to
produce the result as shown in Figure.6. The comparison ratio also differs from
DEN1, DEN2, DEN3 and DEN4. However, DEN3 and DEN4 shows the similar hit
rate ranging from 70% to 86 %.
3.5.2. Sequence Alignment
The aim of the sequence alignment is to match the most similar elements of two
sequences. In comparing sequences, one should account for the influence of
A Novel Bio-Computational Model for Mining the Dengue Gene Sequences
http://www.iaeme.com/IJCIET/index.asp 27 [email protected]
molecular evolution. The probability of acceptably replacing an amino acid with a
similar amino acid is greater than replacement by a very different one. Substitution
matrices evaluate potential replacements for protein and nucleic acid sequences.
Figure 5 Comparison of Two Sequences
Figure 6 Finding the LCS in the given sequences
An optimal pairwise alignment is an alignment which has the maximum amount
of similarity with the minimum number of residue 'substitutions'. There are two types
of substitution matrix available:
1. Point Accepted Mutation (PAM)
2. BLOck SUbstitution Matrix (BLOSUM)
PAM is constructed by examining the kind of mutation that occurs in closely
related protein sequences i.e. mutation of one residue accepted by evolution.
BLOSUM is derived based on direct observation for every possible amino acid
substitution in multiple sequence alignment and it depends only on the identity of
protein sequences. BLOSUM matrices effectively represent more distant sequence
relationships, and BLOSUM62 has become a standard matrix. So in the pairwise
alignment module, BLOSUM 62 is used to find out both local and
T. Marimuthu and V. Balamurugan
http://www.iaeme.com/IJCIET/index.asp 28 [email protected]
global alignments between sequences.
Figure 7 Needleman – Wunsch Global Alignment Algorithm
The pairwise alignment module performs two tasks on dengue serotypes: (i)
Needleman- Wunsch (NW) Align with Blosum62 (ii) Smith- Waterman (SW) Align
with Blosum62. NW Align with Blosum62 performs global alignment. Global
alignment optimizes the alignment over the full-length of the sequences to find out the
similarity between two closely related sequences. In order to carry out the global
alignments on DNA or Protein sequences, Sequence Miner implemented the dynamic
algorithms NW algorithm and uses the Blosum62 substitution matrix as shown in
Figure.7. SW algorithm with Blosum62 performs local alignment. Local alignment is
for determining similar regions between two distinctly related DNA and Protein
sequences. In order to achieve the local alignments on DNA or Protein sequences,
Sequence Miner implemented the dynamic SW algorithm and uses the Blosum62
substitution matrix. It also displays the execution time of the algorithm for the given
input as shown in Figure.8.
Figure 8 Smith-Waterman Local Alignment Algorithm
3.5.3. Pattern Matching
Pattern matching is an important task in bioinformatics algorithms that try to find a
place where one or several patterns are found within a larger sequence or text.
A Novel Bio-Computational Model for Mining the Dengue Gene Sequences
http://www.iaeme.com/IJCIET/index.asp 29 [email protected]
Sequence Miner implements the Boyer Moore and Suffix tree algorithm in order to
highlight the user specified protein or nucleotide pattern in the inputted dengue
sequence. It also displays the periodical patterns along with periodic association rules
and execution time of the algorithm needed to find and highlight the searching
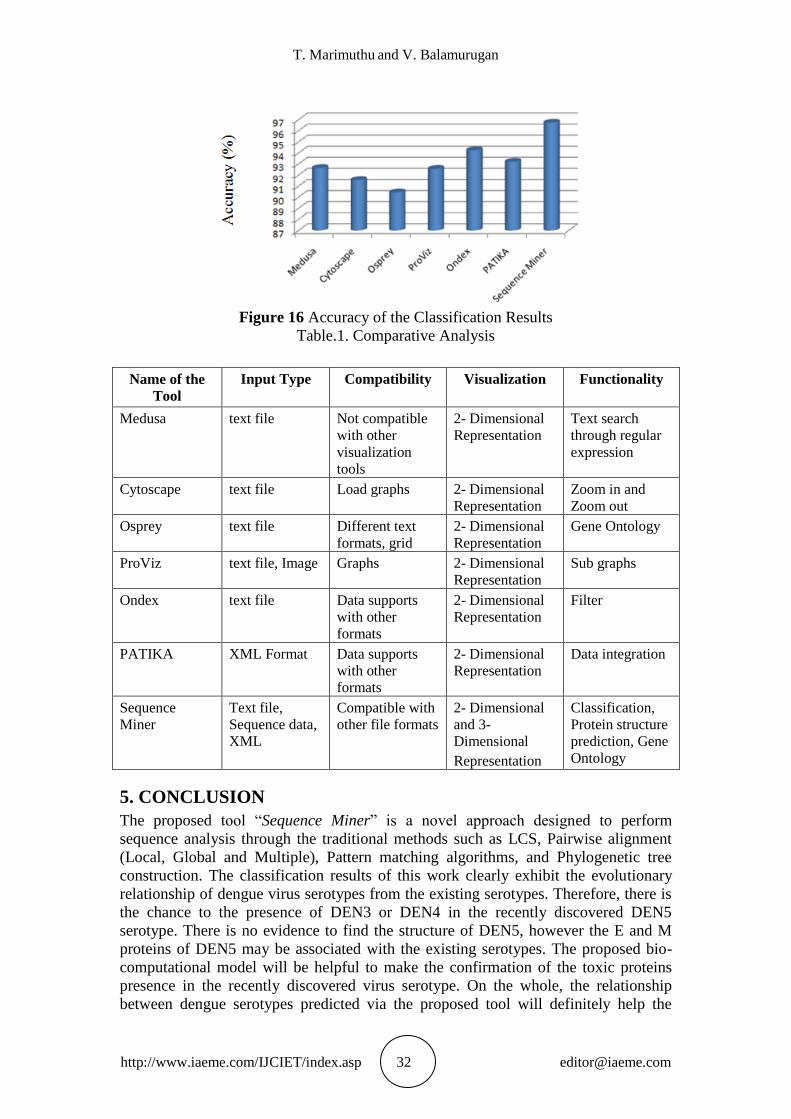
patterns as shown in Figure.9. The periodic association rules are mined with latent
periodicity that also exhibits the evolutionary relationship among DEN3 and DEN4.
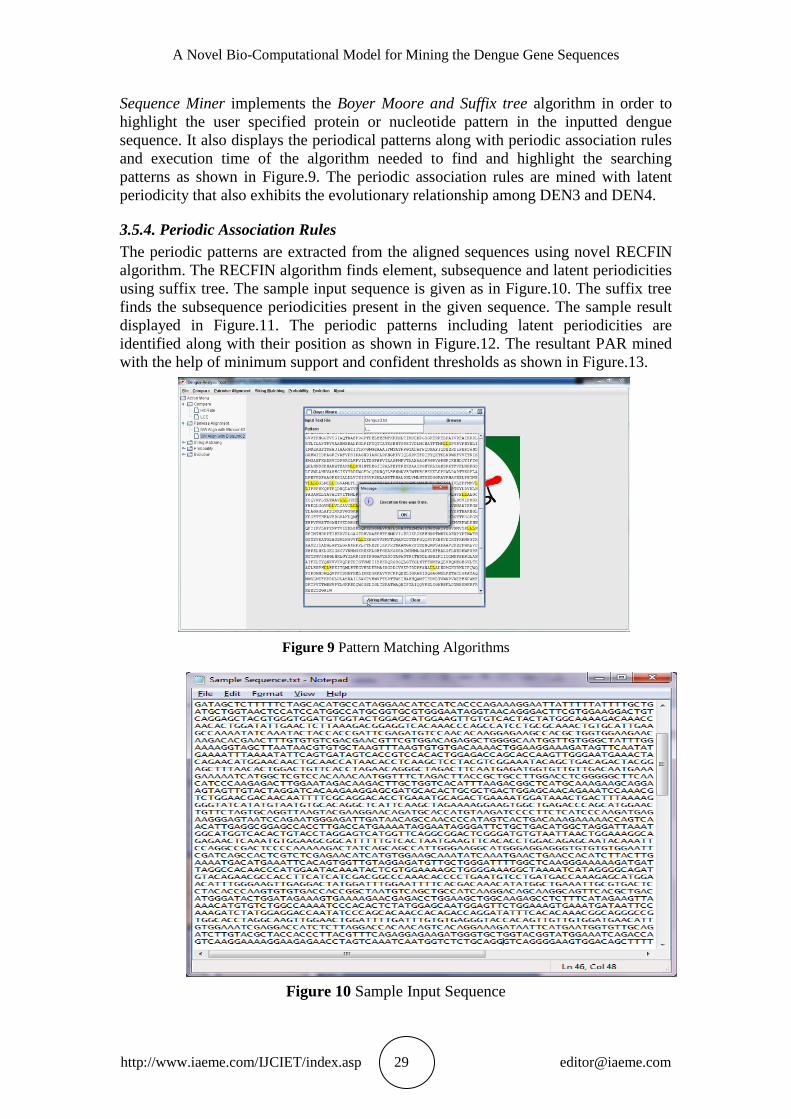
3.5.4. Periodic Association Rules
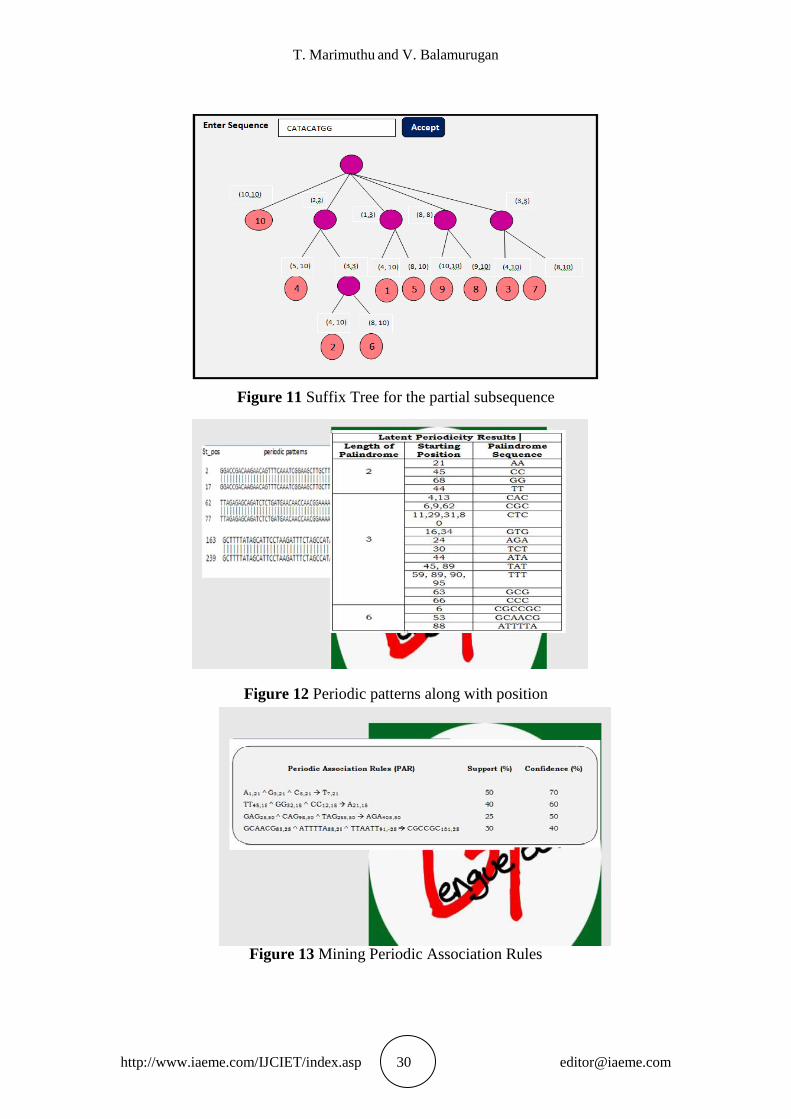
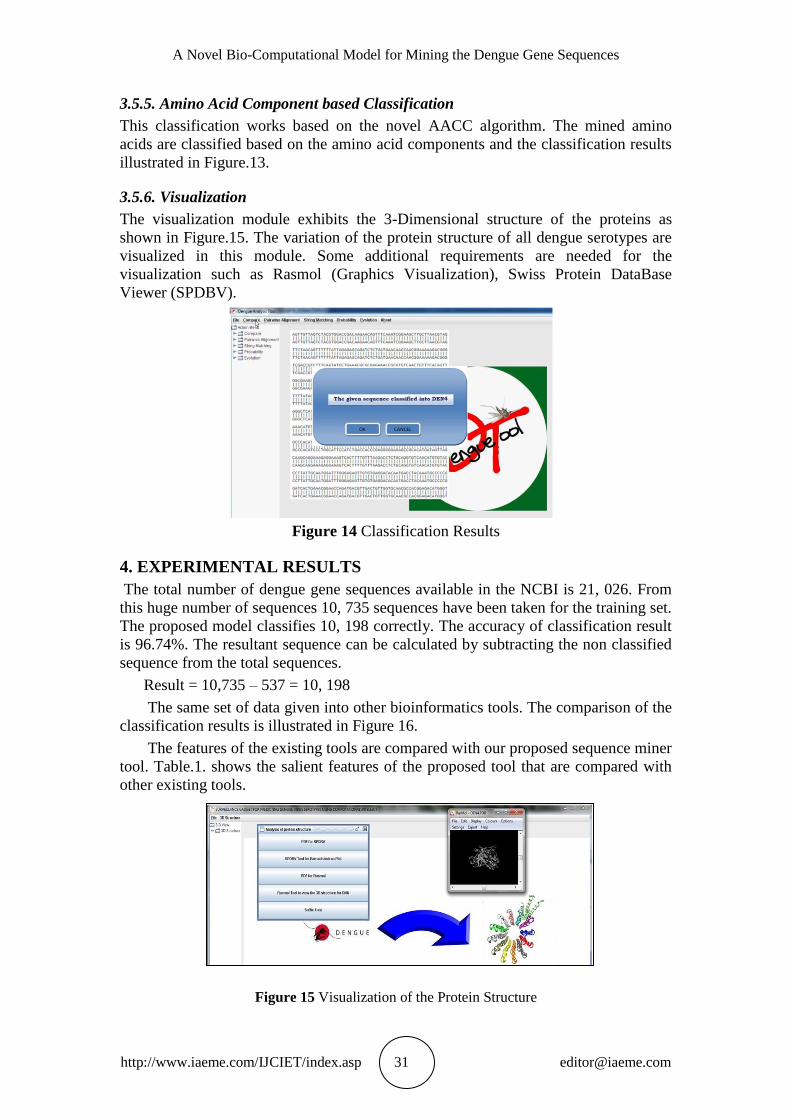
The periodic patterns are extracted from the aligned sequences using novel RECFIN
algorithm. The RECFIN algorithm finds element, subsequence and latent periodicities
using suffix tree. The sample input sequence is given as in Figure.10. The suffix tree
finds the subsequence periodicities present in the given sequence. The sample result
displayed in Figure.11. The periodic patterns including latent periodicities are
identified along with their position as shown in Figure.12. The resultant PAR mined
with the help of minimum support and confident thresholds as shown in Figure.13.
Figure 9 Pattern Matching Algorithms
Figure 10 Sample Input Sequence
T. Marimuthu and V. Balamurugan
http://www.iaeme.com/IJCIET/index.asp 30 [email protected]
Figure 11 Suffix Tree for the partial subsequence
Figure 12 Periodic patterns along with position
Figure 13 Mining Periodic Association Rules
A Novel Bio-Computational Model for Mining the Dengue Gene Sequences
http://www.iaeme.com/IJCIET/index.asp 31 [email protected]
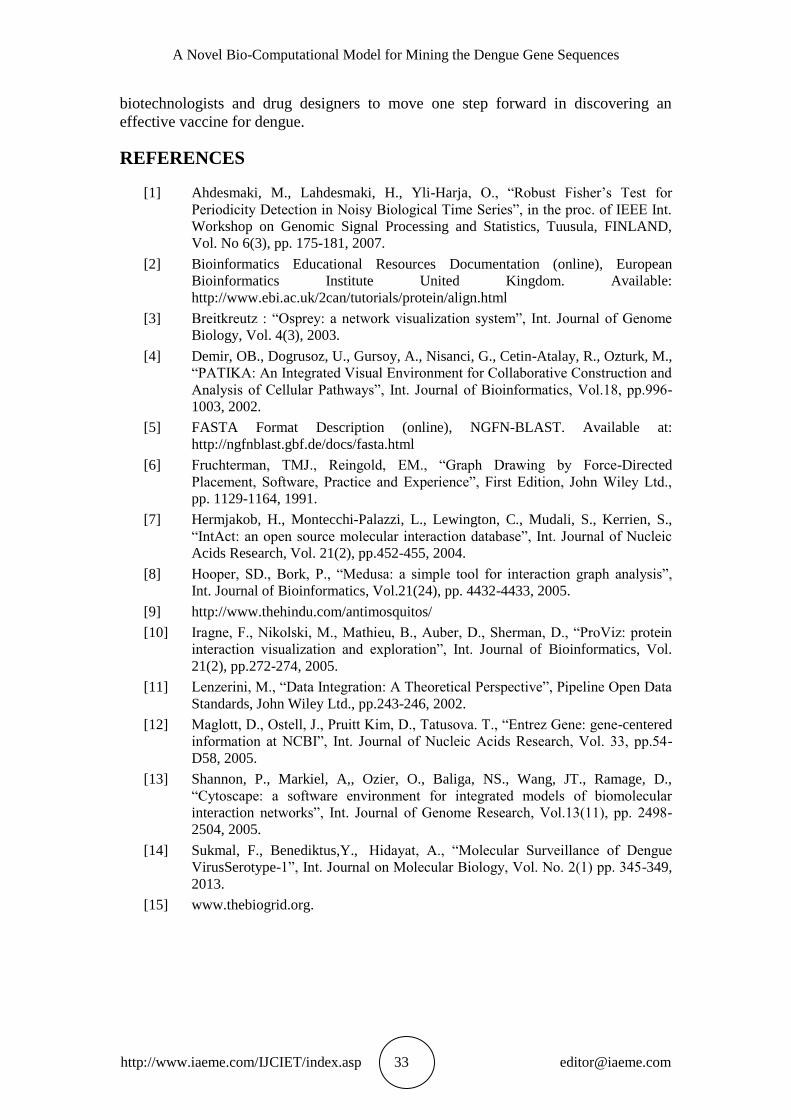
3.5.5. Amino Acid Component based Classification
This classification works based on the novel AACC algorithm. The mined amino
acids are classified based on the amino acid components and the classification results
illustrated in Figure.13.
3.5.6. Visualization
The visualization module exhibits the 3-Dimensional structure of the proteins as
shown in Figure.15. The variation of the protein structure of all dengue serotypes are
visualized in this module. Some additional requirements are needed for the
visualization such as Rasmol (Graphics Visualization), Swiss Protein DataBase
Viewer (SPDBV).
Figure 14 Classification Results
4. EXPERIMENTAL RESULTS
The total number of dengue gene sequences available in the NCBI is 21, 026. From
this huge number of sequences 10, 735 sequences have been taken for the training set.
The proposed model classifies 10, 198 correctly. The accuracy of classification result
is 96.74%. The resultant sequence can be calculated by subtracting the non classified
sequence from the total sequences.
Result = 10,735 – 537 = 10, 198
The same set of data given into other bioinformatics tools. The comparison of the
classification results is illustrated in Figure 16.
The features of the existing tools are compared with our proposed sequence miner
tool. Table.1. shows the salient features of the proposed tool that are compared with
other existing tools.
Figure 15 Visualization of the Protein Structure
T. Marimuthu and V. Balamurugan
http://www.iaeme.com/IJCIET/index.asp 32 [email protected]
Figure 16 Accuracy of the Classification Results
Table.1. Comparative Analysis
Name of the
Tool
Input Type Compatibility Visualization Functionality
Medusa text file Not compatible
with other
visualization
tools
2- Dimensional
Representation
Text search
through regular
expression
Cytoscape text file Load graphs 2- Dimensional
Representation
Zoom in and
Zoom out
Osprey text file Different text
formats, grid
2- Dimensional
Representation
Gene Ontology
ProViz text file, Image Graphs 2- Dimensional
Representation
Sub graphs
Ondex text file Data supports
with other
formats
2- Dimensional
Representation
Filter
PATIKA XML Format Data supports
with other
formats
2- Dimensional
Representation
Data integration
Sequence
Miner
Text file,
Sequence data,
XML
Compatible with
other file formats
2- Dimensional
and 3-
Dimensional
Representation
Classification,
Protein structure
prediction, Gene
Ontology
5. CONCLUSION
The proposed tool “Sequence Miner” is a novel approach designed to perform
sequence analysis through the traditional methods such as LCS, Pairwise alignment
(Local, Global and Multiple), Pattern matching algorithms, and Phylogenetic tree
construction. The classification results of this work clearly exhibit the evolutionary
relationship of dengue virus serotypes from the existing serotypes. Therefore, there is
the chance to the presence of DEN3 or DEN4 in the recently discovered DEN5
serotype. There is no evidence to find the structure of DEN5, however the E and M
proteins of DEN5 may be associated with the existing serotypes. The proposed bio-
computational model will be helpful to make the confirmation of the toxic proteins
presence in the recently discovered virus serotype. On the whole, the relationship
between dengue serotypes predicted via the proposed tool will definitely help the
A Novel Bio-Computational Model for Mining the Dengue Gene Sequences
http://www.iaeme.com/IJCIET/index.asp 33 [email protected]
biotechnologists and drug designers to move one step forward in discovering an
effective vaccine for dengue.
REFERENCES
[1] Ahdesmaki, M., Lahdesmaki, H., Yli-Harja, O., “Robust Fisher’s Test for
Periodicity Detection in Noisy Biological Time Series”, in the proc. of IEEE Int.
Workshop on Genomic Signal Processing and Statistics, Tuusula, FINLAND,
Vol. No 6(3), pp. 175-181, 2007.
[2] Bioinformatics Educational Resources Documentation (online), European
Bioinformatics Institute United Kingdom. Available:
http://www.ebi.ac.uk/2can/tutorials/protein/align.html
[3] Breitkreutz : “Osprey: a network visualization system”, Int. Journal of Genome
Biology, Vol. 4(3), 2003.
[4] Demir, OB., Dogrusoz, U., Gursoy, A., Nisanci, G., Cetin-Atalay, R., Ozturk, M.,
“PATIKA: An Integrated Visual Environment for Collaborative Construction and
Analysis of Cellular Pathways”, Int. Journal of Bioinformatics, Vol.18, pp.996-
1003, 2002.
[5] FASTA Format Description (online), NGFN-BLAST. Available at:
http://ngfnblast.gbf.de/docs/fasta.html
[6] Fruchterman, TMJ., Reingold, EM., “Graph Drawing by Force-Directed
Placement, Software, Practice and Experience”, First Edition, John Wiley Ltd.,
pp. 1129-1164, 1991.
[7] Hermjakob, H., Montecchi-Palazzi, L., Lewington, C., Mudali, S., Kerrien, S.,
“IntAct: an open source molecular interaction database”, Int. Journal of Nucleic
Acids Research, Vol. 21(2), pp.452-455, 2004.
[8] Hooper, SD., Bork, P., “Medusa: a simple tool for interaction graph analysis”,
Int. Journal of Bioinformatics, Vol.21(24), pp. 4432-4433, 2005.
[9] http://www.thehindu.com/antimosquitos/
[10] Iragne, F., Nikolski, M., Mathieu, B., Auber, D., Sherman, D., “ProViz: protein
interaction visualization and exploration”, Int. Journal of Bioinformatics, Vol.
21(2), pp.272-274, 2005.
[11] Lenzerini, M., “Data Integration: A Theoretical Perspective”, Pipeline Open Data
Standards, John Wiley Ltd., pp.243-246, 2002.
[12] Maglott, D., Ostell, J., Pruitt Kim, D., Tatusova. T., “Entrez Gene: gene-centered
information at NCBI”, Int. Journal of Nucleic Acids Research, Vol. 33, pp.54-
D58, 2005.
[13] Shannon, P., Markiel, A,, Ozier, O., Baliga, NS., Wang, JT., Ramage, D.,
“Cytoscape: a software environment for integrated models of biomolecular
interaction networks”, Int. Journal of Genome Research, Vol.13(11), pp. 2498-
2504, 2005.
[14] Sukmal, F., Benediktus,Y., Hidayat, A., “Molecular Surveillance of Dengue
VirusSerotype-1”, Int. Journal on Molecular Biology, Vol. No. 2(1) pp. 345-349,
2013.
[15] www.thebiogrid.org.