Embed Size (px)
Citation preview
1
Issues and Strategies for
Integrated Model Calibration
IAH Waterloo 2015
Dirk Kassenaar, E.J. Wexler P.J. Thompson, M.G.S. Takeda
Earthfx Inc.
2
Integrated Modeling
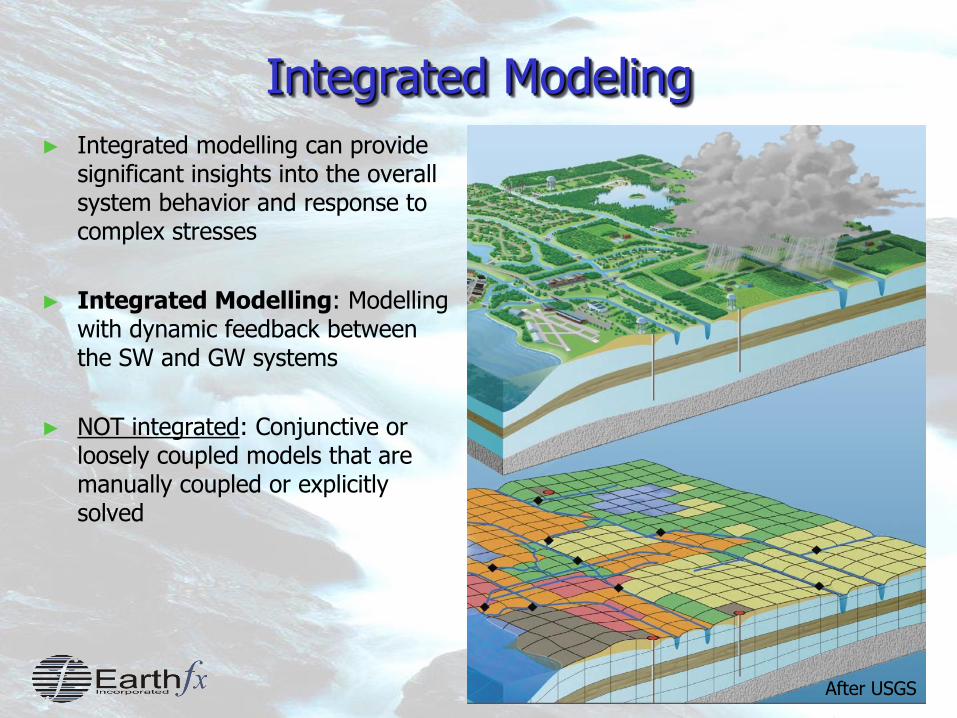
► Integrated modelling can provide significant insights into the overall system behavior and response to complex stresses
► Integrated Modelling: Modelling with dynamic feedback between the SW and GW systems
► NOT integrated: Conjunctive or loosely coupled models that are manually coupled or explicitly solved
After USGS
3
Presentation Objectives
► Is integrated modelling different?
Technical Issues:
► Complex non-linear processes, compensating errors, long run times…
Non-Technical Issues:
► Knowledge limitations, different conceptual models, biases, terminology…
► Strategies for addressing these issues:
We present a general strategy and flow chart for model development
5
Integrated Hydrostratigraphic Modelling
► We are already doing integrated modelling…
► Integrated Stratigraphic/Groundwater modelling
Some GW modellers have only a limited background in geology
► Geology is a “knowledge boundary”
► Desire to independently and completely develop the stratigraphic model
Re-conceptualization of the stratigraphic model is rarely undertaken once the GW model calibration process has begun.
► Geologic refinements often addressed with K zones or parameter estimation (compensating errors)
► Integrated SW/GW modelling
Similar “knowledge boundaries”, but integration is essential
Greater chance that “compensating errors” enter into the process
6
Presentation Outline
► Technical Issues and Challenges
Discussion of issues, with examples of soil zone response and dynamic GW feedback to illustrate challenges
► Strategies for integrated SW/GW model calibration
Presentation of an integrated model development “flow chart”
Other guidelines and recommendations
► Non-technical issues
Data management, blind spots, “Renaissance Hydrogeology”
7
Customs, Conventions and Blind Spots
► Historic simplifications
GW: Too many constant heads, assumption of stasis (steady state)
SW: Lumped parameter models, groundwater as a “decay reservoir”, separation of hydrology and hydraulics, empirical baseflow separation
► Different in calibration approach and emphasis
GW: Emphasis on matching heads and spatial patterns (head, xy)
► Less emphasis on regional flux calibration; poor recharge guesstimates
SW: Emphasis on matching streamflow peaks (flux, time)
► Limited emphasis on spatial and low-flow calibration
► Both SW and GW modellers have “blind spots”
Conventions and simplifications must be addressed during the integrated model development process (Watch out for a defensive response!)
8
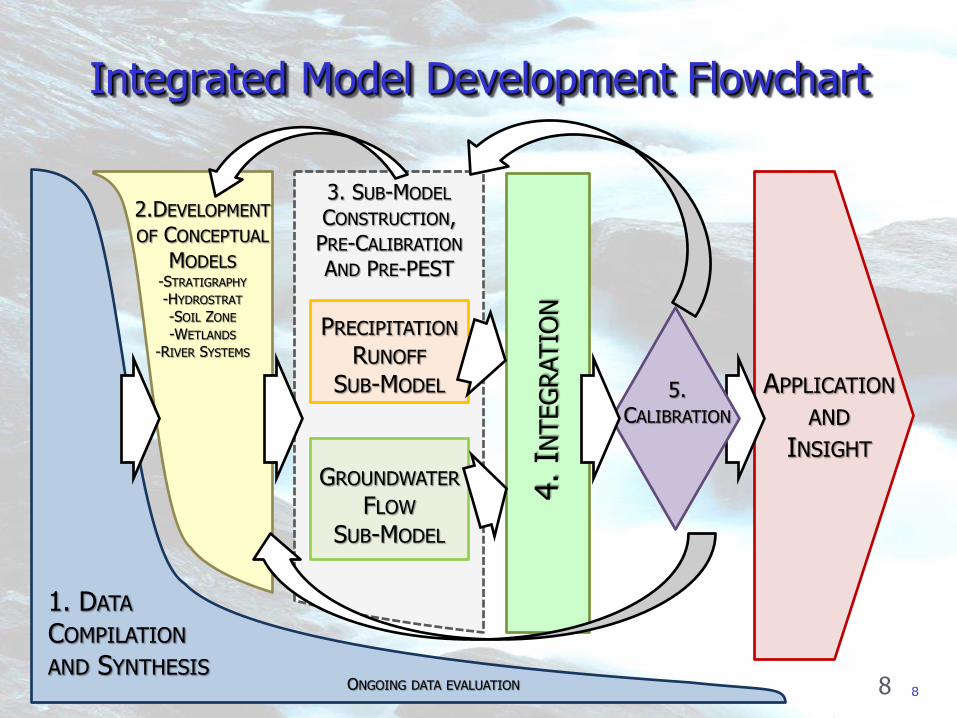
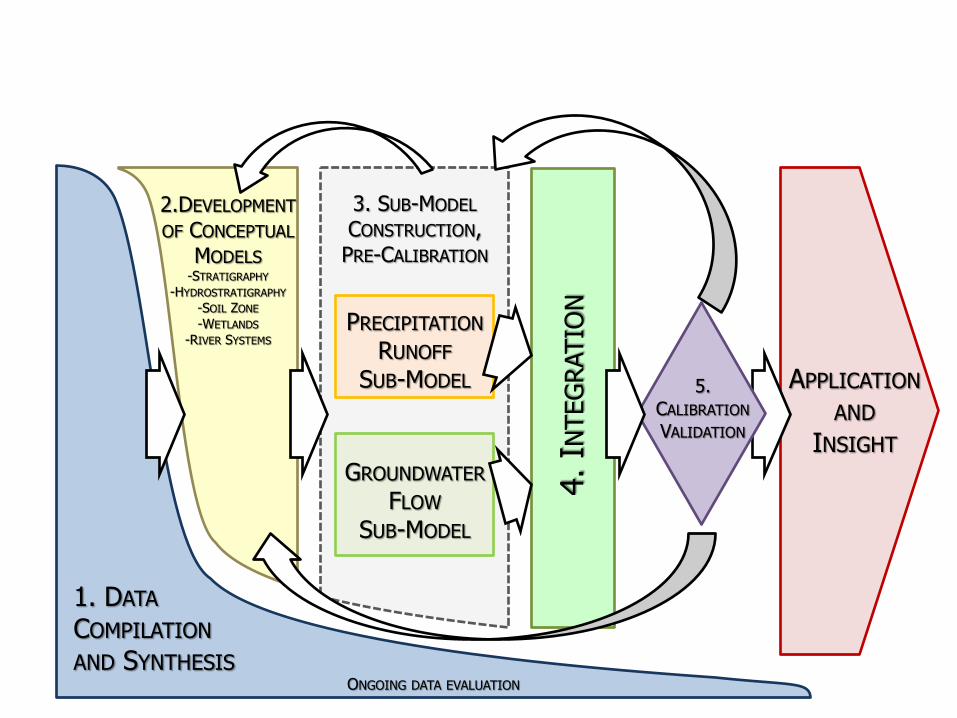
Integrated Model Development Flowchart
8
1. DATA COMPILATION AND SYNTHESIS
2.DEVELOPMENT OF CONCEPTUAL
MODELS -STRATIGRAPHY -HYDROSTRAT -SOIL ZONE -WETLANDS
-RIVER SYSTEMS
3. SUB-MODEL CONSTRUCTION, PRE-CALIBRATION AND PRE-PEST
4. IN
TEG
RATIO
N
APPLICATION AND
INSIGHT
5. CALIBRATION
PRECIPITATION RUNOFF
SUB-MODEL
GROUNDWATER FLOW
SUB-MODEL
ONGOING DATA EVALUATION
9
Model Construction Flowchart
► Model construction includes iterative data evaluation, conceptualization, sub-model pre-calibration and integration
Sub-models cannot be independently calibrated, but some components of the sub-model (e.g. snow pack sub-model) can be more or less developed
► Stages 1-5 are not actually “completed” in a linear manner
The most important conceptual insights are usually only identified once the model integration and final calibration is complete.
10
1. DATA COMPILATION AND SYNTHESIS
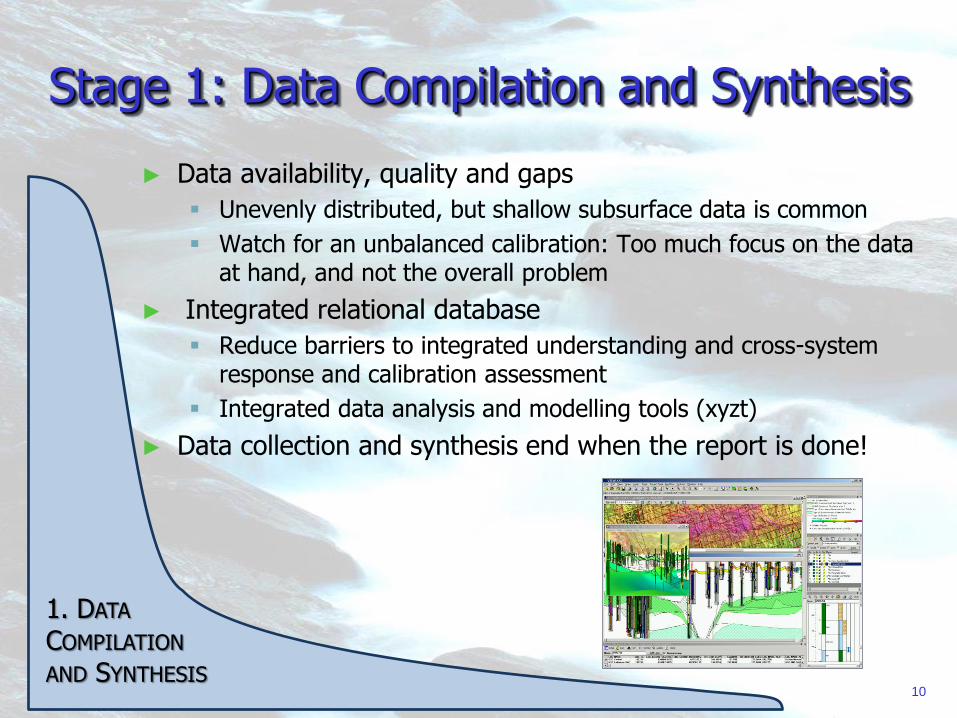
Stage 1: Data Compilation and Synthesis
► Data availability, quality and gaps
Unevenly distributed, but shallow subsurface data is common
Watch for an unbalanced calibration: Too much focus on the data at hand, and not the overall problem
► Integrated relational database
Reduce barriers to integrated understanding and cross-system response and calibration assessment
Integrated data analysis and modelling tools (xyzt)
► Data collection and synthesis end when the report is done!
11
Stage 2: Preliminary Conceptualization
► Multiple conceptual models need to be generally formulated
Stratigraphy, hydrostratigraphy, soil zone, land cover, vegetation, snow pack, land use (pervious-impervious), climate
► Pre-identify areas of strong transient SW/GW interaction
Shallow depth to water – Dunnian rejected recharge
► Enhanced ET in areas with shallow depth to water table
Dynamic wetlands – storage
Riparian zones and “contributing areas”
Reaches with significant river pickup and loss
► Headwaters, springs, intermittent streams, seepage areas
Identify, but avoid, these areas during initial model construction!
12
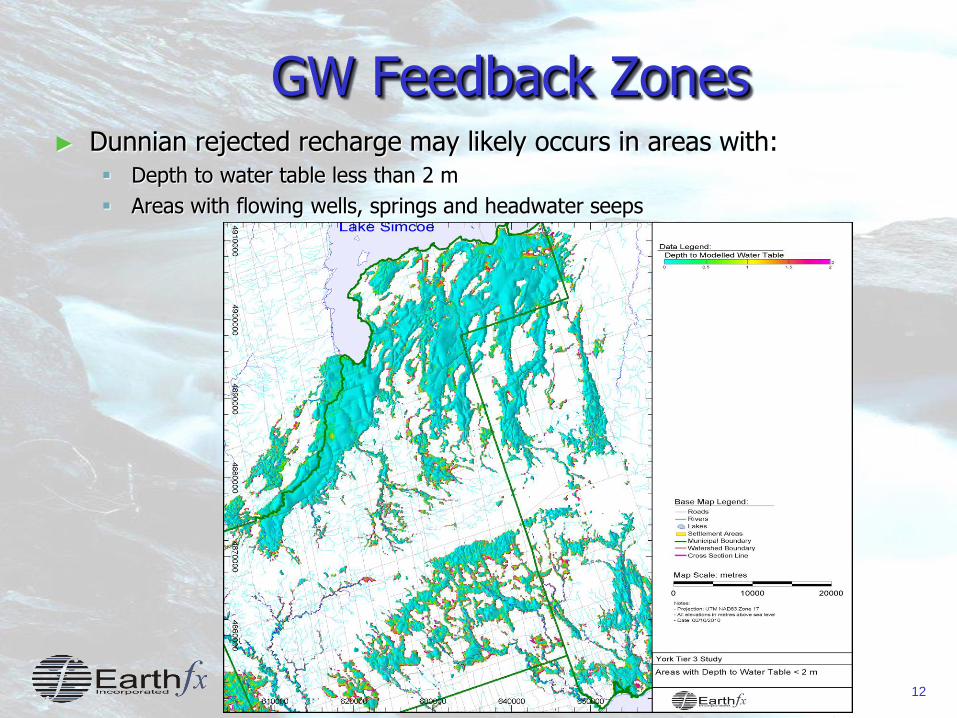
GW Feedback Zones ► Dunnian rejected recharge may likely occurs in areas with:
Depth to water table less than 2 m
Areas with flowing wells, springs and headwater seeps
13
Stage 3: Sub-Model Development
► Focus on:
SW and GW model construction and parameter preparation
Data review, assessment and pattern identification
Understanding of general sensitivity (Pre-PEST)
► GW: Focus on the deeper GW flow system (steady state)
► SW: Pre-calibrate to a gauged sub-catchment with modest GW/SW interaction
Assume parsimony (consistency) when later extrapolating parameters from the test or “donor” catchment to adjacent catchments.
14
Compensating Errors
► Compensating errors arise when the parameters of one sub-model are adjusted incorrectly to offset processes and feedback from another sub-model
► Examples:
GW feedback (Dunnian rejected recharge) can be incorrectly represented as low permeability soil
Wetlands storage (and release) can mask GW discharge
Cross-watershed GW inflows can be missed as stream gauge underflow
Excessive hydraulic conductivity variation and PEST can mask structural and stratigraphic errors.
Over-parameterization and excessive local sub-catchment calibration adjustment versus “parsimony”
►
15
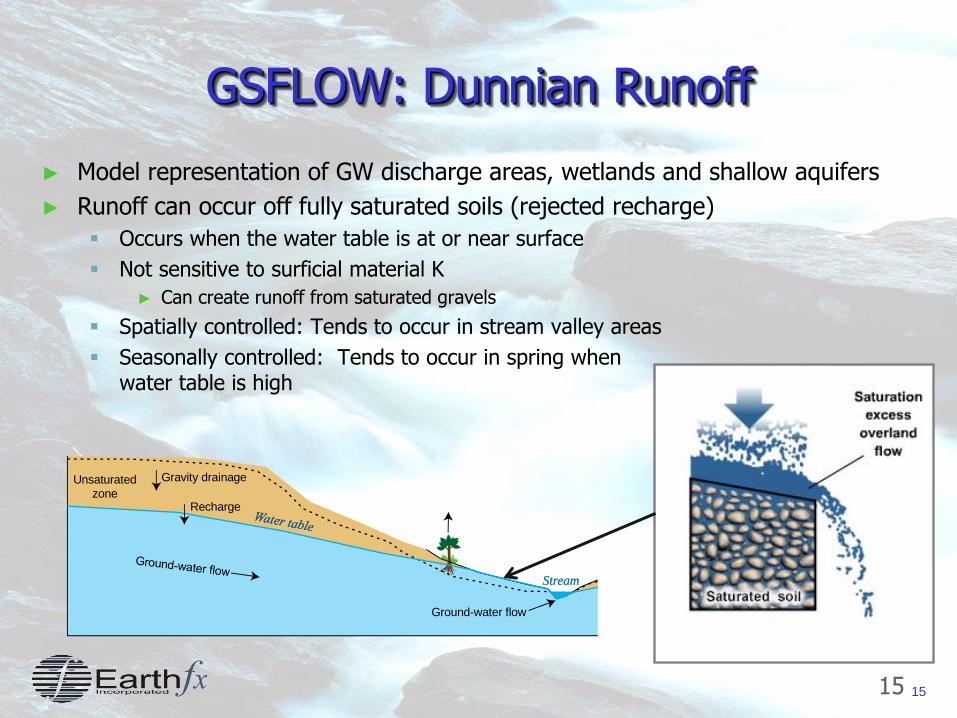
GSFLOW: Dunnian Runoff
► Model representation of GW discharge areas, wetlands and shallow aquifers
► Runoff can occur off fully saturated soils (rejected recharge)
Occurs when the water table is at or near surface
Not sensitive to surficial material K
► Can create runoff from saturated gravels
Spatially controlled: Tends to occur in stream valley areas
Seasonally controlled: Tends to occur in spring when water table is high
15
U n s a t u r a t e d z o n e
S t r e a m S t r e a m
G r a v i t y d r a i n a g e
R e c h a r g e
G r o u n d - w a t e r f l o w
16
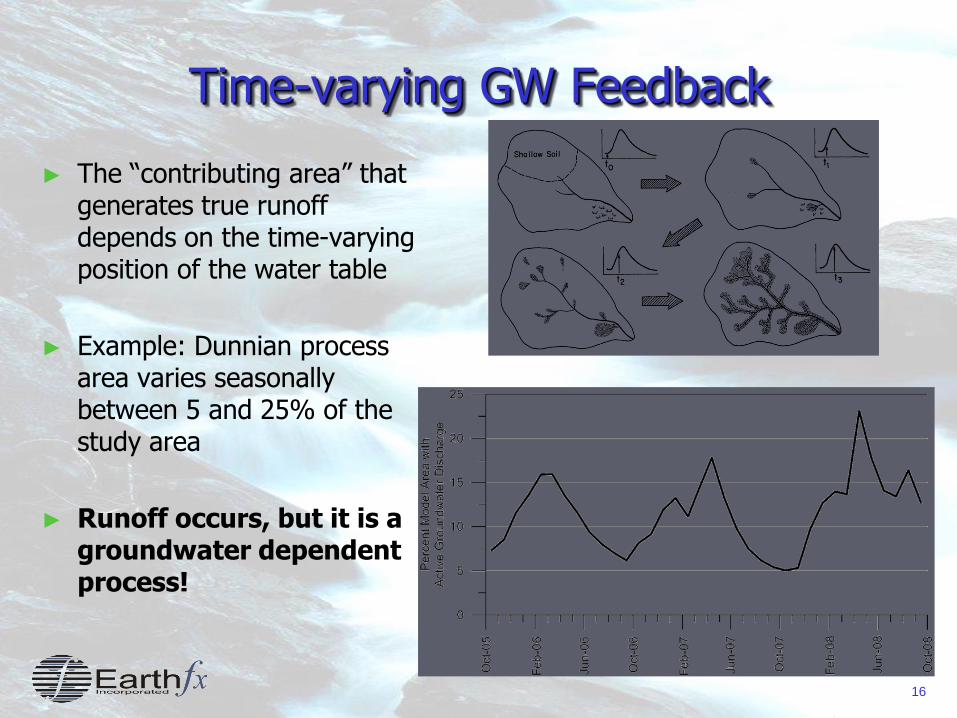
Time-varying GW Feedback
► The “contributing area” that generates true runoff depends on the time-varying position of the water table
► Example: Dunnian process area varies seasonally between 5 and 25% of the study area
► Runoff occurs, but it is a groundwater dependent process!
17
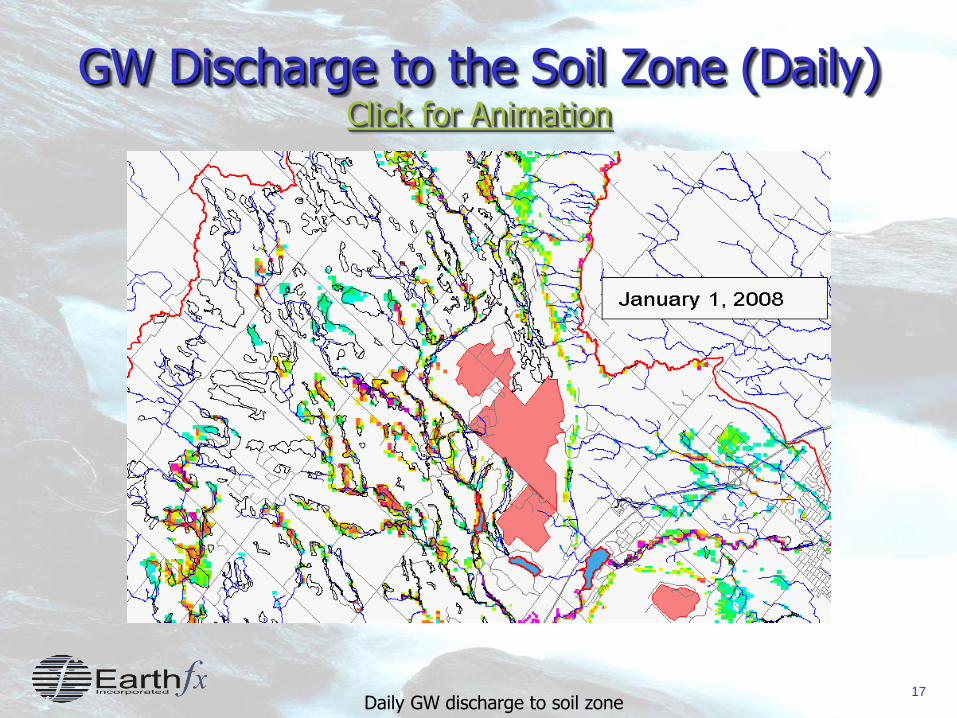
GW Discharge to the Soil Zone (Daily) Click for Animation
Daily GW discharge to soil zone
18
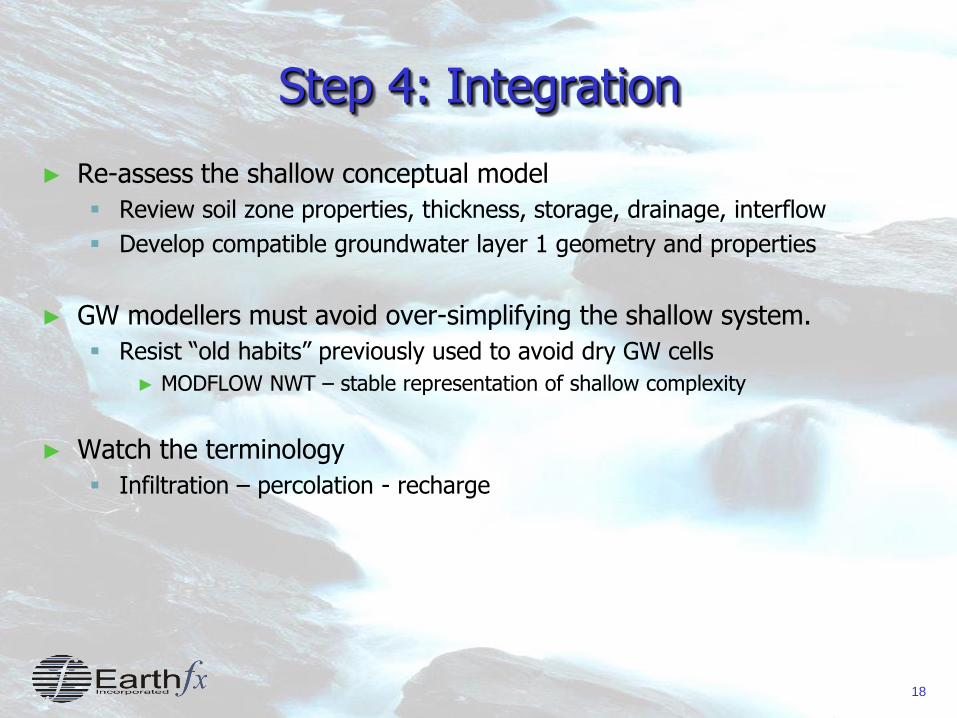
Step 4: Integration
► Re-assess the shallow conceptual model
Review soil zone properties, thickness, storage, drainage, interflow
Develop compatible groundwater layer 1 geometry and properties
► GW modellers must avoid over-simplifying the shallow system.
Resist “old habits” previously used to avoid dry GW cells
► MODFLOW NWT – stable representation of shallow complexity
► Watch the terminology
Infiltration – percolation - recharge
19
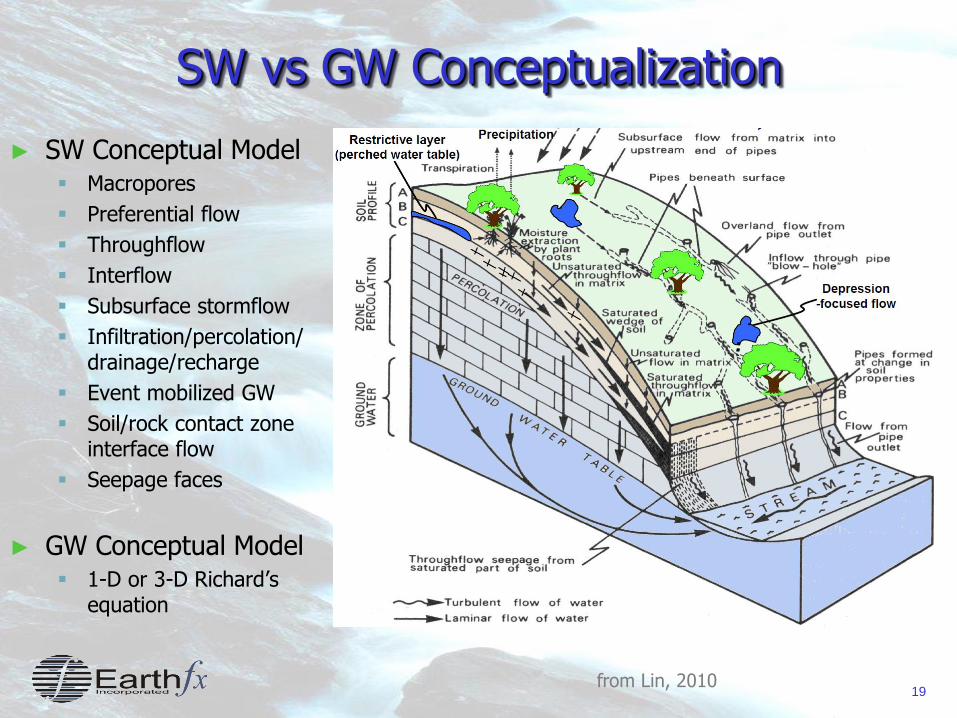
SW vs GW Conceptualization
► SW Conceptual Model Macropores
Preferential flow
Throughflow
Interflow
Subsurface stormflow
Infiltration/percolation/ drainage/recharge
Event mobilized GW
Soil/rock contact zone interface flow
Seepage faces
► GW Conceptual Model 1-D or 3-D Richard’s
equation
from Lin, 2010
20
Technical Issues
► The shallow subsurface, where the integration happens, is highly transient and complex
Significant fluctuation in system feedback
► GW Feedback is highly variable – wet year/dry year, seasonal
► Empirical baseflow separation is only a first guess
► Strong seasonality means the average conditions never exist
Steady state calibration can be very limited in the upper system
► In summary, dynamic feedback is reality – get on with it
Recognizing the dynamic nature is essential to the calibration process
21
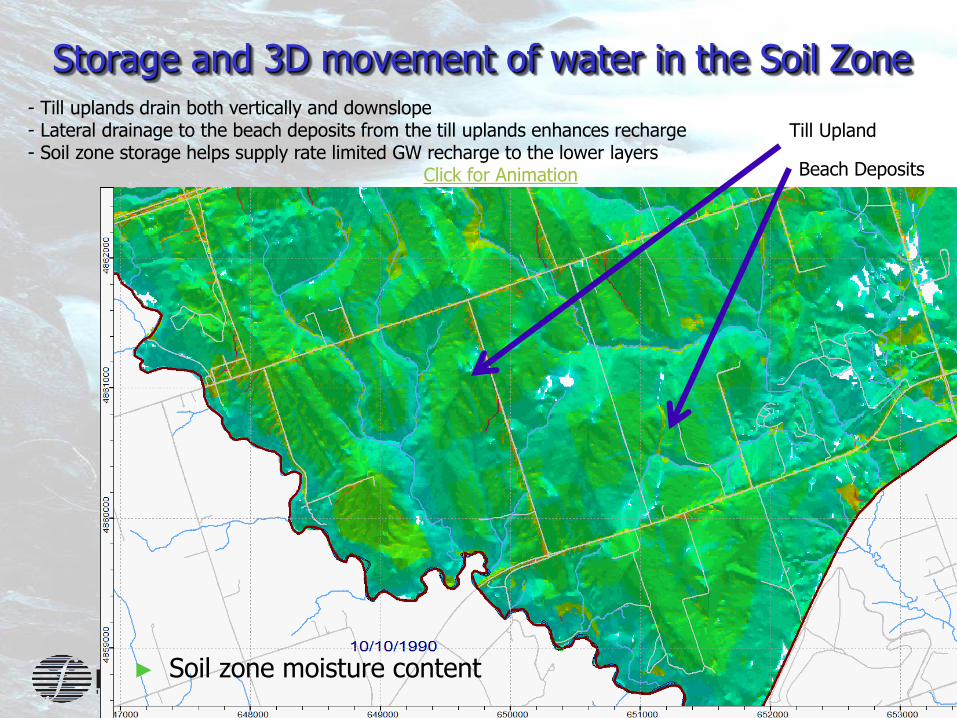
Storage and 3D movement of water in the Soil Zone
► Soil zone moisture content
Beach Deposits
Till Upland - Till uplands drain both vertically and downslope - Lateral drainage to the beach deposits from the till uplands enhances recharge - Soil zone storage helps supply rate limited GW recharge to the lower layers Click for Animation
22
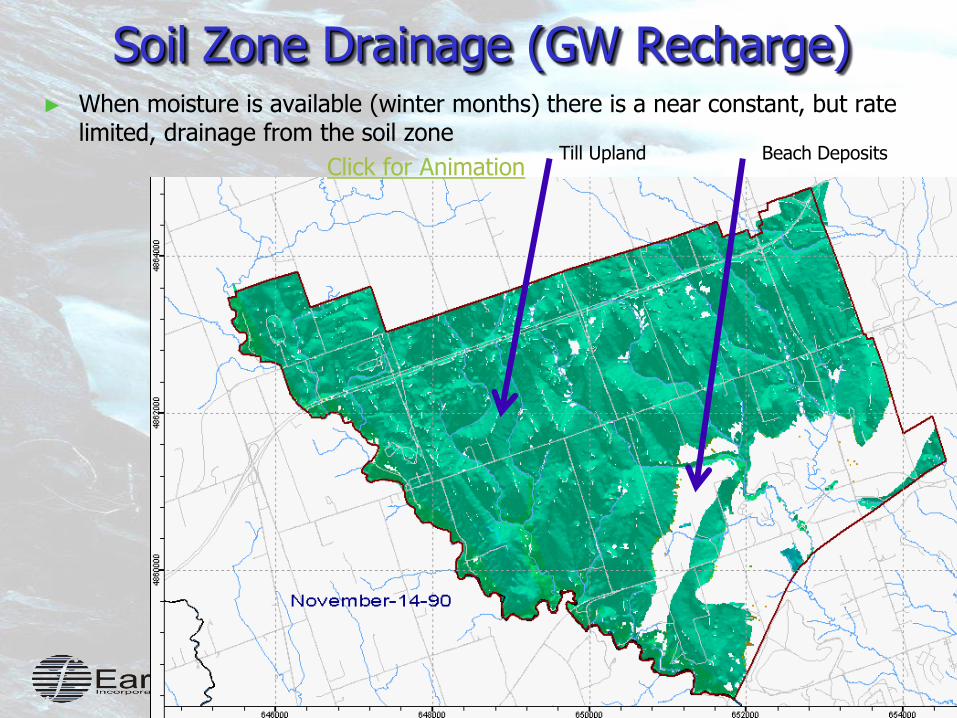
Soil Zone Drainage (GW Recharge) ► When moisture is available (winter months) there is a near constant, but rate
limited, drainage from the soil zone
Click for Animation Beach Deposits Till Upland
23
Step 5: Integrated Calibration
► Get the models and the team working together
► Continue to re-conceptualize, as necessary
► Write a draft report to formulate your understanding (and impress your boss/client with your progress)
24
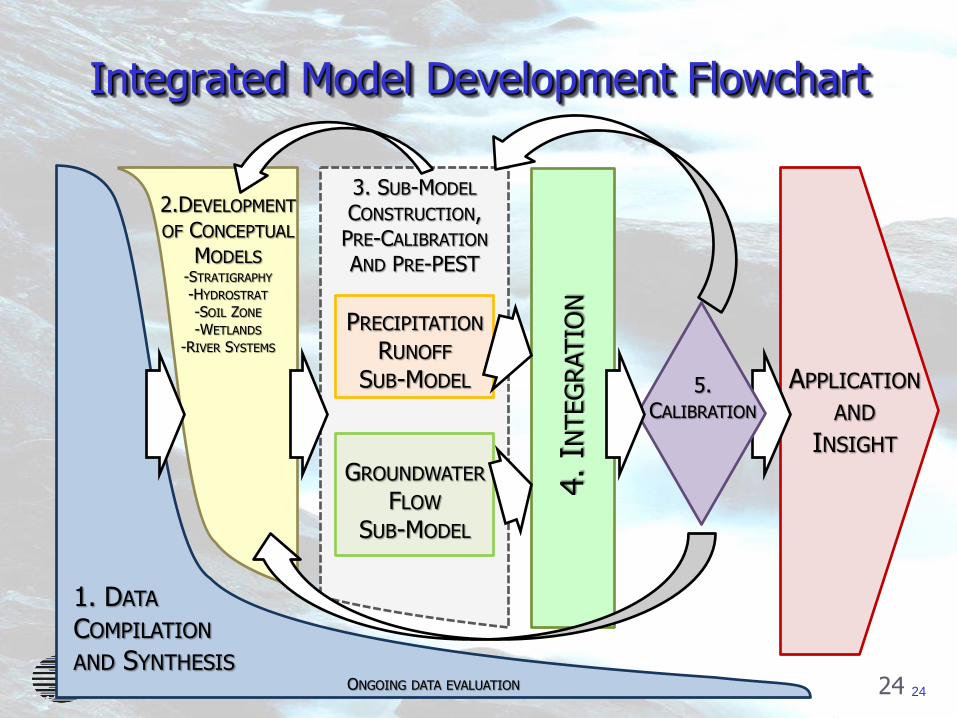
Integrated Model Development Flowchart
24
1. DATA COMPILATION AND SYNTHESIS
2.DEVELOPMENT OF CONCEPTUAL
MODELS -STRATIGRAPHY -HYDROSTRAT -SOIL ZONE -WETLANDS
-RIVER SYSTEMS
3. SUB-MODEL CONSTRUCTION, PRE-CALIBRATION AND PRE-PEST
4. IN
TEG
RATIO
N
APPLICATION AND
INSIGHT
5. CALIBRATION
PRECIPITATION RUNOFF
SUB-MODEL
GROUNDWATER FLOW
SUB-MODEL
ONGOING DATA EVALUATION
25
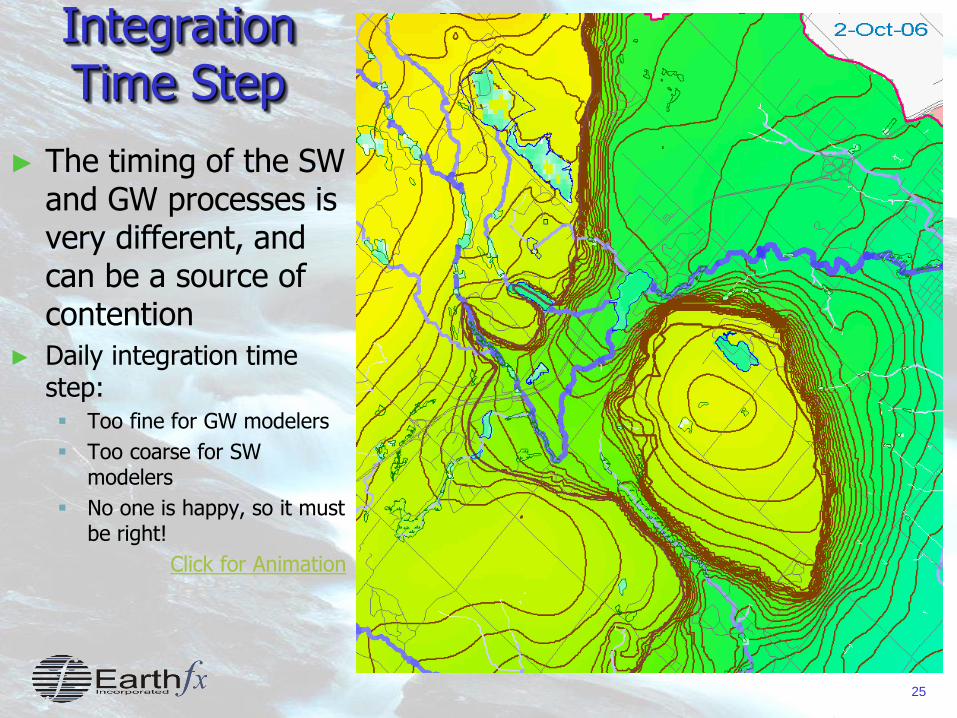
Integration Time Step
► The timing of the SW and GW processes is very different, and can be a source of contention
► Daily integration time step: Too fine for GW modelers
Too coarse for SW modelers
No one is happy, so it must be right!
Click for Animation
26
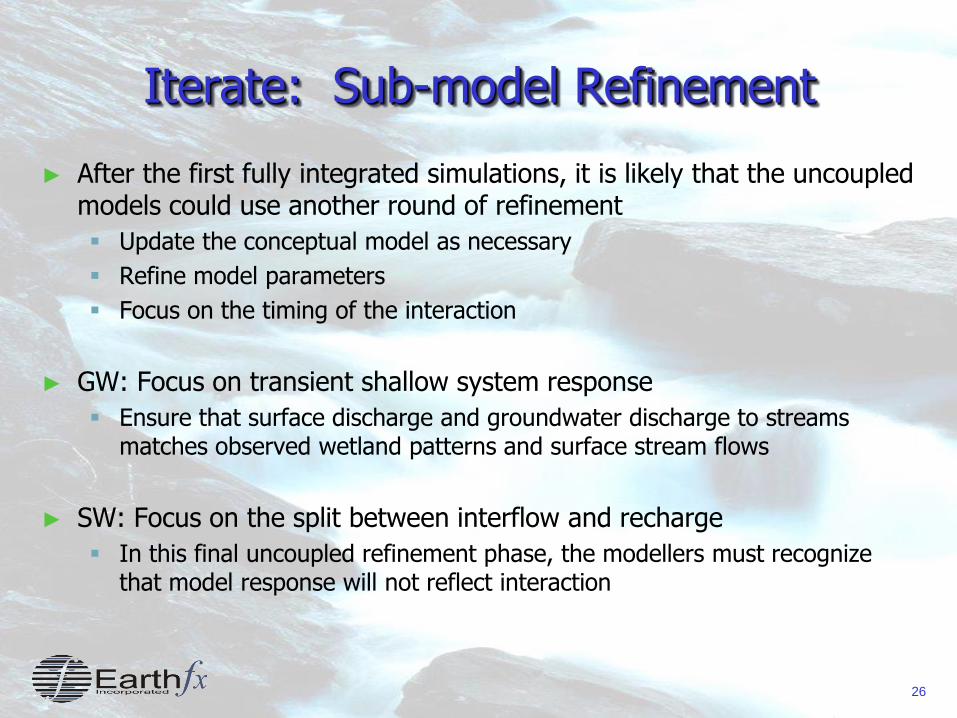
Iterate: Sub-model Refinement
► After the first fully integrated simulations, it is likely that the uncoupled models could use another round of refinement
Update the conceptual model as necessary
Refine model parameters
Focus on the timing of the interaction
► GW: Focus on transient shallow system response
Ensure that surface discharge and groundwater discharge to streams matches observed wetland patterns and surface stream flows
► SW: Focus on the split between interflow and recharge
In this final uncoupled refinement phase, the modellers must recognize that model response will not reflect interaction
27
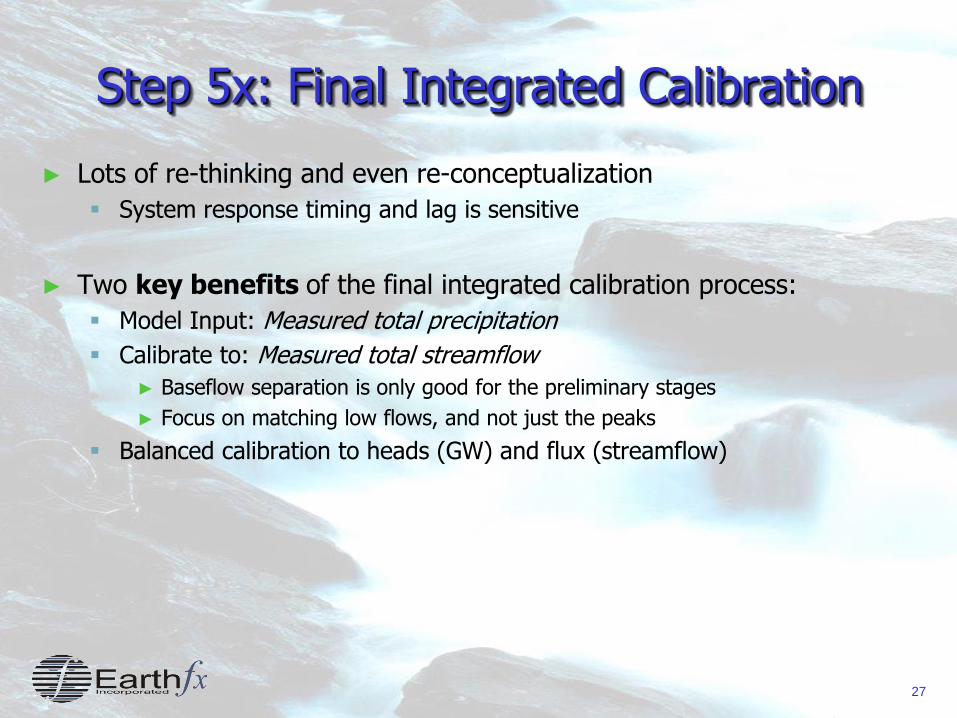
Step 5x: Final Integrated Calibration
► Lots of re-thinking and even re-conceptualization
System response timing and lag is sensitive
► Two key benefits of the final integrated calibration process:
Model Input: Measured total precipitation
Calibrate to: Measured total streamflow
► Baseflow separation is only good for the preliminary stages
► Focus on matching low flows, and not just the peaks
Balanced calibration to heads (GW) and flux (streamflow)
28 28
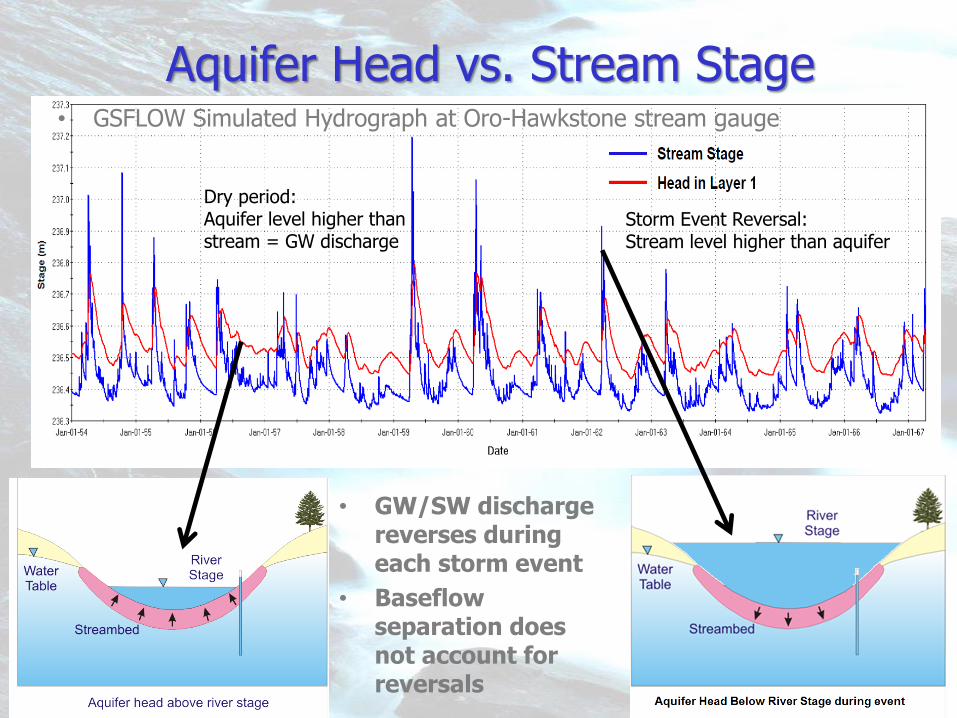
Aquifer Head vs. Stream Stage
• GW/SW discharge reverses during each storm event
• Baseflow separation does not account for reversals
• GSFLOW Simulated Hydrograph at Oro-Hawkstone stream gauge
Storm Event Reversal: Stream level higher than aquifer
Dry period: Aquifer level higher than stream = GW discharge
29
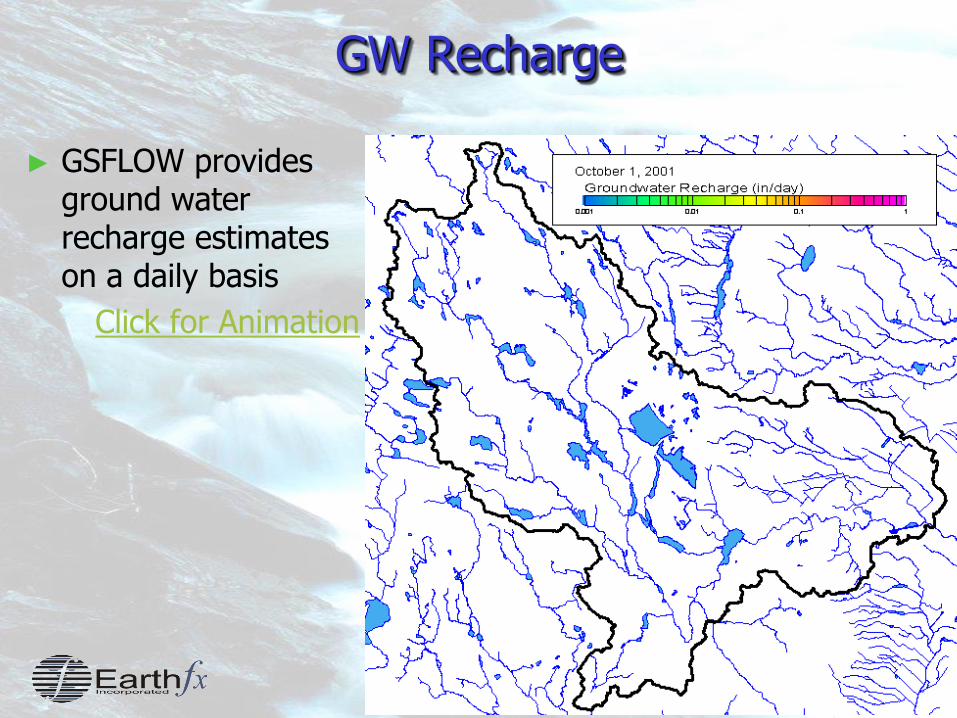
GW Recharge
► GSFLOW provides ground water recharge estimates on a daily basis
Click for Animation
30
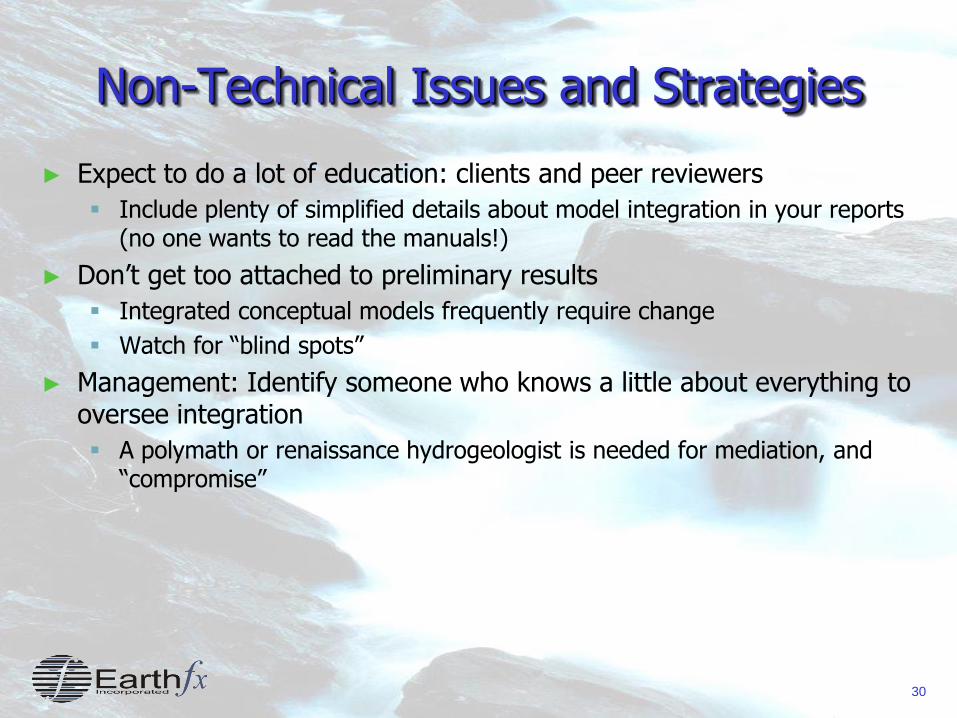
Non-Technical Issues and Strategies
► Expect to do a lot of education: clients and peer reviewers
Include plenty of simplified details about model integration in your reports (no one wants to read the manuals!)
► Don’t get too attached to preliminary results
Integrated conceptual models frequently require change
Watch for “blind spots”
► Management: Identify someone who knows a little about everything to oversee integration
A polymath or renaissance hydrogeologist is needed for mediation, and “compromise”
31
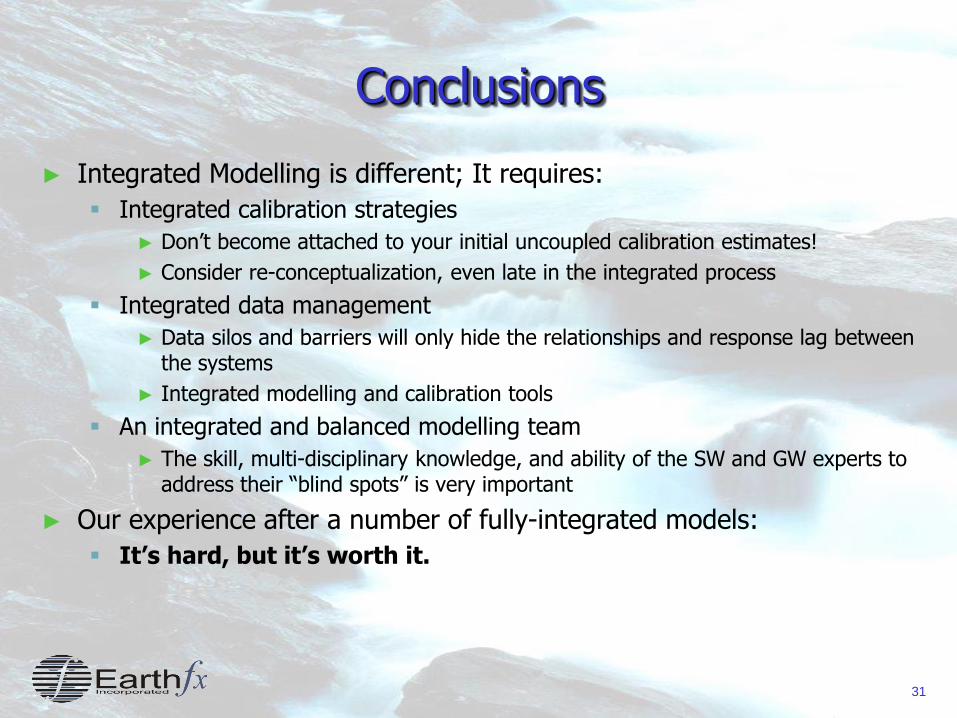
Conclusions
► Integrated Modelling is different; It requires:
Integrated calibration strategies
► Don’t become attached to your initial uncoupled calibration estimates!
► Consider re-conceptualization, even late in the integrated process
Integrated data management
► Data silos and barriers will only hide the relationships and response lag between the systems
► Integrated modelling and calibration tools
An integrated and balanced modelling team
► The skill, multi-disciplinary knowledge, and ability of the SW and GW experts to address their “blind spots” is very important
► Our experience after a number of fully-integrated models:
It’s hard, but it’s worth it.
1. DATA COMPILATION AND SYNTHESIS
2.DEVELOPMENT OF CONCEPTUAL
MODELS -STRATIGRAPHY
-HYDROSTRATIGRAPHY -SOIL ZONE -WETLANDS
-RIVER SYSTEMS
3. SUB-MODEL CONSTRUCTION, PRE-CALIBRATION
4. IN
TEG
RATIO
N
APPLICATION AND
INSIGHT
5. CALIBRATION VALIDATION
PRECIPITATION RUNOFF
SUB-MODEL
GROUNDWATER FLOW
SUB-MODEL
ONGOING DATA EVALUATION