Embed Size (px)
Citation preview

Energy ModelingBuilding Stock Modeling | whole systems energy
modeling
By : Seyed Mehdi Mohaghegh
Tehran- Sharif University of TechnologyEnergy Engineering Department
January 2015

Overview
• Building Stock Modeling • Energy consumption in the residential sector: A case study
of Omani buildings
• Energy System Modeling – Availability of material for future low-carbon
energy pathways

Energy consumption in the residential sector: A case study of Omani buildings
• Stakeholders : – Passiveystem – UCL Energy Institute – Authority for Electricity Regulation Oman (AER)

Overview
• Background information ( Oman, Energy consumption, built environment )
• Research objectives • Methodology • Results• Early result of PassivSystem project• Possible improvement

Background information on Oman
• Area : 300,000 Sq. Km (70th)• Population 2.7 M• GDP Per capita : 25000 $

Population distribution
Muscat Governorate 775,878 28.0%Al Batinah Region 772,590 27.9%Musandam Governorate 31,425 1.1%Adh Dhahirah Region 151,664 5.5%Ad Dakhliyah Region 326,651 11.8%Ash Sharqiyah Region 350,514 12.6%Al Wusta Region 42,111 1.5%Dhofar Governorate 249,729 9.0%Al Buraymi Governorate 72,917 2.6%Total 2,773,479
Regions Total %

Oman Economy

Energy use in Oman• Primary energy use has increased during between 1970-2010 • Primary energy sources are not so diverse• Gas 67% & Oil 33% • Oil is being used for transport sector ( Petrol and Diesel )
Energy use (kt of oil equivalent)

Energy use in Oman
Residential sector ( 100% covered by electricity )

Electricity use in Oman
• The only primary source for power plants is natural gas.

Electricity Intensity
• Annual MWh per account
• Growing income per capita • Steady growth of population, and • large amounts of subsidies for electricity prices
Drivers for electricity demand
(Source: AER, 2011)

Built environment transformation in Oman
• Average local family structure has decreased from 14.4 persons per house in 1980, to 8.2 persons per house in 2009

Density of Urban Area

Predominant building type (Arabic House)
• Mainly built in 1970’s and 1980’ • Standard plot size ( obligation by law) • Poor thermal insulation

Predominant building type (Villa)
• Mainly built from 1990 until the present• Building format has changed significantly - New building regulation (Local Order No.
23/92) (Ministerial Decision 48/2000). • the house should be positioned at the centre of the plot and, according to the
regulations it should be surrounded by a 2-2.5 meter high compound wall to guarantee a minimum level of privacy

Change in building format
• During the retrofit program in Oman, the number of rural and Arabic houses has decreased, but on the other hand, there is significant growth in the number of villas and apartment Slide 22

Research Objective
• there is a lack of scientifically-based and detailed research on the energy demand in domestic sector
• the Omani domestic energy consumption model is proposed and the main goal is to provide useful insight in support of future research and national plans for the delivery of a more efficient domestic stock
• To provide an evaluation for the effects of possible technical interventions regarding energy consumption

Methodology
• Modelling technique - Top-Down approach- Bottom-up approach
• When dealing with a complex system such as energy use in buildings where social, economic and environmental Top-down may not be helpful.
• one of the advantages of physic-based bottom-up modelling is the capability of analysing the impacts of possible interventions on energy consumption levels.

Mode structure

Model Interface ( SIMERGY)
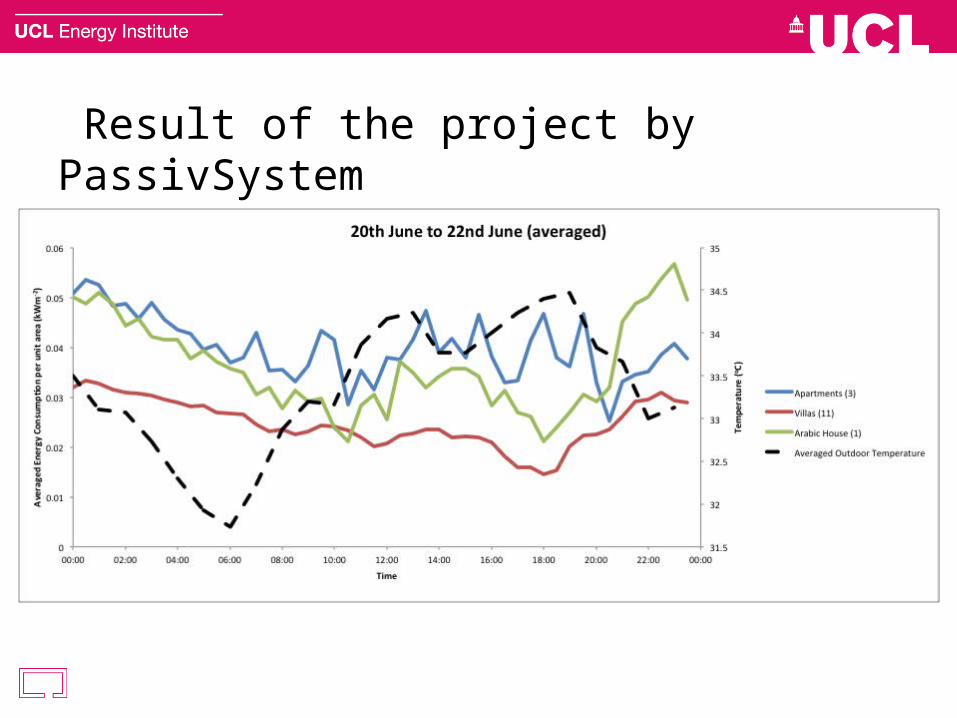
Result of the project by PassivSystem

Result of the project by PassivSystem
7 House ( 5 villas, 2 Apartments )

Developing archetypes
Villa Apartment Arabic House
Unit layout
Income group High high low Floor area 300 m2 150 m2 150m2 No. of Floors 2 5 1 Construction Cement brick reinforced concrete Cement brick
Window area N 20%, S 10 % , E &W15 % N 20%, S 10 % , E &W15 % N 20%, S 10 % , E &W15
% Air conditioning Air to Air HP Central Chiller Air to Air HP Appliance Ownership High High Low

Results

Results

Results
ArchetypesPeak Power demand (KW)
Energy Consumption
(MWh)
Number of Houses In Oman
Estimated Energy Consumption (MWh)
Number of Houses In Muscat
Estimated Energy Consumption (MWh)
Villa 9.4 25.4 157,051.5 3,989,108.9 51,996.2 1,320,702.4
Arabic House 6.4 16.7 171,379.0 2,862,029.9 19,939.5 332,990.2
Apartment 5.9 14.6 114,620.1 1,673,452.9 65,493.7 956,207.8
Other 6.1 15.9 108,007.4 1,717,317.2 15,798.2 251,192.1
Total 551,058.0 10,241,908.9 153,227.6 2,861,092.5
Total number of dwellings by Region and Type in 2010
Villa Apartment
Arabic House
Rural House Other Total
Muscat 51,996 65,494 19,940 307 15,491 153,381 Oman 157,052 114,620 171,379 17,634 90,374 551,058
Slide 14

Results

Upgrade options

Availability of material for future low-carbon energy pathways
• Stakeholders :• UCL Institute for sustainable resources • BHP Billiton LTD

What’s critical about materials
• There is debate about whether the availability of natural resources could place a constraint on future development.
• Specifically for energy sector there is increasing concern that future supply of some lesser known ‘critical materials’ will not be sufficient to meet rising demand in the low-carbon technology sector.
TITLE STYLESUB STYLE

• Electric vehicles & batteries cobalt, lithium, rare earth elements
• Fuel cellsplatinum, (ruthenium, palladium, gold)
• Wind Turbine rare earth elements (neodymium )
• Photovoltaic (solar cells) silicon, silver, indium, gallium, selenium, tellurium, germanium, ruthenium

Boom in demand for most ‘energy materials’

Assessing criticality Three mains steps : • 1- Supply Side • 2- Demand Side• 3- Putting supply and demand together
Qualitative Quantitative

How “ energy system model “ could help ?
• A bottom-up, technology rich energy system model could improve projecting future demand.
• It will provide insights on potential bottlenecks associated with future high and low carbon scenarios.
• It will provide a comparison between different pathways from material point of view. ( e.g. comparison of fuel cell car vs. electric vehicle )

Energy system modelling (TIMES Model )
Objective function : Minimizing discounted system costsInput data
• Cost data • Efficiencies • Demand • Material intensity
( e.g. kg/kwh)
Model equation :Transformation relationship (e.g. efficiency relationship for power plant )
Capacity-activity constraint (e.g. available capacity limit electricity generation of power plants )
Peaking constraint (e.g. Ensuring reserve capacity at peak load )
Scenario specific constraints (e.g. bound on CO2 emissions, renewable targets )
Cumulated constraints over time (e.g. available
fossil resources and Material )
Decision/output variable
• Process activities • Energy/ Emission flows • Energy related
material demand

Material as a commodity
Coal CCS
Flows Flows
Electricity CO2
Commodities
Process
Commodities
CoalMaterial

Competition between technologies
Wind tu
rbine
Wind power (exist)
Wind power (new)
Competing options to produce electricity :• Between technologies • Between old and new plantsInfluenced by :• Technology costs• Efficiencies • Availability of materials

Future challenges
• Substitution of material• Substitution of technology• Recycling of critical materials• Demand from non-energy sectors• Lack of data for some material ( Supply Side )

Thank you !@mehdimohaghegh