Embed Size (px)
Citation preview

International Journal of Innovative Research in Advanced Engineering (IJIRAE) ISSN: 2349-2163 Issue 03, Volume 4 (March 2017) www.ijirae.com
_________________________________________________________________________________________________ IJIRAE: Impact Factor Value – SJIF: Innospace, Morocco (2016): 3.916 | PIF: 2.469 | Jour Info: 4.085 |
ISRAJIF (2016): 3.715 © 2014- 17, IJIRAE- All Rights Reserved Page -73
The Detection of Sea Water Intrusion Based on Resistivity
Data in the Northern City of Semarang
Muhammad Ulin Nuha ABA*
Master Student Department of Physics Diponegoro University Semarang, Indonesia
Agus Setyawan Department of Physics Diponegoro University Semarang, Indonesia
Jatmiko Endro Suseno Department of Physics Diponegoro University Semarang, Indonesia
Abstract - Semarang is one of the metropolitan cities that have problems of intrusion sea water in a long time. Particularly in the northern part of Semarang that there are many industrial activities as well as a variety of urban public facilities. This condition makes many people activity in the area and in need of water consumption. For it is done assessment of sea water intrusion in the area so that the water used public can Unknown eligibility. The method used is the resistivity method configuration Schlumberger is able to perform estimation of subsurface geology and estimation groundwater quality based on values of resistivity. The results showed that almost all regions have been affected by sea water intrusion indicated by low resistivity values between 0-7 Ωm at a depth of 0-45 meters. The areas most affected by the intrusion sea water is in the Southeast side of the region of KarangTempel with the depth of sea water intrusion reaches 45 meters.
Keywords - Semarang, sea water intrusion, resistivity
I. INTRODUCTION
Salt water intrusion is the recessive process underground fresh water by salt water / sea water in aquifers in coastal areas. Sea water intrusion is due to an increase in the exploitation of ground water that is not managed and controlled effectively, causing a decline in groundwater levels, as well as changes in the quality and quantity of groundwater itself [1]. In Indonesia, the groundwater resources in a number of metropolitan areas near the coast of Jakarta, Surabaya, and Semarang have been affected by saltwater intrusion [2]. This problem occurs in Semarang in the long term [3]. For that we need a comprehensive assessment is continuous in this region, so that changes in sea-water intrusion occurs can be detected either.
The study of sea water intrusion in Semarang with various methods already done by researchers. As in 2012 using geoelectric method provides results that zoning saltwater intrusion especially in District covers an area of Semarang GenukKarangroto, Sembungharjo, BangetayuKulon, Genuksari and Trimulyo [1]. In addition to the year 2013 by using well log and numerical methods provide results that occur the movement of salt water from the coastline over the years, also stated that the intrusion in driven by rising sea levels [3]. Another study in 2016 using resistivity and geochemical methods provide results that areas suspected of sea water intrusion that is Trimulyoarea with resistivity value reached 0.27 Ωm [4]. Based on the research that has been done, it is known that the method detection of resistivity continues to be used in sea water intrusion from year to year, show that this method is still very powerful and reliable to use. Apart The use of data freshness can certainly provide information on the conditions of renewal region as well subsurface conditions relating to the distribution area of water intrusion Semarang sea in the north.
II. METHOD
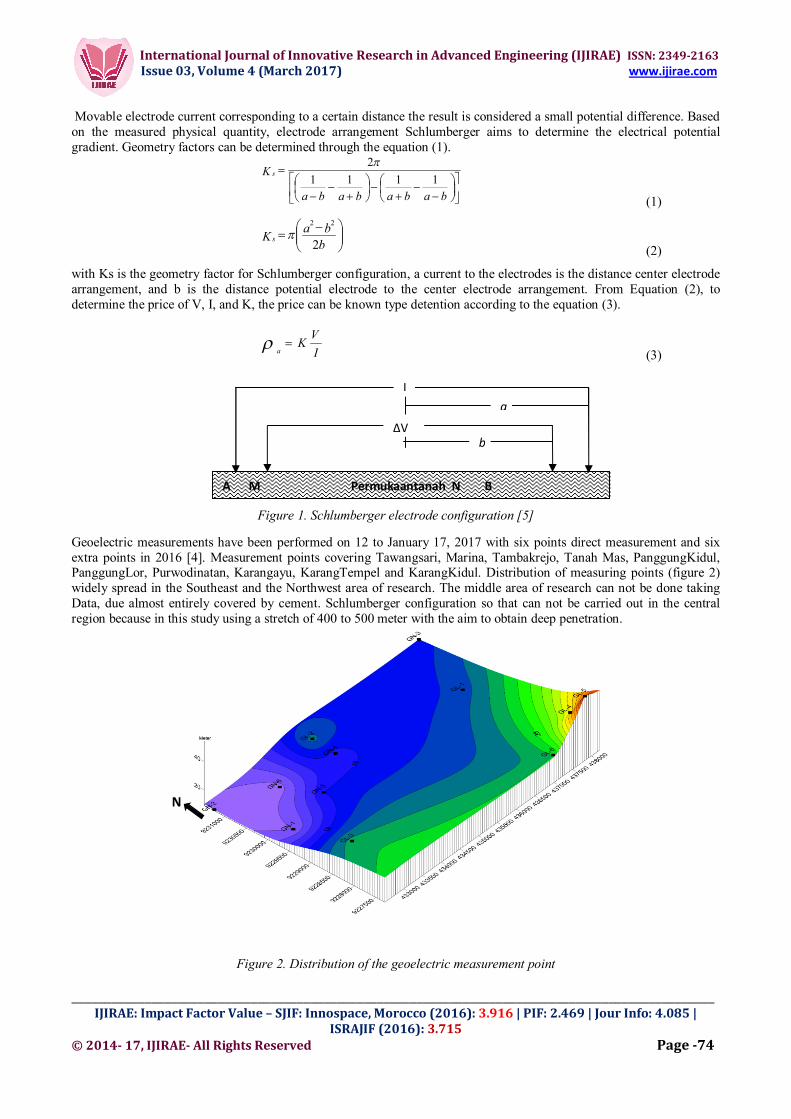
Resistivity method is the method used in the measurement of resistivity rock below ground level. This method is capable of estimating geological below the surface and ground water quality prediction based on the value of resistivity (resistivity) and electrical conductivity values in rocks. Value resistivity and electrical conductivity values in rocks is useful to determine the boundary layer between freshwater and saltwater [1]. In this study used Schlumberger configuration, has a current electrode distance greater than the potential electrodes. Electrodes are placed on the potential mid-electrode currents (Figure 1).
International Journal of Innovative Research in Advanced Engineering (IJIRAE) ISSN: 2349-2163 Issue 03, Volume 4 (March 2017) www.ijirae.com
_________________________________________________________________________________________________ IJIRAE: Impact Factor Value – SJIF: Innospace, Morocco (2016): 3.916 | PIF: 2.469 | Jour Info: 4.085 |
ISRAJIF (2016): 3.715 © 2014- 17, IJIRAE- All Rights Reserved Page -74
Movable electrode current corresponding to a certain distance the result is considered a small potential difference. Based on the measured physical quantity, electrode arrangement Schlumberger aims to determine the electrical potential gradient. Geometry factors can be determined through the equation (1).
babababa
K s 11112
(1)
bbaK s 2
22
(2)
with Ks is the geometry factor for Schlumberger configuration, a current to the electrodes is the distance center electrode arrangement, and b is the distance potential electrode to the center electrode arrangement. From Equation (2), to determine the price of V, I, and K, the price can be known type detention according to the equation (3).
IVK
a
(3)
Figure 1. Schlumberger electrode configuration [5]
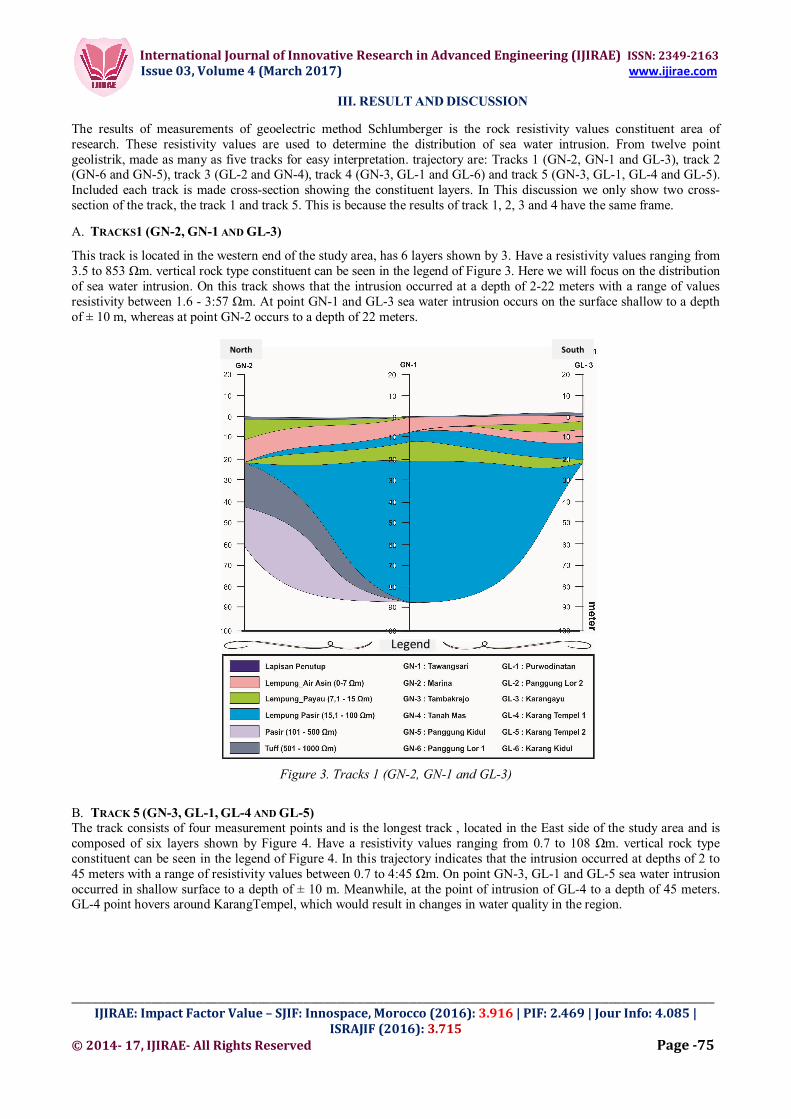
Geoelectric measurements have been performed on 12 to January 17, 2017 with six points direct measurement and six extra points in 2016 [4]. Measurement points covering Tawangsari, Marina, Tambakrejo, Tanah Mas, PanggungKidul, PanggungLor, Purwodinatan, Karangayu, KarangTempel and KarangKidul. Distribution of measuring points (figure 2) widely spread in the Southeast and the Northwest area of research. The middle area of research can not be done taking Data, due almost entirely covered by cement. Schlumberger configuration so that can not be carried out in the central region because in this study using a stretch of 400 to 500 meter with the aim to obtain deep penetration.
Figure 2. Distribution of the geoelectric measurement point
A M Permukaantanah N B
ΔV
I a
b
N
International Journal of Innovative Research in Advanced Engineering (IJIRAE) ISSN: 2349-2163 Issue 03, Volume 4 (March 2017) www.ijirae.com
_________________________________________________________________________________________________ IJIRAE: Impact Factor Value – SJIF: Innospace, Morocco (2016): 3.916 | PIF: 2.469 | Jour Info: 4.085 |
ISRAJIF (2016): 3.715 © 2014- 17, IJIRAE- All Rights Reserved Page -75
III. RESULT AND DISCUSSION
The results of measurements of geoelectric method Schlumberger is the rock resistivity values constituent area of research. These resistivity values are used to determine the distribution of sea water intrusion. From twelve point geolistrik, made as many as five tracks for easy interpretation. trajectory are: Tracks 1 (GN-2, GN-1 and GL-3), track 2 (GN-6 and GN-5), track 3 (GL-2 and GN-4), track 4 (GN-3, GL-1 and GL-6) and track 5 (GN-3, GL-1, GL-4 and GL-5). Included each track is made cross-section showing the constituent layers. In This discussion we only show two cross-section of the track, the track 1 and track 5. This is because the results of track 1, 2, 3 and 4 have the same frame. A. TRACKS1 (GN-2, GN-1 AND GL-3)
This track is located in the western end of the study area, has 6 layers shown by 3. Have a resistivity values ranging from 3.5 to 853 Ωm. vertical rock type constituent can be seen in the legend of Figure 3. Here we will focus on the distribution of sea water intrusion. On this track shows that the intrusion occurred at a depth of 2-22 meters with a range of values resistivity between 1.6 - 3:57 Ωm. At point GN-1 and GL-3 sea water intrusion occurs on the surface shallow to a depth of ± 10 m, whereas at point GN-2 occurs to a depth of 22 meters.
Figure 3. Tracks 1 (GN-2, GN-1 and GL-3)
B. TRACK 5 (GN-3, GL-1, GL-4 AND GL-5) The track consists of four measurement points and is the longest track , located in the East side of the study area and is composed of six layers shown by Figure 4. Have a resistivity values ranging from 0.7 to 108 Ωm. vertical rock type constituent can be seen in the legend of Figure 4. In this trajectory indicates that the intrusion occurred at depths of 2 to 45 meters with a range of resistivity values between 0.7 to 4:45 Ωm. On point GN-3, GL-1 and GL-5 sea water intrusion occurred in shallow surface to a depth of ± 10 m. Meanwhile, at the point of intrusion of GL-4 to a depth of 45 meters. GL-4 point hovers around KarangTempel, which would result in changes in water quality in the region.
North South
Legend

International Journal of Innovative Research in Advanced Engineering (IJIRAE) ISSN: 2349-2163 Issue 03, Volume 4 (March 2017) www.ijirae.com
_________________________________________________________________________________________________ IJIRAE: Impact Factor Value – SJIF: Innospace, Morocco (2016): 3.916 | PIF: 2.469 | Jour Info: 4.085 |
ISRAJIF (2016): 3.715 © 2014- 17, IJIRAE- All Rights Reserved Page -76
Figure 4. Tracks 5 (GN-3, GL-1, GL-4 and GL-5)
C. PREDICTION OF SEA WATER INTRUSION DISTRIBUTION Based on the results of modeling the trajectory of one to five, we can get the distribution of sea water intrusion in the northern part of the region Semarang presented by graph 1 (figure 5). the graph constitute charts the relationship between the measurement point and the depth of sea water intrusion. In this graph, it appears that the general intrusion has occurred in all regions, though most are still located at a depth that is not too deep. But there are three points that invite attention area, namely point GL-4, GL-6 and GN-2. GL-4 are the points that are in the area and most KarangTempel severe because of sea water intrusion occurs to a depth of 45 meters. The next point of GL-6 that was in KarangKidul region happened intrusion to a depth of 17 meters, where the area is not far away of Karang Temple. Then point GN-2 is located in the Marina area, adjacent areas with the intrusion of the beach and to a depth of 22 meters.
Figure 5. Graph of Estimation sea water intrusion distribution to a depth
Based on the graph in Figure 5 can be made contour distribution of sea water intrusion in the region Semarang the north (figure 6). Figure 6 is a contour distribution of the alleged intrusion in Semarang dioverlay northern part of the contour topographic and geological maps. Based on the contour, apparent that sea water intrusion occurs in alluvial plains (Qa). This is consistent with the geological conditions Semarang, Semarang namely northern region composed by alluvial generally consists of sand and clay [6].
GL-1, 3 GL-2, 6GL-3, 13
GL-4, 45
GL-5, 8GL-6, 17
GN-1, 8
GN-2, 22
GN-3, 10GN-4, 6GN-5, 10GN-6, 100
1020304050
0 1 2 3 4 5 6 7 8 9 10 11 12 13
Dept
h (m
)
Station
North South
Legend

International Journal of Innovative Research in Advanced Engineering (IJIRAE) ISSN: 2349-2163 Issue 03, Volume 4 (March 2017) www.ijirae.com
_________________________________________________________________________________________________ IJIRAE: Impact Factor Value – SJIF: Innospace, Morocco (2016): 3.916 | PIF: 2.469 | Jour Info: 4.085 |
ISRAJIF (2016): 3.715 © 2014- 17, IJIRAE- All Rights Reserved Page -77
Figure 6. Overlay between (a) topography Contour,
(b) Distribution of sea water intrusion contour and (c) geological map.
IV. CONCLUSIONS Based on the analysis of resistivity in the area of research, we can conclude that almost all Semarang northern part has been exposed to sea water intrusion indicated by the low resistivity between 0-7 Ωm at a depth of 0-45 meters. The greatest intrusion area located on the southeast side, namely in the area of the KarangTempel with a depth of intrusion reached 45 meters, so the quality of water in this area is estimated to have undergone a change.
ACKNOWLEDGMENT
We thankfully appreciate for support from Ardaneswari have upon his geoelectric data as supporting this research.
REFERENCES
[1] Nisa, K., Tony. Y. and Sugeng W., “AplikasiMetodeGeolistrikTahananJenisuntukMenentukanZonaIntrusi Air Laut di KecamatanGenuk Semarang”, Journal BerkalaFisika, Vol. 15, No.1, Page 7-14, 2012.
[2] AASA, Towards A Sustainable Asia :Enviroment and Climate Change, Science Press Beijing, Republik of Korea, Page 52, 2011.
[3] Rahmawati, N., Jean-Francois, V. and Ignasius, L.S.P., “Salt intrusion in Coastal and Lowland areas of Semarang City”, Journal of Hydrology, Vol. 494, Page 146-159, 2013
[4] Ardaneswari, T.A., Tony, Y. and Thomas, T.P., “AnalisisIntrusi Air LautMeggunakan Data ResistivitasdanGeokimia Air tanah di DataranAluvial Kota Semarang”, Youngster Physics Journal, Vol. 5, No. 4, Page 335-350. 2016,
[5] Telford, M.W., Geldart L.P., Sheriff R.E., Keys D.A., Applied Geophysics, Cambridge University Press, USA, 1990. [6] Setyawan A., Najib, Yoga, A., Agnis, T., Dhana, H., Fitra, R., Fajar, W., Ganap, F., and Galang, V., “Sea Water
Intrusion in Kaligawe Semarang Based on Resistivity Data,”in 2nd International Conference on Tropical and Coastal Region Eco Development, 2016, IOP Publishing, Series : Earth and Enviromental Science 55.
Information : Qa : Alluvium Qtd :Damar Formation
N
(a)
(b)
(c)


![RESISTIVITY [ ]](https://img.pdfslide.net/doc/110x75/6249524a7a9f6a12787a8128/resistivity-.jpg)


