Embed Size (px)
Citation preview
Effects of climate change and deforestation on
potential carbon sequestration and its implication in
forest landscape restoration
World Agroforestry Centre (ICRAF)
Nairobi, March 14, 2016
aWorld Agroforestry Centre (ICRAF), United Nations Avenue, P.O. Box 30677-00100, Nairobi, Kenya bInstitute of Geography, Friedrich-Alexander-University Erlangen-Nuremberg, Wetterkreuz 15, 91058
Erlangen, Germany
Mulugeta Mokriaa,b, Dr. Aster Gebrekirstosa , Dr. Ermias Aynekulua, Prof. Dr.
Achim Bräuningb
World Agroforestry Centre (ICRAF)
Nairobi, March 14, 2016
• Brief introduction (forests, drivers of deforestation and
tree mortality)
• Methodology (site description, field, laboratory and
modeling analysis)
• Results (carbon stock, sequestration, growth rate,
impact, resilience and range of ecotone shift)
• Management and restoration implications
Outline
World Agroforestry Centre (ICRAF)
Nairobi, March 14, 2016
• Tropical forests and agroforests: an important biome,
to stabilize atmospheric carbon cycle and to minimize
climate change impact
• Continued to be degrade due to livelihood related
issues and climate change
• Become major carbon sources and accelerating global
climate change
• There is a need to understand the drivers, processes
and impacts to suggest possible policy and
management options
Introduction
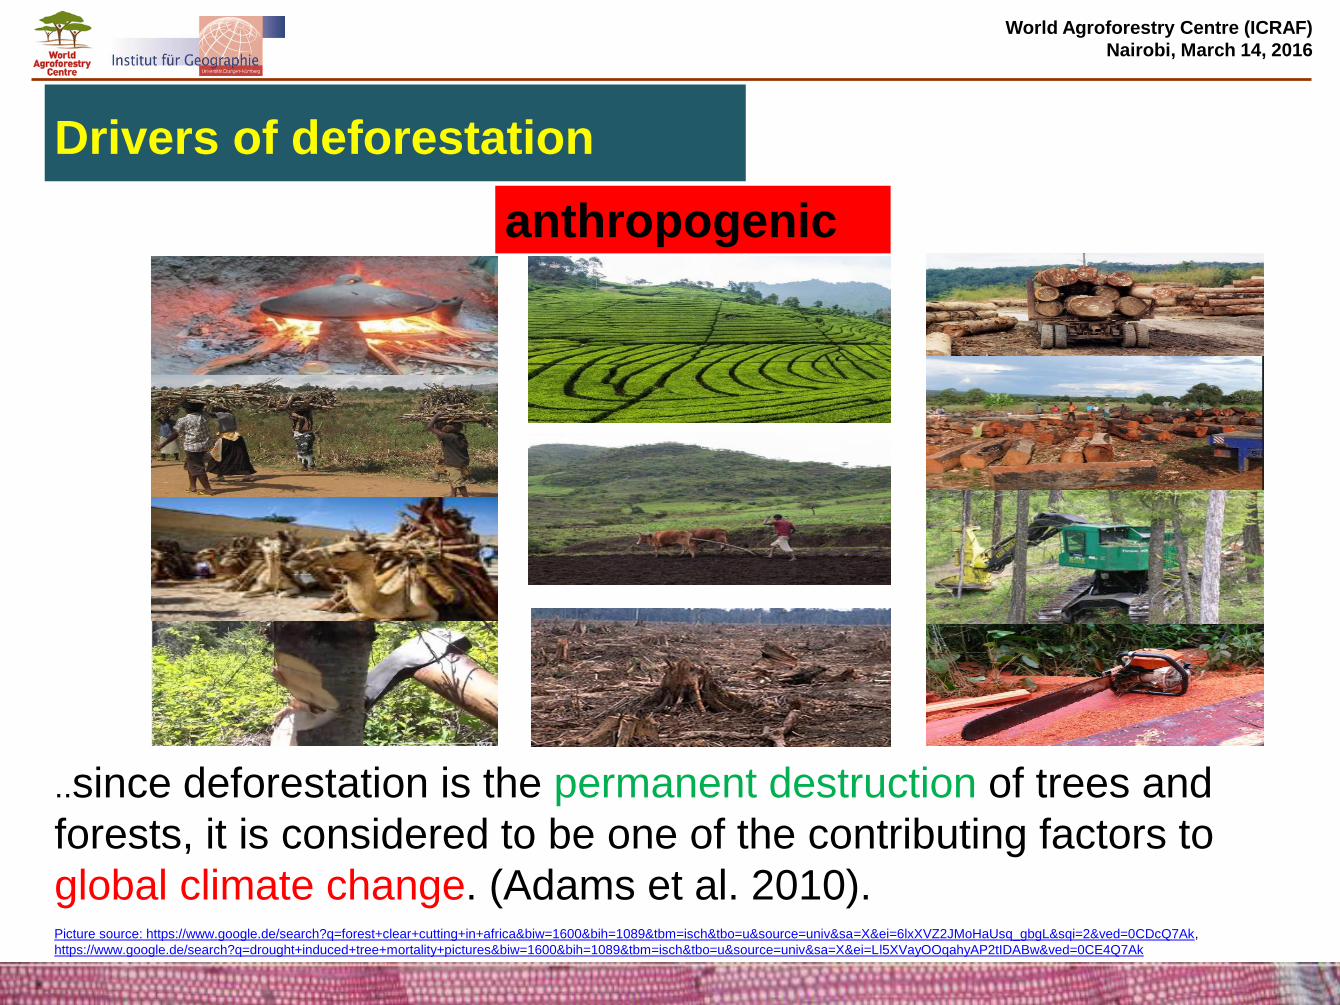
Drivers of deforestation
Picture source: https://www.google.de/search?q=forest+clear+cutting+in+africa&biw=1600&bih=1089&tbm=isch&tbo=u&source=univ&sa=X&ei=6lxXVZ2JMoHaUsq_gbgL&sqi=2&ved=0CDcQ7Ak,
https://www.google.de/search?q=drought+induced+tree+mortality+pictures&biw=1600&bih=1089&tbm=isch&tbo=u&source=univ&sa=X&ei=Ll5XVayOOqahyAP2tIDABw&ved=0CE4Q7Ak
World Agroforestry Centre (ICRAF)
Nairobi, March 14, 2016
anthropogenic
..since deforestation is the permanent destruction of trees and
forests, it is considered to be one of the contributing factors to
global climate change. (Adams et al. 2010).
World Agroforestry Centre (ICRAF)
Nairobi, March 14, 2016
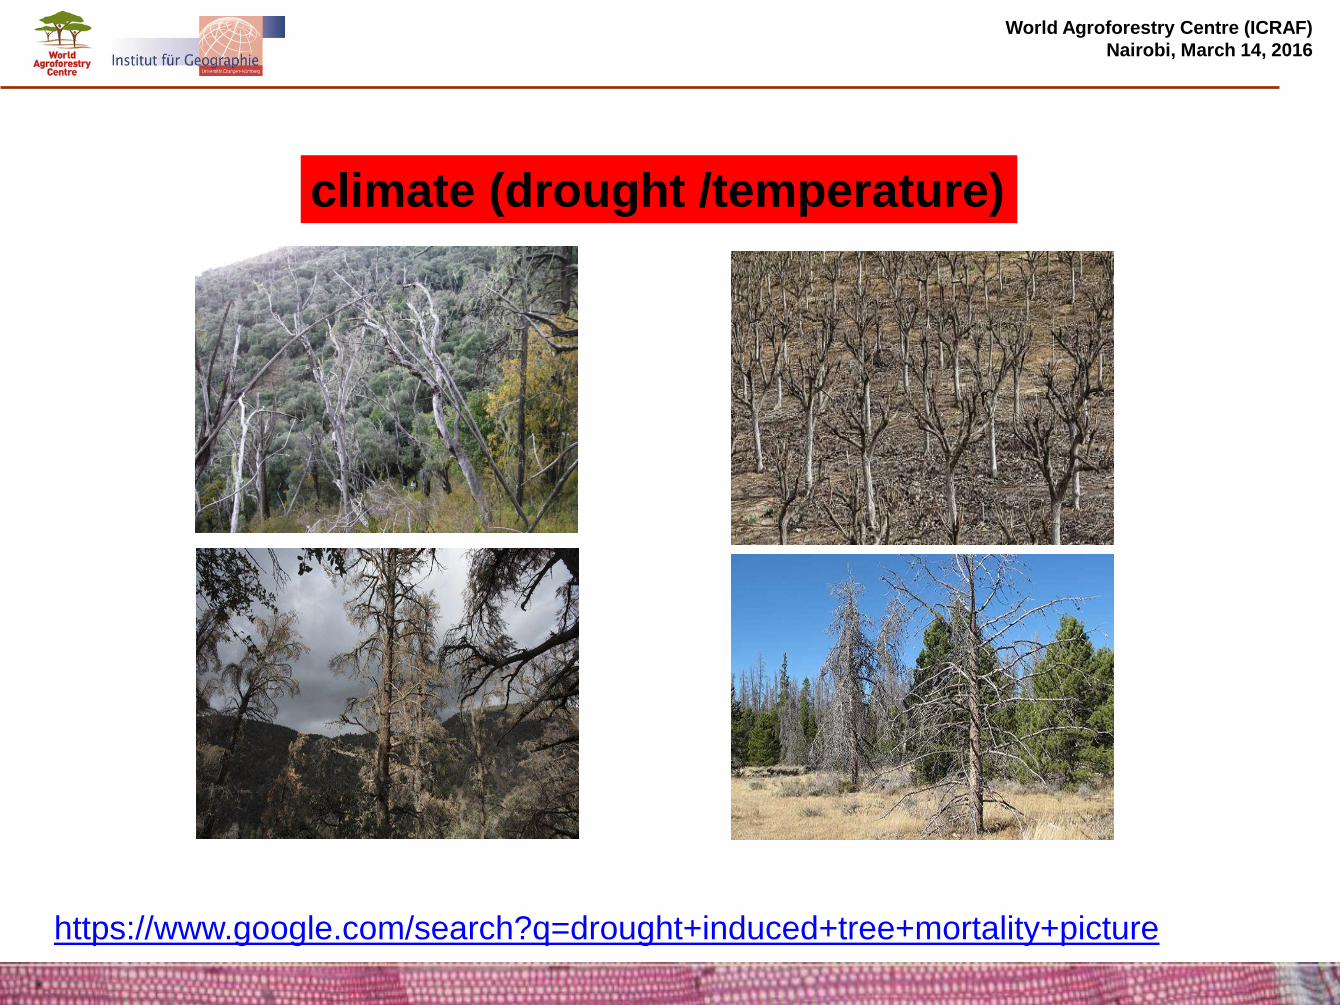
climate (drought /temperature)
https://www.google.com/search?q=drought+induced+tree+mortality+picture
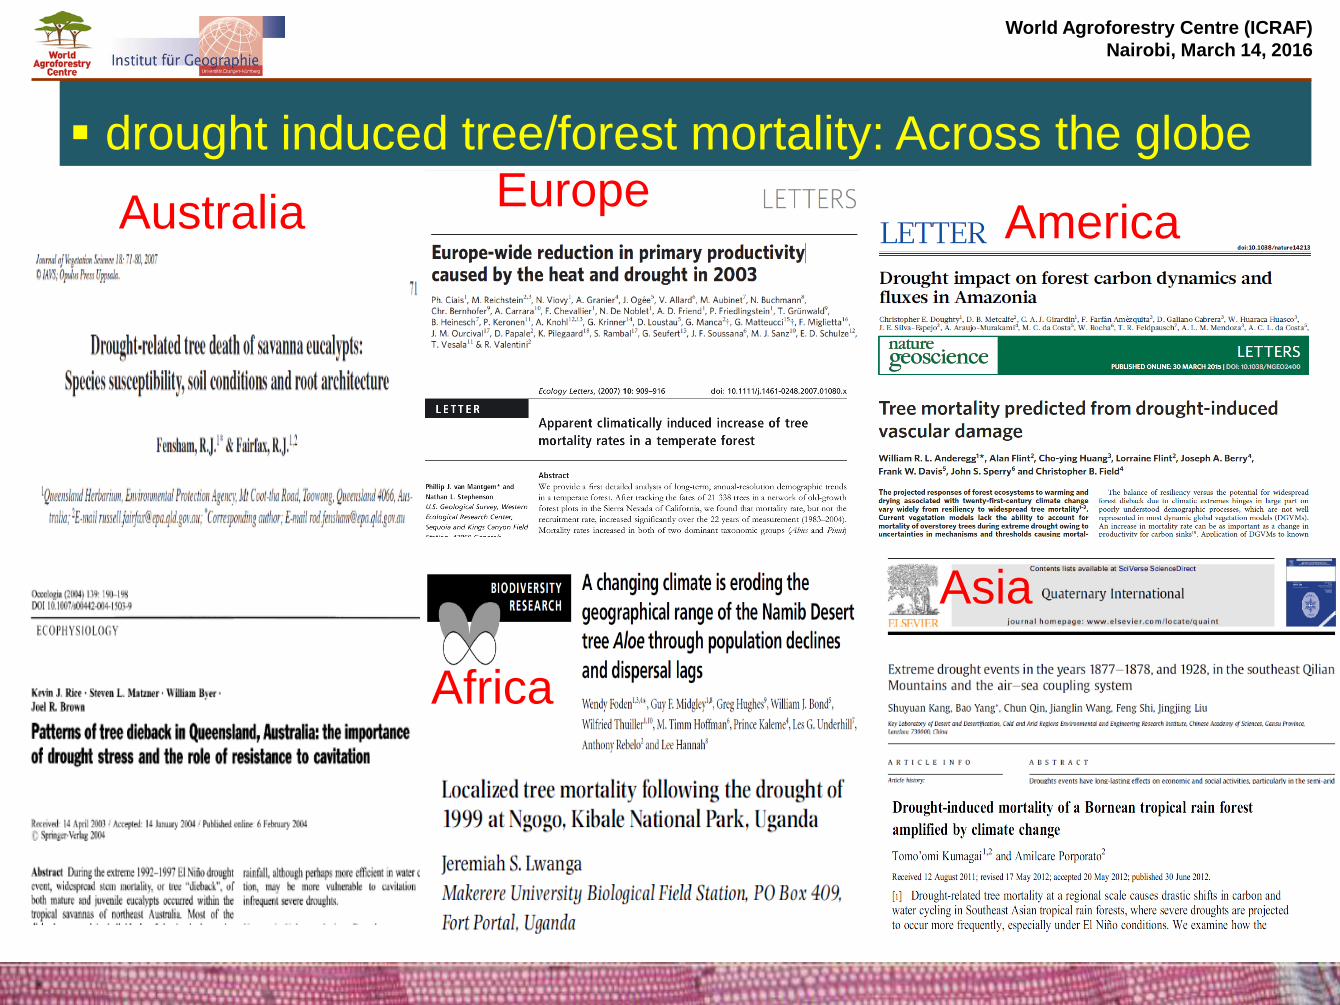
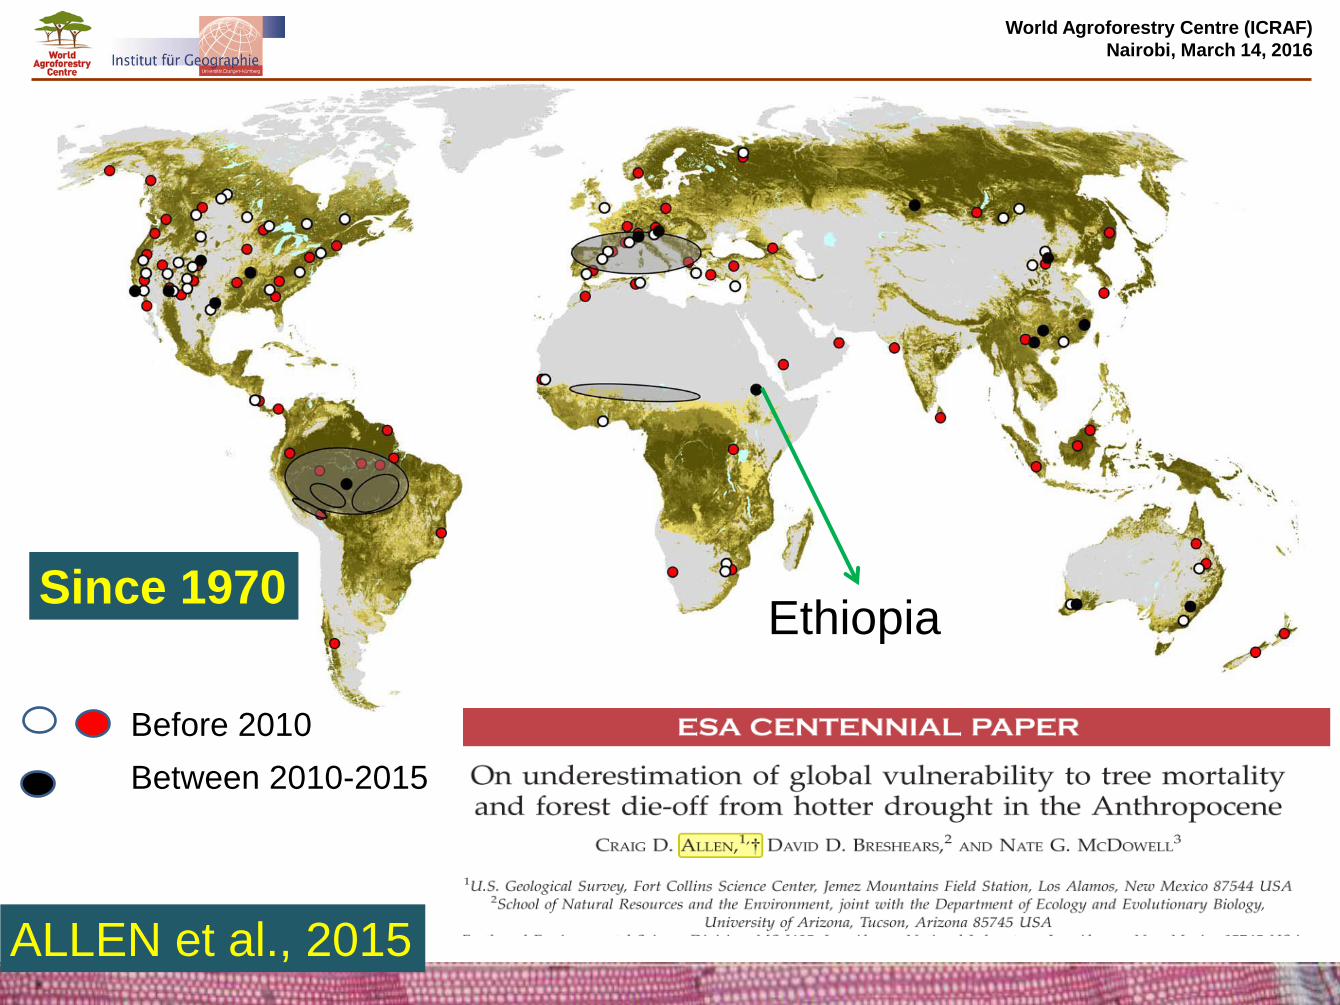
drought induced tree/forest mortality: Across the globe
Australia Europe
Africa
Asia
World Agroforestry Centre (ICRAF)
Nairobi, March 14, 2016
America
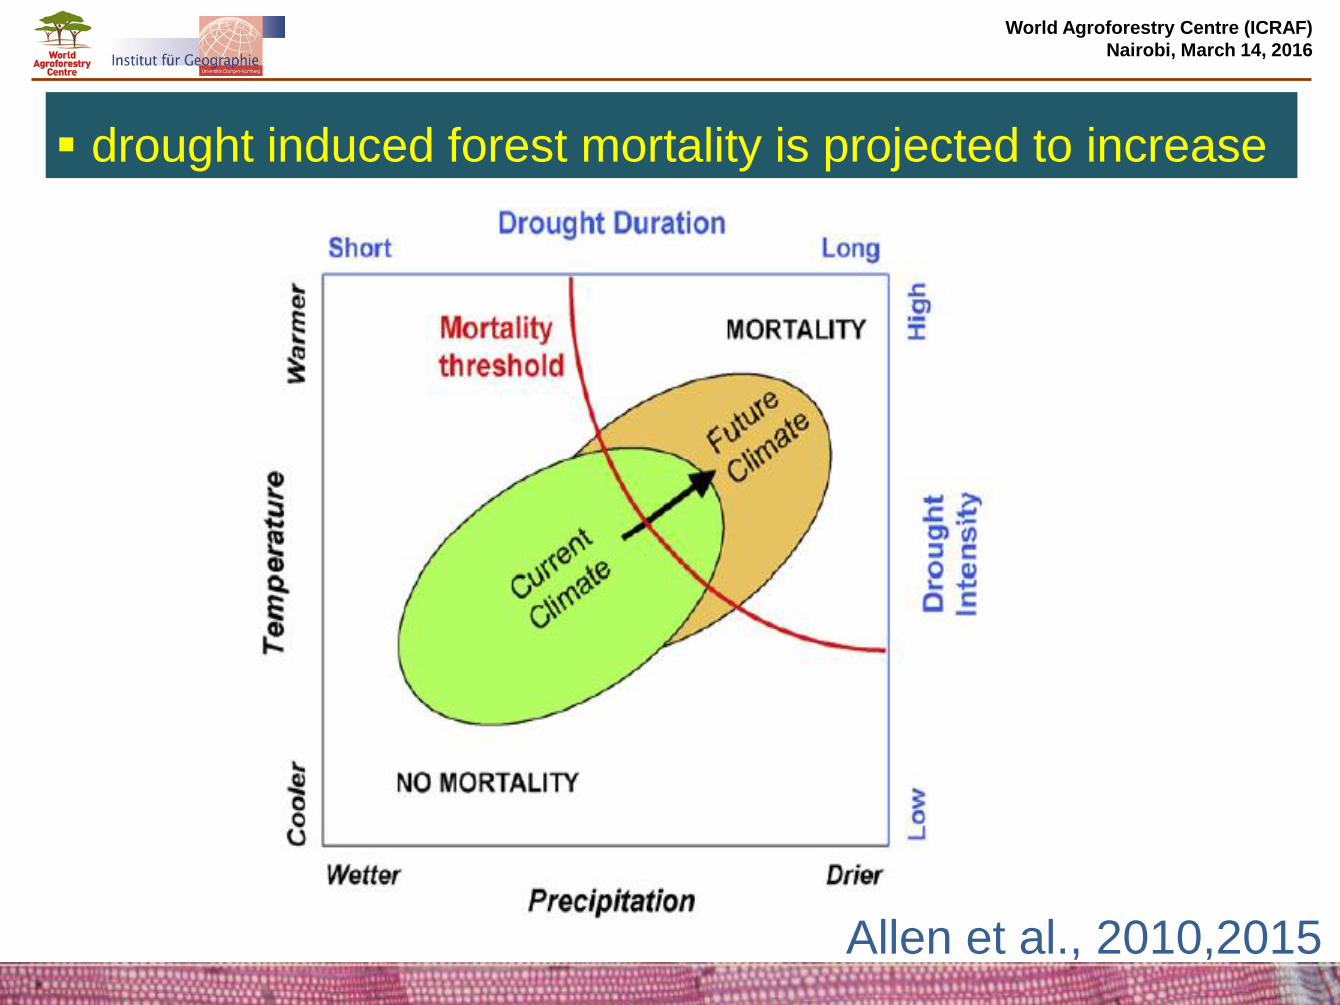
drought induced forest mortality is projected to increase
World Agroforestry Centre (ICRAF)
Nairobi, March 14, 2016
Allen et al., 2010,2015
World Agroforestry Centre (ICRAF)
Nairobi, March 14, 2016
Ethiopia
ALLEN et al., 2015
Since 1970
Before 2010
Between 2010-2015
World Agroforestry Centre (ICRAF)
Nairobi, March 14, 2016
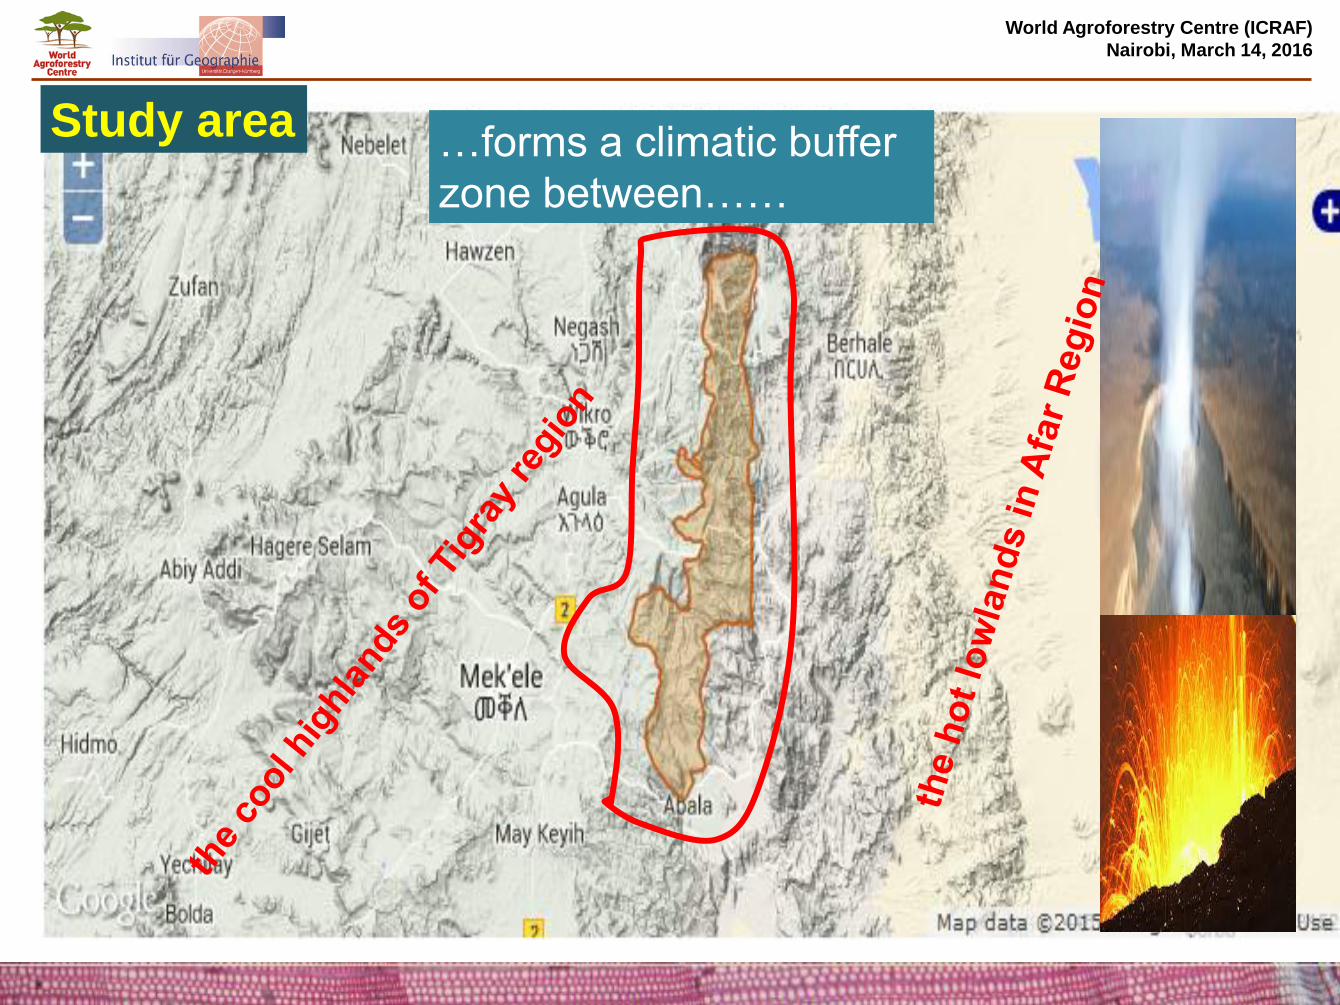
…forms a climatic buffer
zone between……
Study area
World Agroforestry Centre (ICRAF)
Nairobi, March 14, 2016
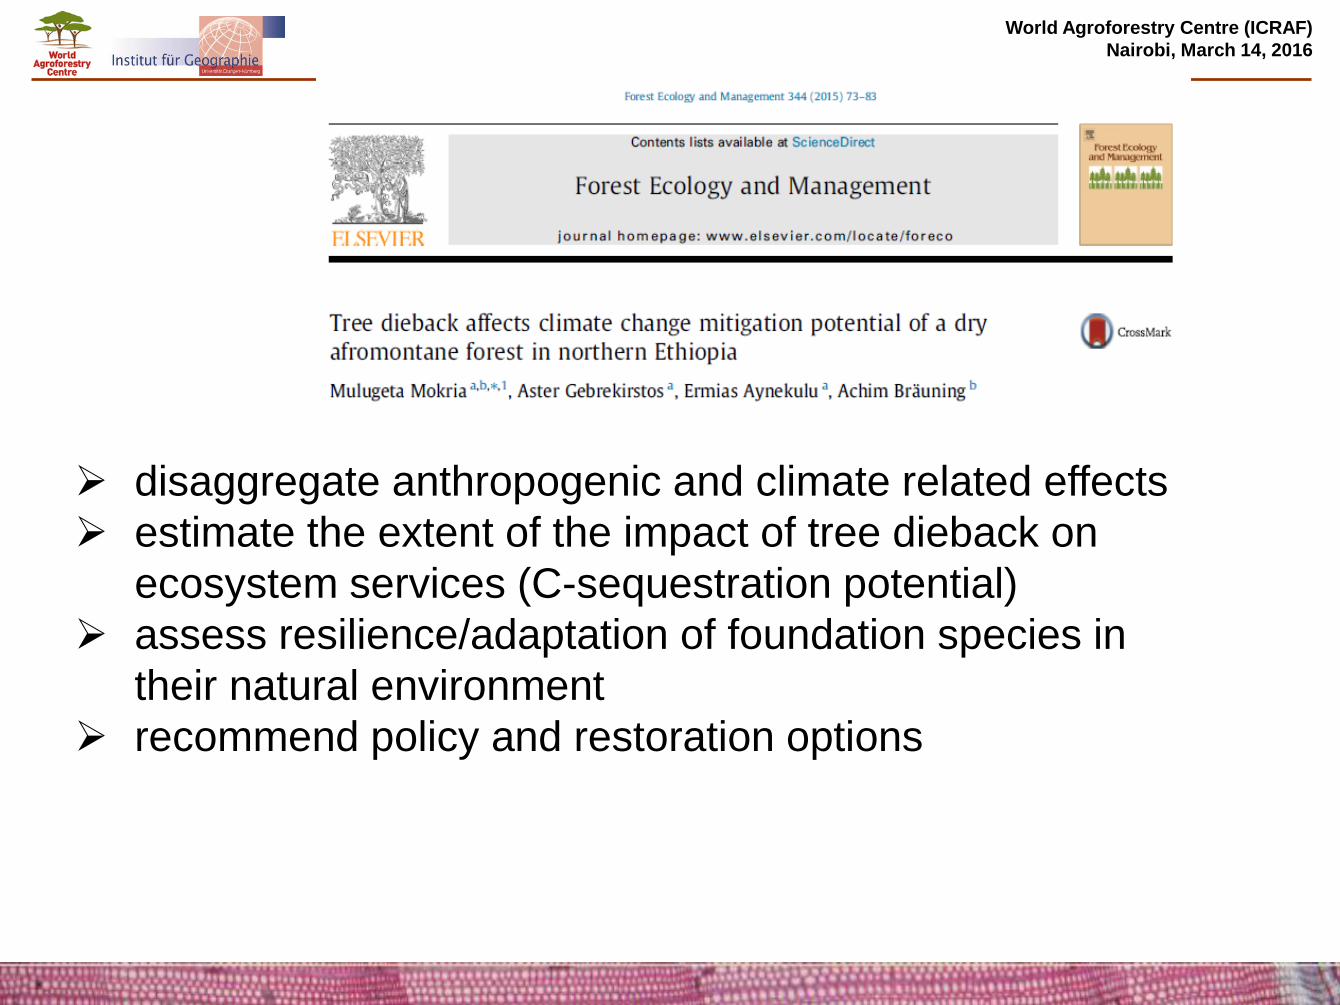
disaggregate anthropogenic and climate related effects
estimate the extent of the impact of tree dieback on
ecosystem services (C-sequestration potential)
assess resilience/adaptation of foundation species in
their natural environment
recommend policy and restoration options
World Agroforestry Centre (ICRAF)
Nairobi, March 14, 2016
https://www.google.com/search
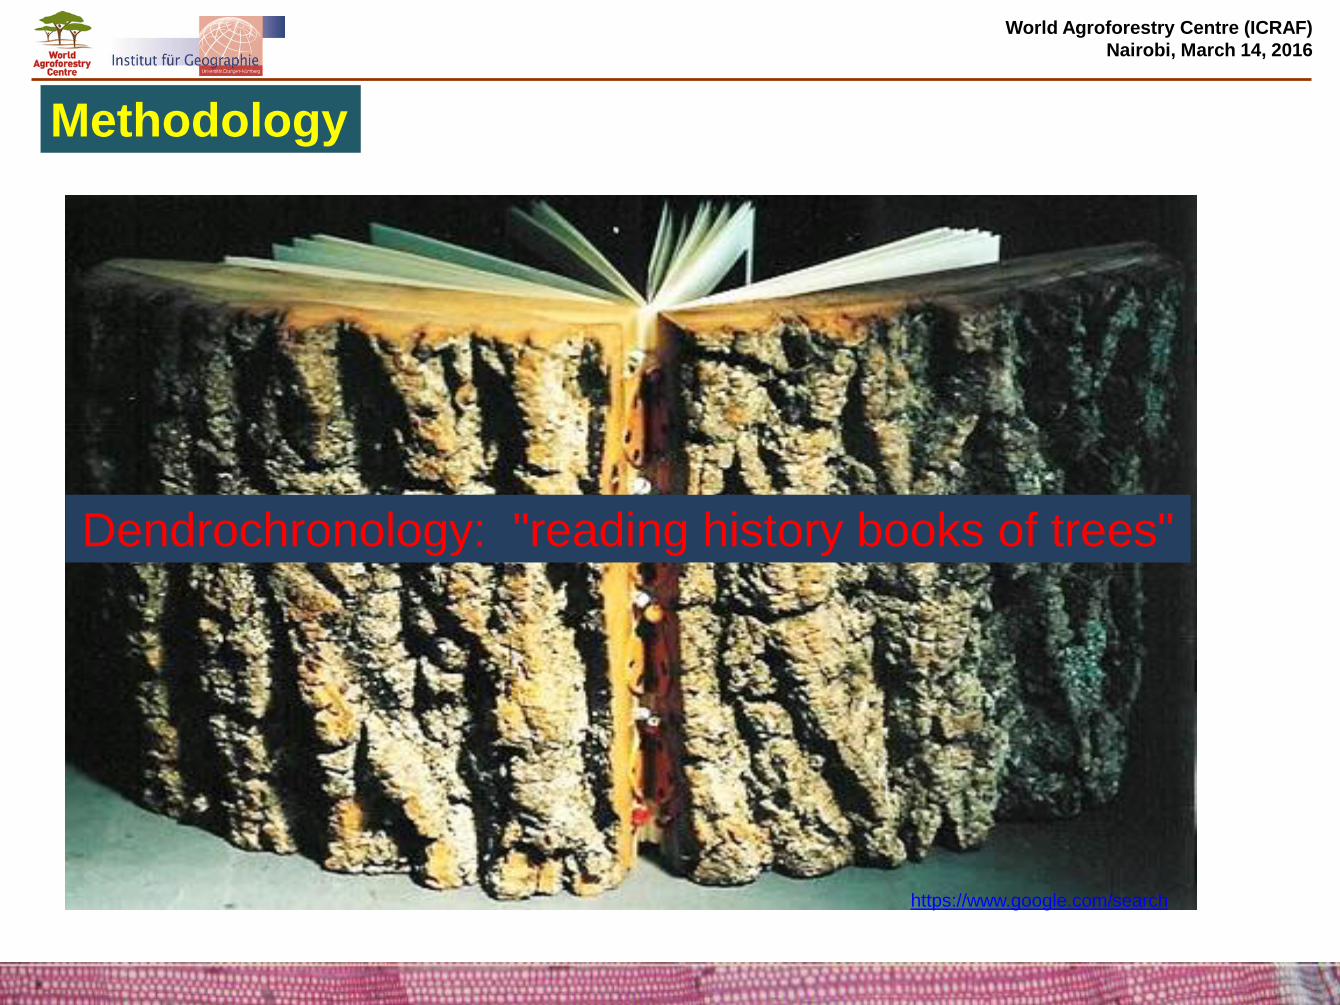
Dendrochronology: "reading history books of trees"
Methodology
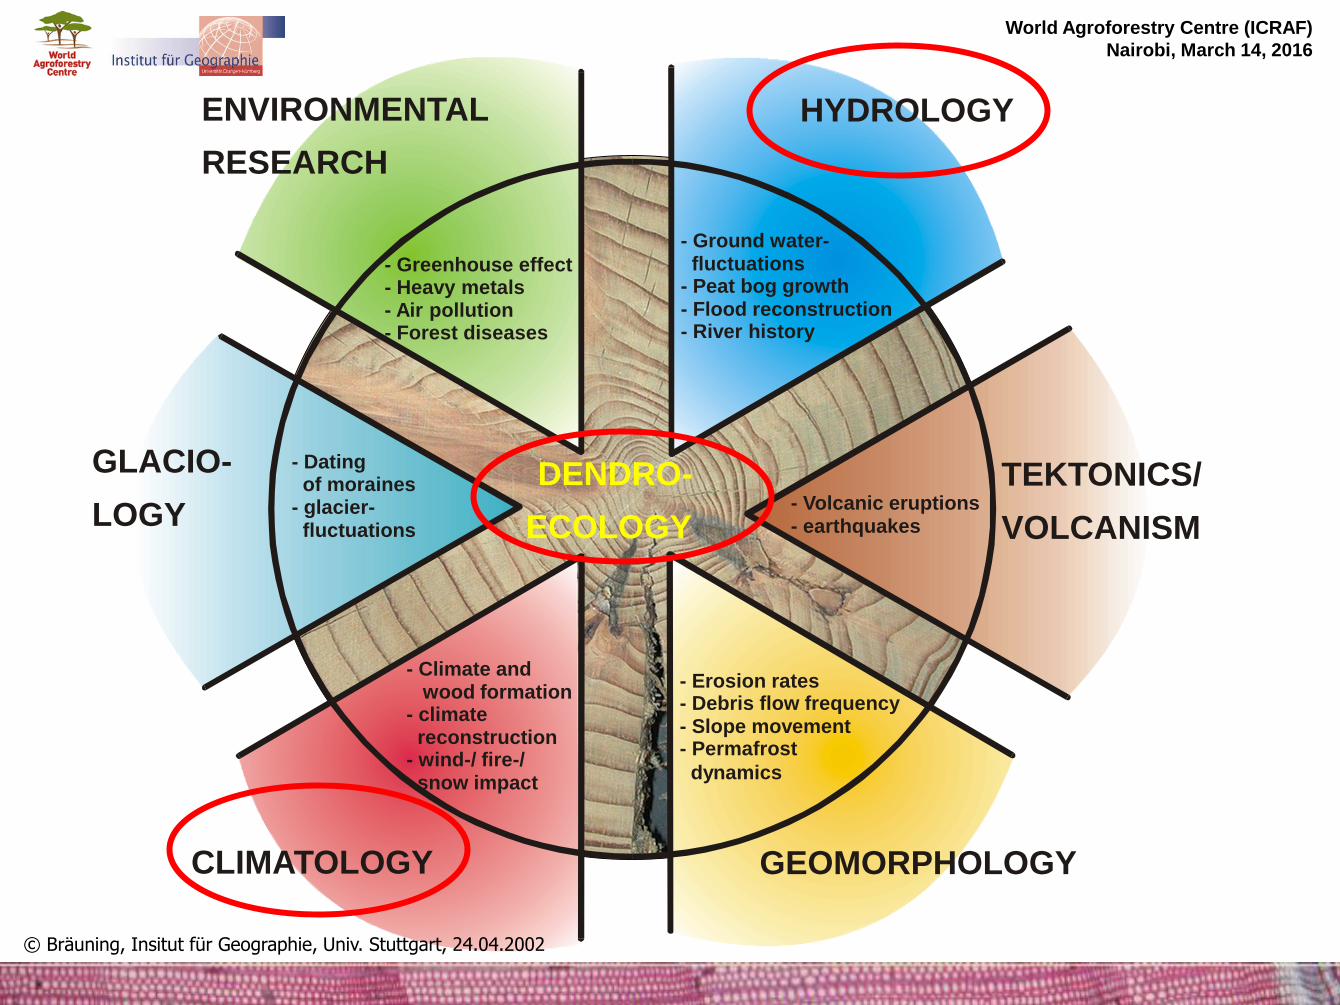
- Greenhouse effect - Heavy metals - Air pollution - Forest diseases
GLACIO-
LOGY
ENVIRONMENTAL
RESEARCH
CLIMATOLOGY GEOMORPHOLOGY
HYDROLOGY
TEKTONICS/
VOLCANISM
DENDRO-
ECOLOGY
- Ground water- fluctuations - Peat bog growth - Flood reconstruction - River history
- Dating of moraines - glacier- fluctuations
- Climate and wood formation - climate reconstruction - wind-/ fire-/ snow impact
- Erosion rates - Debris flow frequency - Slope movement - Permafrost
dynamics
- Volcanic eruptions - earthquakes
© Bräuning, Insitut für Geographie, Univ. Stuttgart, 24.04.2002
World Agroforestry Centre (ICRAF)
Nairobi, March 14, 2016
Interview with local people and experts in the area:
Their local knowledge about the forest and their
perception
Drivers of deforestation
Change in climate and its impacts
When the tree dieback started and its trend
World Agroforestry Centre (ICRAF)
Nairobi, March 14, 2016
Method- field data collection
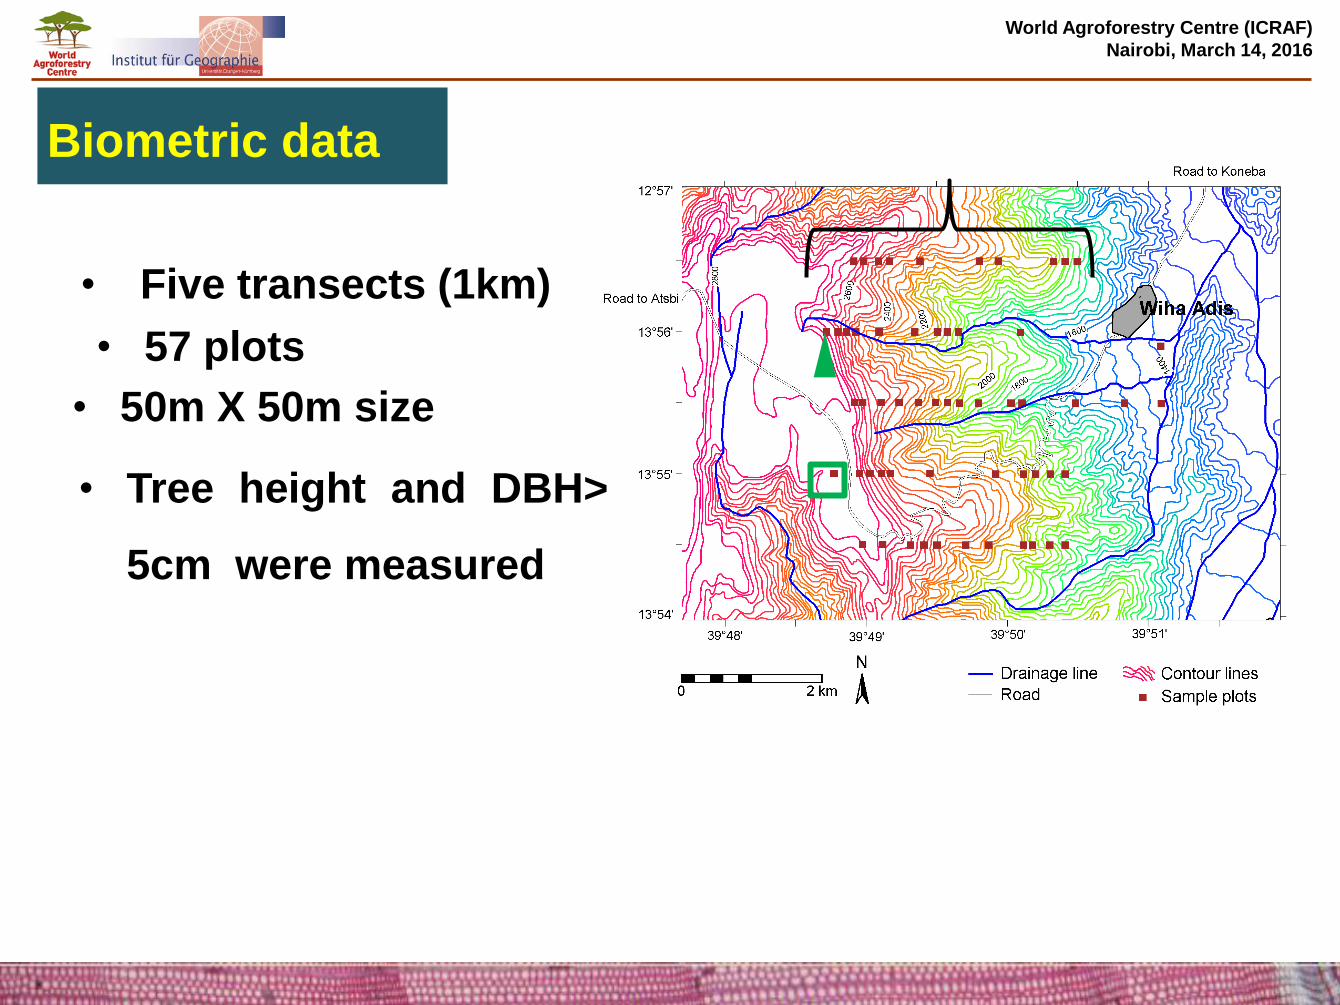
Biometric data
• Five transects (1km)
• 57 plots
• 50m X 50m size
• Tree height and DBH>
5cm were measured
World Agroforestry Centre (ICRAF)
Nairobi, March 14, 2016
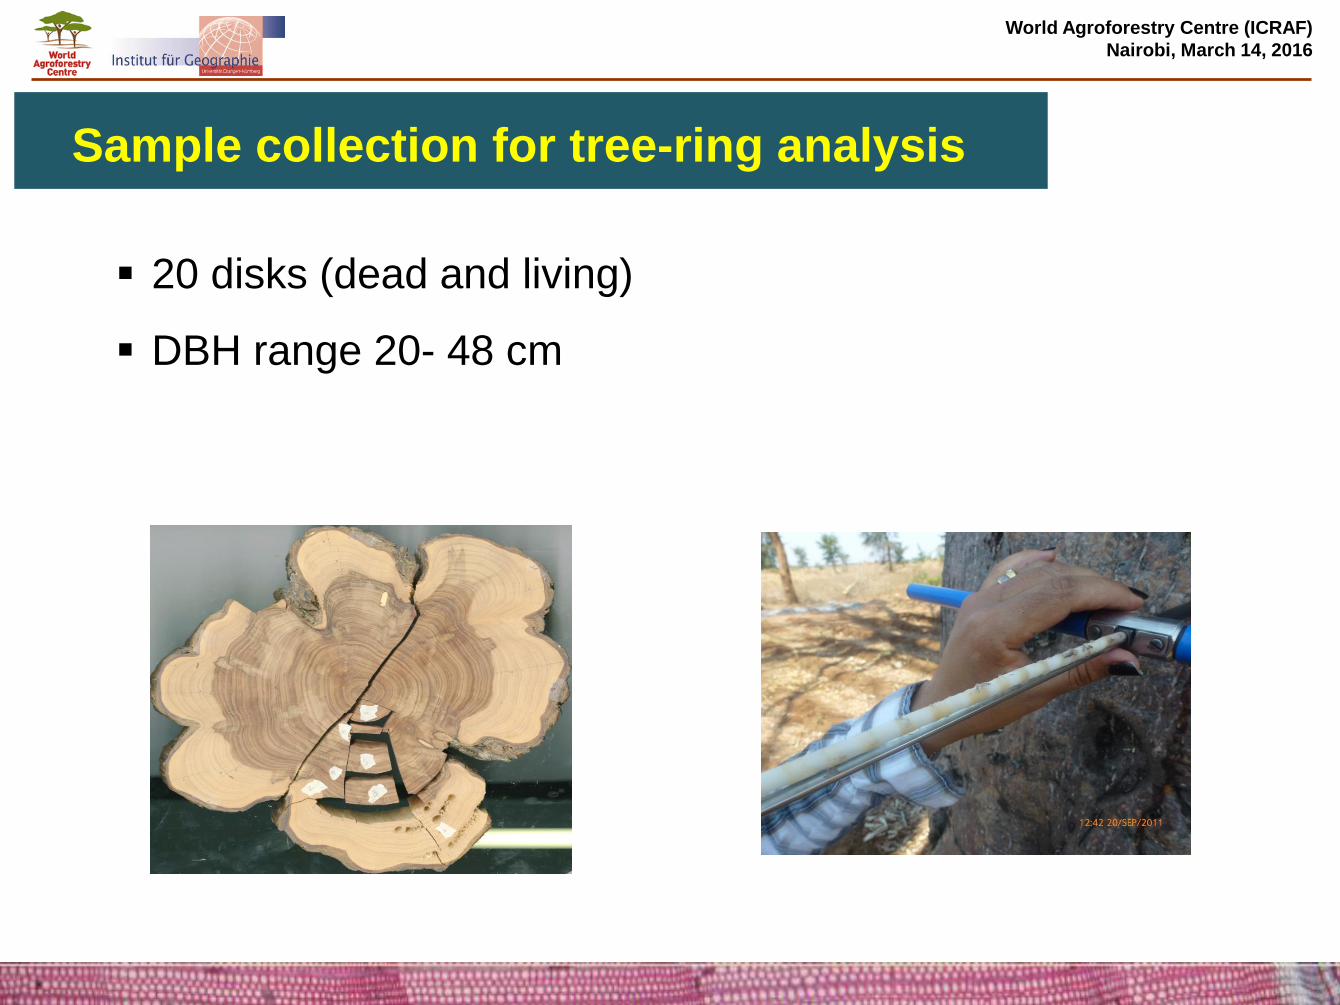
Sample collection for tree-ring analysis
World Agroforestry Centre (ICRAF)
Nairobi, March 14, 2016
20 disks (dead and living)
DBH range 20- 48 cm
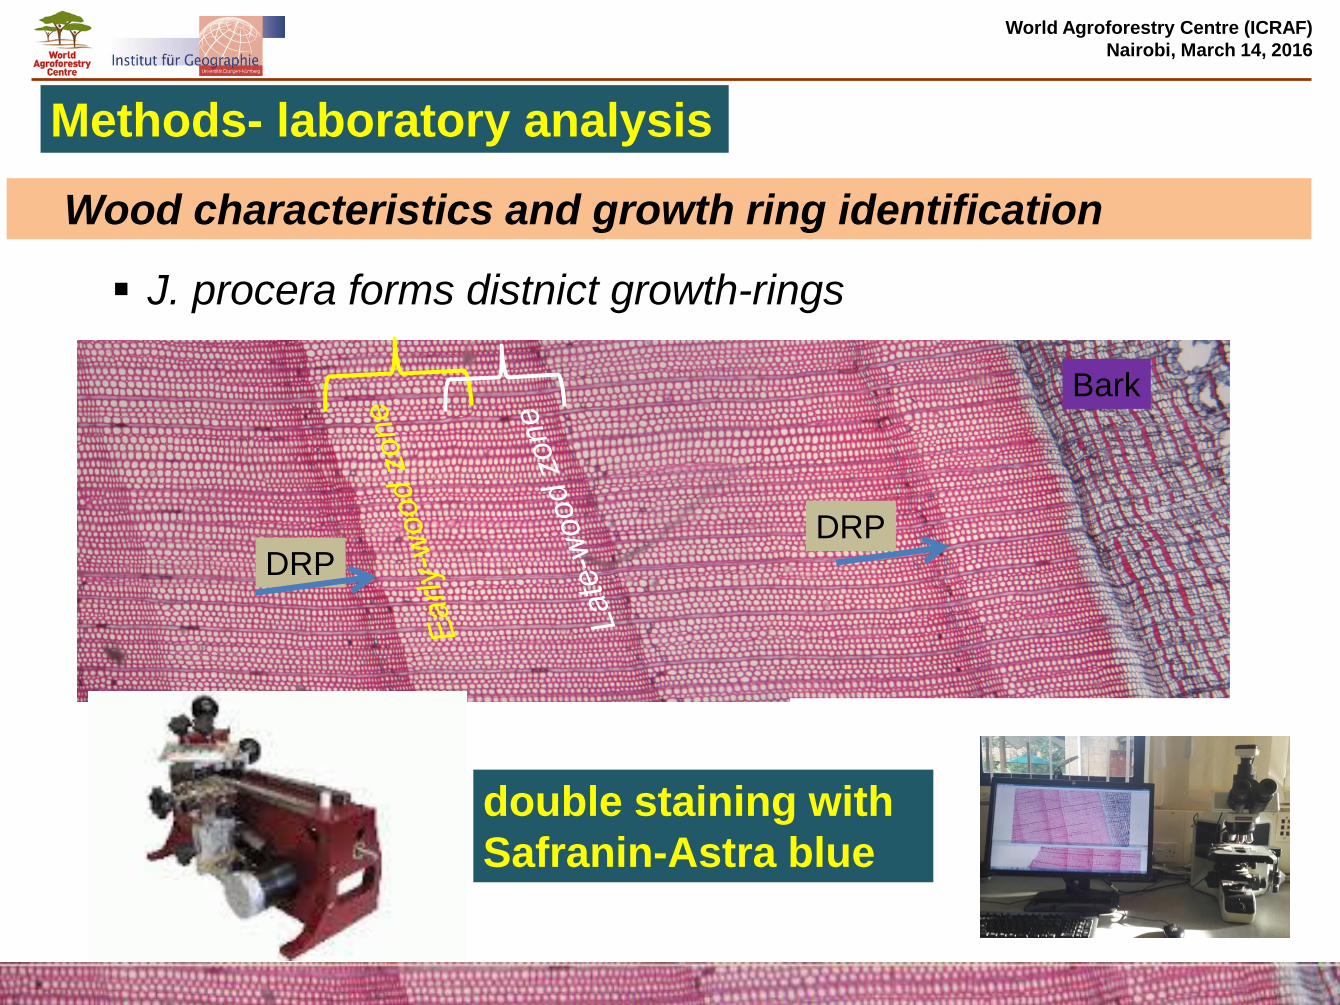
Wood characteristics and growth ring identification
Bark
J. procera forms distnict growth-rings
DRP DRP
World Agroforestry Centre (ICRAF)
Nairobi, March 14, 2016
Methods- laboratory analysis
double staining with
Safranin-Astra blue
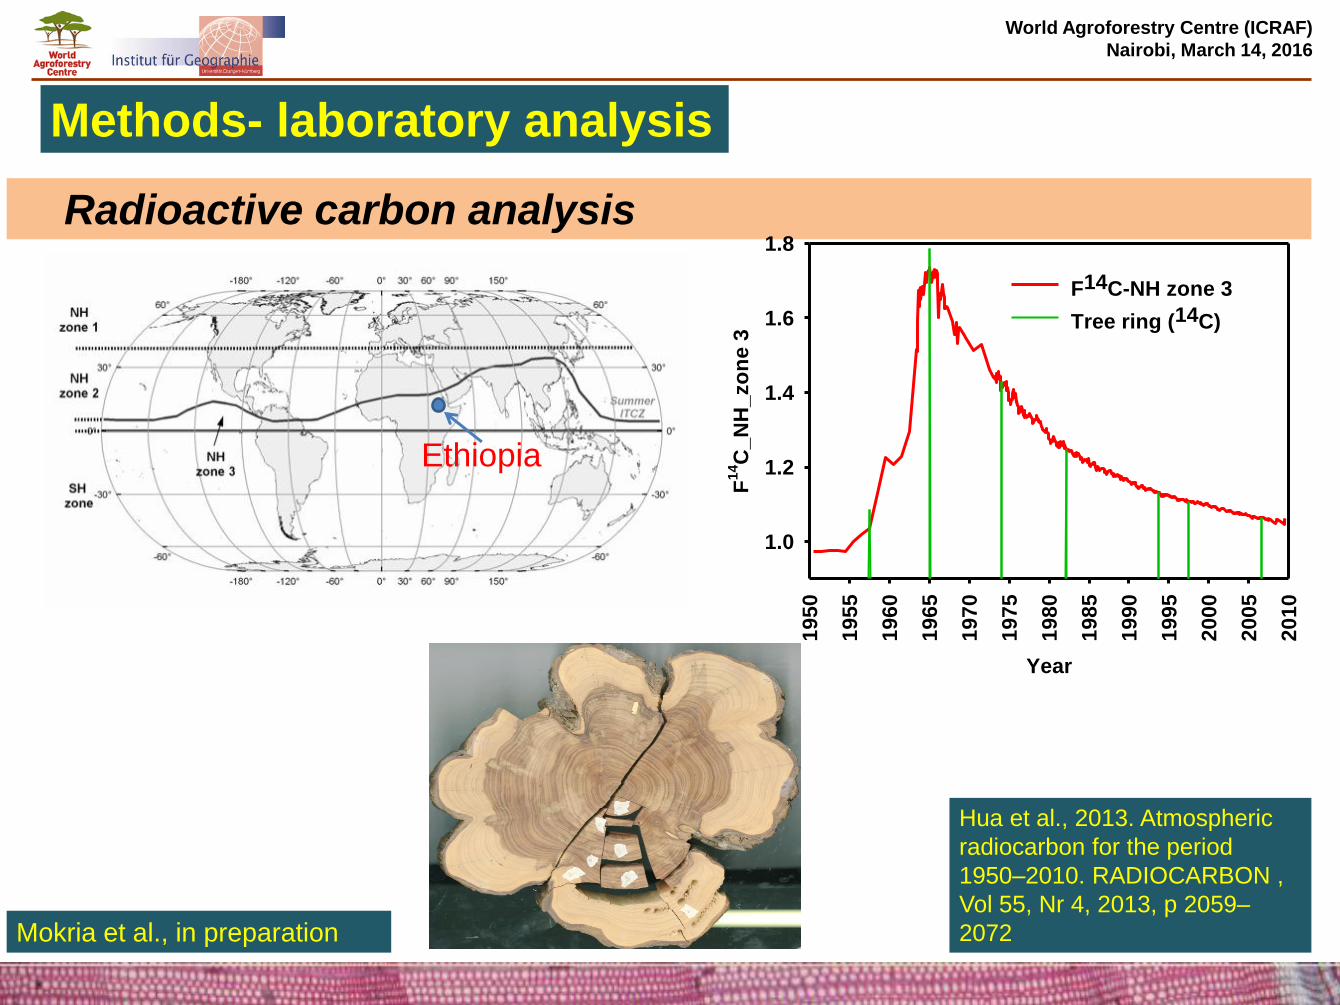
Radioactive carbon analysis
World Agroforestry Centre (ICRAF)
Nairobi, March 14, 2016
Methods- laboratory analysis
Year
19
50
19
55
19
60
19
65
19
70
19
75
19
80
19
85
19
90
19
95
20
00
20
05
20
10
F1
4C
_N
H_
zo
ne
3
1.0
1.2
1.4
1.6
1.8
F14C-NH zone 3
Tree ring (14C)
Ethiopia
Hua et al., 2013. Atmospheric
radiocarbon for the period
1950–2010. RADIOCARBON ,
Vol 55, Nr 4, 2013, p 2059–
2072 Mokria et al., in preparation
World Agroforestry Centre (ICRAF)
Nairobi, March 14, 2016
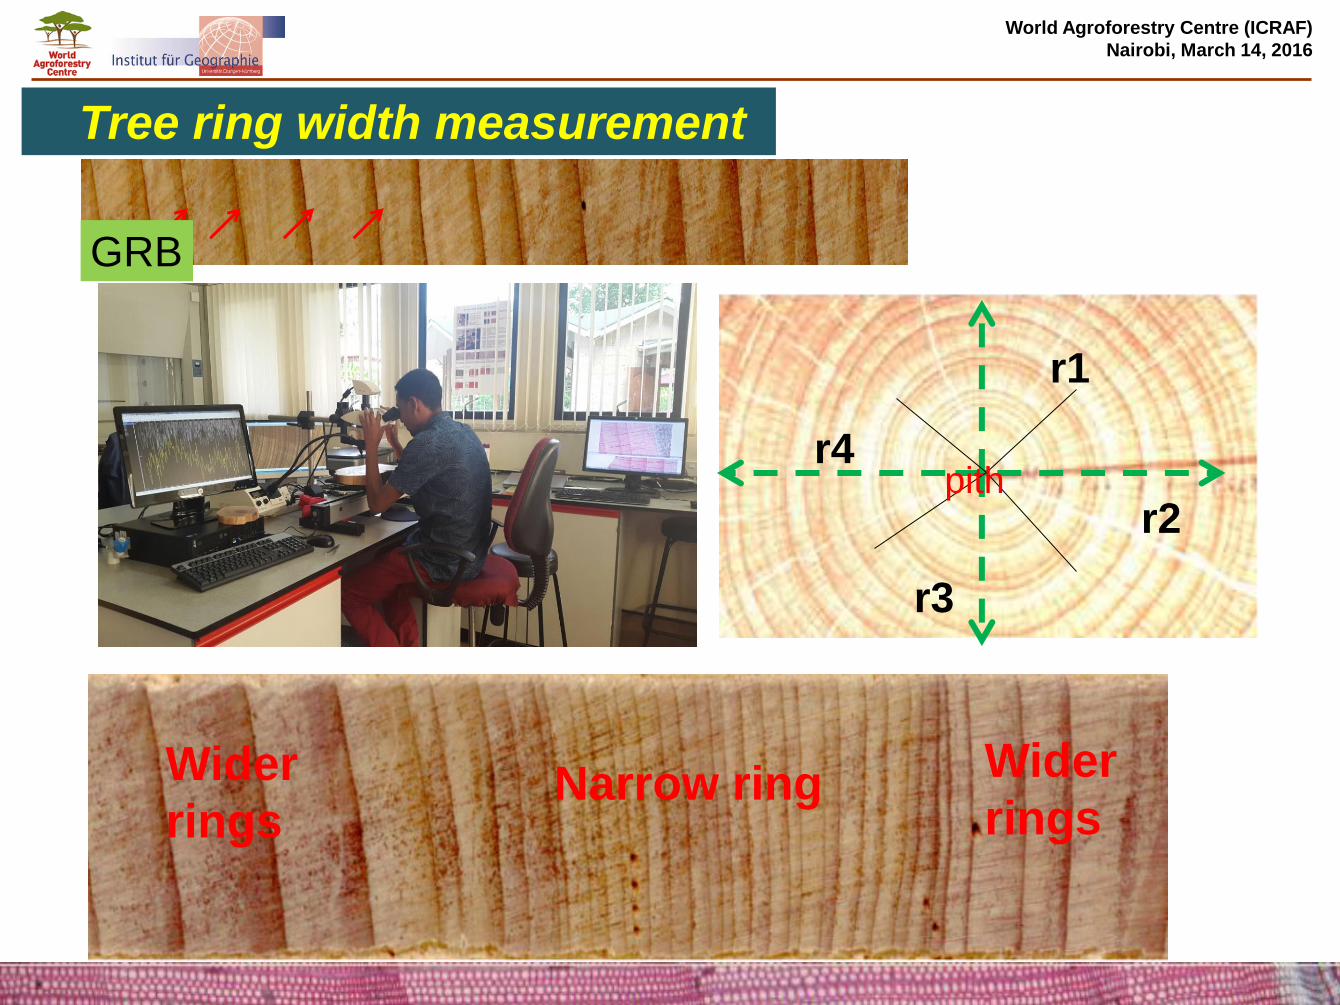
GRB
Wider
rings Narrow ring
Wider
rings
Tree ring width measurement
r1
r2
r3
r4 pith
World Agroforestry Centre (ICRAF)
Nairobi, March 14, 2016
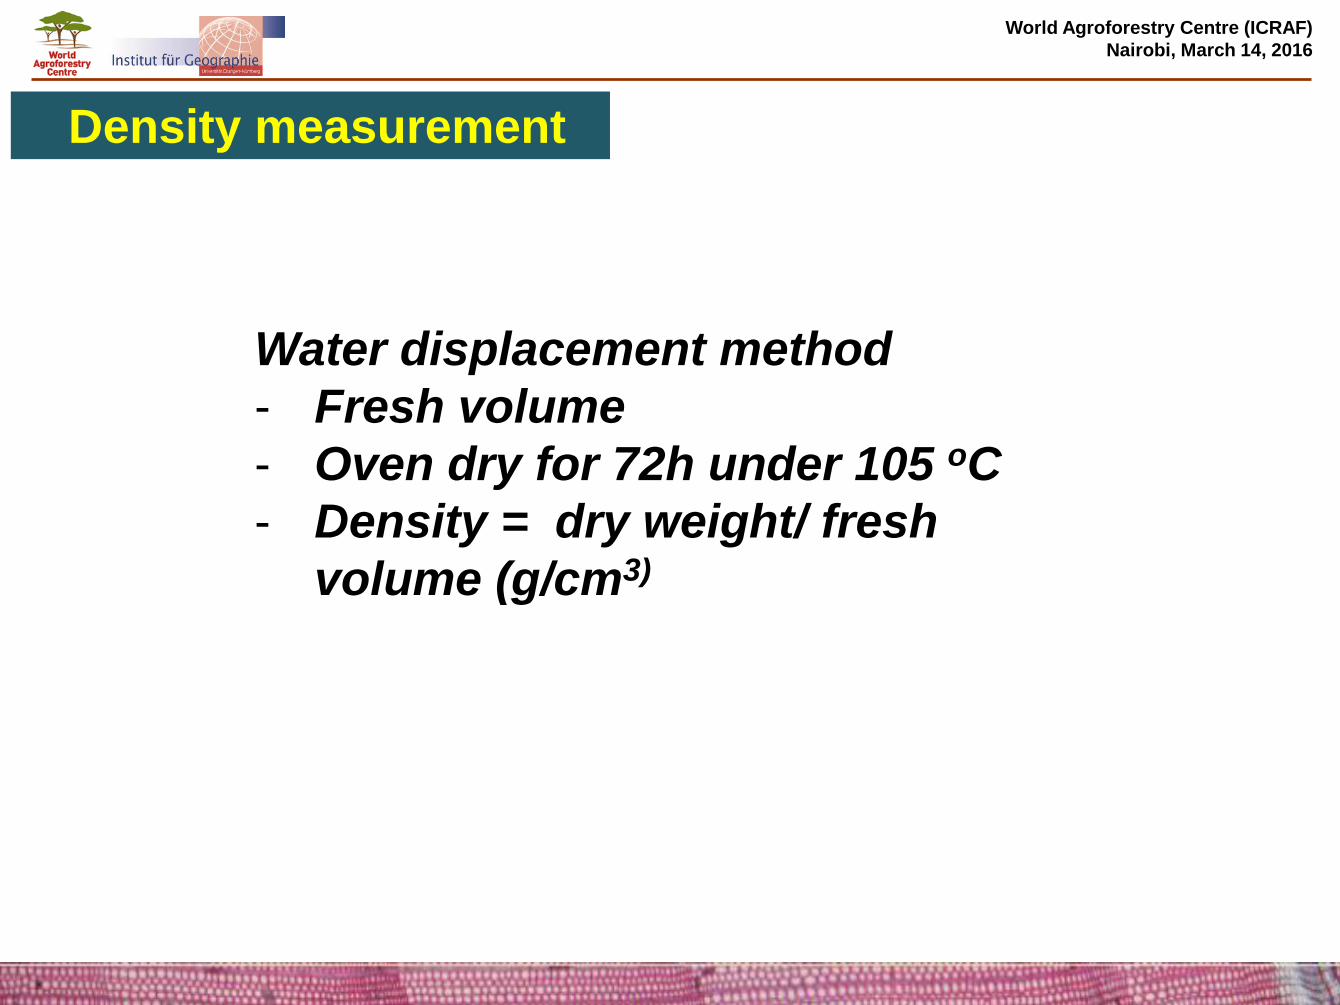
Density measurement
Water displacement method
- Fresh volume
- Oven dry for 72h under 105 oC
- Density = dry weight/ fresh
volume (g/cm3)
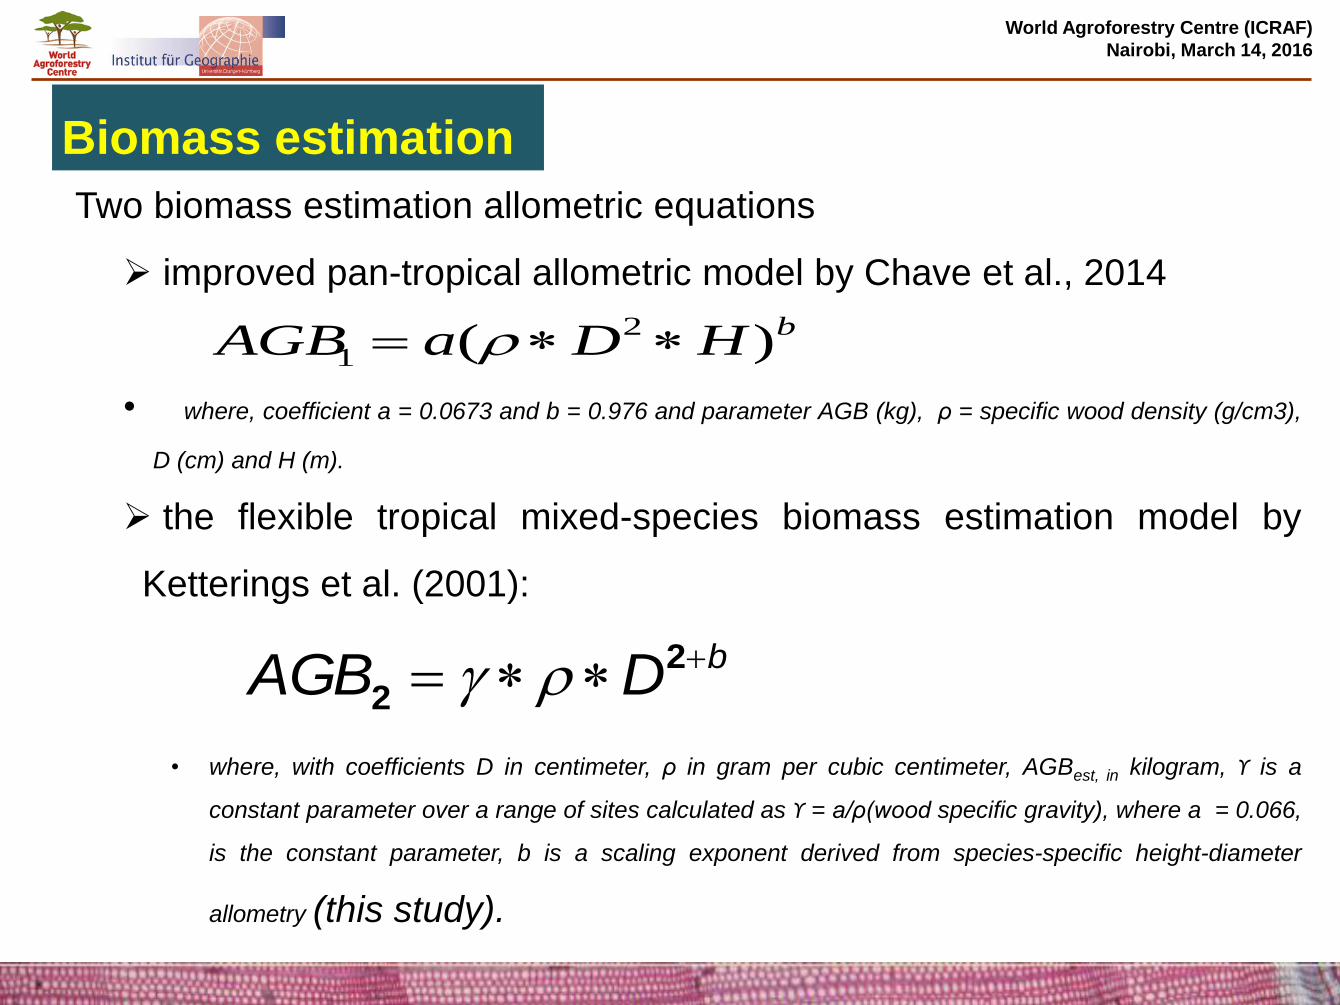
Two biomass estimation allometric equations
improved pan-tropical allometric model by Chave et al., 2014
• where, coefficient a = 0.0673 and b = 0.976 and parameter AGB (kg), ρ = specific wood density (g/cm3),
D (cm) and H (m).
the flexible tropical mixed-species biomass estimation model by
Ketterings et al. (2001):
• where, with coefficients D in centimeter, ρ in gram per cubic centimeter, AGBest, in kilogram, ϒ is a
constant parameter over a range of sites calculated as ϒ = a/ρ(wood specific gravity), where a = 0.066,
is the constant parameter, b is a scaling exponent derived from species-specific height-diameter
allometry (this study).
World Agroforestry Centre (ICRAF)
Nairobi, March 14, 2016
bHDaAGB )( 2
1
bDAGB 2
2
Biomass estimation
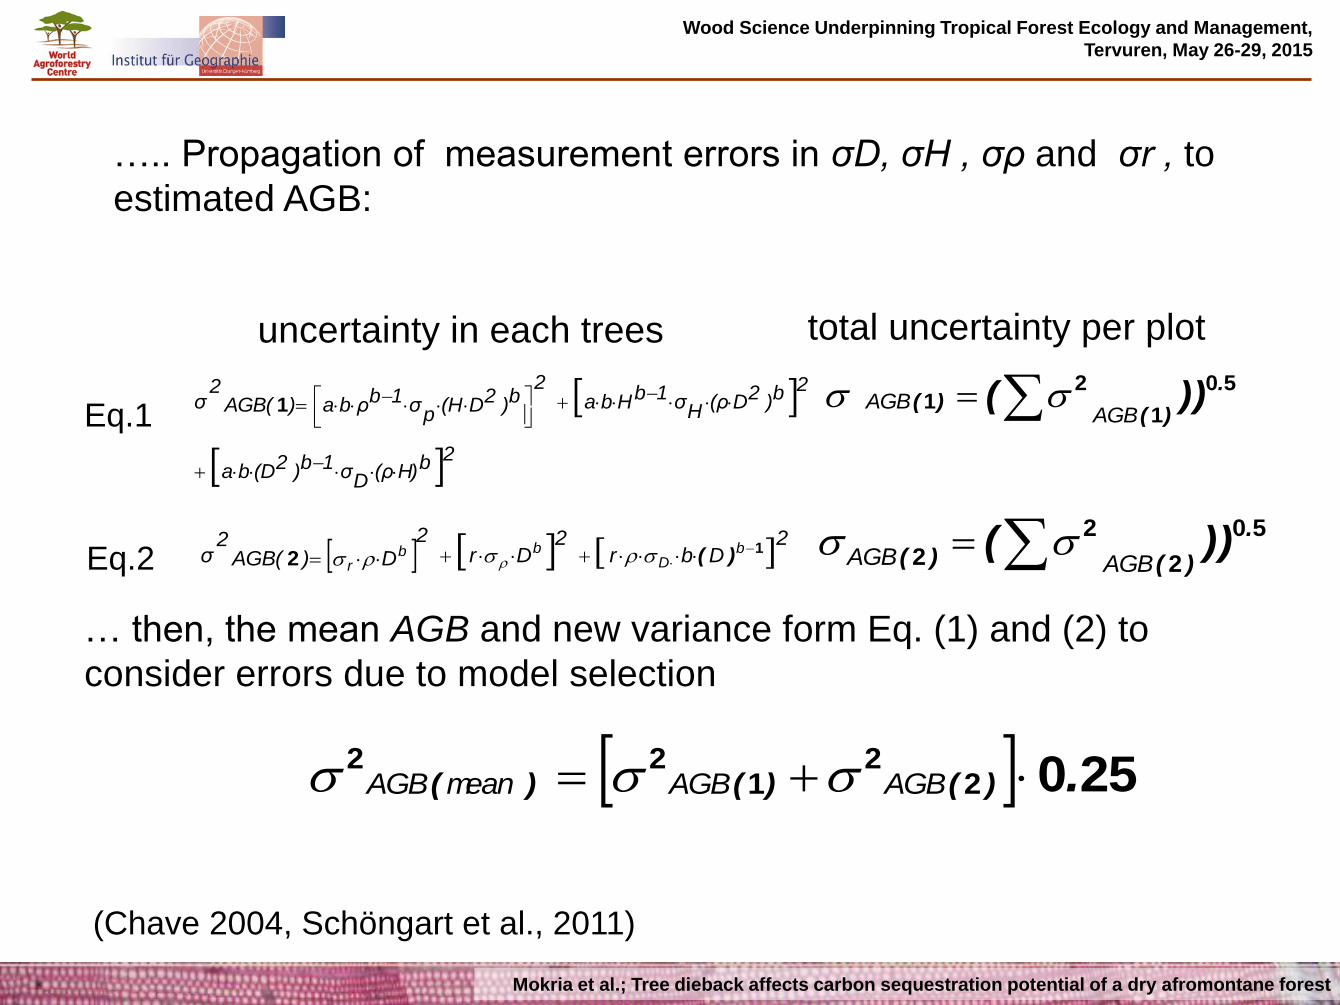
….. Propagation of measurement errors in σD, σH , σρ and σr , to
estimated AGB:
(Chave 2004, Schöngart et al., 2011)
Eq.1
Eq.2
total uncertainty per plot uncertainty in each trees
… then, the mean AGB and new variance form Eq. (1) and (2) to
consider errors due to model selection
Wood Science Underpinning Tropical Forest Ecology and Management,
Tervuren, May 26-29, 2015
Mokria et al.; Tree dieback affects carbon sequestration potential of a dry afromontane forest
2bH)(ρD
σ1b)2(Dba
2b)2D(ρH
σ1bHba2
b)2D(Hp
σ1bρba)AGB(2
σ
1
50
1
21
.
)()( ))(
AGBAGB
2
Dbr2
Dr2
D)AGB(2
σ bD
bbr
12
)(
50
2
2
2
.
)()( ))(AGBAGB
25022
122 .)()()( AGBAGBmeanAGB
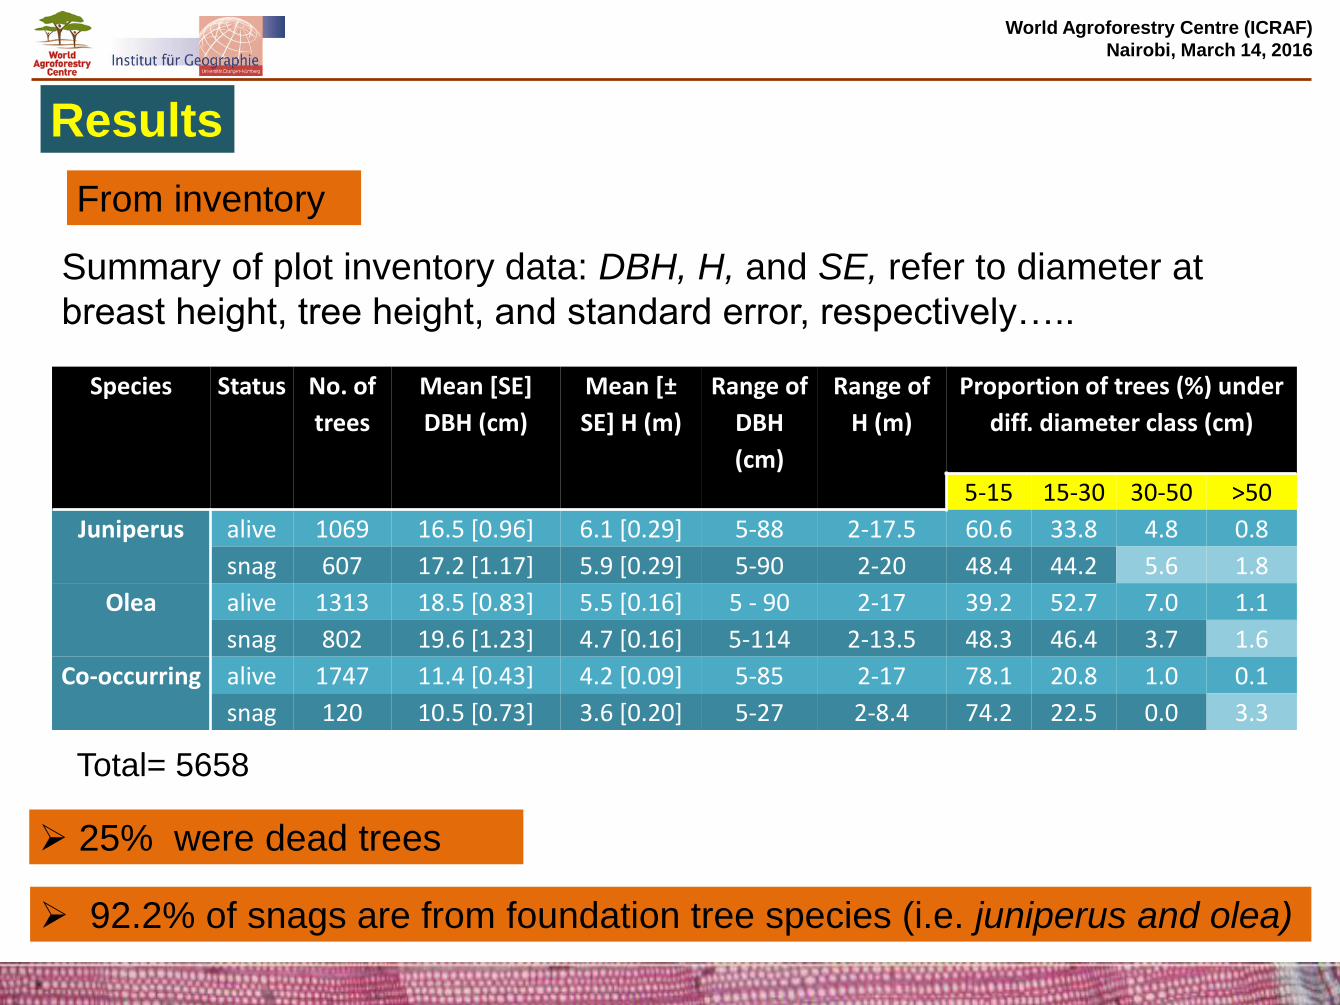
Species Status No. of
trees
Mean [SE]
DBH (cm)
Mean [±
SE] H (m)
Range of
DBH
(cm)
Range of
H (m)
Proportion of trees (%) under
diff. diameter class (cm)
5-15 15-30 30-50 >50
Juniperus alive 1069 16.5 [0.96] 6.1 [0.29] 5-88 2-17.5 60.6 33.8 4.8 0.8
snag 607 17.2 [1.17] 5.9 [0.29] 5-90 2-20 48.4 44.2 5.6 1.8
Olea alive 1313 18.5 [0.83] 5.5 [0.16] 5 - 90 2-17 39.2 52.7 7.0 1.1
snag 802 19.6 [1.23] 4.7 [0.16] 5-114 2-13.5 48.3 46.4 3.7 1.6
Co-occurring alive 1747 11.4 [0.43] 4.2 [0.09] 5-85 2-17 78.1 20.8 1.0 0.1
snag 120 10.5 [0.73] 3.6 [0.20] 5-27 2-8.4 74.2 22.5 0.0 3.3
Summary of plot inventory data: DBH, H, and SE, refer to diameter at
breast height, tree height, and standard error, respectively…..
92.2% of snags are from foundation tree species (i.e. juniperus and olea)
World Agroforestry Centre (ICRAF)
Nairobi, March 14, 2016
Total= 5658
Results
From inventory
25% were dead trees
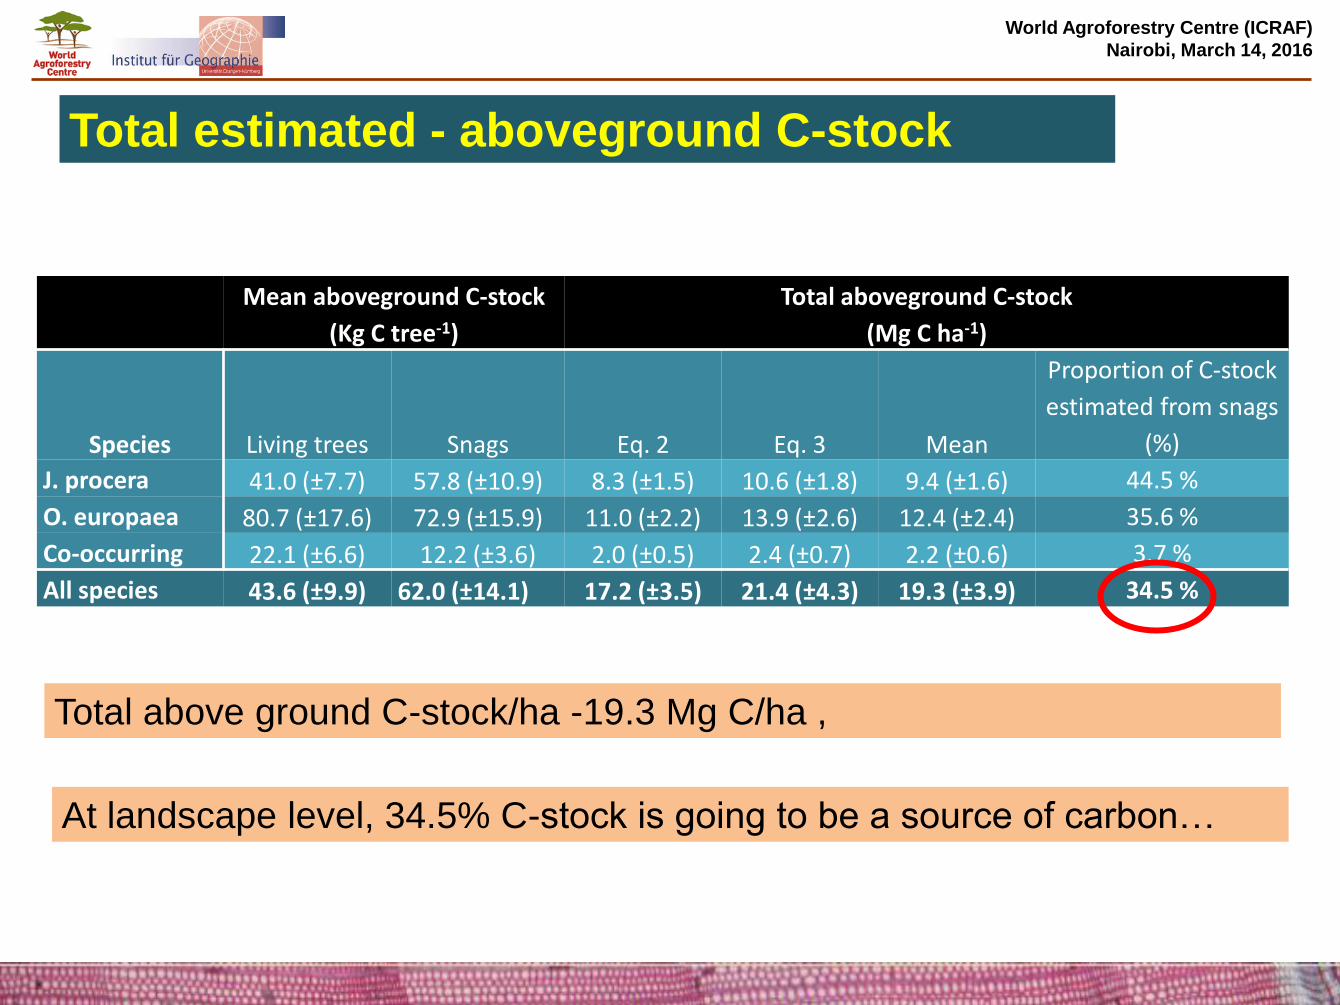
Total estimated - aboveground C-stock
At landscape level, 34.5% C-stock is going to be a source of carbon…
World Agroforestry Centre (ICRAF)
Nairobi, March 14, 2016
Mean aboveground C-stock
(Kg C tree-1)
Total aboveground C-stock
(Mg C ha-1)
Species Living trees Snags Eq. 2 Eq. 3 Mean
Proportion of C-stock
estimated from snags
(%)
J. procera 41.0 (±7.7) 57.8 (±10.9) 8.3 (±1.5) 10.6 (±1.8) 9.4 (±1.6) 44.5 %
O. europaea 80.7 (±17.6) 72.9 (±15.9) 11.0 (±2.2) 13.9 (±2.6) 12.4 (±2.4) 35.6 %
Co-occurring 22.1 (±6.6) 12.2 (±3.6) 2.0 (±0.5) 2.4 (±0.7) 2.2 (±0.6) 3.7 %
All species 43.6 (±9.9) 62.0 (±14.1) 17.2 (±3.5) 21.4 (±4.3) 19.3 (±3.9) 34.5 %
Total above ground C-stock/ha -19.3 Mg C/ha ,
Diameter class (cm)
5-1
0
10
-15
15
-20
20
-25
25
-30
30
-35
35
-40
40
-45
45
-50
>5
0
Ca
rbo
n s
tock (
Mg
)
0
2
4
6
8
10
12
Living trees
Snags
(a) J. procera
Diameter class (cm)
5-1
0
10
-15
15
-20
20
-25
25
-30
30
-35
35
-40
40
-45
45
-50
>5
0
Ca
rbo
n s
tock (
Mg
)
0
4
8
12
16
20
24
28
Living trees
Snags
(b) O. europaea
Diameter class (cm)
5-1
0
10
-15
15
-20
20
-25
25
-30
30
-35
35
-40
40
-45
45
-50
>50
Carb
on s
tock (
Mg)
0
2
4
6
8
Living trees
Snags
(C) Other species
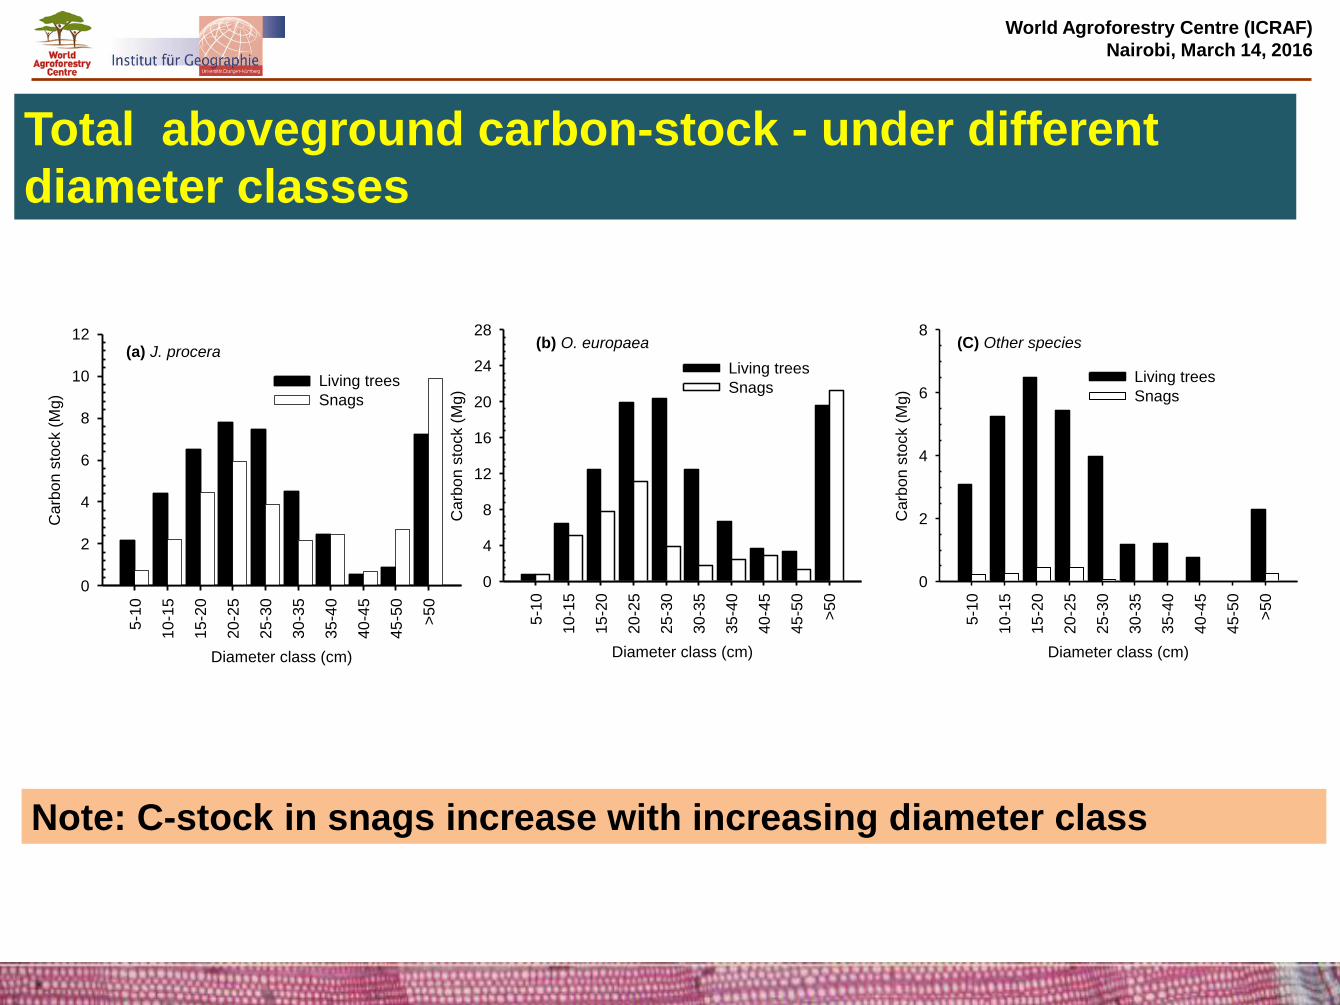
Total aboveground carbon-stock - under different
diameter classes
Note: C-stock in snags increase with increasing diameter class
World Agroforestry Centre (ICRAF)
Nairobi, March 14, 2016
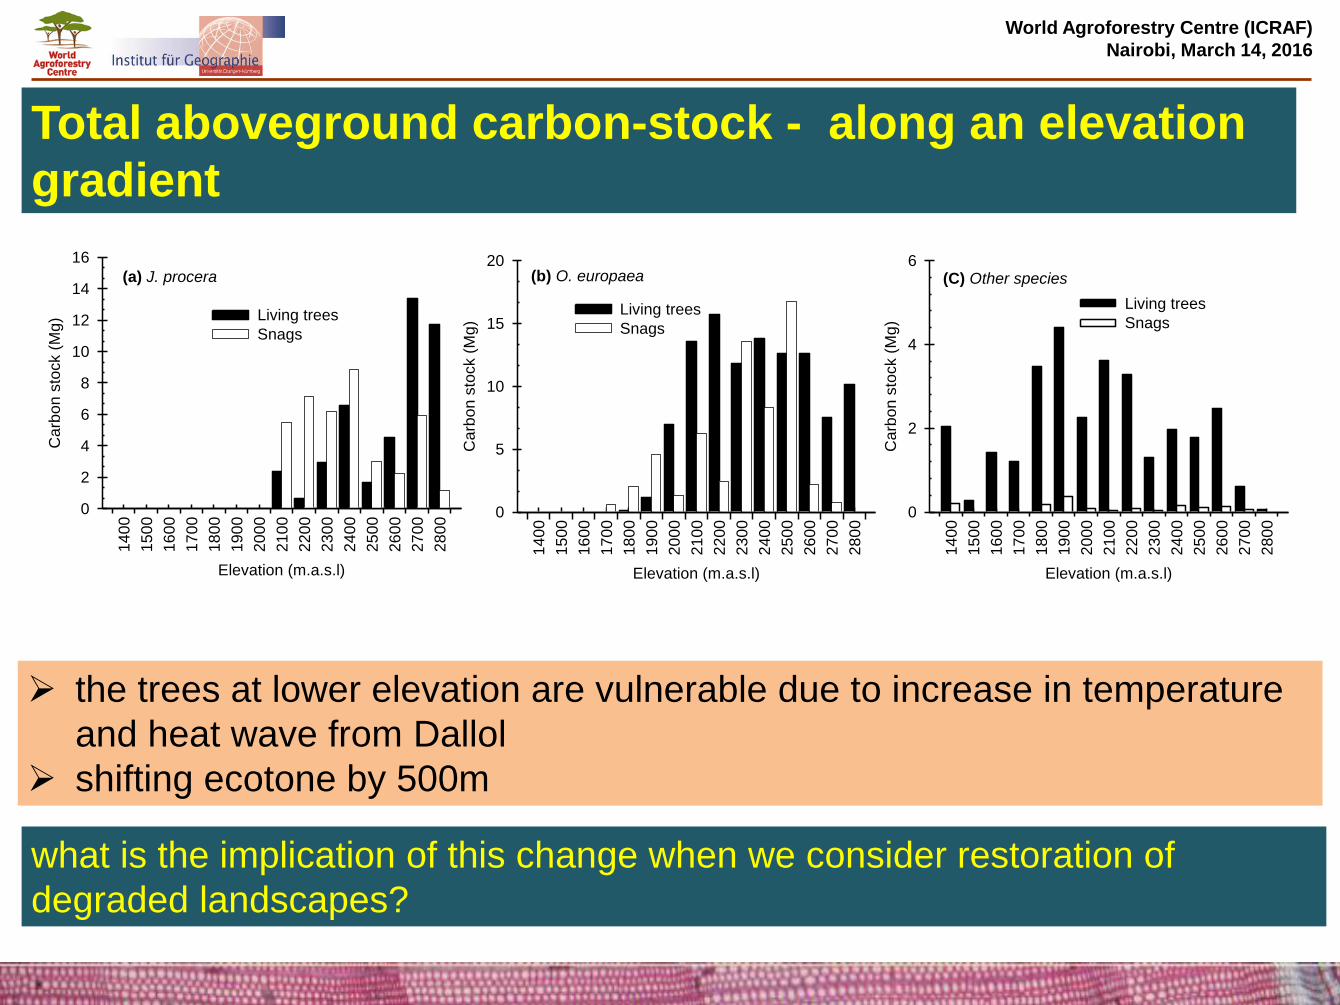
Total aboveground carbon-stock - along an elevation
gradient
Elevation (m.a.s.l)
14
00
15
00
16
00
17
00
18
00
19
00
20
00
21
00
22
00
23
00
24
00
25
00
26
00
27
00
28
00
Ca
rbo
n s
tock (
Mg
)
0
5
10
15
20
Living trees
Snags
(b) O. europaea
Elevation (m.a.s.l)
14
00
15
00
16
00
17
00
18
00
19
00
20
00
21
00
22
00
23
00
24
00
25
00
26
00
27
00
28
00
Ca
rbo
n s
tock (
Mg
)
0
2
4
6
8
10
12
14
16
Living trees
Snags
(a) J. procera
Elevation (m.a.s.l)
14
00
15
00
16
00
17
00
18
00
19
00
20
00
21
00
22
00
23
00
24
00
25
00
26
00
27
00
28
00
Ca
rbo
n s
tock (
Mg
)
0
2
4
6
Living trees
Snags
(C) Other species
World Agroforestry Centre (ICRAF)
Nairobi, March 14, 2016
the trees at lower elevation are vulnerable due to increase in temperature
and heat wave from Dallol
shifting ecotone by 500m
what is the implication of this change when we consider restoration of
degraded landscapes?
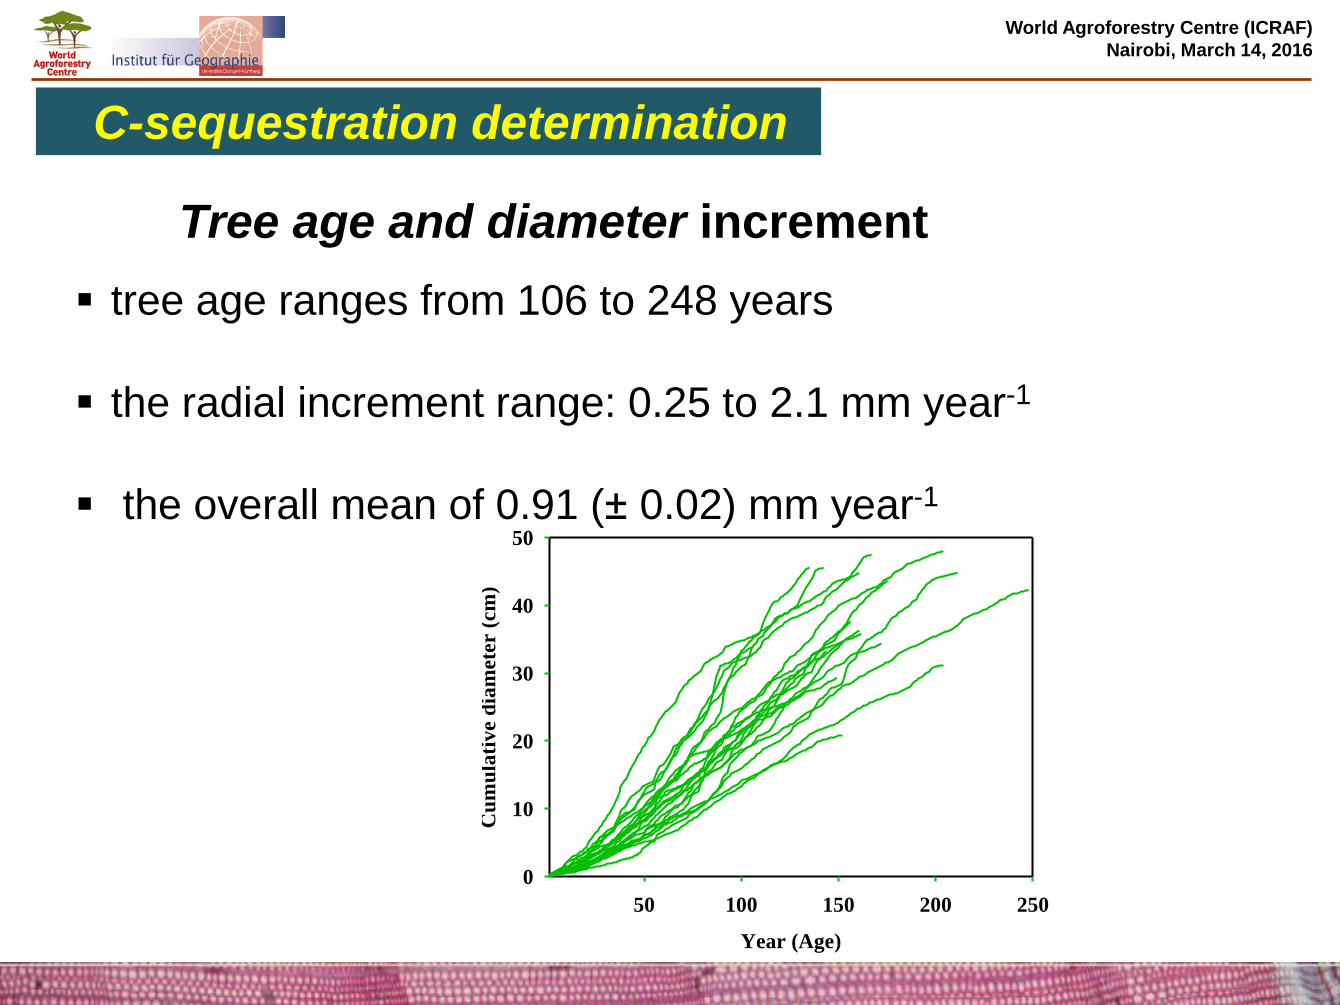
Tree age and diameter increment
tree age ranges from 106 to 248 years
the radial increment range: 0.25 to 2.1 mm year-1
the overall mean of 0.91 (± 0.02) mm year-1
World Agroforestry Centre (ICRAF)
Nairobi, March 14, 2016
C-sequestration determination
Year (Age)
50 100 150 200 250
Cu
mu
lati
ve d
iam
ete
r (
cm
)
0
10
20
30
40
50
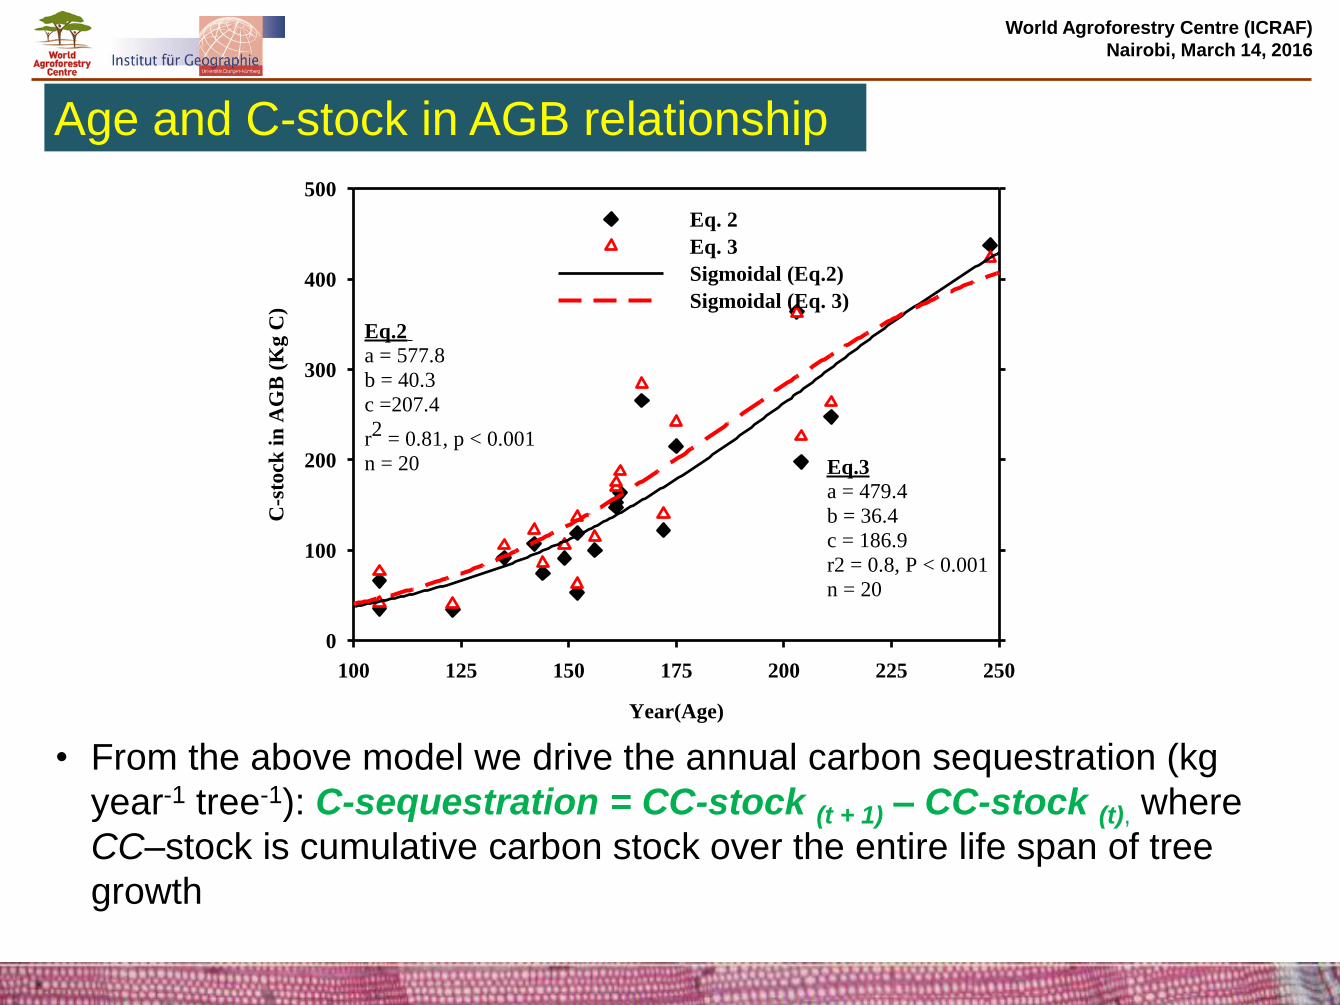
Age and C-stock in AGB relationship
• From the above model we drive the annual carbon sequestration (kg
year-1 tree-1): C-sequestration = CC-stock (t + 1) – CC-stock (t), where
CC–stock is cumulative carbon stock over the entire life span of tree
growth
World Agroforestry Centre (ICRAF)
Nairobi, March 14, 2016
Year(Age)
100 125 150 175 200 225 250
C-s
tock
in
AG
B (
Kg
C)
0
100
200
300
400
500
Eq. 2
Eq. 3
Sigmoidal (Eq.2)
Sigmoidal (Eq. 3)
Eq.2 a = 577.8
b = 40.3
c =207.4
r2
= 0.81, p < 0.001
n = 20 Eq.3
a = 479.4
b = 36.4
c = 186.9
r2 = 0.8, P < 0.001
n = 20
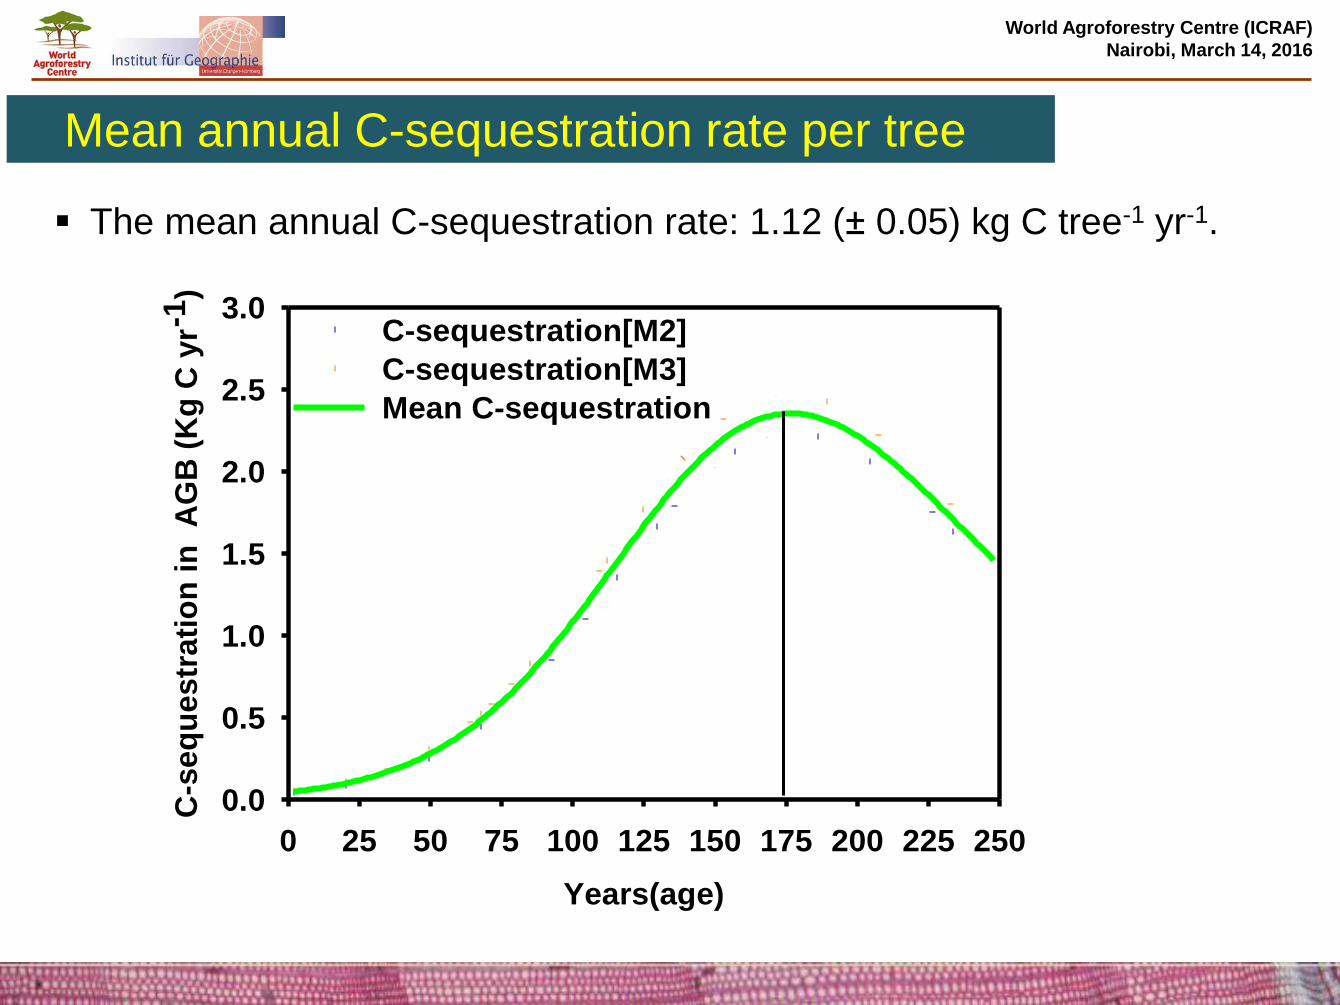
Mean annual C-sequestration rate per tree
The mean annual C-sequestration rate: 1.12 (± 0.05) kg C tree-1 yr-1.
World Agroforestry Centre (ICRAF)
Nairobi, March 14, 2016
Years(age)
0 25 50 75 100 125 150 175 200 225 250
C-s
eq
ues
tra
tio
n i
n
AG
B (
Kg
C y
r-1
)
0.0
0.5
1.0
1.5
2.0
2.5
3.0C-sequestration[M2]
C-sequestration[M3]
Mean C-sequestration
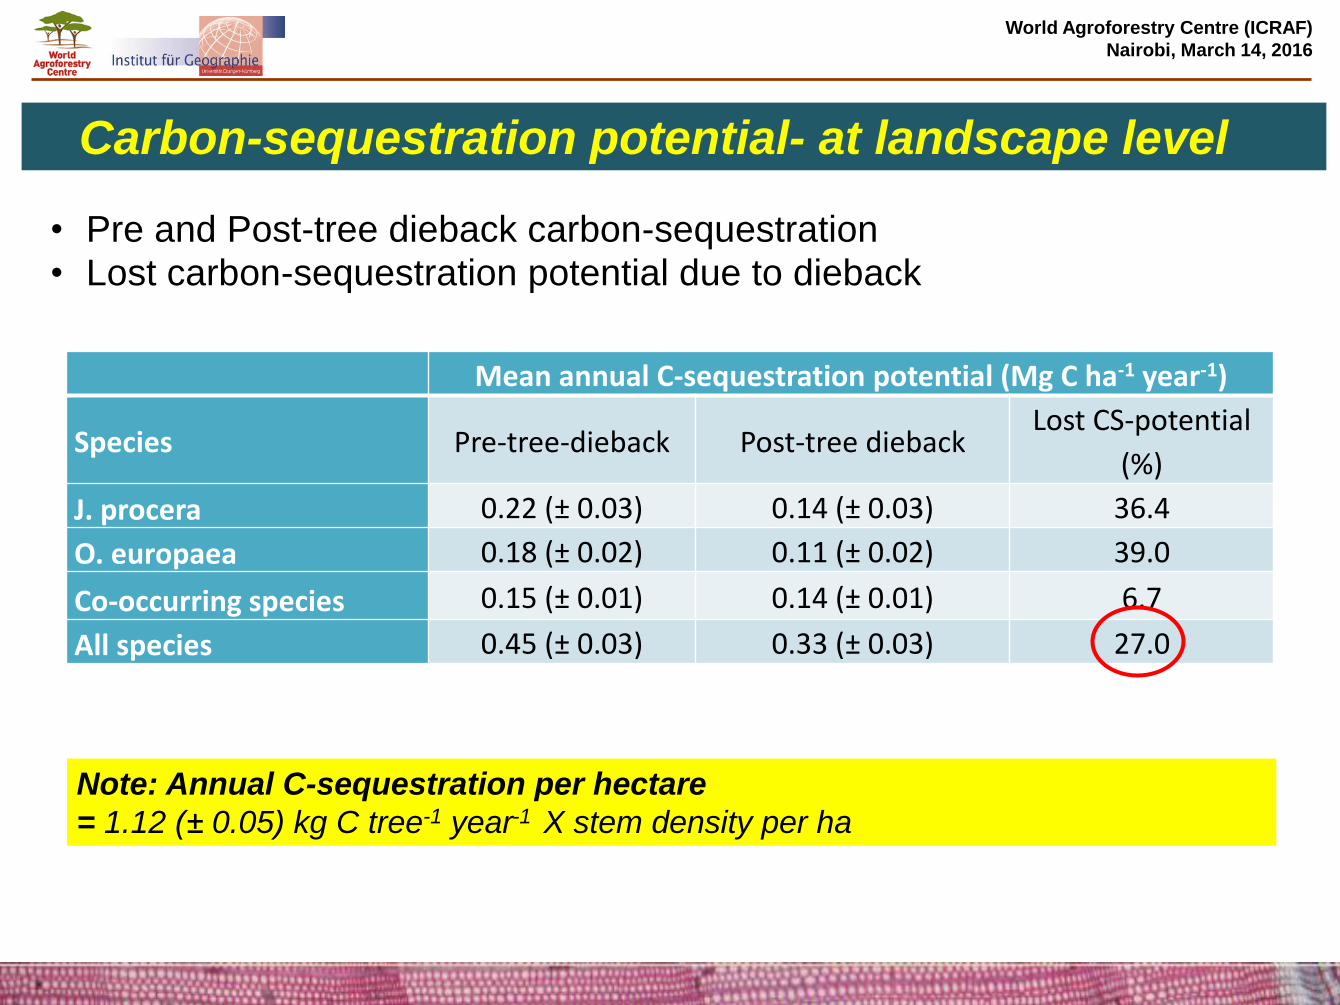
Carbon-sequestration potential- at landscape level
Mean annual C-sequestration potential (Mg C ha-1 year-1)
Species Pre-tree-dieback Post-tree dieback Lost CS-potential
(%)
J. procera 0.22 (± 0.03) 0.14 (± 0.03) 36.4
O. europaea 0.18 (± 0.02) 0.11 (± 0.02) 39.0
Co-occurring species 0.15 (± 0.01) 0.14 (± 0.01) 6.7
All species 0.45 (± 0.03) 0.33 (± 0.03) 27.0
• Pre and Post-tree dieback carbon-sequestration • Lost carbon-sequestration potential due to dieback
World Agroforestry Centre (ICRAF)
Nairobi, March 14, 2016
Note: Annual C-sequestration per hectare
= 1.12 (± 0.05) kg C tree-1 year-1 X stem density per ha
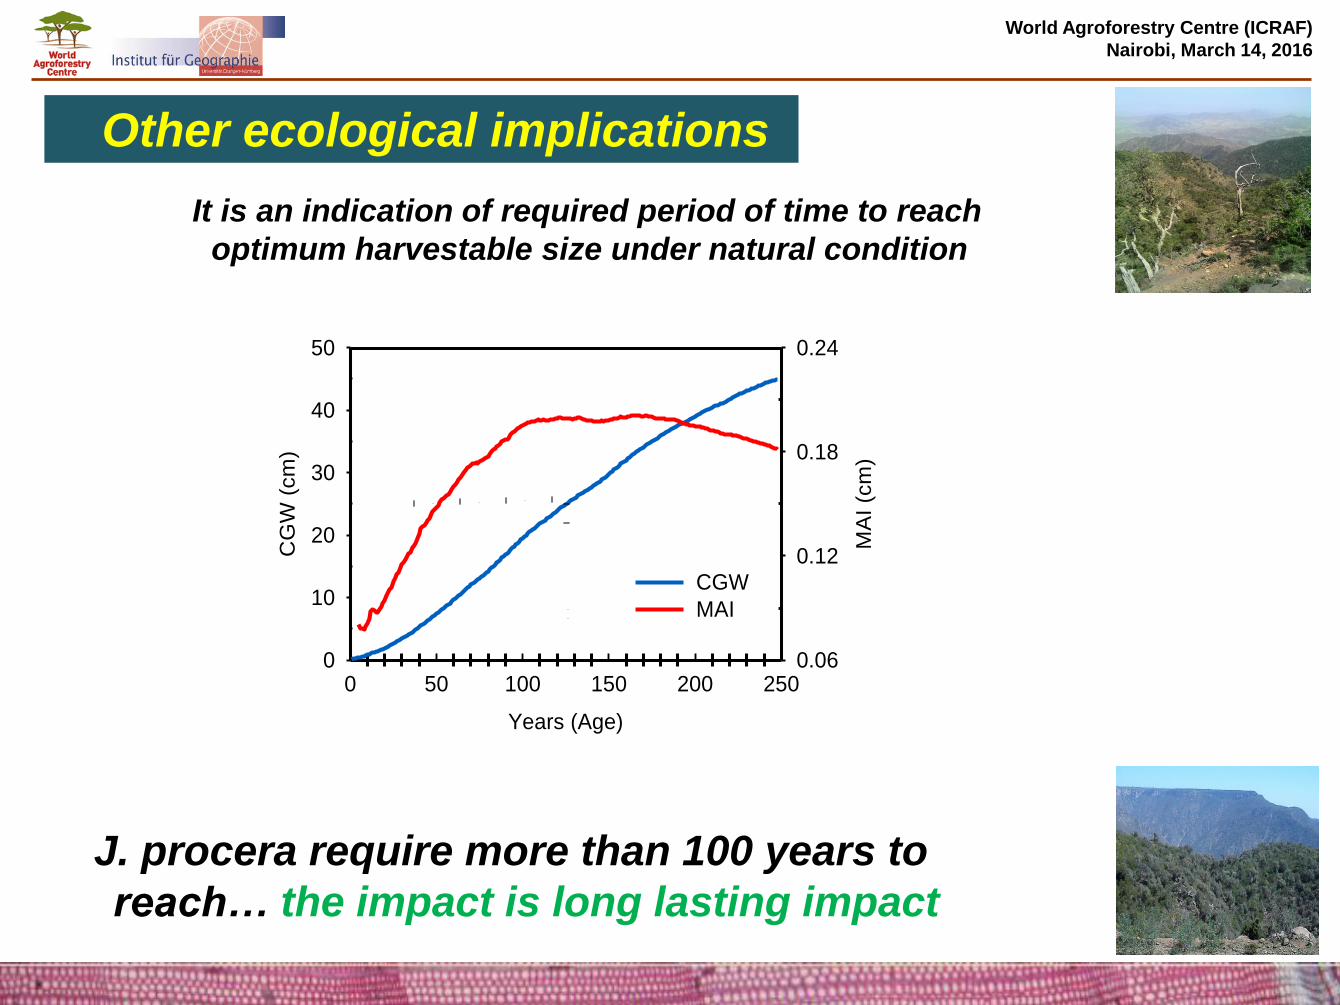
It is an indication of required period of time to reach
optimum harvestable size under natural condition
World Agroforestry Centre (ICRAF)
Nairobi, March 14, 2016
Other ecological implications
Years (Age)
0 50 100 150 200 250
CG
W (
cm
)
0
10
20
30
40
50
MA
I (c
m)
0.06
0.12
0.18
0.24
CGW
MAI
J. procera require more than 100 years to
reach… the impact is long lasting impact
World Agroforestry Centre (ICRAF)
Nairobi, March 14, 2016
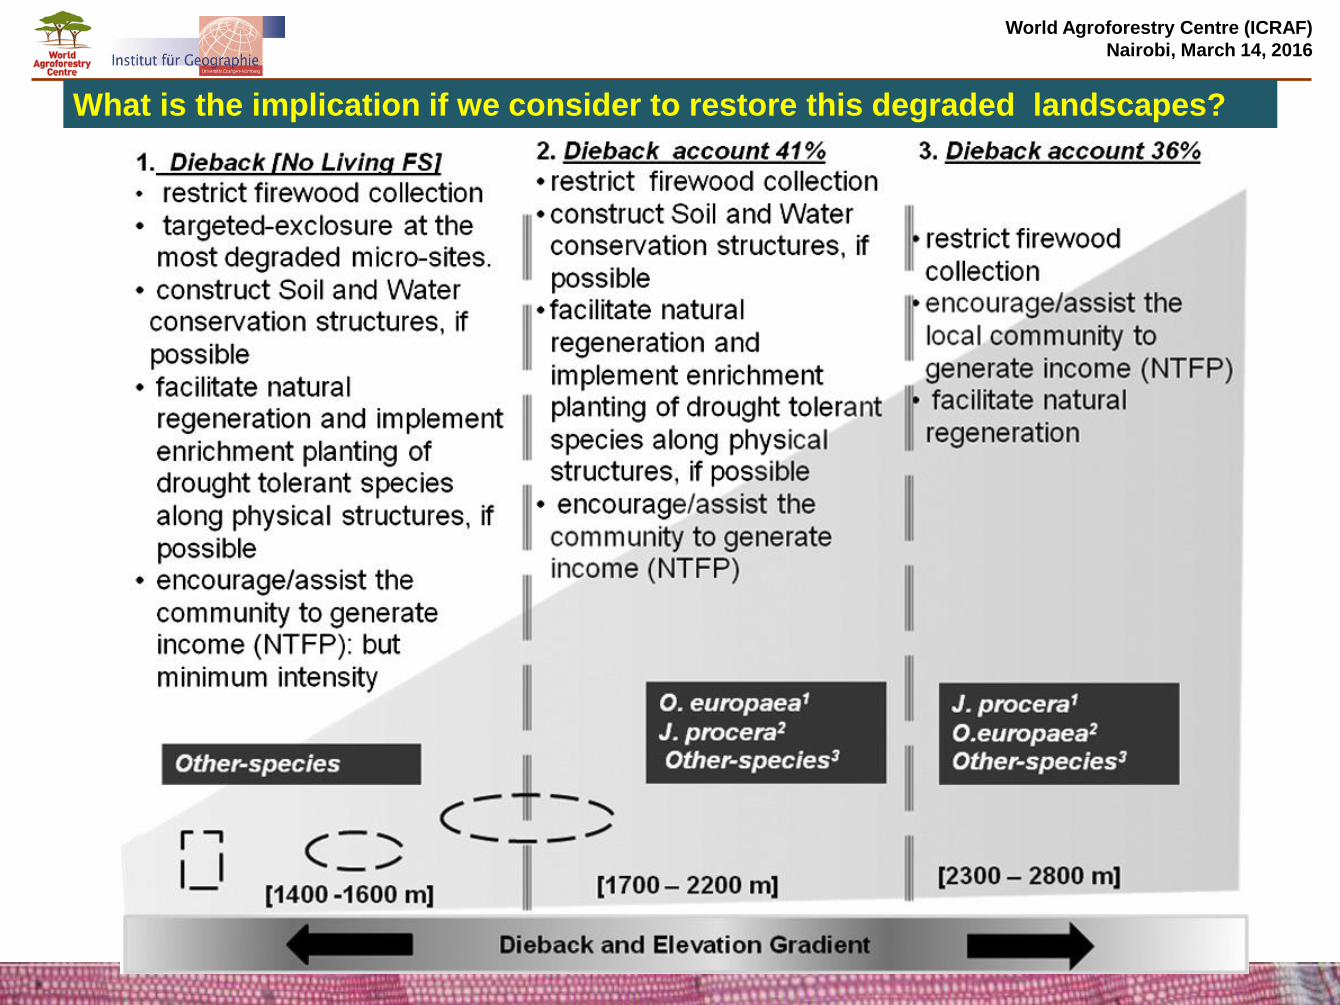
What is the implication if we consider to restore this degraded landscapes?
trees at lower elevation are more vulnerable due to increase
in temperature and heat wave from Dallol
dieback caused upward ecotone shift by about 500m,
ecotone shift Indicates changing environmental conditions
the impact of tree dieback on the ecosystem is long-lasting
It is costly to curb the situation after major vegetation loss
conservation is cheaper than restoration
restoration should consider a micros site conditions and
climate resilient species
Dendrochronology is very useful tool to determine annual
carbon sequestration (temporal and spatial), to asses
resilience of species , understand landscape history and
population dynamics
World Agroforestry Centre (ICRAF)
Nairobi, March 14, 2016
Conclusion and recommendation
World Agroforestry Centre (ICRAF)
Nairobi, March 14, 2016
Thank you!
Acknowledgement
CRP 6.4 for co-funding
Mekele University for support during field work
Edith Anyango for assisting laboratory work