Embed Size (px)
Citation preview
Advancing the adoption of artificial nitrogen sinksKelly Addy, Art Gold1*, Louis Schipper2, Mark David3, Nicole Sacha1 and Brian Needelman4
1University of Rhode Island, 2University of Waikato, 3University of Illinois, 4 University of Maryland *[email protected]
This material is based upon work supported by the National Institute of Food and Agriculture, USDA, under agreement No. 2011-51130-31120. Any opinions, findings, conclusions, or recommendations expressed in this poster are those of the authors and do not necessarily reflect the view of the USDA. Contribution #5352 of the RI Agricultural Experiment Station.
Citations from this poster and meta-analysis :
Cameron and Schipper. 2010. Ecol. Eng.
Christiansen et al. 2011. Agr. Water Manage.
Christiansen et al. 2011. Journal of Environ. Eng.
Christiansen et al. 2012. Tran. Am. Soc. Ag. Eng.
Christiansen et al. 2013. Ecol. Eng.
Chun et al. 2009. Biosystems Eng.
Crumpton et al. 2008. Final Report: Potential of restored and constructed wetlands to reduce nutrient export.
David et al. in review. J. Environ. Qual.
Elgood et al. 2010. Ecol. Eng.
Gibert et al. 2008. Bioresource Technol.
Greenan et al. 2006J. Environ. Qual.
Healy et al. 2006. J. Environ. Sci. Heal.
Healy et al. 2012. Ecol. Eng.
Healy et al. 2014. Ecol. Eng.
Lepine et al. in review. J. Environ Qual.
Kadlec. 2012. Critical Reviews in Environmental Science and Technology.
Long et al. 2011. Agr. Ecosyst. and Environ.
Mitsch and Day. 2006. Ecol. Eng.
Moorman at al. 2010. Ecol. Eng.
Pluer et al. in review. J. Environ. Qual.
Robertson et al. 2009. J. Environ. Qual.
Robertson. 2010. Ecol. Eng.
Robertson and Merkley. 2009. J. Environ. Qual..
Rosenburg et al. 2000. Metawin statistical software for meta-analysis.
Schipper et al. 2010ab. Ecol. Eng.
Schipper and Vojvodić-Vuković. 2000. J. Environ. Qual.
Schmidt and Clark. 2012. J. Environ. Qual.
Warneke et al. 2011. Ecol. Engin.
Warneke et al. 2011bc. Water Research.
Woli et al. 2010. Ecol. Eng.
IntroductionIntroduction
Acknowledgements & References
Constructed WetlandsConstructed wetlands (Fig.1) are artificial systems that provide ecological services, such as flood water storage, nutrient (nitrogen or phosphorus) storage and cycling, and erosion control. They are modeled after natural wetland systems. These systems are placed alongside ditches or streams where they retain water for hours or days to allow nitrate-N removal through denitrification.
Figure 1: (a) Constructed wetland in Iowa and (b) conceptual diagram of constructed wetland treating tile drainage (Mitsch and Day 2006).
The two main types of denitrifying bioreactors are beds (Fig. 3a) and walls (Fig. 3b). Beds are closed systems that receive tile drain inflow. Walls are placed in the natural flowpath of groundwater leaving from agricultural fields.
Constructed wetlands and denitrifying bioreactors are artificial “sinks” (hotspots of nitrogen (N) removal) that are created to resemble natural systems that promote denitrification. When installed at the edge of
an agricultural field, they can intercept groundwater or tile drainage water and reduce the nitrate-N content of agricultural discharge. The goal of our project is to advance the adoption and proper
placement of denitrifying bioreactors and constructed wetlands in agricultural settings.
Meta-analysis: N removal in denitrifying bioreactors
Outreach approachOutreach approach
The International Atlas identifies artificial N sink research and demonstration sites from across the globe. The map not only gives information about where the systems are but also provides project contact information, links to case studies, papers, and websites with additional information. We welcome any additions to our atlas or website (email [email protected]).
Another important feature of the website is the Frequently Asked Questions (FAQs) which provides basic information on the function and processes of artificial N sinks. Basic information about point source pollution, dead zones and other related details are also present on this page. Most questions have links to EPA definitions and various videos which give a fuller understanding of the subject.
Resources include fact sheets, case studies, videos, workshop presentations and research summaries about constructed wetlands and denitrifying bioreactors. Research papers written by scientists are further studied and condensed into summaries in our case study section which highlights the situation, actions, and take-home messages. We also have videos and fact sheets that highlight similar subject matter.
www.artificialnsinks.org This website, primarily targeting land managers and farm advisors, offers guidance, an International Atlas of constructed wetlands and denitrification bioreactors, fact sheets, case studies, presentations, videos and other resources. We also have a listserv to share news on artificial N sinks and share project successes. To join our listserv, email [email protected].
Figure 2: Denitrifying beds under construction.
Meta-analysis results for denitrifying bioreactors
pLimitations & Next steps
Next Steps• Two papers (one on this meta-analysis) have been submitted to a special issue of the Journal of
Environmental Quality on “Moving Denitrifying Bioreactors beyond Proof of Concept.” Our project wasthe impetus for this special issue and Dr. Schipper is a Guest Editor at JEQ for it.
• Develop bed design recommendations to maximize nitrate removal and minimize any potentially adverse byproducts.
Denitrifying BioreactorsA denitrifying bioreactor (Fig.2) is an artificially constructed system that mimics selected functions of riparian wetlands. These systems are composed of an added source of carbon (often woodchips) that intercept groundwater or tile drainage. The wood chips create an anaerobic environment in which bacteria transform the nitrate-N in the water into nitrogen gas.
Meta-analysis: Methods
Bioreactor design: Nitrate removal rates in bed and lab column studies were not significantly different, but both were higher than wall designs (p<0.05; note: small n value of walls).
Bed influent nitrate concentration: Beds with influent N > 30 mg l-1 had higher nitrate removal rates than beds with intermediate (10-30 mg l-1; p<0.01) and low influent N (<10 mg l-1; p<0.05).
Fig 3a: Denitrifying bed to treat tile drainage (Schipper et al. 2010)
Figure 3b: Denitrifying wall to intercept groundwater flow (Schipper et al. 2010)
Artificial N sinks are not suitable for all locations and conditions. It is important to consider site conditions and hydrology at all sites to maximize N removal function.
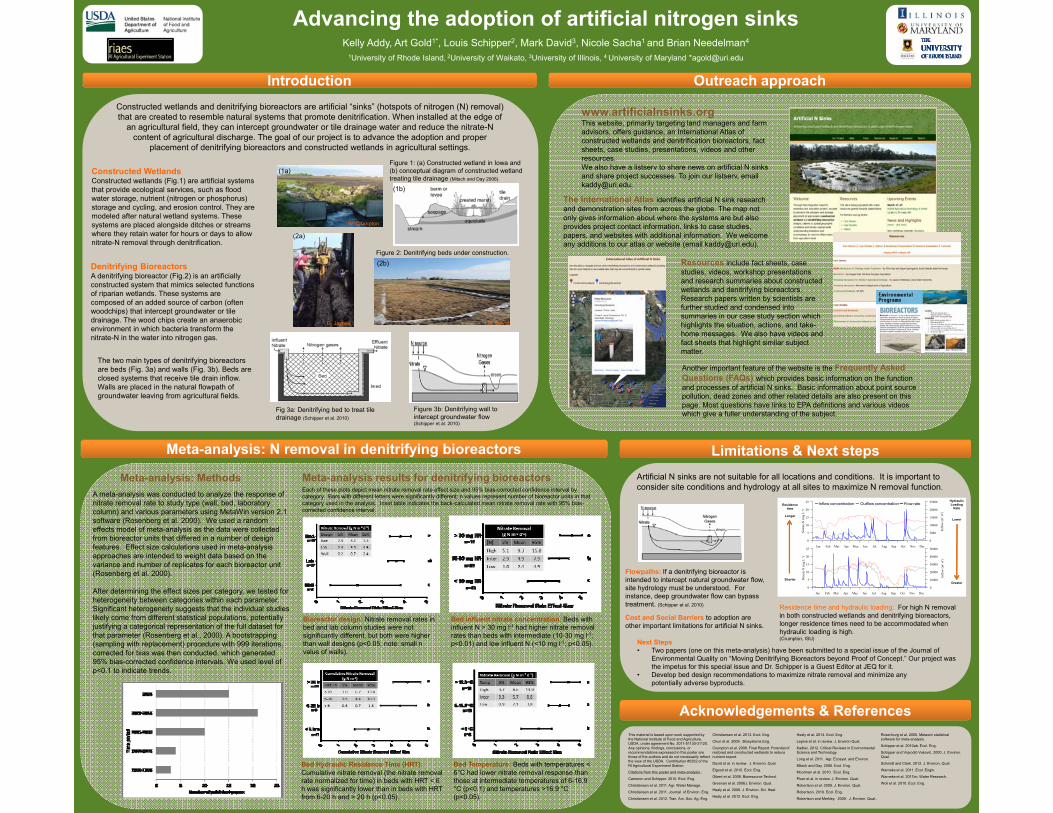
Flowpaths: If a denitrifying bioreactor is intended to intercept natural groundwater flow, site hydrology must be understood. For instance, deep groundwater flow can bypass treatment. (Schipper et al. 2010) Residence time and hydraulic loading: For high N removal
in both constructed wetlands and denitrifying bioreactors, longer residence times need to be accommodated when hydraulic loading is high. (Crumpton, ISU)
Cost and Social Barriers to adoption are other important limitations for artificial N sinks.
A meta-analysis was conducted to analyze the response of nitrate removal rate to study type (wall, bed, laboratory column) and various parameters using MetaWin version 2.1 software (Rosenberg et al. 2000). We used a random effects model of meta-analysis as the data were collected from bioreactor units that differed in a number of design features. Effect size calculations used in meta-analysis approaches are intended to weight data based on the variance and number of replicates for each bioreactor unit (Rosenberg et al. 2000).
After determining the effect sizes per category, we tested for heterogeneity between categories within each parameter. Significant heterogeneity suggests that the individual studies likely come from different statistical populations, potentially justifying a categorical representation of the full dataset for that parameter (Rosenberg et al., 2000). A bootstrapping (sampling with replacement) procedure with 999 iterations, corrected for bias was then conducted, which generated 95% bias-corrected confidence intervals. We used level of p<0.1 to indicate trends.
Bed Hydraulic Residence Time (HRT): Cumulative nitrate removal (the nitrate removal rate normalized for time) in beds with HRT < 6 h was significantly lower than in beds with HRT from 6-20 h and > 20 h (p<0.05).
Bed Temperature: Beds with temperatures < 6°C had lower nitrate removal response than those at intermediate temperatures of 6-16.9 °C (p<0.1) and temperatures >16.9 °C (p<0.05).
M. David
(2b)
(1b)
D. Jaynes
(2a)
W. Crumpton
(1a)
0
5
10
15
20
25
Nitr
ate-
N (m
g L-1
)
0
5000
10000
15000
20000
25000
Inflo
w (m
3 d-1
)
Jan Feb Mar Apr May Jun Jul Aug Sep Oct Nov Dec
0
5
10
15
20
25
Nitr
ate-
N (m
g L-1
)
0
10000
20000
30000
40000
50000
Inflo
w (m
3 d-1
)
Jan Feb Mar Apr May Jun Jul Aug Sep Oct Nov Dec
Residence time
Longer
Shorter
Hydraulic Loading
Rate
Lower
Greater
Inflow concentration Outflow concentration Flow rate
Each of these plots depict mean nitrate removal rate effect size and 95% bias-corrected confidence interval by category. Bars with different letters were significantly different; n values represent number of bioreactor units in that category used in the analysis. Inset table indicates the back-calculated mean nitrate removal rate with 95% bias-corrected confidence interval.