Embed Size (px)
Citation preview

Sustainability in Community Sport
October 2011
Charles Johnston
Property Director
Sport England
Creating sporting opportunities in every community

Some Statistics on Current Provision
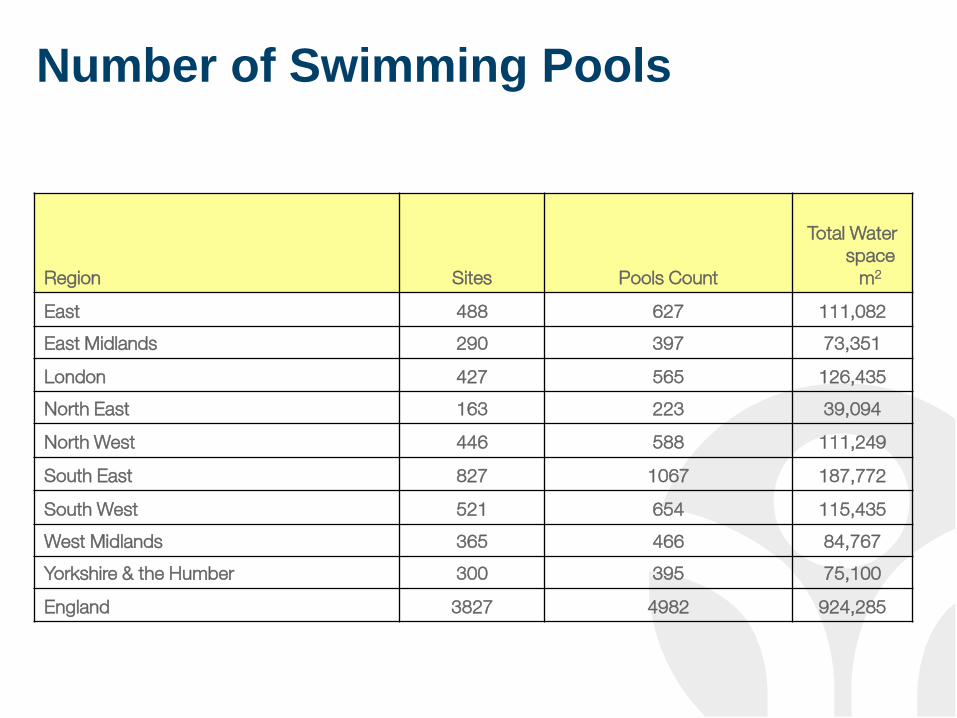
Number of Swimming Pools
Region Sites Pools Count
Total Water
space
m2
East 488 627 111,082
East Midlands 290 397 73,351
London 427 565 126,435
North East 163 223 39,094
North West 446 588 111,249
South East 827 1067 187,772
South West 521 654 115,435
West Midlands 365 466 84,767
Yorkshire & the Humber 300 395 75,100
England 3827 4982 924,285
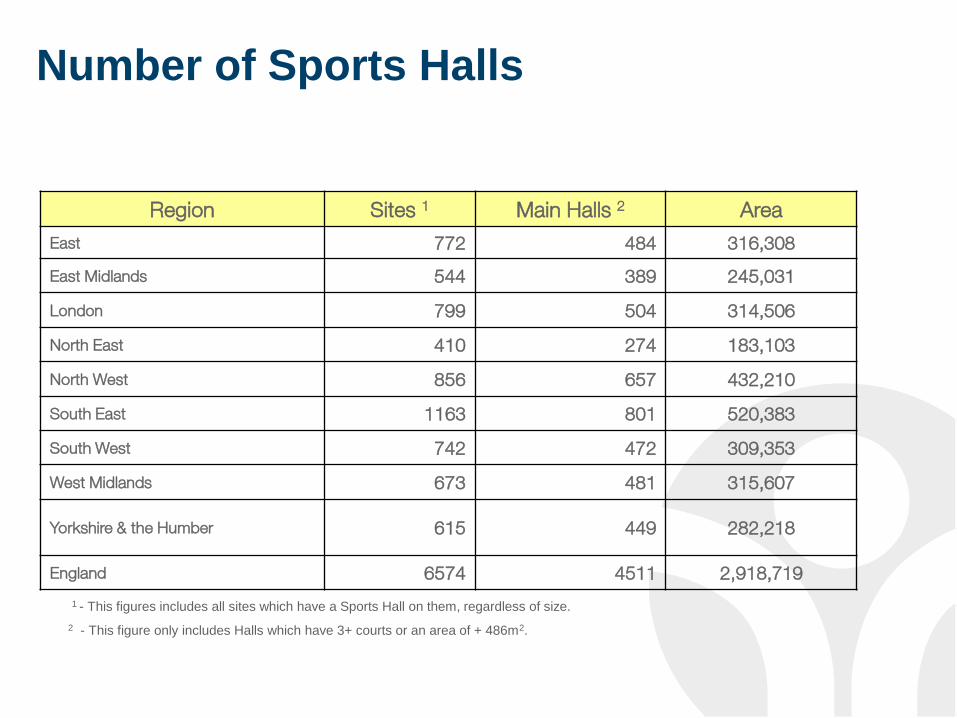
Number of Sports Halls
Region Sites 1 Main Halls 2 Area
East 772 484 316,308
East Midlands 544 389 245,031
London 799 504 314,506
North East 410 274 183,103
North West 856 657 432,210
South East 1163 801 520,383
South West 742 472 309,353
West Midlands 673 481 315,607
Yorkshire & the Humber 615 449 282,218
England 6574 4511 2,918,719
1 - This figures includes all sites which have a Sports Hall on them, regardless of size.
2 - This figure only includes Halls which have 3+ courts or an area of + 486m2.
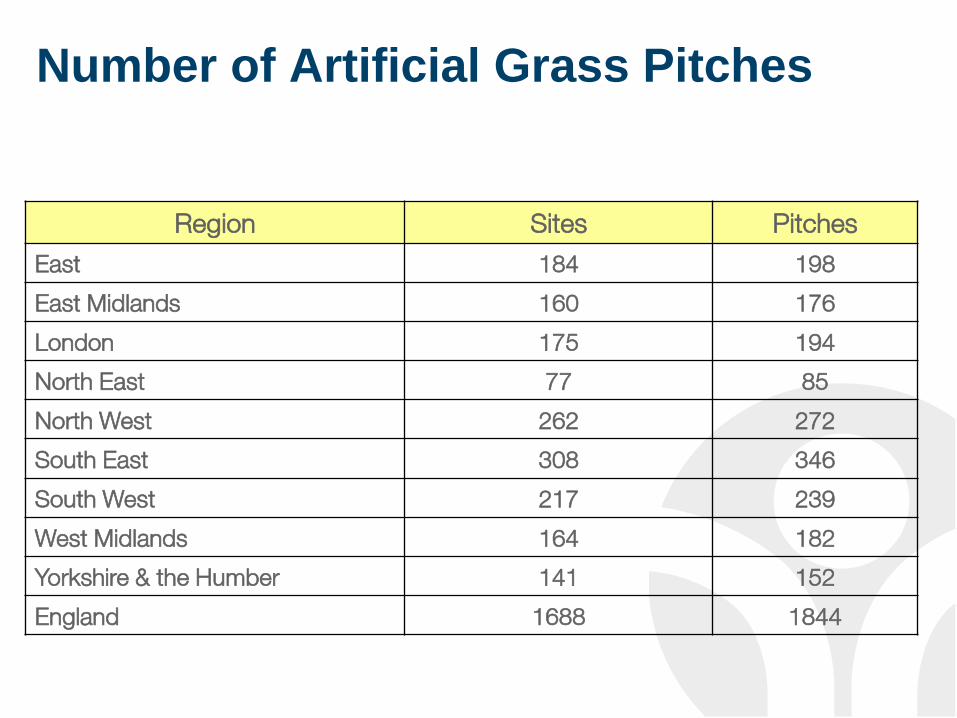
Number of Artificial Grass Pitches
Region Sites Pitches
East 184 198
East Midlands 160 176
London 175 194
North East 77 85
North West 262 272
South East 308 346
South West 217 239
West Midlands 164 182
Yorkshire & the Humber 141 152
England 1688 1844
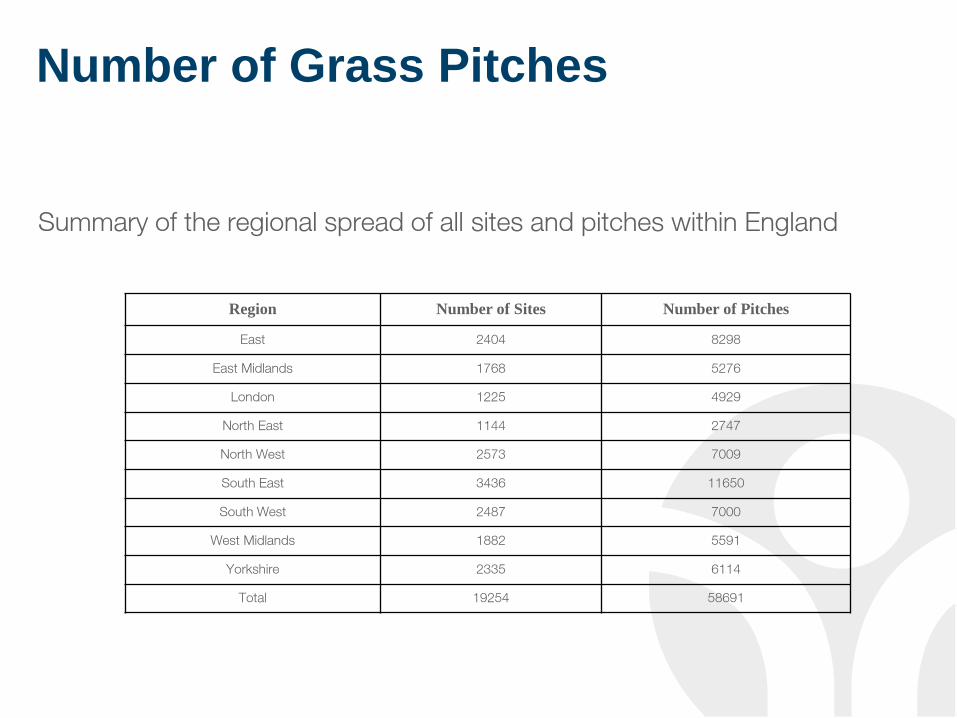
Number of Grass Pitches
Summary of the regional spread of all sites and pitches within England
Region Number of Sites Number of Pitches
East 2404 8298
East Midlands 1768 5276
London 1225 4929
North East 1144 2747
North West 2573 7009
South East 3436 11650
South West 2487 7000
West Midlands 1882 5591
Yorkshire 2335 6114
Total 19254 58691
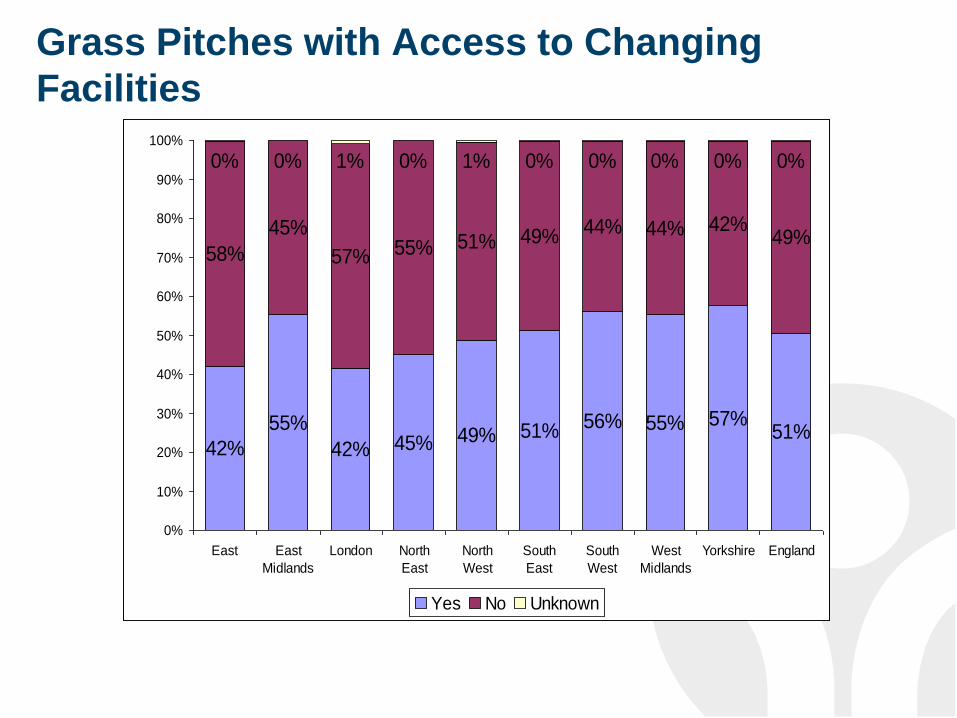
Grass Pitches with Access to Changing
Facilities
42%
55%
42% 45% 49% 51% 56% 55% 57%51%
58%
45%
57% 55% 51% 49% 44% 44% 42%49%
0% 0% 1% 0% 1% 0% 0% 0% 0% 0%
0%
10%
20%
30%
40%
50%
60%
70%
80%
90%
100%
East East
Midlands
London North
East
North
West
South
East
South
West
West
Midlands
Yorkshire England
Yes No Unknown
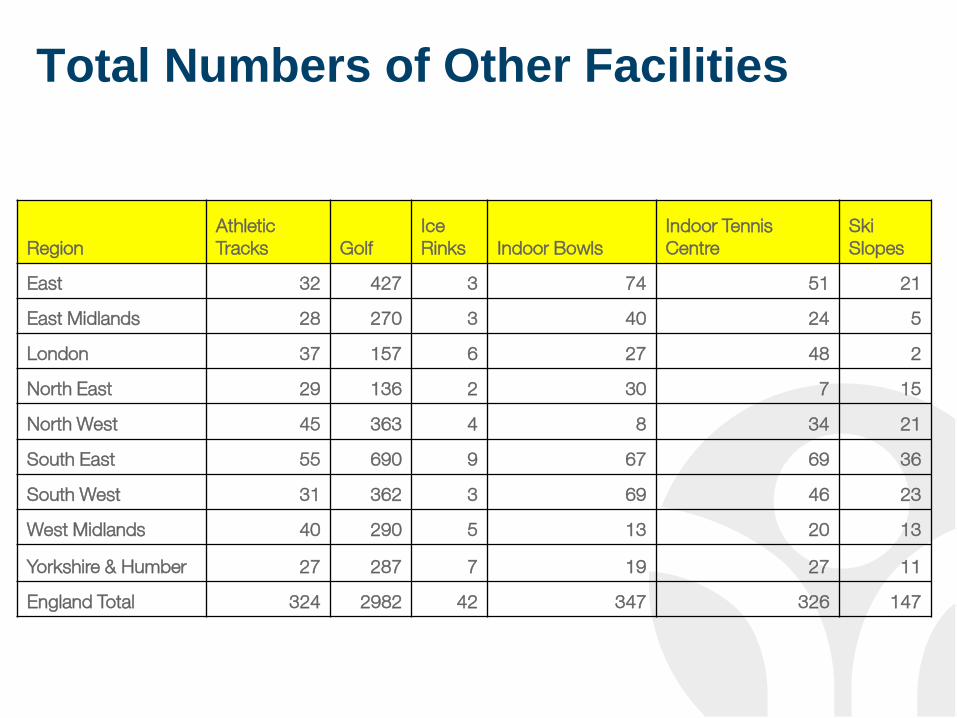
Total Numbers of Other Facilities
Region
Athletic
Tracks Golf
Ice
Rinks Indoor Bowls
Indoor Tennis
Centre
Ski
Slopes
East 32 427 3 74 51 21
East Midlands 28 270 3 40 24 5
London 37 157 6 27 48 2
North East 29 136 2 30 7 15
North West 45 363 4 8 34 21
South East 55 690 9 67 69 36
South West 31 362 3 69 46 23
West Midlands 40 290 5 13 20 13
Yorkshire & Humber 27 287 7 19 27 11
England Total 324 2982 42 347 326 147
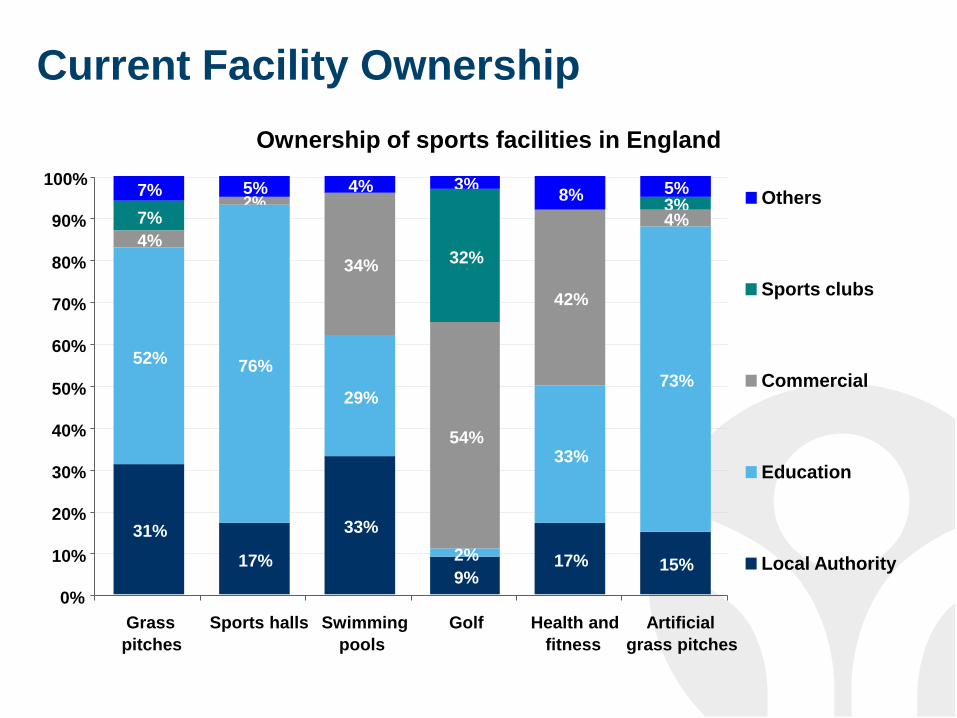
Ownership of sports facilities in England
0%
10%
20%
30%
40%
50%
60%
70%
80%
90%
100%
Grass
pitches
Sports halls Swimming
pools
Golf Health and
fitness
Artificial
grass pitches
31%
17%
33%
9% 17% 15% Local Authority
Current Facility Ownership
7% 5% 4% 3% 8% 5%
Others 7%
32%
3%
Sports clubs
4%
2%
34%
54%
42%
4%
Commercial
52% 76%
29%
2%
33%
73%
Education

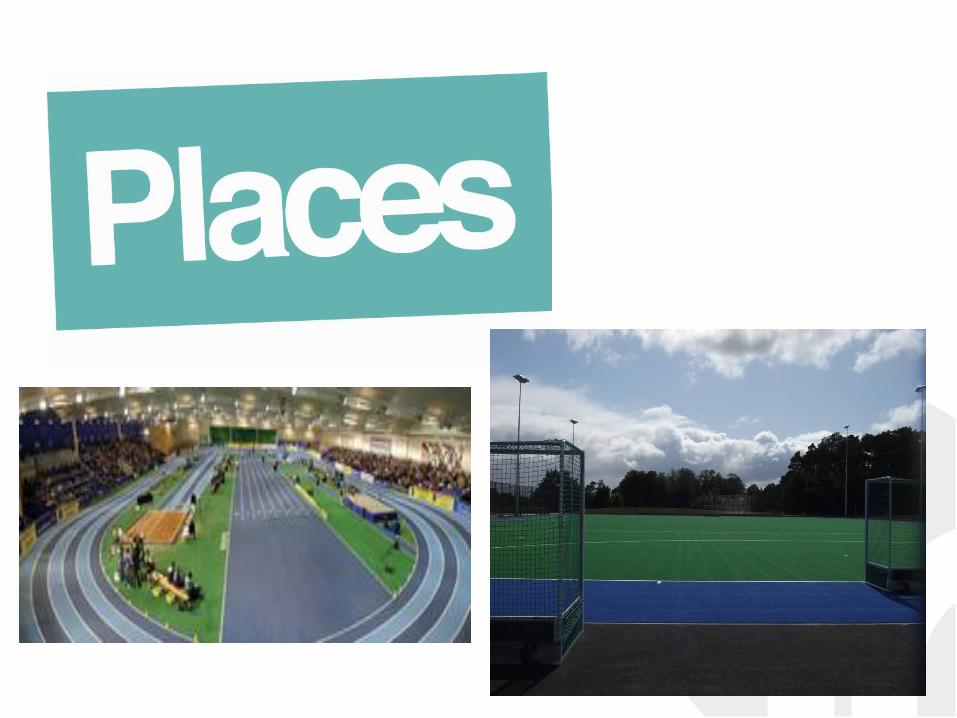
Key Areas for our Intervention
Pitch Sports Group – Working Together
Creating sporting opportunities in every community 11
Creating sporting opportunities in every community 12
Creating sporting opportunities in every community 13
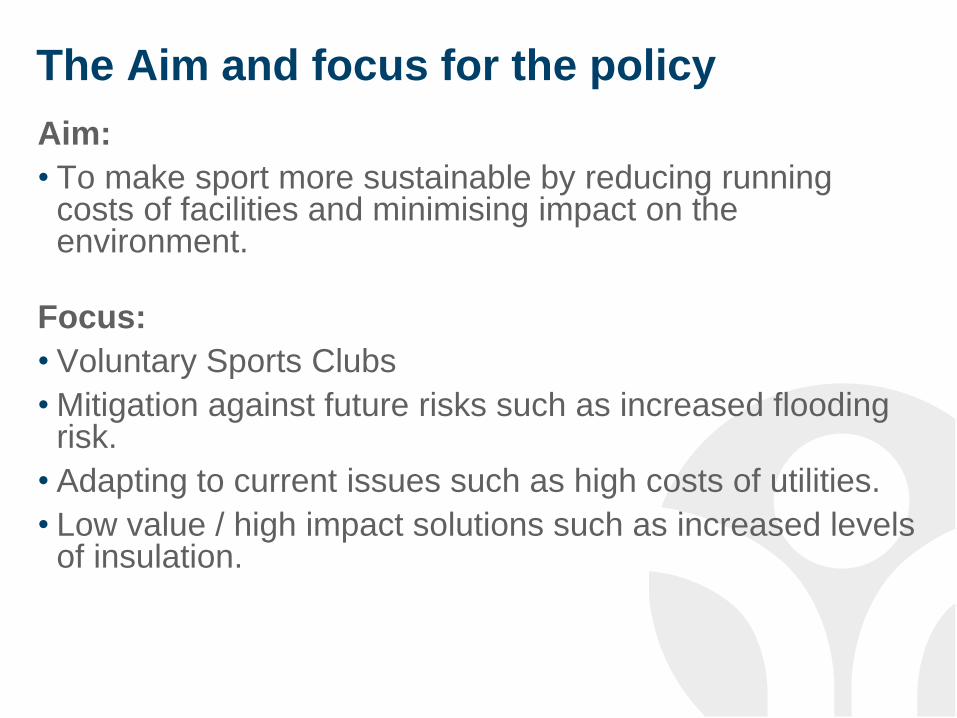
The Aim and focus for the policy
Aim:
• To make sport more sustainable by reducing running costs of facilities and minimising impact on the environment.
Focus:
• Voluntary Sports Clubs
• Mitigation against future risks such as increased flooding risk.
• Adapting to current issues such as high costs of utilities.
• Low value / high impact solutions such as increased levels of insulation.
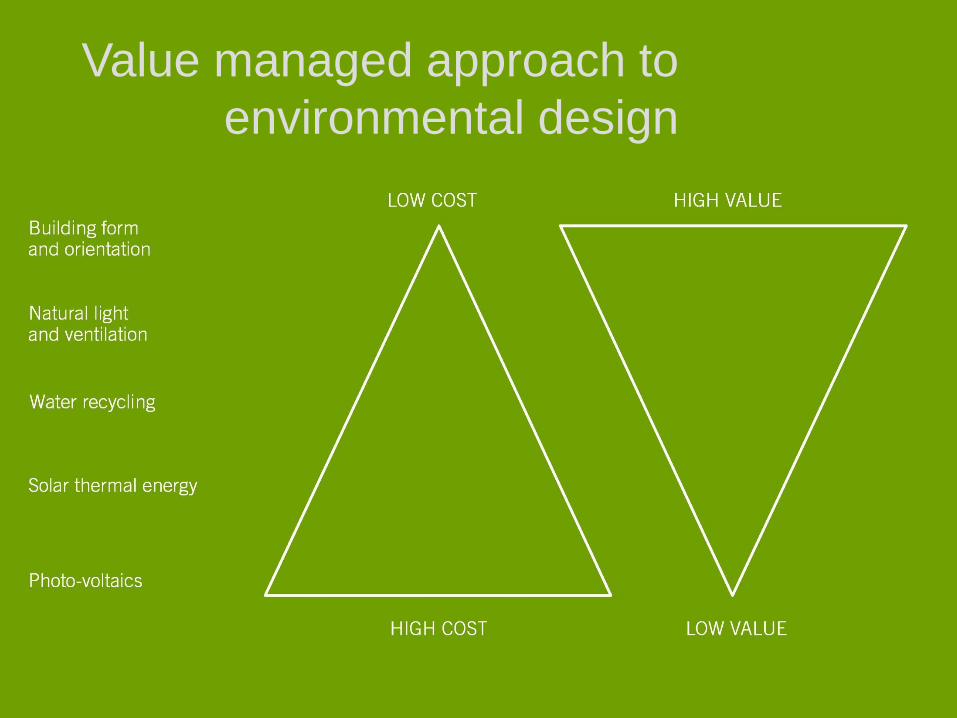
ECB Presentation Template - 24.1.05 Page 14
Value managed approach to
environmental design
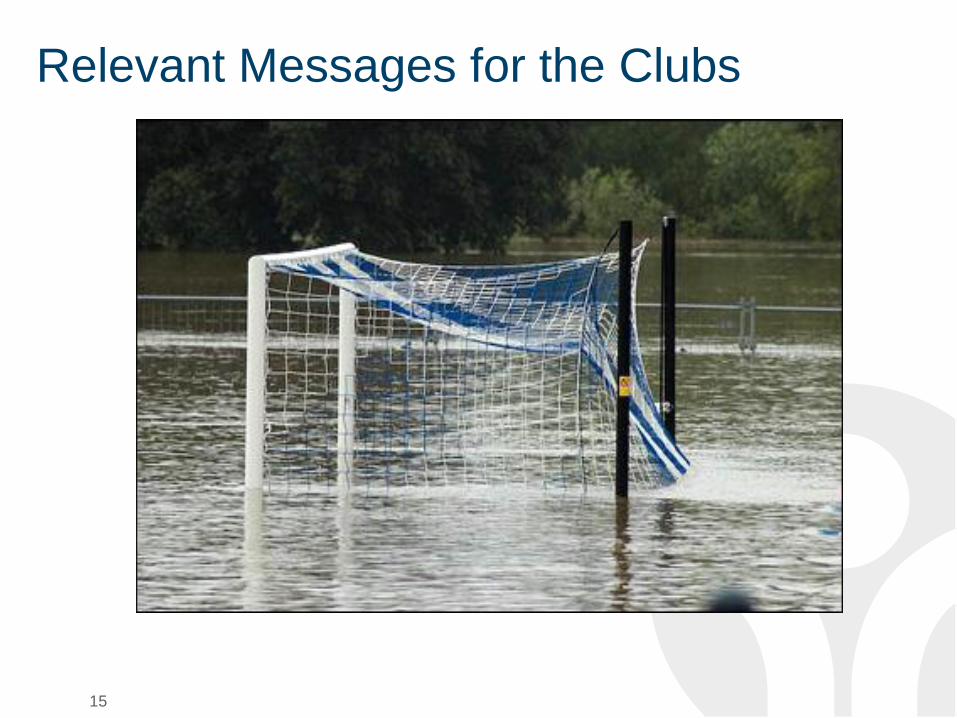
Relevant Messages for the Clubs
15
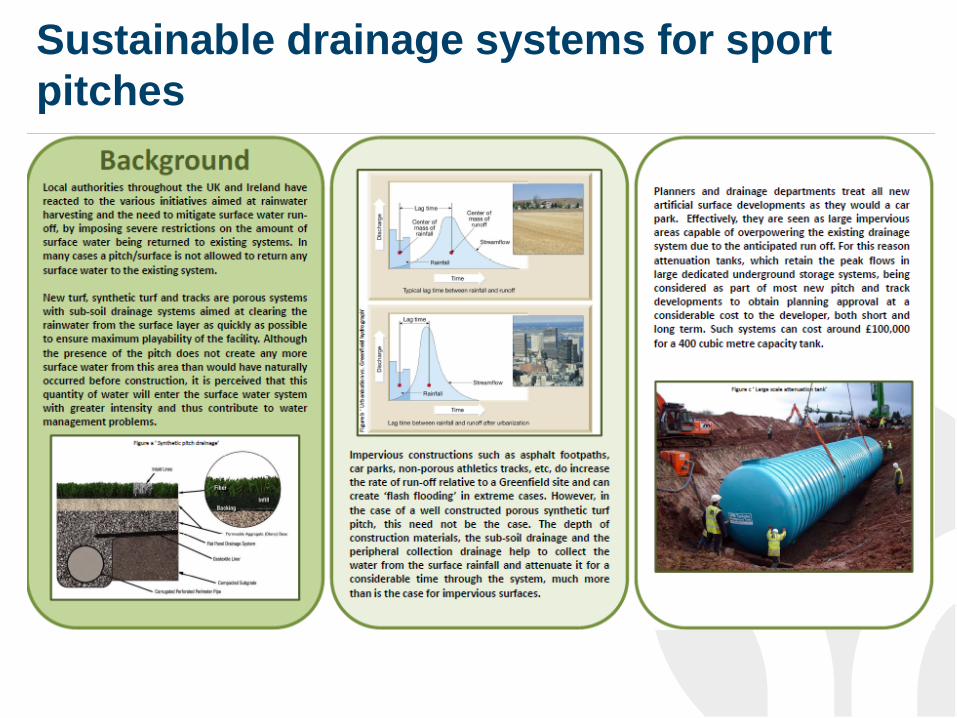
Sustainable drainage systems for sport
pitches
Creating sporting opportunities in every community 16
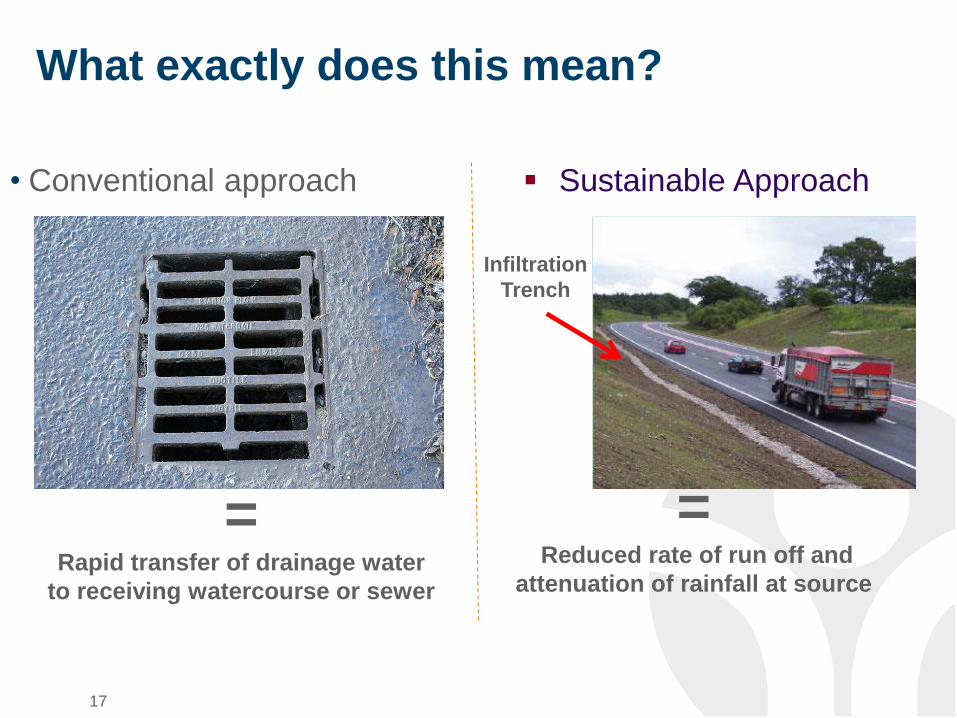
What exactly does this mean?
• Conventional approach
17
Sustainable Approach
= Rapid transfer of drainage water
to receiving watercourse or sewer
= Reduced rate of run off and
attenuation of rainfall at source
Infiltration
Trench
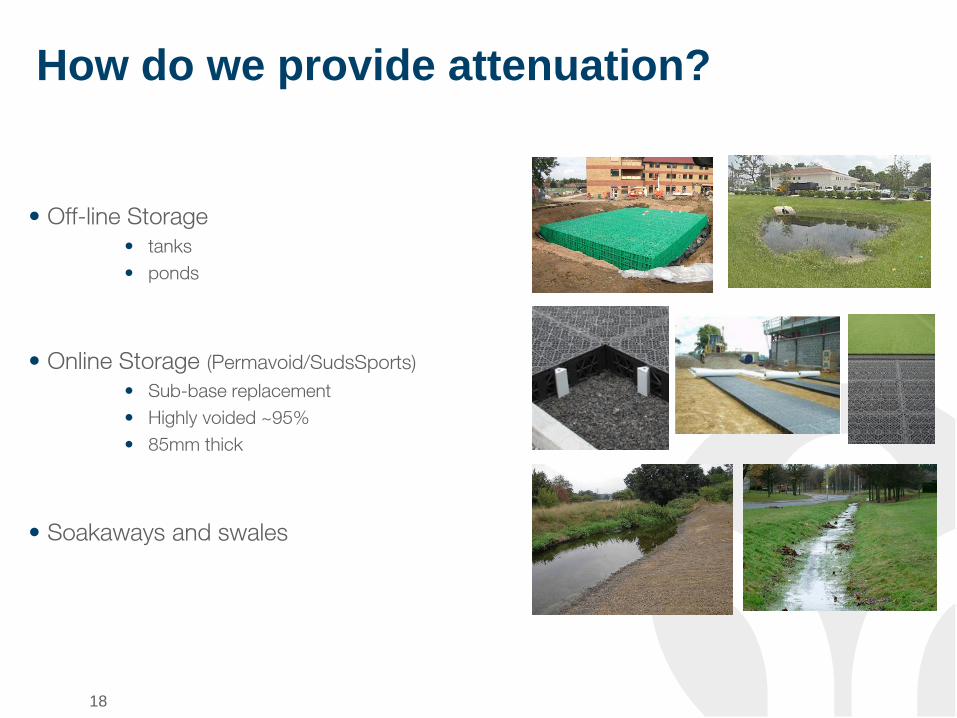
How do we provide attenuation?
• Off-line Storage
• tanks
• ponds
• Online Storage (Permavoid/SudsSports)
• Sub-base replacement
• Highly voided ~95%
• 85mm thick
• Soakaways and swales
18
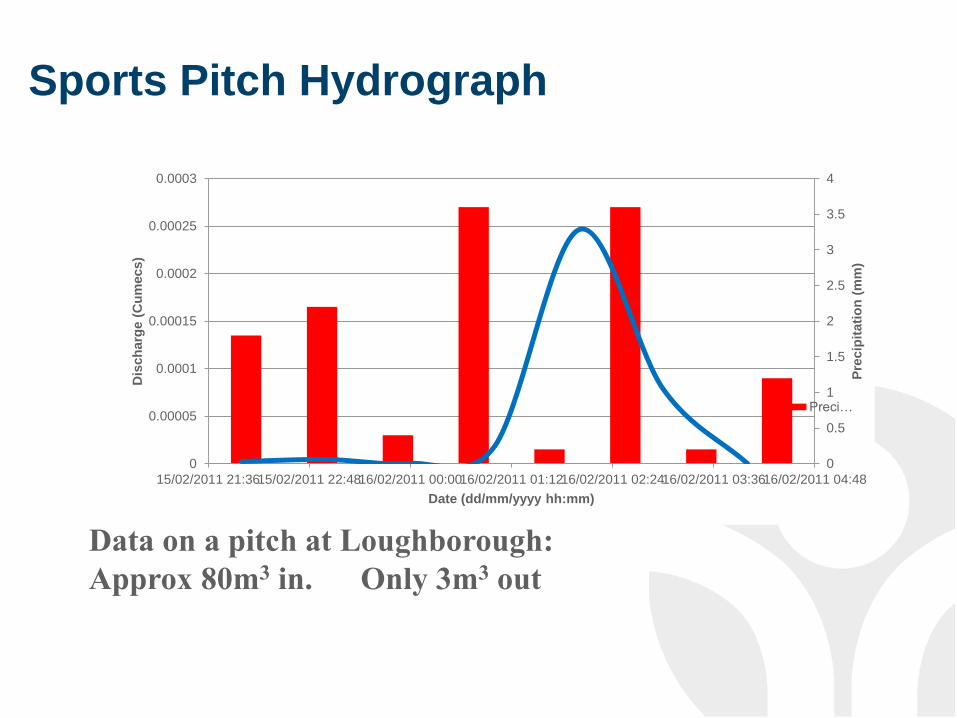
Sports Pitch Hydrograph
0
0.5
1
1.5
2
2.5
3
3.5
4
0
0.00005
0.0001
0.00015
0.0002
0.00025
0.0003
15/02/2011 21:3615/02/2011 22:4816/02/2011 00:0016/02/2011 01:1216/02/2011 02:2416/02/2011 03:3616/02/2011 04:48
Pre
cip
itati
on
(m
m)
Dis
ch
arg
e (
Cu
mecs)
Date (dd/mm/yyyy hh:mm)
Preci…
Data on a pitch at Loughborough:
Approx 80m3 in. Only 3m3 out
ECB Presentation Template - 24.1.05 Page 20
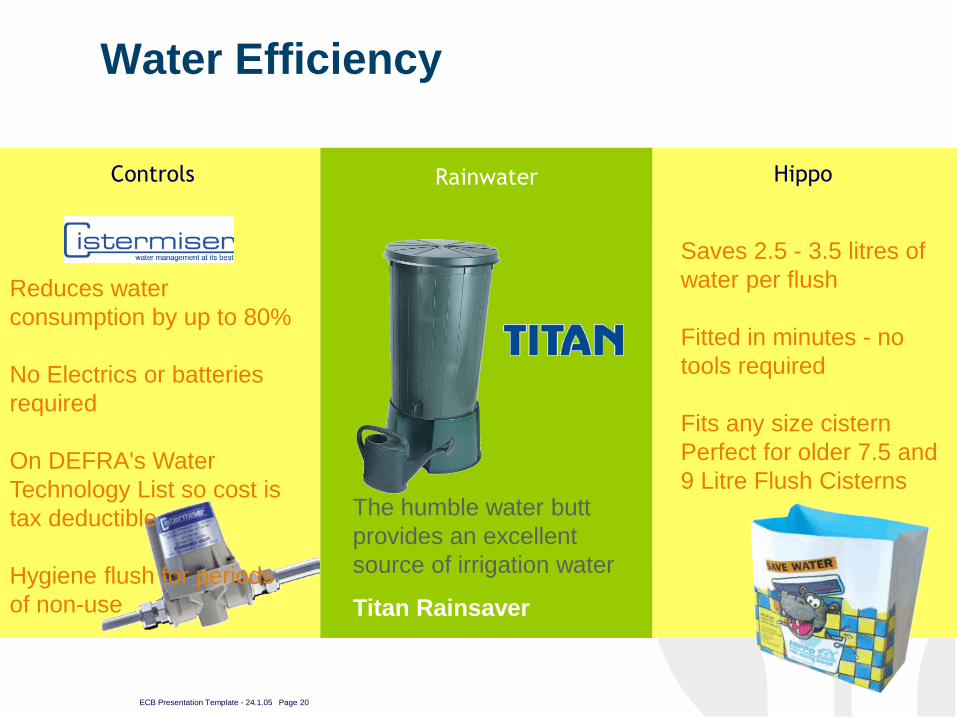
Controls
Water Efficiency
Hippo Rainwater
The humble water butt
provides an excellent
source of irrigation water
Titan Rainsaver
Reduces water
consumption by up to 80%
No Electrics or batteries
required
On DEFRA's Water
Technology List so cost is
tax deductible
Hygiene flush for periods
of non-use
Saves 2.5 - 3.5 litres of
water per flush
Fitted in minutes - no
tools required
Fits any size cistern
Perfect for older 7.5 and
9 Litre Flush Cisterns

ECB Presentation Template - 24.1.05 Page 21
Insulation
Natural Wool Glass
Wool
Mineral Wool PIR Polyisocyanurate
ECB Presentation Template - 24.1.05 Page 22
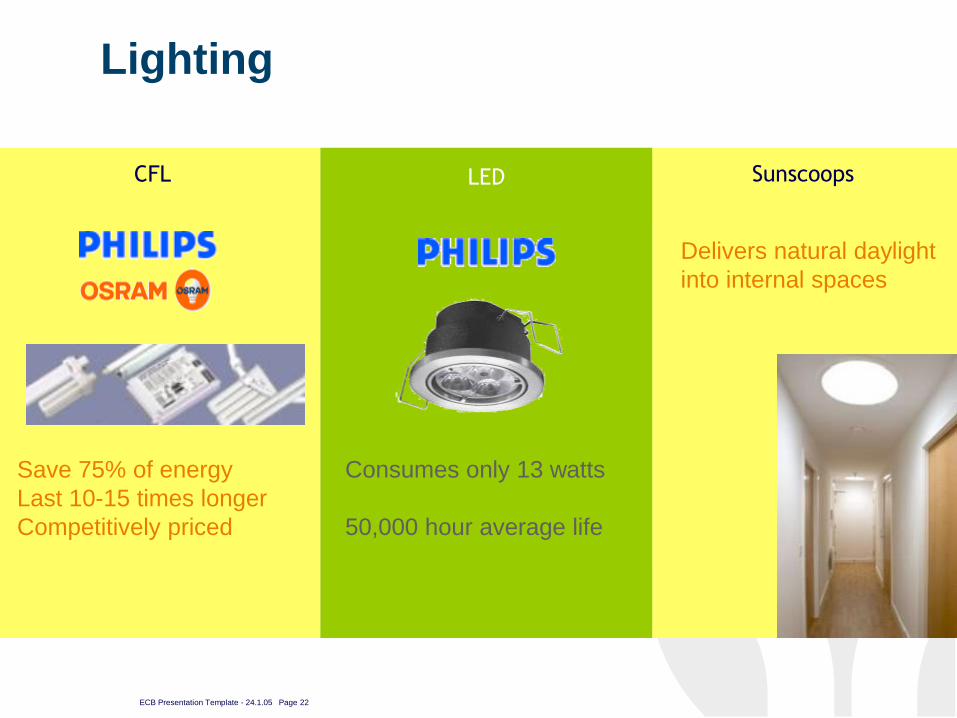
CFL
Lighting
Sunscoops LED
Save 75% of energy
Last 10-15 times longer
Competitively priced
Consumes only 13 watts
50,000 hour average life
Delivers natural daylight
into internal spaces
ECB Presentation Template - 24.1.05 Page 23
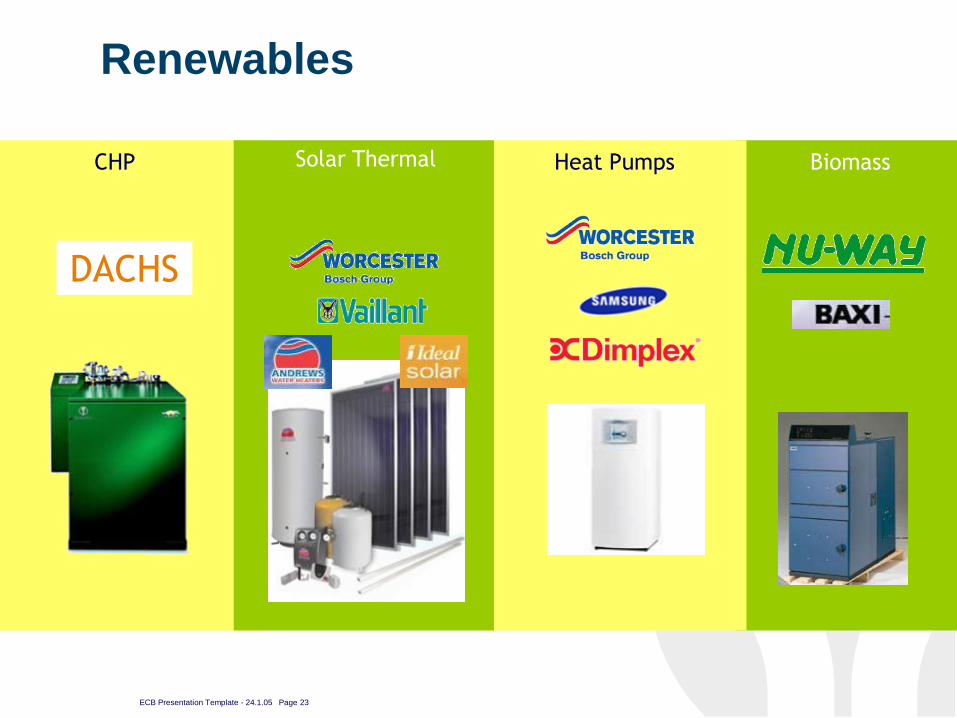
CHP
Renewables
Biomass Heat Pumps Solar Thermal
DACHS
Influence with our Investment
TJ
GHJGHJ
GHJGHJ
TJ
GHJGHJ
GHJGHJ
FDGDFGFD
YUIYUI
FJKKDFKFHDGKJDHFG
DFKJHGJKDFHGKDF
JFGJDFHGKJDHFGKD
KFHGKDJFHGKDHFGK
DFKGHDFKHG
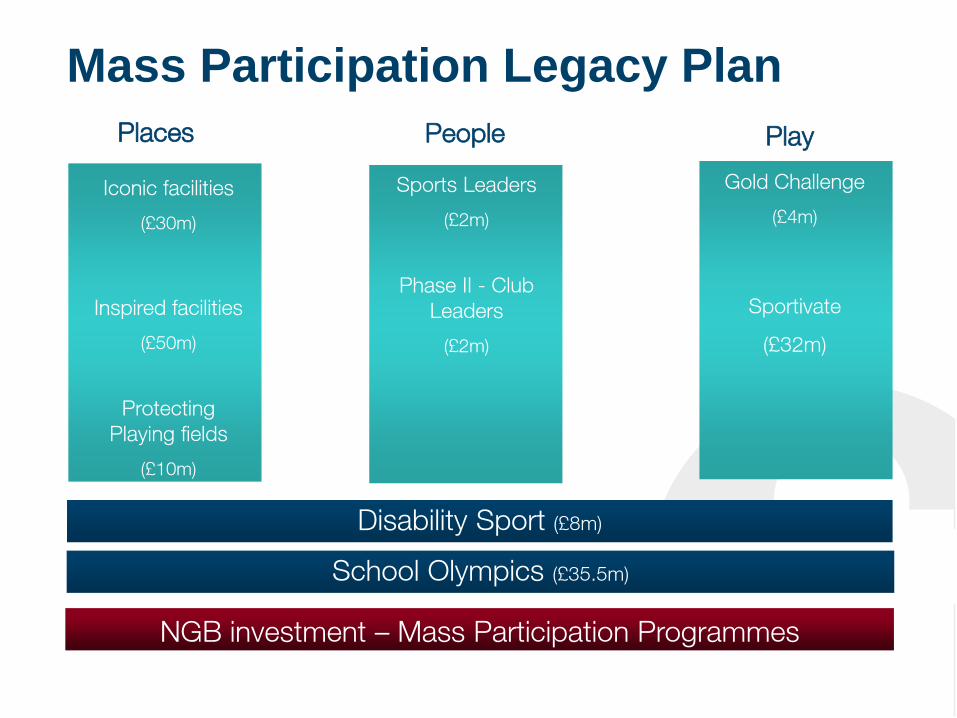
Mass Participation Legacy Plan
Iconic facilities
(£30m)
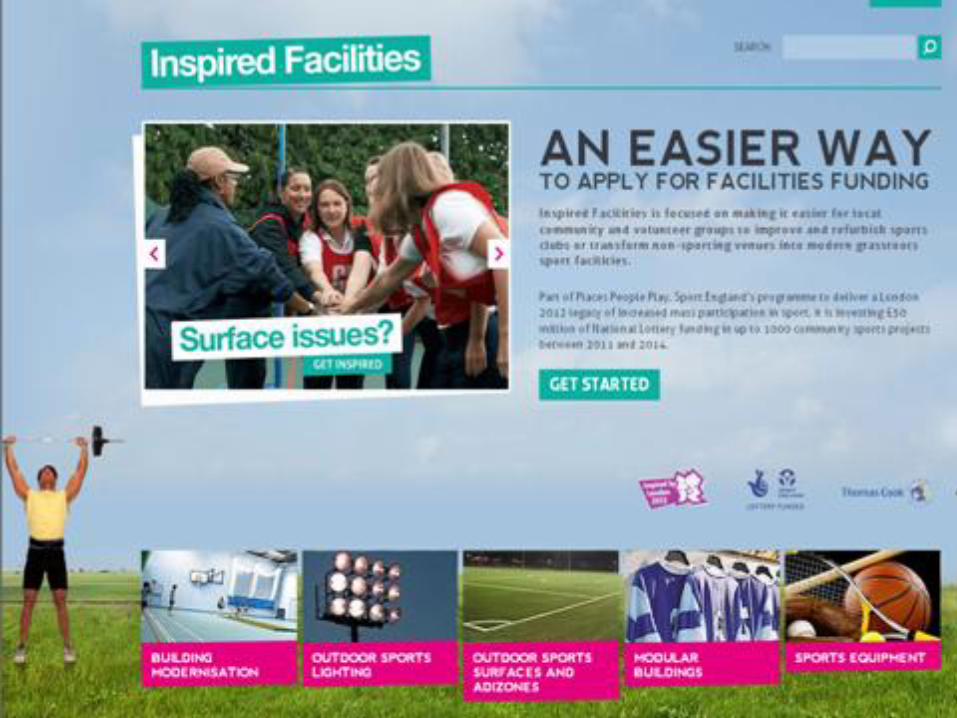
Inspired facilities
(£50m)
Protecting
Playing fields
(£10m)
Places People Play
Sports Leaders
(£2m)
Phase II - Club
Leaders
(£2m)
Gold Challenge
(£4m)
Sportivate
(£32m)
Disability Sport (£8m)
NGB investment – Mass Participation Programmes
School Olympics (£35.5m)
In Conclusion
ECB Presentation Template - 24.1.05 Page 30
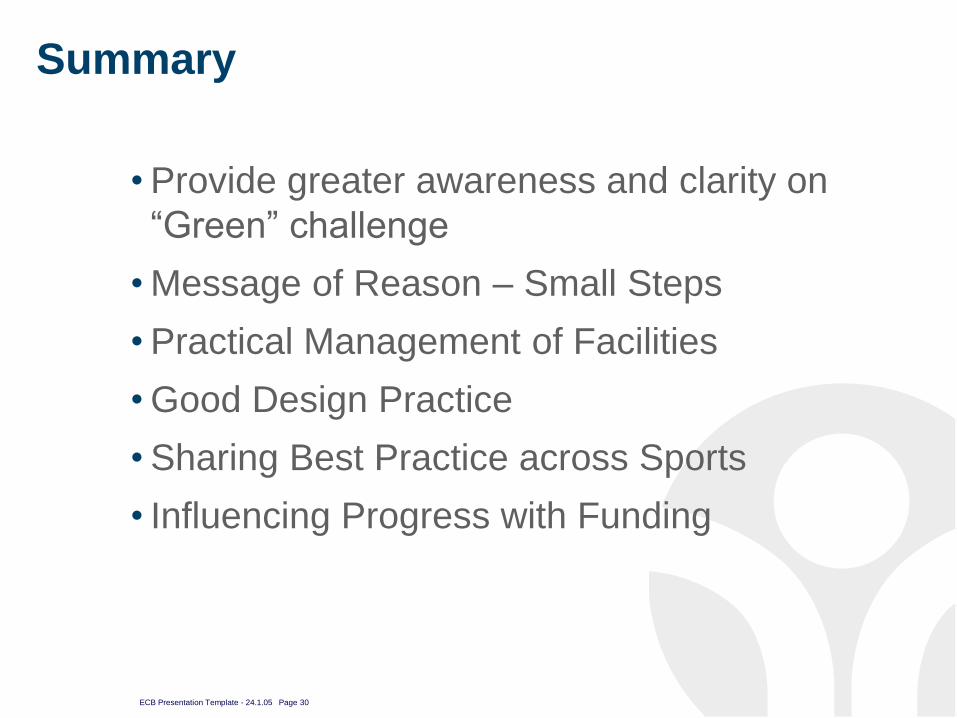
Summary
• Provide greater awareness and clarity on
“Green” challenge
• Message of Reason – Small Steps
• Practical Management of Facilities
• Good Design Practice
• Sharing Best Practice across Sports
• Influencing Progress with Funding
Sustainability in Community Sport
October 2011
Charles Johnston
Property Director
Sport England
Creating sporting opportunities in every community