Embed Size (px)
Citation preview
The role of nitrous oxide in the agricultural greenhouse gas budget
Ute Skiba Centre for Ecology and Hydrology
Bush Estate, near Edinburgh [email protected]

• Long lived greenhouse gas >100 years • Responsible for 10% of the total global anthropogenic radiative forcing •Largest source of stratospheric NOx (ozone hole) • ~77% is produced by microorganisms
•nitrification/denitrification
Nitrous Oxide: The Facts

The atmospheric increase of N2O is largely attributed to agricultural activity and CH4 to fossil fuel use and animal rearing
Atmospheric increase of N2Oand CH4

Agriculture is responsible for 10% of UK GHG emissions 5.4% N2O, 4% CH4, 0.7% CO2
0
200
400
600
MT
CO
2e
q in
20
12
Agriculture All sources
UK Agricultural sources 0.9% CO2
44% CH4
81% N2O of annual budgets
CO2
CH4
N2O
+ Waste

0
5
10
15
20
25
30
NAEI 2009 'Agricultural sources'G
g N
2O
Agricultural emissions
Gg N2O
Direct 51.4
Indirect 29
manure 6.4

Intensively managed grasslands are important sources of N2O
• Dominant in western high rainfall areas
• Large and frequent input of N fertiliser
• Soil compaction by livestock
Easter Bush

The role of N2O in the GHG budget at Easter Bush
•Eddy covariance flux measurements • CO2 since 2002 • CH4 short campaigns • N2O several ~ 1 year campaigns
•Manual static chamber measurements since 2002 • weekly/fortnightly 2006 – 2010
•Chamber/eddy covariance inter-comparison campaigns •Livestock CH4 /eddy covariance •Carbon stocks – ploughing effects •Carbon and nitrogen budgets

Rainfall and fertiliser induced N2O emissions
-500
0
500
1000
1500
2000
17
.1.0
7
20
.03
.07
18
.04
.07
21
.5.0
7
10
.7.0
7
30
.7.0
7
24
.9.0
7
27
.11
.07
18
.3.0
8
6.4
.08
18
.4.0
8
16
.5.0
8
19
.6.0
8
04
.07
.08
01
.08
.08
29
.08
.08
23
.9.0
8
19
.2.0
9
6.4
.09
15
.5.0
9
23
.6.0
9
27
.7.0
9
21
.8.0
9
21
.10
.09
9.3
.10
12
.4.1
0
21
.5.1
0
28
.6.1
0
so
il N
2O
-N fl
ux
es
(mg
m-2
h-1
)
N2O fluxes at Easter Bush grassland 2007 - 2010N2O loss as % of N fertiliser input
2007 6.52008 3.32009 1.42010 1.4
red arrows: N fertiliser application
-500
0
500
1000
1500
2000
17.1
.07
20.0
3.0
7
18.0
4.0
7
21.5
.07
10.7
.07
30.7
.07
24.9
.07
27.1
1.0
7
18.3
.08
6.4
.08
18.4
.08
16.5
.08
19.6
.08
04.0
7.0
8
01.0
8.0
8
29.0
8.0
8
23.9
.08
19.2
.09
6.4
.09
15.5
.09
23.6
.09
27.7
.09
21.8
.09
21.1
0.0
9
9.3
.10
12.4
.10
21.5
.10
28.6
.10
so
il N
2O
-N fl
uxes
(mg
m-2
h-1
)
N2O fluxes at Easter Bush grassland 2007 - 2010N2O loss as % of N fertiliser input
2007 6.52008 3.32009 1.42010 1.4
red arrows: N fertiliser application
Skiba et al, 2013, Biogeosciences, 10, 1231–1241
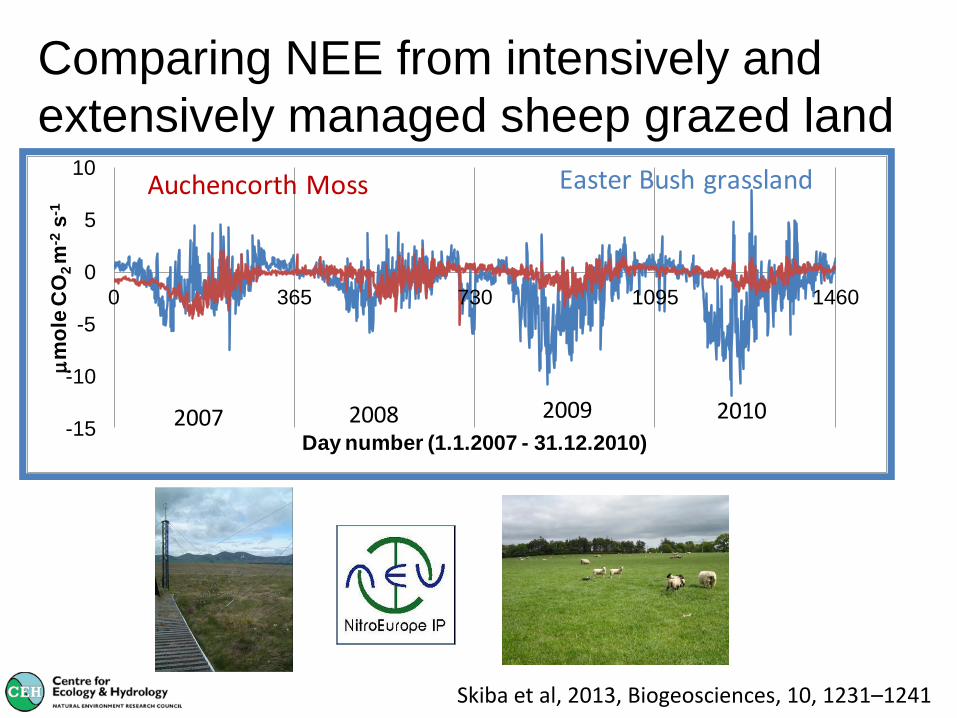
Comparing NEE from intensively and
extensively managed sheep grazed land
-15
-10
-5
0
5
10
0 365 730 1095 1460
mm
ole
CO
2 m
-2s
-1
Day number (1.1.2007 - 31.12.2010)
Easter Bush grassland
2007 2008 2009 2010
Auchencorth Moss
Skiba et al, 2013, Biogeosciences, 10, 1231–1241

Measuring ruminant CH4 fluxes by eddy covariance showed agreement with IPCC emission factor
Methane flux measured by EC in 2010 using Li-7700 open-path CH4 sensor
Dengel et al, 2011 Global Change Biology doi: 10.1111/j.1365-2486.2011.02466.x

Greenhouse gas budget for the intensively managed grassland (Easter Bush) 2002 - 2010
-2500
-2000
-1500
-1000
-500
0
500
1000
2002
2003
2004
2005
20
06
2007
2008
2009
2010
g C
O2
equ
ival
ent m
-2y-1
CO2 N2O CH4
Ave
rage
On average 60% of NEE sequestration is counteracted by N2O & CH4 emissions

Carbon budget for the intensively managed grassland (Easter Bush) 2002 - 2010
-700
-600
-500
-400
-300
-200
-100
0
100
200
300
400
2002
2003
2004
2005
2006
2007
2008
2009
2010
aver
age
Car
bo
n in
pu
t (-
) an
d lo
sses
(+)
[g C
m2
y-1
CH4 (enteric ferm.)
CH4 (excretion)
CH4 (soil)
CH4 (organic fert.)
Leaching*
Wool
Meat
Harvest
Organic fert.
CO2 (NEE)
Net sequestration of -180.7 (91.5) g C m-2y-1

Two ways to study carbon cycling
• Eddy covariance measurements of net ecosystem exchange of CO2 and C losses
• Soil carbon stock measurements
2004 & 2011
100* 60 cm cores
Marion Schrumpf (MPG, Jena, DE) CarboEurope

The intensively managed grazed grassland in SE Scotland on clay loam soil is NOT a significant carbon sink
Net C sequestration (- export of cut grass, meat,
wool, C leaching, CH4) -180.7 (91.5) g C m-2y-1
Carbon stock change 9.0 ± 215 g C m-2y-1

Intensively managed grazed grasslands are a net source of nitrous oxide from soil
methane from ruminants But it is unlikely that these emissions are off-set by carbon
sequestration Ploughing does lead to large CO2 losses

Can grasslands be carbon neutral?
Jean-Francois Soussana, Gilles Lemairec:
Coupling carbon and nitrogen cycles for environmentally sustainable intensification of grasslands and crop-livestock systems
Agriculture, Ecosystems and Environment 190 (2014) 9–17
Extensive grazing can increase soil N cycling and C sequestration. What is the tipping point to a N2O/CH4 emitting system? How can management be used to minimise N2O/CH4 emissions and increase C sequestration?
DEFRA GHG Platform Project
NitroEurope
CarboEurope
GREENGRASS