Embed Size (px)
Citation preview
5/13/2018 view_file - slidepdf.com
http://slidepdf.com/reader/full/viewfile 1/7
Stress-Strain Modeling of
270 ksi Low-Relaxation
Prestressing StrandsRaviK.Devalapura
Graduate Research Assistant
Department of Civil Engineering
University of Nebraska-Lincoln
Omaha, Nebraska
Maher K . Tadros, Ph.D. ,P.E.Cheryl W. Prewett Professor
and Director of Center for
Infrastructure Research
Department of Civil Engineering
University of Nebraska-Lincoln
Omaha, Nebraska
100
A stress-strain relationship for Grade 270
low-relaxation prestressing strands is
presented. It is based on recent extensive
testing by the authors requested by the PCI
Industry Handbook Committee. The testing
has resulted in refined constants of the
previously developed power formula which
has been shown in several studies to predictprestressing steel stress for a given strain to
within 1 percent error of any prescribed
experimental value. Tables and stress-strain
graphs for other common types of pre-
stressing steel are reproduced here, from an
earlier study, for the convenience of readers.
Skogman et a1. . presented a formula for predicting the
stress-s.train relationShiP. ~.or.any type o.f prestressing
steel, the so-called "power formula." Its general form is:
(I)
where fp s is the stress corresponding to a given strain c p s ; E,
Q, K and R are curve fitting constants, and fp y is the stress at
1 percent strain.
The stress fp y may be taken from experimental results or
to comply with ASTM minimum standards. For example,ASTM A-4161 spec ifies that minimum fp y for Grade 270,
low-relaxation steel be equal to 0.9 of the breaking stress,
i.e., 0.9(270) = = 243 ksi (1676MPa).
PCI JOURNAL

5/13/2018 view_file - slidepdf.com
http://slidepdf.com/reader/full/viewfile 2/7
A simple procedure for calculating the four power formu-
la constants to provide a close fit of the power formula to a
prescribed experimental curve is given by Mattock.' He
showed that the theoretical curve can be made to produce
stresses within 1 percent of the prescribed values. Other in-
dependent studies by Skogman et a1.,1Naarnan,' Harajli and
Naarnan,' and Menegotto and Pinto" have confirmed the
great accuracy and versatility of the power formula.
As part of the work of Skogman et a1.,1constants for the
commonly used types of prestressing steel were developed.
These constants were based on a number of actual stress-
strain curves supplied by steel manufacturers. Use of the so-
called "typical" curves was avoided since they generally
were supplied as theoretical curves coinciding with ASTM
minimums.
Due to the scarcity of the available actual curves, the con-
stants developed in Ref. 1 were based on conservative as-
sumptions. The prediction curves were in some instances
significantly lower than the lowest available experimental
curves.
The PCI Industry Handbook Committee requested that theUniversity of Nebraska conduct additional experimental
work to serve two purposes:
(a) Provide for a larger population of experimental stress-
strain curves and thus more viable statistical lower bound
analysis.
(b) Investigate the influence of the variability of stress-
strain curves supplied by manufacturers, which were de-
rived from tests conducted on different types of steel and
various testing machines by different operators.
Twenty-eight strands supplied directly by precast concrete
producers, from four different strand manufacturing sources,
were tested. All strands were Grade 270 low-relaxation
strands as this type appeared to be the most widely used by
producers in the United States. The number of specimens
representing other grades was not large enough to allow use-
ful statistical analysis. No attempt was made to obtain speci-
mens directly from strand manufacturers ..Producer-supplied
specimens were believed to be a more accurate representa-
tion of the steel actually used in concrete products.
The results of the 28 tests conducted at Nebraska were
compared with those of 28 others conducted by manufactur-
ers. Almost equal levels of stresses were observed in the e-
braska tests. The 56 curves were combined and a statisticallower bound curve was derived. The power formula con-
stants were then developed such that the prediction curve
would meet two requirements: (a) as close a fit as possible
to the experimental lower bound, and (b) predicted stress at
1 percent strain is equal to the ASTM minimum f " y " " 0.9 f p I I
= 243 ksi ([676 MFa).
An upper limit was also placed on fp s equal to ASTM
minimum specified f p l I = 270 ksi (1862 MPa). Both ASTM
fp y and fp u values were found to be significantly lower than
the experimental lower bound values. Thus, a reassessment
of the ASTM A-416 specification may result in an upward
revision of these minimums. However, until such revision ismade, the authors recommend that the current minimums
not be exceeded. This recommendation is not followed in
the current PCI Design Handbook formula,' which predicts
March-April 1992
Fig. 1. Testing setup with a failed specimen.
fp y = 0.92 f p u ' Additional comparisons between the proposed
prediction formula and other equations are made in a sepa-
rate section of this paper.
TESTING SETUP
A Tinius Olsen testing machine was used. An LVDT was
connected to the specimen to measure elongation using an
aluminum bracket system (see Fig. l),Aluminum angles
were placed between the strand and the machine grips to
prevent the grip threads from "biting" on the strand wires
and causing premature stress concentration failure.' This ar-
rangement proved satisfactory and strand breakage took
place away from the grips, with the classical wire "necking"
before breakage. The specimen length, loading rate and
other details were in accordance with ASTM.9
DISCUSSION OF TEST RESULTS
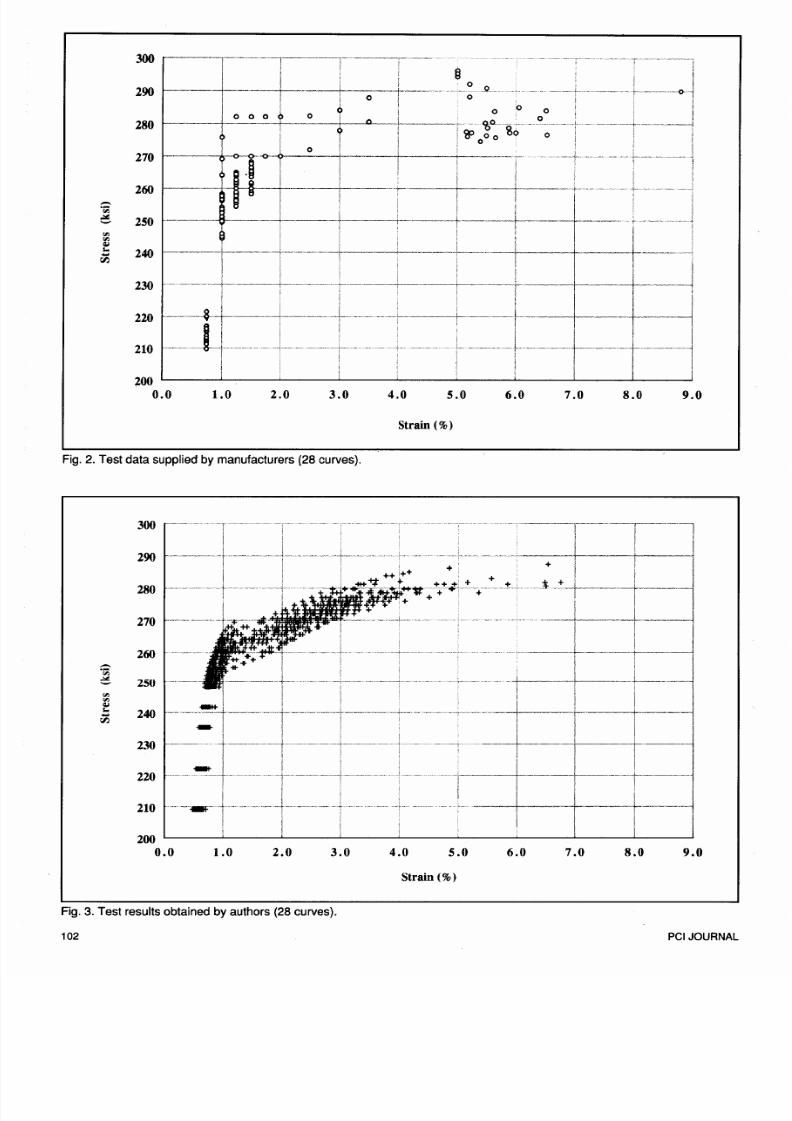
Fig. 2 shows plots of the test results supplied by strand
manufacturers. It represents 14 specimens from Deriver,
seven from Springfield Industries, three from Surniden Wire
Products Corporation, two from Florida Wire and Cable
Company, one from Shinko Wire America Inc., and one
from ARMCO. Most of the stress-strain relationship data
were given in detail up to a 1.5 percent strain. The breaking
load was given for all specimens with ultimate elongation.
Fig. 3 shows the results of the 28 tests conducted by theauthors. The testing setup produced full stress-strain dia-
grams and no extrapolation had to be made. The specimens
obtained from various precast concrete producers were
traced back to the following sources: eight from Florida
Wire and Cable Company, three from Union Wire Rope,
nine from Shinko Wire America Inc., and eight from Ameri-
can Spring Wire Corp.
The results in Fig. 3 indicate a yield strength much higher
than the ASTM value of 0.9 fp w Also, the modulus of elas-
ticity was higher than the current typical value of 28,000 ksi
(193,060 MPa). Hence, a value of 28,500 ksi (196,508 MPa)
was used to derive the proposed curve. More details of thetest results are provided in Ref. 10 of this paper.
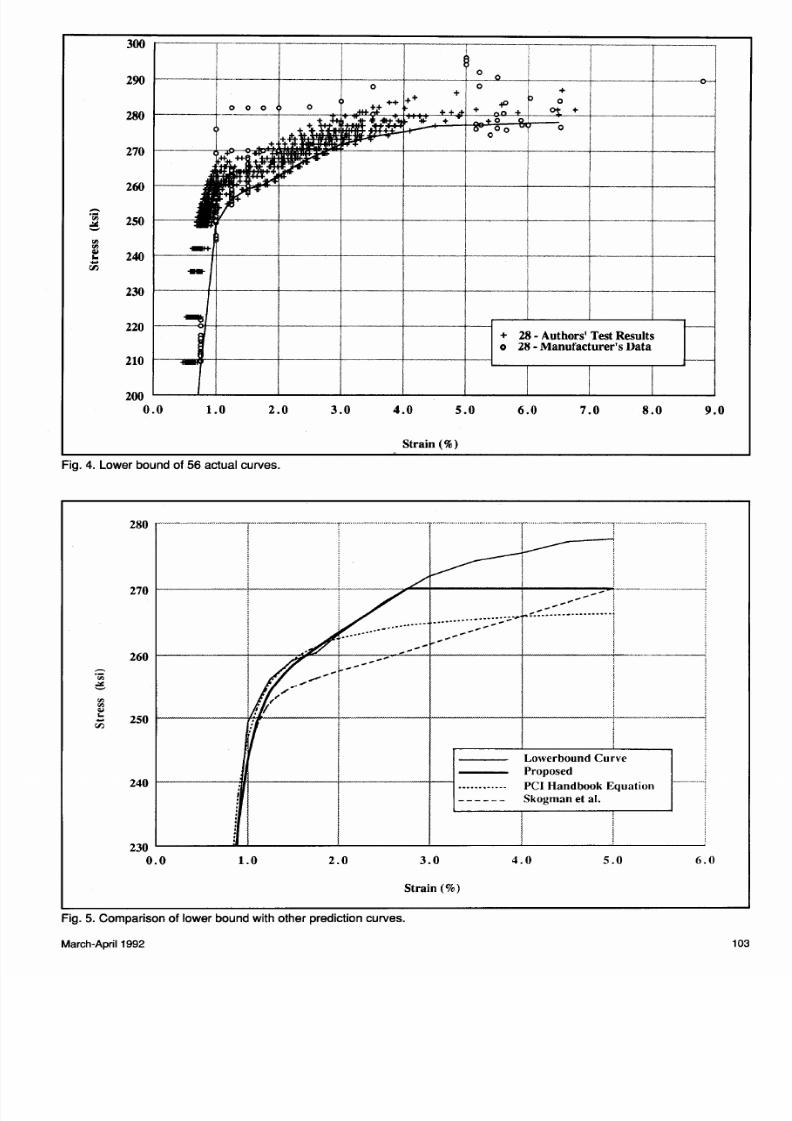
The two groups of tests are combined in Fig. 4. The re-
sults submitted by manufacturers appear to be consistent
101
5/13/2018 view_file - slidepdf.com
http://slidepdf.com/reader/full/viewfile 3/7
300
290
280
270
260
.--
.t;l
0 250
tiltil
~'" 240-
230
220
210
i
00 i
0 0 i
0 0o 0 0 0n nO
0f---"
I ~ o g 0 % 6I0
0.-0-"
~
--" """"...-. . . . .
...
!
S ! i
Ii i
i Iv
.. _ " ._--"
i !200
0.0 1.0 2.0 3.0 4.0 5.0 6 .0 8.0 9.0.0
Strain (%)
Fig. 2. Test data supplied by manufacturers (28 curves).
300
290
280
270
260
.--
.t;l
0 250
tiltil
~
'"240
-230
220
210
i
+ +
_-+1: ++_+ +
+ + t ++.+ +
. : \ i . l ,. t t . " . ,, : , ; ?Jt~+ * + ++
.+ . i~.
~~w.J. ~+~. . II!U!' .... : : . I t : ,1 * : + + .
i
-- i
-- -
200
0.0 1.0 2.0 3.0 4.0 7.0 8.0 9.0.0 6.0
Strain (%)
Fig. 3. Test results obtained by authors (28 curves).
102 PCI JOURNAL
5/13/2018 view_file - slidepdf.com
http://slidepdf.com/reader/full/viewfile 4/7
3 0 0
2 9 0
280
2 7 0
2 6 0
- --'" 2 5 0
= -'"'"~
2 4 0. .-I:l2 3 0
2 2 0
2 1 0
2 0 0
0 . 0
--
1.0
o
+ 28 - Authors' Test Resultso 28 - Manufacturer's Data
9.0. 0 3 . 0 4.0 5 . 0 6.0 7 . 0 8.0
Fig. 4. Lower bound of 56 actual curves.
Strain (%)
I I / - - " ~ " ' ; ' ' ' '-> !1,/ Ii !; I 'i---------i'f+-----!-------t-------i------f----,,-,,---.
1 I I !I
Lowerbound CurveProposed
PCI Handbook EquationSkogman et al.
2 4 0 I-------.lfi------!-------+---l .
!
260
- -r;;. . : . :~
'"' "~. . . 2 5 0-I:l
6 . 0
230 ~ -4~ ~ ~ ~ ~ ~
0.0 1.0 3 . 0 5 . 0. 0.0
Strain (%)
Fig. 5. Comparison of lower bound with other prediction curves.
March·April 1992 103
5/13/2018 view_file - slidepdf.com
http://slidepdf.com/reader/full/viewfile 5/7
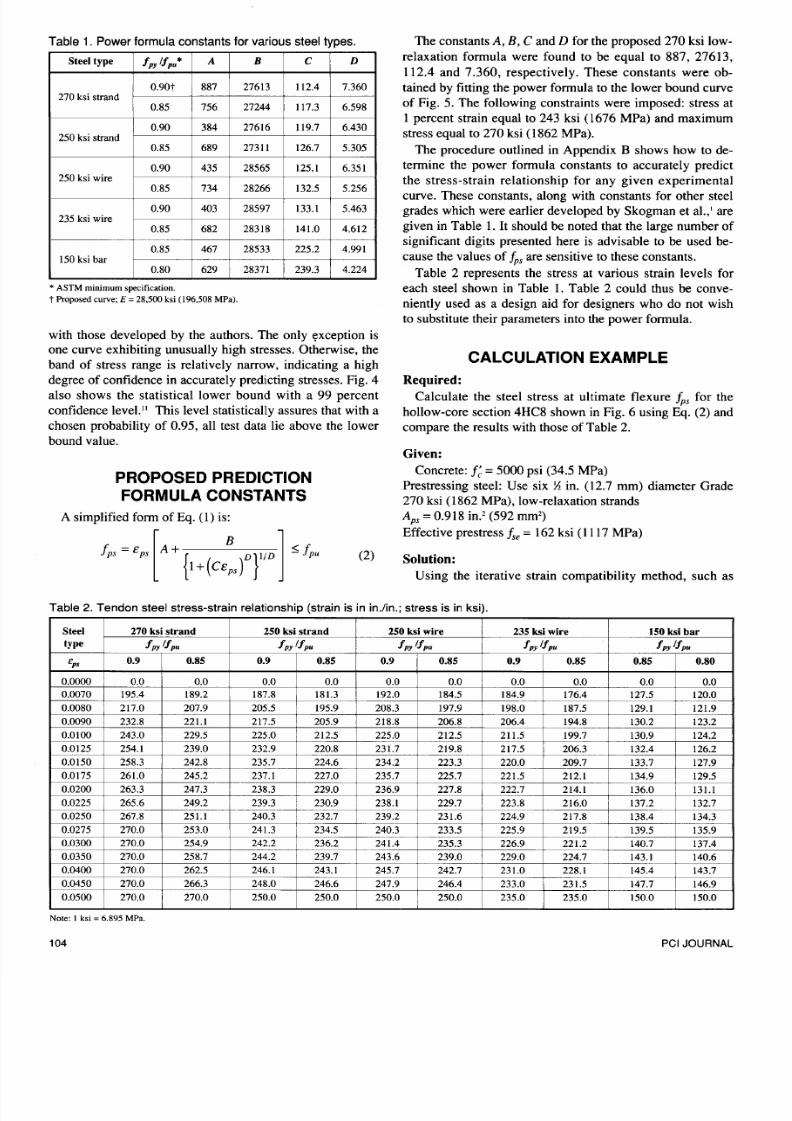
T ab le 1 . P ow er fo rm ula c on sta nts fo r v ario us s te el ty pe s.
Steel type fpy I fpu '" A B C D
0.90t 887 27613 112.4 7.360270 ksi strand
0.85 756 27244 117.3 6.598
0.90 384 27616 119.7 6.430
250 ksi strand
0.85 689 27311 126.7 5.305
0.90 435 28565 125.1 6.351
250 ksi wire0.85 734 28266 132.5 5.256
0.90 403 28597 133.1 5.463235 ksi wire
0.85 682 28318 141.0 4.612
0.85 467 28533 225.2 4.991
150 ksi bar
0.80 629 28371 239.3 4.224
• ASTM minimum specification.
t Proposed curve; E = 28,500 ksi (196,508 MPa).
with those developed by the authors. The only exception is
one curve exhibiting unusually high stresses. Otherwise, the
band of stress range is relatively narrow, indicating a high
degree of confidence in accurately predicting stresses. Fig. 4
also shows the statistical lower bound with a 99 percent
confidence level." This level statistically assures that with a
chosen probability of 0.95, all test data lie above the lower
bound value.
PROPOSED PREDICTION
FORMULA CONSTANTS
A simplified form ofEq. (1) is:
ips =Cps [ A + 1 B D r " 1 s ipu
1+ ( C c ps)
The constants A, B, C and D for the proposed 270 ksi low-
relaxation formula were found to be equal to 887, 27613,
112.4 and 7.360, respectively. These constants were ob-
tained by fitting the power formula to the lower bound curve
of Fig. 5. The following constraints were imposed: stress at
1 percent strain equal to 243 ksi (1676 MPa) and maximum
stress equal to 270 ksi (1862 MPa).
The procedure outlined in Appendix B shows how to de-
termine the power formula constants to accurately predict
the stress-strain relationship for any given experimentalcurve. These constants, along with constants for other steel
grades which were earlier developed by Skogman et al.,' are
given in Table 1. It should be noted that the large number of
significant digits presented here is advisable to be used be-
cause the values of ips are sensitive to these constants.
Table 2 represents the stress at various strain levels for
each steel shown in Table 1. Table 2 could thus be conve-
niently used as a design aid for designers who do not wish
to substitute their parameters into the power formula.
CALCULATION EXAMPLE
Required:
Calculate the steel stress at ultimate flexure ips for the
hollow-core section 4HC8 shown in Fig. 6 using Eq. (2) and
compare the results with those of Table 2.
Given:
Concrete: i;= 5000 psi (34.5 MPa)
Prestressing steel: Use six X in. (12.7 mm) diameter Grade
270 ksi (1862 MPa), low-relaxation strands
Aps = 0.918 in.' (592 mm')
Effective prestress fs e = 162 ksi (1117 MPa)
( 2 ) Solution:
Using the iterative strain compatibility method, such as
Table 2. Tendon steel stress-strain relationship (strain is in in.lin.; stress is in ksi).
Steel 270 ksi strand 250 ksi strand 250 ksi wire 235 ksi wire 150 ksi bar
type fpylfpu fpy u; fpylfpu fpylfpu fpy u . :fps 0.9 0.85 0.9 0.85 0.9 0.85 0.9 0.85 0.85 0.80
0.0000 0.0 0.0 0.0 0.0 0.0 0.0 0.0 0.0 0.0 0.0
0.0070 195.4 189.2 187.8 181.3 I 192.0 184.5 184.9 176.4 127.5 120.0
0.0080 217.0 207.9 205.5 195.9 208.3 197.9 198.0 187.5 129.1 121.9
0.0090 232.8 221.1 217.5 205.9 218.8 206.8 206.4 194.8 130.2 123.2
0.0100 243.0 229.5 225.0 212.5 225.0 212.5 211.5 199.7 130.9 124.2
0.0125 254.1 239.0 232.9 220.8 231.7 219.8 217.5 206.3 132.4 126.2
0.0150 258.3 242.8 235.7 224.6 234.2 223.3 220.0 209.7 133.7 127.9
0.0175 261.0 245.2 237.1 227.0 235.7 225.7 221.5 212.1 134.9 129.5
0.0200 263.3 247.3 238.3 229.0 236.9 227.8 222.7 214.1 136.0 131.1
0.0225 265.6 249.2 239.3 , 230.9 238.1 229.7 223.8 216.0 137.2 132.7
0.0250 267.8 251.1 240.3 I 232.7 239.2 231.6 224.9 217.8 138.4 134.3
0.0275 270.0 253.0 241.3 i 234.5 240.3 233.5 225.9 219.5 139.5 135.9
0.0300 270.0 254.9 242.2 236.2 241.4 235.3 226.9 221.2 140.7 137.4
0.0350 270.0 258.7 244.2 239.7 243.6 239.0 229.0 224.7 143.1 140.6
0.0400 270.0 262.5 246.1 243.1 245.7 242.7 231.0 228.1 145.4 143.7
0.0450 270.0 266.3 248.0 246.6 247.9 246.4 233.0 231.5 147.7 146.9
0.0500 270.0 270.0 250.0 250.0 250.0I
250.0 235.0 235.0 150.0 150.0
Note: 1k si = 6.895 MPa.
104 PCI JOURNAL

5/13/2018 view_file - slidepdf.com
http://slidepdf.com/reader/full/viewfile 6/7
1-------4 -0"------1
lU2 '1[ .0 .0.00.0.0.) 1 "T·
F ig . 6 . P re ca st c on cr ete h ollo w-c or e s la b fo r c alc ula tio n
example.
that given in Ref. 1, cps = 0.017. Details are not shown here
for brevity.
1. Using Eq. (2), substitute the value of Cps and the constants
A, B, C and D from Table 1 that represent low-relaxation
strand:
- [ 27,613 1 < 270ips - 0.017 887 + 7.360 117.360 -
{1+(l12.4(0.017)) }
= 260.5 ksi (1796 MPa)
2. Interpolating values from Table 2, i p s = 260.6 ksi
(1797 MPa).
CONCLUSIONS
Examination of Fig. 5 reveals the following observations:
1. The proposed curve is extremely close to the experi-
mental lower bound curve. Yet, it satisfies the current
ASTM A-416 minimums.
2_ The proposed curve will give higher stresses than that
of Skogman et al. It also gives higher stresses than the PCI
Design Handbook formula for strains in excess of about 2
percent, which is common in double tees and hollow-core
slabs.
3. ASTM minimums are considerably lower than the ex-
perimentallower bound values.
REFERENCES
1. Skogman, C. B., Tadros, M. K., and Grasmick, R., "Flexural
Strength of Prestressed Concrete Members," PCI JOURNAL,
V. 33, No.5, September-October 1988,pp. 96-123.
March-April 1992
2. ASTM A-4l6, "Standard Specification for Steel Strand, Un-
coated Seven-Wire Stress-Relieved for Prestressed Concrete,"
American Society forTesting andMaterials, Philadelphia, PA.
3. Mattock, A. H., "Flexural Strength of Prestressed Concrete
Sections by Programmable Calculator," PCI JOURNAL, V.
24, No.1, January-February 1979,pp. 32-54.
4. Naaman, A. E., "Partially Prestressed Concrete: Review and
Recommendations," PCI JOURNAL, V. 30, No.5, November-
December 1985,pp. 31-47.
5. Harajli, M. H., and Naaman, A. E., "Evaluation of the Ultimate
Steel Stress in Partially Prestressed Flexural Members," PCIJOURNAL, V. 30, No.5, September-October 1985,pp. 54-81.
6. Menegotto, M., and Pinto, P. E., "Method of Analysis for
Cyclically Loaded R. C. Plane Frames, Including Changes in
Geometry and Non-Elastic Behavior of Elements Under Com-
bined Normal Force and Bending," International Association
for Bridge and Structural Engineering, Preliminary Report for
Symposium on Resistance and Ultimate Deformability of
Structures Acted on by Well-DefinedRepeated Loads, Lisbon,
Portugal, 1973,pp. 15-22.
7. PCI Design Handbook, Third Edition, Precast/Prestressed
Concrete Institute, Chicago, IL, 1985,pp. 11-18.
8. Preston, H. K., "Testing 7-Wire Strand for Prestressed Con-
crete - The State of the Art," PCI JOURNAL, V. 30, No.3,
May-June 1985,pp. 134-155.
9. ASTM A 370-77, "Standard Methods and Definitions for Me-
chanical Testing of Steel Products," American Society for
Testing and Materials, Philadelphia, PA.
10. Devalapura, R. K., and Tadros, M. K., "A Critical Assessment
of ACI Code Eq. (18-3) for Prestressing Steel Stress at Ulti-
mate Flexure," Paper accepted for publication in ACI Struc-
tural Journal, American Concrete Institute, Detroit, MI.
11. Benjamin, J. R., and Cornell, C. A., Probability, Statistics, and
Decision for Civil Engineers, McGraw-Hill Book Company,
1970.
ACKNOWLEDGMENT
The study presented here was funded in part by the
Precast/Prestressed Concrete Institute and by the Center for
Infrastructure Research at the University of Nebraska.
The authors wish to thank all the steel suppliers and man-
ufacturers who supplied the stress-strain curves and to the
precast concrete producers who furnished strand specimens
for testing.
105
5/13/2018 view_file - slidepdf.com
http://slidepdf.com/reader/full/viewfile 7/7
APPENDIX A - NOTATION
ip s = stress in prestressed reinforcement at ultimate flexure
fp u = specified tensile strength of prestressing tendons
ip y = specified yield strength of prestressing tendons
E, K, Q, RIA, B, C, D = constants used in power formula
cp s = strain in prestressed tendon reinforcement at ultimate
flexure
Cp u = ultimate strain in prestressing tendon
APPENDIX 8-
PROCEDURE TO DETERMINE POWER FORMULA CONSTANTS
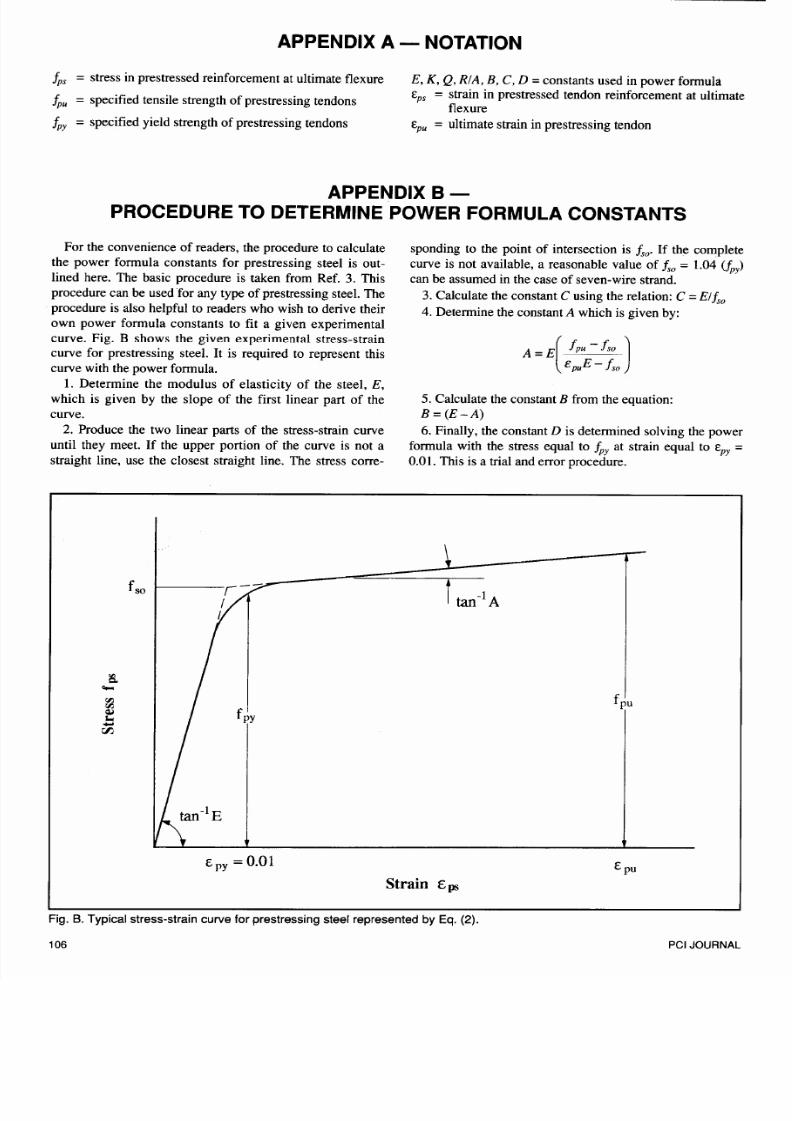
For the convenience of readers, the procedure to calculate
the power formula constants for prestressing steel is out-
lined here. The basic procedure is taken from Ref. 3. This
procedure can be used for any type of prestressing steel. The
procedure is also helpful to readers who wish to derive their
own power formula constants to fit a given experimental
curve. Fig. B shows the given experimental stress-strain
curve for prestressing steel. It is required to represent thiscurve with the power formula.
1. Determine the modulus of elasticity of the steel, E,
which is given by the slope of the first linear part of the
curve.
2. Produce the two linear parts of the stress-strain curve
until they meet. If the upper portion of the curve is not a
straight line, use the closest straight line. The stress corre-
sponding to the point of intersection is I s o . If the complete
curve is not available, a reasonable value of I s o = 1.04 ( fpy )
can be assumed in the case of seven-wire strand.
3. Calculate the constant C using the relation: C = Elisa
4. Determine the constant A which is given by:
5. Calculate the constant B from the equation:
B = (E-A)
6. Finally, the constant D is determined solving the power
formula with the stress equal to ip y at strain equal to cp y =0.01. This is a trial and error procedure.
IS .~rIJ fpurIJQ,j
' " '. . . .v:
Epy =0.01
StrainEps
Fig. B. Typical stress-strain curve for prestressing steel represented by Eq. (2).
106 PCI JOURNAL


