A mesoscopic simulation based
dynamic traffic assignment model
Authors:
M.P. Linares1,2, C. Carmona1, J. Barceló1,2, O. Serch1
1 inLab FIB Universitat Politècnica de Catalunya – BarcelonaTECH Jordi Girona 1-3 08034 Barcelona Spain
2 Departament d’Estadística i Investigació Operativa Universitat Politècnica de Catalunya – BarcelonaTECH Jordi Girona 1-3 08034 Barcelona Spain (mari.paz.linares, carlos.carmona, jaume.barcelo, oriol.serch)@upc.edu Tel: +34 93 401 6941
Paper submitted for presentation and publication to 93st Transportation Research Board 2014 Annual Meeting Washington, D.C. July 2013
# 6500 WORDS: + 4 Figures = 7500
TRB 2014 Annual Meeting Original paper submittal - not revised by author

Linares, Carmona, Barceló, Serch
2
ABSTRACT 1
Nowadays urban traffic is one of the main challenges for urban areas in terms of congestion, 2
accidents and pollution. This problem has been stressed by the increasing mobility promoted by the 3
use of private vehicles. So, the time wasted on users' trips has an important impact on urban 4
economy. In this context, transport models become relevant for the development of new strategies 5
and policies for a sustainable urban transport. In particular, models for traffic forecasting like 6
dynamic traffic assignment models, providing temporal coherent representation of the interactions 7
among traffic choices, flows, time and cost measures. In this paper, we develop a dynamic traffic 8
assignment model based on the dynamic user equilibrium by solving a variational inequalities 9
formulation under a preventive approach. An iterative solution algorithm, which is a modification of 10
the Method of Successive Averages, explicitly considers the time and a variable traffic demand on 11
each path of the network within the flow propagation and assignment processes. The dynamics of the 12
reassigned flows at each iteration is simulated by a new mesoscopic multiclass multilane simulation 13
model accounting for lane changes and traffic control at signalized intersections. 14
Keywords: dynamic traffic assignment, dynamic user equilibrium, mesoscopic traffic simulation, 15
Method of Successive Averages. 16
TRB 2014 Annual Meeting Original paper submittal - not revised by author

Linares, Carmona, Barceló, Serch
3
INTRODUCTION 17
The Dynamic Traffic Assignment (DTA) problem, which has been receiving the attention of the 18
researchers since the early 80's, can be considered as an extension of the traffic assignment problem 19
that is able to describe how traffic patterns evolve over time and space in the transport network 20
(Mahmassani [1]). 21
The increasing market penetration of the technologies, that underlie Intelligent Transport Systems 22
(ITS), has been one of the mean reasons to promote research on the problems of DTA, since belong 23
to the core models for ITS: advanced traffic management and traffic information systems. 24
DTA is aimed at determining time-dependent links and path flows in a congested road network 25
satisfying a set of individual objectives and/or an overall system goal. 26
According to the behavioral hypothesis modeling the individual decisions taken during the trip, the 27
DTA problems can be classified as follows: 28
• Dynamic System Optimum assignment (DSO) 29
• Dynamic User Equilibrium assignment (DUE) 30
Despite the mathematical difficulty involved in treating the DTA problems, this aspect does not 31
imply an obstacle to the different associated solution approaches associated when used real world 32
applications. In any case they must always be able of realistically reproducing observed traffic 33
behaviors. 34
The proposed approaches to solve the DTA problem may be classified into four broad 35
methodological groups: 36
• Mathematical programming 37
• Optimal control 38
• Variational inequalities 39
• Simulation 40
The first three groups of approaches are usually classified in turn into the so-called analytical 41
approaches. In these cases, the DTA problem is formulated as a mathematical problem which is 42
solved directly using optimization techniques. 43
Because of the limitations of mathematical programming and optimal control theory in DTA context 44
and the advantages offered by variational inequalities, analytical DTA models have migrated towards 45
the variational inequalities approach. An extended overview of mathematical programming, optimal 46
control and variational inequalities can be found in Peeta et al. [2]. 47
On the other hand, simulation based formulations, looking for approximate heuristic solutions with 48
reasonable computational costs, focus on enabling practical deployment for real networks. 49
While analytical models are mathematically rigorous, they rely on simplified assumptions to account 50
for traffic dynamics that make them unsuitable for large-scale real-world applications requiring 51
models that capture the stochastic characteristics of traffic dynamics in detail, by estimating and 52
predicting OD flows, travel times, queues and spill-backs, and dealing properly with flow 53
TRB 2014 Annual Meeting Original paper submittal - not revised by author

Linares, Carmona, Barceló, Serch
4
interruptions at signalized intersections These capabilities are generally beyond that of existing 54
analytical models, but within the abilities of simulation approaches. 55
LITERATURE REVIEW 56
The preceding section classified the DTA approaches into two groups: analytical and based on 57
simulation. Taking into account the above considerations we will focus our attention only on 58
simulation-based DTA models. 59
There are three types of simulation-based DTA models, which are distinguished based on the level of 60
granularity with which they represent the studied system. They range from low fidelity to high 61
fidelity as follows: 62
• Macroscopic simulation models 63
• Mesoscopic simulation models 64
• Microscopic simulation models 65
To begin with, macroscopic models treat traffic in an aggregate manner, such as a uniform or 66
homogeneous flow, without considering each constituent particle (individual vehicles). They 67
approximate flow propagation throughout the network using physical concepts and analytical 68
methods. Microscopic approaches model individual entities, decisions and interactions with higher 69
degree of detail. Each vehicle maneuvers at a specific simulation time step based on estimations 70
derived from a set of behavioral models, such as car following, lane changing, merging and yielding. 71
Mesoscopic models combine elements from microscopic and macroscopic approaches, representing 72
activities and interactions of each vehicle with less detail but still enough to account for the essentials 73
of traffic dynamics 74
Macroscopic Simulation-based DTA Models 75
Macroscopic DTA models apply physical analogies usually based on hydrodynamic theory in 76
describing traffic dynamics. The evolution of traffic over time and space is represented by a set of 77
differential equations, the continuum equation, the fundamental diagram and other equations in the 78
case of second order models, which are solved by numerical methods that have limitations in 79
appropriately including interactions between vehicles and roads. This is why some macroscopic 80
DTA models resort to simulation. 81
Macroscopic simulation-based DTA models, such as METANET [3] or INDY [4], describe both 82
traffic flow propagation and trip-maker decisions at aggregate level i.e. traffic is considered to be a 83
continuum in steady state. 84
In order to be able to simulate route choice decisions, in INDY, traffic flows are disaggregated by 85
route: traffic is assigned to a specific route by a route choice model. In METANET, traffic flows are 86
not disaggregated by route. Single commodity flows are routed by splitting proportions at network 87
nodes. The routes followed in a random network loading are generally not consistent with the route 88
flow rates resulting from the route choice model, since split proportions, which correspond to a given 89
route flow set, are not easily determinable. 90
91
TRB 2014 Annual Meeting Original paper submittal - not revised by author

Linares, Carmona, Barceló, Serch
5
Mesoscopic Simulation-based DTA Models 92
Mesoscopic simulation-based DTA models can either move individual vehicles or packets of 93
vehicles at an aggregate level, while trip-maker decisions are made individually; i.e. a microscopic 94
level of representation of individual trip-maker decisions is combined with a macroscopic description 95
of traffic flow propagation or Dynamic Network Loading (DNL). 96
Computation times in mesoscopic models are significantly reduced compared to microscopic models 97
due to the aggregate description of traffic flow. Mesoscopic models can computationally succeed in 98
the analysis of medium-sized networks. These models typically carry out both equilibrium 99
assignments and en-route assignments. 100
One way to simulate traffic is to group vehicles into packets, and route these packets through the 101
network (CONTRAM [5]). The packet of vehicles acts as one entity, sharing the speed determined 102
from the speed density function established for each link, and the density on the link at the moment 103
of entry. CONTRAM is based on time-dependent queuing theory. 104
Another mesoscopic paradigm is the queue-server approach used by some models, such as DynaMIT 105
[6] and DYNASMART [1]. In this approach, road segments are modeled with two parts: queuing 106
and moving. The vehicles travel through the moving part with the speed calculated using a 107
macroscopic speed-density function. DYNASMART and DYNAMIT use traffic models based on 108
flow that propagate vehicles on links according to a modified Greenshields speed-density 109
relationship. As the vehicle moves through the link, a queue-server transfers the vehicles 110
downstream to another link, or constructs queues on the current link, representing congestion. 111
Another DTA models based on mesoscopic simulation are METROPOLIS [7] and MEZZO [8]. The 112
last was developed at the Royal Institute of Technology as the mesoscopic component of a hybrid 113
mesoscopic-microscopic simulation model. 114
This approach combines the advantages of dynamic disaggregated traffic modeling (since the 115
vehicles are modeled individually), with an easy calibration and the use of macroscopic speed-116
density functions. 117
Microscopic Simulation-based DTA Models 118
Microscopic simulation-based DTA models describe traffic flow propagation with higher degree of 119
detail at the level of individual vehicles. They model the movement of each vehicle and their 120
interactions with each other and with the infrastructure. Trip-maker decisions such as route choice 121
are represented at individual level as well. 122
Traffic flow propagation in microsimulation models combines mathematical car-following and gap 123
acceptance models, with heuristics representing driver behavior (e.g. lane-changing behavior, gap 124
acceptance). In addition, traffic control, including signal operation, location and traffic detectors, are 125
also modeled in detail. These models require the detailed calibration of model parameters, which is a 126
very time consuming, and computationally costly task. 127
In the microscopic TRANSIMS model [9], traffic propagation is based on a cellular automata 128
technique for car-following and lane-changing, enhanced by additional rules for elements such as 129
signals, weaving lanes, unprotected turns, etc. The lanes of all links of the network are divided into 130
TRB 2014 Annual Meeting Original paper submittal - not revised by author

Linares, Carmona, Barceló, Serch
6
cells of equal size, which are either empty or occupied by a single vehicle. Since there are less model 131
parameters, cellular automata models are easier to calibrate. 132
In the microscopic-based DTA model DTASQ [10], later the commercial software DYNAMEQ, 133
attempts to capture the effects of car-following, gap acceptance and lane changing with a minimum 134
number of parameters. This leads to a reduction in the calibration effort. The simulation, based on a 135
simplified car-following relationship (ultimately, somewhat closer to cellular automata models), is a 136
discrete-event procedure. This leads to a sharp reduction in computational effort as well, when 137
compared to microscopic discrete time approaches. Mahut, in his thesis, provides a detailed 138
description of this DNL model [11]. Though categorized as a microscopic simulation-based DTA 139
model, DYNAMEQ properties (such as calibration efforts or computation times), have more 140
commonalities with mesoscopic simulation approaches than with typically microscopic. 141
Most microscopic simulation models use an en-route approach, but Barceló et al. [12] showed that 142
the microsimulation model Aimsun (Barceló, 1992) could also be used in conjunction with an 143
iterative equilibrium-like assignment method. Recently, Aimsun included the possibility to use 144
mesoscopic simulation, instead of microsimulation, to perform the DNL process into a DTA scheme 145
under DUE behavior hypothesis. TRANSIMS and DYNAMEQ deal with equilibrium assignment as 146
well. 147
Other microscopic simulation-based DTA models share the conceptual approaches discussed here. In 148
1993, DRACULA [13] was developed at the University of Leeds; in 1983, Van Aerde developed 149
INTEGRATION [14] and, finally, the most recent, DynusT [15] developed at the University of 150
Arizona in 2011. 151
A NEW DYNAMIC TRAFFIC ASSIGNMENT MODEL 152
Fundamentals 153
The DTA model developed in this paper is based on the dynamic extension of the Wardrop's 154
Principle referred before to as Dynamic User Equilibrium (DUE). In order to achieve the dynamic 155
equilibrium, we solve the variational inequalities formulation by employing a preventive approach 156
based on an iterative solution algorithm which is a modification of the Method of Successive 157
Averages proposed by Sheffi [16] for a variational inequalities problem. 158
DTA models for predicting user equilibrium flows on traffic networks are often solved by an 159
algorithm that iterates between two main components until a convergence criterion is satisfied, 160
systematized by Florian et al. [10]. These two components are referred to as DNL and path flow 161
reassignment. The DNL procedure takes the allocation of travel demands to network paths at each 162
time step as given, loads these into the network over time and computes time dependent path costs 163
from that network loading. The path flow reassignment step then uses the time dependent costs 164
obtained in the DNL to adjust the allocation of traffic to paths to be used in the next DNL. 165
DTA models based on simulation use a traffic simulator to reproduce the complex traffic flow 166
dynamics. In our case, we develop a mesoscopic multiclass multilane DNL simulation model, which 167
is embedded in the proposed DTA framework in order to capture realistically the traffic dynamics 168
169
TRB 2014 Annual Meeting Original paper submittal - not revised by author

Linares, Carmona, Barceló, Serch
7
Proposed DTA Model 170
A description of the proposed DTA model is given in what follows. Its conceptual structure is 171
illustrated in FIGURE 1. 172
173
FIGURE 1 Structure of the proposed DTA model. 174
175
The main inputs to this DTA are: the network geometry and control plans at signalized intersections 176
and the demandtime-sliced into discrete departure time periods. Demand is represented by a set of 177
time-dependent origin-destination matrices that contains one matrix for each departure time interval 178
for each vehicles class. 179
At the initialization step a K-static shortest paths algorithm is executed in order to obtain the best set 180
of paths for each OD pair. The inputs to the K-static shortest path algorithm are the free flow travel 181
costs of each link of the network. 182
TRB 2014 Annual Meeting Original paper submittal - not revised by author

Linares, Carmona, Barceló, Serch
8
It is important highlight here that starting the flow assignment process with only one possible path 183
for each OD pair for an all-or-nothing assignment, the possibility of generating false congestion is 184
very high. If it occurs, all the main links of the network can present congestion, and consequently 185
very high costs. In this case, in the next step of the process, we will find a shortest path that will not 186
use these congested links, so we could go far from the equilibrium, and more iterations would be 187
needed to converge. To avoid this, the initialization step uses a set of paths of predefined size M=K 188
for each OD pair provided by the K-shortest paths, the same for all departure time intervals. The 189
estimation of the appropriate value for parameter M is determined as part of the calibration process. 190
The method used is the link-based shortest path algorithm of Lim and Kim [17] that provides 191
efficient alternative paths considering overlapping among paths. This algorithm builds new paths 192
based on both the degree of overlapping between each path and the travel cost. 193
After the initialization step, and while neither the maximum number of DTA iterations nor the 194
convergence criterion is achieved, the algorithm iterates between two main components: the flow 195
reassignment and the DNL components. 196
Firstly, we try to assign the demand of the different OD pairs at each departure time interval into the 197
corresponding paths of the initial set of M “best paths” (����). The first iteration of the flow 198
reassignment component is performed differently from the assignment of the rest of the iterations of 199
the procedure. In this first iteration, the flow assignment is inversely proportional to the paths cost. 200
For all OD pair��, for all departure time interval�, for all paths ∈ ����, the flow is assigned by 201
following the Equation (1). 202
����� = 1 �����⁄∑ �1 �����⁄ ��∈����
· ����(1)
where: 203
����� is the flow assigned to the path from origin � to the destination �departing at time 204
interval � at iteration �. 205
����� is the cost of the path from origin � to the destination � departing at time interval �. 206
���� is the number of travels of the corresponding time dependent OD matrix. 207
208
After this, the DNL method is used in order to determine how these paths flows (the output of the 209
flow reassignment component) are propagated along the corresponding paths, generating time 210
dependent traffic intensities on the network sections, links travel times, paths travel times, etc., for 211
the current iteration. This DNL flow propagation is carried out by the proposed new mesoscopic 212
traffic simulation model. 213
This mesoscopic traffic simulation provides the new costs of all links in the network. Obviously, the 214
cost of a given link can be different in the first simulation interval than in the next ones. Therefore 215
we will have different costs for each link of the network for each time interval. 216
217
TRB 2014 Annual Meeting Original paper submittal - not revised by author

Linares, Carmona, Barceló, Serch
9
The DTA procedure uses this information: 218
• To update the cost of the paths used in the previously performed DNL. 219
• To calculate the new shortest path for each OD pair for each departure time interval. Because 220
the link cost is different depending on the time when the vehicle arrives to this link, we need 221
to use a time-dependent shortest path to calculate the new best path. The method used is an 222
adaptation of the algorithm proposed by Ziliaskopoulos and Mahmassani [18]. This may be 223
considered to be a temporal extension of the label correcting algorithms used to compute 224
static shortest path algorithms. 225
In order to know if the algorithm has achieved a DUE, we use the relative gap measure (RGap) based 226
on the duality gap function proposed by Janson [19], which measures the difference between the total 227
travel costs of the used paths at iteration k, and the total travel costs if all trips would had used the 228
current shortest path (����), for each OD pair and each departure time, given by the equation (2): 229
!"� =∑ #����� $% ∙ ������ − ���(���� �)�,�,�∈����+,-
∑ ����� ∙ ���(���� ��,�(2)
If the relative gap is acceptable then, the DTA algorithm ends, otherwise the flow assignment is not 230
in equilibrium and we need to improve it and we move to the next iteration. 231
If the DTA algorithm reaches the pre-established maximum number of iterations before achieving 232
convergence then, it ends. In this case, the corresponding result is the last calculated flow 233
assignment, although it is not an equilibrium solution. If the performed iterations are less than the 234
maximum number of iterations, the algorithm continues by executing a new flow reassignment. 235
We propose a modification of the Method of Successive Averages (MSA) to determine the new time 236
dependent paths flows, through the experimented travel times on these paths in the previous iteration 237
as a result of the DNL. 238
This variant of MSA needs, in addition to the current paths set for each OD pair for each time 239
interval, the new time-dependent shortest path for each OD pair for each departure time interval 240
calculated on the previous DTA iteration by using the travel cost obtained on the previously 241
performed DNL. The proposed flow reassignment procedure acts in a different way depending if the 242
new shortest paths belong to the current set of paths for the same interval or not. In the second case, 243
we add this new path to the set. 244
Hereinafter, the proposed DTA algorithm proceeds identically than in the first iteration until the 245
convergence criterion or the maximum number of iterations are achieved. 246
Throughout the following sections, we present a specification of DNL and flow reassignment 247
components of the presented DTA scheme. 248
Dynamic Network Loading 249
FIGURE 2 shows our DNL classification inspired by the representation proposed by Astarita [20], 250
who proposed a classification of the DNL mechanisms based on whether each of the proposed 251
TRB 2014 Annual Meeting Original paper submittal - not revised by author

Linares, Carmona, Barceló, Serch
10
procedures discretizes or not the time, the space and the demand. FIGURE 2 represents the models 252
in a three-dimensional space where the axes x, y and z are the time, the space and the demand, 253
respectively. Thus, the value zero represents the continuous models, which do not make any type of 254
discretization; while advancing on one of the axes towards infinity represents a discretization of the 255
variable of that axis. 256
This classification identifies the following modeling approaches proposed to perform the DNL 257
procedure, in particular for carrying out the link flow propagation: microsimulation models (car-258
following models and cellular-automaton models); space-continuous time-discrete models, 259
continuous or discrete in time link models, models following a packet approach and macroscopic 260
simulation models. 261
262
263
FIGURE 2 Proposed classification of based-on simulation DNL models adapted from Astarita [20]. 264
265
Because the objective is to develop a new DNL model as one of the main components of the 266
proposed iterative DTA procedure, it is necessary to have an efficient process of DNL, that needs 267
computational times as short as posible, even for the case of working with medium-sized or large 268
traffic networks. And, it is also very important to try to reach a balance in regard to the number of 269
parameters without losing the ability of suitably describing the traffic flow dynamics. On one side it 270
is the handicap of the calibration: the more parameter values dependent on the network more difficult 271
will be found the most suitable to reproduce reality. On the other hand, without using any input 272
parameter probably be difficult to reproduce traffic behaviors that should not be overlooked and that 273
are about network characteristics, the geographical location, etc. 274
TRB 2014 Annual Meeting Original paper submittal - not revised by author

Linares, Carmona, Barceló, Serch
11
Taking into account the above requirements in the selection between different DNL approaches into 275
a DTA model, we can rule out models based on macroscopic simulation. These models, which are 276
very suitable in terms of execution times, do not reproduce traffic behaviors needed when the 277
proposed DNL model is embedded into a DTA scheme. Furthermore, microscopic simulation models 278
are also routinely discarded. Microscopic procedures usually require very high computational time, 279
besides requiring a large number of input parameters that describe traffic behavior, which in practice 280
are difficult to calibrate. 281
Thus, the most suitable option seems to raise the use of models that combine the best properties of 282
both: microscopic and macroscopic models, i.e., a mesoscopic model. Our scope is to develop 283
models whose foundations are close to those of microscopic models, which are the best reproducing 284
reality, but dispense with some of the microscopic details. So, we try to achieve better execution 285
times and we substantially reduce the number of input parameters needed simlifying the subsequent 286
calibration effort while not sacrificing the essentials of flow dynamics. 287
The proposed DNL considers time in a continuous form, staying away from the usual way of 288
working of microscopic traffic simulation models that discretize time in steps of predefined size. 289
Another difference between the proposed model and microsimulation models is given by the discrete 290
consideration of the space rather than continuous, except for the case of cellular automaton models 291
which work with cells. Thus, in our case, there is not explicit control of what happens with the 292
vehicles inside the links. The model only pays attention to specific points of the link that are essential 293
to define the network loading correctly. However, the proposed model keeps microscopic models 294
key feature: the demand discretization, that is considered vehicle to vehicle. Thus, we locate the 295
proposed model at the point (0, "0�1234�ℎ, 1) into the previously presented scheme classification, 296
as shown in FIGURE 2. 297
Like some microscopic models based on car-following theory or cellular-automaton, in the proposed 298
model vehicles move trying to maximize their speeds in the presence of certain constraints. These 299
constraints ensure that vehicle trajectories satisfy position, speed and acceleration bounds, in 300
particular, trying to avoid vehicular collisions. 301
Thus, in the DTA model presented in this work, the DNL problem is solved using this new traffic 302
simulation model presented in more detail in Linares et al. [21] and summarized in what follows. 303
This model is based on a mesoscopic scheme that considers continuous-time link-based approach 304
with a complete demand discretization. 305
The use of different vehicles classes in the problem is allowed by the disaggregated treatment of the 306
demand. In addition, this model also allows the longitudinal discretization of the links in lanes, as 307
one of the goals is to reproduce the traversal movements produced by vehicles changing its lanes that 308
can considerably augment the link congestion. Therefore the proposed DNL is a multilane multiclass 309
traffic simulation model. 310
The DNL problem is considered from a discrete demand point of view, so, it is formulated by 311
defining a function for each vehicle, which from a specific link position 6, returns the time which the 312
vehicle in question reaches that position (�789: (x)) and when leaves it (�789� (x)). 313
The objective of the DNL is to calculate traffic variables for each link from the time dependent flow 314
assignment at each of the network paths. This calculation pivots on the knowledge of the input and 315
output times of the vehicle at each of the links of the network. So, the proposed model considers at 316
each lane of a link two positions (the initial and the final) in which it should evaluate the functions 317 �789: (x) and �789� (x). 318
TRB 2014 Annual Meeting Original paper submittal - not revised by author
Linares, Carmona, Barceló, Serch
12
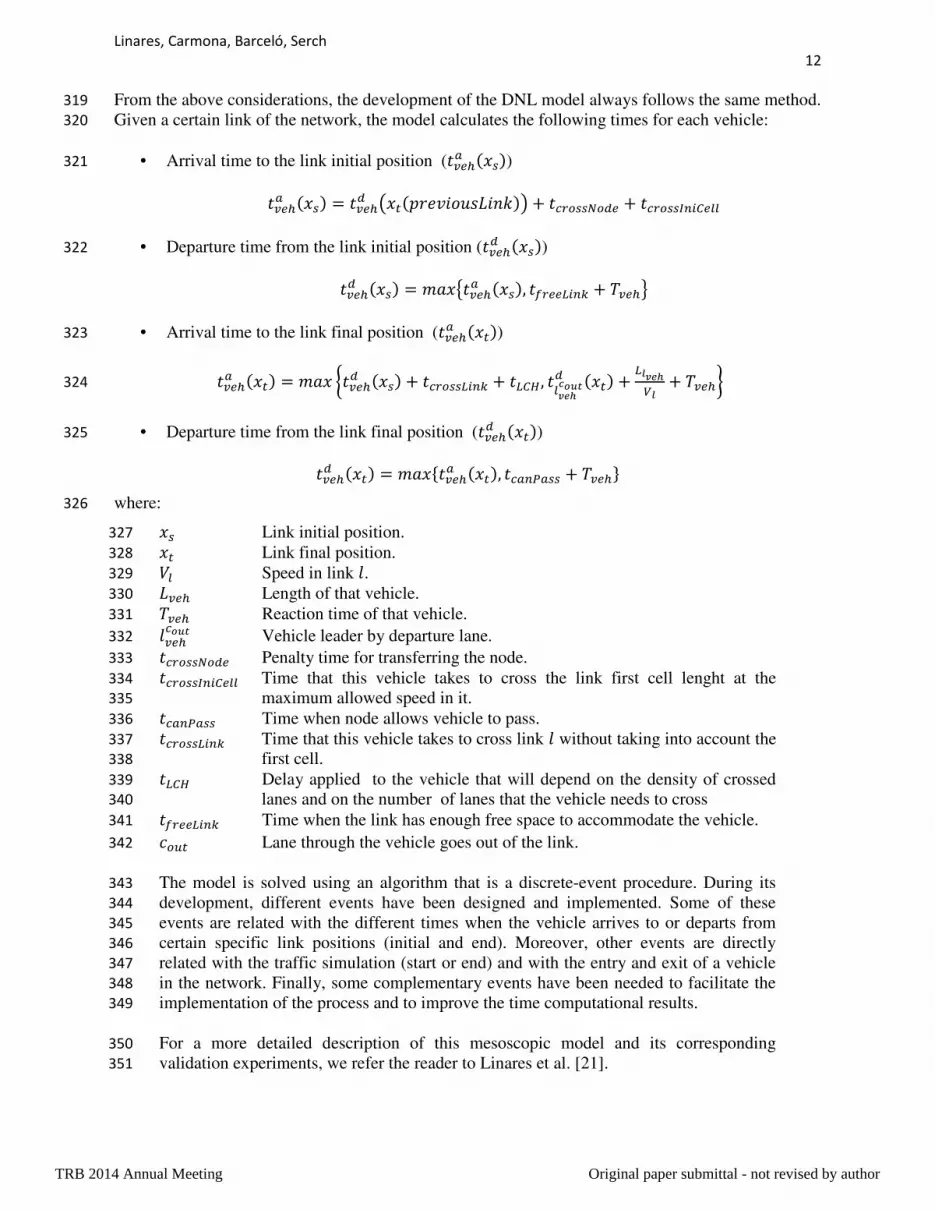
From the above considerations, the development of the DNL model always follows the same method. 319
Given a certain link of the network, the model calculates the following times for each vehicle: 320
• Arrival time to the link initial position (�789: (6;)) 321
�789: (6;) = �789� �6�(02<=�>?1=3�)� + �AB�;;C��8 + �AB�;;DEFG8HH • Departure time from the link initial position (�789� (6;)) 322
�789� (6;) = I"6J�789: (6;), �KB88LFE + M789N • Arrival time to the link final position (�789: (6�)) 323
�789: (6�) = I"6 O�789� (6;) + �AB�;;LFE + �LGP, �HQRST�U�� (6�) + LVQRSWV + M789X 324
• Departure time from the link final position (�789� (6�)) 325
�789� (6�) = I"6Y�789: (6�), �A:E�:;; + M789Z where: 326
6; Link initial position. 327 6� Link final position. 328 [H Speed in link \. 329 1789 Length of that vehicle. 330 M789 Reaction time of that vehicle. 331 \789A�U� Vehicle leader by departure lane. 332 �AB�;;C��8 Penalty time for transferring the node. 333 �AB�;;DEFG8HH Time that this vehicle takes to cross the link first cell lenght at the 334
maximum allowed speed in it. 335 �A:E�:;; Time when node allows vehicle to pass. 336 �AB�;;LFE Time that this vehicle takes to cross link \ without taking into account the 337
first cell. 338 �LGP Delay applied to the vehicle that will depend on the density of crossed 339
lanes and on the number of lanes that the vehicle needs to cross 340 �KB88LFE Time when the link has enough free space to accommodate the vehicle. 341
��]� Lane through the vehicle goes out of the link. 342
The model is solved using an algorithm that is a discrete-event procedure. During its 343
development, different events have been designed and implemented. Some of these 344
events are related with the different times when the vehicle arrives to or departs from 345
certain specific link positions (initial and end). Moreover, other events are directly 346
related with the traffic simulation (start or end) and with the entry and exit of a vehicle 347
in the network. Finally, some complementary events have been needed to facilitate the 348
implementation of the process and to improve the time computational results. 349
For a more detailed description of this mesoscopic model and its corresponding 350
validation experiments, we refer the reader to Linares et al. [21]. 351
TRB 2014 Annual Meeting Original paper submittal - not revised by author

13
Linares, Carmona, Barceló, Serch
Flow Reassignment 352
The objective here is to develop an efficient DTA model. To achieve this aim, it is 353
fundamental to implement a method of flow reassignment that converges efficient to the 354
DUE. First of all, it is important to note that not all flow reassignment algorithms 355
achieve the expected equilibrium. Only the methods that implicitly assume that the 356
network traffic conditions are predictable (preventive methods) are able to achieve it 357
(Friesz [22] and Chiu et al. [23]). On the other hand, it would be reactive algorithms that 358
assume that network traffic conditions are not predictable and where the users can make 359
decisions while they are en-route, based on their real-time information about the current 360
traffic conditions. Due to the objective of this work, we propose a preventive flow 361
reassignment algorithm which bases its decisions on its historical experience. 362
Among the different preventive approaches existing in the literature, in this paper we 363
use the iterative flow reassignment algorithm proposed in Linares et al. [24], based on a 364
modification of the Method of Successive Averages (MSA). This is one of the most 365
widely used methods for path flow reassignment component in a DTA scheme because 366
is one of the most simple and efficient. 367
The aim of the proposed modification is to overcome the limitations observed during 368
the state-of-the-art study about DTA with MSA. We focus our efforts on solving two 369
drawbacks: 370
• The expensive requirement of memory space of the usual implementation of the 371
MSA algorithm. 372
• The indiscriminate flow diversion from each used paths to the new best path, 373
typical of the standard MSA not taking explicitly into account travel time 374
conditions 375
In order to improve the currently available options to solve these two limitations, we 376
develop a new MSA that combines some of the literature modifications with the 377
addition of new ones. In order to solve the first problem, we consider the general 378
scheme formulated by Mahut [25], which is based on the idea of limiting the number of 379
paths for each origin-destination pair for each departure time interval ( �̂��). To 380
overcome the second limitation, we propose the use of a diversion factor (_����) in 381
order to perform the reassignment by taking into account the cost of the alternative 382
paths. This new factor is based on a logit distribution of demand flow according to 383
actual travel costs of the alternative paths. The method considers the costs based on the 384
links actual travel times obtained in the DNL of the previous iteration of the global 385
procedure. Thus, 386
_���� = exp(−�����(������))∑ exp(−�����(������))�c����
where ����� is the cost of the path based on the actual travel times ������ of the path. 387
The specific proposed algorithm is shown in the following scheme: 388
389
TRB 2014 Annual Meeting Original paper submittal - not revised by author

14
Linares, Carmona, Barceló, Serch
For all OD pair (�, �) for all departure time interval�: 390
• If the maximum number of paths is not achieved �d���� $%d < �̂���: 391
a. Time-dependent shortest path (����) calculation based on the links costs 392
according to the actual link travel times obtained in the last DNL. 393
b. Path Flow Reassignment: 394
- If the shortest path is new ����� ∉ ���� $%�: 395
i. Assign the flow ����� ∀ ∈ ���� $% and on ���� following: 396
����� = O h · ���� =� = ����(1 − h ) · ���� · _���� =� ≠ ���� ii. Update paths set: ���� = ���� $% ∪ ���� 397
iii. Update number of paths. 398
- Else ����� ∈ ���� $%� 399
i. Assign the flow ����� ∀ ∈ ���� $% following: 400
����� = kh · ���� + (1 − h ) · ����� $% =� = ����(1 − h ) · ����� $% =� ≠ ����
( 2 )
ii. Update paths set: ���� = ���� $% 401
• Else, the maximum number of paths is achieved �d���� $%d ≥ �̂���: 402
a. Identify the shortest path ���� among those already used paths ���� $%. 403
b. Path Flow Reassignment: 404
i. Assign the flow ����� ∀ ∈ ���� $% following: 405
����� = kh · ���� + (1 − h ) · ����� $% =� = ����(1 − h ) · ����� $% =� ≠ ����
( 3 )
ii. Update path set: ���� = ���� $% 406
where: 407
� is the iteration count. 408
�̂�� is the maximum number of paths considered from origin � to destination 409 � entering to the network during the time interval �. 410
���� is the set of paths from origin � to destination � entering to the network 411
during the time interval � at iteration �. 412
���� is the time-dependent shortest path from origin � to destination � 413
entering to the network during the time interval �. 414
TRB 2014 Annual Meeting Original paper submittal - not revised by author

15
Linares, Carmona, Barceló, Serch
����� is the flow assigned to the path departing at time interval � at iteration 415
�. 416
���� is the demand from origin � to destination � entering to the network 417
during the time interval �. 418
h is the MSA parameter according to the corresponding iteration �. 419
_���� is the previously defined diversion factor. 420
COMPUTATIONAL EXPERIENCES 421
Real Urban Test Network 422
In order to test the behavior of the developed DTA model, it was applied to the network 423
of Amara Berri district in the city of San Sebastian (Spain). The proposed test network 424
(FIGURE 3) consists of 76 nodes, 192 links and 301 turns. The maximum allowed 425
speed goes from 35 Km/h to 60Km/h depending on the link type. Each link has its 426
corresponding longitudinal division by lanes among 1 and 5 lanes. The performed 427
experiment used a synthetic demand that assigned to the network the total flow of 428
12.116 trips. Four 15-min matrices provided the origin-destination demand data for 13 429
zones resulting in 80 OD pairs. Two vehicle classes were considered: the 90% of the 430
demand corresponded to light vehicles with an effective length of 5 meters, while the 431
remaining 10% of the demand corresponded to a heavy vehicle class with an effective 432
length of 9 meters. 433
Calibration and Validation 434
A common practice in testing most of the existing mesoscopic models has been to make 435
two types of comparisons: 436
437
• Check the ability to reproduce traffic flow behavior in terms for instance of 438
how do they fit the expected fundamental diagram for critical links, and 439
• Use some “ground truth” to get a global insight of how the predicted flows, 440
travel times and so on fit those taken as external reference. 441
In some cases (Astarita et al. [26]) this second type of tests has been conducted in a 442
synthetic experiment against a microscopic simulation model. This has been the 443
calibration and validation alternative used in our case using as reference a microscopic 444
Aimsun model [27]. 445
The ability of the new DNL model to suitably reproduce the fundamental diagram was 446
checked in testing exercises reported in Linares et al. [21], due to space limitation we 447
will refer here only to the second type of validation exercises. 448
A calibration procedure was conducted for the proposed DTA model, which 449
fundamentally consisted of adjusting the following DNL parameters: the lane change 450
penalty (�LGP), the cross node time penalty (�AB�;;C��8) and the reaction times of both 451
vehicle classes. The final adjusted values for the penalty parameters were: �LGP =452
TRB 2014 Annual Meeting Original paper submittal - not revised by author

16
Linares, Carmona, Barceló, Serch
0.2sec, �AB�;;C��8 = 0.6sec, while the considered reaction times were: light vehicle 453
class = 0.5?2� and heavy vehicle class = 0.75?2�. 454
In addition, at the initialization step, the proposed DTA process requires a set of shortest 455
paths for each origin to each destination. As we previously explained, the decision of 456
the number of paths for each OD pair is a key point on the way to achieve the 457
convergence. The best option to get right is to test different options during the network 458
calibration process. In our case for the test network the best and more stable results, 459
avoiding flip-flop oscillations between paths, were achieved with 3 alternative paths for 460
each OD pair. 461
462
FIGURE 3 Results of the validation process. 463
TRB 2014 Annual Meeting Original paper submittal - not revised by author

17
Linares, Carmona, Barceló, Serch
FIGURE 3 depicts the results of the validation process in terms of the comparison of 464
the link densities for the micro and meso models and the relationship between vehicles 465
per link at the bottom. The results obtained for both models (proposed and benchmark) 466
are very similar, excepting the congestion caused by roundabouts. Proposed model 467
overestimates congestion at the roundabouts, causing significant differences in some 468
adjacent links compared with the results obtained from the benchmark. The study of the 469
errors shows the correctness of the proposed model obtaining a RMSE = 8.84 and a 470
Normalized RMSE = 6.42%. 471
The developed DTA was initially run by using three initial paths for each OD pair for 472
each interval. The 60-min loading interval was divided into four 15-min time intervals 473
for the proposed DTA model, which was run successfully for 30 iterations, each 474
requiring roughly 1 minute. 475
The relative gap (RGap) was calculated in order to take into account the different 476
departure time intervals in the analysis of the results. FIGURE 4 shows the obtained 477
RGaps values for four departure intervals ranged from 2 to 3.5 percent at the last DTA 478
iteration. 479
480
FIGURE 4 Relative Gaps Results. 481
TRB 2014 Annual Meeting Original paper submittal - not revised by author

18
Linares, Carmona, Barceló, Serch
CONCLUSIONS 482
The DTA model presented in this paper is based on the conceptual approach splitting 483
the process in two components: a path flow reassignment and a Dynamic Network 484
Loading (DNL). The path flow reassignment has been implemented in terms of a 485
modified MSA algorithm designed to solve the variational inequalities formulation of 486
the dynamic equilibrium formulation of the assignment problem. The DNL follows a 487
new modeling approach to emulate the flow propagation through the network along the 488
paths defined by the path flow reassignment. 489
The model has been calibrated and validated through a set of synthetic experiments 490
taking as reference an Aimsun microscopic simulation model of a real network. The 491
validation shows the ability of the DNL model to acceptably reproduce the basics of the 492
flow dynamics, as well as the capability of the model to achieve a DUE measured in 493
terms of the Relative Gap function. The validation process has been complemented 494
checking the similitudes between the link flows provided by both models and the 495
analysis of their differences. 496
REFERENCES 497
[1] Mahmassani, H.S. Dynamic network traffic assignment and simulation methodology 498
for advanced system management applications. Networks and Spatial Economics, 499
1(3-4):267-292, 2001. 500
[2] S. Peeta and A. K. Ziliaskopoulos. Foundations of dynamic traffic assignment: The 501
past, the present and the future. Networks and Spatial Economics, 1(3-4):233-265, 502
2001. 503
[3] Messner, A. and Papageorgiou, M. Metanet: A macroscopic simulation program for 504
motorway networks. Traffic Engineering & Control, 31(8-9):466-470, 1990. 505
[4] Bliemer, M., Versteegt, H. and Castenmiller, R. Indy: a new analytical multiclass 506
dynamic traffic assignment model. In Proceedings of the TRISTAN V conference, 507
Guadeloupe, 2004. 508
[5] Leonard, D., Gower, P. and Taylor, N.B. CONTRAM: structure of the model. 509
Research report-Transport and Road Research Laboratory, (178), 1989. 510
[6] Ben-Akiva, M., Bierlaire, M., Koutsopoulos, H. and Mishalani, R. DynaMIT: a 511
simulation-based system for traffic prediction. In DACCORS Short Term 512
Forecasting Workshop, The Netherlands. Citeseer, 1998. 513
[7] de Palma, A. and Marchal, F. METROPOLIS: un outil de simulation du traffic 514
urbain. Technical report, THEMA (THéorie Economique, Modélisation et 515
Applications), Université de Cergy-Pontoise, 1996. 516
[8] Burghout, W. Hybrid microscopic-mesoscopic traffic simulation. PhD thesis, 517
Department of Infrastructure, Division of Transportation and Logistics, Royal 518
Institute of Technology, 2004. 519
[9] Nagel, K., Beckman, R.J. and Barrett, C.L. Transims for urban planning. In 6th 520
International Conference on Computers in Urban Planning and Urban 521
Management, Venice, Italy. Citeseer, 1999. 522
[10] Florian, M., Mahut, M. and Tremblay, N. A hybrid optimization-mesoscopic 523
simulation dynamic traffic assignment model. In Intelligent Transportation Systems, 524
2001. Proceedings. 2001 IEEE, pages 118-121. IEEE, 2001. 525
TRB 2014 Annual Meeting Original paper submittal - not revised by author
19
Linares, Carmona, Barceló, Serch
[11] Mahut, M. A discrete flow model for dynamic network loading. PhD 526
thesis,Universite de Montreal, 2000. 527
[12] Barceló, J. and Casas, J. Heuristic dynamic assignment based on AIMSUN 528
microscopic traffic simulator. In 5th Triennial Symposium on Transportation 529
Analysis, Guadeloupe, 2004. 530
[13] Liu, R. Traffic simulation with DRACULA. In Fundamentals of Traffic 531
Simulation, pages 399-430. Springer, 2010. 532
[14] Van Aerde, M., Hellinga, M., Baker, B., Rakha, M. INTEGRATION: An 533
overview of traffic simulation features. Presented at 75th Annual Meeting of the 534
Transportation Research Board, Washington, D.C., 1996. 535
[15] Chiu, Y.C. and Nava, E.J. DynusT. About DynusT. www.dynust.net. Accessed 536
June, 17, 2013. 537
[16] Powell, W. B. and Sheffi, Y. The convergence of equilibrium algorithms with 538
predetermined step sizes. Transportation Science, 16(1):4555, 1982. 539
[17] Lim, Y. and Kim, H. A shortest path algorithm for real road network based on 540
path overlap. Journal of the Eastern Asia Society for Transportation Studies, 541
6:1426-1438, 2005. 542
[18] Ziliaskopoulos, A. K. and Mahmassani, H. S. Time-dependent, shortest-path 543
algorithm for real-time intelligent vehicle highway system applications. In 544
Transportation Research Record: Journal of the Transportation Research Board, 545
1408:94-100, 1993. 546
[19] Janson, B.N. Dynamic traffic assignment for urban road networks. 547
Transportation Research Part B: Methodological, 25(2):143161, 1991. 548
[20] Astarita, V. Node and Links Models for Network Traffic Flow Simulation. 549
Mathematical and Computer Modeling, 32:643–656, 2002. 550
[21] Linares, M.P., Carmona, C., Barceló, J., Serch, O. Mazariegos, O. An Approach 551
to Multiclass Mesoscopic Simulation Based on Individual Vehicles for Dynamic 552
Network Loading. Accepted in Intelligent Transportation Systems 2013. 553
Proceedings. 2013 IEEE. 554
[22] Friesz, T. L., Bernstein, D., Smith, T. E., Tobin, R. L. and Wie, B. A variational 555
inequality formulation of the dynamic network user equilibrium problem. 556
Operations Research, 41(1):179-191, 1993. 557
[23] Chiu, Y.C., Bottom, J., Mahut, M., Paz, A., Balakrishna, R., Waller, T. and 558
Hicks, J. A primer for dynamic traffic assignment. Transportation Research Board, 559
2010. 560
[24] Linares, M.P., Barceló, J. Comparison of path flow reassignment methods for 561
dynamic user equilibrium traffic assignment based on mesosimulation. Presented at 562
1st European Symposium on Quantitative Methods in Transportation Systems 563
(LATSIS), Lausanne, 2012. 564
[25] Mahut, M., Florian, M. and Tremblay, N. Space-time queues and dynamic traffic 565
assignment: A model, algorithm and applications. In National Research Council 566
(US). Transportation Research Board. Meeting (82nd:Washington, DC). 567
Compendium of papers CD-ROM, 2003. 568
[26] Astarita, V., Er-Rafia, K., Florian, M., Mahut, M. and Velan, S. Comparison of 569
Three Methods for Dynamic Network Loading. In Transportation Research Record: 570
Journal of the Transportation Research Board, 1171:179-190, 2001. 571
[27] Aimsun 7.0. Traffic Simulator, distributed by Transportation Simulation 572
Systems, 2011. 573
TRB 2014 Annual Meeting Original paper submittal - not revised by author
Recommended