Arctic Monitoring and Assessment Programme (AMAP)
AMAPAssessment 2002:Radioactivity in the Arctic
AM
AP
Asse
ssme
nt
20
02
:R
adioactivity in the Arctic
AM
AP
ISBN 82-7971-017-5
Barsebäck NPP
Oskarshamn NPP
Kola NPP
Bilibino NPP
Nar’yan Mar
Mezen
Sukhoy Nos
Chernaya Bay
Ringhals NPP
Forsmark NPPOlkiluoto NPP
Loviisa NPPLeningrad NPP
Wrangel Island
AmchitkaIsland
CHUKOTKA
Reykjavik
Jan Mayen
BjørnøyaSpitsbergen
Svalbard
NovayaZemlya
SevernayaZemlya
NewSiberianIslands
FranzJosefLand
BaffinIsland
Yenisey
Pechora
Lena
Ob
Tom
GreatSlaveLake
Murmansk
Arkhangelsk
Stockholm
Helsinki
Oslo
Tórshavn
St. Petersburg
Moscow
Tomsk
Mayak
Zheleznogorsk
Chernobyl
TaymirPeninsula
Nuuk
Victoria Island
Ellesmere Island
Davis Strait
Foxe Basin
NorwegianSea
GreenlandSea
LabradorSea
FramStrait
DenmarkStrait
ChukchiSea
Bering
Strait
EastSiberian
Sea
Gulf ofAlaska
KaraSea
PechoraSea
LaptevSea
Amundsen Gulf
Hu
dso
n S
tra
it
NorthSea
Skage
rrak
Gulf of F
inland
WhiteSea
Andreyeva Bay
BaffinBay
Hudson Bay
BarentsSea
Beaufort Sea
Bering SeaOkhotsk Sea
A r c t i c O c e a n
At lant ic Ocean
Paci f ic Ocean
C A N A D A
N U N A V U T
N O R T H W E S T
T E R R I T O R I E S
( N W T )
Y U K O N
L A B R A D O R
Q U E B E C
U S AAlaska
G R E E N L A N D
DENMARK
ICELAND
FAROEISLANDS
FINLAND
SWEDENNORWAY
R U S S I A
Al
e
ut
ia
nI s l a n d s
Mackenzie River
Yu
kon
Riv
er
Fairbanks
Anchorage
Canadian ArcticArchipelago
CanadaBasin
MakarovBasin
AmundsenBasin
NansenBasin
Lomonoso
v Rid
ge
Nansen-G
akkel R
idge
Ca n a d
i an
Ba
si n
Severnaya Dvina
S
I
B
E
R
IA
UR
AL
S
WE
ST
ER
N
A
R
C
T
I
CE
A
S
T
E
R
N
AR
CT
IC
Alpha
-M
en
de
lee
vR
idg
e
Eu
ra
si a
n
Ba
si n
Ath
ab
ascaR
iver
dnuo
Sret
sacn
a L
PeaceR
iver
Slave R.
Cum
berla
nd S
ound
Thule Air BaseQaanaaq
Khatanga
Longyearbyen
Sellafield
Cap de la Hague
IrishSea
SakhalinIsland
Burnt Mountain
Gul
fof
Both
nia
Camp Century
InarijärviHillesøy
PasvikTana
Apukkajärvi
Lake LovozeroZapolyarnyi
Vatnajökull
TorniojokiKemijoki
Jerisjärvi/Äkäsjärvi
RovaniemiEast Greenland Current
Katte- gatt
Öre-sund-
Baltic
Se
a
Polyarnyi/Snezhnogorsk
0– 500– 2000 50 100 200 300 500 1000 1500 2000 3000 4000 m
RADIO cover NØRHAVEN DEFINITIV• 18/8/2004 10:59 Page 2
AMAP Assessment 2002:Radioactivity in the Arctic
Arctic Monitoring and Assessment Programme (AMAP), Oslo, 2004
ISBN 82-7971-017-5
© Arctic Monitoring and Assessment Programme, 2004
Published byArctic Monitoring and Assessment Programme (AMAP), P.O. Box 8100 Dep, N-0032 Oslo, Norway (www.amap.no)
CitationAMAP, 2004. AMAP Assessment 2002: Radioactivity in the Arctic. Arctic Monitoring and Assessment Programme (AMAP), Oslo, Norway. xi + 100 pp.
OrderingAMAP Secretariat, P.O. Box 8100 Dep, N-0032 Oslo, Norway
This report will also be published as an electronic document, available from the AMAP website at www.amap.no
–––––––––––––––––––––––––––––––––––––––––––––––––––––––––––––––––––––––––––––––––––––––––––––––––––––––––––––
Production
Overall volume editors / scientific, technical and linguistic editingSimon J. Wilson, Carolyn Symon
Lay-out and technical production managementOlsen & Olsen, Helstedsvej 10, DK-3480 Fredensborg, Denmark
Design and production of computer graphicsKai Olsen, Olsen & Olsen
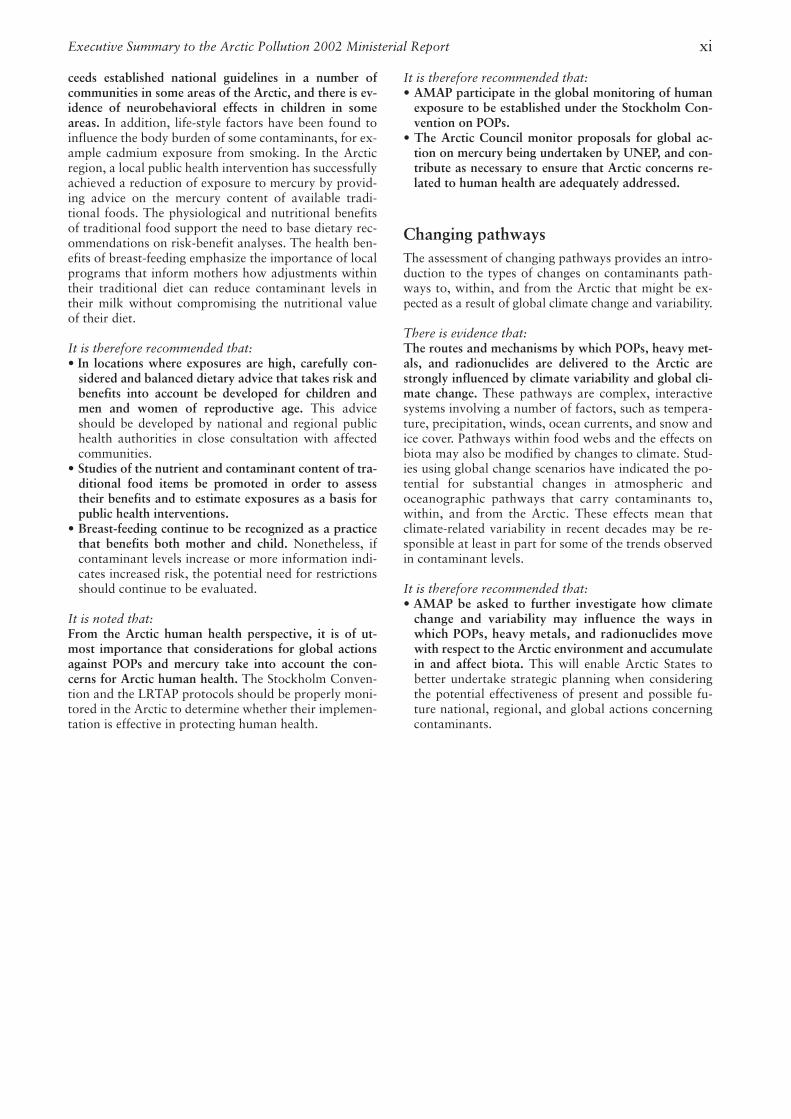
CoverMaintenance work at the Kola NPP. Based on original photo by Thomas Nilsen, The Norwegian Barents Secretariat
PrintingNørhaven Book, Agerlandsvej 5, DK-8800 Viborg, Denmark
–––––––––––––––––––––––––––––––––––––––––––––––––––––––––––––––––––––––––––––––––––––––––––––––––––––––––––––
AMAP Working Group:Helgi Jensson (Chair, Iceland), Yuri Tsaturov (Vice-chair, Russia), David Stone (Canada), Ole Jensen (Denmark), Outi Mähönen (Finland),Gunnar Futsæter (Norway), Cynthia de Wit (Sweden), John Calder (USA), Jan-Idar Solbakken (Permanent Participants of the Indigenous PeoplesOrganisations)
AMAP Secretariat:Lars-Otto Reiersen, Vitaly Kimstach, Simon Wilson, Inger Utne
Indigenous peoples organizations, AMAP observing countries, and international organizations:
Aleut International Association (AIA), Arctic Athabaskan Council (AAC), Gwitch’in Council International (GCI), Inuit Circumpolar Conference(ICC), Russian Association of Indigenous Peoples of the North (RAIPON), Saami Council.
France, Germany, Netherlands, Poland, United Kingdom.
Advisory Committee on Protection of the Sea (ACOPS), Association of World Reindeer Herders (AWRH), Circumpolar Conservation Union(CCU), European Environment Agency (EEA), International Arctic Science Committee (IASC), International Arctic Social Sciences Association(IASSA), International Atomic Energy Agency (IAEA), International Council for the Exploration of the Sea (ICES), International Federation ofRed Cross and Red Crescent Societies (IFFCRCS), International Union for Circumpolar Health (IUCH), International Union for the Conserva-tion of Nature (IUCN), International Union of Radioecology (IUR), Nordic Council of Ministers (NCM), Nordic Council of Parliamentarians(NCP), North Atlantic Marine Mammal Commission (NAMMCO), Northern Forum (NF), OECD Nuclear Energy Agency (OECD/NEA), Osloand Paris Commissions (OSPARCOM), Standing Committee of Arctic Parliamentarians (SCAP), United Nations Economic Commission for Eu-rope (UN ECE), United Nations Environment Programme (UNEP), World Health Organization (WHO), World Meteorological Organization(WMO), World Wide Fund for Nature (WWF).
AMAP data centers:International Council for the Exploration of the Sea (ICES), Norwegian Institute for Air Research (NILU), Norwegian Radiation ProtectionAuthority (NRPA), University of Alaska – Fairbanks (UAF).
ii
AMAP Assessment 2002: Radioactivity in the Arctic–––––––––––––––––––––––––––––––––––––––––––––––––––––––––––––––––––––––––––––––––––––––––––––––––––––––––––––
iii
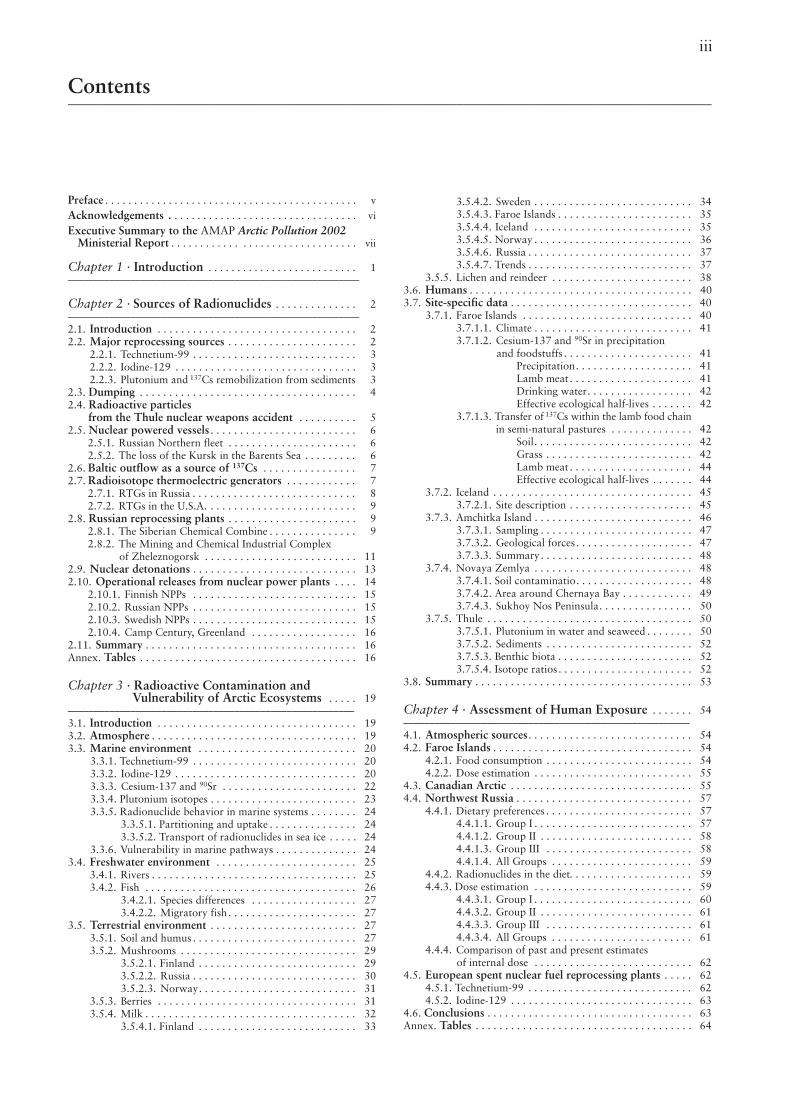
Preface . . . . . . . . . . . . . . . . . . . . . . . . . . . . . . . . . . . . . . . . . . . . v
Acknowledgements . . . . . . . . . . . . . . . . . . . . . . . . . . . . . . . . . vi
Executive Summary to the AMAP Arctic Pollution 2002Ministerial Report . . . . . . . . . . . . . . . . . . . . . . . . . . . . . . . . vii
Chapter 1 · Introduction . . . . . . . . . . . . . . . . . . . . . . . . . . 1––––––––––––––––––––––––––––––––––––––––––––––––––––––––
Chapter 2 · Sources of Radionuclides . . . . . . . . . . . . . . 2––––––––––––––––––––––––––––––––––––––––––––––––––––––––2.1. Introduction . . . . . . . . . . . . . . . . . . . . . . . . . . . . . . . . . . 22.2. Major reprocessing sources . . . . . . . . . . . . . . . . . . . . . . 2
2.2.1. Technetium-99 . . . . . . . . . . . . . . . . . . . . . . . . . . . . 32.2.2. Iodine-129 . . . . . . . . . . . . . . . . . . . . . . . . . . . . . . . 32.2.3. Plutonium and 137Cs remobilization from sediments 3
2.3. Dumping . . . . . . . . . . . . . . . . . . . . . . . . . . . . . . . . . . . . . 42.4. Radioactive particles
from the Thule nuclear weapons accident . . . . . . . . . . 52.5. Nuclear powered vessels . . . . . . . . . . . . . . . . . . . . . . . . . 6
2.5.1. Russian Northern fleet . . . . . . . . . . . . . . . . . . . . . . 62.5.2. The loss of the Kursk in the Barents Sea . . . . . . . . . 6
2.6. Baltic outflow as a source of 137Cs . . . . . . . . . . . . . . . . 72.7. Radioisotope thermoelectric generators . . . . . . . . . . . . 7
2.7.1. RTGs in Russia . . . . . . . . . . . . . . . . . . . . . . . . . . . . 82.7.2. RTGs in the U.S.A. . . . . . . . . . . . . . . . . . . . . . . . . . 9
2.8. Russian reprocessing plants . . . . . . . . . . . . . . . . . . . . . . 92.8.1. The Siberian Chemical Combine . . . . . . . . . . . . . . . 92.8.2. The Mining and Chemical Industrial Complex
of Zheleznogorsk . . . . . . . . . . . . . . . . . . . . . . . . . . 112.9. Nuclear detonations . . . . . . . . . . . . . . . . . . . . . . . . . . . . 132.10. Operational releases from nuclear power plants . . . . 14
2.10.1. Finnish NPPs . . . . . . . . . . . . . . . . . . . . . . . . . . . . 152.10.2. Russian NPPs . . . . . . . . . . . . . . . . . . . . . . . . . . . . 152.10.3. Swedish NPPs . . . . . . . . . . . . . . . . . . . . . . . . . . . . 152.10.4. Camp Century, Greenland . . . . . . . . . . . . . . . . . . 16
2.11. Summary . . . . . . . . . . . . . . . . . . . . . . . . . . . . . . . . . . . . 16Annex. Tables . . . . . . . . . . . . . . . . . . . . . . . . . . . . . . . . . . . . . 16
Chapter 3 · Radioactive Contamination and Vulnerability of Arctic Ecosystems . . . . . 19
–––––––––––––––––––––––––––––––––––––––––––––––––––––––3.1. Introduction . . . . . . . . . . . . . . . . . . . . . . . . . . . . . . . . . . 193.2. Atmosphere . . . . . . . . . . . . . . . . . . . . . . . . . . . . . . . . . . . 193.3. Marine environment . . . . . . . . . . . . . . . . . . . . . . . . . . . 20
3.3.1. Technetium-99 . . . . . . . . . . . . . . . . . . . . . . . . . . . . 203.3.2. Iodine-129 . . . . . . . . . . . . . . . . . . . . . . . . . . . . . . . 203.3.3. Cesium-137 and 90Sr . . . . . . . . . . . . . . . . . . . . . . . 223.3.4. Plutonium isotopes . . . . . . . . . . . . . . . . . . . . . . . . . 233.3.5. Radionuclide behavior in marine systems . . . . . . . . 24
3.3.5.1. Partitioning and uptake . . . . . . . . . . . . . . . 243.3.5.2. Transport of radionuclides in sea ice . . . . . 24
3.3.6. Vulnerability in marine pathways . . . . . . . . . . . . . . 243.4. Freshwater environment . . . . . . . . . . . . . . . . . . . . . . . . 25
3.4.1. Rivers . . . . . . . . . . . . . . . . . . . . . . . . . . . . . . . . . . . 253.4.2. Fish . . . . . . . . . . . . . . . . . . . . . . . . . . . . . . . . . . . . 26
3.4.2.1. Species differences . . . . . . . . . . . . . . . . . . 273.4.2.2. Migratory fish . . . . . . . . . . . . . . . . . . . . . . 27
3.5. Terrestrial environment . . . . . . . . . . . . . . . . . . . . . . . . . 273.5.1. Soil and humus . . . . . . . . . . . . . . . . . . . . . . . . . . . . 273.5.2. Mushrooms . . . . . . . . . . . . . . . . . . . . . . . . . . . . . . 29
3.5.2.1. Finland . . . . . . . . . . . . . . . . . . . . . . . . . . . 293.5.2.2. Russia . . . . . . . . . . . . . . . . . . . . . . . . . . . . 303.5.2.3. Norway. . . . . . . . . . . . . . . . . . . . . . . . . . . 31
3.5.3. Berries . . . . . . . . . . . . . . . . . . . . . . . . . . . . . . . . . . 313.5.4. Milk . . . . . . . . . . . . . . . . . . . . . . . . . . . . . . . . . . . . 32
3.5.4.1. Finland . . . . . . . . . . . . . . . . . . . . . . . . . . . 33
3.5.4.2. Sweden . . . . . . . . . . . . . . . . . . . . . . . . . . . 343.5.4.3. Faroe Islands . . . . . . . . . . . . . . . . . . . . . . . 353.5.4.4. Iceland . . . . . . . . . . . . . . . . . . . . . . . . . . . 353.5.4.5. Norway . . . . . . . . . . . . . . . . . . . . . . . . . . . 363.5.4.6. Russia . . . . . . . . . . . . . . . . . . . . . . . . . . . . 373.5.4.7. Trends . . . . . . . . . . . . . . . . . . . . . . . . . . . . 37
3.5.5. Lichen and reindeer . . . . . . . . . . . . . . . . . . . . . . . . 383.6. Humans . . . . . . . . . . . . . . . . . . . . . . . . . . . . . . . . . . . . . . 403.7. Site-specific data . . . . . . . . . . . . . . . . . . . . . . . . . . . . . . . 40
3.7.1. Faroe Islands . . . . . . . . . . . . . . . . . . . . . . . . . . . . . 403.7.1.1. Climate . . . . . . . . . . . . . . . . . . . . . . . . . . . 413.7.1.2. Cesium-137 and 90Sr in precipitation
and foodstuffs . . . . . . . . . . . . . . . . . . . . . . 41Precipitation. . . . . . . . . . . . . . . . . . . . 41Lamb meat . . . . . . . . . . . . . . . . . . . . . 41Drinking water. . . . . . . . . . . . . . . . . . 42Effective ecological half-lives . . . . . . . 42
3.7.1.3. Transfer of 137Cs within the lamb food chainin semi-natural pastures . . . . . . . . . . . . . . 42
Soil. . . . . . . . . . . . . . . . . . . . . . . . . . . 42Grass . . . . . . . . . . . . . . . . . . . . . . . . . 42Lamb meat . . . . . . . . . . . . . . . . . . . . . 44Effective ecological half-lives . . . . . . . 44
3.7.2. Iceland . . . . . . . . . . . . . . . . . . . . . . . . . . . . . . . . . . 453.7.2.1. Site description . . . . . . . . . . . . . . . . . . . . . 45
3.7.3. Amchitka Island . . . . . . . . . . . . . . . . . . . . . . . . . . . 463.7.3.1. Sampling . . . . . . . . . . . . . . . . . . . . . . . . . . 473.7.3.2. Geological forces . . . . . . . . . . . . . . . . . . . . 473.7.3.3. Summary. . . . . . . . . . . . . . . . . . . . . . . . . . 48
3.7.4. Novaya Zemlya . . . . . . . . . . . . . . . . . . . . . . . . . . . 483.7.4.1. Soil contaminatio. . . . . . . . . . . . . . . . . . . . 483.7.4.2. Area around Chernaya Bay . . . . . . . . . . . . 493.7.4.3. Sukhoy Nos Peninsula. . . . . . . . . . . . . . . . 50
3.7.5. Thule . . . . . . . . . . . . . . . . . . . . . . . . . . . . . . . . . . . 503.7.5.1. Plutonium in water and seaweed . . . . . . . . 503.7.5.2. Sediments . . . . . . . . . . . . . . . . . . . . . . . . . 523.7.5.3. Benthic biota . . . . . . . . . . . . . . . . . . . . . . . 523.7.5.4. Isotope ratios . . . . . . . . . . . . . . . . . . . . . . . 52
3.8. Summary . . . . . . . . . . . . . . . . . . . . . . . . . . . . . . . . . . . . . 53
Chapter 4 · Assessment of Human Exposure . . . . . . . 54–––––––––––––––––––––––––––––––––––––––––––––––––––––––4.1. Atmospheric sources. . . . . . . . . . . . . . . . . . . . . . . . . . . . 544.2. Faroe Islands . . . . . . . . . . . . . . . . . . . . . . . . . . . . . . . . . . 54
4.2.1. Food consumption . . . . . . . . . . . . . . . . . . . . . . . . . 544.2.2. Dose estimation . . . . . . . . . . . . . . . . . . . . . . . . . . . 55
4.3. Canadian Arctic . . . . . . . . . . . . . . . . . . . . . . . . . . . . . . . 554.4. Northwest Russia . . . . . . . . . . . . . . . . . . . . . . . . . . . . . . 57
4.4.1. Dietary preferences . . . . . . . . . . . . . . . . . . . . . . . . . 574.4.1.1. Group I . . . . . . . . . . . . . . . . . . . . . . . . . . . 574.4.1.2. Group II . . . . . . . . . . . . . . . . . . . . . . . . . . 584.4.1.3. Group III . . . . . . . . . . . . . . . . . . . . . . . . . 584.4.1.4. All Groups . . . . . . . . . . . . . . . . . . . . . . . . 59
4.4.2. Radionuclides in the diet. . . . . . . . . . . . . . . . . . . . . 594.4.3. Dose estimation . . . . . . . . . . . . . . . . . . . . . . . . . . . 59
4.4.3.1. Group I . . . . . . . . . . . . . . . . . . . . . . . . . . . 604.4.3.2. Group II . . . . . . . . . . . . . . . . . . . . . . . . . . 614.4.3.3. Group III . . . . . . . . . . . . . . . . . . . . . . . . . 614.4.3.4. All Groups . . . . . . . . . . . . . . . . . . . . . . . . 61
4.4.4. Comparison of past and present estimatesof internal dose . . . . . . . . . . . . . . . . . . . . . . . . . . . 62
4.5. European spent nuclear fuel reprocessing plants . . . . . 624.5.1. Technetium-99 . . . . . . . . . . . . . . . . . . . . . . . . . . . . 624.5.2. Iodine-129 . . . . . . . . . . . . . . . . . . . . . . . . . . . . . . . 63
4.6. Conclusions . . . . . . . . . . . . . . . . . . . . . . . . . . . . . . . . . . . 63Annex. Tables . . . . . . . . . . . . . . . . . . . . . . . . . . . . . . . . . . . . . 64
Contents–––––––––––––––––––––––––––––––––––––––––––––––––––––––––––––––––––––––––––––––––––––––––––––––––––––––––––––
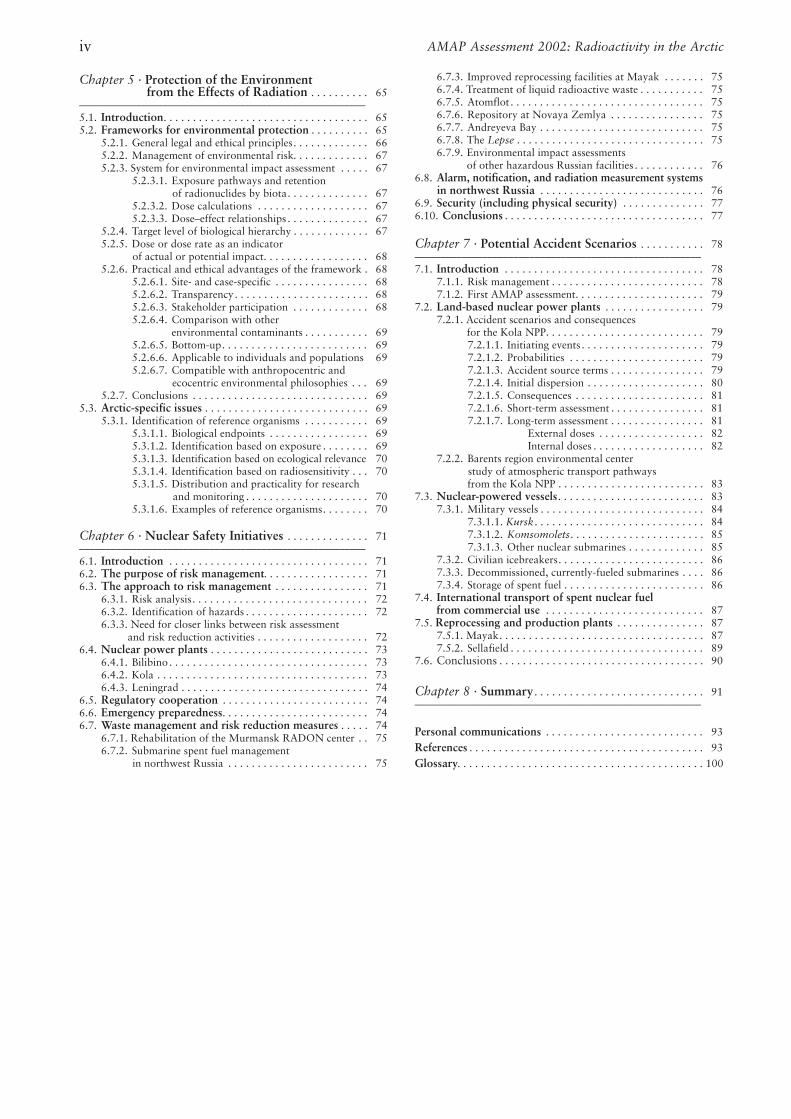
Chapter 5 · Protection of the Environmentfrom the Effects of Radiation . . . . . . . . . . 65
––––––––––––––––––––––––––––––––––––––––––––––––––––––– 5.1. Introduction. . . . . . . . . . . . . . . . . . . . . . . . . . . . . . . . . . . 655.2. Frameworks for environmental protection . . . . . . . . . . 65
5.2.1. General legal and ethical principles. . . . . . . . . . . . . 665.2.2. Management of environmental risk. . . . . . . . . . . . . 675.2.3. System for environmental impact assessment . . . . . 67
5.2.3.1. Exposure pathways and retention of radionuclides by biota. . . . . . . . . . . . . . 67
5.2.3.2. Dose calculations . . . . . . . . . . . . . . . . . . . 675.2.3.3. Dose–effect relationships . . . . . . . . . . . . . . 67
5.2.4. Target level of biological hierarchy . . . . . . . . . . . . . 675.2.5. Dose or dose rate as an indicator
of actual or potential impact. . . . . . . . . . . . . . . . . . 685.2.6. Practical and ethical advantages of the framework . 68
5.2.6.1. Site- and case-specific . . . . . . . . . . . . . . . . 685.2.6.2. Transparency. . . . . . . . . . . . . . . . . . . . . . . 685.2.6.3. Stakeholder participation . . . . . . . . . . . . . 685.2.6.4. Comparison with other
environmental contaminants . . . . . . . . . . . 695.2.6.5. Bottom-up. . . . . . . . . . . . . . . . . . . . . . . . . 695.2.6.6. Applicable to individuals and populations 695.2.6.7. Compatible with anthropocentric and
ecocentric environmental philosophies . . . 695.2.7. Conclusions . . . . . . . . . . . . . . . . . . . . . . . . . . . . . . 69
5.3. Arctic-specific issues . . . . . . . . . . . . . . . . . . . . . . . . . . . . 695.3.1. Identification of reference organisms . . . . . . . . . . . 69
5.3.1.1. Biological endpoints . . . . . . . . . . . . . . . . . 695.3.1.2. Identification based on exposure . . . . . . . . 695.3.1.3. Identification based on ecological relevance 705.3.1.4. Identification based on radiosensitivity . . . 705.3.1.5. Distribution and practicality for research
and monitoring . . . . . . . . . . . . . . . . . . . . . 705.3.1.6. Examples of reference organisms. . . . . . . . 70
Chapter 6 · Nuclear Safety Initiatives . . . . . . . . . . . . . . 71––––––––––––––––––––––––––––––––––––––––––––––––––––––– 6.1. Introduction . . . . . . . . . . . . . . . . . . . . . . . . . . . . . . . . . . 716.2. The purpose of risk management. . . . . . . . . . . . . . . . . . 716.3. The approach to risk management . . . . . . . . . . . . . . . . 71
6.3.1. Risk analysis. . . . . . . . . . . . . . . . . . . . . . . . . . . . . . 726.3.2. Identification of hazards . . . . . . . . . . . . . . . . . . . . . 726.3.3. Need for closer links between risk assessment
and risk reduction activities . . . . . . . . . . . . . . . . . . . 726.4. Nuclear power plants . . . . . . . . . . . . . . . . . . . . . . . . . . . 73
6.4.1. Bilibino . . . . . . . . . . . . . . . . . . . . . . . . . . . . . . . . . . 736.4.2. Kola . . . . . . . . . . . . . . . . . . . . . . . . . . . . . . . . . . . . 736.4.3. Leningrad . . . . . . . . . . . . . . . . . . . . . . . . . . . . . . . . 74
6.5. Regulatory cooperation . . . . . . . . . . . . . . . . . . . . . . . . . 746.6. Emergency preparedness. . . . . . . . . . . . . . . . . . . . . . . . . 746.7. Waste management and risk reduction measures . . . . . 74
6.7.1. Rehabilitation of the Murmansk RADON center . . 756.7.2. Submarine spent fuel management
in northwest Russia . . . . . . . . . . . . . . . . . . . . . . . . 75
6.7.3. Improved reprocessing facilities at Mayak . . . . . . . 756.7.4. Treatment of liquid radioactive waste . . . . . . . . . . . 756.7.5. Atomflot . . . . . . . . . . . . . . . . . . . . . . . . . . . . . . . . . 756.7.6. Repository at Novaya Zemlya . . . . . . . . . . . . . . . . 756.7.7. Andreyeva Bay . . . . . . . . . . . . . . . . . . . . . . . . . . . . 756.7.8. The Lepse . . . . . . . . . . . . . . . . . . . . . . . . . . . . . . . . 756.7.9. Environmental impact assessments
of other hazardous Russian facilities . . . . . . . . . . . . 766.8. Alarm, notification, and radiation measurement systems
in northwest Russia . . . . . . . . . . . . . . . . . . . . . . . . . . . . 766.9. Security (including physical security) . . . . . . . . . . . . . . 776.10. Conclusions . . . . . . . . . . . . . . . . . . . . . . . . . . . . . . . . . . 77
Chapter 7 · Potential Accident Scenarios . . . . . . . . . . . 78––––––––––––––––––––––––––––––––––––––––––––––––––––––– 7.1. Introduction . . . . . . . . . . . . . . . . . . . . . . . . . . . . . . . . . . 78
7.1.1. Risk management . . . . . . . . . . . . . . . . . . . . . . . . . . 787.1.2. First AMAP assessment. . . . . . . . . . . . . . . . . . . . . . 79
7.2. Land-based nuclear power plants . . . . . . . . . . . . . . . . . 797.2.1. Accident scenarios and consequences
for the Kola NPP. . . . . . . . . . . . . . . . . . . . . . . . . . . 797.2.1.1. Initiating events . . . . . . . . . . . . . . . . . . . . . 797.2.1.2. Probabilities . . . . . . . . . . . . . . . . . . . . . . . 797.2.1.3. Accident source terms . . . . . . . . . . . . . . . . 797.2.1.4. Initial dispersion . . . . . . . . . . . . . . . . . . . . 807.2.1.5. Consequences . . . . . . . . . . . . . . . . . . . . . . 817.2.1.6. Short-term assessment . . . . . . . . . . . . . . . . 817.2.1.7. Long-term assessment . . . . . . . . . . . . . . . . 81
External doses . . . . . . . . . . . . . . . . . . 82Internal doses . . . . . . . . . . . . . . . . . . . 82
7.2.2. Barents region environmental center study of atmospheric transport pathways from the Kola NPP . . . . . . . . . . . . . . . . . . . . . . . . . 83
7.3. Nuclear-powered vessels. . . . . . . . . . . . . . . . . . . . . . . . . 837.3.1. Military vessels . . . . . . . . . . . . . . . . . . . . . . . . . . . . 84
7.3.1.1. Kursk. . . . . . . . . . . . . . . . . . . . . . . . . . . . . 847.3.1.2. Komsomolets. . . . . . . . . . . . . . . . . . . . . . . 857.3.1.3. Other nuclear submarines . . . . . . . . . . . . . 85
7.3.2. Civilian icebreakers. . . . . . . . . . . . . . . . . . . . . . . . . 867.3.3. Decommissioned, currently-fueled submarines . . . . 867.3.4. Storage of spent fuel . . . . . . . . . . . . . . . . . . . . . . . . 86
7.4. International transport of spent nuclear fuel from commercial use . . . . . . . . . . . . . . . . . . . . . . . . . . . 87
7.5. Reprocessing and production plants . . . . . . . . . . . . . . . 877.5.1. Mayak. . . . . . . . . . . . . . . . . . . . . . . . . . . . . . . . . . . 877.5.2. Sellafield . . . . . . . . . . . . . . . . . . . . . . . . . . . . . . . . . 89
7.6. Conclusions . . . . . . . . . . . . . . . . . . . . . . . . . . . . . . . . . . . 90
Chapter 8 · Summary . . . . . . . . . . . . . . . . . . . . . . . . . . . . . 91–––––––––––––––––––––––––––––––––––––––––––––––––––––––
Personal communications . . . . . . . . . . . . . . . . . . . . . . . . . . . 93
References . . . . . . . . . . . . . . . . . . . . . . . . . . . . . . . . . . . . . . . . 93
Glossary. . . . . . . . . . . . . . . . . . . . . . . . . . . . . . . . . . . . . . . . . . 100
AMAP Assessment 2002: Radioactivity in the Arcticiv
This assessment report details the results of the 2002AMAP assessment of Radioactivity in the Arctic. It buildsupon the previous AMAP radioactivity assessment thatwas presented in ‘AMAP Assessment Report: Arctic Pol-lution Issues’* that was published in 1998.
The Arctic Monitoring and Assessment Programme(AMAP) is a group working under the Arctic Council.
The Arctic Council Ministers have requested AMAP to:
• produce integrated assessment reports on the statusand trends of the conditions of the Arctic ecosystems;
• identify possible causes for the changing conditions;• detect emerging problems, their possible causes, and
the potential risk to Arctic ecosystems including in-digenous peoples and other Arctic residents; and to
• recommend actions required to reduce risks to Arcticecosystems.
This report is one of five detailed assessment reportsthat provide the accessible scientific basis and validationfor the statements and recommendations made in thesecond AMAP State of the Arctic Environment report,‘Arctic Pollution 2002’** that was delivered to ArcticCouncil Ministers at their meeting in Inari, Finland in Oc-tober 2002. It includes extensive background data and ref-erences to the scientific literature, and details the sourcesfor figures reproduced in the ‘Arctic Pollution 2002’ re-port. Whereas the ‘Arctic Pollution 2002’ report con-tains recommendations that specifically focus on actionsaimed at improving the Arctic environment, the conclu-sions and recommendations presented in this report alsocover issues of a more scientific nature, such as propos-als for filling gaps in knowledge, and recommendationsrelevant to future monitoring and research work, etc.
To allow readers of this report to see how AMAP in-terprets and develops its scientifically-based assessmentproduct in terms of more action-orientated conclusionsand recommendations, the ‘Executive Summary of theArctic Pollution 2002 Ministerial Report’, which also cov-ers other priority issues (Persistent Organic Pollutants,Heavy Metals, Human Health, and Climate Change Ef-fects on Contaminant Pathways), is reproduced in thisreport on pages vii to xi.
The AMAP assessment is not a formal environmentalrisk assessment. Rather, it constitutes a compilation ofcurrent knowledge about the Arctic region, an evalua-tion of this information in relation to agreed criteria ofenvironmental quality, and a statement of the prevailingconditions in the area. The assessment presented in thisreport was prepared in a systematic and uniform man-ner to provide a comparable knowledge base that buildson earlier work and can be extended through continuingwork in the future.
The AMAP scientific assessments are prepared underthe direction of the AMAP Assessment Steering Group.The product is the responsibility of the scientific experts
involved in the preparation of the assessment. Leadcountries for the AMAP Radioactivity Assessment underAMAP phase II were Norway and Russia. The assess-ment is based on work conducted by a large number ofscientists and experts from the Arctic countries (Canada,Denmark/Greenland/Faroe Islands, Finland, Iceland,Norway, Russia, Sweden, and the United States), togetherwith contributions from indigenous peoples organiza-tions, from other organizations, and from experts inother countries.
AMAP would like to express its appreciation to all ofthese experts, who have contributed their time, effort,and data; and especially to the lead experts who coordi-nated the production of this report, and to referees whoprovided valuable comments and helped ensure thequality of the report. A list of the main contributors isincluded in the acknowledgements on page vi of this re-port. The list is not comprehensive. Specifically, it doesnot include the many national institutes, laboratoriesand organizations, and their staff, which have been in-volved in the various countries. Apologies, and no lesserthanks, are given to any individuals unintentionallyomitted from the list. Special thanks are due to the leadauthors responsible for the preparation of the variouschapters of this report.
The support of the Arctic countries is vital to the suc-cess of AMAP. AMAP work is essentially based on on-going activities within the Arctic countries, and thecountries also provide the necessary support for most ofthe experts involved in the preparation of the assess-ments. In particular, AMAP would like to express its ap-preciation to Norway and Russia for undertaking a leadrole in supporting the Radioactivity assessment. Specialthanks are also offered to the Nordic Council of Minis-ters for their financial support to the work of AMAP,and to sponsors of other bilateral and multilateral pro-jects that have delivered data for use in this assessment,including the European Union and the Joint Norwe-gian–Russian Group on Environmental Cooperation.
The AMAP Working Group that was established tooversee this work, and the AMAP radioactivity assess-ment group are pleased to present its assessment.
Helgi JenssonAMAP Working Group Chair
Per StrandAMAP radioactivity assessment co-lead (Norway)
Yuri TsaturovAMAP radioactivity assessment co-lead (Russia)
Lars-Otto ReiersenAMAP Executive Secretary
Oslo, June 2004
**AMAP, 1998. AMAP Assessment Report: Arctic Pollution Issues. Arctic Monitoring and Assessment Programme (AMAP), Oslo, Norway. xii+859 pp.
**AMAP, 2002. Arctic Pollution 2002: Persistent Organic Pollutants, Heavy Metals, Radioactivity, Human Health, Changing Pathways. Arctic Monitoring and Assessment Programme (AMAP), Oslo, Norway. xii+112 pp.
v
Preface–––––––––––––––––––––––––––––––––––––––––––––––––––––––––––––––––––––––––––––––––––––––––––––––––––––––––––––
The AMAP Working Group would like to thank the following persons for their work in preparing the AMAP 2002 Radioactivity Assessment.
Assessment Leads:Per Strand, Norwegian Radiation Protection Authority, Østerås, NorwayYuri Tsaturov, Roshydromet, Moscow, Russia
Coordinating Editors:Per StrandYuri TsaturovMorten Sickel, Norwegian Radiation Protection Authority, Østerås, Norway
Contributing Authors:Alexander Baklanov, Danish Meteorological Institute, Copenhagen, DenmarkMikhail Balonov, International Atomic Energy Agency, Vienna, AustriaTone Bergan, Norwegian Radiation Protection Authority, Østerås, NorwayMike Bewers, Bedford Institute of Oceanography, Department of Fisheries and Oceans, Dartmouth, NS, Canada Justin Brown, Norwegian Radiation Protection Authority, Østerås, NorwayHenning Dahlgaard, Radiation Research Department, Risø National Laboratory, Roskilde, DenmarkDouglas Dasher, Alaska Department of Environmental Conservation, Fairbanks, AK, USASlava Golikov, Institute of Radiation Hygiene, St. Petersburg, RussiaAnn Heinrich, Office of International Emergency Management and Cooperation, US Department of Energy, Washington DC, USABrenada Howard, Centre for Ecology and Hydrology, Lancaster, UKMikhail Iosjpe, Norwegian Radiation Protection Authority, Østerås, NorwayHans Pauli Joensen, Faculty of Science and Technology, University of the Faroe Islands, Argir, Faroe IslandsVincent McClelland, Office of International Emergency Management and Cooperation, US Department of Energy, Washington DC, USAMarkus Meili, Institute of Applied Environmental Research (ITM), Stockholm University, Stockholm, SwedenAlexander Nikitin, SPA Typhoon, Roshydromet, Obninsk, RussiaDeborah Oughton, Department of Plant and Environmental Sciences, Agricultural University of Norway, Ås, NorwaySigurdur Emil Palsson, Icelandic Radiation Protection Institute, Reykjavik, IcelandKristina Rissanen, Regional Laboratory in Northern Finland, Radiation and Nuclear Safety Authority, Rovaniemi, FinlandBritt Salbu, Department of Plant and Environmental Sciences, Agricultural University of Norway, Ås, NorwayMorten SickelPer StrandYuri TsaturovSergei Vakulovski, SPA Typhoon, Roshydromet, Obninsk, Russia
Contributors:Ingar Amundsen, Norwegian Radiation Protection Authority, Østerås, NorwayRonny Bergman, Swedish Defence Research Agency, Umeå, SwedenGordon Christensen, Insitute for Energy Research, Kjeller, NorwayOle Reistad, Norwegian Radiation Protection Authority, Østerås, NorwayAnne Liv Rudjord, Norwegian Radiation Protection Authority, Østerås, NorwayFrits Steenhuisen, Arctic Centre, University of Groningen, Groningen, Netherlands Helene Stensrud, Norwegian Radiation Protection Authority, Østerås, NorwayJason Stow, Department of Indian and Northern Affairs, Ottawa, Canada
Provision of data:Unless otherwise indicated, original graphics presented in this report were prepared by the AMAP Radioactivity Thematic Data Centre at theNorwegian Radiation Protection Authority (NRPA). The majority of the data incorporated in the graphics were provided by the following or-ganizations:
Alaska Department of Environmental Conservation, AK, USABundesamt für Seeschifffahrt und Hydrographie (BSH), Hamburg, GermanyCentre for Environment, Fisheries and Aquaculture Science (CEFAS), Lowestoft, U.K.Finnish Radiation and Nuclear Safety Authority (STUK), Rovaniemi, FinlandNorwegian Radiation Protection Authority (NRPA), Østerås, NorwayRisø National Laboratory, Roskilde, DenmarkRoshydromet, Moscow, RussiaSwedish Defence Research Agency, Umeå, SwedenUniversity of the Faroe Islands, Argir, Faroe Islands
vi
Acknowledgements–––––––––––––––––––––––––––––––––––––––––––––––––––––––––––––––––––––––––––––––––––––––––––––––––––––––––––––
The Arctic Monitoring and Assessment Programme(AMAP) was established in 1991 to monitor identifiedpollution risks and their impacts on Arctic ecosystems. In1997 the first AMAP report, Arctic Pollution Issues: AState of the Arctic Environment Report* was published.
The assessment showed that the Arctic is closely con-nected to the rest of the world, receiving contaminantsfrom sources far outside the Arctic region. The reportwas welcomed by the Arctic Council Ministers, whoagreed to increase their efforts to limit and reduce emis-sions of contaminants into the environment and to pro-mote international cooperation in order to address theserious pollution risks reported by AMAP.
The AMAP information greatly assisted the negota-tion of the protocols on persistent organic pollutants(POPs) and heavy metals to the United Nations Eco-nomic Commission for Europe’s Convention on Long-range Transboundary Air Pollution (LRTAP Conven-tion). They also played an important role in establishingthe need for a global agreement on POPs, which wasconcluded in 2001 as the Stockholm Convention. Persis-tence, long-range transport, and bioaccumulation arescreening criteria under both the POPs protocol and theStockholm Convention, to be applied to proposals toadd substances to the agreements. Information fromAMAP will be useful in this context in showing whetherpersistent substances are accumulating in the Arctic andare therefore candidates for control, and also in assess-ing the effectiveness of the agreements.
The Arctic Council also decided to take cooperativeactions to reduce pollution of the Arctic. As a direct fol-low up of the AMAP reports, the Arctic Council ActionPlan to Eliminate Pollution of the Arctic (ACAP) wascreated to address sources identified through AMAP.ACAP was approved in 2000 and several projects havebegun. The AMAP information was also used in estab-lishing priorities for the Arctic Regional Programme ofAction to Prevent Pollution from Landbased Sources(RPA), developed by the working group on Protection ofthe Arctic Marine Environment (PAME), and adoptedby the Arctic Council in 1998.
After the first assessment, AMAP was asked to con-tinue its activities and provide an updated assessment onpersistent organic pollutants (POPs), heavy metals, ra-dioactivity, human health, and pathways in 2002. Fivescientific reports and a plain-language report have beenprepared. This Executive Summary provides the mainconclusions and recommendations of the 2002 AMAPassessments.
International Agreements and ActionsAs described above, the LRTAP Convention protocols andthe Stockholm Convention are essential instruments forreducing contamination in the Arctic. However, they can-not have any effect until they are ratified and implemented.
It is therefore recommended that:• The UN ECE LRTAP Protocols on Heavy Metals and
POPs be ratified and implemented.• The Stockholm Convention on POPs be ratified and
implemented.
Specific recommendations for monitoring activities insupport of these agreements are included in subsequentsections.
Persistent Organic PollutantsThe POPs assessment addresses several chemicals ofconcern, including both substances that have been stud-ied for some time and chemicals that have only recentlybeen found in the environment.
The 1997 AMAP assessment concluded that levels ofPOPs in the Arctic environment are generally lower than inmore temperate regions. However, several biological andphysical processes concentrate POPs in some species andat some locations, producing some high levels in the Arctic.
The present AMAP assessment has found that theconclusions and recommendations of the first assess-ment remain valid. In addition:
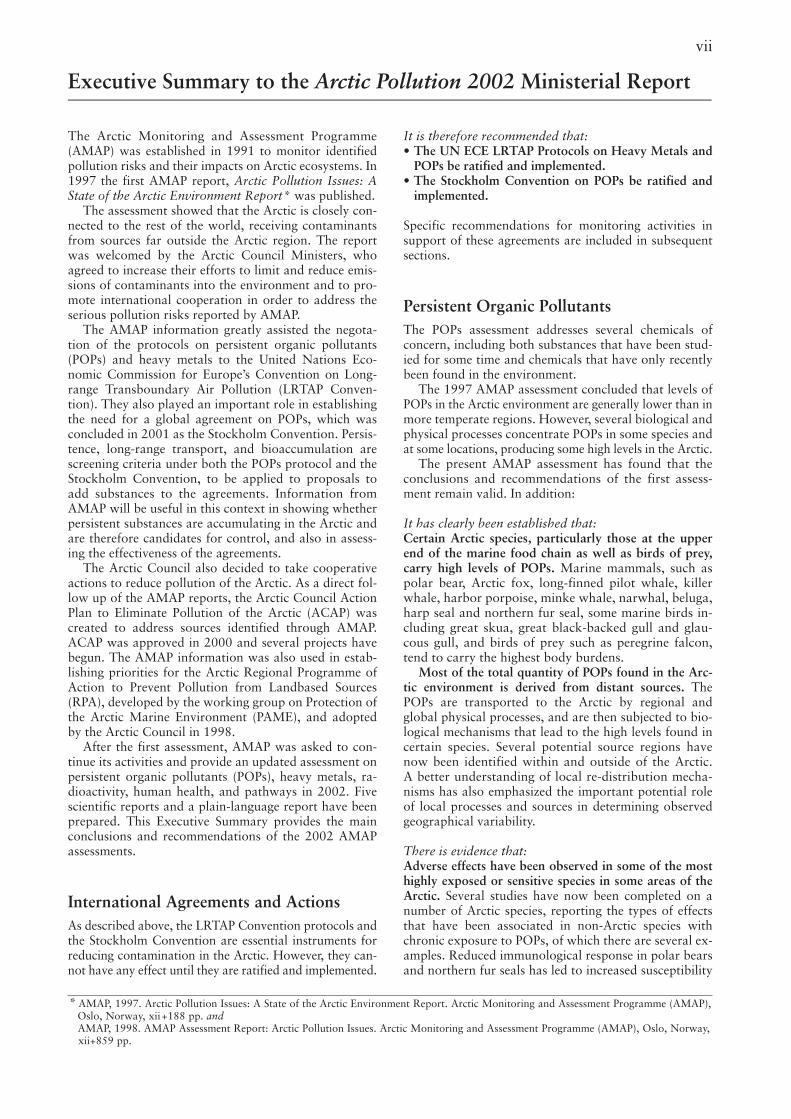
It has clearly been established that: Certain Arctic species, particularly those at the upperend of the marine food chain as well as birds of prey,carry high levels of POPs. Marine mammals, such aspolar bear, Arctic fox, long-finned pilot whale, killerwhale, harbor porpoise, minke whale, narwhal, beluga,harp seal and northern fur seal, some marine birds in-cluding great skua, great black-backed gull and glau-cous gull, and birds of prey such as peregrine falcon,tend to carry the highest body burdens.
Most of the total quantity of POPs found in the Arc-tic environment is derived from distant sources. ThePOPs are transported to the Arctic by regional andglobal physical processes, and are then subjected to bio-logical mechanisms that lead to the high levels found incertain species. Several potential source regions havenow been identified within and outside of the Arctic.A better understanding of local re-distribution mecha-nisms has also emphasized the important potential roleof local processes and sources in determining observedgeographical variability.
There is evidence that:Adverse effects have been observed in some of the mosthighly exposed or sensitive species in some areas of theArctic. Several studies have now been completed on anumber of Arctic species, reporting the types of effectsthat have been associated in non-Arctic species withchronic exposure to POPs, of which there are several ex-amples. Reduced immunological response in polar bearsand northern fur seals has led to increased susceptibility
Executive Summary to the Arctic Pollution 2002 Ministerial Report–––––––––––––––––––––––––––––––––––––––––––––––––––––––––––––––––––––––––––––––––––––––––––––––––––––––––––––
* AMAP, 1997. Arctic Pollution Issues: A State of the Arctic Environment Report. Arctic Monitoring and Assessment Programme (AMAP),Oslo, Norway, xii+188 pp. andAMAP, 1998. AMAP Assessment Report: Arctic Pollution Issues. Arctic Monitoring and Assessment Programme (AMAP), Oslo, Norway,xii+859 pp.
vii
to infection. Immunological, behavioral, and reproduc-tive effects as well as reduced adult survival has beenfound in glaucous gulls. Peregrine falcons have sufferedfrom eggshell thinning and reproductive effects. Repro-ductive effects in dogwhelks are associated with expo-sure to tributyltin.
It is therefore recommended that:• AMAP be asked to further enhance studies aimed at de-
tecting effects in Arctic species relating to exposure tohigh levels of POPs and to integrate this informationwith an understanding of general population effectsand health. Without this understanding, it will not bepossible to assess whether proposed and existing con-trols can be expected to afford the necessary protection(e.g., under the LRTAP and Stockholm agreements).
There is evidence that:The levels of some POPs are decreasing in most speciesand media in the Arctic, but the rates vary in extent, lo-cation and media or species being studied. The decreasescan be related to reduced release to the environment. Forexample, declines in alpha-HCH in air closely follow de-creases in global usage, but declines in marine biota aremuch slower due to a huge reservoir of the substance inthe global oceans.
For other POPs, declines are minimal and some levelsare actually increasing, despite low current emissions.This illustrates the long period that may pass betweenthe introduction of controls and the resulting decrease inlevels in biota, as has been observed for PCBs, toxa-phene, and beta-HCH.
It is therefore recommended that:• AMAP be asked to continue trend monitoring of POPs
in key indicator media and biota. This will enable as-sessment of whether the measures taken in the LRTAPProtocol and the Stockholm Convention are being ef-fective in driving down POPs levels in the Arctic.
There is evidence that:POPs substances other than those included in theLRTAP Protocol and Stockholm Convention may be ator approaching levels in the Arctic that could justify re-gional and global action. For example, levels of thebrominated flame retardants such as polybrominated di-phenyl ethers (PBDEs), polychlorinated naphthalenes(PCNs), and some current-use pesticides such as endo-sulfan have been monitored in Arctic air and biota.PBDEs are increasing in the Canadian Arctic.
It is therefore recommended that:• AMAP be asked to maintain a capacity to detect current-
use POPs in the Arctic. This will help ensure that ArcticStates have an early opportunity to respond to a trendindicating Arctic accumulation, thus allowing a proac-tive approach to minimize the contamination ratherthan having to respond to a more serious situation later.
Heavy MetalsThe heavy metals assessment focuses on mercury, lead,and cadmium.
It has clearly been established that:In the Arctic, mercury is removed from the atmosphereand deposits on snow in a form that can become bio-available. Enhanced deposition occurs in the Arctic. Thisrecently discovered process is linked to polar sunrise,and is unique to high latitude areas. The resulting en-hanced deposition may mean that the Arctic plays a pre-viously unrecognized role as an important sink in theglobal mercury cycle.
There is evidence that:Some of the deposited mercury is released to the envi-ronment at snowmelt, becoming bioavailable at the on-set of animal and plant reproduction and rapid growth.Although poorly understood, this process may be thechief mechanism for transferring atmospheric mercuryto Arctic food webs.
It is therefore recommended that:• The Arctic Council encourage expanded and acceler-
ated research on critical aspects of the mercury cycleand budget in the Arctic. Such research should includelong-range transport, mercury deposition mechanisms,processes leading to biological exposure and effects,and the influence of climate variability and change onthese processes.
There is evidence that:Despite substantial mercury emission reductions inNorth America and Western Europe during the 1980s,global mercury emissions may, in fact, be increasing.Mercury emissions from waste incineration are likelyunderestimated. The burning of coal in small-scalepower plants and residential heaters, principally inAsia, are major potential sources of current mercuryemissions. These emissions are likely to increase signif-icantly due to economic and population growth in thisregion.
It is therefore recommended that:• The Arctic Council promote efforts at global, regional,
and national levels to quantify all sources of mercuryand report results in a consistent and regular mannerto improve emission inventories. Particular effortsshould focus on measuring contributions made by theburning of coal for residential heating and small-scalepower plants as well as by waste incineration.
There is strong evidence that:There is a trend of increasing mercury levels in marinebirds and mammals in the Canadian Arctic, and someindications of increases in West Greenland. The effectsof these levels are not well understood. However, thereare also examples of stable or decreasing levels in otherregions, perhaps indicating the importance of local orregional processes.
It is therefore recommended that:• AMAP be asked to continue temporal trend monitor-
ing and the assessment of effects of mercury in key in-dicator media and biota. This will enable assessmentof whether the measures taken in the LRTAP Protocolare being effective in driving down mercury levels inthe Arctic.
viii AMAP Assessment 2002: Radioactivity in the Arctic
There is evidence that:Current mercury exposures pose a health risk to somepeople and animals in the Arctic. These risks includesubtle neurobehavioral effects.
It is therefore recommended that:• In view of the fact that reducing exposure to mercury
can only be addressed by regional and global action toreduce worldwide emissions, and acknowledging theassessment for global action undertaken by UNEP andits resulting proposals, the Arctic Council take appro-priate steps to ensure that Arctic concerns are ade-quately addressed and to promote the development ofregional and global actions.
It has clearly been established that:Dramatic reduction in the deposition of atmosphericlead has occurred in Arctic regions where the use ofleaded gasoline is banned. Arctic-wide elimination ofleaded gasoline use will reduce lead exposure in other re-gions of the Arctic. Although levels in wildlife and fishhave not measurably declined, likely reflecting contin-ued uptake from the large reservoir of lead deposited insoils and sediments, lead levels in the environment areexpected to diminish over time if current trends con-tinue.
It is therefore recommended that:• The Arctic Council support continued efforts to elimi-
nate the use of leaded gasoline in all Arctic regions.
It has clearly been established that:Certain regions of the Arctic contain elevated lead levelsin the environment because of past or current use of leadshot by hunters. Even though lead shot is banned inAlaska, for example, lead blood levels in endangeredUS populations of Steller’s eiders are above known aviantoxicity thresholds for lead poisoning, which may be re-sponsible for observed reduced breeding success. InGreenland, lead shot appears to be a significant sourceof human dietary exposure to lead.
It is therefore recommended that: • The Arctic Council encourage a complete ban on the
use of lead shot in the Arctic, and that enforcement beimproved.
There is evidence that:Cadmium levels in some seabirds is high enough tocause kidney damage. Monitoring data on cadmium inthe abiotic and biotic environment to date provide noconclusive evidence of trends or effects. However, cad-mium accumulates in birds and mammals and notenough is known about possible effects.
It is therefore recommended that: • The monitoring of cadmium in the Arctic be continued
to support human exposure estimates.
There is evidence that:Levels of platinum, palladium, and rhodium have in-creased rapidly in Greenland snow and ice since the1970s. These elements are used in automobile catalyticconverters to reduce hydrocarbon pollution. The tox-
icity and bioaccumulation potential of these elementsare largely unknown, which prevents assessment of theirpotential impact in the Arctic.
It is therefore recommended that: • AMAP be asked to consider the need to monitor trends
of platinum, palladium, and rhodium in the Arctic.
RadioactivityThe radioactivity assessment addresses man-made ra-dionuclides and radiation exposures deriving fromhuman activities.
It has clearly been established that:In general, levels of anthropogenic radionuclides in theArctic environment are declining. Most of the radioac-tive contamination in the Arctic land environment isfrom the fallout from nuclear weapons testing duringthe period 1945 to 1980. In some areas, the fallout fromthe Chernobyl accident in 1986 is a major source. Forthe Arctic marine environment, a major source of ra-dionuclides is the releases from European reprocessingplants at Sellafield and Cap de la Hague.
However, releases from the reprocessing plants haveresulted in increases in levels of some radionuclides inthe European Arctic seas during recent years, in particu-lar technetium-99 and iodine-129. The present doses tothe population are low but the present levels of tech-netium in some marine foodstuffs marketed in Europeare above the EU intervention levels for food to infantsand are close to the intervention level for adults.
The technetium information adds further weight to therecommendation made by AMAP to the Arctic Councilin Barrow in 2000 that:• ‘The Arctic Council encourage the United Kingdom to
reduce the releases from Sellafield to the marineenvironment of technetium, by implementing availabletechnology.’
There is evidence that:Radionuclides in sediments are now a source of pluto-nium and cesium-137 to the Arctic. Earlier releases suchas those from Sellafield that have deposited in sedimentsin the Irish Sea, especially cesium-137 and plutonium,have been observed to remobilize so that these depositsare now acting as sources to the Arctic. Thus, even if op-erational releases of these radionuclides from reprocess-ing plants are reduced, releases from environmentalsources such as contaminated sediment in the Irish Seaand the Baltic Sea will be observed in the Arctic.
It is therefore recommended that:• The Arctic Council support a more detailed study on
the remobilization of radionuclides from sediment andits potential effect on the Arctic.
It is apparent that:There is continuing uncertainty about the amount of ra-dionuclides present at a number of sources and potentialsources in the Arctic. Access to information about civil-ian and military sources continues to be a problem.
Executive Summary to the Arctic Pollution 2002 Ministerial Report ix
It is therefore recommended that:• The Arctic Council promote more openness of re-
stricted information from any sources.
It has clearly been established that:Compared with other areas of the world, the Arctic con-tains large areas of high vulnerability to radionuclides.This is due to the characteristics of vegetation, animals,human diets, and land- and resource-use practices. Onland in the AMAP area, there is considerable variation invulnerability due to differences in these characteristics. Incontrast, vulnerability associated with releases of radionu-clides to the marine environment is relatively uniform andsimilar to that for other areas of the world. Maps of vul-nerable areas, when combined with deposition maps, canbe useful in an accident situation. The information onvulnerability is of importance for emergency planning.
It is therefore recommended that:• AMAP be asked to clarify the vulnerability and impact
of radioactivity on the Arctic environment and its con-sequences for emergency preparedness planning.
It is apparent that:When performing risk reducing actions, close links toassessment programs are important and interventionsshould be prioritized in relation to the extent and mag-nitude of threats posed by nuclear activities, especially inrespect to accidents. Interventions themselves can alsohave negative effects for humans and the environment,and careful judgments have to be made together with en-vironmental impact assessments prior to carrying out aproject. It is the view of AMAP that this has not alwaysbeen done in interventions adopted to date.
It is therefore recommended that:• Risk and impact assessment programmes be performed
prior to implementation of action to reduce risk.• Risk and impact assessments, including accident sce-
narios, be performed with regard to the transport ofnuclear waste and fuel within the Arctic and nearbyareas and with regard to planned storage and repro-cessing within the Arctic and nearby areas.
It is apparent that:The protection of the environment from the effects ofradiation deserves specific attention. The current systemof radiological protection is entirely based on the protec-tion of human health. This approach can fail to addressenvironmental damage in areas such as the Arctic thathave low human population densities. Recently, an in-ternational consensus has emerged that the rapid devel-opment of a system and a framework for the protectionof the environment needs further effort. The Interna-tional Union of Radioecology (IUR), with support fromAMAP, was one of the first international organizationsto promote and present such a system and framework.
It is therefore recommended that:• AMAP be asked to take an active part in the continued
efforts to address environmental protection, with spe-cial responsibility for the Arctic. This should include thetask of adding the need for protection of the environ-ment into monitoring strategies and assessment tools.
It is noted that:Since the previous AMAP assessment, nuclear safetyprogrammes have been implemented in Russia at somenuclear power plants and other nuclear installations rel-evant to the Arctic.
It is therefore recommended that:• The Arctic Council continue its cooperation with Rus-
sia to improve the safety and safeguarding of nuclearinstallations and waste sites.
Human HealthThe human health assessment considered health risks as-sociated with exposure to contaminants in relation toother lifestyle factors determining health. This assess-ment has extended geographical coverage and confirmedthe conclusions and recommendations from the first as-sessment.
It has clearly been established that:The highest Arctic exposures to several POPs and mer-cury are faced by Inuit populations in Greenland andCanada. These exposures are linked mainly to consump-tion of marine species as part of traditional diets. Tempo-ral trends of human exposures to POPs have so far notbeen observed. Exposure to mercury has increased inmany Arctic regions while exposure to lead has declined.
It is therefore recommended that:• The monitoring of human exposure to mercury, relevant
POPs, including dioxins and dioxin-like compoundsand other chemicals of concern, be continued in orderto help estimate risk, further elaborate geographicaltrends, and begin to establish time trends of exposure.
There is evidence that:Subtle health effects are occurring in certain areas of theArctic due to exposure to contaminants in traditionalfood, particularly for mercury and PCBs. The evidencesuggests that the greatest concern is for fetal and neona-tal development. In the Arctic, human intake of sub-stances with dioxin-like effects is a matter of concern,confirmed by recent results from Greenland. Increasinghuman exposure to current-use chemicals has been doc-umented, for example for brominated flame retardants.Others such as polychlorinated naphthalenes (PCN) areexpected to be found in human tissues. Some of thesecompounds are expected to add to the total dioxin activ-ity in humans. The AMAP human health monitoringprogram includes a number of measures of effects, rang-ing from biomarkers of effects at the molecular level toepidemiological outcomes.
It is therefore recommended that:• The human health effects program developed by
AMAP be more extensively applied in order to providea better base for human risk assessment especially con-cerning pre- and neonatal exposures.
It has clearly been established that:In the Arctic, diet is the main source of exposure to mostcontaminants. Dietary intake of mercury and PCBs ex-
x AMAP Assessment 2002: Radioactivity in the Arctic
ceeds established national guidelines in a number ofcommunities in some areas of the Arctic, and there is ev-idence of neurobehavioral effects in children in someareas. In addition, life-style factors have been found toinfluence the body burden of some contaminants, for ex-ample cadmium exposure from smoking. In the Arcticregion, a local public health intervention has successfullyachieved a reduction of exposure to mercury by provid-ing advice on the mercury content of available tradi-tional foods. The physiological and nutritional benefitsof traditional food support the need to base dietary rec-ommendations on risk-benefit analyses. The health ben-efits of breast-feeding emphasize the importance of localprograms that inform mothers how adjustments withintheir traditional diet can reduce contaminant levels intheir milk without compromising the nutritional valueof their diet.
It is therefore recommended that:• In locations where exposures are high, carefully con-
sidered and balanced dietary advice that takes risk andbenefits into account be developed for children andmen and women of reproductive age. This adviceshould be developed by national and regional publichealth authorities in close consultation with affectedcommunities.
• Studies of the nutrient and contaminant content of tra-ditional food items be promoted in order to assesstheir benefits and to estimate exposures as a basis forpublic health interventions.
• Breast-feeding continue to be recognized as a practicethat benefits both mother and child. Nonetheless, ifcontaminant levels increase or more information indi-cates increased risk, the potential need for restrictionsshould continue to be evaluated.
It is noted that:From the Arctic human health perspective, it is of ut-most importance that considerations for global actionsagainst POPs and mercury take into account the con-cerns for Arctic human health. The Stockholm Conven-tion and the LRTAP protocols should be properly moni-tored in the Arctic to determine whether their implemen-tation is effective in protecting human health.
It is therefore recommended that:• AMAP participate in the global monitoring of human
exposure to be established under the Stockholm Con-vention on POPs.
• The Arctic Council monitor proposals for global ac-tion on mercury being undertaken by UNEP, and con-tribute as necessary to ensure that Arctic concerns re-lated to human health are adequately addressed.
Changing pathwaysThe assessment of changing pathways provides an intro-duction to the types of changes on contaminants path-ways to, within, and from the Arctic that might be ex-pected as a result of global climate change and variability.
There is evidence that:The routes and mechanisms by which POPs, heavy met-als, and radionuclides are delivered to the Arctic arestrongly influenced by climate variability and global cli-mate change. These pathways are complex, interactivesystems involving a number of factors, such as tempera-ture, precipitation, winds, ocean currents, and snow andice cover. Pathways within food webs and the effects onbiota may also be modified by changes to climate. Stud-ies using global change scenarios have indicated the po-tential for substantial changes in atmospheric andoceanographic pathways that carry contaminants to,within, and from the Arctic. These effects mean thatclimate-related variability in recent decades may be re-sponsible at least in part for some of the trends observedin contaminant levels.
It is therefore recommended that:• AMAP be asked to further investigate how climate
change and variability may influence the ways inwhich POPs, heavy metals, and radionuclides movewith respect to the Arctic environment and accumulatein and affect biota. This will enable Arctic States tobetter undertake strategic planning when consideringthe potential effectiveness of present and possible fu-ture national, regional, and global actions concerningcontaminants.
Executive Summary to the Arctic Pollution 2002 Ministerial Report xi

The current system of radiological protection is basedsolely on the protection of human health. The firstAMAP assessment concluded that the feasibility of as-sessing radiation effects on flora and fauna was limited.During AMAP Phase II, however, the development of aframework which includes the protection of flora andfauna in the basis for radiological protection has beengiven increased priority. This is warranted owing to thelow human population density of the Arctic and theneed to ensure that flora and fauna are adequately pro-tected from the effects of radionuclides in the environ-ment.
The general recommendations of the first AMAP as-sessment advocated:
• rigorous adherence to international guidance on radio-logical protection;
• more authoritative and comprehensive evaluations ofthe risk posed by accidents in the nuclear power in-dustry;
• increased attention to nuclear safety in nuclear fleetoperations; and
• improved estimates of habits and diets of Arctic resi-dents and radionuclide transfer rates in the environ-ment leading to human exposure thereby improvingthe basis for assessing radiation exposure and risk anddeciding on the need for intervention.
These general recommendations were augmented bymore specific recommendations concerning the storageof spent nuclear fuel and radioactive waste, monitoring,and limitations in the availability of information and sci-entific understanding.
The topics covered in this assessment are basicallysimilar to those of the previous report but with em-phasis given to new information and the results of in-vestigations instigated as a direct result of the firstAMAP assessment. Particular attention is given to pro-gress in the development of a radiological protectionsystem that includes provisions to guard against ad-verse effects of radionuclides on biota. Additional top-ics new to this assessment are the loss of the nuclear-powered submarine Kursk off Murmansk in August2000, and the potential for increased transport of spentnuclear fuel and mixed oxide fuel. These topics areaugmented by re-assessments of specific activities orsources based on information that has become avail-able since the beginning of 1997. Only those issues thatpertain directly to conditions in the Arctic or that posethreats to the Arctic environment are addressed in thisassessment.
1
This report concerns issues relating to the presence andeffects of radioactive contaminants in the Arctic. It fol-lows on from Chapter 8 of the first AMAP assessmentreport (AMAP, 1997, 1998; available at http://www.amap.no). The purpose of this second assessment is toprovide an update in cases where new information hasbecome available that either warrants revised assessmentor relates to operations and sources that were not previ-ously considered. Such information has been providedby Arctic countries as a result of further research or as aconsequence of AMAP monitoring activities.
The first AMAP assessment was based on informa-tion available up to the beginning of 1997. It containedan introduction to the topics of radioactivity and radio-logical protection and explanations of transport pro-cesses and exposure pathways for radionuclides. The as-sessment then dealt sequentially with: past and presentradioactive contamination of the Arctic; individual dosesto man estimated from environmental measurements;source-related assessments of past and present releases;source-related assessments of potential releases; and spa-tial analysis of the vulnerability of Arctic ecosystems.The main part of the assessment concerned: the presenceand distribution of radionuclides in the Arctic and theirsources; doses to humans resulting from the presence ofthese radionuclides and their sources at both individualand collective (population) levels; the radiological threatsposed by known sources of radionuclides in the Arctic,especially in relation to potential accidents in the civilianand military sectors; and the vulnerability of the Arcticin the sense of the degrees of human exposure conse-quent to accidental releases in the Arctic compared toother regions of the world. The overall conclusions of theprevious AMAP assessment of radioactivity in the Arc-tic, supported by more detailed explanations were that:
‘... the greatest threats [from radioactivity] to humanhealth and the environment posed by human and indus-trial activities in the Arctic are associated with the po-tential for accidents in the civilian and military nuclearsectors. Of most concern are the consequences of poten-tial accidents in nuclear power plant reactors, during thehandling and storage of nuclear weapons, in the decom-missioning of nuclear submarines and in the disposal ofspent nuclear fuel from vessels. In the Arctic, terrestrialpathways of human exposure to radioactive contamina-tion are far more important than marine pathways. Thevulnerability of Arctic populations, especially indigenouspeoples, to radiocaesium deposition is much greaterthan for temperate populations due to the importance ofterrestrial, semi-natural exposure pathways.’
Chapter 1
Introduction –––––––––––––––––––––––––––––––––––––––––––––––––––––––––––––––––––––––––––––––––––––––––
2.1. IntroductionThe previous AMAP assessment (AMAP, 1998) de-scribed the actual and potential anthropogenic sourcesof radionuclides and associated radiological effects rele-vant to the Arctic environment. Actual sources are thosefrom which there are continuing releases of radionu-clides to the open environment (i.e., to areas outside nor-mal regulatory control). These include emissions fromnuclear fuel reprocessing plants in Western Europe, rou-tine emissions from nuclear power plants in the Arctic(both civilian and military), and fallout from the atmos-phere as a legacy of atmospheric nuclear weapons tests.Potential sources are contained sources of radionuclidesthat are managed in a manner that has the goal of pre-venting radiologically significant releases to the environ-ment. These include civilian and military nuclear reac-tors, nuclear waste storage facilities, and authorized ac-cumulations of radionuclides in controlled areas such asthe Mayak storage ponds. Such containment can fail,leading to additional releases of radionuclides to theopen environment and possible increased exposure ofhumans and other organisms.
This chapter includes new information on sourcesof radioactivity covered in the previous AMAP assess-
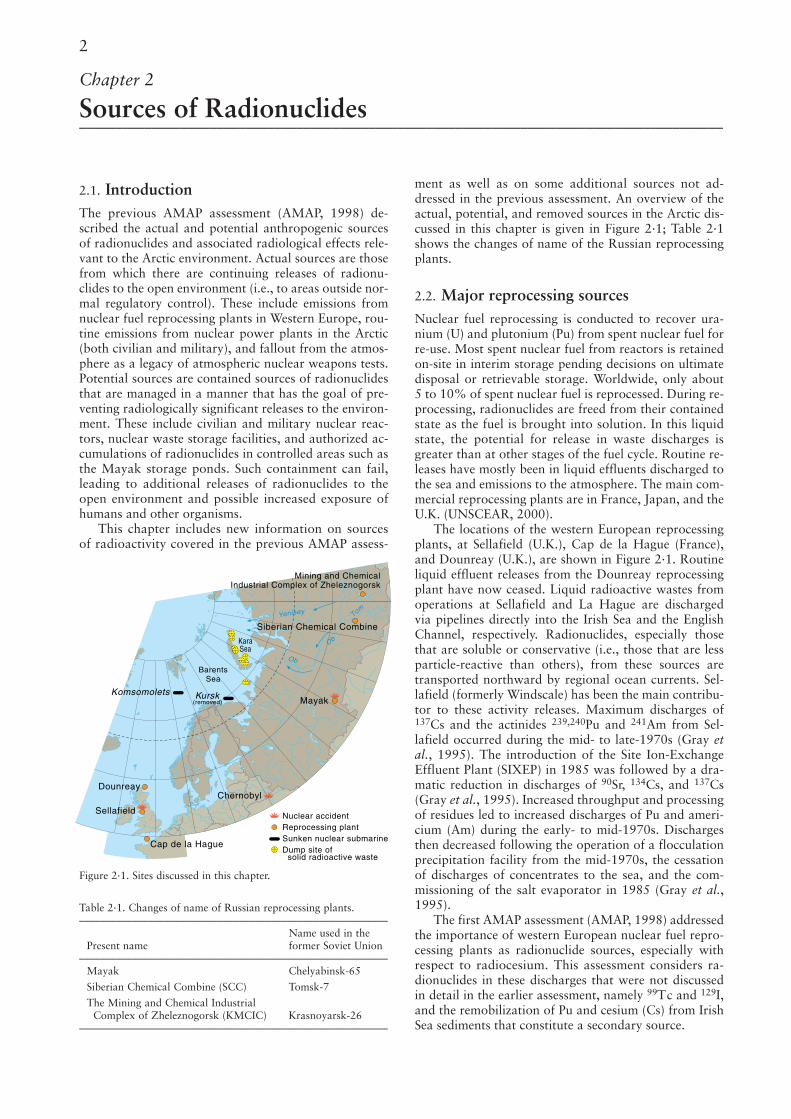
ment as well as on some additional sources not ad-dressed in the previous assessment. An overview of theactual, potential, and removed sources in the Arctic dis-cussed in this chapter is given in Figure 2·1; Table 2·1shows the changes of name of the Russian reprocessingplants.
2.2. Major reprocessing sources Nuclear fuel reprocessing is conducted to recover ura-nium (U) and plutonium (Pu) from spent nuclear fuel forre-use. Most spent nuclear fuel from reactors is retainedon-site in interim storage pending decisions on ultimatedisposal or retrievable storage. Worldwide, only about5 to 10% of spent nuclear fuel is reprocessed. During re-processing, radionuclides are freed from their containedstate as the fuel is brought into solution. In this liquidstate, the potential for release in waste discharges isgreater than at other stages of the fuel cycle. Routine re-leases have mostly been in liquid effluents discharged tothe sea and emissions to the atmosphere. The main com-mercial reprocessing plants are in France, Japan, and theU.K. (UNSCEAR, 2000).
The locations of the western European reprocessingplants, at Sellafield (U.K.), Cap de la Hague (France),and Dounreay (U.K.), are shown in Figure 2·1. Routineliquid effluent releases from the Dounreay reprocessingplant have now ceased. Liquid radioactive wastes fromoperations at Sellafield and La Hague are dischargedvia pipelines directly into the Irish Sea and the EnglishChannel, respectively. Radionuclides, especially thosethat are soluble or conservative (i.e., those that are lessparticle-reactive than others), from these sources aretransported northward by regional ocean currents. Sel-lafield (formerly Windscale) has been the main contribu-tor to these activity releases. Maximum discharges of137Cs and the actinides 239,240Pu and 241Am from Sel-lafield occurred during the mid- to late-1970s (Gray etal., 1995). The introduction of the Site Ion-ExchangeEffluent Plant (SIXEP) in 1985 was followed by a dra-matic reduction in discharges of 90Sr, 134Cs, and 137Cs(Gray et al., 1995). Increased throughput and processingof residues led to increased discharges of Pu and ameri-cium (Am) during the early- to mid-1970s. Dischargesthen decreased following the operation of a flocculationprecipitation facility from the mid-1970s, the cessationof discharges of concentrates to the sea, and the com-missioning of the salt evaporator in 1985 (Gray et al.,1995).
The first AMAP assessment (AMAP, 1998) addressedthe importance of western European nuclear fuel repro-cessing plants as radionuclide sources, especially withrespect to radiocesium. This assessment considers ra-dionuclides in these discharges that were not discussedin detail in the earlier assessment, namely 99Tc and 129I,and the remobilization of Pu and cesium (Cs) from IrishSea sediments that constitute a secondary source.
2
Chapter 2
Sources of Radionuclides –––––––––––––––––––––––––––––––––––––––––––––––––––––––––––––––––––––––––––––––––––––––––
Table 2·1. Changes of name of Russian reprocessing plants.––––––––––––––––––––––––––––––––––––––––––––––––––––––––––
Name used in thePresent name former Soviet Union
––––––––––––––––––––––––––––––––––––––––––––––––––––––––––Mayak Chelyabinsk-65
Siberian Chemical Combine (SCC) Tomsk-7
The Mining and Chemical IndustrialComplex of Zheleznogorsk (KMCIC) Krasnoyarsk-26
––––––––––––––––––––––––––––––––––––––––––––––––––––––––––
Mayak
Chernobyl
Siberian Chemical Combine
Kursk (removed)
Komsomolets
Mining and ChemicalIndustrial Complex of Zheleznogorsk
Dounreay
Sellafield
Yenisey
Ob
Ob
Tom
Nuclear accidentReprocessing plantSunken nuclear submarineDump site of solid radioactive waste
Cap de la Hague
KaraSea
BarentsSea
Figure 2·1. Sites discussed in this chapter.
2.2.1. Technetium-99
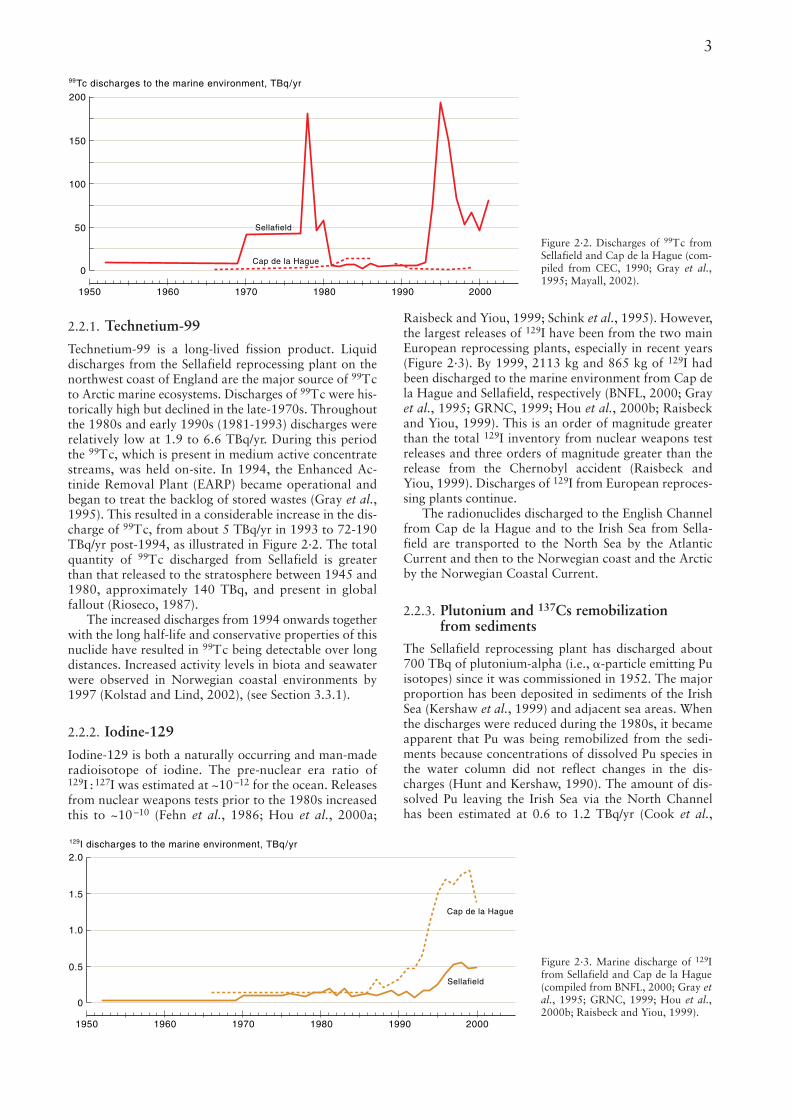
Technetium-99 is a long-lived fission product. Liquiddischarges from the Sellafield reprocessing plant on thenorthwest coast of England are the major source of 99Tcto Arctic marine ecosystems. Discharges of 99Tc were his-torically high but declined in the late-1970s. Throughoutthe 1980s and early 1990s (1981-1993) discharges wererelatively low at 1.9 to 6.6 TBq/yr. During this periodthe 99Tc, which is present in medium active concentratestreams, was held on-site. In 1994, the Enhanced Ac-tinide Removal Plant (EARP) became operational andbegan to treat the backlog of stored wastes (Gray et al.,1995). This resulted in a considerable increase in the dis-charge of 99Tc, from about 5 TBq/yr in 1993 to 72-190TBq/yr post-1994, as illustrated in Figure 2·2. The totalquantity of 99Tc discharged from Sellafield is greaterthan that released to the stratosphere between 1945 and1980, approximately 140 TBq, and present in globalfallout (Rioseco, 1987).
The increased discharges from 1994 onwards togetherwith the long half-life and conservative properties of thisnuclide have resulted in 99Tc being detectable over longdistances. Increased activity levels in biota and seawaterwere observed in Norwegian coastal environments by1997 (Kolstad and Lind, 2002), (see Section 3.3.1).
2.2.2. Iodine-129
Iodine-129 is both a naturally occurring and man-maderadioisotope of iodine. The pre-nuclear era ratio of129I : 127I was estimated at ~10–12 for the ocean. Releasesfrom nuclear weapons tests prior to the 1980s increasedthis to ~10–10 (Fehn et al., 1986; Hou et al., 2000a;
Raisbeck and Yiou, 1999; Schink et al., 1995). However,the largest releases of 129I have been from the two mainEuropean reprocessing plants, especially in recent years(Figure 2·3). By 1999, 2113 kg and 865 kg of 129I hadbeen discharged to the marine environment from Cap dela Hague and Sellafield, respectively (BNFL, 2000; Grayet al., 1995; GRNC, 1999; Hou et al., 2000b; Raisbeckand Yiou, 1999). This is an order of magnitude greaterthan the total 129I inventory from nuclear weapons testreleases and three orders of magnitude greater than therelease from the Chernobyl accident (Raisbeck andYiou, 1999). Discharges of 129I from European reproces-sing plants continue.
The radionuclides discharged to the English Channelfrom Cap de la Hague and to the Irish Sea from Sella-field are transported to the North Sea by the AtlanticCurrent and then to the Norwegian coast and the Arcticby the Norwegian Coastal Current.
2.2.3. Plutonium and 137Cs remobilization from sediments
The Sellafield reprocessing plant has discharged about700 TBq of plutonium-alpha (i.e., �-particle emitting Puisotopes) since it was commissioned in 1952. The majorproportion has been deposited in sediments of the IrishSea (Kershaw et al., 1999) and adjacent sea areas. Whenthe discharges were reduced during the 1980s, it becameapparent that Pu was being remobilized from the sedi-ments because concentrations of dissolved Pu species inthe water column did not reflect changes in the dis-charges (Hunt and Kershaw, 1990). The amount of dis-solved Pu leaving the Irish Sea via the North Channelhas been estimated at 0.6 to 1.2 TBq/yr (Cook et al.,
3
Sellafield
Cap de la Hague
1950 1960 1970 1980 1990 2000
200
99Tc discharges to the marine environment, TBq/yr
150
100
50
0
Sellafield
Cap de la Hague
1950 1960 1970 1980 1990 2000
2.0
1.5
1.0
0.5
129I discharges to the marine environment, TBq/yr
0
Figure 2·2. Discharges of 99Tc fromSellafield and Cap de la Hague (com-piled from CEC, 1990; Gray et al.,1995; Mayall, 2002).
Figure 2·3. Marine discharge of 129Ifrom Sellafield and Cap de la Hague(compiled from BNFL, 2000; Gray etal., 1995; GRNC, 1999; Hou et al.,2000b; Raisbeck and Yiou, 1999).
1997; Leonard et al., 1999). This pathway became a rec-ognized source of Pu to Arctic waters in the mid-1990s(Grøttheim, 2000; Herrmann et al., 1998; Kershaw etal., 1995) (see section 3.3.4). Isotope ratios in the Sel-lafield discharge have varied throughout its period ofoperation, but values around 0.2 seem indicative of238Pu : 239,240Pu activity ratios as well as of 240Pu : 239Puatom ratios in the remobilized Sellafield-derived Pu(Kershaw et al., 1995).
Most of the historic 137Cs discharges from Sellafield(~40 PBq) remained in solution and were transportedout of the Irish Sea, principally to Nordic waters (AMAP,1998). Complexed cesium in seawater has a weak affin-ity for sediment particles and so only a very small pro-portion was deposited in the sediments of the Irish Seaand downstream sea areas such as the North Sea andSkagerrak. When the 137Cs discharges were reduced inthe mid-1980s, monitoring showed that concentrationsin the water leaving the Irish Sea originated mainly fromremobilized activity previously deposited in the sedi-ments (Hunt and Kershaw, 1990). Cook et al. (1997) es-timated an annual loss of 86 TBq of 137Cs from Irish Seasediments based on sampling in 1992. By comparing in-ventories of 137Cs in Irish Sea sediments undertaken in1988 and 1995, Poole et al. (1997) concluded that 350to 573 TBq had been remobilized from the sedimentsduring that period. The remobilization of 137Cs fromIrish Sea sediments has thus been a more significantsource to Arctic waters than the 1990s discharges.
2.3. DumpingIn March 1993, a report was prepared by the govern-mental commission on radioactive waste disposal in seasadjacent to the territory of the Russian Federation (Ya-blokov, 1993). This is generally known as the ‘WhiteBook’ or the ‘Yablokov Report’. During its preparation,some Russian experts claimed that the upper estimatedinventory for the reactors dumped in the Arctic seaswere not justified. A major source of uncertainty at thattime in the calculation of fission products, activationproducts, and transuranium elements (actinides), was
the lack of information about the mass, enrichment, andburn-up of the spent nuclear fuel.
The first AMAP assessment outlined the results ofthe International Arctic Seas Assessment Project (IASAP).As part of IASAP, two Russian institutes (the KurchatovInstitute and the Institute of Physical and Power Engi-neering) undertook studies to improve estimates of thetotal inventory in the nuclear reactors (with and withoutspent nuclear fuel) dumped in the seas off the northwestregions of the Russian Federation (IAEA, 1997). Effortsto improve these estimates continued in Russia afterIASAP was completed. In January 1998, a workshop as-sociated with an International Science and TechnologyCenter project (Lavkovsky, 1998) discussed the resultsof these studies and concluded that they did not signifi-cantly modify the outcome of IASAP (IAEA, 1998a).The results are summarized in the rest of this section(Sivintsev and Kiknadze, 1998).
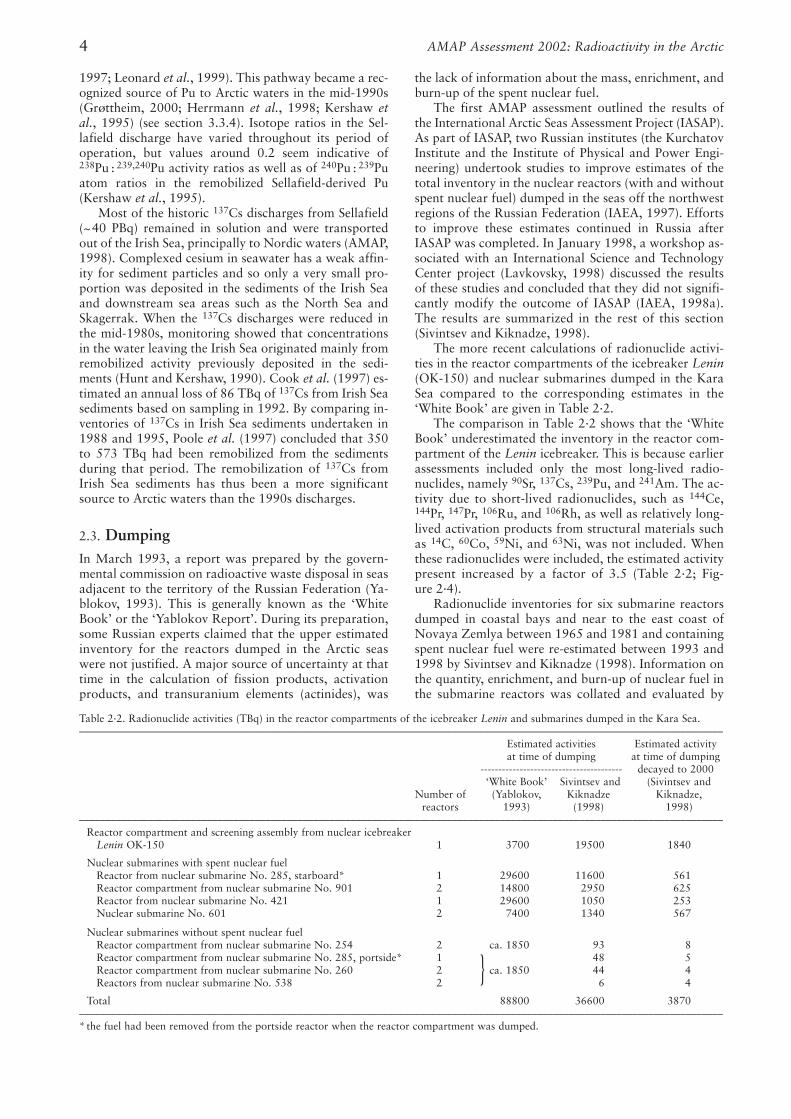
The more recent calculations of radionuclide activi-ties in the reactor compartments of the icebreaker Lenin(OK-150) and nuclear submarines dumped in the KaraSea compared to the corresponding estimates in the‘White Book’ are given in Table 2·2.
The comparison in Table 2·2 shows that the ‘WhiteBook’ underestimated the inventory in the reactor com-partment of the Lenin icebreaker. This is because earlierassessments included only the most long-lived radio-nuclides, namely 90Sr, 137Cs, 239Pu, and 241Am. The ac-tivity due to short-lived radionuclides, such as 144Ce,144Pr, 147Pr, 106Ru, and 106Rh, as well as relatively long-lived activation products from structural materials suchas 14C, 60Co, 59Ni, and 63Ni, was not included. Whenthese radionuclides were included, the estimated activitypresent increased by a factor of 3.5 (Table 2·2; Fig-ure 2·4).
Radionuclide inventories for six submarine reactorsdumped in coastal bays and near to the east coast ofNovaya Zemlya between 1965 and 1981 and containingspent nuclear fuel were re-estimated between 1993 and1998 by Sivintsev and Kiknadze (1998). Information onthe quantity, enrichment, and burn-up of nuclear fuel inthe submarine reactors was collated and evaluated by
AMAP Assessment 2002: Radioactivity in the Arctic4
Table 2·2. Radionuclide activities (TBq) in the reactor compartments of the icebreaker Lenin and submarines dumped in the Kara Sea. –––––––––––––––––––––––––––––––––––––––––––––––––––––––––––––––––––––––––––––––––––––––––––––––––––––––––––––––––––––––––
Estimated activities Estimated activityat time of dumping at time of dumping
---------------------------------------- decayed to 2000‘White Book’ Sivintsev and (Sivintsev and
Number of (Yablokov, Kiknadze Kiknadze, reactors 1993) (1998) 1998)
–––––––––––––––––––––––––––––––––––––––––––––––––––––––––––––––––––––––––––––––––––––––––––––––––––––––––––––––––––––––––Reactor compartment and screening assembly from nuclear icebreaker
Lenin OK-150 1 3700 19500 1840
Nuclear submarines with spent nuclear fuel Reactor from nuclear submarine No. 285, starboard* 1 29600 11600 561Reactor compartment from nuclear submarine No. 901 2 14800 2950 625Reactor from nuclear submarine No. 421 1 29600 1050 253Nuclear submarine No. 601 2 7400 1340 567
Nuclear submarines without spent nuclear fuelReactor compartment from nuclear submarine No. 254 2 ca. 1850 93 8Reactor compartment from nuclear submarine No. 285, portside* 1 48 5Reactor compartment from nuclear submarine No. 260 2 ca. 1850 44 4Reactors from nuclear submarine No. 538 2 6 4
Total 88800 36600 3870–––––––––––––––––––––––––––––––––––––––––––––––––––––––––––––––––––––––––––––––––––––––––––––––––––––––––––––––––––––––––* the fuel had been removed from the portside reactor when the reactor compartment was dumped.
}
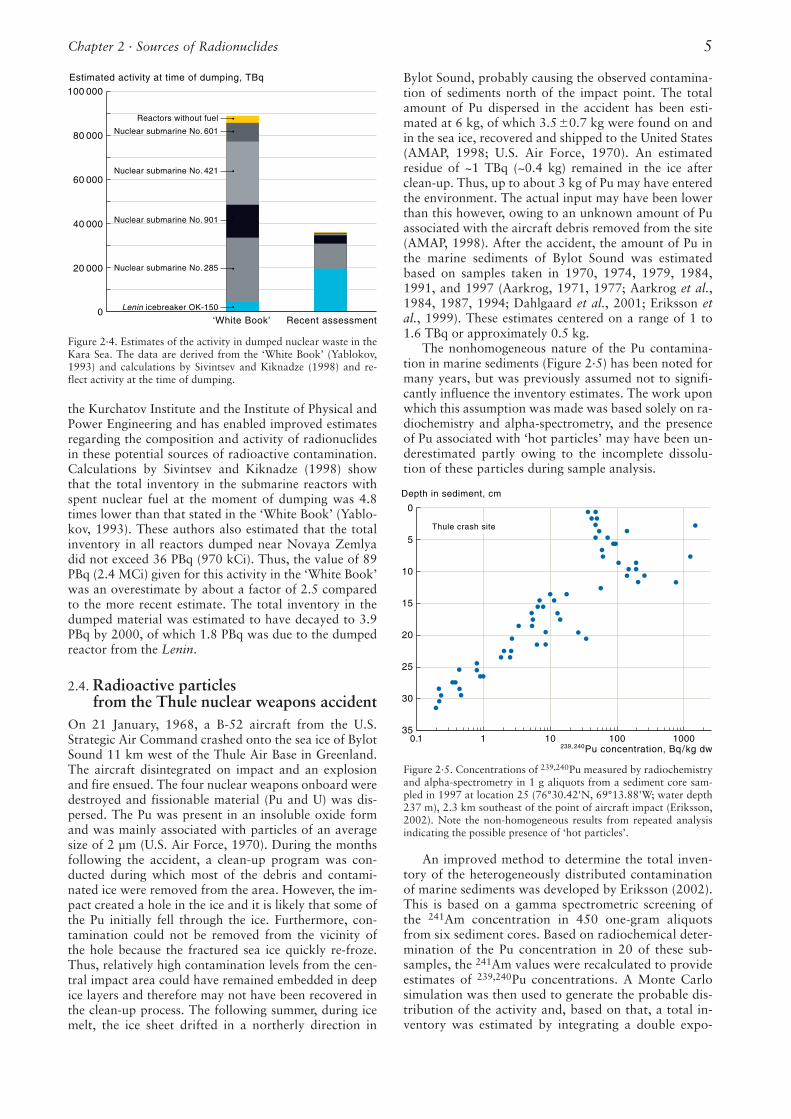
the Kurchatov Institute and the Institute of Physical andPower Engineering and has enabled improved estimatesregarding the composition and activity of radionuclidesin these potential sources of radioactive contamination.Calculations by Sivintsev and Kiknadze (1998) showthat the total inventory in the submarine reactors withspent nuclear fuel at the moment of dumping was 4.8times lower than that stated in the ‘White Book’ (Yablo-kov, 1993). These authors also estimated that the totalinventory in all reactors dumped near Novaya Zemlyadid not exceed 36 PBq (970 kCi). Thus, the value of 89PBq (2.4 MCi) given for this activity in the ‘White Book’was an overestimate by about a factor of 2.5 comparedto the more recent estimate. The total inventory in thedumped material was estimated to have decayed to 3.9PBq by 2000, of which 1.8 PBq was due to the dumpedreactor from the Lenin.
2.4. Radioactive particles from the Thule nuclear weapons accident
On 21 January, 1968, a B-52 aircraft from the U.S.Strategic Air Command crashed onto the sea ice of BylotSound 11 km west of the Thule Air Base in Greenland.The aircraft disintegrated on impact and an explosionand fire ensued. The four nuclear weapons onboard weredestroyed and fissionable material (Pu and U) was dis-persed. The Pu was present in an insoluble oxide formand was mainly associated with particles of an averagesize of 2 µm (U.S. Air Force, 1970). During the monthsfollowing the accident, a clean-up program was con-ducted during which most of the debris and contami-nated ice were removed from the area. However, the im-pact created a hole in the ice and it is likely that some ofthe Pu initially fell through the ice. Furthermore, con-tamination could not be removed from the vicinity ofthe hole because the fractured sea ice quickly re-froze.Thus, relatively high contamination levels from the cen-tral impact area could have remained embedded in deepice layers and therefore may not have been recovered inthe clean-up process. The following summer, during icemelt, the ice sheet drifted in a northerly direction in
Bylot Sound, probably causing the observed contamina-tion of sediments north of the impact point. The totalamount of Pu dispersed in the accident has been esti-mated at 6 kg, of which 3.5�0.7 kg were found on andin the sea ice, recovered and shipped to the United States(AMAP, 1998; U.S. Air Force, 1970). An estimatedresidue of ~1 TBq (~0.4 kg) remained in the ice afterclean-up. Thus, up to about 3 kg of Pu may have enteredthe environment. The actual input may have been lowerthan this however, owing to an unknown amount of Puassociated with the aircraft debris removed from the site(AMAP, 1998). After the accident, the amount of Pu inthe marine sediments of Bylot Sound was estimatedbased on samples taken in 1970, 1974, 1979, 1984,1991, and 1997 (Aarkrog, 1971, 1977; Aarkrog et al.,1984, 1987, 1994; Dahlgaard et al., 2001; Eriksson etal., 1999). These estimates centered on a range of 1 to1.6 TBq or approximately 0.5 kg.
The nonhomogeneous nature of the Pu contamina-tion in marine sediments (Figure 2·5) has been noted formany years, but was previously assumed not to signifi-cantly influence the inventory estimates. The work uponwhich this assumption was made was based solely on ra-diochemistry and alpha-spectrometry, and the presenceof Pu associated with ‘hot particles’ may have been un-derestimated partly owing to the incomplete dissolu-tion of these particles during sample analysis.
An improved method to determine the total inven-tory of the heterogeneously distributed contaminationof marine sediments was developed by Eriksson (2002).This is based on a gamma spectrometric screening ofthe 241Am concentration in 450 one-gram aliquotsfrom six sediment cores. Based on radiochemical deter-mination of the Pu concentration in 20 of these sub-samples, the 241Am values were recalculated to provideestimates of 239,240Pu concentrations. A Monte Carlosimulation was then used to generate the probable dis-tribution of the activity and, based on that, a total in-ventory was estimated by integrating a double expo-
Chapter 2 · Sources of Radionuclides 5
100 000
Estimated activity at time of dumping, TBq
80 000
60 000
40 000
20 000
0
Reactors without fuel
Lenin icebreaker OK-150
Nuclear submarine No. 285
Nuclear submarine No. 901
Nuclear submarine No. 421
Nuclear submarine No. 601
‘White Book’ Recent assessment
2 4
Figure 2·4. Estimates of the activity in dumped nuclear waste in theKara Sea. The data are derived from the ‘White Book’ (Yablokov,1993) and calculations by Sivintsev and Kiknadze (1998) and re-flect activity at the time of dumping.
2.5
351 10 100 1000
0.1
30
25
20
15
10
5
0
Depth in sediment, cm
239, 240Pu concentration, Bq/kg dw
Thule crash site
Figure 2·5. Concentrations of 239,240Pu measured by radiochemistryand alpha-spectrometry in 1 g aliquots from a sediment core sam-pled in 1997 at location 25 (76°30.42'N, 69°13.88'W; water depth237 m), 2.3 km southeast of the point of aircraft impact (Eriksson,2002). Note the non-homogeneous results from repeated analysisindicating the possible presence of ‘hot particles’.
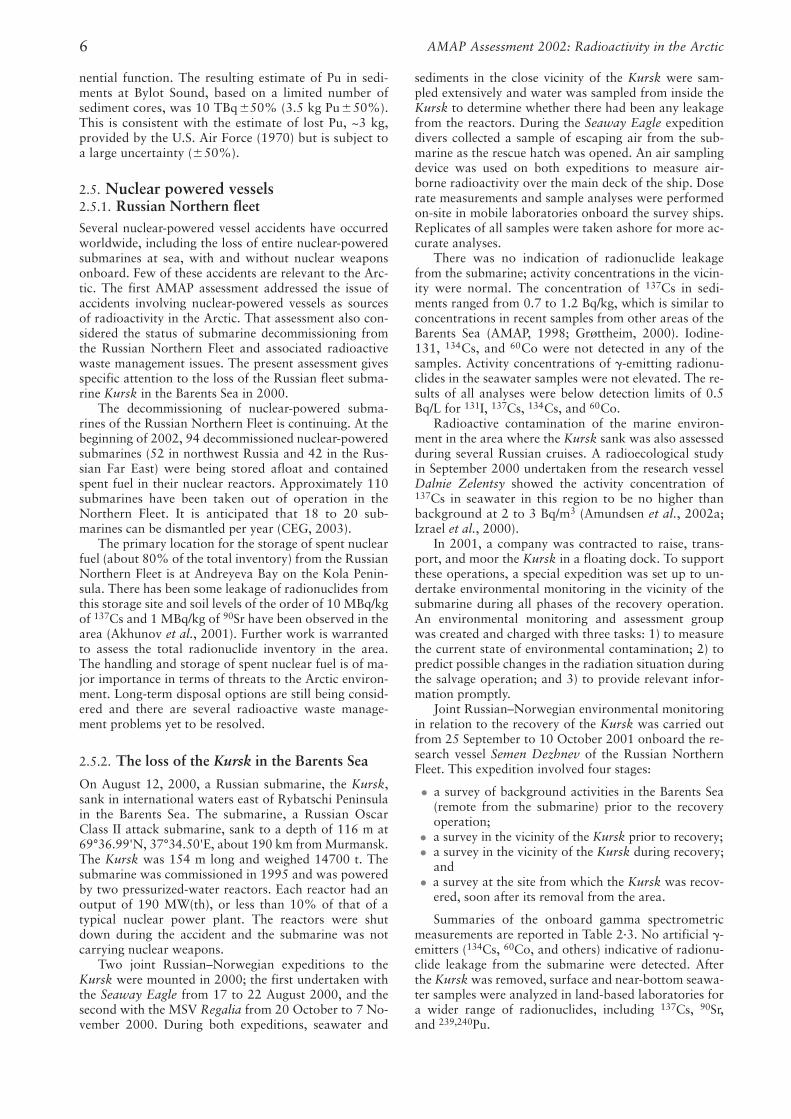
nential function. The resulting estimate of Pu in sedi-ments at Bylot Sound, based on a limited number ofsediment cores, was 10 TBq�50% (3.5 kg Pu�50%).This is consistent with the estimate of lost Pu, ~3 kg,provided by the U.S. Air Force (1970) but is subject toa large uncertainty (�50%).
2.5. Nuclear powered vessels2.5.1. Russian Northern fleetSeveral nuclear-powered vessel accidents have occurredworldwide, including the loss of entire nuclear-poweredsubmarines at sea, with and without nuclear weaponsonboard. Few of these accidents are relevant to the Arc-tic. The first AMAP assessment addressed the issue ofaccidents involving nuclear-powered vessels as sourcesof radioactivity in the Arctic. That assessment also con-sidered the status of submarine decommissioning fromthe Russian Northern Fleet and associated radioactivewaste management issues. The present assessment givesspecific attention to the loss of the Russian fleet subma-rine Kursk in the Barents Sea in 2000.
The decommissioning of nuclear-powered subma-rines of the Russian Northern Fleet is continuing. At thebeginning of 2002, 94 decommissioned nuclear-poweredsubmarines (52 in northwest Russia and 42 in the Rus-sian Far East) were being stored afloat and containedspent fuel in their nuclear reactors. Approximately 110submarines have been taken out of operation in theNorthern Fleet. It is anticipated that 18 to 20 sub-marines can be dismantled per year (CEG, 2003).
The primary location for the storage of spent nuclearfuel (about 80% of the total inventory) from the RussianNorthern Fleet is at Andreyeva Bay on the Kola Penin-sula. There has been some leakage of radionuclides fromthis storage site and soil levels of the order of 10 MBq/kgof 137Cs and 1 MBq/kg of 90Sr have been observed in thearea (Akhunov et al., 2001). Further work is warrantedto assess the total radionuclide inventory in the area.The handling and storage of spent nuclear fuel is of ma-jor importance in terms of threats to the Arctic environ-ment. Long-term disposal options are still being consid-ered and there are several radioactive waste manage-ment problems yet to be resolved.
2.5.2. The loss of the Kursk in the Barents Sea
On August 12, 2000, a Russian submarine, the Kursk,sank in international waters east of Rybatschi Peninsulain the Barents Sea. The submarine, a Russian OscarClass II attack submarine, sank to a depth of 116 m at69°36.99'N, 37°34.50'E, about 190 km from Murmansk.The Kursk was 154 m long and weighed 14700 t. Thesubmarine was commissioned in 1995 and was poweredby two pressurized-water reactors. Each reactor had anoutput of 190 MW(th), or less than 10% of that of atypical nuclear power plant. The reactors were shutdown during the accident and the submarine was notcarrying nuclear weapons.
Two joint Russian–Norwegian expeditions to theKursk were mounted in 2000; the first undertaken withthe Seaway Eagle from 17 to 22 August 2000, and thesecond with the MSV Regalia from 20 October to 7 No-vember 2000. During both expeditions, seawater and
sediments in the close vicinity of the Kursk were sam-pled extensively and water was sampled from inside theKursk to determine whether there had been any leakagefrom the reactors. During the Seaway Eagle expeditiondivers collected a sample of escaping air from the sub-marine as the rescue hatch was opened. An air samplingdevice was used on both expeditions to measure air-borne radioactivity over the main deck of the ship. Doserate measurements and sample analyses were performedon-site in mobile laboratories onboard the survey ships.Replicates of all samples were taken ashore for more ac-curate analyses.
There was no indication of radionuclide leakagefrom the submarine; activity concentrations in the vicin-ity were normal. The concentration of 137Cs in sedi-ments ranged from 0.7 to 1.2 Bq/kg, which is similar toconcentrations in recent samples from other areas of theBarents Sea (AMAP, 1998; Grøttheim, 2000). Iodine-131, 134Cs, and 60Co were not detected in any of thesamples. Activity concentrations of �-emitting radionu-clides in the seawater samples were not elevated. The re-sults of all analyses were below detection limits of 0.5Bq/L for 131I, 137Cs, 134Cs, and 60Co.
Radioactive contamination of the marine environ-ment in the area where the Kursk sank was also assessedduring several Russian cruises. A radioecological studyin September 2000 undertaken from the research vesselDalnie Zelentsy showed the activity concentration of137Cs in seawater in this region to be no higher thanbackground at 2 to 3 Bq/m3 (Amundsen et al., 2002a;Izrael et al., 2000).
In 2001, a company was contracted to raise, trans-port, and moor the Kursk in a floating dock. To supportthese operations, a special expedition was set up to un-dertake environmental monitoring in the vicinity of thesubmarine during all phases of the recovery operation.An environmental monitoring and assessment groupwas created and charged with three tasks: 1) to measurethe current state of environmental contamination; 2) topredict possible changes in the radiation situation duringthe salvage operation; and 3) to provide relevant infor-mation promptly.
Joint Russian–Norwegian environmental monitoringin relation to the recovery of the Kursk was carried outfrom 25 September to 10 October 2001 onboard the re-search vessel Semen Dezhnev of the Russian NorthernFleet. This expedition involved four stages:
• a survey of background activities in the Barents Sea(remote from the submarine) prior to the recoveryoperation;
• a survey in the vicinity of the Kursk prior to recovery;• a survey in the vicinity of the Kursk during recovery;
and • a survey at the site from which the Kursk was recov-
ered, soon after its removal from the area.
Summaries of the onboard gamma spectrometricmeasurements are reported in Table 2·3. No artificial �-emitters (134Cs, 60Co, and others) indicative of radionu-clide leakage from the submarine were detected. Afterthe Kursk was removed, surface and near-bottom seawa-ter samples were analyzed in land-based laboratories fora wider range of radionuclides, including 137Cs, 90Sr,and 239,240Pu.
AMAP Assessment 2002: Radioactivity in the Arctic6
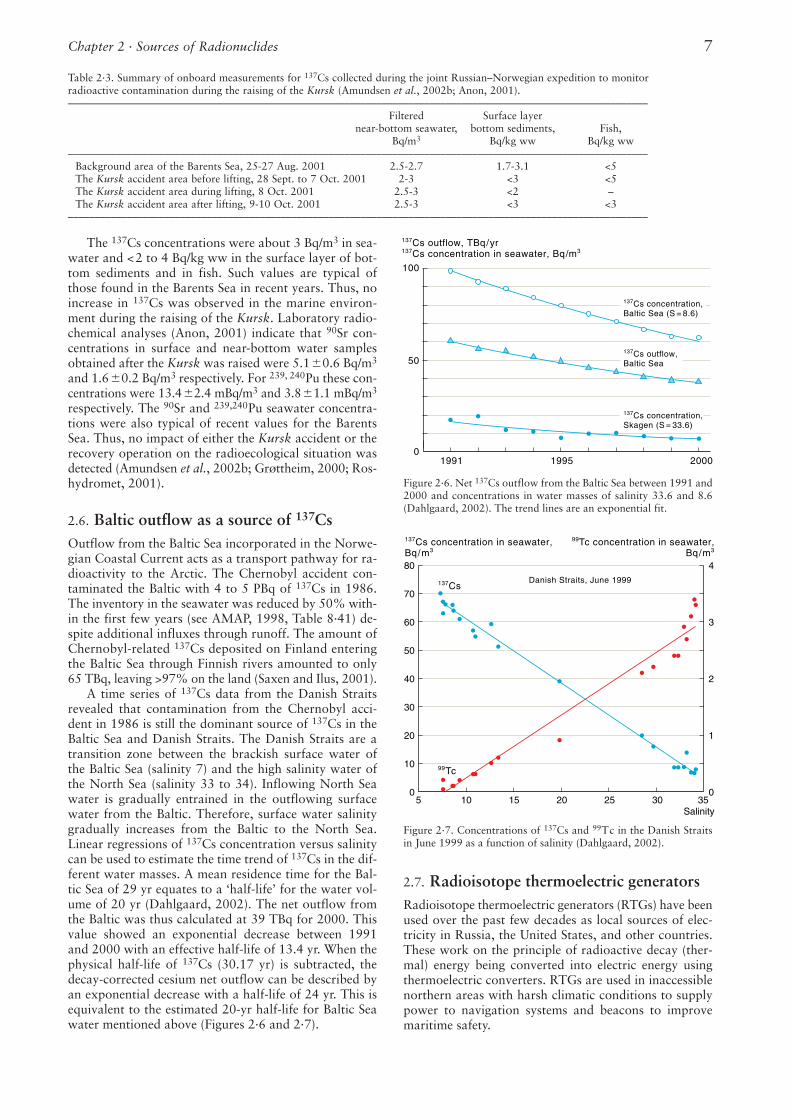
The 137Cs concentrations were about 3 Bq/m3 in sea-water and <2 to 4 Bq/kg ww in the surface layer of bot-tom sediments and in fish. Such values are typical ofthose found in the Barents Sea in recent years. Thus, noincrease in 137Cs was observed in the marine environ-ment during the raising of the Kursk. Laboratory radio-chemical analyses (Anon, 2001) indicate that 90Sr con-centrations in surface and near-bottom water samplesobtained after the Kursk was raised were 5.1�0.6 Bq/m3
and 1.6�0.2 Bq/m3 respectively. For 239, 240Pu these con-centrations were 13.4�2.4 mBq/m3 and 3.8�1.1 mBq/m3
respectively. The 90Sr and 239,240Pu seawater concentra-tions were also typical of recent values for the BarentsSea. Thus, no impact of either the Kursk accident or therecovery operation on the radioecological situation wasdetected (Amundsen et al., 2002b; Grøttheim, 2000; Ros-hydromet, 2001).
2.6. Baltic outflow as a source of 137CsOutflow from the Baltic Sea incorporated in the Norwe-gian Coastal Current acts as a transport pathway for ra-dioactivity to the Arctic. The Chernobyl accident con-taminated the Baltic with 4 to 5 PBq of 137Cs in 1986.The inventory in the seawater was reduced by 50% with-in the first few years (see AMAP, 1998, Table 8·41) de-spite additional influxes through runoff. The amount ofChernobyl-related 137Cs deposited on Finland enteringthe Baltic Sea through Finnish rivers amounted to only65 TBq, leaving >97% on the land (Saxen and Ilus, 2001).
A time series of 137Cs data from the Danish Straitsrevealed that contamination from the Chernobyl acci-dent in 1986 is still the dominant source of 137Cs in theBaltic Sea and Danish Straits. The Danish Straits are atransition zone between the brackish surface water ofthe Baltic Sea (salinity 7) and the high salinity water ofthe North Sea (salinity 33 to 34). Inflowing North Seawater is gradually entrained in the outflowing surfacewater from the Baltic. Therefore, surface water salinitygradually increases from the Baltic to the North Sea.Linear regressions of 137Cs concentration versus salinitycan be used to estimate the time trend of 137Cs in the dif-ferent water masses. A mean residence time for the Bal-tic Sea of 29 yr equates to a ‘half-life’ for the water vol-ume of 20 yr (Dahlgaard, 2002). The net outflow fromthe Baltic was thus calculated at 39 TBq for 2000. Thisvalue showed an exponential decrease between 1991and 2000 with an effective half-life of 13.4 yr. When thephysical half-life of 137Cs (30.17 yr) is subtracted, thedecay-corrected cesium net outflow can be described byan exponential decrease with a half-life of 24 yr. This isequivalent to the estimated 20-yr half-life for Baltic Seawater mentioned above (Figures 2·6 and 2·7).
2.7. Radioisotope thermoelectric generatorsRadioisotope thermoelectric generators (RTGs) have beenused over the past few decades as local sources of elec-tricity in Russia, the United States, and other countries.These work on the principle of radioactive decay (ther-mal) energy being converted into electric energy usingthermoelectric converters. RTGs are used in inaccessiblenorthern areas with harsh climatic conditions to supplypower to navigation systems and beacons to improvemaritime safety.
Chapter 2 · Sources of Radionuclides 7
Table 2·3. Summary of onboard measurements for 137Cs collected during the joint Russian–Norwegian expedition to monitor radioactive contamination during the raising of the Kursk (Amundsen et al., 2002b; Anon, 2001).–––––––––––––––––––––––––––––––––––––––––––––––––––––––––––––––––––––––––––––––––––––––––––––––––––––––––––––
Filtered Surface layer near-bottom seawater, bottom sediments, Fish,
Bq/m3 Bq/kg ww Bq/kg ww–––––––––––––––––––––––––––––––––––––––––––––––––––––––––––––––––––––––––––––––––––––––––––––––––––––––––––––
Background area of the Barents Sea, 25-27 Aug. 2001 2.5-2.7 1.7-3.1 <5The Kursk accident area before lifting, 28 Sept. to 7 Oct. 2001 2-3 <3 <5The Kursk accident area during lifting, 8 Oct. 2001 2.5-3 <2 –The Kursk accident area after lifting, 9-10 Oct. 2001 2.5-3 <3 <3
–––––––––––––––––––––––––––––––––––––––––––––––––––––––––––––––––––––––––––––––––––––––––––––––––––––––––––––
100
50
01991 1995 2000
137Cs outflow, TBq/yr137Cs concentration in seawater, Bq/m3
137Cs concentration,Baltic Sea (S = 8.6)
137Cs concentration,Skagen (S = 33.6)
137Cs outflow,Baltic Sea
80
70
60
50
40
30
20
10
05 10 15 20 25 30 35
Salinity
137Cs concentration in seawater, Bq/m3
137Cs
99Tc
99Tc concentration in seawater,Bq/m3
4
3
2
1
0
Danish Straits, June 1999
Figure 2·6. Net 137Cs outflow from the Baltic Sea between 1991 and2000 and concentrations in water masses of salinity 33.6 and 8.6(Dahlgaard, 2002). The trend lines are an exponential fit.
Figure 2·7. Concentrations of 137Cs and 99Tc in the Danish Straitsin June 1999 as a function of salinity (Dahlgaard, 2002).
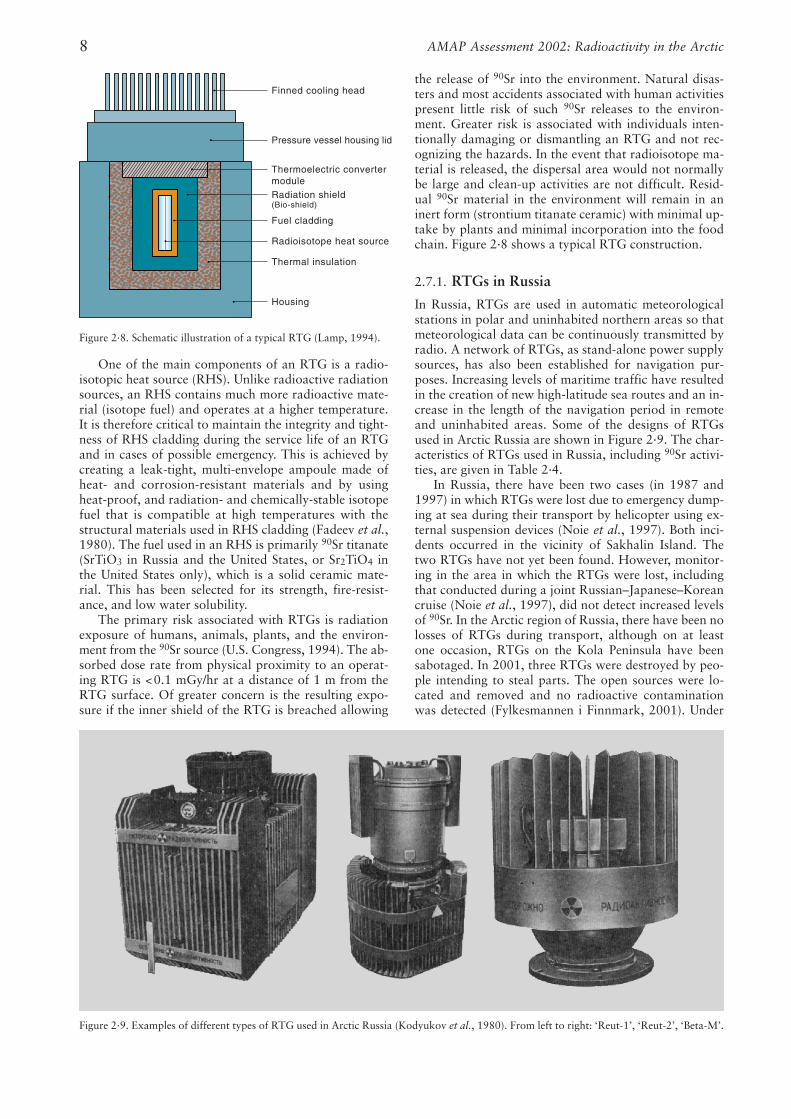
One of the main components of an RTG is a radio-isotopic heat source (RHS). Unlike radioactive radiationsources, an RHS contains much more radioactive mate-rial (isotope fuel) and operates at a higher temperature.It is therefore critical to maintain the integrity and tight-ness of RHS cladding during the service life of an RTGand in cases of possible emergency. This is achieved bycreating a leak-tight, multi-envelope ampoule made ofheat- and corrosion-resistant materials and by usingheat-proof, and radiation- and chemically-stable isotopefuel that is compatible at high temperatures with thestructural materials used in RHS cladding (Fadeev et al.,1980). The fuel used in an RHS is primarily 90Sr titanate(SrTiO3 in Russia and the United States, or Sr2TiO4 inthe United States only), which is a solid ceramic mate-rial. This has been selected for its strength, fire-resist-ance, and low water solubility.
The primary risk associated with RTGs is radiationexposure of humans, animals, plants, and the environ-ment from the 90Sr source (U.S. Congress, 1994). The ab-sorbed dose rate from physical proximity to an operat-ing RTG is <0.1 mGy/hr at a distance of 1 m from theRTG surface. Of greater concern is the resulting expo-sure if the inner shield of the RTG is breached allowing
the release of 90Sr into the environment. Natural disas-ters and most accidents associated with human activitiespresent little risk of such 90Sr releases to the environ-ment. Greater risk is associated with individuals inten-tionally damaging or dismantling an RTG and not rec-ognizing the hazards. In the event that radioisotope ma-terial is released, the dispersal area would not normallybe large and clean-up activities are not difficult. Resid-ual 90Sr material in the environment will remain in aninert form (strontium titanate ceramic) with minimal up-take by plants and minimal incorporation into the foodchain. Figure 2·8 shows a typical RTG construction.
2.7.1. RTGs in Russia
In Russia, RTGs are used in automatic meteorologicalstations in polar and uninhabited northern areas so thatmeteorological data can be continuously transmitted byradio. A network of RTGs, as stand-alone power supplysources, has also been established for navigation pur-poses. Increasing levels of maritime traffic have resultedin the creation of new high-latitude sea routes and an in-crease in the length of the navigation period in remoteand uninhabited areas. Some of the designs of RTGsused in Arctic Russia are shown in Figure 2·9. The char-acteristics of RTGs used in Russia, including 90Sr activi-ties, are given in Table 2·4.
In Russia, there have been two cases (in 1987 and1997) in which RTGs were lost due to emergency dump-ing at sea during their transport by helicopter using ex-ternal suspension devices (Noie et al., 1997). Both inci-dents occurred in the vicinity of Sakhalin Island. Thetwo RTGs have not yet been found. However, monitor-ing in the area in which the RTGs were lost, includingthat conducted during a joint Russian–Japanese–Koreancruise (Noie et al., 1997), did not detect increased levelsof 90Sr. In the Arctic region of Russia, there have been nolosses of RTGs during transport, although on at leastone occasion, RTGs on the Kola Peninsula have beensabotaged. In 2001, three RTGs were destroyed by peo-ple intending to steal parts. The open sources were lo-cated and removed and no radioactive contaminationwas detected (Fylkesmannen i Finnmark, 2001). Under
AMAP Assessment 2002: Radioactivity in the Arctic8
�������������������������������������������������
QQQQQQQQQQQQQQQQQQQQQQQQQQQQQQQQQQQQQQQQQQQQQQQQQ
¢¢¢¢¢¢¢¢¢¢¢¢¢¢¢¢¢¢¢¢¢¢¢¢¢¢¢¢¢¢¢¢¢¢¢¢¢¢¢¢¢¢¢¢¢¢¢¢¢
Pressure vessel housing lid
Thermoelectric convertermoduleRadiation shield(Bio-shield)
Fuel cladding
Radioisotope heat source
Thermal insulation
Housing
Finned cooling head
Figure 2·8. Schematic illustration of a typical RTG (Lamp, 1994).
Figure 2·9. Examples of different types of RTG used in Arctic Russia (Kodyukov et al., 1980). From left to right: ‘Reut-1’, ‘Reut-2’, ‘Beta-M’.
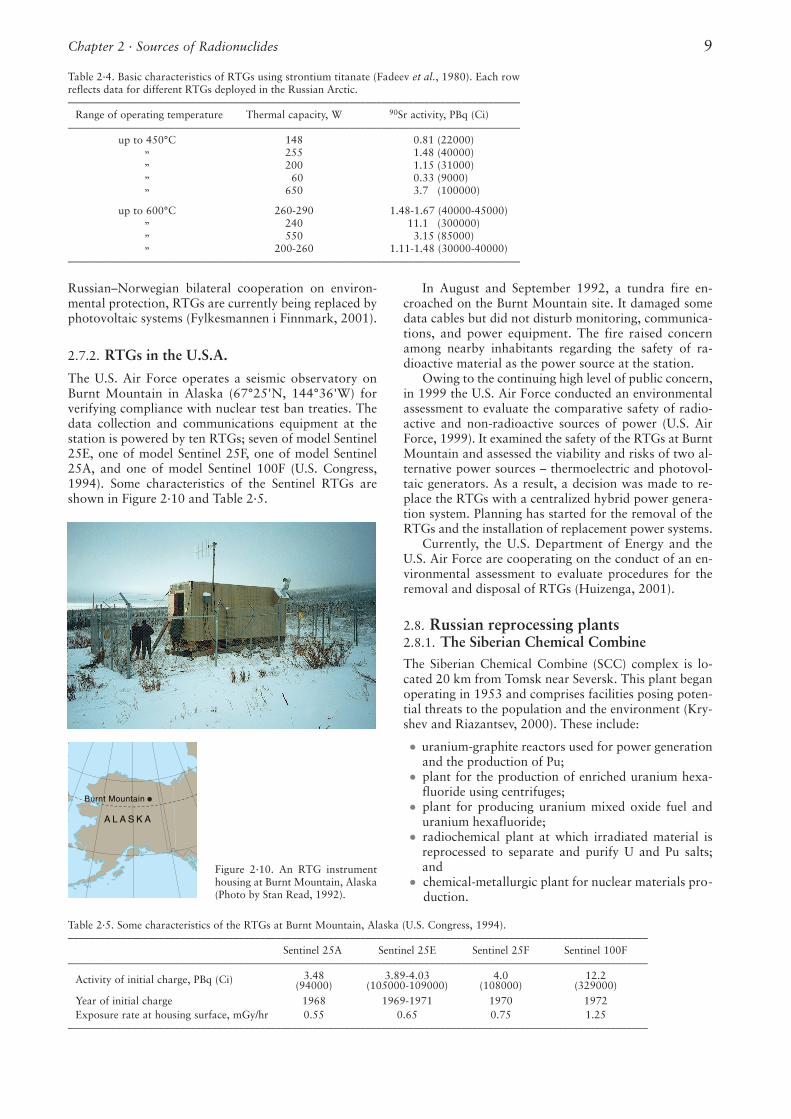
Russian–Norwegian bilateral cooperation on environ-mental protection, RTGs are currently being replaced byphotovoltaic systems (Fylkesmannen i Finnmark, 2001).
2.7.2. RTGs in the U.S.A.
The U.S. Air Force operates a seismic observatory onBurnt Mountain in Alaska (67°25'N, 144°36'W) forverifying compliance with nuclear test ban treaties. Thedata collection and communications equipment at thestation is powered by ten RTGs; seven of model Sentinel25E, one of model Sentinel 25F, one of model Sentinel25A, and one of model Sentinel 100F (U.S. Congress,1994). Some characteristics of the Sentinel RTGs areshown in Figure 2·10 and Table 2·5.
In August and September 1992, a tundra fire en-croached on the Burnt Mountain site. It damaged somedata cables but did not disturb monitoring, communica-tions, and power equipment. The fire raised concernamong nearby inhabitants regarding the safety of ra-dioactive material as the power source at the station.
Owing to the continuing high level of public concern,in 1999 the U.S. Air Force conducted an environmentalassessment to evaluate the comparative safety of radio-active and non-radioactive sources of power (U.S. AirForce, 1999). It examined the safety of the RTGs at BurntMountain and assessed the viability and risks of two al-ternative power sources – thermoelectric and photovol-taic generators. As a result, a decision was made to re-place the RTGs with a centralized hybrid power genera-tion system. Planning has started for the removal of theRTGs and the installation of replacement power systems.
Currently, the U.S. Department of Energy and theU.S. Air Force are cooperating on the conduct of an en-vironmental assessment to evaluate procedures for theremoval and disposal of RTGs (Huizenga, 2001).
2.8. Russian reprocessing plants2.8.1. The Siberian Chemical CombineThe Siberian Chemical Combine (SCC) complex is lo-cated 20 km from Tomsk near Seversk. This plant beganoperating in 1953 and comprises facilities posing poten-tial threats to the population and the environment (Kry-shev and Riazantsev, 2000). These include:
• uranium-graphite reactors used for power generationand the production of Pu;
• plant for the production of enriched uranium hexa-fluoride using centrifuges;
• plant for producing uranium mixed oxide fuel anduranium hexafluoride;
• radiochemical plant at which irradiated material isreprocessed to separate and purify U and Pu salts;and
• chemical-metallurgic plant for nuclear materials pro- duction.
Chapter 2 · Sources of Radionuclides 9
Table 2·4. Basic characteristics of RTGs using strontium titanate (Fadeev et al., 1980). Each row reflects data for different RTGs deployed in the Russian Arctic.–––––––––––––––––––––––––––––––––––––––––––––––––––––––––––––––––––––––––––––––––––––
Range of operating temperature Thermal capacity, W 90Sr activity, PBq (Ci)–––––––––––––––––––––––––––––––––––––––––––––––––––––––––––––––––––––––––––––––––––––
up to 450°C 148 0.81 (22000)’’ 255 1.48 (40000)’’ 200 1.15 (31000)’’ 60 0.33 (9000)’’ 650 3.7 (100000)
up to 600°C 260-290 1.48-1.67 (40000-45000)’’ 240 11.1 (300000)’’ 550 3.15 (85000)’’ 200-260 1.11-1.48 (30000-40000)
–––––––––––––––––––––––––––––––––––––––––––––––––––––––––––––––––––––––––––––––––––––
Table 2·5. Some characteristics of the RTGs at Burnt Mountain, Alaska (U.S. Congress, 1994).–––––––––––––––––––––––––––––––––––––––––––––––––––––––––––––––––––––––––––––––––––––––––––––––––––––––––––––
Sentinel 25A Sentinel 25E Sentinel 25F Sentinel 100F–––––––––––––––––––––––––––––––––––––––––––––––––––––––––––––––––––––––––––––––––––––––––––––––––––––––––––––
Activity of initial charge, PBq (Ci) 3.48 3.89-4.03 4.0 12.2(94000) (105000-109000) (108000) (329000)
Year of initial charge 1968 1969-1971 1970 1972Exposure rate at housing surface, mGy/hr 0.55 0.65 0.75 1.25
–––––––––––––––––––––––––––––––––––––––––––––––––––––––––––––––––––––––––––––––––––––––––––––––––––––––––––––
Burnt Mountain
A L A S K A
Figure 2·10. An RTG instrumenthousing at Burnt Mountain, Alaska(Photo by Stan Read, 1992).
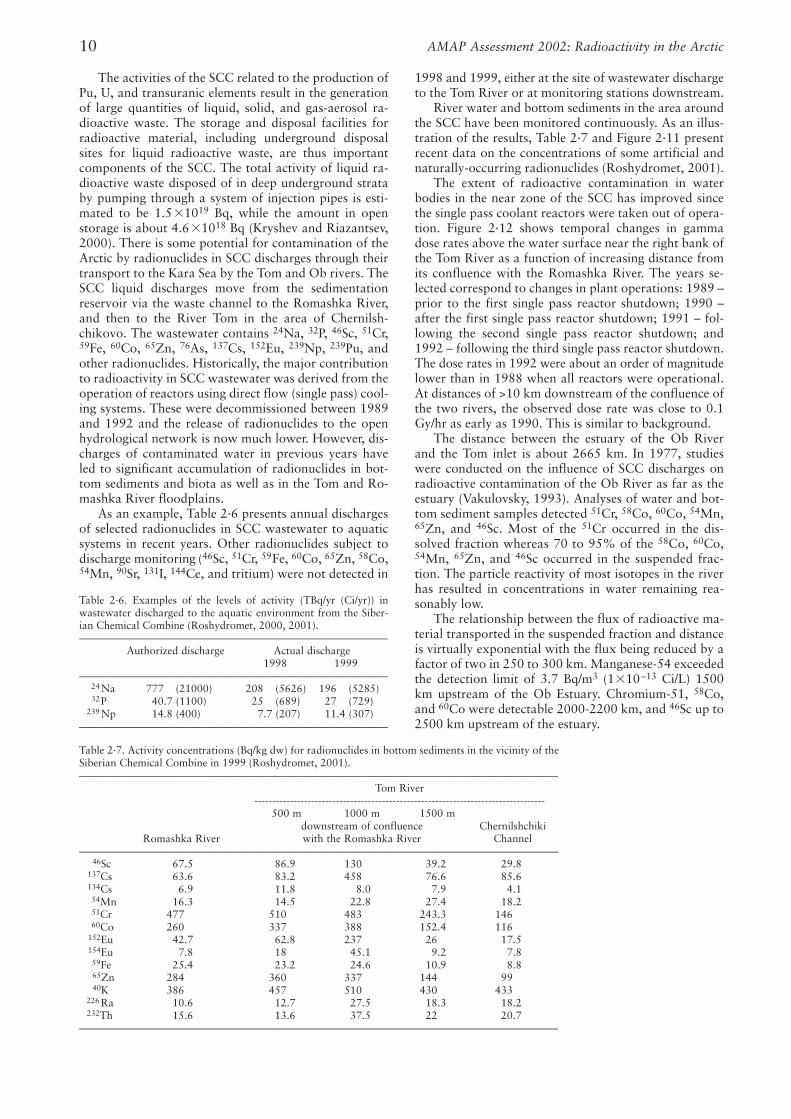
The activities of the SCC related to the production ofPu, U, and transuranic elements result in the generationof large quantities of liquid, solid, and gas-aerosol ra-dioactive waste. The storage and disposal facilities forradioactive material, including underground disposalsites for liquid radioactive waste, are thus importantcomponents of the SCC. The total activity of liquid ra-dioactive waste disposed of in deep underground strataby pumping through a system of injection pipes is esti-mated to be 1.5�1019 Bq, while the amount in openstorage is about 4.6�1018 Bq (Kryshev and Riazantsev,2000). There is some potential for contamination of theArctic by radionuclides in SCC discharges through theirtransport to the Kara Sea by the Tom and Ob rivers. TheSCC liquid discharges move from the sedimentationreservoir via the waste channel to the Romashka River,and then to the River Tom in the area of Chernilsh-chikovo. The wastewater contains 24Na, 32P, 46Sc, 51Cr,59Fe, 60Co, 65Zn, 76As, 137Cs, 152Eu, 239Np, 239Pu, andother radionuclides. Historically, the major contributionto radioactivity in SCC wastewater was derived from theoperation of reactors using direct flow (single pass) cool-ing systems. These were decommissioned between 1989and 1992 and the release of radionuclides to the openhydrological network is now much lower. However, dis-charges of contaminated water in previous years haveled to significant accumulation of radionuclides in bot-tom sediments and biota as well as in the Tom and Ro-mashka River floodplains.
As an example, Table 2·6 presents annual dischargesof selected radionuclides in SCC wastewater to aquaticsystems in recent years. Other radionuclides subject todischarge monitoring (46Sc, 51Cr, 59Fe, 60Co, 65Zn, 58Co,54Mn, 90Sr, 131I, 144Ce, and tritium) were not detected in
1998 and 1999, either at the site of wastewater dischargeto the Tom River or at monitoring stations downstream.
River water and bottom sediments in the area aroundthe SCC have been monitored continuously. As an illus-tration of the results, Table 2·7 and Figure 2·11 presentrecent data on the concentrations of some artificial andnaturally-occurring radionuclides (Roshydromet, 2001).
The extent of radioactive contamination in waterbodies in the near zone of the SCC has improved sincethe single pass coolant reactors were taken out of opera-tion. Figure 2·12 shows temporal changes in gammadose rates above the water surface near the right bank ofthe Tom River as a function of increasing distance fromits confluence with the Romashka River. The years se-lected correspond to changes in plant operations: 1989 –prior to the first single pass reactor shutdown; 1990 –after the first single pass reactor shutdown; 1991 – fol-lowing the second single pass reactor shutdown; and1992 – following the third single pass reactor shutdown.The dose rates in 1992 were about an order of magnitudelower than in 1988 when all reactors were operational.At distances of >10 km downstream of the confluence ofthe two rivers, the observed dose rate was close to 0.1Gy/hr as early as 1990. This is similar to background.
The distance between the estuary of the Ob Riverand the Tom inlet is about 2665 km. In 1977, studieswere conducted on the influence of SCC discharges onradioactive contamination of the Ob River as far as theestuary (Vakulovsky, 1993). Analyses of water and bot-tom sediment samples detected 51Cr, 58Co, 60Co, 54Mn,65Zn, and 46Sc. Most of the 51Cr occurred in the dis-solved fraction whereas 70 to 95% of the 58Co, 60Co,54Mn, 65Zn, and 46Sc occurred in the suspended frac-tion. The particle reactivity of most isotopes in the riverhas resulted in concentrations in water remaining rea-sonably low.
The relationship between the flux of radioactive ma-terial transported in the suspended fraction and distanceis virtually exponential with the flux being reduced by afactor of two in 250 to 300 km. Manganese-54 exceededthe detection limit of 3.7 Bq/m3 (1�10–13 Ci/L) 1500km upstream of the Ob Estuary. Chromium-51, 58Co,and 60Co were detectable 2000-2200 km, and 46Sc up to2500 km upstream of the estuary.
AMAP Assessment 2002: Radioactivity in the Arctic10
Table 2·6. Examples of the levels of activity (TBq/yr (Ci/yr)) inwastewater discharged to the aquatic environment from the Siber-ian Chemical Combine (Roshydromet, 2000, 2001).––––––––––––––––––––––––––––––––––––––––––––––––––––––––––
Authorized discharge Actual discharge1998 1999
––––––––––––––––––––––––––––––––––––––––––––––––––––––––––24 Na 777 (21000) 208 (5626) 196 (5285)32P 40.7 (1100) 25 (689) 27 (729)
239 Np 14.8 (400) 7.7 (207) 11.4 (307)––––––––––––––––––––––––––––––––––––––––––––––––––––––––––
Table 2·7. Activity concentrations (Bq/kg dw) for radionuclides in bottom sediments in the vicinity of theSiberian Chemical Combine in 1999 (Roshydromet, 2001).––––––––––––––––––––––––––––––––––––––––––––––––––––––––––––––––––––––––––––––––––––––––––
Tom River----------------------------------------------------------------------------------
500 m 1000 m 1500 mdownstream of confluence Chernilshchiki
Romashka River with the Romashka River Channel––––––––––––––––––––––––––––––––––––––––––––––––––––––––––––––––––––––––––––––––––––––––––
46Sc 67.5 86.9 130 39.2 29.8137Cs 63.6 83.2 458 76.6 85.6134Cs 6.9 11.8 8.0 7.9 4.154Mn 16.3 14.5 22.8 27.4 18.251Cr 477 510 483 243.3 14660Co 260 337 388 152.4 116
152Eu 42.7 62.8 237 26 17.5154Eu 7.8 18 45.1 9.2 7.859Fe 25.4 23.2 24.6 10.9 8.865Zn 284 360 337 144 9940K 386 457 510 430 433
226 Ra 10.6 12.7 27.5 18.3 18.2232Th 15.6 13.6 37.5 22 20.7
––––––––––––––––––––––––––––––––––––––––––––––––––––––––––––––––––––––––––––––––––––––––––
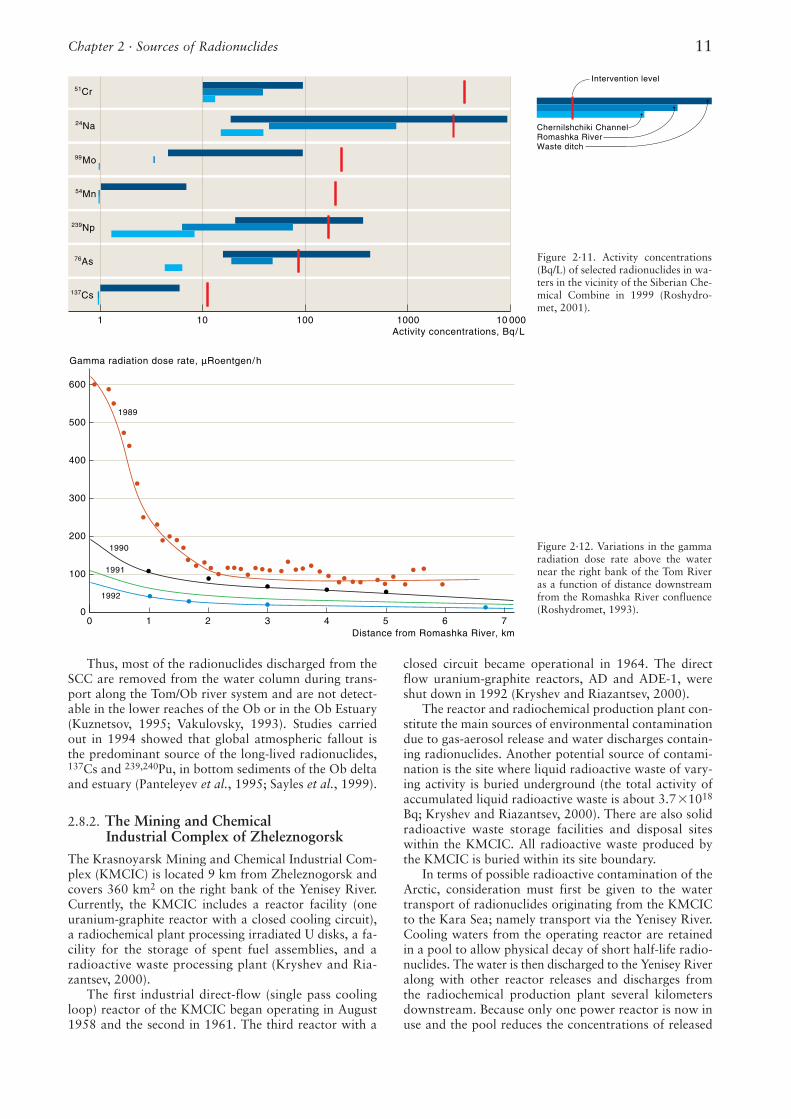
Thus, most of the radionuclides discharged from theSCC are removed from the water column during trans-port along the Tom/Ob river system and are not detect-able in the lower reaches of the Ob or in the Ob Estuary(Kuznetsov, 1995; Vakulovsky, 1993). Studies carriedout in 1994 showed that global atmospheric fallout isthe predominant source of the long-lived radionuclides,137Cs and 239,240Pu, in bottom sediments of the Ob deltaand estuary (Panteleyev et al., 1995; Sayles et al., 1999).
2.8.2. The Mining and Chemical Industrial Complex of Zheleznogorsk
The Krasnoyarsk Mining and Chemical Industrial Com-plex (KMCIC) is located 9 km from Zheleznogorsk andcovers 360 km2 on the right bank of the Yenisey River.Currently, the KMCIC includes a reactor facility (oneuranium-graphite reactor with a closed cooling circuit),a radiochemical plant processing irradiated U disks, a fa-cility for the storage of spent fuel assemblies, and aradioactive waste processing plant (Kryshev and Ria-zantsev, 2000).
The first industrial direct-flow (single pass coolingloop) reactor of the KMCIC began operating in August1958 and the second in 1961. The third reactor with a
closed circuit became operational in 1964. The directflow uranium-graphite reactors, AD and ADE-1, wereshut down in 1992 (Kryshev and Riazantsev, 2000).
The reactor and radiochemical production plant con-stitute the main sources of environmental contaminationdue to gas-aerosol release and water discharges contain-ing radionuclides. Another potential source of contami-nation is the site where liquid radioactive waste of vary-ing activity is buried underground (the total activity ofaccumulated liquid radioactive waste is about 3.7�1018
Bq; Kryshev and Riazantsev, 2000). There are also solidradioactive waste storage facilities and disposal siteswithin the KMCIC. All radioactive waste produced bythe KMCIC is buried within its site boundary.
In terms of possible radioactive contamination of theArctic, consideration must first be given to the watertransport of radionuclides originating from the KMCICto the Kara Sea; namely transport via the Yenisey River.Cooling waters from the operating reactor are retainedin a pool to allow physical decay of short half-life radio-nuclides. The water is then discharged to the Yenisey Riveralong with other reactor releases and discharges fromthe radiochemical production plant several kilometersdownstream. Because only one power reactor is now inuse and the pool reduces the concentrations of released
Chapter 2 · Sources of Radionuclides 11
10 0001000100101
51Cr
99Mo
54Mn
239Np
76As
137Cs
24Na
Activity concentrations, Bq/L
Intervention level
Chernilshchiki ChannelRomashka RiverWaste ditch
600
500
400
300
200
100
00 1 2 3 4 5 6 7
Gamma radiation dose rate, µRoentgen/h
1989
1990
1991
1992
Distance from Romashka River, km
Figure 2·11. Activity concentrations(Bq/L) of selected radionuclides in wa-ters in the vicinity of the Siberian Che-mical Combine in 1999 (Roshydro-met, 2001).
Figure 2·12. Variations in the gammaradiation dose rate above the waternear the right bank of the Tom Riveras a function of distance downstreamfrom the Romashka River confluence(Roshydromet, 1993).
nuclides, there has been a significant decrease in con-centrations in the Yenisey River as well as in aquaticplants and fish, especially for the short-lived isotopes.However, bottom sediments and the river floodplain arecontaminated with long-lived radionuclides such as60Co, 137Cs, and 152Eu as a result of previous releases,largely those from the two direct-flow reactors. Since1992, discharges of radioactivity in wastewater from theKMCIC have not led to additional contamination ofbottom sediments above previous levels (Roshydromet,1998). Table 2·8 presents data on the discharges of se-lected radionuclides in wastewater from the KMCIC in1998 to 1999.
There is continuous monitoring of environmentalcontamination in the vicinity of the KMCIC. Table 2·9provides, as an example, data on the concentrations ofselected artificial radionuclides in river water in the nearzone of the facility in 1999.
AMAP Assessment 2002: Radioactivity in the Arctic12
The concentrations of artificial radionuclides inthe Yenisey River in the vicinity of the KMCIC are cur-rently much lower than intervention levels defined inNRB-99 (Minzdrav, 1999). In addition to continuousmonitoring in the vicinity of the KMCIC, monitoringof radioactive contamination is regularly conductedthroughout the Yenisey River system (the KMCIC is2400 km from the Yenisey outlet to the Kara Sea). Onestudy measured river contamination between 1971 and1993. This included analyses of bottom sediments,which are good indicators of river ecosystem contam-ination. Table 2·10 presents some results of the bottomsediment survey of August 1973. This study showed theimpact of the KMCIC to be detectable to a distance ofabout 2000 km downstream of the plant and thus into
the Arctic. Activity concentrations in bottom sedimentsat the boundary of the far zone of the Krasnoyarsk con-tamination trace are a thousand times lower than thosein the near zone, but still exceed levels expected fromglobal fallout.
Data on the concentrations of radionuclides in riverwater in the far zone impacted by the KMCIC for differ-ent periods of observation are shown in Table 2·11. Be-yond the near zone the contamination of water de-creased markedly although trace amounts of artificialradionuclides were detected at considerable distances(>1300 km) from the discharge. Nevertheless, activityconcentrations in river water are several orders of mag-nitude lower than the intervention levels regulated bythe radiation safety norms.
Most of the discharged radionuclides (46Sc, 54Mn,58Co, 59Fe, 60Co, and 65Zn) are transported on sus-pended particles. Only 24Na and 51Cr are transportedmainly in dissolved form. As most of the 51Cr occurs indissolved form it can be transported over long distances(Table 2·11). These monitoring data, combined withwater discharge data for the Yenisey River, can be usedto estimate the fluxes of radionuclides from the near andfar zones of the KMCIC before the removal from serviceof the two single pass reactors. Estimated average fluxesfor 1985 to 1991 are shown in Table 2·12.
The results suggest that the fluxes of long-livedradionuclides from the far zone were modest. Thus,these discharges are only likely to have had a minor in-fluence on radioactive contamination of Arctic seas.
Table 2·8. Discharges (GBq (Ci)) of selected radionuclides in waste-water from the Mining and Chemical Industrial Complex of Zhelez-nogorsk (Roshydromet, 2001).–––––––––––––––––––––––––––––––––––––––––––––––––––––––––––––––––––––––––––––––
Authorized Actual dischargedischarge 1998 1999
–––––––––––––––––––––––––––––––––––––––––––––––––––––––––––––––––––––––––––––––
24Na 185000 (5000) 57600 (1560) 72600 (1960)32P 22200 (600) 7360 (199) 9840 (266)46Sc 370 (10) 30 (0.81) 41.4 (1.12)51Cr 14800 (400) 2580 (69.7) 3170 (85.6)54Mn 148 (4) 3.8 (0.104) 4.1 (0.11)60Co 374 (10.1) 50.5 (1.37) 50.9 (1.38)64Cu 5550 (150) 1120 (30.3) 1490 (40.2)65Zn 370 (10) 34 (0.92) 31.1 (0.84)76As 5550 (150) 738 (19.9) 1070 (28.9)90Sr 81.4(2.2) 3.6 (0.097) 41.1 (1.11)
131I 555 (15) 17.4 (0.47) 45.9 (1.24)134Cs 29.6(0.8) 0.56(0.015) 0.56(0.015)137Cs 114.7(3.1) 64.4 (1.74) 42.2 (1.14)152Eu 185 (5) 2.3 (0.062) 2.96(0.08)239Np 7400 (200) 4670 (126) 7100 (192)
–––––––––––––––––––––––––––––––––––––––––––––––––––––––––––––––––––––––––––––––
Table 2·9. Concentrations (Bq/L) of selected radionuclides in Yeni-sey River water in the vicinity of the Mining and Chemical Indus-trial Complex of Zheleznogorsk in 1999 (Roshydromet, 2001).–––––––––––––––––––––––––––––––––––––––––––––––––––––––––––––––––––––––––––––––
Monitoring point Intervention 250 m 10 km level
downstream downstream NRB-99of the outlet of the outlet (Minzdrav, 1999)
–––––––––––––––––––––––––––––––––––––––––––––––––––––––––––––––––––––––––––––––
24Na 10.7 2.2 –32P 0.73 0.14 5846Sc <0.01 <0.001 9351Cr 0.4 <0.1 370054Mn <0.001 <0.0002 20059Fe <0.01 <0.001 7758Co <0.01 <0.001 1960Co 0.005 0.0017 4165Zn <0.01 <0.001 3676As <0.2 <0.03 8790Sr 0.0078 0.0069 595Zr <0.001 <0.0002 15095Nb <0.001 <0.0002 240
103Ru <0.001 <0.0002 190106Ru <0.002 <0.0002 20131I <0.01 <0.002 6.3134Cs <0.0003 <0.00005 7.3137Cs <0.004 0.0018 11152Eu <0.001 <0.0002 99239Np <1.3 <0.2 170
–––––––––––––––––––––––––––––––––––––––––––––––––––––––––––––––––––––––––––––––
Table 2·10. Activity concentrations (kBq/m2) in bottom sedimentsof the Yenisey River in August 1973 (Vakulovsky et al., 1995).–––––––––––––––––––––––––––––––––––––––––––––––––––––––––––––––––––––––––––––––
Distance from discharge source6 km 250 km 800 km 1930 km
–––––––––––––––––––––––––––––––––––––––––––––––––––––––––––––––––––––––––––––––
46Sc 330 26 2.4 <251Cr 1550 <6 <6 <654Mn 220 48 2.3 <0.258Co 200 32 3.8 <0.760Co 440 65 4.8 <0.359Fe 400 15 <3 <365Zn 1470 260 23 <0.6134Cs 140 2 <0.4 <0.4137Cs 460 90 18 4.4144Ce 110 34 3.5 <3152Eu 220 36 2.2 <0.2154Eu 70 12 <0.4 <0.4
Total 5800 620 60 5–––––––––––––––––––––––––––––––––––––––––––––––––––––––––––––––––––––––––––––––
Of the long-lived radionuclides, only 137Cs can reach theKara Sea in significant quantities. The amount of 137Csentering the Kara Sea in the Yenisey River outflow is es-timated to have averaged between 0.8 and 2.8 TBq/yrover the period 1958 to 1993. This includes 137Cs fromboth global fallout and discharges from the KMCIC andshould be considered an upper limit. Thus, routine dis-charges from the KMCIC over this period could have re-sulted in an input of 30 to 100 TBq of 137Cs to the KaraSea (Vakulovsky et al., 1995). This is less than the 137Csinput from atmospheric fallout (about 1.4 PBq for theKara Sea) and comparable with the input to the KaraSea from Sellafield, about 150 TBq (NRPA, 1993).
2.9. Nuclear detonationsThe total number of nuclear detonations, including thefirst nuclear test in 1945, has been 2419, with an aggre-gated yield of 530 Mt of TNT equivalent (UNSCEAR,
Chapter 2 · Sources of Radionuclides 13
2000). The vast majority (1876) of these detonationswere underground, but with a comparatively low aggre-gate yield of 90 Mt. In contrast, the 543 atmosphericdetonations contributed 440 Mt or 83% of the aggre-gate yield (UNSCEAR, 2000). The calculations of yieldare based on certain assumptions about partitioning be-tween fission and fusion yields in individual tests. Thereliability of these assumptions will determine uncertain-ties in the estimates of yield. The largest 25 atmosphericnuclear tests, those exceeding 4 Mt, account for nearly66% of the total explosive yield and about 55% of theestimated total (fission plus fusion) yield.
The largest atmospheric test was an air detonationwith a yield of 50 Mt conducted by the former SovietUnion at the Novaya Zemlya test site on 30 October1961. The largest underground nuclear tests in the Arc-tic were a 1.5 to 10 Mt test conducted by the former So-viet Union at the Novaya Zemlya test site on 27 October1973, and a test of approx. 5 Mt conducted by the UnitedStates at Amchitka, Alaska, on 6 November 1971. In ad-dition, the former Soviet Union conducted a number ofcrater detonations where nuclear devices were detonatedat shallow depths for non-military purposes.
Recently, there has been new information on localcontamination resulting from underground nuclear ex-plosions for non-military purposes carried out by theformer Soviet Union. Research has shown that these ex-plosions led to considerable contamination of localizedareas. The sites ‘Kraton-3’ and ‘Crystal’ in the Republicof Sakha, where such tests were conducted, containresidual radioactive contamination despite earlier clean-up efforts. Concentrations of Pu in lichen in the vicinityof the Kraton-3 and Crystal sites are relatively high. Theaverage plutonium concentration in lichen in the mostcontaminated area surrounding the Kraton-3 site is 2.1
Table 2·11. Activity concentrations in Yenisey River water (Vakulovsky et al., 1995).––––––––––––––––––––––––––––––––––––––––––––––––––––––––––––––––––––––––––––––––––––––––––––––––––––––––––––––––––
Intervention Distance from Activity concentration, mBq/Llevel, discharge source, average
mBq/L km 1985-1991 1992 1993–––––––––––––––––––––––––––––––––––––––––––––––––––––––––––––––––––––––––––––––––––
46Sc 93000 250 11 <0.7 <0.7850 5 <0.7 <0.7
1360 5 <0.7 <0.751Cr 3700000 250 1900 700 <14
850 1100 150 <141360 700 160 <14
54Mn 200000 250 8 <0.7 <0.7850 3 <0.7 <0.7
1360 3 <0.7 <0.758Co 19000 250 26 4 <1.5
850 12 <1.5 <1.51360 7 10 <1.5
60Co 41000 250 7 <1.5 <1.5850 4 8 <1.5
1360 4 <1.5 <1.559Fe 77000 250 42 <3 <3
850 7 <3 <31360 8 <3 <3
65Zn 65000 250 23 <2 <2850 <2 <2 <2
1360 <2 <2 <2137Cs 11000 250 6 2 1
850 5 6 21360 5 2 2
–––––––––––––––––––––––––––––––––––––––––––––––––––––––––––––––––––––––––––––––––––
Table 2·12. Estimated average fluxes (TBq/yr) of radionuclides inthe Yenisey River for 1985 to 1991 (Vakulovsky et al., 1995).––––––––––––––––––––––––––––––––––––––––––––––––––––––––––
Near zone Far zone(15 km (1360 km
from the discharge) from the discharge)––––––––––––––––––––––––––––––––––––––––––––––––––––––––––
32P 1800 �1000 –46Sc 9 �4 1.7�1.051Cr 2300 �1200 250 � 25054Mn 9 �5 1.0�0.758Co 40 �20 2.5�1.460Co 5 �1 1.4�0.859Fe 20 �10 2.8�1.065Zn 17 �8 –90Sr 1.6�0.7 1.5�0.6
137Cs 6 �3 1.8�1.0––––––––––––––––––––––––––––––––––––––––––––––––––––––––––
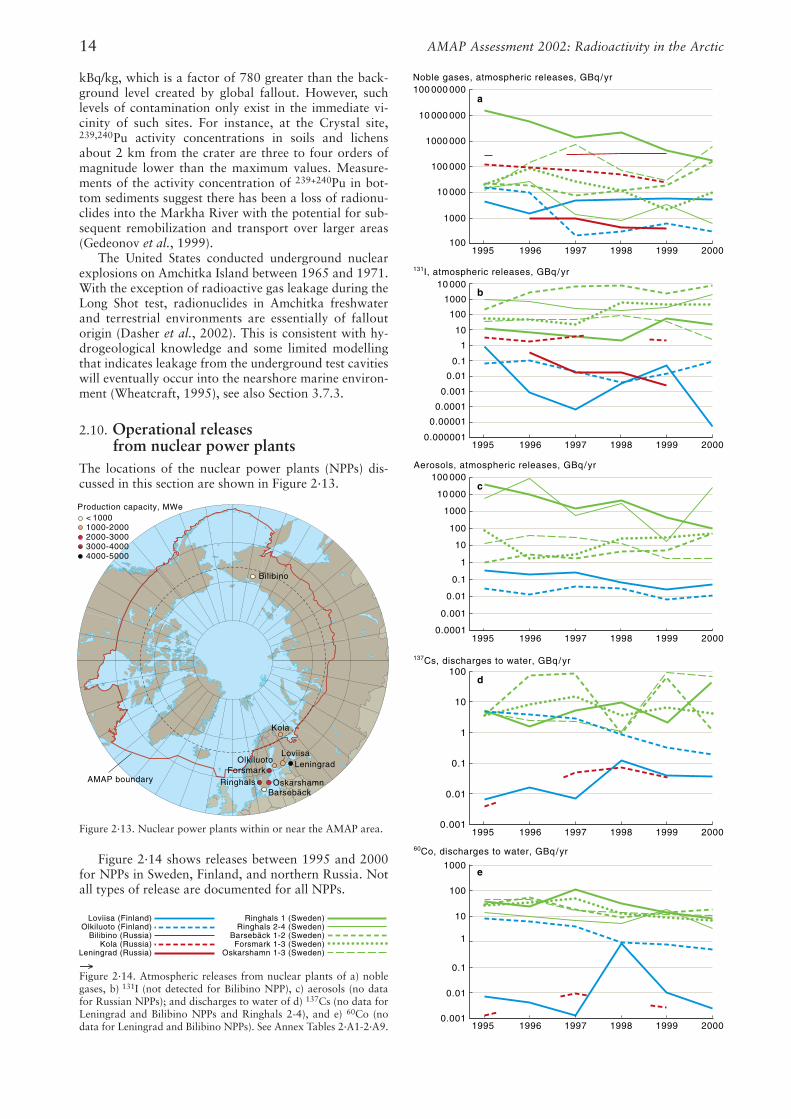
kBq/kg, which is a factor of 780 greater than the back-ground level created by global fallout. However, suchlevels of contamination only exist in the immediate vi-cinity of such sites. For instance, at the Crystal site,239,240Pu activity concentrations in soils and lichensabout 2 km from the crater are three to four orders ofmagnitude lower than the maximum values. Measure-ments of the activity concentration of 239+240Pu in bot-tom sediments suggest there has been a loss of radionu-clides into the Markha River with the potential for sub-sequent remobilization and transport over larger areas(Gedeonov et al., 1999).
The United States conducted underground nuclearexplosions on Amchitka Island between 1965 and 1971.With the exception of radioactive gas leakage during theLong Shot test, radionuclides in Amchitka freshwaterand terrestrial environments are essentially of falloutorigin (Dasher et al., 2002). This is consistent with hy-drogeological knowledge and some limited modellingthat indicates leakage from the underground test cavitieswill eventually occur into the nearshore marine environ-ment (Wheatcraft, 1995), see also Section 3.7.3.
2.10. Operational releases from nuclear power plants
The locations of the nuclear power plants (NPPs) dis-cussed in this section are shown in Figure 2·13.
Figure 2·14 shows releases between 1995 and 2000for NPPs in Sweden, Finland, and northern Russia. Notall types of release are documented for all NPPs.
AMAP Assessment 2002: Radioactivity in the Arctic14
BarsebäckOskarshamnRinghals
Forsmark
LoviisaOlkiluoto
Kola
Leningrad
Bilibino
AMAP boundary
< 10001000-20002000-30003000-40004000-5000
Production capacity, MWe
100 000 000Noble gases, atmospheric releases, GBq/yr
10 000 000
1000 000
100 000
10 000
1000
1001995 1996 1997 1998 1999 2000
1995 1996 1997 1998 1999 2000
1995 1996 1997 1998 1999 2000
1995 1996 1997 1998 1999 2000
1995 1996 1997 1998 1999 2000
10 000
131I, atmospheric releases, GBq/yr
1000
100
10
1
0.1
0.01
0.001
0.0001
0.00001
0.000001
100 000Aerosols, atmospheric releases, GBq/yr
1000
10 000
100
10
1
0.1
0.01
0.001
0.0001
137Cs, discharges to water, GBq/yr100
10
1
0.1
0.01
0.001
1000
100
10
1
0.1
0.01
0.001
60Co, discharges to water, GBq/yr
a
b
c
d
e
→Figure 2·14. Atmospheric releases from nuclear plants of a) noblegases, b) 131I (not detected for Bilibino NPP), c) aerosols (no datafor Russian NPPs); and discharges to water of d) 137Cs (no data forLeningrad and Bilibino NPPs and Ringhals 2-4), and e) 60Co (nodata for Leningrad and Bilibino NPPs). See Annex Tables 2·A1-2·A9.
Figure 2·13. Nuclear power plants within or near the AMAP area.
Loviisa (Finland)Olkiluoto (Finland)
Bilibino (Russia)Kola (Russia)
Leningrad (Russia)
Ringhals 1 (Sweden)Ringhals 2-4 (Sweden)
Barsebäck 1-2 (Sweden)Forsmark 1-3 (Sweden)
Oskarshamn 1-3 (Sweden)
2.10.1. Finnish NPPs
Finland has two NPPs both situated on the Baltic Seacoast: the Loviisa NPP on the Gulf of Finland and theOlkiluoto NPP on the Gulf of Bothnia. Two reactorunits are in operation at both sites (see Table 2·13).
Annex Table A2·2 tabulates the annual radionuclidereleases (GBq/yr) from each of the two NPPs for 1995 to2000 for the six most abundant radionuclides in liquideffluent that also contribute most to individual dose.Corresponding releases in gaseous effluents are pre-sented in Annex Table A2·1.
The principal noble gas release from Loviisa has been41Ar and, for Olkiluoto, xenon isotopes. Among aero-sols, the main releases from Loviisa have been 60Co,110mAg, and 124Sb, and from Olkiluoto 54Mn, 58Co, and60Co. The annual release limits for the two NPPs areshown in Table 2·14.
2.10.2. Russian NPPs
There are two NPPs in the Russian Arctic; at Kola andBilibino. Of the Russian NPPs outside the Arctic, the Le-ningrad NPP is of interest within the context of AMAPassessments. The atmospheric releases of radionuclidesfrom these three plants and liquid effluents from the
Kola and Bilibino NPPs in 1994 to 1995 were reviewedduring the first AMAP assessment. Annexes A2·3 andA2·4 show atmospheric releases and liquid discharges ofradionuclides from the Kola NPP in recent years.
Data on atmospheric releases of radionuclides fromthe Bilibino NPP in recent years are presented in AnnexA2·5. The 60Co discharge from this NPP in 1999 was0.03% of the permitted discharge and for other man-made radionuclides discharges were below detection lim-its (Roshydromet, 2001). Data for the Leningrad NPPatmospheric releases are given in Annex Table A2·6.
2.10.3. Swedish NPPs
Sweden has four NPPs: two on the east coast (Forsmarkand Oskarshamn on the Baltic Sea) and two on the westcoast (Ringhals on the Kattegatt and Barsebäck on theÖresund), as specified in Table 2·15.
No specific discharge limits have been formally de-fined by the Swedish Radiation Protection Authority.Limits are currently imposed through restrictions ondoses to members of critical groups (see Chapter 4).Thus, for each nuclear facility and for each nuclide re-leased, site-specific release-to-dose conversion ratios havebeen calculated. These values pertain to doses to individ-uals in hypothetical critical groups and take into consid-eration local dispersion conditions and moderately con-servative assumptions on dietary conditions and the con-tribution of locally-produced foodstuffs.
Measurements of actual releases of 129I were not re-quested under previous regulations. Likewise, emissionsof 14C and 3H were not routinely measured. Emissionsof 14C were estimated on the basis of international expe-rience as 0.2 TBq/GWyr for pressurized-water reactorsand 0.6 TBq/GWyr for boiling-water reactors. How-ever, new regulations require all nuclides to be meas-ured. Releases are given in Annex Tables A2·7 to A2·9.
Chapter 2 · Sources of Radionuclides 15
Table 2·13. Details of Finnish nuclear power plants. PWR: pressurized water reactor; BWR: boiling water reactor.––––––––––––––––––––––––––––––––––––––––––––––––––––––––––––––––––––––––––––––––––––––––––––––––––––––
Installed capacity, CommercialUnit (company) Reactor type/model gross/net, MW(e) start-up date
––––––––––––––––––––––––––––––––––––––––––––––––––––––––––––––––––––––––––––––––––––––––––––––––––––––Loviisa 1 (Fortum Power and Heat Oy) PWR/VVER-440/V213 510/488 1977Loviisa 2 (Fortum Power and Heat Oy) PWR/VVER-440/V213 510/488 1981Olkiluoto 1 (Teollisuuden Voima Oy, TVO) BWR 870/840 1979Olkiluoto 2 (Teollisuuden Voima Oy, TVO) BWR 870/840 1982
––––––––––––––––––––––––––––––––––––––––––––––––––––––––––––––––––––––––––––––––––––––––––––––––––––––
Table 2·15. Details of Swedish nuclear power plants. BWR: boiling water reactor; PWR: pressurized-water reactor.––––––––––––––––––––––––––––––––––––––––––––––––––––––––––––––––––––––––––––––––––––––
Net electric output, CommercialSite Discharges to Reactor type MW(e) start up
––––––––––––––––––––––––––––––––––––––––––––––––––––––––––––––––––––––––––––––––––––––Barsebäck 1 Öresund BWR, ABB-Atom 600 1975*
Barsebäck 2 Öresund BWR, ABB-Atom 600 1977Forsmark 1 Baltic Sea BWR, ABB-Atom 968 1980Forsmark 2 Baltic Sea BWR, ABB-Atom 969 1981Forsmark 3 Baltic Sea BWR, ABB-Atom 1158 1985Oskarshamn 1 Baltic Sea BWR, ABB-Atom 445 1972Oskarshamn 2 Baltic Sea BWR, ABB-Atom 605 1975Oskarshamn 3 Baltic Sea BWR, ABB-Atom 1160 1985Ringhals 1 Kattegat BWR, ABB-Atom 830 1976Ringhals 2 Kattegat PWR, Westinghouse 870 1975Ringhals 3 Kattegat PWR, Westinghouse 915 1981Ringhals 4 Kattegat PWR, Westinghouse 915 1983
–––––––––––––––––––––––––––––––––––––––––––––––––––––––––––––––––––––––––––––––––––––– *ceased to generate electricity 1 December 1999 when the reactor was shut down.
Table 2·14. Annual release limits (GBq) for the Loviisa and Olkiluotonuclear power plants (AMAP Data Centre; Tossavainen, 2002).––––––––––––––––––––––––––––––––––––––––––––––––––––––––––
Liquid effluents Gaseous effluents----------------------------------------------------------------
Other Noble 3H nuclides gases* Iodines*
––––––––––––––––––––––––––––––––––––––––––––––––––––––––––Loviisa 150000 890 22000000 220Olkiluoto 18000 300 18000000 110
––––––––––––––––––––––––––––––––––––––––––––––––––––––––––* in 131I equivalents
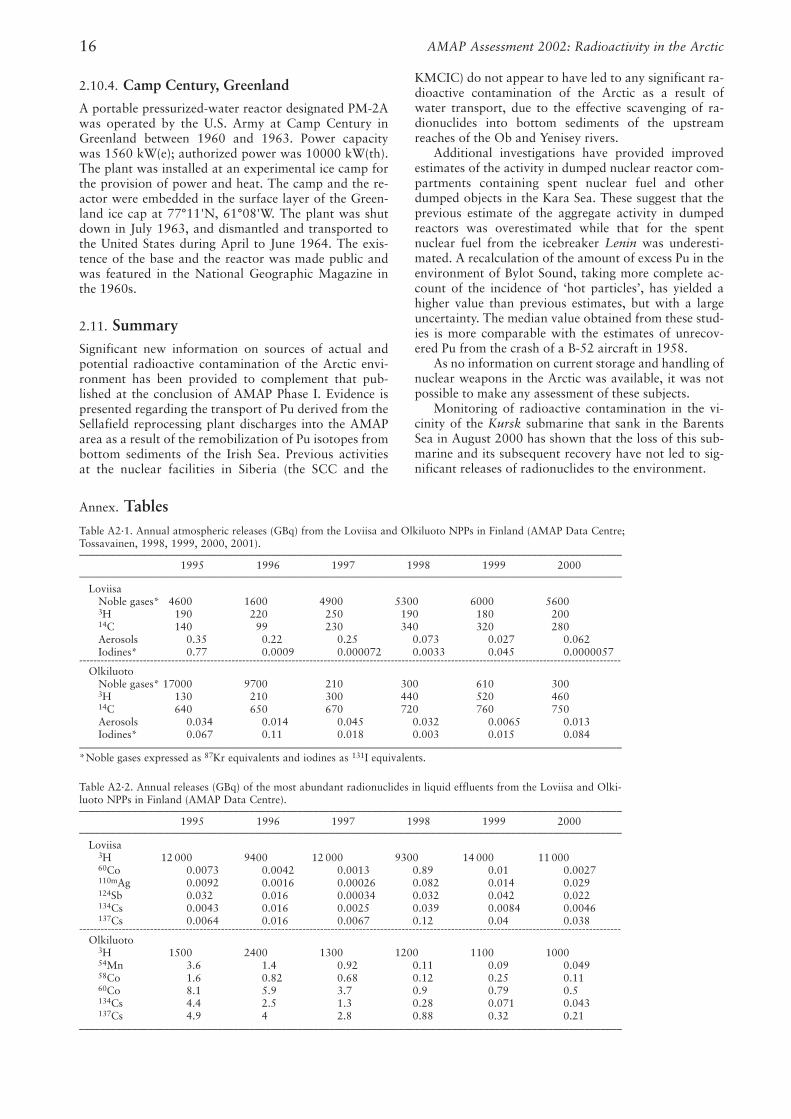
2.10.4. Camp Century, Greenland
A portable pressurized-water reactor designated PM-2Awas operated by the U.S. Army at Camp Century inGreenland between 1960 and 1963. Power capacitywas 1560 kW(e); authorized power was 10000 kW(th).The plant was installed at an experimental ice camp forthe provision of power and heat. The camp and the re-actor were embedded in the surface layer of the Green-land ice cap at 77°11'N, 61°08'W. The plant was shutdown in July 1963, and dismantled and transported tothe United States during April to June 1964. The exis-tence of the base and the reactor was made public andwas featured in the National Geographic Magazine inthe 1960s.
2.11. SummarySignificant new information on sources of actual andpotential radioactive contamination of the Arctic envi-ronment has been provided to complement that pub-lished at the conclusion of AMAP Phase I. Evidence ispresented regarding the transport of Pu derived from theSellafield reprocessing plant discharges into the AMAParea as a result of the remobilization of Pu isotopes frombottom sediments of the Irish Sea. Previous activitiesat the nuclear facilities in Siberia (the SCC and the
KMCIC) do not appear to have led to any significant ra-dioactive contamination of the Arctic as a result ofwater transport, due to the effective scavenging of ra-dionuclides into bottom sediments of the upstreamreaches of the Ob and Yenisey rivers.
Additional investigations have provided improvedestimates of the activity in dumped nuclear reactor com-partments containing spent nuclear fuel and otherdumped objects in the Kara Sea. These suggest that theprevious estimate of the aggregate activity in dumpedreactors was overestimated while that for the spentnuclear fuel from the icebreaker Lenin was underesti-mated. A recalculation of the amount of excess Pu in theenvironment of Bylot Sound, taking more complete ac-count of the incidence of ‘hot particles’, has yielded ahigher value than previous estimates, but with a largeuncertainty. The median value obtained from these stud-ies is more comparable with the estimates of unrecov-ered Pu from the crash of a B-52 aircraft in 1958.
As no information on current storage and handling ofnuclear weapons in the Arctic was available, it was notpossible to make any assessment of these subjects.
Monitoring of radioactive contamination in the vi-cinity of the Kursk submarine that sank in the BarentsSea in August 2000 has shown that the loss of this sub-marine and its subsequent recovery have not led to sig-nificant releases of radionuclides to the environment.
AMAP Assessment 2002: Radioactivity in the Arctic16
Annex. TablesTable A2·1. Annual atmospheric releases (GBq) from the Loviisa and Olkiluoto NPPs in Finland (AMAP Data Centre; Tossavainen, 1998, 1999, 2000, 2001). ––––––––––––––––––––––––––––––––––––––––––––––––––––––––––––––––––––––––––––––––––––––––––––––––––––––
1995 1996 1997 1998 1999 2000––––––––––––––––––––––––––––––––––––––––––––––––––––––––––––––––––––––––––––––––––––––––––––––––––––––
LoviisaNoble gases* 4600 1600 4900 5300 6000 56003H 190 220 250 190 180 20014C 140 99 230 340 320 280Aerosols 0.35 0.22 0.25 0.073 0.027 0.062Iodines* 0.77 0.0009 0.000072 0.0033 0.045 0.0000057
---------------------------------------------------------------------------------------------------------------------------------------------------------Olkiluoto
Noble gases* 17000 9700 210 300 610 3003H 130 210 300 440 520 46014C 640 650 670 720 760 750Aerosols 0.034 0.014 0.045 0.032 0.0065 0.013Iodines* 0.067 0.11 0.018 0.003 0.015 0.084
–––––––––––––––––––––––––––––––––––––––––––––––––––––––––––––––––––––––––––––––––––––––––––––––––––––– *Noble gases expressed as 87Kr equivalents and iodines as 131I equivalents.
Table A2·2. Annual releases (GBq) of the most abundant radionuclides in liquid effluents from the Loviisa and Olki-luoto NPPs in Finland (AMAP Data Centre).––––––––––––––––––––––––––––––––––––––––––––––––––––––––––––––––––––––––––––––––––––––––––––––––––––––
1995 1996 1997 1998 1999 2000––––––––––––––––––––––––––––––––––––––––––––––––––––––––––––––––––––––––––––––––––––––––––––––––––––––
Loviisa3H 12 000 9400 12 000 9300 14 000 11 00060Co 0.0073 0.0042 0.0013 0.89 0.01 0.0027110mAg 0.0092 0.0016 0.00026 0.082 0.014 0.029124Sb 0.032 0.016 0.00034 0.032 0.042 0.022134Cs 0.0043 0.016 0.0025 0.039 0.0084 0.0046137Cs 0.0064 0.016 0.0067 0.12 0.04 0.038
--------------------------------------------------------------------------------------------------------------------------------------------------------- Olkiluoto
3H 1500 2400 1300 1200 1100 100054Mn 3.6 1.4 0.92 0.11 0.09 0.04958Co 1.6 0.82 0.68 0.12 0.25 0.1160Co 8.1 5.9 3.7 0.9 0.79 0.5134Cs 4.4 2.5 1.3 0.28 0.071 0.043137Cs 4.9 4 2.8 0.88 0.32 0.21
––––––––––––––––––––––––––––––––––––––––––––––––––––––––––––––––––––––––––––––––––––––––––––––––––––––
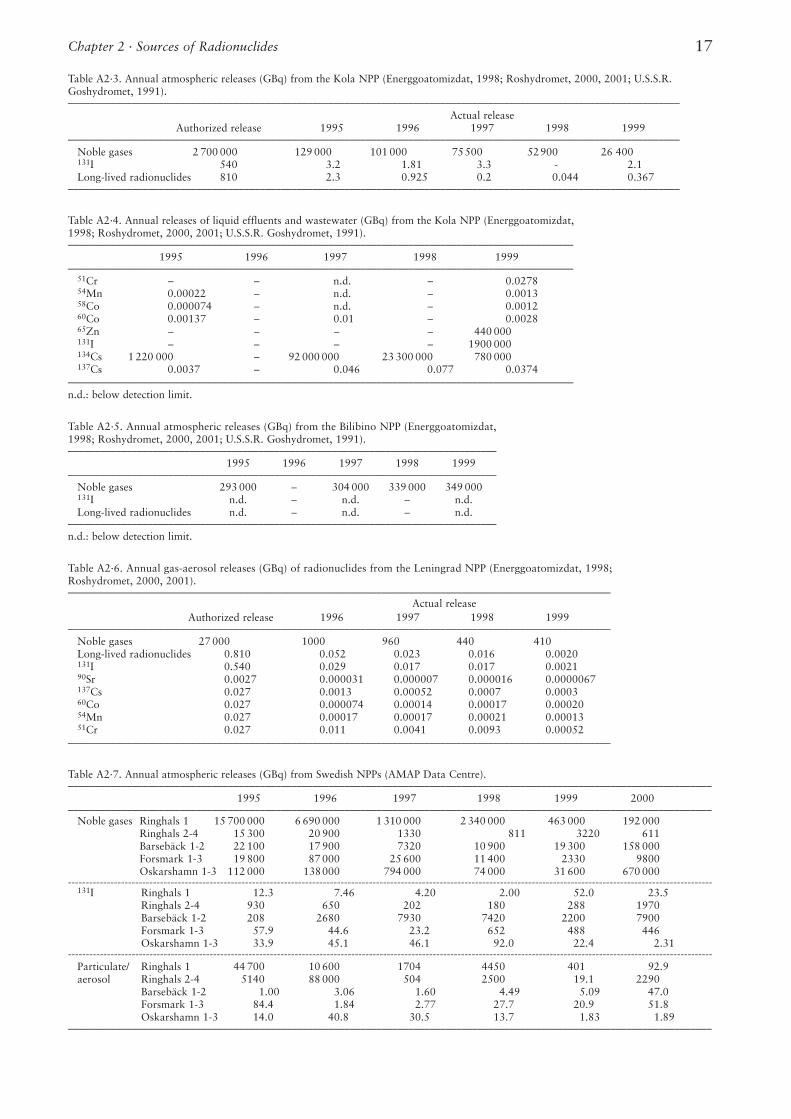
Table A2·3. Annual atmospheric releases (GBq) from the Kola NPP (Energgoatomizdat, 1998; Roshydromet, 2000, 2001; U.S.S.R.Goshydromet, 1991).–––––––––––––––––––––––––––––––––––––––––––––––––––––––––––––––––––––––––––––––––––––––––––––––––––––––––––––––––––
Actual releaseAuthorized release 1995 1996 1997 1998 1999
–––––––––––––––––––––––––––––––––––––––––––––––––––––––––––––––––––––––––––––––––––––––––––––––––––––––––––––––––––Noble gases 2 700 000 129 000 101 000 75500 52900 26 400131I 540 3.2 1.81 3.3 - 2.1Long-lived radionuclides 810 2.3 0.925 0.2 0.044 0.367
–––––––––––––––––––––––––––––––––––––––––––––––––––––––––––––––––––––––––––––––––––––––––––––––––––––––––––––––––––
Table A2·4. Annual releases of liquid effluents and wastewater (GBq) from the Kola NPP (Energgoatomizdat,1998; Roshydromet, 2000, 2001; U.S.S.R. Goshydromet, 1991).–––––––––––––––––––––––––––––––––––––––––––––––––––––––––––––––––––––––––––––––––––––––––––––––
1995 1996 1997 1998 1999–––––––––––––––––––––––––––––––––––––––––––––––––––––––––––––––––––––––––––––––––––––––––––––––
51Cr – – n.d. – 0.027854Mn 0.00022 – n.d. – 0.001358Co 0.000074 – n.d. – 0.001260Co 0.00137 – 0.01 – 0.002865Zn – – – – 440 000131I – – – – 1900 000134Cs 1 220 000 – 92 000 000 23 300 000 780 000137Cs 0.0037 – 0.046 0.077 0.0374
––––––––––––––––––––––––––––––––––––––––––––––––––––––––––––––––––––––––––––––––––––––––––––––– n.d.: below detection limit.
Table A2·5. Annual atmospheric releases (GBq) from the Bilibino NPP (Energgoatomizdat, 1998; Roshydromet, 2000, 2001; U.S.S.R. Goshydromet, 1991).–––––––––––––––––––––––––––––––––––––––––––––––––––––––––––––––––––––––––––––––––
1995 1996 1997 1998 1999–––––––––––––––––––––––––––––––––––––––––––––––––––––––––––––––––––––––––––––––––
Noble gases 293 000 – 304 000 339 000 349 000131I n.d. – n.d. – n.d.Long-lived radionuclides n.d. – n.d. – n.d.
–––––––––––––––––––––––––––––––––––––––––––––––––––––––––––––––––––––––––––––––––n.d.: below detection limit.
Table A2·6. Annual gas-aerosol releases (GBq) of radionuclides from the Leningrad NPP (Energgoatomizdat, 1998; Roshydromet, 2000, 2001).––––––––––––––––––––––––––––––––––––––––––––––––––––––––––––––––––––––––––––––––––––––––––––––––––––––
Actual releaseAuthorized release 1996 1997 1998 1999
––––––––––––––––––––––––––––––––––––––––––––––––––––––––––––––––––––––––––––––––––––––––––––––––––––––Noble gases 27 000 1000 960 440 410Long-lived radionuclides 0.810 0.052 0.023 0.016 0.0020131I 0.540 0.029 0.017 0.017 0.002190Sr 0.0027 0.000031 0.000007 0.000016 0.0000067137Cs 0.027 0.0013 0.00052 0.0007 0.000360Co 0.027 0.000074 0.00014 0.00017 0.0002054Mn 0.027 0.00017 0.00017 0.00021 0.0001351Cr 0.027 0.011 0.0041 0.0093 0.00052
––––––––––––––––––––––––––––––––––––––––––––––––––––––––––––––––––––––––––––––––––––––––––––––––––––––
Table A2·7. Annual atmospheric releases (GBq) from Swedish NPPs (AMAP Data Centre).–––––––––––––––––––––––––––––––––––––––––––––––––––––––––––––––––––––––––––––––––––––––––––––––––––––––––––––––––––––––––
1995 1996 1997 1998 1999 2000–––––––––––––––––––––––––––––––––––––––––––––––––––––––––––––––––––––––––––––––––––––––––––––––––––––––––––––––––––––––––
Noble gases Ringhals 1 15 700 000 6 690 000 1 310 000 2 340 000 463 000 192 000Ringhals 2-4 15 300 20 900 1330 000.81100000000.3220 611Barsebäck 1-2 22 100 17 900 7320 10 900 19 300 158 000Forsmark 1-3 19 800 87 000 25 600 11 400 2330 9800Oskarshamn 1-3 112 000 138000 794 000 74 000 31 600 670 000
--------------------------------------------------------------------------------------------------------------------------------------------------------------------------------------131I Ringhals 1 12.3 7.46 4.20 2.00 52.0 23.5
Ringhals 2-4 930 650 202 180 288 1970Barsebäck 1-2 208 2680 7930. 7420 2200 7900Forsmark 1-3 57.9 44.6 23.2 652 488 446Oskarshamn 1-3 33.9 45.1 46.1 92.0 22.4 2.31
--------------------------------------------------------------------------------------------------------------------------------------------------------------------------------------Particulate/ Ringhals 1 44 700 10 600 1704 4450 401 92.9aerosol Ringhals 2-4 5140 88 000 504 2500 19.1 2290
Barsebäck 1-2 1.00 3.06 1.60 4.49 5.09 47.0Forsmark 1-3 84.4 1.84 2.77 27.7 20.9 51.8Oskarshamn 1-3 14.0 40.8 30.5 13.7 1.83 1.89
–––––––––––––––––––––––––––––––––––––––––––––––––––––––––––––––––––––––––––––––––––––––––––––––––––––––––––––––––––––––––
Chapter 2 · Sources of Radionuclides 17
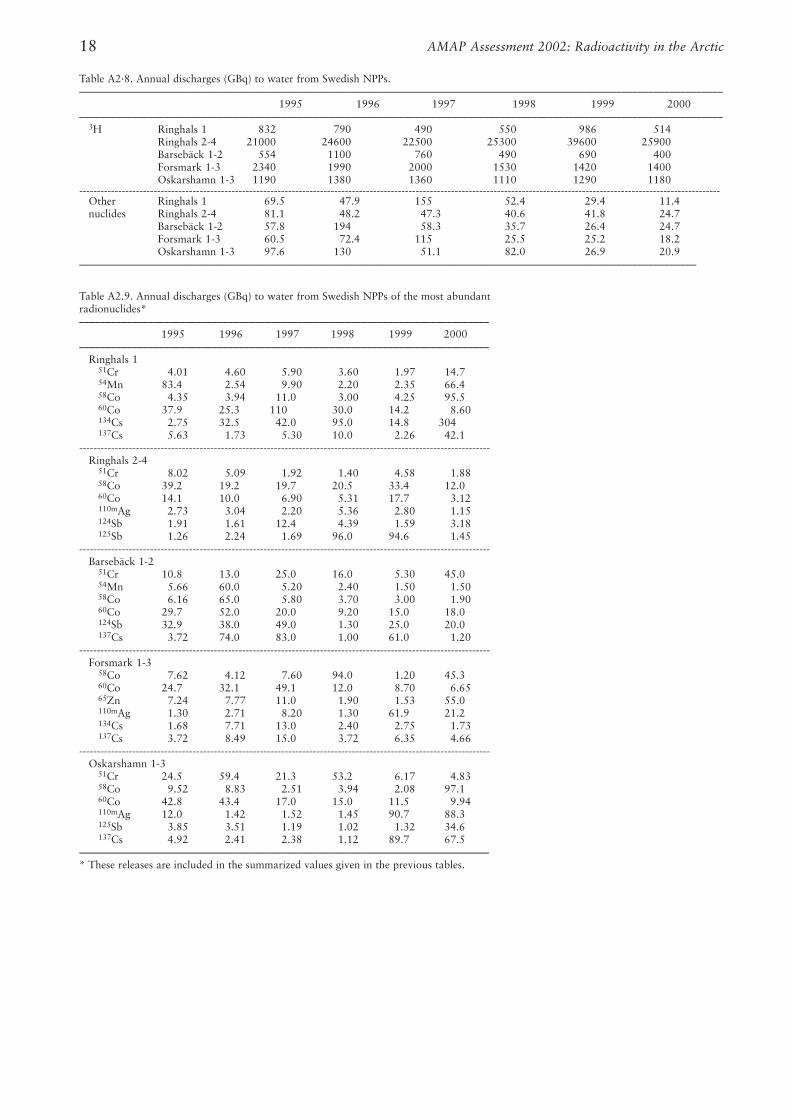
Table A2·8. Annual discharges (GBq) to water from Swedish NPPs.–––––––––––––––––––––––––––––––––––––––––––––––––––––––––––––––––––––––––––––––––––––––––––––––––––––––––––––––––––––––––
1995 1996 1997 1998 1999 2000–––––––––––––––––––––––––––––––––––––––––––––––––––––––––––––––––––––––––––––––––––––––––––––––––––––––––––––––––––––––––
3H Ringhals 1 832 790 490 550 986 514Ringhals 2-4 21000 24600 22500 25300 39600 25900Barsebäck 1-2 554 1100 760 490 690 400Forsmark 1-3 2340 1990 2000 1530 1420 1400Oskarshamn 1-3 1190 1380 1360 1110 1290 1180
-------------------------------------------------------------------------------------------------------------------------------------------------------------------------------------Other Ringhals 1 69.5 47.9 155 52.4 29.4 11.4nuclides Ringhals 2-4 81.1 48.2 47.3 40.6 41.8 24.7
Barsebäck 1-2 57.8 194 58.3 35.7 26.4 24.7Forsmark 1-3 60.5 72.4 115 25.5 25.2 18.2Oskarshamn 1-3 97.6 130 51.1 82.0 26.9 20.9
––––––––––––––––––––––––––––––––––––––––––––––––––––––––––––––––––––––––––––––––––––––––––––––––––––––––––––––––––––
Table A2.9. Annual discharges (GBq) to water from Swedish NPPs of the most abundant radionuclides*–––––––––––––––––––––––––––––––––––––––––––––––––––––––––––––––––––––––––––––
1995 1996 1997 1998 1999 2000–––––––––––––––––––––––––––––––––––––––––––––––––––––––––––––––––––––––––––––
Ringhals 151Cr 4.01 4.60 5.90 3.60 1.97 14.754Mn 83.4 2.54 9.90 2.20 2.35 66.458Co 4.35 3.94 11.0 3.00 4.25 95.560Co 37.9 25.3 110 30.0 14.2 8.60134Cs 2.75 32.5 42.0 95.0 14.8 304137Cs 5.63 1.73 5.30 10.0 2.26 42.1
--------------------------------------------------------------------------------------------------------------------Ringhals 2-4
51Cr 8.02 5.09 1.92 1.40 4.58 1.8858Co 39.2 19.2 19.7 20.5 33.4 12.060Co 14.1 10.0 6.90 5.31 17.7 3.12110mAg 2.73 3.04 2.20 5.36 2.80 1.15124Sb 1.91 1.61 12.4 4.39 1.59 3.18125Sb 1.26 2.24 1.69 96.0 94.6 1.45
-------------------------------------------------------------------------------------------------------------------- Barsebäck 1-2
51Cr 10.8 13.0 25.0 16.0 5.30 45.054Mn 5.66 60.0 5.20 2.40 1.50 1.5058Co 6.16 65.0 5.80 3.70 3.00 1.9060Co 29.7 52.0 20.0 9.20 15.0 18.0124Sb 32.9 38.0 49.0 1.30 25.0 20.0137Cs 3.72 74.0 83.0 1.00 61.0 1.20
-------------------------------------------------------------------------------------------------------------------- Forsmark 1-3
58Co 7.62 4.12 7.60 94.0 1.20 45.360Co 24.7 32.1 49.1 12.0 8.70 6.6565Zn 7.24 7.77 11.0 1.90 1.53 55.0110mAg 1.30 2.71 8.20 1.30 61.9 21.2134Cs 1.68 7.71 13.0 2.40 2.75 1.73137Cs 3.72 8.49 15.0 3.72 6.35 4.66
-------------------------------------------------------------------------------------------------------------------- Oskarshamn 1-3
51Cr 24.5 59.4 21.3 53.2 6.17 4.8358Co 9.52 8.83 2.51 3.94 2.08 97.160Co 42.8 43.4 17.0 15.0 11.5 9.94110mAg 12.0 1.42 1.52 1.45 90.7 88.3125Sb 3.85 3.51 1.19 1.02 1.32 34.6137Cs 4.92 2.41 2.38 1.12 89.7 67.5
–––––––––––––––––––––––––––––––––––––––––––––––––––––––––––––––––––––––––––––* These releases are included in the summarized values given in the previous tables.
AMAP Assessment 2002: Radioactivity in the Arctic18
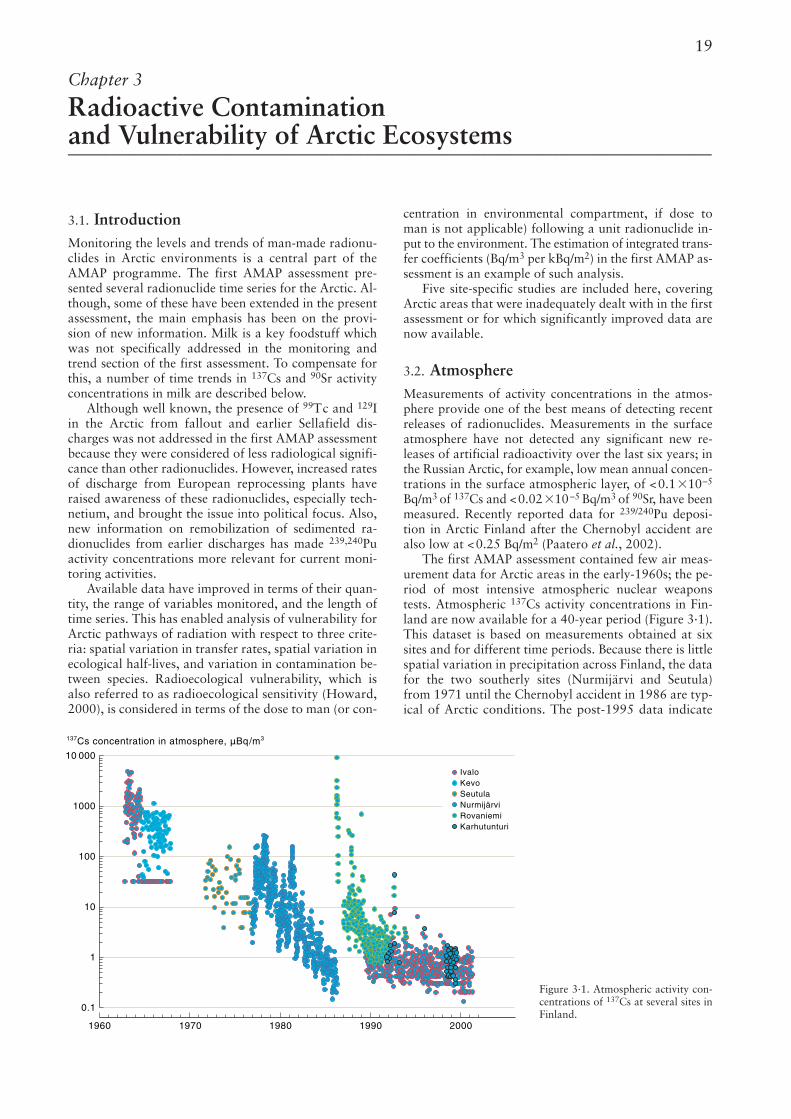
centration in environmental compartment, if dose toman is not applicable) following a unit radionuclide in-put to the environment. The estimation of integrated trans-fer coefficients (Bq/m3 per kBq/m2) in the first AMAP as-sessment is an example of such analysis.
Five site-specific studies are included here, coveringArctic areas that were inadequately dealt with in the firstassessment or for which significantly improved data arenow available.
3.2. AtmosphereMeasurements of activity concentrations in the atmos-phere provide one of the best means of detecting recentreleases of radionuclides. Measurements in the surfaceatmosphere have not detected any significant new re-leases of artificial radioactivity over the last six years; inthe Russian Arctic, for example, low mean annual concen-trations in the surface atmospheric layer, of <0.1�10–5
Bq/m3 of 137Cs and <0.02�10–5 Bq/m3 of 90Sr, have beenmeasured. Recently reported data for 239/240Pu deposi-tion in Arctic Finland after the Chernobyl accident arealso low at <0.25 Bq/m2 (Paatero et al., 2002).
The first AMAP assessment contained few air meas-urement data for Arctic areas in the early-1960s; the pe-riod of most intensive atmospheric nuclear weaponstests. Atmospheric 137Cs activity concentrations in Fin-land are now available for a 40-year period (Figure 3·1).This dataset is based on measurements obtained at sixsites and for different time periods. Because there is littlespatial variation in precipitation across Finland, the datafor the two southerly sites (Nurmijärvi and Seutula)from 1971 until the Chernobyl accident in 1986 are typ-ical of Arctic conditions. The post-1995 data indicate
19
3.1. IntroductionMonitoring the levels and trends of man-made radionu-clides in Arctic environments is a central part of theAMAP programme. The first AMAP assessment pre-sented several radionuclide time series for the Arctic. Al-though, some of these have been extended in the presentassessment, the main emphasis has been on the provi-sion of new information. Milk is a key foodstuff whichwas not specifically addressed in the monitoring andtrend section of the first assessment. To compensate forthis, a number of time trends in 137Cs and 90Sr activityconcentrations in milk are described below.
Although well known, the presence of 99Tc and 129Iin the Arctic from fallout and earlier Sellafield dis-charges was not addressed in the first AMAP assessmentbecause they were considered of less radiological signifi-cance than other radionuclides. However, increased ratesof discharge from European reprocessing plants haveraised awareness of these radionuclides, especially tech-netium, and brought the issue into political focus. Also,new information on remobilization of sedimented ra-dionuclides from earlier discharges has made 239,240Puactivity concentrations more relevant for current moni-toring activities.
Available data have improved in terms of their quan-tity, the range of variables monitored, and the length oftime series. This has enabled analysis of vulnerability forArctic pathways of radiation with respect to three crite-ria: spatial variation in transfer rates, spatial variation inecological half-lives, and variation in contamination be-tween species. Radioecological vulnerability, which isalso referred to as radioecological sensitivity (Howard,2000), is considered in terms of the dose to man (or con-
Chapter 3
Radioactive Contamination and Vulnerability of Arctic Ecosystems –––––––––––––––––––––––––––––––––––––––––––––––––––––––––––––––––––––––––––––––––––––––––
10 000
1000
100
10
1
1960 1970 1980 1990 2000
0.1
137Cs concentration in atmosphere, µBq/m3
IvaloKevoSeutulaNurmijärviRovaniemiKarhutunturi
Figure 3·1. Atmospheric activity con-centrations of 137Cs at several sites inFinland.
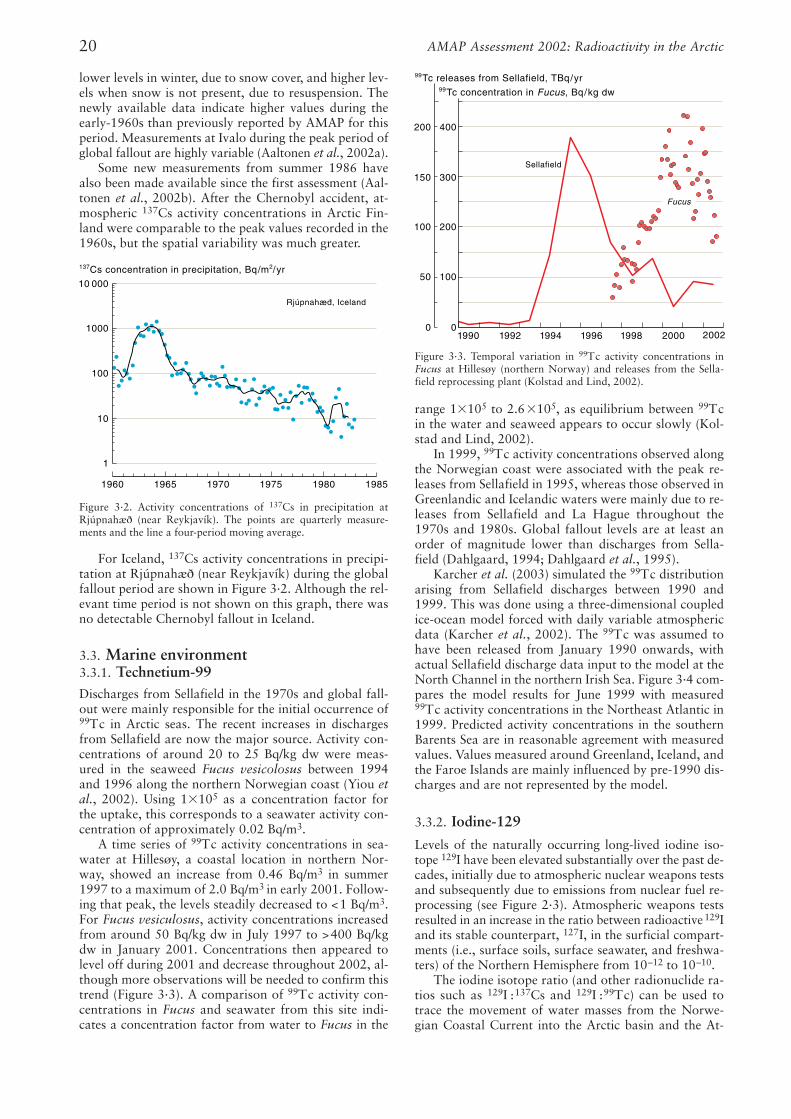
lower levels in winter, due to snow cover, and higher lev-els when snow is not present, due to resuspension. Thenewly available data indicate higher values during theearly-1960s than previously reported by AMAP for thisperiod. Measurements at Ivalo during the peak period ofglobal fallout are highly variable (Aaltonen et al., 2002a).
Some new measurements from summer 1986 havealso been made available since the first assessment (Aal-tonen et al., 2002b). After the Chernobyl accident, at-mospheric 137Cs activity concentrations in Arctic Fin-land were comparable to the peak values recorded in the1960s, but the spatial variability was much greater.
For Iceland, 137Cs activity concentrations in precipi-tation at Rjúpnahæ∂ (near Reykjavík) during the globalfallout period are shown in Figure 3·2. Although the rel-evant time period is not shown on this graph, there wasno detectable Chernobyl fallout in Iceland.
3.3. Marine environment3.3.1. Technetium-99Discharges from Sellafield in the 1970s and global fall-out were mainly responsible for the initial occurrence of99Tc in Arctic seas. The recent increases in dischargesfrom Sellafield are now the major source. Activity con-centrations of around 20 to 25 Bq/kg dw were meas-ured in the seaweed Fucus vesicolosus between 1994and 1996 along the northern Norwegian coast (Yiou etal., 2002). Using 1�105 as a concentration factor forthe uptake, this corresponds to a seawater activity con-centration of approximately 0.02 Bq/m3.
A time series of 99Tc activity concentrations in sea-water at Hillesøy, a coastal location in northern Nor-way, showed an increase from 0.46 Bq/m3 in summer1997 to a maximum of 2.0 Bq/m3 in early 2001. Follow-ing that peak, the levels steadily decreased to <1 Bq/m3.For Fucus vesiculosus, activity concentrations increasedfrom around 50 Bq/kg dw in July 1997 to >400 Bq/kgdw in January 2001. Concentrations then appeared tolevel off during 2001 and decrease throughout 2002, al-though more observations will be needed to confirm thistrend (Figure 3·3). A comparison of 99Tc activity con-centrations in Fucus and seawater from this site indi-cates a concentration factor from water to Fucus in the
range 1�105 to 2.6�105, as equilibrium between 99Tcin the water and seaweed appears to occur slowly (Kol-stad and Lind, 2002).
In 1999, 99Tc activity concentrations observed alongthe Norwegian coast were associated with the peak re-leases from Sellafield in 1995, whereas those observed inGreenlandic and Icelandic waters were mainly due to re-leases from Sellafield and La Hague throughout the1970s and 1980s. Global fallout levels are at least anorder of magnitude lower than discharges from Sella-field (Dahlgaard, 1994; Dahlgaard et al., 1995).
Karcher et al. (2003) simulated the 99Tc distributionarising from Sellafield discharges between 1990 and1999. This was done using a three-dimensional coupledice-ocean model forced with daily variable atmosphericdata (Karcher et al., 2002). The 99Tc was assumed tohave been released from January 1990 onwards, withactual Sellafield discharge data input to the model at theNorth Channel in the northern Irish Sea. Figure 3·4 com-pares the model results for June 1999 with measured99Tc activity concentrations in the Northeast Atlantic in1999. Predicted activity concentrations in the southernBarents Sea are in reasonable agreement with measuredvalues. Values measured around Greenland, Iceland, andthe Faroe Islands are mainly influenced by pre-1990 dis-charges and are not represented by the model.
3.3.2. Iodine-129
Levels of the naturally occurring long-lived iodine iso-tope 129I have been elevated substantially over the past de-cades, initially due to atmospheric nuclear weapons testsand subsequently due to emissions from nuclear fuel re-processing (see Figure 2·3). Atmospheric weapons testsresulted in an increase in the ratio between radioactive 129Iand its stable counterpart, 127I, in the surficial compart-ments (i.e., surface soils, surface seawater, and freshwa-ters) of the Northern Hemisphere from 10–12 to 10–10.
The iodine isotope ratio (and other radionuclide ra-tios such as 129I :137Cs and 129I :99Tc) can be used totrace the movement of water masses from the Norwe-gian Coastal Current into the Arctic basin and the At-
AMAP Assessment 2002: Radioactivity in the Arctic20
10 000
1000
100
198519801975197019651960
10
1
137Cs concentration in precipitation, Bq/m2/yr
Rjúpnahæd, Iceland
99Tc concentration in Fucus, Bq/kg dw
200 400
150 300
100 200
50 100
0 0
99Tc releases from Sellafield, TBq/yr
Sellafield
Fucus
2002200019981996199419921990
Figure 3·2. Activity concentrations of 137Cs in precipitation atRjúpnahæ∂ (near Reykjavík). The points are quarterly measure-ments and the line a four-period moving average.
Figure 3·3. Temporal variation in 99Tc activity concentrations inFucus at Hillesøy (northern Norway) and releases from the Sella-field reprocessing plant (Kolstad and Lind, 2002).
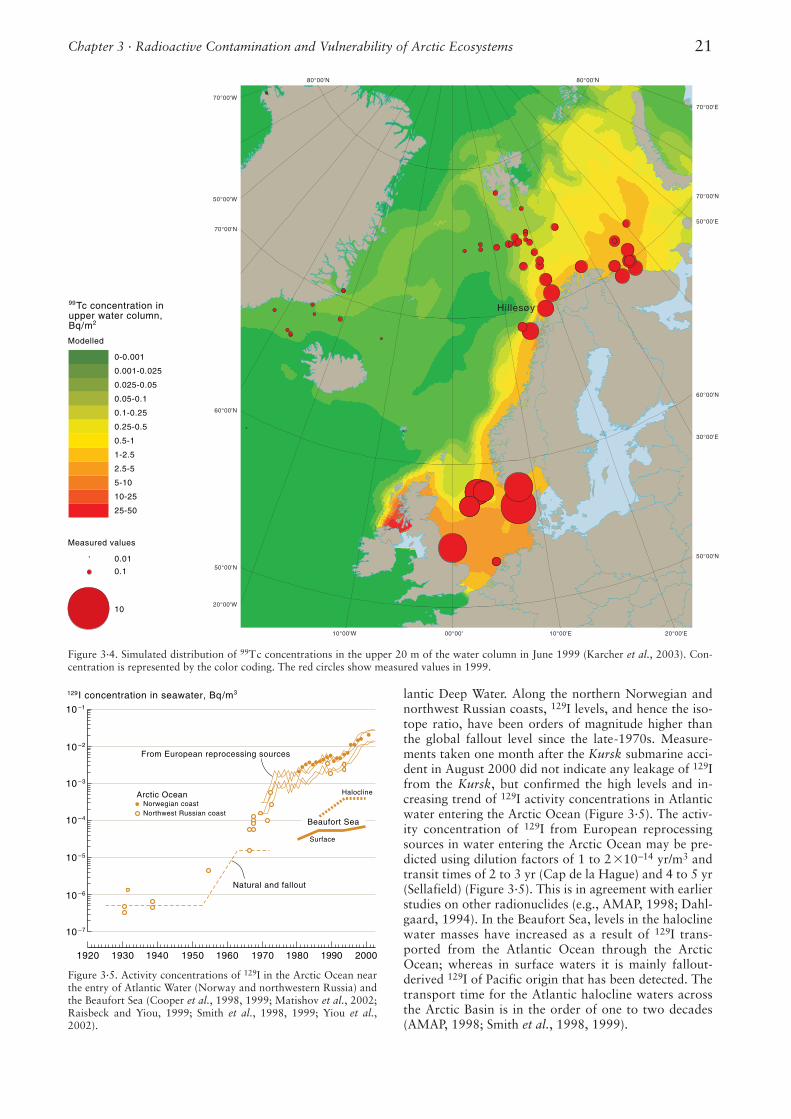
Chapter 3 · Radioactive Contamination and Vulnerability of Arctic Ecosystems 21
ing
01
000000 0.025
000000 0.05
000000 0.1
000000 0.25
000000 0.5
000000 1
000001 2.5
000001 5
000001 10
000001 25
000001 50
20°0’0"W50°0’0"W70°0’0"W
10°0’0"W 0°0’0"E 10°0’0"E
20°0’0"E
20°0’0"E
50°0’0"E 70°0’0"E
50°0’0"N50°0’0"N
60°0’0"N
60°0’0"N
70°0’0"N
70°0’0"N
20°0’0"W
30°0’0"W
40°0’0"W
50°0’0"W
60°0’0"W
30°0’0"E
40°0’0"E
50°0’0"E
60°0’0"E
70°0’0"E
80°0’0"N 80°0’0"N
ing
ing
01
1
0
80°00'N
70°00'E
70°00'N
60°00'N
50°00'N
80°00'N
50°00'E
30°00'E
70°00'W
70°00'N
60°00'N
50°00'N
50°00'W
20°00'W
20°00'E10°00'E00°00'10°00'W
Hillesøy
Figure 3·4. Simulated distribution of 99Tc concentrations in the upper 20 m of the water column in June 1999 (Karcher et al., 2003). Con-centration is represented by the color coding. The red circles show measured values in 1999.
10 –7
10 –6
10 –5
10 –4
10 –3
10 –1
10 –2
129I concentration in seawater, Bq/m3
Natural and fallout
Beaufort Sea
Halocline
Surface
From European reprocessing sources
Arctic Ocean Norwegian coast Northwest Russian coast
20001980196019401920 1990197019501930
Figure 3·5. Activity concentrations of 129I in the Arctic Ocean nearthe entry of Atlantic Water (Norway and northwestern Russia) andthe Beaufort Sea (Cooper et al., 1998, 1999; Matishov et al., 2002;Raisbeck and Yiou, 1999; Smith et al., 1998, 1999; Yiou et al.,2002).
0-0.001
0.001-0.025
0.025-0.05
0.05-0.1
0.1-0.25
0.25-0.5
0.5-1
1-2.5
2.5-5
5-10
10-25
25-50
0.01
0.1
10
99Tc concentration inupper water column,Bq/m2
Modelled
Measured values
lantic Deep Water. Along the northern Norwegian andnorthwest Russian coasts, 129I levels, and hence the iso-tope ratio, have been orders of magnitude higher thanthe global fallout level since the late-1970s. Measure-ments taken one month after the Kursk submarine acci-dent in August 2000 did not indicate any leakage of 129Ifrom the Kursk, but confirmed the high levels and in-creasing trend of 129I activity concentrations in Atlanticwater entering the Arctic Ocean (Figure 3·5). The activ-ity concentration of 129I from European reprocessingsources in water entering the Arctic Ocean may be pre-dicted using dilution factors of 1 to 2�10–14 yr/m3 andtransit times of 2 to 3 yr (Cap de la Hague) and 4 to 5 yr(Sellafield) (Figure 3·5). This is in agreement with earlierstudies on other radionuclides (e.g., AMAP, 1998; Dahl-gaard, 1994). In the Beaufort Sea, levels in the haloclinewater masses have increased as a result of 129I trans-ported from the Atlantic Ocean through the ArcticOcean; whereas in surface waters it is mainly fallout-derived 129I of Pacific origin that has been detected. Thetransport time for the Atlantic halocline waters acrossthe Arctic Basin is in the order of one to two decades(AMAP, 1998; Smith et al., 1998, 1999).
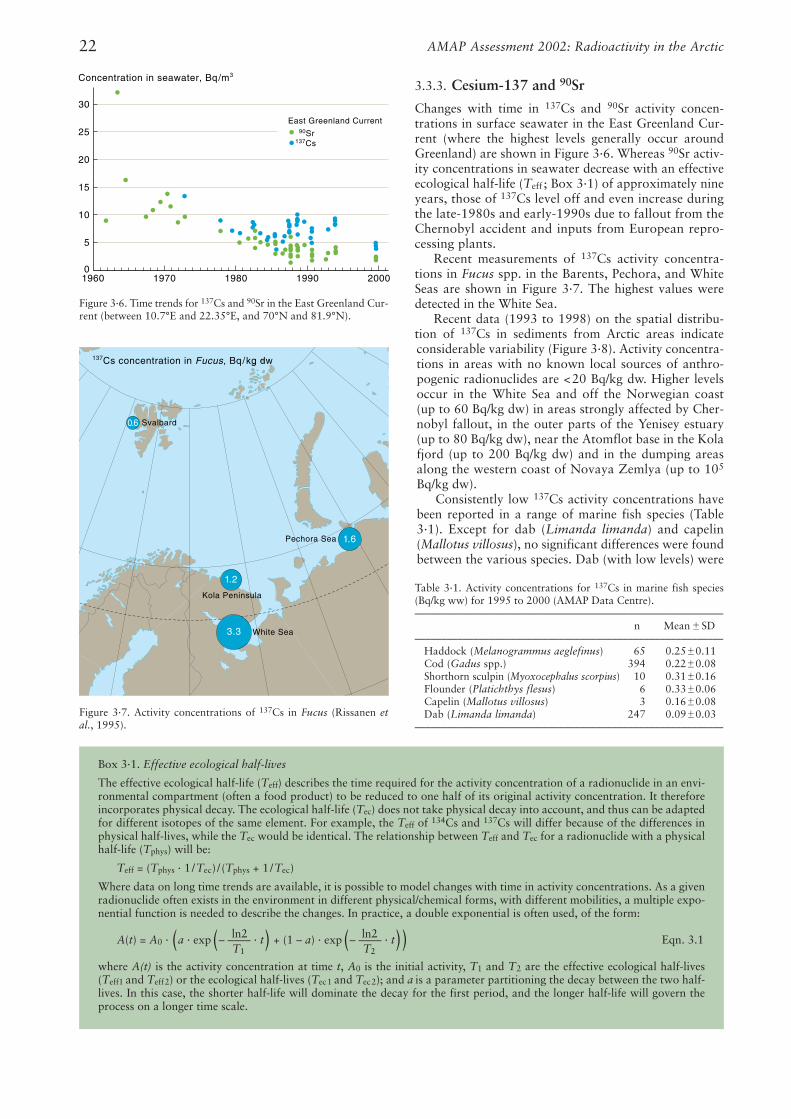
3.3.3. Cesium-137 and 90Sr
Changes with time in 137Cs and 90Sr activity concen-trations in surface seawater in the East Greenland Cur-rent (where the highest levels generally occur aroundGreenland) are shown in Figure 3·6. Whereas 90Sr activ-ity concentrations in seawater decrease with an effectiveecological half-life (Teff ; Box 3·1) of approximately nineyears, those of 137Cs level off and even increase duringthe late-1980s and early-1990s due to fallout from theChernobyl accident and inputs from European repro-cessing plants.
Recent measurements of 137Cs activity concentra-tions in Fucus spp. in the Barents, Pechora, and WhiteSeas are shown in Figure 3·7. The highest values weredetected in the White Sea.
Recent data (1993 to 1998) on the spatial distribu-tion of 137Cs in sediments from Arctic areas indicateconsiderable variability (Figure 3·8). Activity concentra-tions in areas with no known local sources of anthro-pogenic radionuclides are <20 Bq/kg dw. Higher levelsoccur in the White Sea and off the Norwegian coast(up to 60 Bq/kg dw) in areas strongly affected by Cher-nobyl fallout, in the outer parts of the Yenisey estuary(up to 80 Bq/kg dw), near the Atomflot base in the Kolafjord (up to 200 Bq/kg dw) and in the dumping areasalong the western coast of Novaya Zemlya (up to 105
Bq/kg dw). Consistently low 137Cs activity concentrations have
been reported in a range of marine fish species (Table3·1). Except for dab (Limanda limanda) and capelin(Mallotus villosus), no significant differences were foundbetween the various species. Dab (with low levels) were
AMAP Assessment 2002: Radioactivity in the Arctic22
Svalbard
Kola Peninsula
White Sea
Pechora Sea
3.3
1.2
1.6
0.6
137Cs concentration in Fucus, Bq/kg dw
30
25
20
15
10
5
01960 1970 1980 1990 2000
Concentration in seawater, Bq/m3
East Greenland Current 90Sr 137Cs
Figure 3·6. Time trends for 137Cs and 90Sr in the East Greenland Cur-rent (between 10.7°E and 22.35°E, and 70°N and 81.9°N).
Figure 3·7. Activity concentrations of 137Cs in Fucus (Rissanen etal., 1995).
Table 3·1. Activity concentrations for 137Cs in marine fish species(Bq/kg ww) for 1995 to 2000 (AMAP Data Centre). ––––––––––––––––––––––––––––––––––––––––––––––––––––––––––
n Mean ± SD––––––––––––––––––––––––––––––––––––––––––––––––––––––––––
Haddock (Melanogrammus aeglefinus) 65 0.25±0.11Cod (Gadus spp.) 394 0.22±0.08Shorthorn sculpin (Myoxocephalus scorpius) 10 0.31±0.16Flounder (Platichthys flesus) 6 0.33±0.06Capelin (Mallotus villosus) 3 0.16±0.08Dab (Limanda limanda) 247 0.09±0.03
––––––––––––––––––––––––––––––––––––––––––––––––––––––––––
Box 3·1. Effective ecological half-lives
The effective ecological half-life (Teff) describes the time required for the activity concentration of a radionuclide in an envi-ronmental compartment (often a food product) to be reduced to one half of its original activity concentration. It thereforeincorporates physical decay. The ecological half-life (Tec) does not take physical decay into account, and thus can be adaptedfor different isotopes of the same element. For example, the Teff of 134Cs and 137Cs will differ because of the differences inphysical half-lives, while the Tec would be identical. The relationship between Teff and Tec for a radionuclide with a physicalhalf-life (Tphys) will be:
Teff = (Tphys · 1 /Tec) / (Tphys + 1 /Tec)
Where data on long time trends are available, it is possible to model changes with time in activity concentrations. As a givenradionuclide often exists in the environment in different physical/chemical forms, with different mobilities, a multiple expo-nential function is needed to describe the changes. In practice, a double exponential is often used, of the form:
ln2 ln2A(t) = A0 · (a · exp(– –––– · t) + (1 – a) · exp(– –––– · t)) Eqn. 3.1T1 T2
where A(t) is the activity concentration at time t, A0 is the initial activity, T1 and T2 are the effective ecological half-lives(Teff1 and Teff2) or the ecological half-lives (Tec1 and Tec2); and a is a parameter partitioning the decay between the two half-lives. In this case, the shorter half-life will dominate the decay for the first period, and the longer half-life will govern theprocess on a longer time scale.
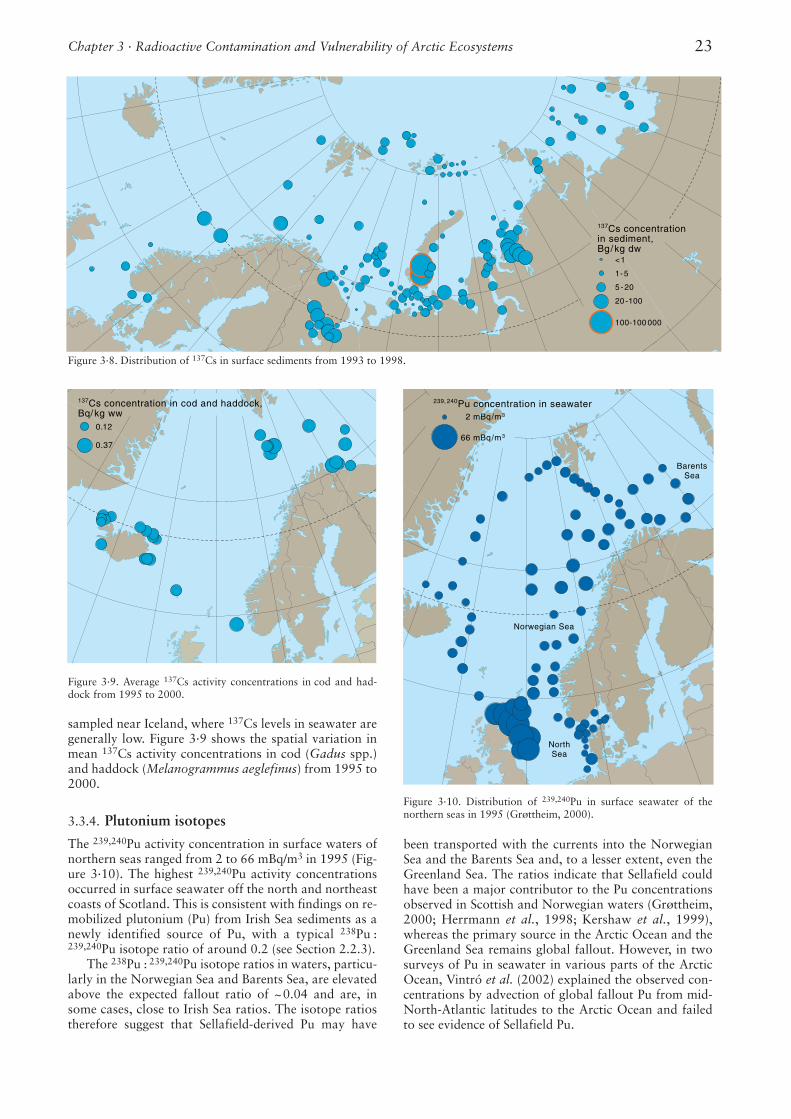
sampled near Iceland, where 137Cs levels in seawater aregenerally low. Figure 3·9 shows the spatial variation inmean 137Cs activity concentrations in cod (Gadus spp.)and haddock (Melanogrammus aeglefinus) from 1995 to2000.
3.3.4. Plutonium isotopes
The 239,240Pu activity concentration in surface waters ofnorthern seas ranged from 2 to 66 mBq/m3 in 1995 (Fig-ure 3·10). The highest 239,240Pu activity concentrationsoccurred in surface seawater off the north and northeastcoasts of Scotland. This is consistent with findings on re-mobilized plutonium (Pu) from Irish Sea sediments as anewly identified source of Pu, with a typical 238Pu :239,240Pu isotope ratio of around 0.2 (see Section 2.2.3).
The 238Pu : 239,240Pu isotope ratios in waters, particu-larly in the Norwegian Sea and Barents Sea, are elevatedabove the expected fallout ratio of ~0.04 and are, insome cases, close to Irish Sea ratios. The isotope ratiostherefore suggest that Sellafield-derived Pu may have
been transported with the currents into the NorwegianSea and the Barents Sea and, to a lesser extent, even theGreenland Sea. The ratios indicate that Sellafield couldhave been a major contributor to the Pu concentrationsobserved in Scottish and Norwegian waters (Grøttheim,2000; Herrmann et al., 1998; Kershaw et al., 1999),whereas the primary source in the Arctic Ocean and theGreenland Sea remains global fallout. However, in twosurveys of Pu in seawater in various parts of the ArcticOcean, Vintró et al. (2002) explained the observed con-centrations by advection of global fallout Pu from mid-North-Atlantic latitudes to the Arctic Ocean and failedto see evidence of Sellafield Pu.
Chapter 3 · Radioactive Contamination and Vulnerability of Arctic Ecosystems 23
137Cs concentration in cod and haddock,Bq/kg ww
0.12
0.37
BarentsSea
NorthSea
Norwegian Sea
66 mBq/m3
2 mBq/m3
239, 240Pu concentration in seawater
3.10
<1
1- 5
5 - 20
20 -100
100-100 000
137Cs concentrationin sediment,Bg/kg dw
Figure 3·8. Distribution of 137Cs in surface sediments from 1993 to 1998.
Figure 3·9. Average 137Cs activity concentrations in cod and had-dock from 1995 to 2000.
Figure 3·10. Distribution of 239,240Pu in surface seawater of thenorthern seas in 1995 (Grøttheim, 2000).
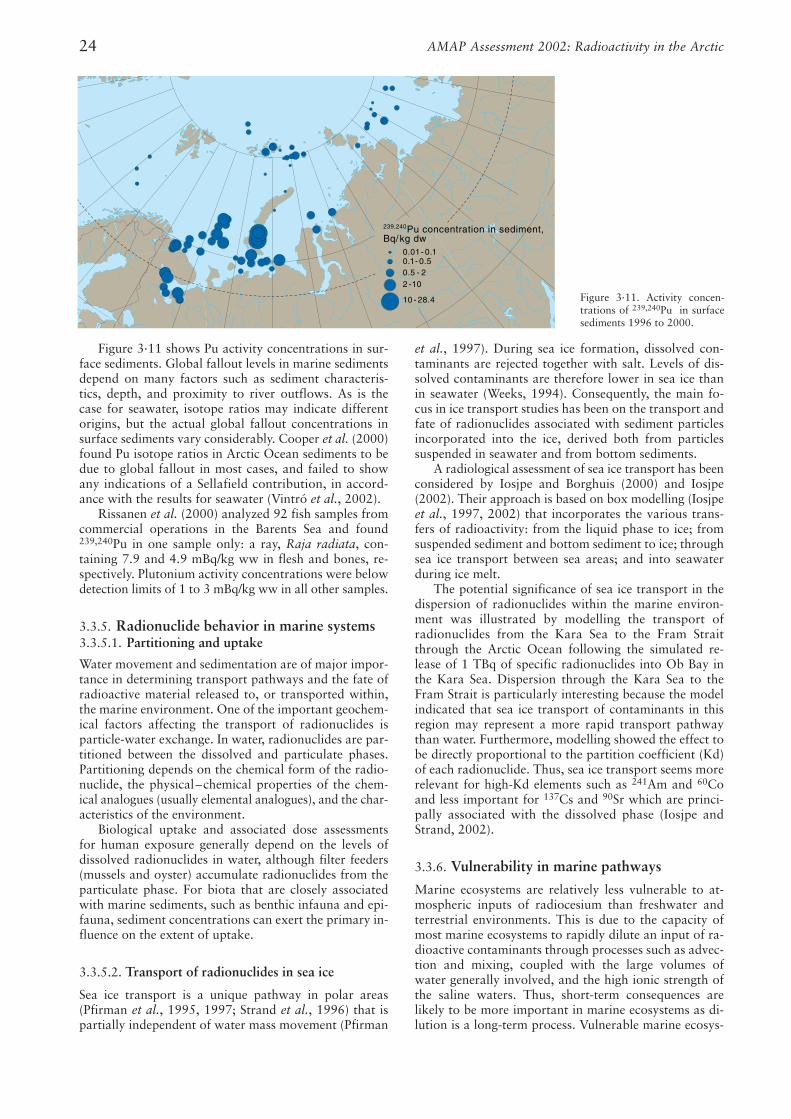
Figure 3·11 shows Pu activity concentrations in sur-face sediments. Global fallout levels in marine sedimentsdepend on many factors such as sediment characteris-tics, depth, and proximity to river outflows. As is thecase for seawater, isotope ratios may indicate differentorigins, but the actual global fallout concentrations insurface sediments vary considerably. Cooper et al. (2000)found Pu isotope ratios in Arctic Ocean sediments to bedue to global fallout in most cases, and failed to showany indications of a Sellafield contribution, in accord-ance with the results for seawater (Vintró et al., 2002).
Rissanen et al. (2000) analyzed 92 fish samples fromcommercial operations in the Barents Sea and found239,240Pu in one sample only: a ray, Raja radiata, con-taining 7.9 and 4.9 mBq/kg ww in flesh and bones, re-spectively. Plutonium activity concentrations were belowdetection limits of 1 to 3 mBq/kg ww in all other samples.
3.3.5. Radionuclide behavior in marine systems3.3.5.1. Partitioning and uptake
Water movement and sedimentation are of major impor-tance in determining transport pathways and the fate ofradioactive material released to, or transported within,the marine environment. One of the important geochem-ical factors affecting the transport of radionuclides isparticle-water exchange. In water, radionuclides are par-titioned between the dissolved and particulate phases.Partitioning depends on the chemical form of the radio-nuclide, the physical–chemical properties of the chem-ical analogues (usually elemental analogues), and the char-acteristics of the environment.
Biological uptake and associated dose assessmentsfor human exposure generally depend on the levels ofdissolved radionuclides in water, although filter feeders(mussels and oyster) accumulate radionuclides from theparticulate phase. For biota that are closely associatedwith marine sediments, such as benthic infauna and epi-fauna, sediment concentrations can exert the primary in-fluence on the extent of uptake.
3.3.5.2. Transport of radionuclides in sea ice
Sea ice transport is a unique pathway in polar areas(Pfirman et al., 1995, 1997; Strand et al., 1996) that ispartially independent of water mass movement (Pfirman
et al., 1997). During sea ice formation, dissolved con-taminants are rejected together with salt. Levels of dis-solved contaminants are therefore lower in sea ice thanin seawater (Weeks, 1994). Consequently, the main fo-cus in ice transport studies has been on the transport andfate of radionuclides associated with sediment particlesincorporated into the ice, derived both from particlessuspended in seawater and from bottom sediments.
A radiological assessment of sea ice transport has beenconsidered by Iosjpe and Borghuis (2000) and Iosjpe(2002). Their approach is based on box modelling (Iosjpeet al., 1997, 2002) that incorporates the various trans-fers of radioactivity: from the liquid phase to ice; fromsuspended sediment and bottom sediment to ice; throughsea ice transport between sea areas; and into seawaterduring ice melt.
The potential significance of sea ice transport in thedispersion of radionuclides within the marine environ-ment was illustrated by modelling the transport ofradionuclides from the Kara Sea to the Fram Straitthrough the Arctic Ocean following the simulated re-lease of 1 TBq of specific radionuclides into Ob Bay inthe Kara Sea. Dispersion through the Kara Sea to theFram Strait is particularly interesting because the modelindicated that sea ice transport of contaminants in thisregion may represent a more rapid transport pathwaythan water. Furthermore, modelling showed the effect tobe directly proportional to the partition coefficient (Kd)of each radionuclide. Thus, sea ice transport seems morerelevant for high-Kd elements such as 241Am and 60Coand less important for 137Cs and 90Sr which are princi-pally associated with the dissolved phase (Iosjpe andStrand, 2002).
3.3.6. Vulnerability in marine pathways
Marine ecosystems are relatively less vulnerable to at-mospheric inputs of radiocesium than freshwater andterrestrial environments. This is due to the capacity ofmost marine ecosystems to rapidly dilute an input of ra-dioactive contaminants through processes such as advec-tion and mixing, coupled with the large volumes ofwater generally involved, and the high ionic strength ofthe saline waters. Thus, short-term consequences arelikely to be more important in marine ecosystems as di-lution is a long-term process. Vulnerable marine ecosys-
AMAP Assessment 2002: Radioactivity in the Arctic24
239,240Pu concentration in sediment,Bq/kg dw
0.01- 0.10.1- 0.50.5 - 22 -10
10 - 28.4 Figure 3·11. Activity concen-trations of 239,240Pu in surfacesediments 1996 to 2000.
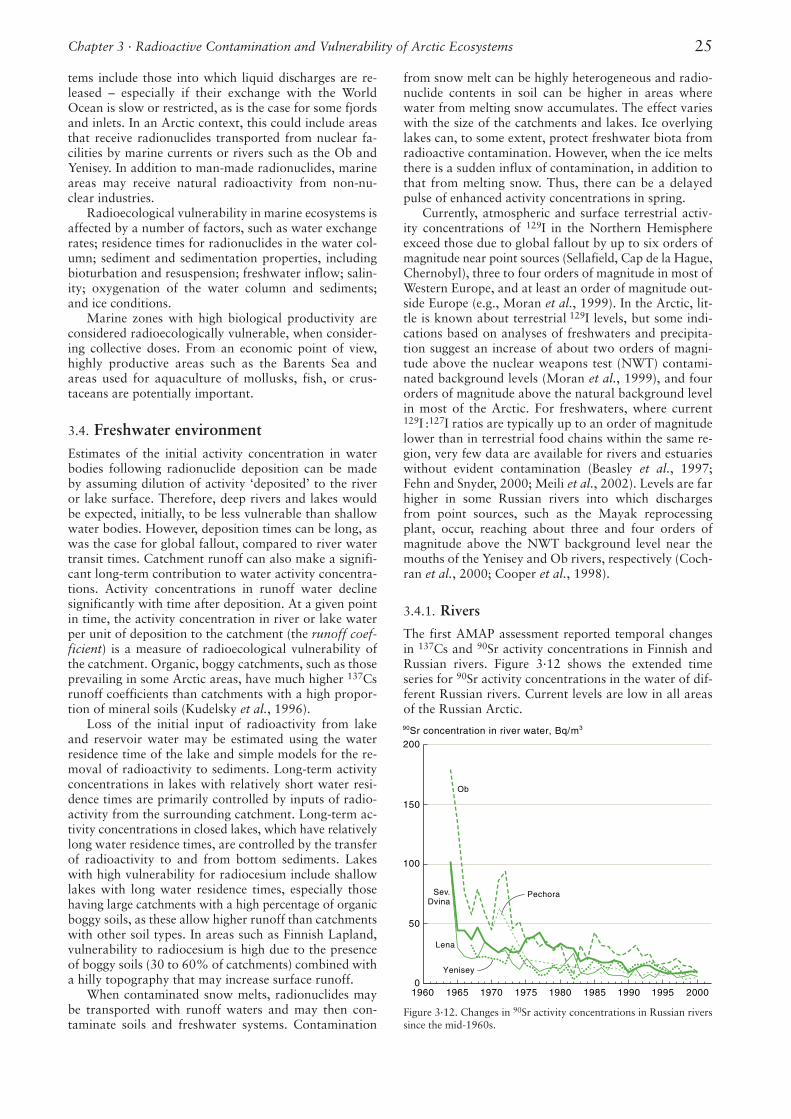
tems include those into which liquid discharges are re-leased – especially if their exchange with the WorldOcean is slow or restricted, as is the case for some fjordsand inlets. In an Arctic context, this could include areasthat receive radionuclides transported from nuclear fa-cilities by marine currents or rivers such as the Ob andYenisey. In addition to man-made radionuclides, marineareas may receive natural radioactivity from non-nu-clear industries.
Radioecological vulnerability in marine ecosystems isaffected by a number of factors, such as water exchangerates; residence times for radionuclides in the water col-umn; sediment and sedimentation properties, includingbioturbation and resuspension; freshwater inflow; salin-ity; oxygenation of the water column and sediments;and ice conditions.
Marine zones with high biological productivity areconsidered radioecologically vulnerable, when consider-ing collective doses. From an economic point of view,highly productive areas such as the Barents Sea andareas used for aquaculture of mollusks, fish, or crus-taceans are potentially important.
3.4. Freshwater environmentEstimates of the initial activity concentration in waterbodies following radionuclide deposition can be madeby assuming dilution of activity ‘deposited’ to the riveror lake surface. Therefore, deep rivers and lakes wouldbe expected, initially, to be less vulnerable than shallowwater bodies. However, deposition times can be long, aswas the case for global fallout, compared to river watertransit times. Catchment runoff can also make a signifi-cant long-term contribution to water activity concentra-tions. Activity concentrations in runoff water declinesignificantly with time after deposition. At a given pointin time, the activity concentration in river or lake waterper unit of deposition to the catchment (the runoff coef-ficient) is a measure of radioecological vulnerability ofthe catchment. Organic, boggy catchments, such as thoseprevailing in some Arctic areas, have much higher 137Csrunoff coefficients than catchments with a high propor-tion of mineral soils (Kudelsky et al., 1996).
Loss of the initial input of radioactivity from lakeand reservoir water may be estimated using the waterresidence time of the lake and simple models for the re-moval of radioactivity to sediments. Long-term activityconcentrations in lakes with relatively short water resi-dence times are primarily controlled by inputs of radio-activity from the surrounding catchment. Long-term ac-tivity concentrations in closed lakes, which have relativelylong water residence times, are controlled by the transferof radioactivity to and from bottom sediments. Lakeswith high vulnerability for radiocesium include shallowlakes with long water residence times, especially thosehaving large catchments with a high percentage of organicboggy soils, as these allow higher runoff than catchmentswith other soil types. In areas such as Finnish Lapland,vulnerability to radiocesium is high due to the presenceof boggy soils (30 to 60% of catchments) combined witha hilly topography that may increase surface runoff.
When contaminated snow melts, radionuclides maybe transported with runoff waters and may then con-taminate soils and freshwater systems. Contamination
from snow melt can be highly heterogeneous and radio-nuclide contents in soil can be higher in areas wherewater from melting snow accumulates. The effect varieswith the size of the catchments and lakes. Ice overlyinglakes can, to some extent, protect freshwater biota fromradioactive contamination. However, when the ice meltsthere is a sudden influx of contamination, in addition tothat from melting snow. Thus, there can be a delayedpulse of enhanced activity concentrations in spring.
Currently, atmospheric and surface terrestrial activ-ity concentrations of 129I in the Northern Hemisphereexceed those due to global fallout by up to six orders ofmagnitude near point sources (Sellafield, Cap de la Hague,Chernobyl), three to four orders of magnitude in most ofWestern Europe, and at least an order of magnitude out-side Europe (e.g., Moran et al., 1999). In the Arctic, lit-tle is known about terrestrial 129I levels, but some indi-cations based on analyses of freshwaters and precipita-tion suggest an increase of about two orders of magni-tude above the nuclear weapons test (NWT) contami-nated background levels (Moran et al., 1999), and fourorders of magnitude above the natural background levelin most of the Arctic. For freshwaters, where current129I :127I ratios are typically up to an order of magnitudelower than in terrestrial food chains within the same re-gion, very few data are available for rivers and estuarieswithout evident contamination (Beasley et al., 1997;Fehn and Snyder, 2000; Meili et al., 2002). Levels are farhigher in some Russian rivers into which dischargesfrom point sources, such as the Mayak reprocessingplant, occur, reaching about three and four orders ofmagnitude above the NWT background level near themouths of the Yenisey and Ob rivers, respectively (Coch-ran et al., 2000; Cooper et al., 1998).
3.4.1. Rivers
The first AMAP assessment reported temporal changesin 137Cs and 90Sr activity concentrations in Finnish andRussian rivers. Figure 3·12 shows the extended timeseries for 90Sr activity concentrations in the water of dif-ferent Russian rivers. Current levels are low in all areasof the Russian Arctic.
Chapter 3 · Radioactive Contamination and Vulnerability of Arctic Ecosystems 25
150
100
50
020001990 1995198019701960 198519751965
Ob
Sev.Dvina
Lena
Pechora
Yenisey
200
90Sr concentration in river water, Bq/m3
Figure 3·12. Changes in 90Sr activity concentrations in Russian riverssince the mid-1960s.
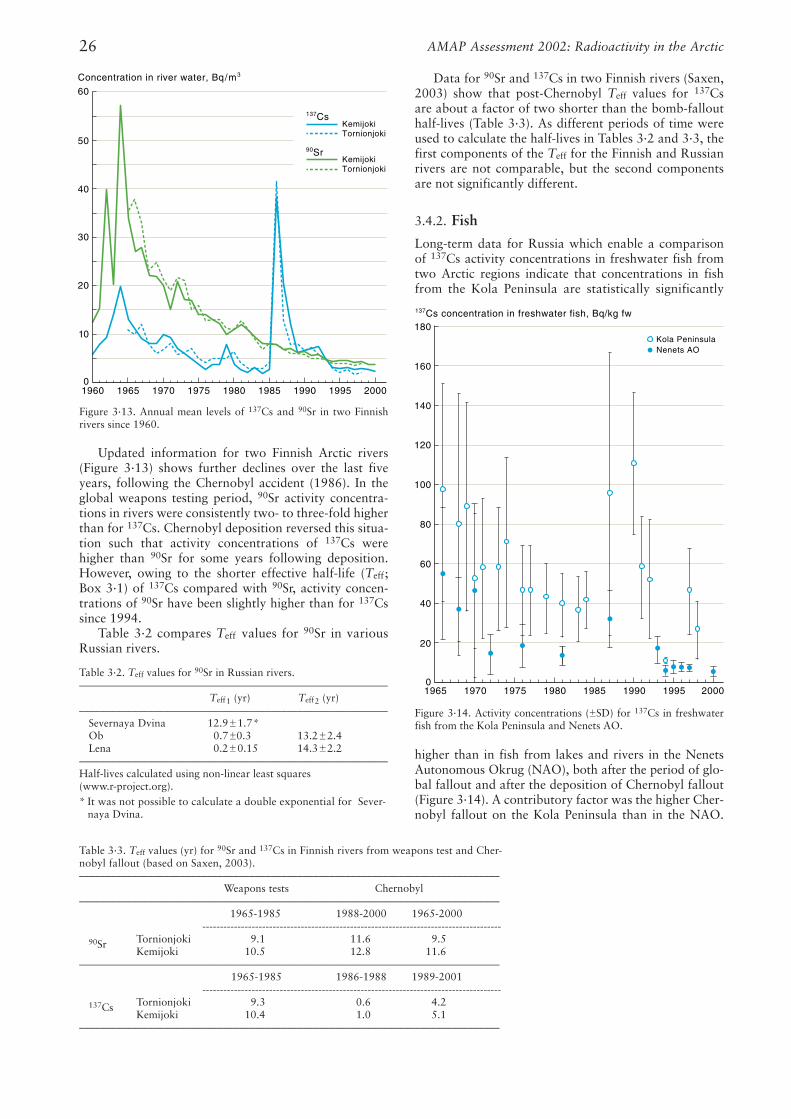
Updated information for two Finnish Arctic rivers(Figure 3·13) shows further declines over the last fiveyears, following the Chernobyl accident (1986). In theglobal weapons testing period, 90Sr activity concentra-tions in rivers were consistently two- to three-fold higherthan for 137Cs. Chernobyl deposition reversed this situa-tion such that activity concentrations of 137Cs werehigher than 90Sr for some years following deposition.However, owing to the shorter effective half-life (Teff;Box 3·1) of 137Cs compared with 90Sr, activity concen-trations of 90Sr have been slightly higher than for 137Cssince 1994.
Table 3·2 compares Teff values for 90Sr in variousRussian rivers.
Data for 90Sr and 137Cs in two Finnish rivers (Saxen,2003) show that post-Chernobyl Teff values for 137Csare about a factor of two shorter than the bomb-fallouthalf-lives (Table 3·3). As different periods of time wereused to calculate the half-lives in Tables 3·2 and 3·3, thefirst components of the Teff for the Finnish and Russianrivers are not comparable, but the second componentsare not significantly different.
3.4.2. Fish
Long-term data for Russia which enable a comparisonof 137Cs activity concentrations in freshwater fish fromtwo Arctic regions indicate that concentrations in fishfrom the Kola Peninsula are statistically significantly
higher than in fish from lakes and rivers in the NenetsAutonomous Okrug (NAO), both after the period of glo-bal fallout and after the deposition of Chernobyl fallout(Figure 3·14). A contributory factor was the higher Cher-nobyl fallout on the Kola Peninsula than in the NAO.
AMAP Assessment 2002: Radioactivity in the Arctic26
60
Concentration in river water, Bq/m3
50
40
30
20
10
0
Kemijoki Tornionjoki
Kemijoki Tornionjoki
200019951990198519801975197019651960
137Cs
90Sr
0
20
40
60
80
100
120
140
160
180
137Cs concentration in freshwater fish, Bq/kg fw
20001995199019851980197519701965
Kola PeninsulaNenets AO
Figure 3·13. Annual mean levels of 137Cs and 90Sr in two Finnishrivers since 1960.
Table 3·2. Teff values for 90Sr in Russian rivers.––––––––––––––––––––––––––––––––––––––––––––––––––––––––––
Teff1 (yr) Teff2 (yr)––––––––––––––––––––––––––––––––––––––––––––––––––––––––––
Severnaya Dvina 12.9±1.7*Ob 0.7±0.3 13.2±2.4Lena 0.2±0.15 14.3±2.2
–––––––––––––––––––––––––––––––––––––––––––––––––––––––––– Half-lives calculated using non-linear least squares (www.r-project.org).* It was not possible to calculate a double exponential for Sever-
naya Dvina.
Table 3·3. Teff values (yr) for 90Sr and 137Cs in Finnish rivers from weapons test and Cher-nobyl fallout (based on Saxen, 2003).–––––––––––––––––––––––––––––––––––––––––––––––––––––––––––––––––––––––––––––––
Weapons tests Chernobyl –––––––––––––––––––––––––––––––––––––––––––––––––––––––––––––––––––––––––––––––
1965-1985 1988-2000 1965-2000------------------------------------------------------------------------------------------------------------------------
90Sr Tornionjoki 9.1 11.6 9.5Kemijoki 10.5 12.8 11.6
–––––––––––––––––––––––––––––––––––––––––––––––––––––––––––––––––––––––––––––––1965-1985 1986-1988 1989-2001
------------------------------------------------------------------------------------------------------------------------137Cs Tornionjoki 9.3 0.6 4.2
Kemijoki 10.4 1.0 5.1–––––––––––––––––––––––––––––––––––––––––––––––––––––––––––––––––––––––––––––––
Figure 3·14. Activity concentrations (±SD) for 137Cs in freshwaterfish from the Kola Peninsula and Nenets AO.
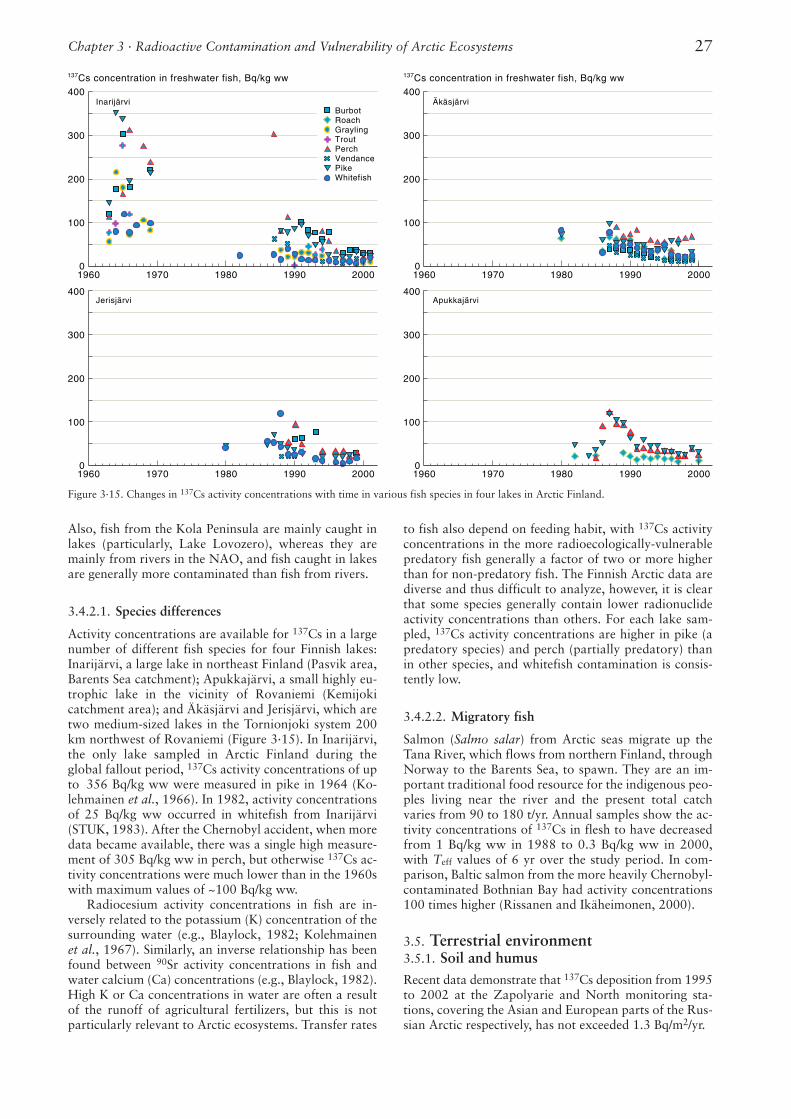
Also, fish from the Kola Peninsula are mainly caught inlakes (particularly, Lake Lovozero), whereas they aremainly from rivers in the NAO, and fish caught in lakesare generally more contaminated than fish from rivers.
3.4.2.1. Species differences
Activity concentrations are available for 137Cs in a largenumber of different fish species for four Finnish lakes:Inarijärvi, a large lake in northeast Finland (Pasvik area,Barents Sea catchment); Apukkajärvi, a small highly eu-trophic lake in the vicinity of Rovaniemi (Kemijokicatchment area); and Äkäsjärvi and Jerisjärvi, which aretwo medium-sized lakes in the Tornionjoki system 200km northwest of Rovaniemi (Figure 3·15). In Inarijärvi,the only lake sampled in Arctic Finland during theglobal fallout period, 137Cs activity concentrations of upto 356 Bq/kg ww were measured in pike in 1964 (Ko-lehmainen et al., 1966). In 1982, activity concentrationsof 25 Bq/kg ww occurred in whitefish from Inarijärvi(STUK, 1983). After the Chernobyl accident, when moredata became available, there was a single high measure-ment of 305 Bq/kg ww in perch, but otherwise 137Cs ac-tivity concentrations were much lower than in the 1960swith maximum values of ~100 Bq/kg ww.
Radiocesium activity concentrations in fish are in-versely related to the potassium (K) concentration of thesurrounding water (e.g., Blaylock, 1982; Kolehmainenet al., 1967). Similarly, an inverse relationship has beenfound between 90Sr activity concentrations in fish andwater calcium (Ca) concentrations (e.g., Blaylock, 1982).High K or Ca concentrations in water are often a resultof the runoff of agricultural fertilizers, but this is notparticularly relevant to Arctic ecosystems. Transfer rates
to fish also depend on feeding habit, with 137Cs activityconcentrations in the more radioecologically-vulnerablepredatory fish generally a factor of two or more higherthan for non-predatory fish. The Finnish Arctic data arediverse and thus difficult to analyze, however, it is clearthat some species generally contain lower radionuclideactivity concentrations than others. For each lake sam-pled, 137Cs activity concentrations are higher in pike (apredatory species) and perch (partially predatory) thanin other species, and whitefish contamination is consis-tently low.
3.4.2.2. Migratory fish
Salmon (Salmo salar) from Arctic seas migrate up theTana River, which flows from northern Finland, throughNorway to the Barents Sea, to spawn. They are an im-portant traditional food resource for the indigenous peo-ples living near the river and the present total catchvaries from 90 to 180 t/yr. Annual samples show the ac-tivity concentrations of 137Cs in flesh to have decreasedfrom 1 Bq/kg ww in 1988 to 0.3 Bq/kg ww in 2000,with Teff values of 6 yr over the study period. In com-parison, Baltic salmon from the more heavily Chernobyl-contaminated Bothnian Bay had activity concentrations100 times higher (Rissanen and Ikäheimonen, 2000).
3.5. Terrestrial environment3.5.1. Soil and humusRecent data demonstrate that 137Cs deposition from 1995to 2002 at the Zapolyarie and North monitoring sta-tions, covering the Asian and European parts of the Rus-sian Arctic respectively, has not exceeded 1.3 Bq/m2/yr.
Chapter 3 · Radioactive Contamination and Vulnerability of Arctic Ecosystems 27
400
300
200
100
0
400
300
200
100
0
400
300
200
100
0
400
300
200
100
01960 1970 1980 1990 2000 1960 1970 1980 1990 2000
Inarijärvi Äkäsjärvi
Jerisjärvi Apukkajärvi
BurbotRoachGraylingTroutPerchVendancePikeWhitefish
137Cs concentration in freshwater fish, Bq/kg ww 137Cs concentration in freshwater fish, Bq/kg ww
1960 1970 1980 1990 2000 1960 1970 1980 1990 2000
Figure 3·15. Changes in 137Cs activity concentrations with time in various fish species in four lakes in Arctic Finland.
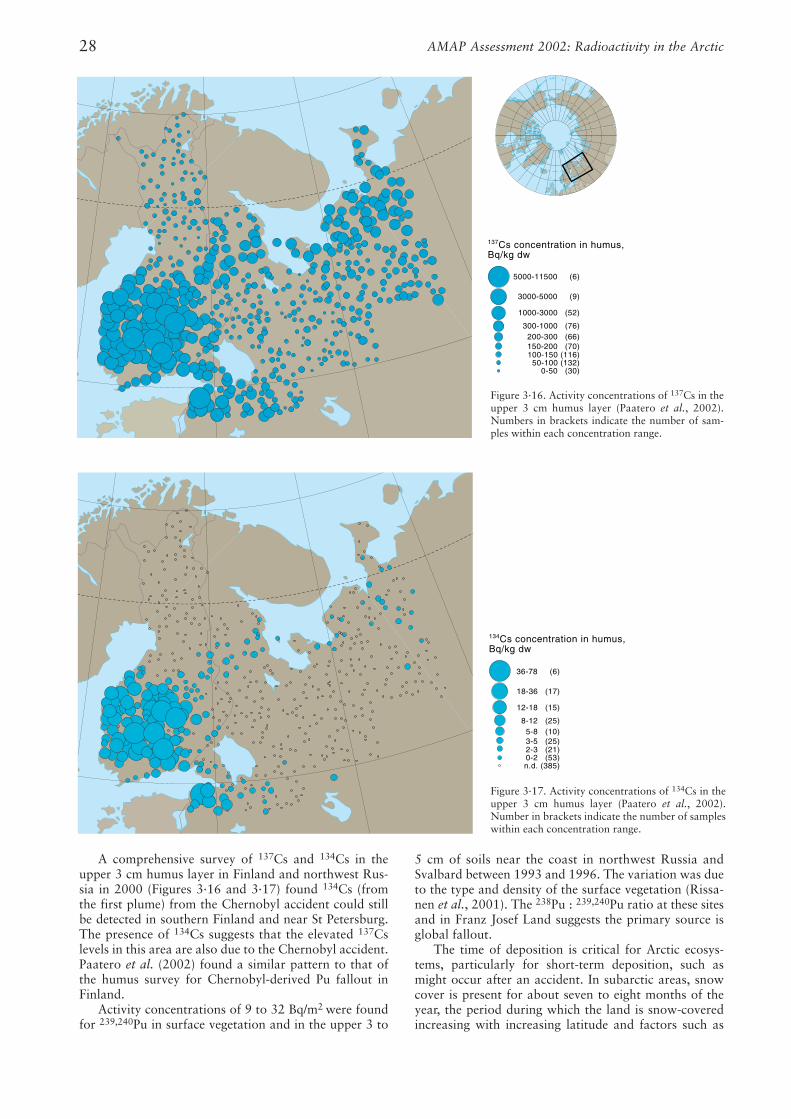
A comprehensive survey of 137Cs and 134Cs in theupper 3 cm humus layer in Finland and northwest Rus-sia in 2000 (Figures 3·16 and 3·17) found 134Cs (fromthe first plume) from the Chernobyl accident could stillbe detected in southern Finland and near St Petersburg.The presence of 134Cs suggests that the elevated 137Cslevels in this area are also due to the Chernobyl accident.Paatero et al. (2002) found a similar pattern to that ofthe humus survey for Chernobyl-derived Pu fallout inFinland.
Activity concentrations of 9 to 32 Bq/m2 were foundfor 239,240Pu in surface vegetation and in the upper 3 to
5 cm of soils near the coast in northwest Russia andSvalbard between 1993 and 1996. The variation was dueto the type and density of the surface vegetation (Rissa-nen et al., 2001). The 238Pu : 239,240Pu ratio at these sitesand in Franz Josef Land suggests the primary source isglobal fallout.
The time of deposition is critical for Arctic ecosys-tems, particularly for short-term deposition, such asmight occur after an accident. In subarctic areas, snowcover is present for about seven to eight months of theyear, the period during which the land is snow-coveredincreasing with increasing latitude and factors such as
AMAP Assessment 2002: Radioactivity in the Arctic28
5000-11500 (6)
3000-5000 (9)
1000-3000 (52)
300-1000 (76)200-300 (66)150-200 (70)100-150 (116) 50-100 (132)
0-50 (30)
137Cs concentration in humus, Bq/kg dw
3.16
36-78 (6)
18-36 (17)
12-18 (15)
8-12 (25)5-8 (10)3-5 (25)2-3 (21)
0-2 (53)n.d. (385)
134Cs concentration in humus, Bq/kg dw
Figure 3·16. Activity concentrations of 137Cs in theupper 3 cm humus layer (Paatero et al., 2002).Numbers in brackets indicate the number of sam-ples within each concentration range.
Figure 3·17. Activity concentrations of 134Cs in theupper 3 cm humus layer (Paatero et al., 2002).Number in brackets indicate the number of sampleswithin each concentration range.
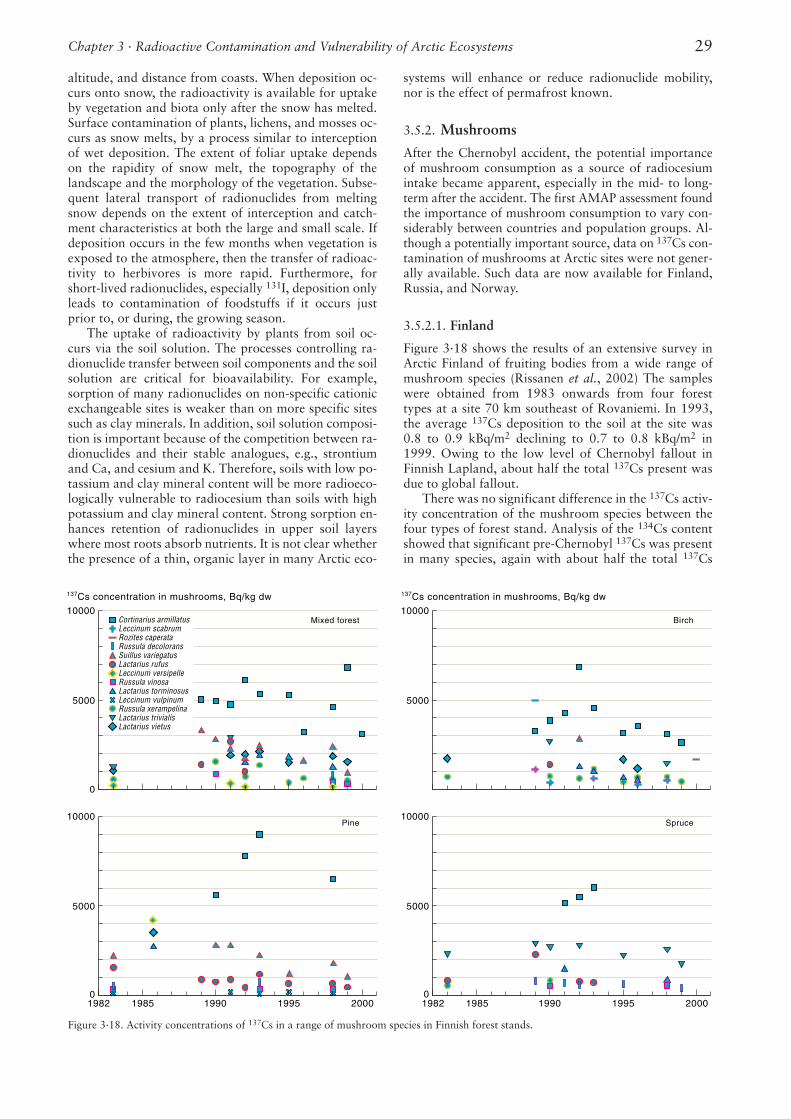
altitude, and distance from coasts. When deposition oc-curs onto snow, the radioactivity is available for uptakeby vegetation and biota only after the snow has melted.Surface contamination of plants, lichens, and mosses oc-curs as snow melts, by a process similar to interceptionof wet deposition. The extent of foliar uptake dependson the rapidity of snow melt, the topography of thelandscape and the morphology of the vegetation. Subse-quent lateral transport of radionuclides from meltingsnow depends on the extent of interception and catch-ment characteristics at both the large and small scale. Ifdeposition occurs in the few months when vegetation isexposed to the atmosphere, then the transfer of radioac-tivity to herbivores is more rapid. Furthermore, forshort-lived radionuclides, especially 131I, deposition onlyleads to contamination of foodstuffs if it occurs justprior to, or during, the growing season.
The uptake of radioactivity by plants from soil oc-curs via the soil solution. The processes controlling ra-dionuclide transfer between soil components and the soilsolution are critical for bioavailability. For example,sorption of many radionuclides on non-specific cationicexchangeable sites is weaker than on more specific sitessuch as clay minerals. In addition, soil solution composi-tion is important because of the competition between ra-dionuclides and their stable analogues, e.g., strontiumand Ca, and cesium and K. Therefore, soils with low po-tassium and clay mineral content will be more radioeco-logically vulnerable to radiocesium than soils with highpotassium and clay mineral content. Strong sorption en-hances retention of radionuclides in upper soil layerswhere most roots absorb nutrients. It is not clear whetherthe presence of a thin, organic layer in many Arctic eco-
systems will enhance or reduce radionuclide mobility,nor is the effect of permafrost known.
3.5.2. Mushrooms
After the Chernobyl accident, the potential importanceof mushroom consumption as a source of radiocesiumintake became apparent, especially in the mid- to long-term after the accident. The first AMAP assessment foundthe importance of mushroom consumption to vary con-siderably between countries and population groups. Al-though a potentially important source, data on 137Cs con-tamination of mushrooms at Arctic sites were not gener-ally available. Such data are now available for Finland,Russia, and Norway.
3.5.2.1. Finland
Figure 3·18 shows the results of an extensive survey inArctic Finland of fruiting bodies from a wide range ofmushroom species (Rissanen et al., 2002) The sampleswere obtained from 1983 onwards from four foresttypes at a site 70 km southeast of Rovaniemi. In 1993,the average 137Cs deposition to the soil at the site was0.8 to 0.9 kBq/m2 declining to 0.7 to 0.8 kBq/m2 in1999. Owing to the low level of Chernobyl fallout inFinnish Lapland, about half the total 137Cs present wasdue to global fallout.
There was no significant difference in the 137Cs activ-ity concentration of the mushroom species between thefour types of forest stand. Analysis of the 134Cs contentshowed that significant pre-Chernobyl 137Cs was presentin many species, again with about half the total 137Cs
Chapter 3 · Radioactive Contamination and Vulnerability of Arctic Ecosystems 29
Cortinarius armillatusLeccinum scabrumRozites caperataRussula decoloransSuillus variegatusLactarius rufusLeccinum versipelleRussula vinosaLactarius torminosusLeccinum vulpinumRussula xerampelinaLactarius trivialisLactarius vietus
10000
5000
0
10000
5000
0
10000
5000
10000
5000
01982 1985 1990 1995 2000 1982 1985 1990 1995 2000
137Cs concentration in mushrooms, Bq/kg dw 137Cs concentration in mushrooms, Bq/kg dw
Mixed forest
Pine
Birch
Spruce
Figure 3·18. Activity concentrations of 137Cs in a range of mushroom species in Finnish forest stands.
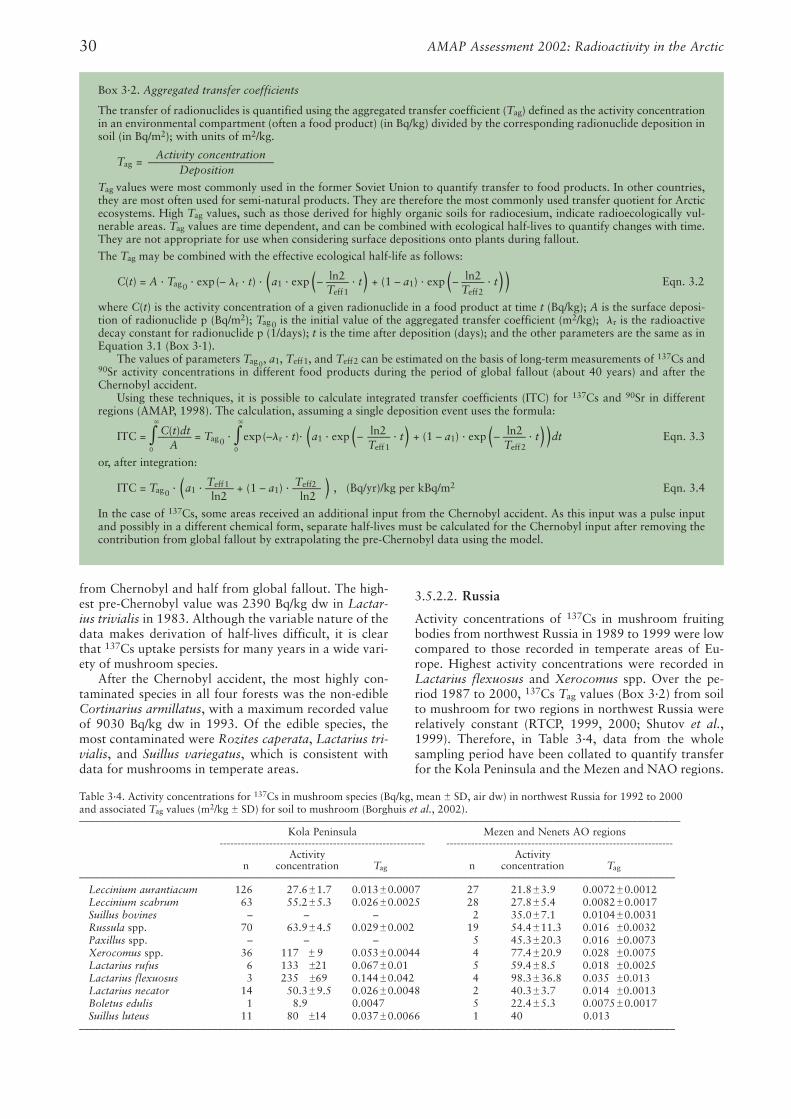
from Chernobyl and half from global fallout. The high-est pre-Chernobyl value was 2390 Bq/kg dw in Lactar-ius trivialis in 1983. Although the variable nature of thedata makes derivation of half-lives difficult, it is clearthat 137Cs uptake persists for many years in a wide vari-ety of mushroom species.
After the Chernobyl accident, the most highly con-taminated species in all four forests was the non-edibleCortinarius armillatus, with a maximum recorded valueof 9030 Bq/kg dw in 1993. Of the edible species, themost contaminated were Rozites caperata, Lactarius tri-vialis, and Suillus variegatus, which is consistent withdata for mushrooms in temperate areas.
3.5.2.2. Russia
Activity concentrations of 137Cs in mushroom fruitingbodies from northwest Russia in 1989 to 1999 were lowcompared to those recorded in temperate areas of Eu-rope. Highest activity concentrations were recorded inLactarius flexuosus and Xerocomus spp. Over the pe-riod 1987 to 2000, 137Cs Tag values (Box 3·2) from soilto mushroom for two regions in northwest Russia wererelatively constant (RTCP, 1999, 2000; Shutov et al.,1999). Therefore, in Table 3·4, data from the wholesampling period have been collated to quantify transferfor the Kola Peninsula and the Mezen and NAO regions.
AMAP Assessment 2002: Radioactivity in the Arctic30
Box 3·2. Aggregated transfer coefficients
The transfer of radionuclides is quantified using the aggregated transfer coefficient (Tag) defined as the activity concentrationin an environmental compartment (often a food product) (in Bq/kg) divided by the corresponding radionuclide deposition insoil (in Bq/m2); with units of m2/kg.
Activity concentrationTag = ––––––––––––––––––––––
Deposition
Tag values were most commonly used in the former Soviet Union to quantify transfer to food products. In other countries,they are most often used for semi-natural products. They are therefore the most commonly used transfer quotient for Arcticecosystems. High Tag values, such as those derived for highly organic soils for radiocesium, indicate radioecologically vul-nerable areas. Tag values are time dependent, and can be combined with ecological half-lives to quantify changes with time.They are not appropriate for use when considering surface depositions onto plants during fallout.
The Tag may be combined with the effective ecological half-life as follows:
ln2 ln2C(t) = A · Tag0 · exp(– �r · t) · (a1 · exp(– –––– · t) + (1 – a1) · exp(– –––– · t)) Eqn. 3.2Teff1 Teff2
where C(t) is the activity concentration of a given radionuclide in a food product at time t (Bq/kg); A is the surface deposi-tion of radionuclide p (Bq/m2); Tag0 is the initial value of the aggregated transfer coefficient (m2/kg); �r is the radioactivedecay constant for radionuclide p (1/days); t is the time after deposition (days); and the other parameters are the same as inEquation 3.1 (Box 3·1).
The values of parameters Tag0, a1, Teff1, and Teff2 can be estimated on the basis of long-term measurements of 137Cs and90Sr activity concentrations in different food products during the period of global fallout (about 40 years) and after theChernobyl accident.
Using these techniques, it is possible to calculate integrated transfer coefficients (ITC) for 137Cs and 90Sr in differentregions (AMAP, 1998). The calculation, assuming a single deposition event uses the formula:
�C(t)dt
�ln2 ln2ITC = �–––––– = Tag0 · �exp(–�r · t)· (a1 · exp(– –––– · t) + (1 – a1) · exp(– –––– · t))dt Eqn. 3.3
0 A 0 Teff1 Teff2
or, after integration:
Teff1 Teff2ITC = Tag0 · (a1 · ––––– + (1 – a1) · ––––– ) , (Bq/yr)/kg per kBq/m2 Eqn. 3.4ln2 ln2
In the case of 137Cs, some areas received an additional input from the Chernobyl accident. As this input was a pulse inputand possibly in a different chemical form, separate half-lives must be calculated for the Chernobyl input after removing thecontribution from global fallout by extrapolating the pre-Chernobyl data using the model.
Table 3·4. Activity concentrations for 137Cs in mushroom species (Bq/kg, mean ± SD, air dw) in northwest Russia for 1992 to 2000and associated Tag values (m2/kg ± SD) for soil to mushroom (Borghuis et al., 2002).–––––––––––––––––––––––––––––––––––––––––––––––––––––––––––––––––––––––––––––––––––––––––––––––––––––––––––––––––
Kola Peninsula Mezen and Nenets AO regions---------------------------------------------------------------------------------------------------------------------------------------------------------------------
Activity Activityn concentration Tag n concentration Tag
––––––––––––––––––––––––––––––––––––––––––––––––––––––––––––––––––––––––––––––––––––––––––––––––––––––––––––––––Leccinium aurantiacum 126 27.6±1.7 0.013±0.0007 27 21.8±3.9 0.0072±0.0012Leccinium scabrum 63 55.2±5.3 0.026±0.0025 28 27.8±5.4 0.0082±0.0017Suillus bovines – – – 2 35.0±7.1 0.0104±0.0031Russula spp. 70 63.9±4.5 0.029±0.002 19 54.4±11.3 0.016 ±0.0032Paxillus spp. – – – 5 45.3±20.3 0.016 ±0.0073Xerocomus spp. 36 117 ± 9 0.053±0.0044 4 77.4±20.9 0.028 ±0.0075Lactarius rufus 6 133 ±21 0.067±0.01 5 59.4±8.5 0.018 ±0.0025Lactarius flexuosus 3 235 ±69 0.144±0.042 4 98.3±36.8 0.035 ±0.013Lactarius necator 14 50.3±9.5 0.026±0.0048 2 40.3±3.7 0.014 ±0.0013Boletus edulis 1 8.9 0.0047 5 22.4±5.3 0.0075±0.0017Suillus luteus 11 80 ±14 0.037±0.0066 1 40.0 0.0130000.
––––––––––––––––––––––––––––––––––––––––––––––––––––––––––––––––––––––––––––––––––––––––––––––––––––––––––––––––

The average 137Cs Tag values from soil to mushroom onthe Kola Peninsula were significantly higher than for theNAO region (P = 0.00024, Table 3·4 and Figure 3·19).
3.5.2.3. Norway
Activity concentrations of 137Cs in mushroom speciesfrom Troms and Finnmark collected in 1998 to 1999 aregiven in Table 3·5. Activity concentrations vary signifi-cantly between species. The activity concentration inspecies such as Rozites caperata, which is known to ac-
cumulate cesium, was a factor of ten to fifteen higherthan in Leccinum spp. The activity concentration of137Cs in fungi with a high cesium transfer was about 500times higher than in plant species from the same site,whereas the factor was approximately 50 for fungi witha moderate transfer.
The Tag values also varied between the different spe-cies. Species with a known high uptake of 137Cs had aten-fold higher Tag value for 137Cs than those with alower uptake.
Overall, the data indicate lower activity concentra-tions in Arctic mushroom species than in those fromnearby temperate areas of NW Europe due to the lowlevels of global and Chernobyl fallout in most of theareas sampled. Nevertheless, the 137Cs activity concen-trations are higher in mushrooms than in many otherArctic foodstuffs. There is, however, evidence of largeTag values. Although activity concentrations in the mostcontaminated species vary between areas, the data arenot directly comparable as different weight bases havebeen used.
3.5.3. Berries
Activity concentrations of 137Cs in the berries of cloud-berry (Rubus chamaemorus), bilberry (Vaccinium myr-tillus), and cowberry (Vaccinium vitis-idaea) were meas-ured at four sites in Lapland. In 1980 to 1981, beforethe Chernobyl accident, 137Cs activity concentrations atKittilä were 25 to 45 Bq/kg ww in cloudberry, 11 to 19Bq/kg ww in bilberry, and 6 to 22 Bq/kg ww in cowberry(Rissanen et al., 1987). Sufficient data were available atone of the four sites, Salla-Kuusamo, to indicate a slowchange in concentration since the Chernobyl accident(Figure 3·20) and higher 137Cs activity concentrations incloudberry berries than in those of bilberry or cowberry.
The range in activity concentrations in these speciesat the four sites in Lapland since the Chernobyl accidentis shown in Table 3·6. Despite the difficulties in compar-ing data with some time dependency after the Chernobylaccident, the sampling frequencies for the four speciesare sufficiently similar to conclude that there are differ-ences between the species and that cloudberry is themost contaminated.
Chapter 3 · Radioactive Contamination and Vulnerability of Arctic Ecosystems 31
1000
100
10
Lecc
iniu
m a
uran
tiacu
mB
olet
us e
dulis
Lecc
iniu
m s
cabr
umS
uillu
s bo
vine
sS
uillu
s lu
teus
Lact
ariu
s ne
cato
rP
axill
us s
pp.
Rus
sula
spp
.La
ctar
ius
rufu
sX
eroc
omus
spp
.
Lact
ariu
s fle
xuos
us
137Cs concentration in mushrooms, Bq/kg dw
Kola PeninsulaMezen and Nenets AO
50
40
30
20
10
02000199519901985
Cloudberry
Bilberry
Cowberry
137Cs concentration in berries, Bq/kg ww
Table 3·6. Range in 137Cs activity concentrations (Bq/kg ww) forberry species in Lapland for 1986 to 2001 (Rissanen, pers. comm.,2002).––––––––––––––––––––––––––––––––––––––––––––––––––––––––––
Rovaniemi Inari Salla-Kuusamo Kittilä––––––––––––––––––––––––––––––––––––––––––––––––––––––––––
Cloudberry 30-63 16-31 21-49 30-38Bilberry 6-15 2-9 5-13 10-16Cowberry 4-25 2-7 4-8 2-12
––––––––––––––––––––––––––––––––––––––––––––––––––––––––––
Figure 3·19. Activity concentrations of 137Cs in various mushroomspecies from the Kola Peninsula and the Mezen and Nenets AO re-gions (Borghuis et al., 2002).
Figure 3·20. Changes over time in 137Cs activity concentrations inthree species of berries at Salla-Kuusamo in Lapland, Finland (Ris-sanen et al., 1987).
Table 3·5. Activity concentrations for 137Cs in mushroom species(Bq/kg dw ± SD) in Arctic Norway for 1998 to 1999 and corre-sponding Tag values (m2/kg ± SD) for soil to mushroom (Salbu, pers.comm., 2001).––––––––––––––––––––––––––––––––––––––––––––––––––––––––––
Activityn concentration Tag
–––––––––––––––––––––––––––––––––––––––––––––––––––––––––– Boletus edulis 1 2097 2.17Leccinum spp. 2 354±175 0.37±0.14Rhozites caperata 4 3929±3557 4.38±4.47Russula spp. 5 595±417 0.48±0.43
––––––––––––––––––––––––––––––––––––––––––––––––––––––––––
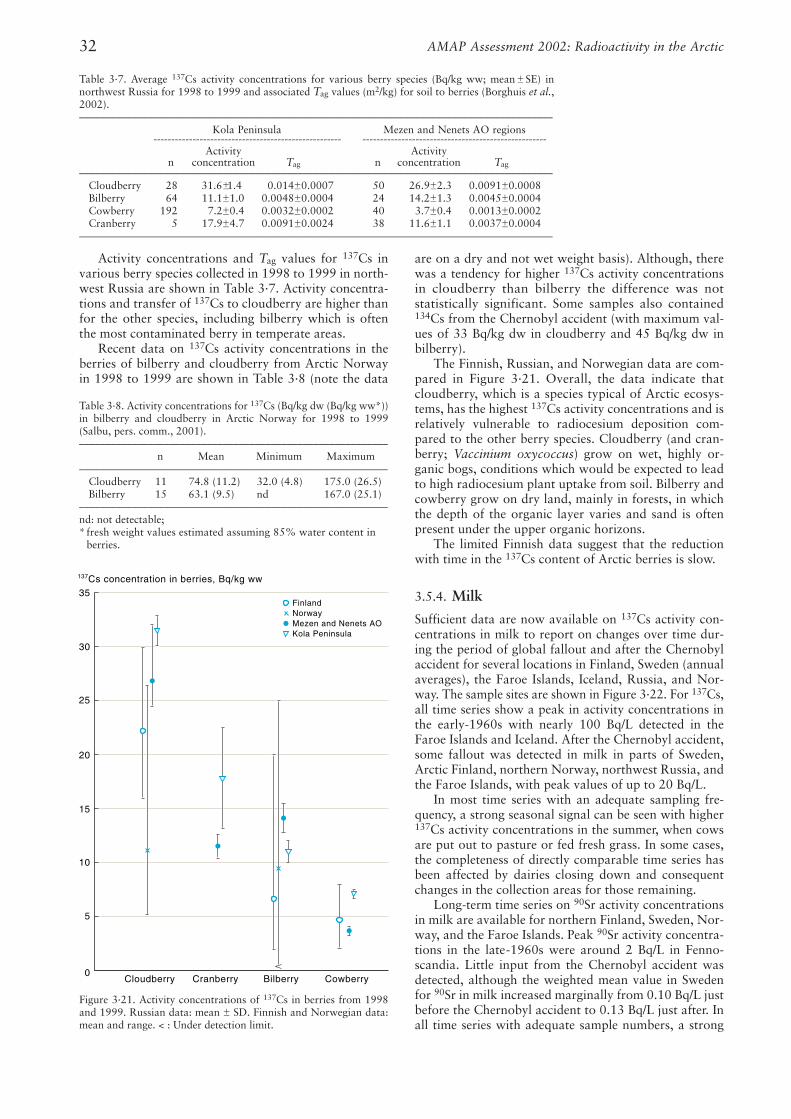
Activity concentrations and Tag values for 137Cs invarious berry species collected in 1998 to 1999 in north-west Russia are shown in Table 3·7. Activity concentra-tions and transfer of 137Cs to cloudberry are higher thanfor the other species, including bilberry which is oftenthe most contaminated berry in temperate areas.
Recent data on 137Cs activity concentrations in theberries of bilberry and cloudberry from Arctic Norwayin 1998 to 1999 are shown in Table 3·8 (note the data
are on a dry and not wet weight basis). Although, therewas a tendency for higher 137Cs activity concentrationsin cloudberry than bilberry the difference was notstatistically significant. Some samples also contained134Cs from the Chernobyl accident (with maximum val-ues of 33 Bq/kg dw in cloudberry and 45 Bq/kg dw inbilberry).
The Finnish, Russian, and Norwegian data are com-pared in Figure 3·21. Overall, the data indicate thatcloudberry, which is a species typical of Arctic ecosys-tems, has the highest 137Cs activity concentrations and isrelatively vulnerable to radiocesium deposition com-pared to the other berry species. Cloudberry (and cran-berry; Vaccinium oxycoccus) grow on wet, highly or-ganic bogs, conditions which would be expected to leadto high radiocesium plant uptake from soil. Bilberry andcowberry grow on dry land, mainly in forests, in whichthe depth of the organic layer varies and sand is oftenpresent under the upper organic horizons.
The limited Finnish data suggest that the reductionwith time in the 137Cs content of Arctic berries is slow.
3.5.4. Milk
Sufficient data are now available on 137Cs activity con-centrations in milk to report on changes over time dur-ing the period of global fallout and after the Chernobylaccident for several locations in Finland, Sweden (annualaverages), the Faroe Islands, Iceland, Russia, and Nor-way. The sample sites are shown in Figure 3·22. For 137Cs,all time series show a peak in activity concentrations inthe early-1960s with nearly 100 Bq/L detected in theFaroe Islands and Iceland. After the Chernobyl accident,some fallout was detected in milk in parts of Sweden,Arctic Finland, northern Norway, northwest Russia, andthe Faroe Islands, with peak values of up to 20 Bq/L.
In most time series with an adequate sampling fre-quency, a strong seasonal signal can be seen with higher137Cs activity concentrations in the summer, when cowsare put out to pasture or fed fresh grass. In some cases,the completeness of directly comparable time series hasbeen affected by dairies closing down and consequentchanges in the collection areas for those remaining.
Long-term time series on 90Sr activity concentrationsin milk are available for northern Finland, Sweden, Nor-way, and the Faroe Islands. Peak 90Sr activity concentra-tions in the late-1960s were around 2 Bq/L in Fenno-scandia. Little input from the Chernobyl accident wasdetected, although the weighted mean value in Swedenfor 90Sr in milk increased marginally from 0.10 Bq/L justbefore the Chernobyl accident to 0.13 Bq/L just after. Inall time series with adequate sample numbers, a strong
AMAP Assessment 2002: Radioactivity in the Arctic32
Table 3·8. Activity concentrations for 137Cs (Bq/kg dw (Bq/kg ww*))in bilberry and cloudberry in Arctic Norway for 1998 to 1999(Salbu, pers. comm., 2001).––––––––––––––––––––––––––––––––––––––––––––––––––––––––––
n Mean Minimum Maximum––––––––––––––––––––––––––––––––––––––––––––––––––––––––––
Cloudberry 11 74.8 (11.2) 32.0 (4.8) 175.0 (26.5)Bilberry 15 63.1 (9.5) nd 167.0 (25.1)
––––––––––––––––––––––––––––––––––––––––––––––––––––––––––nd: not detectable; * fresh weight values estimated assuming 85% water content in
berries.
35
30
25
20
15
10
5
0Cloudberry Cranberry Bilberry Cowberry
137Cs concentration in berries, Bq/kg ww
FinlandNorwayMezen and Nenets AOKola Peninsula
Figure 3·21. Activity concentrations of 137Cs in berries from 1998and 1999. Russian data: mean ± SD. Finnish and Norwegian data:mean and range. < : Under detection limit.
Table 3·7. Average 137Cs activity concentrations for various berry species (Bq/kg ww; mean ± SE) innorthwest Russia for 1998 to 1999 and associated Tag values (m2/kg) for soil to berries (Borghuis et al.,2002).–––––––––––––––––––––––––––––––––––––––––––––––––––––––––––––––––––––––––––––––––––––––––
Kola Peninsula Mezen and Nenets AO regions------------------------------------------------------------------------------------------------------------------------------------
Activity Activityn concentration Tag n concentration Tag
–––––––––––––––––––––––––––––––––––––––––––––––––––––––––––––––––––––––––––––––––––––––––Cloudberry 28 31.6±1.4 0.014±0.0007 50 26.9±2.3 0.0091±0.0008Bilberry 64 11.1±1.0 0.0048±0.0004 24 14.2±1.3 0.0045±0.0004Cowberry 192 7.2±0.4 0.0032±0.0002 40 3.7±0.4 0.0013±0.0002Cranberry 5 17.9±4.7 0.0091±0.0024 38 11.6±1.1 0.0037±0.0004
–––––––––––––––––––––––––––––––––––––––––––––––––––––––––––––––––––––––––––––––––––––––––
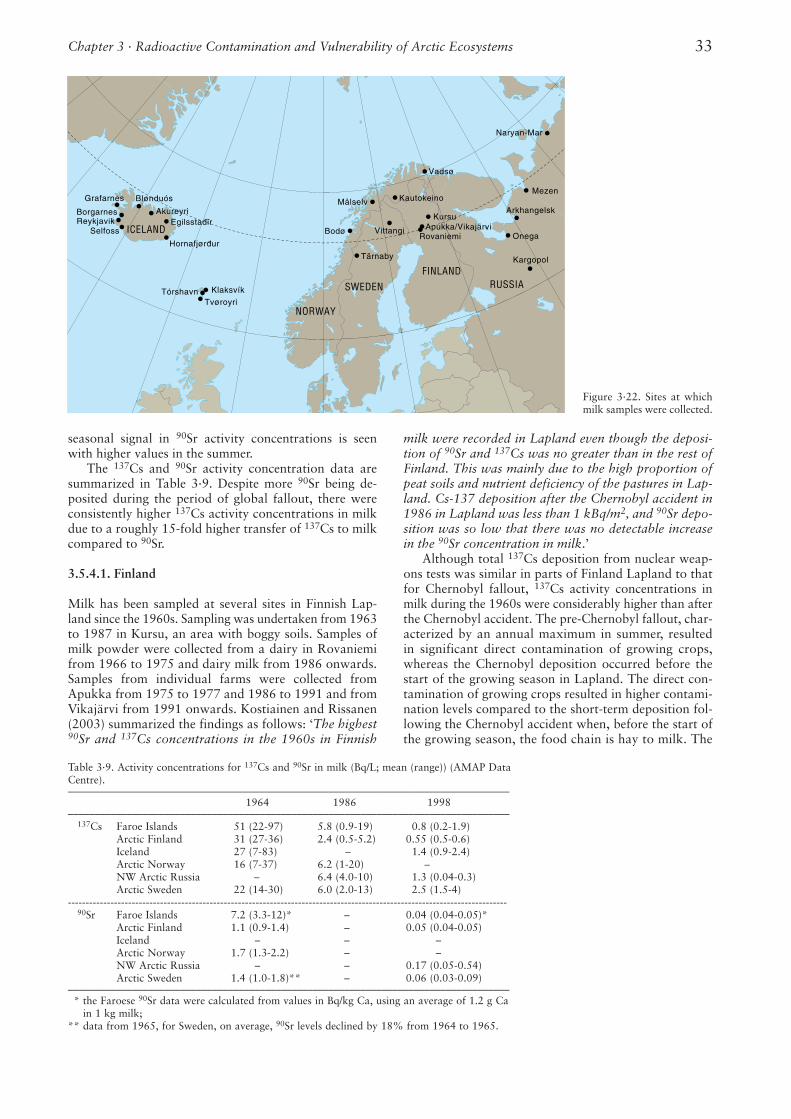
seasonal signal in 90Sr activity concentrations is seenwith higher values in the summer.
The 137Cs and 90Sr activity concentration data aresummarized in Table 3·9. Despite more 90Sr being de-posited during the period of global fallout, there wereconsistently higher 137Cs activity concentrations in milkdue to a roughly 15-fold higher transfer of 137Cs to milkcompared to 90Sr.
3.5.4.1. Finland
Milk has been sampled at several sites in Finnish Lap-land since the 1960s. Sampling was undertaken from 1963to 1987 in Kursu, an area with boggy soils. Samples ofmilk powder were collected from a dairy in Rovaniemifrom 1966 to 1975 and dairy milk from 1986 onwards.Samples from individual farms were collected fromApukka from 1975 to 1977 and 1986 to 1991 and fromVikajärvi from 1991 onwards. Kostiainen and Rissanen(2003) summarized the findings as follows: ‘The highest90Sr and 137Cs concentrations in the 1960s in Finnish
milk were recorded in Lapland even though the deposi-tion of 90Sr and 137Cs was no greater than in the rest ofFinland. This was mainly due to the high proportion ofpeat soils and nutrient deficiency of the pastures in Lap-land. Cs-137 deposition after the Chernobyl accident in1986 in Lapland was less than 1 kBq/m2, and 90Sr depo-sition was so low that there was no detectable increasein the 90Sr concentration in milk.’
Although total 137Cs deposition from nuclear weap-ons tests was similar in parts of Finland Lapland to thatfor Chernobyl fallout, 137Cs activity concentrations inmilk during the 1960s were considerably higher than afterthe Chernobyl accident. The pre-Chernobyl fallout, char-acterized by an annual maximum in summer, resultedin significant direct contamination of growing crops,whereas the Chernobyl deposition occurred before thestart of the growing season in Lapland. The direct con-tamination of growing crops resulted in higher contami-nation levels compared to the short-term deposition fol-lowing the Chernobyl accident when, before the start ofthe growing season, the food chain is hay to milk. The
Chapter 3 · Radioactive Contamination and Vulnerability of Arctic Ecosystems 33
BlønduósGrafarnes
Klaksvík
TvøroyriTórshavn
Bodø
Målselv
Naryan-Mar
Vadsø
Onega
Mezen
Arkhangelsk
Kautokeino
KursuApukka/Vikajärvi
Rovaniemi
Kargopol
Vittangi
Tärnaby
AkureyriBorgarnesReykjavik
Selfoss ICELAND
NORWAY
SWEDEN
FINLANDRUSSIA
Egilsstadir
Hornafjørdur
Figure 3·22. Sites at whichmilk samples were collected.
Table 3·9. Activity concentrations for 137Cs and 90Sr in milk (Bq/L; mean (range)) (AMAP DataCentre).–––––––––––––––––––––––––––––––––––––––––––––––––––––––––––––––––––––––––––––––––––
1964 1986 1998–––––––––––––––––––––––––––––––––––––––––––––––––––––––––––––––––––––––––––––––––––
137Cs Faroe Islands 51 (22-97) 5.8 (0.9-19) 0.8 (0.2-1.9)Arctic Finland 31 (27-36) 2.4 (0.5-5.2) 0.55 (0.5-0.6)Iceland 27 (7-83) – 1.4 (0.9-2.4)Arctic Norway 16 (7-37) 6.2 (1-20) –NW Arctic Russia – 6.4 (4.0-10) 1.3 (0.04-0.3)Arctic Sweden 22 (14-30) 6.0 (2.0-13) 2.5 (1.5-4)
----------------------------------------------------------------------------------------------------------------------------90Sr Faroe Islands 7.2 (3.3-12)* – 0.04 (0.04-0.05)*
Arctic Finland 1.1 (0.9-1.4) – 0.05 (0.04-0.05)Iceland – – –Arctic Norway 1.7 (1.3-2.2) – –NW Arctic Russia – – 0.17 (0.05-0.54)Arctic Sweden 1.4 (1.0-1.8)** – 0.06 (0.03-0.09)
–––––––––––––––––––––––––––––––––––––––––––––––––––––––––––––––––––––––––––––––––––** the Faroese 90Sr data were calculated from values in Bq/kg Ca, using an average of 1.2 g Ca
in 1 kg milk; ** data from 1965, for Sweden, on average, 90Sr levels declined by 18% from 1964 to 1965.
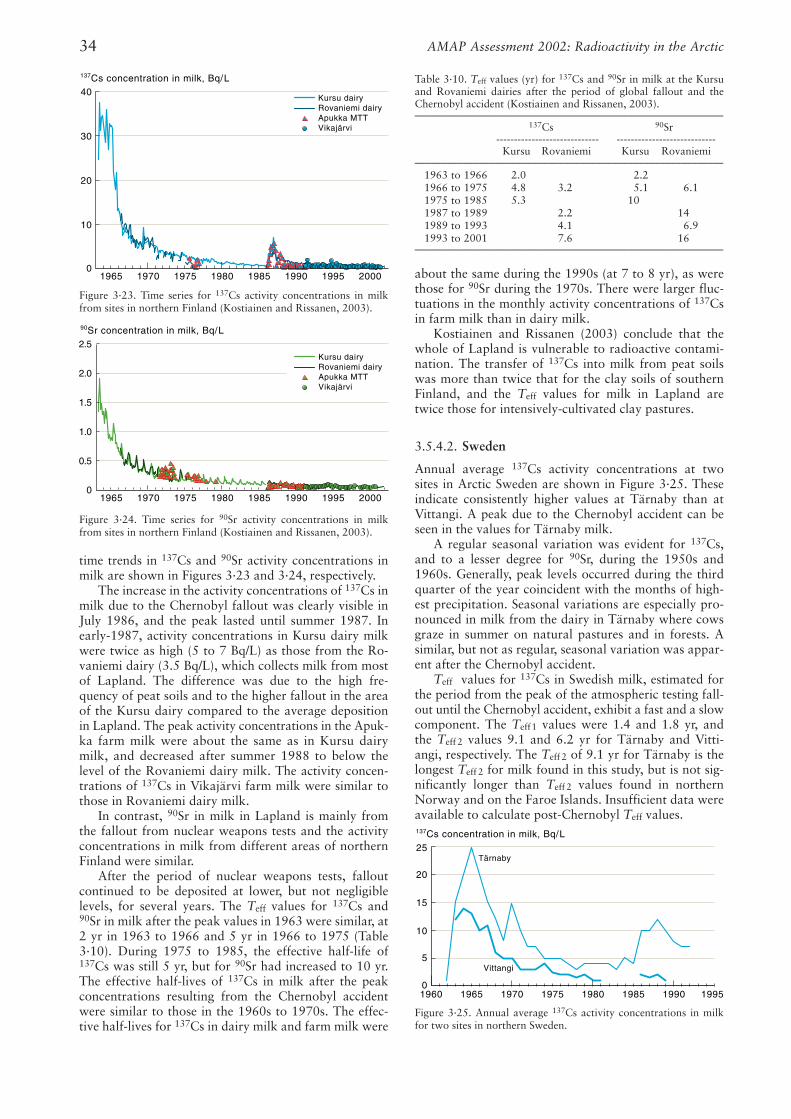
time trends in 137Cs and 90Sr activity concentrations inmilk are shown in Figures 3·23 and 3·24, respectively.
The increase in the activity concentrations of 137Cs inmilk due to the Chernobyl fallout was clearly visible inJuly 1986, and the peak lasted until summer 1987. Inearly-1987, activity concentrations in Kursu dairy milkwere twice as high (5 to 7 Bq/L) as those from the Ro-vaniemi dairy (3.5 Bq/L), which collects milk from mostof Lapland. The difference was due to the high fre-quency of peat soils and to the higher fallout in the areaof the Kursu dairy compared to the average depositionin Lapland. The peak activity concentrations in the Apuk-ka farm milk were about the same as in Kursu dairymilk, and decreased after summer 1988 to below thelevel of the Rovaniemi dairy milk. The activity concen-trations of 137Cs in Vikajärvi farm milk were similar tothose in Rovaniemi dairy milk.
In contrast, 90Sr in milk in Lapland is mainly fromthe fallout from nuclear weapons tests and the activityconcentrations in milk from different areas of northernFinland were similar.
After the period of nuclear weapons tests, falloutcontinued to be deposited at lower, but not negligiblelevels, for several years. The Teff values for 137Cs and90Sr in milk after the peak values in 1963 were similar, at2 yr in 1963 to 1966 and 5 yr in 1966 to 1975 (Table3·10). During 1975 to 1985, the effective half-life of137Cs was still 5 yr, but for 90Sr had increased to 10 yr.The effective half-lives of 137Cs in milk after the peakconcentrations resulting from the Chernobyl accidentwere similar to those in the 1960s to 1970s. The effec-tive half-lives for 137Cs in dairy milk and farm milk were
about the same during the 1990s (at 7 to 8 yr), as werethose for 90Sr during the 1970s. There were larger fluc-tuations in the monthly activity concentrations of 137Csin farm milk than in dairy milk.
Kostiainen and Rissanen (2003) conclude that thewhole of Lapland is vulnerable to radioactive contami-nation. The transfer of 137Cs into milk from peat soilswas more than twice that for the clay soils of southernFinland, and the Teff values for milk in Lapland aretwice those for intensively-cultivated clay pastures.
3.5.4.2. Sweden
Annual average 137Cs activity concentrations at twosites in Arctic Sweden are shown in Figure 3·25. Theseindicate consistently higher values at Tärnaby than atVittangi. A peak due to the Chernobyl accident can beseen in the values for Tärnaby milk.
A regular seasonal variation was evident for 137Cs,and to a lesser degree for 90Sr, during the 1950s and1960s. Generally, peak levels occurred during the thirdquarter of the year coincident with the months of high-est precipitation. Seasonal variations are especially pro-nounced in milk from the dairy in Tärnaby where cowsgraze in summer on natural pastures and in forests. Asimilar, but not as regular, seasonal variation was appar-ent after the Chernobyl accident.
Teff values for 137Cs in Swedish milk, estimated forthe period from the peak of the atmospheric testing fall-out until the Chernobyl accident, exhibit a fast and a slowcomponent. The Teff1 values were 1.4 and 1.8 yr, andthe Teff 2 values 9.1 and 6.2 yr for Tärnaby and Vitti-angi, respectively. The Teff 2 of 9.1 yr for Tärnaby is thelongest Teff 2 for milk found in this study, but is not sig-nificantly longer than Teff 2 values found in northernNorway and on the Faroe Islands. Insufficient data wereavailable to calculate post-Chernobyl Teff values.
AMAP Assessment 2002: Radioactivity in the Arctic34
25
20
15
10
5
019951990198519801975197019651960
Tärnaby
Vittangi
137Cs concentration in milk, Bq/L
1965 1970 1975 1980 1985 1990 1995 2000
40
30
20
10
0
Kursu dairyRovaniemi dairyApukka MTTVikajärvi
137Cs concentration in milk, Bq/L
Figure 3·23. Time series for 137Cs activity concentrations in milkfrom sites in northern Finland (Kostiainen and Rissanen, 2003).
Table 3·10. Teff values (yr) for 137Cs and 90Sr in milk at the Kursuand Rovaniemi dairies after the period of global fallout and theChernobyl accident (Kostiainen and Rissanen, 2003). ––––––––––––––––––––––––––––––––––––––––––––––––––––––––––
137Cs 90Sr-------------------------------------------------------------------------------------
Kursu Rovaniemi Kursu Rovaniemi––––––––––––––––––––––––––––––––––––––––––––––––––––––––––
1963 to 1966 2.0 2.21966 to 1975 4.8 3.2 5.1 6.11975 to 1985 5.3 101987 to 1989 2.2 141989 to 1993 4.1 6.91993 to 2001 7.6 16
––––––––––––––––––––––––––––––––––––––––––––––––––––––––––
1965 1970 1975 1980 1985 1990 1995 2000
2.5
2.0
1.5
1.0
0.5
0
90Sr concentration in milk, Bq/L
Kursu dairyRovaniemi dairyApukka MTTVikajärvi
Figure 3·24. Time series for 90Sr activity concentrations in milkfrom sites in northern Finland (Kostiainen and Rissanen, 2003).
Figure 3·25. Annual average 137Cs activity concentrations in milkfor two sites in northern Sweden.
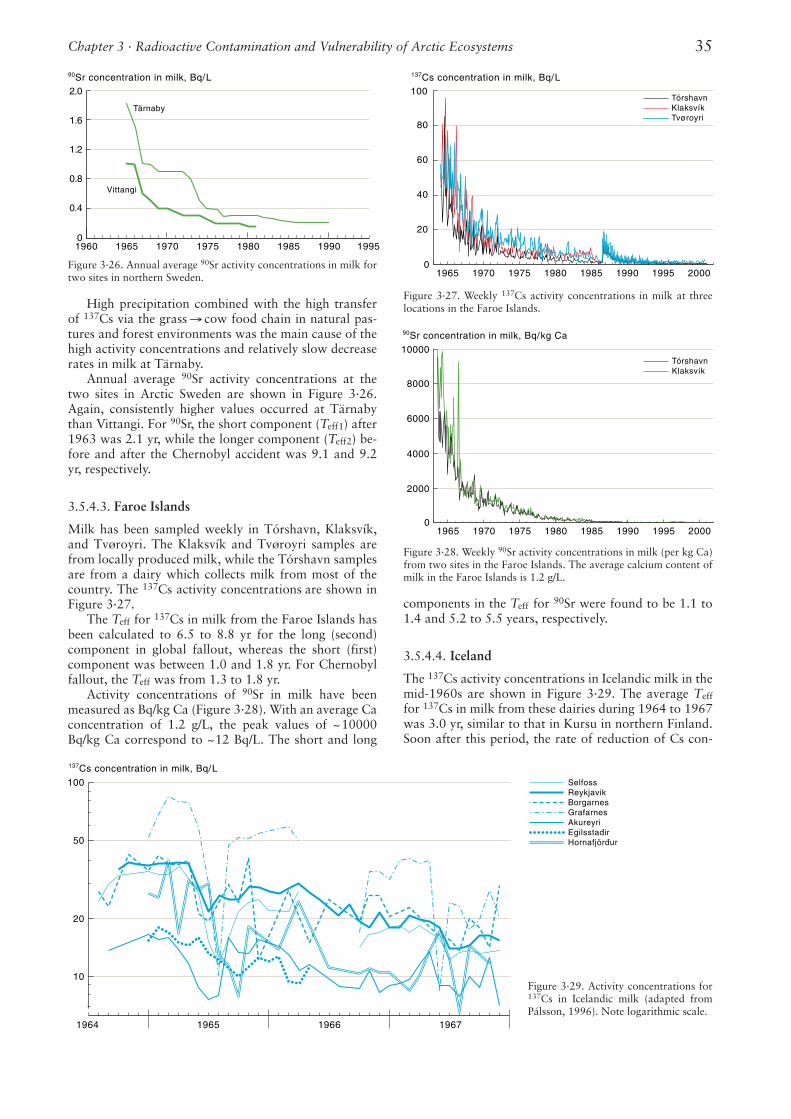
High precipitation combined with the high transferof 137Cs via the grass → cow food chain in natural pas-tures and forest environments was the main cause of thehigh activity concentrations and relatively slow decreaserates in milk at Tärnaby.
Annual average 90Sr activity concentrations at thetwo sites in Arctic Sweden are shown in Figure 3·26.Again, consistently higher values occurred at Tärnabythan Vittangi. For 90Sr, the short component (Teff1) after1963 was 2.1 yr, while the longer component (Teff2) be-fore and after the Chernobyl accident was 9.1 and 9.2yr, respectively.
3.5.4.3. Faroe Islands
Milk has been sampled weekly in Tórshavn, Klaksvík,and Tvøroyri. The Klaksvík and Tvøroyri samples arefrom locally produced milk, while the Tórshavn samplesare from a dairy which collects milk from most of thecountry. The 137Cs activity concentrations are shown inFigure 3·27.
The Teff for 137Cs in milk from the Faroe Islands hasbeen calculated to 6.5 to 8.8 yr for the long (second)component in global fallout, whereas the short (first)component was between 1.0 and 1.8 yr. For Chernobylfallout, the Teff was from 1.3 to 1.8 yr.
Activity concentrations of 90Sr in milk have beenmeasured as Bq/kg Ca (Figure 3·28). With an average Caconcentration of 1.2 g/L, the peak values of ~10000Bq/kg Ca correspond to ~12 Bq/L. The short and long
components in the Teff for 90Sr were found to be 1.1 to1.4 and 5.2 to 5.5 years, respectively.
3.5.4.4. Iceland
The 137Cs activity concentrations in Icelandic milk in themid-1960s are shown in Figure 3·29. The average Teff
for 137Cs in milk from these dairies during 1964 to 1967was 3.0 yr, similar to that in Kursu in northern Finland.Soon after this period, the rate of reduction of Cs con-
Chapter 3 · Radioactive Contamination and Vulnerability of Arctic Ecosystems 35
2.0
1.6
1.2
0.8
0.4
019951990198519801975197019651960
Tärnaby
Vittangi
90Sr concentration in milk, Bq/L
1965 1970 1975 1980 1985 1990 1995 2000
10000
8000
6000
4000
2000
0
TórshavnKlaksvík
90Sr concentration in milk, Bq/kg Ca
3.28
100
50
20
10
19651964 1966 1967
137Cs concentration in milk, Bq/LSelfossReykjavikBorgarnesGrafarnesAkureyriEgilsstadirHornafjördur
Figure 3·29. Activity concentrations for137Cs in Icelandic milk (adapted fromPálsson, 1996). Note logarithmic scale.
100
80
60
40
20
0
TórshavnKlaksvíkTvøroyri
137Cs concentration in milk, Bq/L
1965 1970 1975 1980 1985 1990 1995 2000
Figure 3·27. Weekly 137Cs activity concentrations in milk at threelocations in the Faroe Islands.
Figure 3·28. Weekly 90Sr activity concentrations in milk (per kg Ca)from two sites in the Faroe Islands. The average calcium content ofmilk in the Faroe Islands is 1.2 g/L.
Figure 3·26. Annual average 90Sr activity concentrations in milk fortwo sites in northern Sweden.
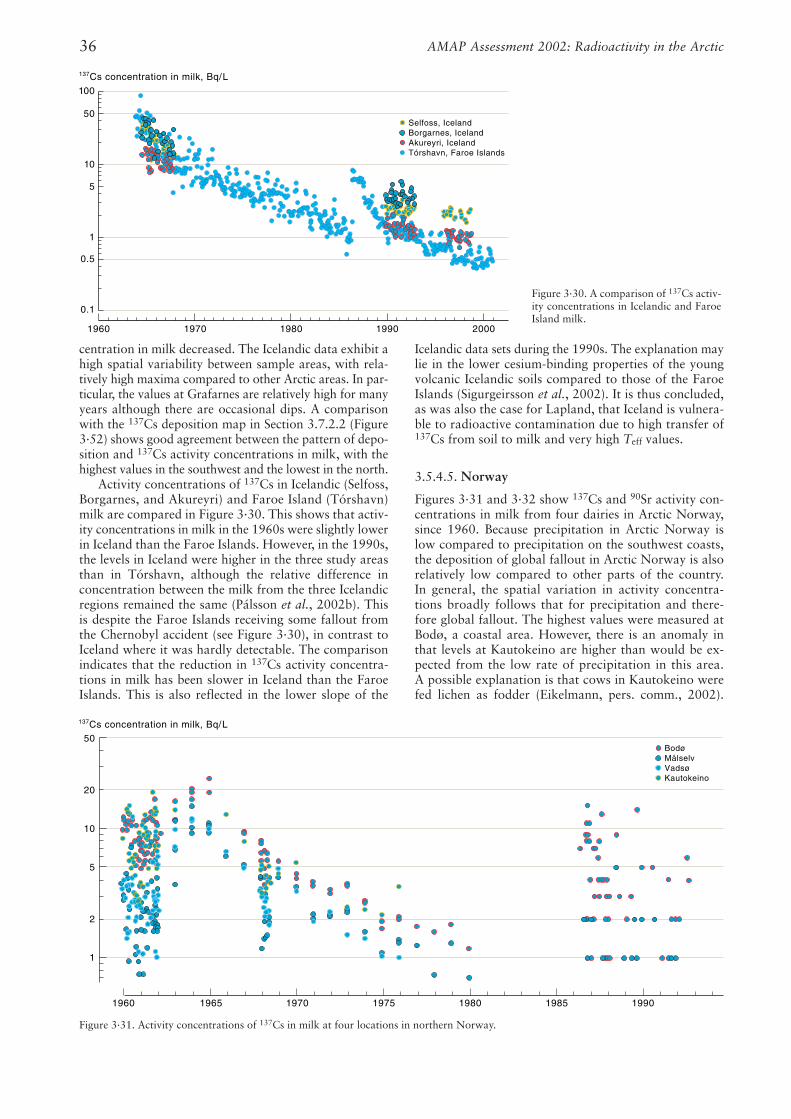
centration in milk decreased. The Icelandic data exhibit ahigh spatial variability between sample areas, with rela-tively high maxima compared to other Arctic areas. In par-ticular, the values at Grafarnes are relatively high for manyyears although there are occasional dips. A comparisonwith the 137Cs deposition map in Section 3.7.2.2 (Figure3·52) shows good agreement between the pattern of depo-sition and 137Cs activity concentrations in milk, with thehighest values in the southwest and the lowest in the north.
Activity concentrations of 137Cs in Icelandic (Selfoss,Borgarnes, and Akureyri) and Faroe Island (Tórshavn)milk are compared in Figure 3·30. This shows that activ-ity concentrations in milk in the 1960s were slightly lowerin Iceland than the Faroe Islands. However, in the 1990s,the levels in Iceland were higher in the three study areasthan in Tórshavn, although the relative difference inconcentration between the milk from the three Icelandicregions remained the same (Pálsson et al., 2002b). Thisis despite the Faroe Islands receiving some fallout fromthe Chernobyl accident (see Figure 3·30), in contrast toIceland where it was hardly detectable. The comparisonindicates that the reduction in 137Cs activity concentra-tions in milk has been slower in Iceland than the FaroeIslands. This is also reflected in the lower slope of the
Icelandic data sets during the 1990s. The explanation maylie in the lower cesium-binding properties of the youngvolcanic Icelandic soils compared to those of the FaroeIslands (Sigurgeirsson et al., 2002). It is thus concluded,as was also the case for Lapland, that Iceland is vulnera-ble to radioactive contamination due to high transfer of137Cs from soil to milk and very high Teff values.
3.5.4.5. Norway
Figures 3·31 and 3·32 show 137Cs and 90Sr activity con-centrations in milk from four dairies in Arctic Norway,since 1960. Because precipitation in Arctic Norway islow compared to precipitation on the southwest coasts,the deposition of global fallout in Arctic Norway is alsorelatively low compared to other parts of the country.In general, the spatial variation in activity concentra-tions broadly follows that for precipitation and there-fore global fallout. The highest values were measured atBodø, a coastal area. However, there is an anomaly inthat levels at Kautokeino are higher than would be ex-pected from the low rate of precipitation in this area.A possible explanation is that cows in Kautokeino werefed lichen as fodder (Eikelmann, pers. comm., 2002).
AMAP Assessment 2002: Radioactivity in the Arctic36
100
50
10
5
1
0.5
0.1
Selfoss, IcelandBorgarnes, IcelandAkureyri, IcelandTórshavn, Faroe Islands
1960 1970 1980 1990 2000
137Cs concentration in milk, Bq/L
50
20
10
5
2
1
137Cs concentration in milk, Bq/L
1960 1970 1980 19901965 1975 1985
BodøMålselvVadsøKautokeino
Figure 3·31. Activity concentrations of 137Cs in milk at four locations in northern Norway.
Figure 3·30. A comparison of 137Cs activ-ity concentrations in Icelandic and FaroeIsland milk.
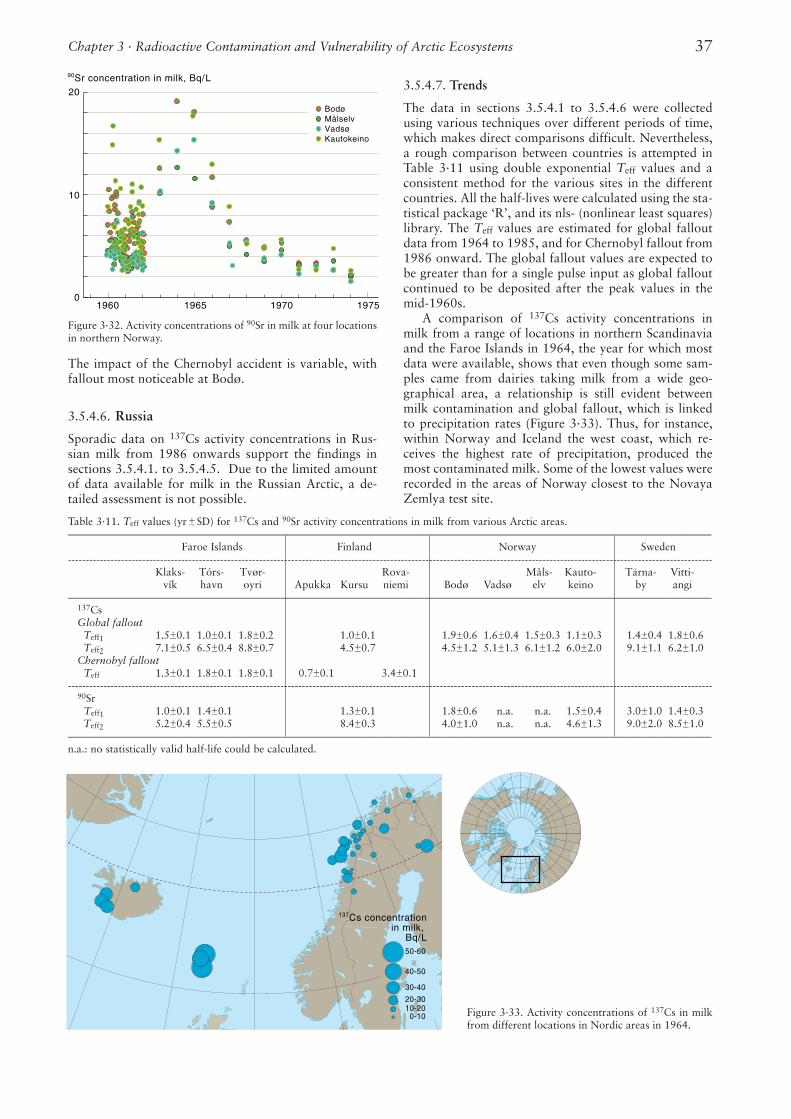
The impact of the Chernobyl accident is variable, withfallout most noticeable at Bodø.
3.5.4.6. Russia
Sporadic data on 137Cs activity concentrations in Rus-sian milk from 1986 onwards support the findings insections 3.5.4.1. to 3.5.4.5. Due to the limited amountof data available for milk in the Russian Arctic, a de-tailed assessment is not possible.
3.5.4.7. Trends
The data in sections 3.5.4.1 to 3.5.4.6 were collectedusing various techniques over different periods of time,which makes direct comparisons difficult. Nevertheless,a rough comparison between countries is attempted inTable 3·11 using double exponential Teff values and aconsistent method for the various sites in the differentcountries. All the half-lives were calculated using the sta-tistical package ‘R’, and its nls- (nonlinear least squares)library. The Teff values are estimated for global falloutdata from 1964 to 1985, and for Chernobyl fallout from1986 onward. The global fallout values are expected tobe greater than for a single pulse input as global falloutcontinued to be deposited after the peak values in themid-1960s.
A comparison of 137Cs activity concentrations inmilk from a range of locations in northern Scandinaviaand the Faroe Islands in 1964, the year for which mostdata were available, shows that even though some sam-ples came from dairies taking milk from a wide geo-graphical area, a relationship is still evident betweenmilk contamination and global fallout, which is linkedto precipitation rates (Figure 3·33). Thus, for instance,within Norway and Iceland the west coast, which re-ceives the highest rate of precipitation, produced themost contaminated milk. Some of the lowest values wererecorded in the areas of Norway closest to the NovayaZemlya test site.
Chapter 3 · Radioactive Contamination and Vulnerability of Arctic Ecosystems 37
20
10
01960 19701965 1975
BodøMålselvVadsøKautokeino
90Sr concentration in milk, Bq/L
50-60
40-50
30-40
20-3010-20
0-10
137Cs concentrationin milk,
Bq/L
Figure 3·32. Activity concentrations of 90Sr in milk at four locationsin northern Norway.
Figure 3·33. Activity concentrations of 137Cs in milkfrom different locations in Nordic areas in 1964.
Table 3·11. Teff values (yr ± SD) for 137Cs and 90Sr activity concentrations in milk from various Arctic areas. –––––––––––––––––––––––––––––––––––––––––––––––––––––––––––––––––––––––––––––––––––––––––––––––––––––––––––––––––––––––––
Faroe Islands Finland Norway Sweden --------------------------------------------------------------------------------------------------------------------------------------------------------------------------------------
Klaks- Tórs- Tvør- Rova- Måls- Kauto- Tärna- Vitti-vík havn oyri Apukka Kursu niemi Bodø Vadsø elv keino by angi
––––––––––––––––––––––––––––––––––––––––––––––––––––––––––––––––––––––––––––––––––––––––––––––––––––––––––––––––––––––––– 137CsGlobal fallout
Teff1 1.5±0.1 1.0±0.1 1.8±0.2 1.0±0.1 1.9±0.6 1.6±0.4 1.5±0.3 1.1±0.3 1.4±0.4 1.8±0.6Teff2 7.1±0.5 6.5±0.4 8.8±0.7 4.5±0.7 4.5±1.2 5.1±1.3 6.1±1.2 6.0±2.0 9.1±1.1 6.2±1.0
Chernobyl falloutTeff 1.3±0.1 1.8±0.1 1.8±0.1 0.7±0.1 3.4±0.1
--------------------------------------------------------------------------------------------------------------------------------------------------------------------------------------90Sr
Teff1 1.0±0.1 1.4±0.1 1.3±0.1 1.8±0.6 n.a. n.a. 1.5±0.4 3.0±1.0 1.4±0.3Teff2 5.2±0.4 5.5±0.5 8.4±0.3 4.0±1.0 n.a. n.a. 4.6±1.3 9.0±2.0 8.5±1.0
–––––––––––––––––––––––––––––––––––––––––––––––––––––––––––––––––––––––––––––––––––––––––––––––––––––––––––––––––––––––––n.a.: no statistically valid half-life could be calculated.
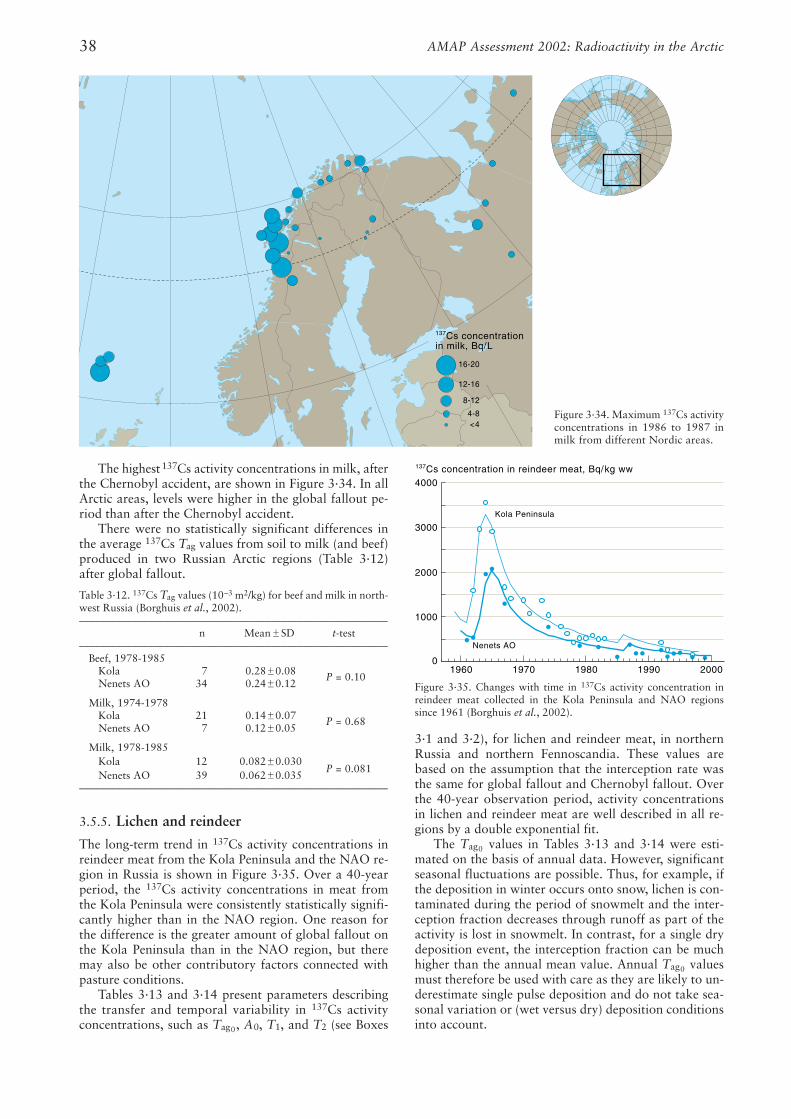
The highest 137Cs activity concentrations in milk, afterthe Chernobyl accident, are shown in Figure 3·34. In allArctic areas, levels were higher in the global fallout pe-riod than after the Chernobyl accident.
There were no statistically significant differences inthe average 137Cs Tag values from soil to milk (and beef)produced in two Russian Arctic regions (Table 3·12)after global fallout.
3.5.5. Lichen and reindeer
The long-term trend in 137Cs activity concentrations inreindeer meat from the Kola Peninsula and the NAO re-gion in Russia is shown in Figure 3·35. Over a 40-yearperiod, the 137Cs activity concentrations in meat fromthe Kola Peninsula were consistently statistically signifi-cantly higher than in the NAO region. One reason forthe difference is the greater amount of global fallout onthe Kola Peninsula than in the NAO region, but theremay also be other contributory factors connected withpasture conditions.
Tables 3·13 and 3·14 present parameters describingthe transfer and temporal variability in 137Cs activityconcentrations, such as Tag0, A0, T1, and T2 (see Boxes
3·1 and 3·2), for lichen and reindeer meat, in northernRussia and northern Fennoscandia. These values arebased on the assumption that the interception rate wasthe same for global fallout and Chernobyl fallout. Overthe 40-year observation period, activity concentrationsin lichen and reindeer meat are well described in all re-gions by a double exponential fit.
The Tag0 values in Tables 3·13 and 3·14 were esti-mated on the basis of annual data. However, significantseasonal fluctuations are possible. Thus, for example, ifthe deposition in winter occurs onto snow, lichen is con-taminated during the period of snowmelt and the inter-ception fraction decreases through runoff as part of theactivity is lost in snowmelt. In contrast, for a single drydeposition event, the interception fraction can be muchhigher than the annual mean value. Annual Tag0 valuesmust therefore be used with care as they are likely to un-derestimate single pulse deposition and do not take sea-sonal variation or (wet versus dry) deposition conditionsinto account.
AMAP Assessment 2002: Radioactivity in the Arctic38
16-20
12-16
8-12
4-8<4
137Cs concentrationin milk, Bq/L
Figure 3·34. Maximum 137Cs activityconcentrations in 1986 to 1987 inmilk from different Nordic areas.
Table 3·12. 137Cs Tag values (10–3 m2/kg) for beef and milk in north-west Russia (Borghuis et al., 2002).––––––––––––––––––––––––––––––––––––––––––––––––––––––––––
n Mean ± SD t-test––––––––––––––––––––––––––––––––––––––––––––––––––––––––––
Beef, 1978-1985Kola 7 0.28±0.08Nenets AO 34 0.24±0.12
P = 0.10
Milk, 1974-1978Kola 21 0.14±0.07Nenets AO 7 0.12±0.05
P = 0.68
Milk, 1978-1985Kola 12 0.082±0.030Nenets AO 39 0.062±0.035
P = 0.081
––––––––––––––––––––––––––––––––––––––––––––––––––––––––––
Nenets AO
Kola Peninsula
4000
3000
2000
1000
020001990198019701960
137Cs concentration in reindeer meat, Bq/kg ww
Figure 3·35. Changes with time in 137Cs activity concentration inreindeer meat collected in the Kola Peninsula and NAO regionssince 1961 (Borghuis et al., 2002).
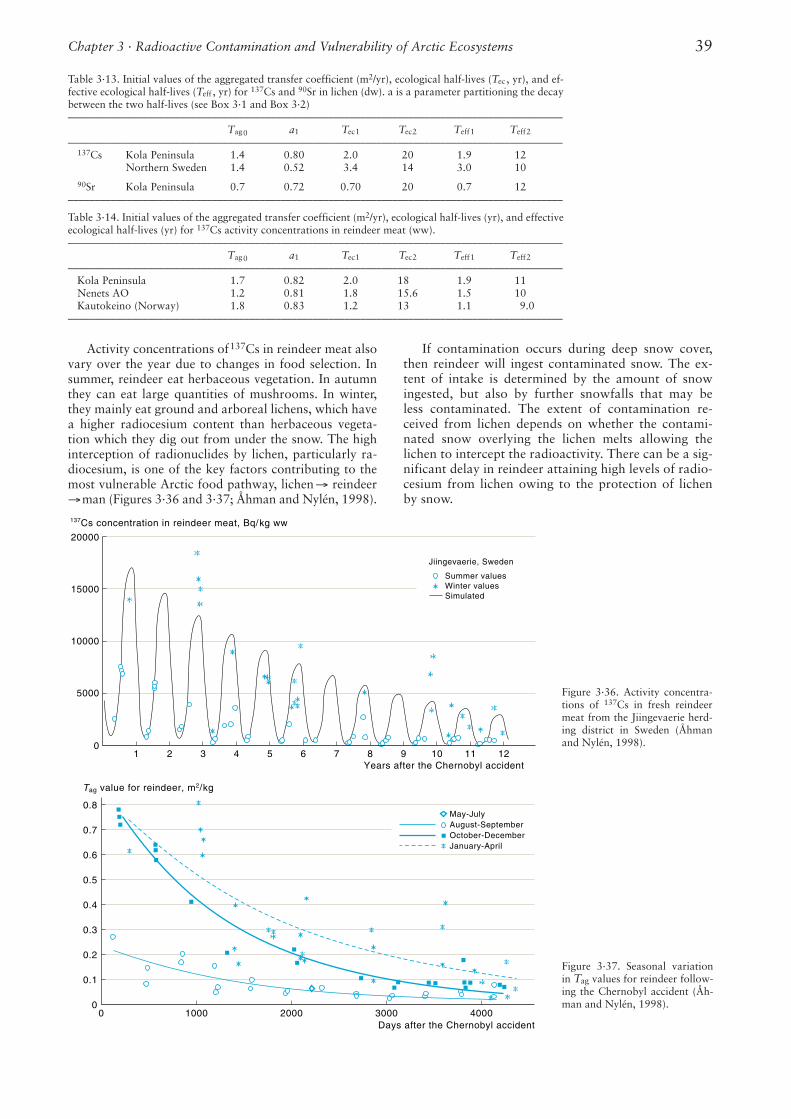
Activity concentrations of137Cs in reindeer meat alsovary over the year due to changes in food selection. Insummer, reindeer eat herbaceous vegetation. In autumnthey can eat large quantities of mushrooms. In winter,they mainly eat ground and arboreal lichens, which havea higher radiocesium content than herbaceous vegeta-tion which they dig out from under the snow. The highinterception of radionuclides by lichen, particularly ra-diocesium, is one of the key factors contributing to themost vulnerable Arctic food pathway, lichen→ reindeer→man (Figures 3·36 and 3·37; Åhman and Nylén, 1998).
If contamination occurs during deep snow cover,then reindeer will ingest contaminated snow. The ex-tent of intake is determined by the amount of snowingested, but also by further snowfalls that may beless contaminated. The extent of contamination re-ceived from lichen depends on whether the contami-nated snow overlying the lichen melts allowing thelichen to intercept the radioactivity. There can be a sig-nificant delay in reindeer attaining high levels of radio-cesium from lichen owing to the protection of lichenby snow.
Chapter 3 · Radioactive Contamination and Vulnerability of Arctic Ecosystems 39
May-JulyAugust-SeptemberOctober-DecemberJanuary-April
0.8
0.7
0.6
0.5
0.4
0.3
0.2
0.1
0
Tag value for reindeer, m2/kg
0 1000 2000 3000 4000Days after the Chernobyl accident
Table 3·14. Initial values of the aggregated transfer coefficient (m2/yr), ecological half-lives (yr), and effectiveecological half-lives (yr) for 137Cs activity concentrations in reindeer meat (ww). –––––––––––––––––––––––––––––––––––––––––––––––––––––––––––––––––––––––––––––––––––––––––––––
Tag0 a1 Tec1 Tec2 Teff1 Teff2
–––––––––––––––––––––––––––––––––––––––––––––––––––––––––––––––––––––––––––––––––––––––––––––Kola Peninsula 1.7 0.82 2.0 18.0 1.9 11Nenets AO 1.2 0.81 1.8 15.6 1.5 10Kautokeino (Norway) 1.8 0.83 1.2 13.0 1.1 9.0
–––––––––––––––––––––––––––––––––––––––––––––––––––––––––––––––––––––––––––––––––––––––––––––
20000
15000
10000
5000
01 2 3 4 5 6 7 8 9 10 11 12
Jiingevaerie, Sweden
Summer valuesWinter valuesSimulated
137Cs concentration in reindeer meat, Bq/kg ww
Years after the Chernobyl accident
Figure 3·36. Activity concentra-tions of 137Cs in fresh reindeermeat from the Jiingevaerie herd-ing district in Sweden (Åhmanand Nylén, 1998).
Figure 3·37. Seasonal variationin Tag values for reindeer follow-ing the Chernobyl accident (Åh-man and Nylén, 1998).
Table 3·13. Initial values of the aggregated transfer coefficient (m2/yr), ecological half-lives (Tec , yr), and ef-fective ecological half-lives (Teff , yr) for 137Cs and 90Sr in lichen (dw). a is a parameter partitioning the decaybetween the two half-lives (see Box 3·1 and Box 3·2)–––––––––––––––––––––––––––––––––––––––––––––––––––––––––––––––––––––––––––––––––––––––––––––
Tag0 a1 Tec1 Tec2 Teff1 Teff2
–––––––––––––––––––––––––––––––––––––––––––––––––––––––––––––––––––––––––––––––––––––––––––––137Cs Kola Peninsula 1.4 0.80 2.0 20 1.9 12
Northern Sweden 1.4 0.52 3.4 14 3.0 10
90Sr Kola Peninsula 0.7 0.72 0.70 20 0.7 12–––––––––––––––––––––––––––––––––––––––––––––––––––––––––––––––––––––––––––––––––––––––––––––
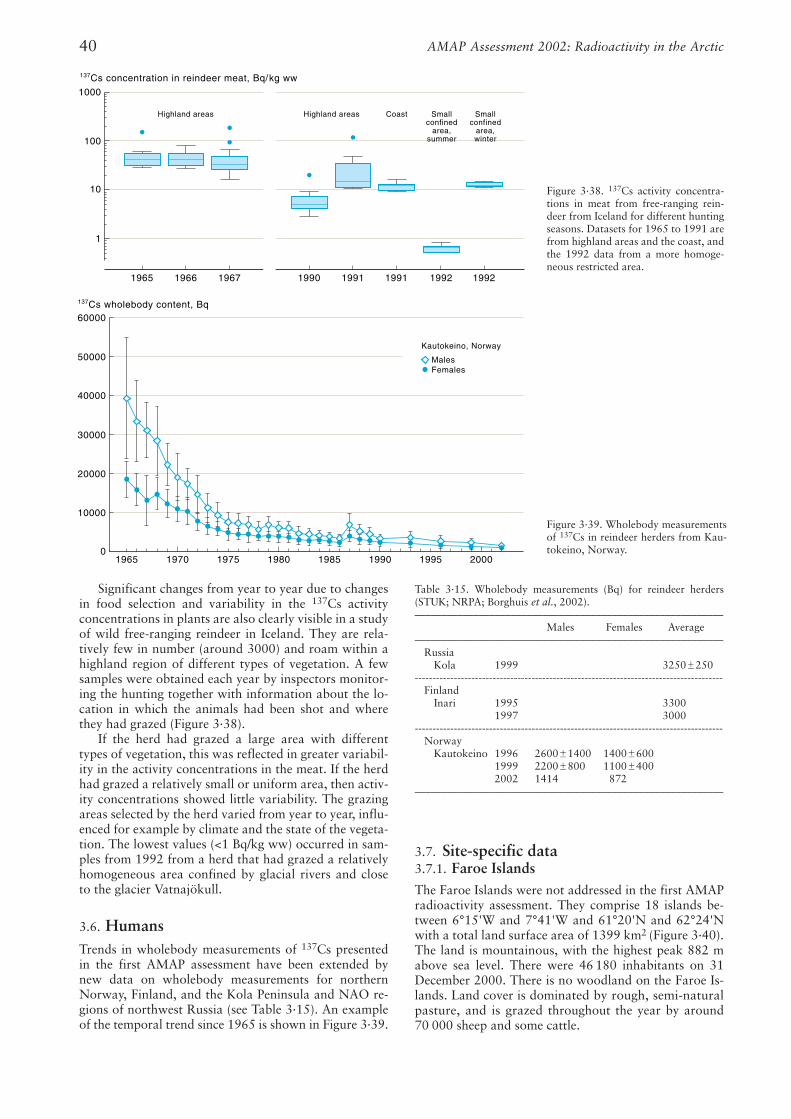
Significant changes from year to year due to changesin food selection and variability in the 137Cs activityconcentrations in plants are also clearly visible in a studyof wild free-ranging reindeer in Iceland. They are rela-tively few in number (around 3000) and roam within ahighland region of different types of vegetation. A fewsamples were obtained each year by inspectors monitor-ing the hunting together with information about the lo-cation in which the animals had been shot and wherethey had grazed (Figure 3·38).
If the herd had grazed a large area with differenttypes of vegetation, this was reflected in greater variabil-ity in the activity concentrations in the meat. If the herdhad grazed a relatively small or uniform area, then activ-ity concentrations showed little variability. The grazingareas selected by the herd varied from year to year, influ-enced for example by climate and the state of the vegeta-tion. The lowest values (<1 Bq/kg ww) occurred in sam-ples from 1992 from a herd that had grazed a relativelyhomogeneous area confined by glacial rivers and closeto the glacier Vatnajökull.
3.6. HumansTrends in wholebody measurements of 137Cs presentedin the first AMAP assessment have been extended bynew data on wholebody measurements for northernNorway, Finland, and the Kola Peninsula and NAO re-gions of northwest Russia (see Table 3·15). An exampleof the temporal trend since 1965 is shown in Figure 3·39.
3.7. Site-specific data3.7.1. Faroe IslandsThe Faroe Islands were not addressed in the first AMAPradioactivity assessment. They comprise 18 islands be-tween 6°15'W and 7°41'W and 61°20'N and 62°24'Nwith a total land surface area of 1399 km2 (Figure 3·40).The land is mountainous, with the highest peak 882 mabove sea level. There were 46 180 inhabitants on 31December 2000. There is no woodland on the Faroe Is-lands. Land cover is dominated by rough, semi-naturalpasture, and is grazed throughout the year by around70 000 sheep and some cattle.
AMAP Assessment 2002: Radioactivity in the Arctic40
1000
10
100
1
1965 1966 1967 1990 1991 19921991 1992
Highland areas Highland areas Coast Smallconfined
area,summer
Smallconfined
area,winter
137Cs concentration in reindeer meat, Bq/kg ww
Kautokeino, Norway
MalesFemales
60000
50000
40000
30000
20000
10000
01970 1975 1980 1985 1990 1995 20001965
137Cs wholebody content, Bq
Table 3·15. Wholebody measurements (Bq) for reindeer herders(STUK; NRPA; Borghuis et al., 2002).––––––––––––––––––––––––––––––––––––––––––––––––––––––––––
Males Females Average––––––––––––––––––––––––––––––––––––––––––––––––––––––––––
RussiaKola 1999 3250±250
---------------------------------------------------------------------------------------Finland
Inari 1995 33001997 3000
--------------------------------------------------------------------------------------- Norway
Kautokeino 1996 2600±1400 1400±6001999 2200±800 1100±4002002 1414 872
––––––––––––––––––––––––––––––––––––––––––––––––––––––––––
Figure 3·38. 137Cs activity concentra-tions in meat from free-ranging rein-deer from Iceland for different huntingseasons. Datasets for 1965 to 1991 arefrom highland areas and the coast, andthe 1992 data from a more homoge-neous restricted area.
Figure 3·39. Wholebody measurementsof 137Cs in reindeer herders from Kau-tokeino, Norway.
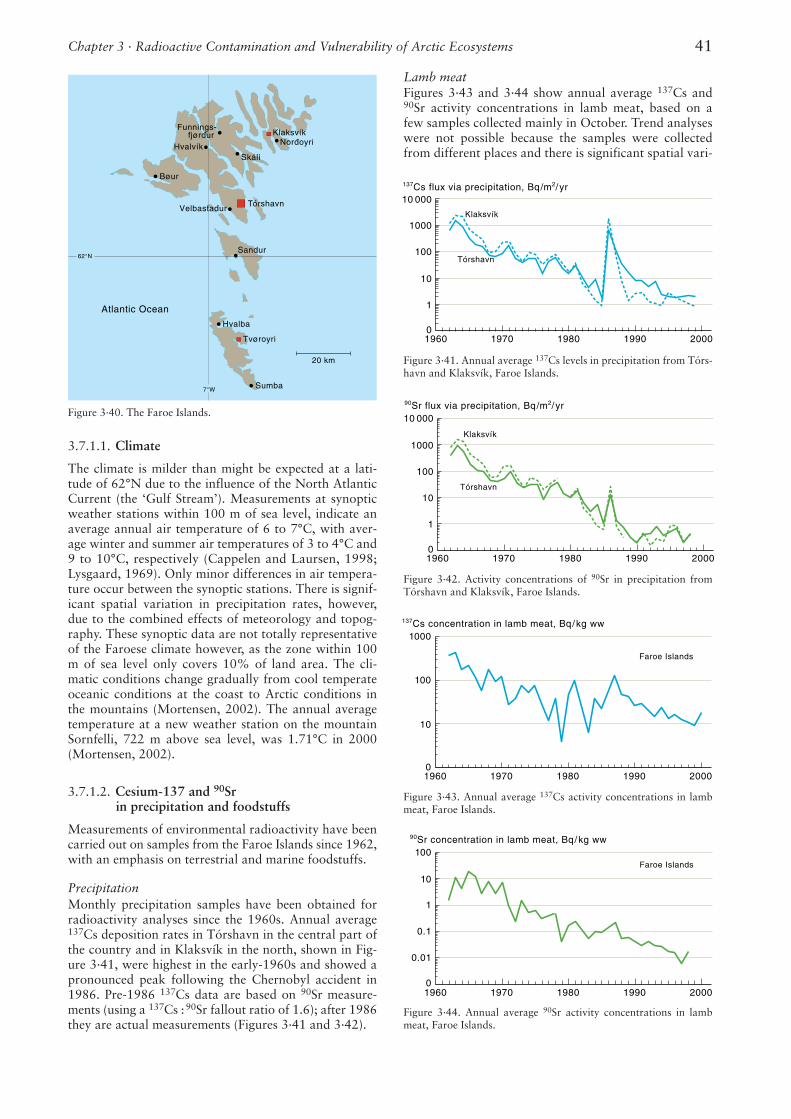
3.7.1.1. Climate
The climate is milder than might be expected at a lati-tude of 62°N due to the influence of the North AtlanticCurrent (the ‘Gulf Stream’). Measurements at synopticweather stations within 100 m of sea level, indicate anaverage annual air temperature of 6 to 7°C, with aver-age winter and summer air temperatures of 3 to 4°C and9 to 10°C, respectively (Cappelen and Laursen, 1998;Lysgaard, 1969). Only minor differences in air tempera-ture occur between the synoptic stations. There is signif-icant spatial variation in precipitation rates, however,due to the combined effects of meteorology and topog-raphy. These synoptic data are not totally representativeof the Faroese climate however, as the zone within 100m of sea level only covers 10% of land area. The cli-matic conditions change gradually from cool temperateoceanic conditions at the coast to Arctic conditions inthe mountains (Mortensen, 2002). The annual averagetemperature at a new weather station on the mountainSornfelli, 722 m above sea level, was 1.71°C in 2000(Mortensen, 2002).
3.7.1.2. Cesium-137 and 90Sr in precipitation and foodstuffs
Measurements of environmental radioactivity have beencarried out on samples from the Faroe Islands since 1962,with an emphasis on terrestrial and marine foodstuffs.
PrecipitationMonthly precipitation samples have been obtained forradioactivity analyses since the 1960s. Annual average137Cs deposition rates in Tórshavn in the central part ofthe country and in Klaksvík in the north, shown in Fig-ure 3·41, were highest in the early-1960s and showed apronounced peak following the Chernobyl accident in1986. Pre-1986 137Cs data are based on 90Sr measure-ments (using a 137Cs :90Sr fallout ratio of 1.6); after 1986they are actual measurements (Figures 3·41 and 3·42).
Lamb meatFigures 3·43 and 3·44 show annual average 137Cs and90Sr activity concentrations in lamb meat, based on afew samples collected mainly in October. Trend analyseswere not possible because the samples were collectedfrom different places and there is significant spatial vari-
Chapter 3 · Radioactive Contamination and Vulnerability of Arctic Ecosystems 41
20 km
Tórshavn
Bøur
Funnings-fjørdur
HvalvíkSkáli
Tvøroyri
Klaksvík
Sandur
Hvalba
Sumba
Nordoyri
Velbastadur
Atlantic Ocean
62°N
7°W
Figure 3·43. Annual average 137Cs activity concentrations in lambmeat, Faroe Islands.
10 000
137Cs flux via precipitation, Bq/m2/yr
1000
100
10
1
01960 1970 1980 1990 2000
Klaksvík
Tórshavn
10 000
1000
100
10
1
01960 1970 1980 1990 2000
Klaksvík
Tórshavn
90Sr flux via precipitation, Bq/m2/yr
1000
100
10
137Cs concentration in lamb meat, Bq/kg ww
01960 1970 1980 1990 2000
Faroe Islands
100
1
10
0.1
0
0.01
1960 1970 1980 1990 2000
Faroe Islands
90Sr concentration in lamb meat, Bq/kg ww
Figure 3·44. Annual average 90Sr activity concentrations in lambmeat, Faroe Islands.
Figure 3·42. Activity concentrations of 90Sr in precipitation fromTórshavn and Klaksvík, Faroe Islands.
Figure 3·41. Annual average 137Cs levels in precipitation from Tórs-havn and Klaksvík, Faroe Islands.
Figure 3·40. The Faroe Islands.
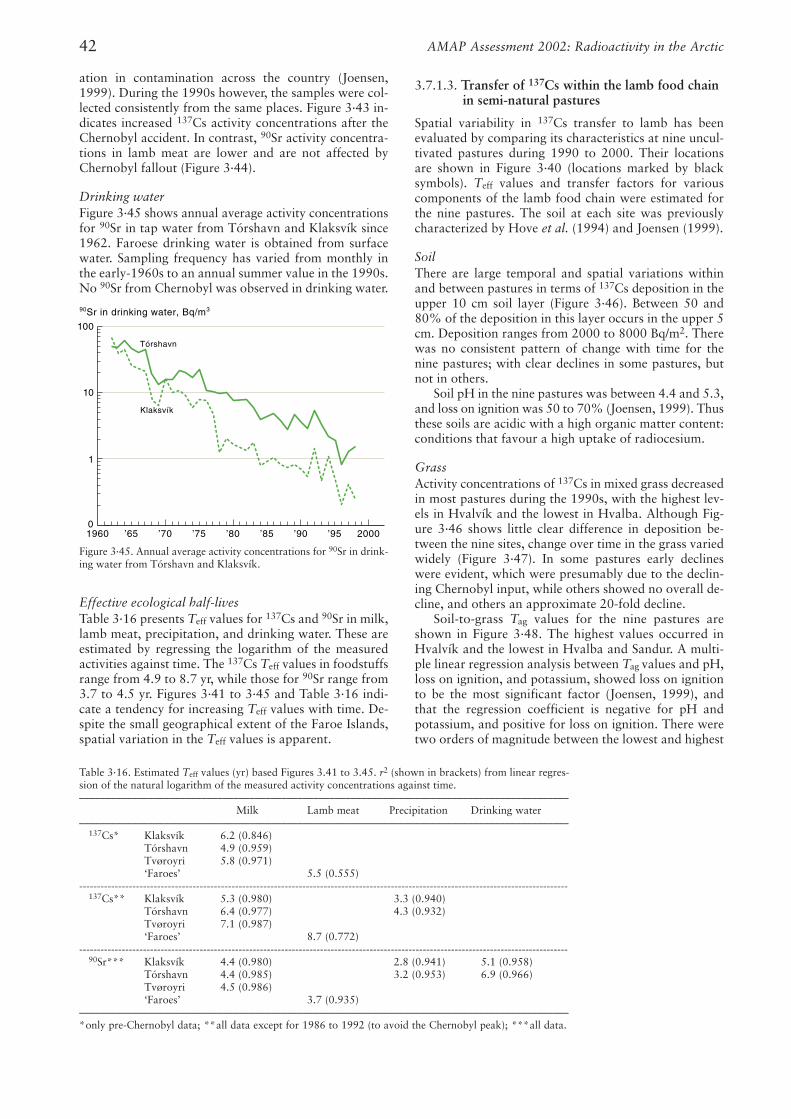
ation in contamination across the country (Joensen,1999). During the 1990s however, the samples were col-lected consistently from the same places. Figure 3·43 in-dicates increased 137Cs activity concentrations after theChernobyl accident. In contrast, 90Sr activity concentra-tions in lamb meat are lower and are not affected byChernobyl fallout (Figure 3·44).
Drinking waterFigure 3·45 shows annual average activity concentrationsfor 90Sr in tap water from Tórshavn and Klaksvík since1962. Faroese drinking water is obtained from surfacewater. Sampling frequency has varied from monthly inthe early-1960s to an annual summer value in the 1990s.No 90Sr from Chernobyl was observed in drinking water.
Effective ecological half-livesTable 3·16 presents Teff values for 137Cs and 90Sr in milk,lamb meat, precipitation, and drinking water. These areestimated by regressing the logarithm of the measuredactivities against time. The 137Cs Teff values in foodstuffsrange from 4.9 to 8.7 yr, while those for 90Sr range from3.7 to 4.5 yr. Figures 3·41 to 3·45 and Table 3·16 indi-cate a tendency for increasing Teff values with time. De-spite the small geographical extent of the Faroe Islands,spatial variation in the Teff values is apparent.
3.7.1.3. Transfer of 137Cs within the lamb food chain in semi-natural pastures
Spatial variability in 137Cs transfer to lamb has beenevaluated by comparing its characteristics at nine uncul-tivated pastures during 1990 to 2000. Their locationsare shown in Figure 3·40 (locations marked by blacksymbols). Teff values and transfer factors for variouscomponents of the lamb food chain were estimated forthe nine pastures. The soil at each site was previouslycharacterized by Hove et al. (1994) and Joensen (1999).
SoilThere are large temporal and spatial variations withinand between pastures in terms of 137Cs deposition in theupper 10 cm soil layer (Figure 3·46). Between 50 and80% of the deposition in this layer occurs in the upper 5cm. Deposition ranges from 2000 to 8000 Bq/m2. Therewas no consistent pattern of change with time for thenine pastures; with clear declines in some pastures, butnot in others.
Soil pH in the nine pastures was between 4.4 and 5.3,and loss on ignition was 50 to 70% (Joensen, 1999). Thusthese soils are acidic with a high organic matter content:conditions that favour a high uptake of radiocesium.
GrassActivity concentrations of 137Cs in mixed grass decreasedin most pastures during the 1990s, with the highest lev-els in Hvalvík and the lowest in Hvalba. Although Fig-ure 3·46 shows little clear difference in deposition be-tween the nine sites, change over time in the grass variedwidely (Figure 3·47). In some pastures early declineswere evident, which were presumably due to the declin-ing Chernobyl input, while others showed no overall de-cline, and others an approximate 20-fold decline.
Soil-to-grass Tag values for the nine pastures areshown in Figure 3·48. The highest values occurred inHvalvík and the lowest in Hvalba and Sandur. A multi-ple linear regression analysis between Tag values and pH,loss on ignition, and potassium, showed loss on ignitionto be the most significant factor (Joensen, 1999), andthat the regression coefficient is negative for pH andpotassium, and positive for loss on ignition. There weretwo orders of magnitude between the lowest and highest
AMAP Assessment 2002: Radioactivity in the Arctic42
3 45
100
10
1
90Sr in drinking water, Bq/m3
01960 ’65 ’70 ’75 ’80 ’85 ’90 ’95 2000
Klaksvík
Tórshavn
Figure 3·45. Annual average activity concentrations for 90Sr in drink-ing water from Tórshavn and Klaksvík.
Table 3·16. Estimated Teff values (yr) based Figures 3.41 to 3.45. r2 (shown in brackets) from linear regres-sion of the natural logarithm of the measured activity concentrations against time.––––––––––––––––––––––––––––––––––––––––––––––––––––––––––––––––––––––––––––––––––––––––––––
Milk Lamb meat Precipitation Drinking water––––––––––––––––––––––––––––––––––––––––––––––––––––––––––––––––––––––––––––––––––––––––––––
137Cs* Klaksvík 6.2 (0.846)Tórshavn 4.9 (0.959)Tvøroyri 5.8 (0.971)‘Faroes’ 5.5 (0.555)
------------------------------------------------------------------------------------------------------------------------------------------137Cs** Klaksvík 5.3 (0.980) 3.3 (0.940)
Tórshavn 6.4 (0.977) 4.3 (0.932)Tvøroyri 7.1 (0.987)‘Faroes’ 8.7 (0.772)
------------------------------------------------------------------------------------------------------------------------------------------90Sr*** Klaksvík 4.4 (0.980) 2.8 (0.941) 5.1 (0.958)
Tórshavn 4.4 (0.985) 3.2 (0.953) 6.9 (0.966)Tvøroyri 4.5 (0.986)‘Faroes’ 3.7 (0.935)
––––––––––––––––––––––––––––––––––––––––––––––––––––––––––––––––––––––––––––––––––––––––––––*only pre-Chernobyl data; **all data except for 1986 to 1992 (to avoid the Chernobyl peak); ***all data.
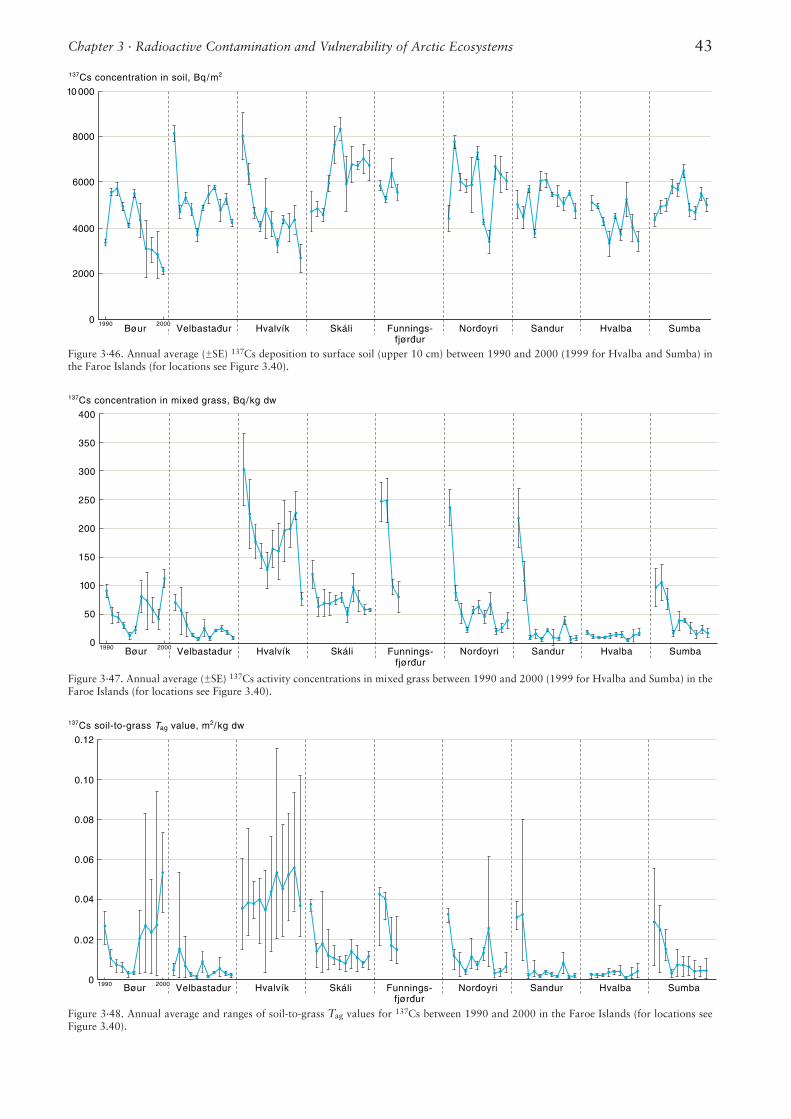
Chapter 3 · Radioactive Contamination and Vulnerability of Arctic Ecosystems 43
10 000
8000
6000
4000
2000
137Cs concentration in soil, Bq/m2
0Bøur Hvalvík Skáli Sandur Hvalba SumbaNordoyriVelbastadur Funnings-
fjørdur
1990 2000
400
350
137Cs concentration in mixed grass, Bq/kg dw
300
250
200
150
100
50
0Bøur Hvalvík Skáli Sandur Hvalba SumbaNordoyriVelbastadur Funnings-
fjørdur
3 47
1990 2000
0.12
0.10
0.08
0.06
0.04
137Cs soil-to-grass Tag value, m2/kg dw
0.02
0Bøur Hvalvík Skáli Sandur Hvalba SumbaNordoyriVelbastadur Funnings-
fjørdur
1990 2000
Figure 3·46. Annual average (±SE) 137Cs deposition to surface soil (upper 10 cm) between 1990 and 2000 (1999 for Hvalba and Sumba) inthe Faroe Islands (for locations see Figure 3.40).
Figure 3·47. Annual average (±SE) 137Cs activity concentrations in mixed grass between 1990 and 2000 (1999 for Hvalba and Sumba) in theFaroe Islands (for locations see Figure 3.40).
Figure 3·48. Annual average and ranges of soil-to-grass Tag values for 137Cs between 1990 and 2000 in the Faroe Islands (for locations seeFigure 3.40).
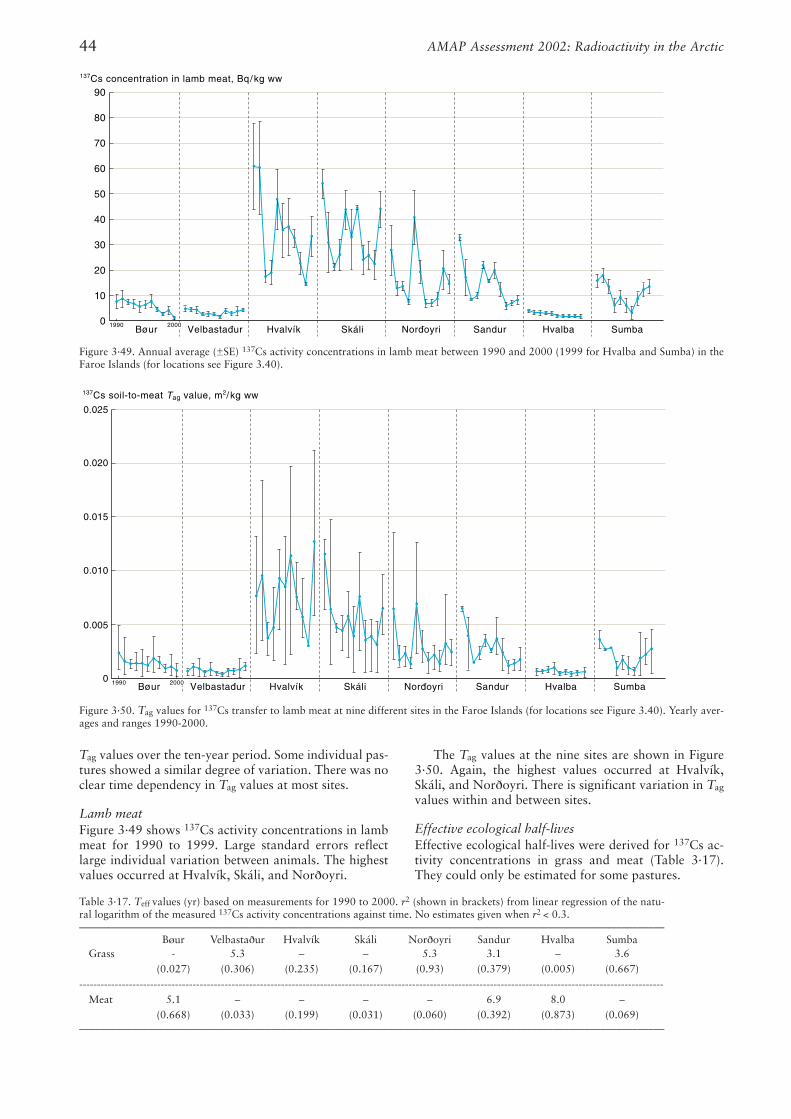
Tag values over the ten-year period. Some individual pas-tures showed a similar degree of variation. There was noclear time dependency in Tag values at most sites.
Lamb meatFigure 3·49 shows 137Cs activity concentrations in lambmeat for 1990 to 1999. Large standard errors reflectlarge individual variation between animals. The highestvalues occurred at Hvalvík, Skáli, and Nor∂oyri.
The Tag values at the nine sites are shown in Figure3·50. Again, the highest values occurred at Hvalvík,Skáli, and Nor∂oyri. There is significant variation in Tag
values within and between sites.
Effective ecological half-lives Effective ecological half-lives were derived for 137Cs ac-tivity concentrations in grass and meat (Table 3·17).They could only be estimated for some pastures.
AMAP Assessment 2002: Radioactivity in the Arctic44
90
80
70
60
50
40
30
20
10
0
137Cs concentration in lamb meat, Bq/kg ww
Bøur Hvalvík Skáli Sandur Hvalba SumbaNordoyriVelbastadur1990 2000
0.025
0.020
0.015
0.010
0.005
137Cs soil-to-meat Tag value, m2/kg ww
0Bøur Hvalvík Skáli Sandur Hvalba SumbaNordoyriVelbastadur1990 2000
Figure 3·49. Annual average (±SE) 137Cs activity concentrations in lamb meat between 1990 and 2000 (1999 for Hvalba and Sumba) in theFaroe Islands (for locations see Figure 3.40).
Figure 3·50. Tag values for 137Cs transfer to lamb meat at nine different sites in the Faroe Islands (for locations see Figure 3.40). Yearly aver-ages and ranges 1990-2000.
Table 3·17. Teff values (yr) based on measurements for 1990 to 2000. r2 (shown in brackets) from linear regression of the natu-ral logarithm of the measured 137Cs activity concentrations against time. No estimates given when r2 < 0.3.––––––––––––––––––––––––––––––––––––––––––––––––––––––––––––––––––––––––––––––––––––––––––––––––––––––––––––––
Bøur Velbasta∂ur Hvalvík Skáli Nor∂oyri Sandur Hvalba SumbaGrass - 5.3 – – 5.3 3.1 – 3.6
(0.027) (0.306) (0.235) (0.167) (0.93) (0.379) (0.005) (0.667)---------------------------------------------------------------------------------------------------------------------------------------------------------------------
Meat 5.1 – – – – 6.9 8.0 –(0.668) (0.033) (0.199) (0.031) (0.060) (0.392) (0.873) (0.069)
––––––––––––––––––––––––––––––––––––––––––––––––––––––––––––––––––––––––––––––––––––––––––––––––––––––––––––––
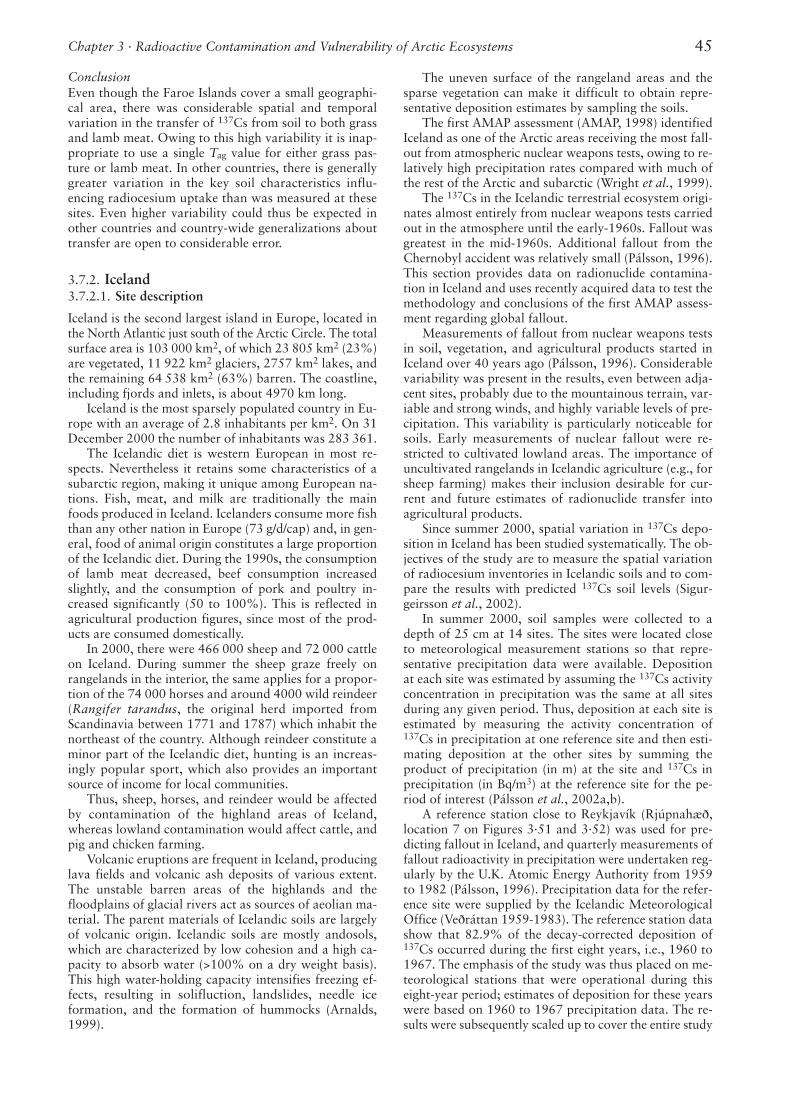
ConclusionEven though the Faroe Islands cover a small geographi-cal area, there was considerable spatial and temporalvariation in the transfer of 137Cs from soil to both grassand lamb meat. Owing to this high variability it is inap-propriate to use a single Tag value for either grass pas-ture or lamb meat. In other countries, there is generallygreater variation in the key soil characteristics influ-encing radiocesium uptake than was measured at thesesites. Even higher variability could thus be expected inother countries and country-wide generalizations abouttransfer are open to considerable error.
3.7.2. Iceland3.7.2.1. Site description
Iceland is the second largest island in Europe, located inthe North Atlantic just south of the Arctic Circle. The totalsurface area is 103 000 km2, of which 23 805 km2 (23%)are vegetated, 11 922 km2 glaciers, 2757 km2 lakes, andthe remaining 64 538 km2 (63%) barren. The coastline,including fjords and inlets, is about 4970 km long.
Iceland is the most sparsely populated country in Eu-rope with an average of 2.8 inhabitants per km2. On 31December 2000 the number of inhabitants was 283 361.
The Icelandic diet is western European in most re-spects. Nevertheless it retains some characteristics of asubarctic region, making it unique among European na-tions. Fish, meat, and milk are traditionally the mainfoods produced in Iceland. Icelanders consume more fishthan any other nation in Europe (73 g/d/cap) and, in gen-eral, food of animal origin constitutes a large proportionof the Icelandic diet. During the 1990s, the consumptionof lamb meat decreased, beef consumption increasedslightly, and the consumption of pork and poultry in-creased significantly (50 to 100%). This is reflected inagricultural production figures, since most of the prod-ucts are consumed domestically.
In 2000, there were 466 000 sheep and 72 000 cattleon Iceland. During summer the sheep graze freely onrangelands in the interior, the same applies for a propor-tion of the 74 000 horses and around 4000 wild reindeer(Rangifer tarandus, the original herd imported fromScandinavia between 1771 and 1787) which inhabit thenortheast of the country. Although reindeer constitute aminor part of the Icelandic diet, hunting is an increas-ingly popular sport, which also provides an importantsource of income for local communities.
Thus, sheep, horses, and reindeer would be affectedby contamination of the highland areas of Iceland,whereas lowland contamination would affect cattle, andpig and chicken farming.
Volcanic eruptions are frequent in Iceland, producinglava fields and volcanic ash deposits of various extent.The unstable barren areas of the highlands and thefloodplains of glacial rivers act as sources of aeolian ma-terial. The parent materials of Icelandic soils are largelyof volcanic origin. Icelandic soils are mostly andosols,which are characterized by low cohesion and a high ca-pacity to absorb water (>100% on a dry weight basis).This high water-holding capacity intensifies freezing ef-fects, resulting in solifluction, landslides, needle iceformation, and the formation of hummocks (Arnalds,1999).
The uneven surface of the rangeland areas and thesparse vegetation can make it difficult to obtain repre-sentative deposition estimates by sampling the soils.
The first AMAP assessment (AMAP, 1998) identifiedIceland as one of the Arctic areas receiving the most fall-out from atmospheric nuclear weapons tests, owing to re-latively high precipitation rates compared with much ofthe rest of the Arctic and subarctic (Wright et al., 1999).
The 137Cs in the Icelandic terrestrial ecosystem origi-nates almost entirely from nuclear weapons tests carriedout in the atmosphere until the early-1960s. Fallout wasgreatest in the mid-1960s. Additional fallout from theChernobyl accident was relatively small (Pálsson, 1996).This section provides data on radionuclide contamina-tion in Iceland and uses recently acquired data to test themethodology and conclusions of the first AMAP assess-ment regarding global fallout.
Measurements of fallout from nuclear weapons testsin soil, vegetation, and agricultural products started inIceland over 40 years ago (Pálsson, 1996). Considerablevariability was present in the results, even between adja-cent sites, probably due to the mountainous terrain, var-iable and strong winds, and highly variable levels of pre-cipitation. This variability is particularly noticeable forsoils. Early measurements of nuclear fallout were re-stricted to cultivated lowland areas. The importance ofuncultivated rangelands in Icelandic agriculture (e.g., forsheep farming) makes their inclusion desirable for cur-rent and future estimates of radionuclide transfer intoagricultural products.
Since summer 2000, spatial variation in 137Cs depo-sition in Iceland has been studied systematically. The ob-jectives of the study are to measure the spatial variationof radiocesium inventories in Icelandic soils and to com-pare the results with predicted 137Cs soil levels (Sigur-geirsson et al., 2002).
In summer 2000, soil samples were collected to adepth of 25 cm at 14 sites. The sites were located closeto meteorological measurement stations so that repre-sentative precipitation data were available. Depositionat each site was estimated by assuming the 137Cs activityconcentration in precipitation was the same at all sitesduring any given period. Thus, deposition at each site isestimated by measuring the activity concentration of137Cs in precipitation at one reference site and then esti-mating deposition at the other sites by summing theproduct of precipitation (in m) at the site and 137Cs inprecipitation (in Bq/m3) at the reference site for the pe-riod of interest (Pálsson et al., 2002a,b).
A reference station close to Reykjavík (Rjúpnahæ∂,location 7 on Figures 3·51 and 3·52) was used for pre-dicting fallout in Iceland, and quarterly measurements offallout radioactivity in precipitation were undertaken reg-ularly by the U.K. Atomic Energy Authority from 1959to 1982 (Pálsson, 1996). Precipitation data for the refer-ence site were supplied by the Icelandic MeteorologicalOffice (Ve∂ráttan 1959-1983). The reference station datashow that 82.9% of the decay-corrected deposition of137Cs occurred during the first eight years, i.e., 1960 to1967. The emphasis of the study was thus placed on me-teorological stations that were operational during thiseight-year period; estimates of deposition for these yearswere based on 1960 to 1967 precipitation data. The re-sults were subsequently scaled up to cover the entire study
Chapter 3 · Radioactive Contamination and Vulnerability of Arctic Ecosystems 45
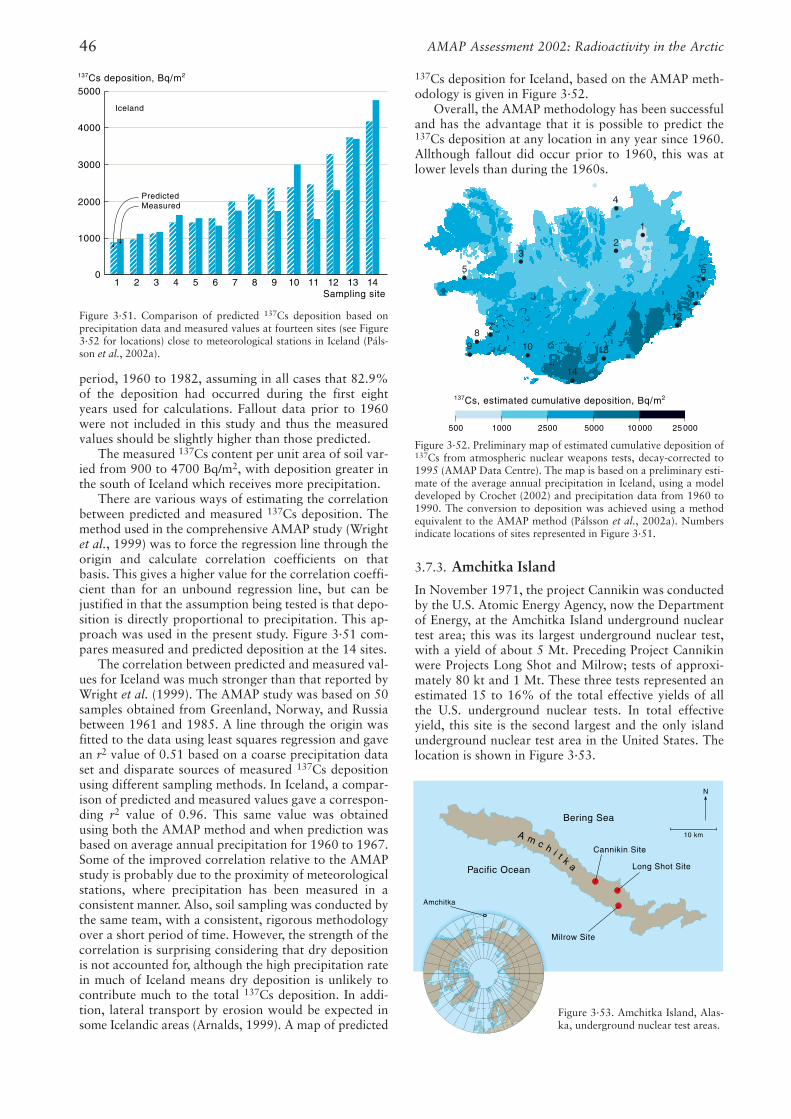
period, 1960 to 1982, assuming in all cases that 82.9%of the deposition had occurred during the first eightyears used for calculations. Fallout data prior to 1960were not included in this study and thus the measuredvalues should be slightly higher than those predicted.
The measured 137Cs content per unit area of soil var-ied from 900 to 4700 Bq/m2, with deposition greater inthe south of Iceland which receives more precipitation.
There are various ways of estimating the correlationbetween predicted and measured 137Cs deposition. Themethod used in the comprehensive AMAP study (Wrightet al., 1999) was to force the regression line through theorigin and calculate correlation coefficients on thatbasis. This gives a higher value for the correlation coeffi-cient than for an unbound regression line, but can bejustified in that the assumption being tested is that depo-sition is directly proportional to precipitation. This ap-proach was used in the present study. Figure 3·51 com-pares measured and predicted deposition at the 14 sites.
The correlation between predicted and measured val-ues for Iceland was much stronger than that reported byWright et al. (1999). The AMAP study was based on 50samples obtained from Greenland, Norway, and Russiabetween 1961 and 1985. A line through the origin wasfitted to the data using least squares regression and gavean r2 value of 0.51 based on a coarse precipitation dataset and disparate sources of measured 137Cs depositionusing different sampling methods. In Iceland, a compar-ison of predicted and measured values gave a correspon-ding r2 value of 0.96. This same value was obtainedusing both the AMAP method and when prediction wasbased on average annual precipitation for 1960 to 1967.Some of the improved correlation relative to the AMAPstudy is probably due to the proximity of meteorologicalstations, where precipitation has been measured in aconsistent manner. Also, soil sampling was conducted bythe same team, with a consistent, rigorous methodologyover a short period of time. However, the strength of thecorrelation is surprising considering that dry depositionis not accounted for, although the high precipitation ratein much of Iceland means dry deposition is unlikely tocontribute much to the total 137Cs deposition. In addi-tion, lateral transport by erosion would be expected insome Icelandic areas (Arnalds, 1999). A map of predicted
137Cs deposition for Iceland, based on the AMAP meth-odology is given in Figure 3·52.
Overall, the AMAP methodology has been successfuland has the advantage that it is possible to predict the137Cs deposition at any location in any year since 1960.Allthough fallout did occur prior to 1960, this was atlower levels than during the 1960s.
3.7.3. Amchitka Island
In November 1971, the project Cannikin was conductedby the U.S. Atomic Energy Agency, now the Departmentof Energy, at the Amchitka Island underground nucleartest area; this was its largest underground nuclear test,with a yield of about 5 Mt. Preceding Project Cannikinwere Projects Long Shot and Milrow; tests of approxi-mately 80 kt and 1 Mt. These three tests represented anestimated 15 to 16% of the total effective yields of allthe U.S. underground nuclear tests. In total effectiveyield, this site is the second largest and the only islandunderground nuclear test area in the United States. Thelocation is shown in Figure 3·53.
AMAP Assessment 2002: Radioactivity in the Arctic46
�������������������
���
������
������
���
����
����
����
5000
4000
3000
2000
1000
0
137Cs deposition, Bq/m2
PredictedMeasured
Iceland
3.51
1 2 3 4 5 6 7 8 9 10 11 12 13 14Sampling site
9 10
11
12
13
14
1
23
4
5 6
78
Bering Sea
Pacific Ocean
10 km
N
Cannikin Site
Long Shot Site
Milrow Site
aktihcmA
Amchitka
Figure 3·51. Comparison of predicted 137Cs deposition based onprecipitation data and measured values at fourteen sites (see Figure3·52 for locations) close to meteorological stations in Iceland (Páls-son et al., 2002a).
Figure 3·52. Preliminary map of estimated cumulative deposition of137Cs from atmospheric nuclear weapons tests, decay-corrected to1995 (AMAP Data Centre). The map is based on a preliminary esti-mate of the average annual precipitation in Iceland, using a modeldeveloped by Crochet (2002) and precipitation data from 1960 to1990. The conversion to deposition was achieved using a methodequivalent to the AMAP method (Pálsson et al., 2002a). Numbersindicate locations of sites represented in Figure 3·51.
Figure 3·53. Amchitka Island, Alas-ka, underground nuclear test areas.
500 1000 2500 5000 10 000 25 000
137Cs, estimated cumulative deposition, Bq/m2
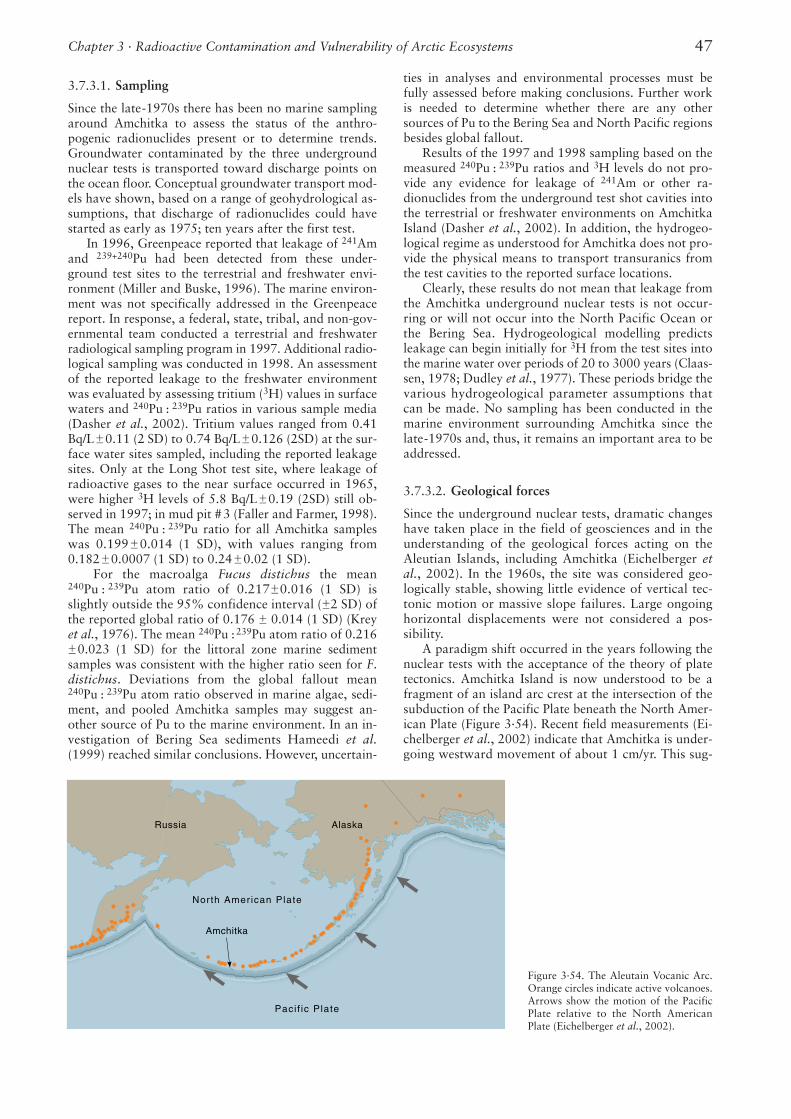
3.7.3.1. Sampling
Since the late-1970s there has been no marine samplingaround Amchitka to assess the status of the anthro-pogenic radionuclides present or to determine trends.Groundwater contaminated by the three undergroundnuclear tests is transported toward discharge points onthe ocean floor. Conceptual groundwater transport mod-els have shown, based on a range of geohydrological as-sumptions, that discharge of radionuclides could havestarted as early as 1975; ten years after the first test.
In 1996, Greenpeace reported that leakage of 241Amand 239+240Pu had been detected from these under-ground test sites to the terrestrial and freshwater envi-ronment (Miller and Buske, 1996). The marine environ-ment was not specifically addressed in the Greenpeacereport. In response, a federal, state, tribal, and non-gov-ernmental team conducted a terrestrial and freshwaterradiological sampling program in 1997. Additional radio-logical sampling was conducted in 1998. An assessmentof the reported leakage to the freshwater environmentwas evaluated by assessing tritium (3H) values in surfacewaters and 240Pu : 239Pu ratios in various sample media(Dasher et al., 2002). Tritium values ranged from 0.41Bq/L±0.11 (2 SD) to 0.74 Bq/L±0.126 (2SD) at the sur-face water sites sampled, including the reported leakagesites. Only at the Long Shot test site, where leakage ofradioactive gases to the near surface occurred in 1965,were higher 3H levels of 5.8 Bq/L±0.19 (2SD) still ob-served in 1997; in mud pit #3 (Faller and Farmer, 1998).The mean 240Pu : 239Pu ratio for all Amchitka sampleswas 0.199±0.014 (1 SD), with values ranging from0.182±0.0007 (1 SD) to 0.24±0.02 (1 SD).
For the macroalga Fucus distichus the mean240Pu : 239Pu atom ratio of 0.217±0.016 (1 SD) isslightly outside the 95% confidence interval (±2 SD) ofthe reported global ratio of 0.176 ± 0.014 (1 SD) (Kreyet al., 1976). The mean 240Pu :239Pu atom ratio of 0.216±0.023 (1 SD) for the littoral zone marine sedimentsamples was consistent with the higher ratio seen for F.distichus. Deviations from the global fallout mean240Pu : 239Pu atom ratio observed in marine algae, sedi-ment, and pooled Amchitka samples may suggest an-other source of Pu to the marine environment. In an in-vestigation of Bering Sea sediments Hameedi et al.(1999) reached similar conclusions. However, uncertain-
ties in analyses and environmental processes must befully assessed before making conclusions. Further workis needed to determine whether there are any othersources of Pu to the Bering Sea and North Pacific regionsbesides global fallout.
Results of the 1997 and 1998 sampling based on themeasured 240Pu : 239Pu ratios and 3H levels do not pro-vide any evidence for leakage of 241Am or other ra-dionuclides from the underground test shot cavities intothe terrestrial or freshwater environments on AmchitkaIsland (Dasher et al., 2002). In addition, the hydrogeo-logical regime as understood for Amchitka does not pro-vide the physical means to transport transuranics fromthe test cavities to the reported surface locations.
Clearly, these results do not mean that leakage fromthe Amchitka underground nuclear tests is not occur-ring or will not occur into the North Pacific Ocean orthe Bering Sea. Hydrogeological modelling predictsleakage can begin initially for 3H from the test sites intothe marine water over periods of 20 to 3000 years (Claas-sen, 1978; Dudley et al., 1977). These periods bridge thevarious hydrogeological parameter assumptions thatcan be made. No sampling has been conducted in themarine environment surrounding Amchitka since thelate-1970s and, thus, it remains an important area to beaddressed.
3.7.3.2. Geological forces
Since the underground nuclear tests, dramatic changeshave taken place in the field of geosciences and in theunderstanding of the geological forces acting on theAleutian Islands, including Amchitka (Eichelberger etal., 2002). In the 1960s, the site was considered geo-logically stable, showing little evidence of vertical tec-tonic motion or massive slope failures. Large ongoinghorizontal displacements were not considered a pos-sibility.
A paradigm shift occurred in the years following thenuclear tests with the acceptance of the theory of platetectonics. Amchitka Island is now understood to be afragment of an island arc crest at the intersection of thesubduction of the Pacific Plate beneath the North Amer-ican Plate (Figure 3·54). Recent field measurements (Ei-chelberger et al., 2002) indicate that Amchitka is under-going westward movement of about 1 cm/yr. This sug-
Chapter 3 · Radioactive Contamination and Vulnerability of Arctic Ecosystems 47
Amchitka
Russia Alaska
North American Plate
Paci f ic Plate
Figure 3·54. The Aleutain Vocanic Arc.Orange circles indicate active volcanoes.Arrows show the motion of the PacificPlate relative to the North AmericanPlate (Eichelberger et al., 2002).
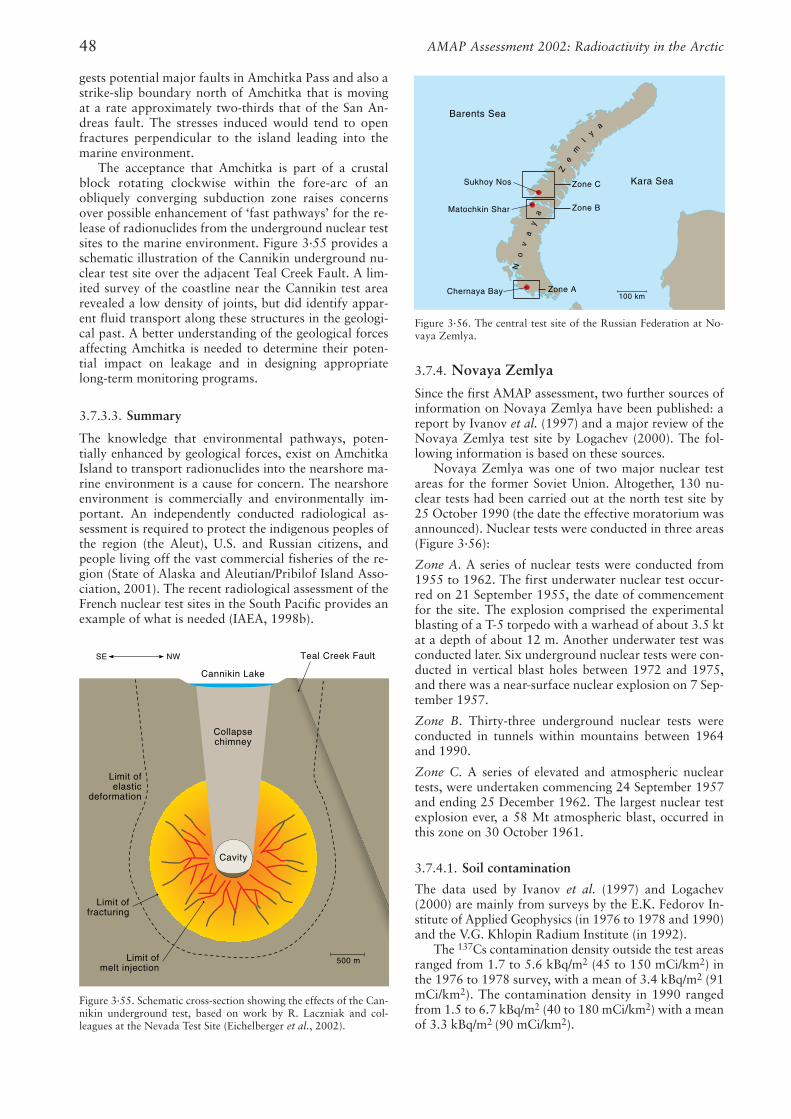
gests potential major faults in Amchitka Pass and also astrike-slip boundary north of Amchitka that is movingat a rate approximately two-thirds that of the San An-dreas fault. The stresses induced would tend to openfractures perpendicular to the island leading into themarine environment.
The acceptance that Amchitka is part of a crustalblock rotating clockwise within the fore-arc of anobliquely converging subduction zone raises concernsover possible enhancement of ‘fast pathways’ for the re-lease of radionuclides from the underground nuclear testsites to the marine environment. Figure 3·55 provides aschematic illustration of the Cannikin underground nu-clear test site over the adjacent Teal Creek Fault. A lim-ited survey of the coastline near the Cannikin test arearevealed a low density of joints, but did identify appar-ent fluid transport along these structures in the geologi-cal past. A better understanding of the geological forcesaffecting Amchitka is needed to determine their poten-tial impact on leakage and in designing appropriatelong-term monitoring programs.
3.7.3.3. Summary
The knowledge that environmental pathways, poten-tially enhanced by geological forces, exist on AmchitkaIsland to transport radionuclides into the nearshore ma-rine environment is a cause for concern. The nearshoreenvironment is commercially and environmentally im-portant. An independently conducted radiological as-sessment is required to protect the indigenous peoples ofthe region (the Aleut), U.S. and Russian citizens, andpeople living off the vast commercial fisheries of the re-gion (State of Alaska and Aleutian/Pribilof Island Asso-ciation, 2001). The recent radiological assessment of theFrench nuclear test sites in the South Pacific provides anexample of what is needed (IAEA, 1998b).
AMAP Assessment 2002: Radioactivity in the Arctic48
Matochkin Shar
Chernaya Bay
Sukhoy Nos
ay
lm
eZ
ay
av
oN
Barents Sea
Kara Sea
100 km
Zone C
Zone B
Zone A
Cavity
Collapsechimney
Teal Creek Fault
Cannikin Lake
Limit ofelastic
deformation
Limit offracturing
Limit ofmelt injection
500 m
NWSE
3 55
Figure 3·55. Schematic cross-section showing the effects of the Can-nikin underground test, based on work by R. Laczniak and col-leagues at the Nevada Test Site (Eichelberger et al., 2002).
3.7.4. Novaya Zemlya
Since the first AMAP assessment, two further sources ofinformation on Novaya Zemlya have been published: areport by Ivanov et al. (1997) and a major review of theNovaya Zemlya test site by Logachev (2000). The fol-lowing information is based on these sources.
Novaya Zemlya was one of two major nuclear testareas for the former Soviet Union. Altogether, 130 nu-clear tests had been carried out at the north test site by25 October 1990 (the date the effective moratorium wasannounced). Nuclear tests were conducted in three areas(Figure 3·56):
Zone A. A series of nuclear tests were conducted from1955 to 1962. The first underwater nuclear test occur-red on 21 September 1955, the date of commencementfor the site. The explosion comprised the experimentalblasting of a T-5 torpedo with a warhead of about 3.5 ktat a depth of about 12 m. Another underwater test wasconducted later. Six underground nuclear tests were con-ducted in vertical blast holes between 1972 and 1975,and there was a near-surface nuclear explosion on 7 Sep-tember 1957.
Zone B. Thirty-three underground nuclear tests wereconducted in tunnels within mountains between 1964and 1990.
Zone C. A series of elevated and atmospheric nucleartests, were undertaken commencing 24 September 1957and ending 25 December 1962. The largest nuclear testexplosion ever, a 58 Mt atmospheric blast, occurred inthis zone on 30 October 1961.
3.7.4.1. Soil contamination
The data used by Ivanov et al. (1997) and Logachev(2000) are mainly from surveys by the E.K. Fedorov In-stitute of Applied Geophysics (in 1976 to 1978 and 1990)and the V.G. Khlopin Radium Institute (in 1992).
The 137Cs contamination density outside the test areasranged from 1.7 to 5.6 kBq/m2 (45 to 150 mCi/km2) inthe 1976 to 1978 survey, with a mean of 3.4 kBq/m2 (91mCi/km2). The contamination density in 1990 rangedfrom 1.5 to 6.7 kBq/m2 (40 to 180 mCi/km2) with a meanof 3.3 kBq/m2 (90 mCi/km2).
Figure 3·56. The central test site of the Russian Federation at No-vaya Zemlya.
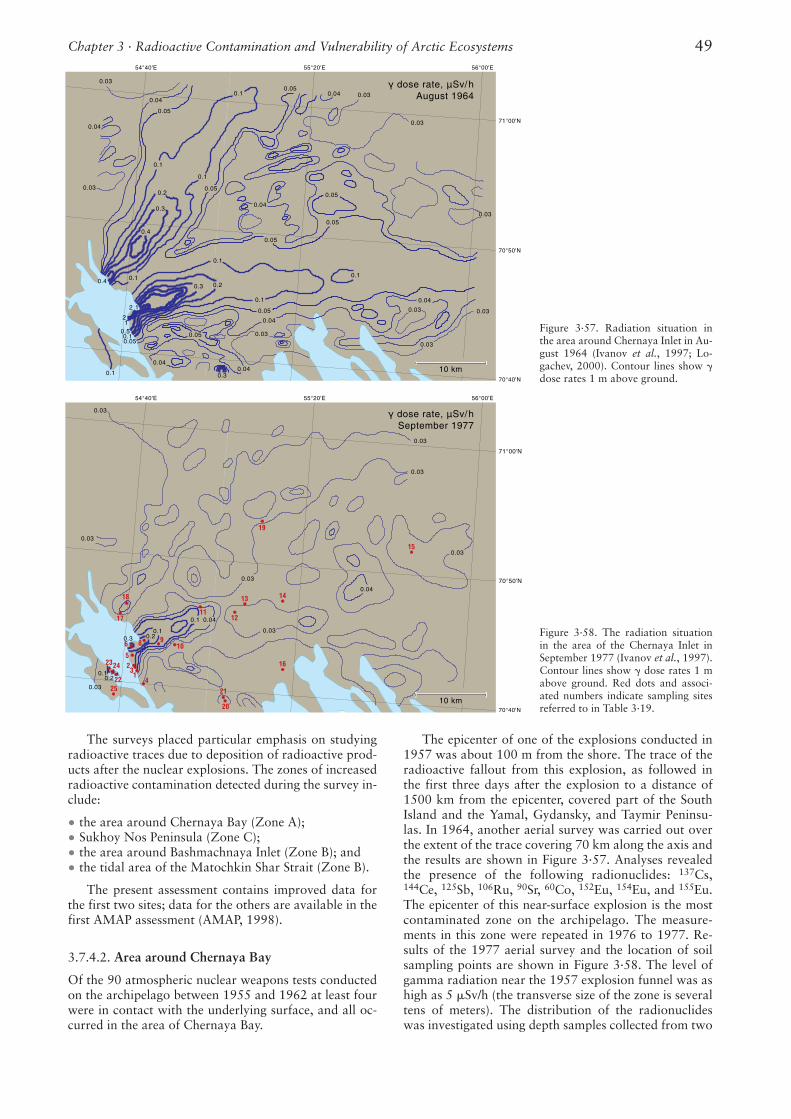
The surveys placed particular emphasis on studyingradioactive traces due to deposition of radioactive prod-ucts after the nuclear explosions. The zones of increasedradioactive contamination detected during the survey in-clude:
• the area around Chernaya Bay (Zone A);• Sukhoy Nos Peninsula (Zone C);• the area around Bashmachnaya Inlet (Zone B); and• the tidal area of the Matochkin Shar Strait (Zone B).
The present assessment contains improved data forthe first two sites; data for the others are available in thefirst AMAP assessment (AMAP, 1998).
3.7.4.2. Area around Chernaya Bay
Of the 90 atmospheric nuclear weapons tests conductedon the archipelago between 1955 and 1962 at least fourwere in contact with the underlying surface, and all oc-curred in the area of Chernaya Bay.
The epicenter of one of the explosions conducted in1957 was about 100 m from the shore. The trace of theradioactive fallout from this explosion, as followed inthe first three days after the explosion to a distance of1500 km from the epicenter, covered part of the SouthIsland and the Yamal, Gydansky, and Taymir Peninsu-las. In 1964, another aerial survey was carried out overthe extent of the trace covering 70 km along the axis andthe results are shown in Figure 3·57. Analyses revealedthe presence of the following radionuclides: 137Cs,144Ce, 125Sb, 106Ru, 90Sr, 60Co, 152Eu, 154Eu, and 155Eu.The epicenter of this near-surface explosion is the mostcontaminated zone on the archipelago. The measure-ments in this zone were repeated in 1976 to 1977. Re-sults of the 1977 aerial survey and the location of soilsampling points are shown in Figure 3·58. The level ofgamma radiation near the 1957 explosion funnel was ashigh as 5 �Sv/h (the transverse size of the zone is severaltens of meters). The distribution of the radionuclideswas investigated using depth samples collected from two
Chapter 3 · Radioactive Contamination and Vulnerability of Arctic Ecosystems 49
14
15
16
20
21
22
24
25
23
13
12
19
11
109
18
17
6
14
5
32
8
0.03
0.03
0.03
0.03
0.3
0.03
0.03
0.03
0.03
0.03
0.03
0.03
0.03
0.03
0.03
0.03
0.03
0.03
0.040.05
0.05
0.05
0.05
0.050.05
0.04
0.04
0.04
0.040.1
0.10.2
0.20.30.1
0.4
0.040.04
0.04
0.05
0.05
0.04
0.040.1
0.1
0.1
0.1
0.1
0.1
0.1
0.1
0.2
0.2
0.3
0.3
0.05
2
1
1
0.5
0.4
0.1
2
55°20'E 56°00'E
71°00'N
70°50'N
70°40'N
54°40'E
55°20'E 56°00'E
71°00'N
70°50'N
70°40'N
54°40'E
10 km
10 km
γ dose rate, µSv/hAugust 1964
γ dose rate, µSv/hSeptember 1977
Figure 3·57. Radiation situation inthe area around Chernaya Inlet in Au-gust 1964 (Ivanov et al., 1997; Lo-gachev, 2000). Contour lines show �dose rates 1 m above ground.
Figure 3·58. The radiation situationin the area of the Chernaya Inlet inSeptember 1977 (Ivanov et al., 1997).Contour lines show � dose rates 1 mabove ground. Red dots and associ-ated numbers indicate sampling sitesreferred to in Table 3·19.
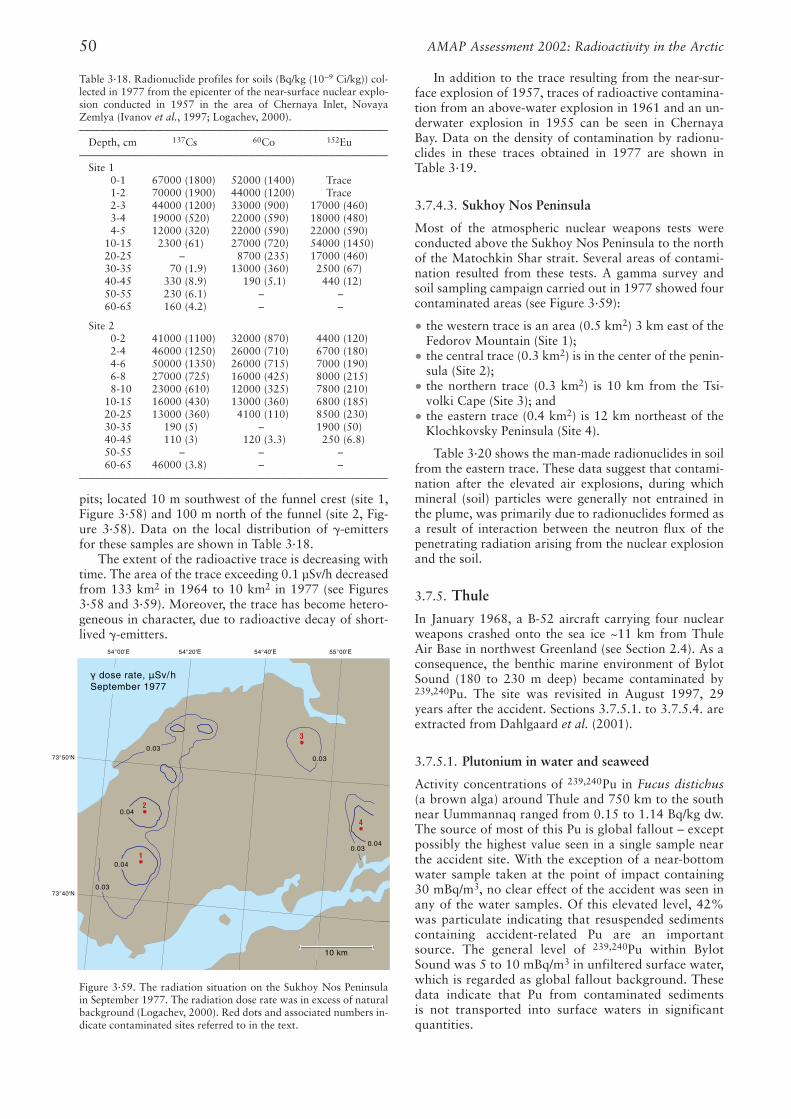
pits; located 10 m southwest of the funnel crest (site 1,Figure 3·58) and 100 m north of the funnel (site 2, Fig-ure 3·58). Data on the local distribution of �-emittersfor these samples are shown in Table 3·18.
The extent of the radioactive trace is decreasing withtime. The area of the trace exceeding 0.1 µSv/h decreasedfrom 133 km2 in 1964 to 10 km2 in 1977 (see Figures3·58 and 3·59). Moreover, the trace has become hetero-geneous in character, due to radioactive decay of short-lived �-emitters.
In addition to the trace resulting from the near-sur-face explosion of 1957, traces of radioactive contamina-tion from an above-water explosion in 1961 and an un-derwater explosion in 1955 can be seen in ChernayaBay. Data on the density of contamination by radionu-clides in these traces obtained in 1977 are shown inTable 3·19.
3.7.4.3. Sukhoy Nos Peninsula
Most of the atmospheric nuclear weapons tests wereconducted above the Sukhoy Nos Peninsula to the northof the Matochkin Shar strait. Several areas of contami-nation resulted from these tests. A gamma survey andsoil sampling campaign carried out in 1977 showed fourcontaminated areas (see Figure 3·59):
• the western trace is an area (0.5 km2) 3 km east of theFedorov Mountain (Site 1);
• the central trace (0.3 km2) is in the center of the penin-sula (Site 2);
• the northern trace (0.3 km2) is 10 km from the Tsi-volki Cape (Site 3); and
• the eastern trace (0.4 km2) is 12 km northeast of theKlochkovsky Peninsula (Site 4).
Table 3·20 shows the man-made radionuclides in soilfrom the eastern trace. These data suggest that contami-nation after the elevated air explosions, during whichmineral (soil) particles were generally not entrained inthe plume, was primarily due to radionuclides formed asa result of interaction between the neutron flux of thepenetrating radiation arising from the nuclear explosionand the soil.
3.7.5. Thule
In January 1968, a B-52 aircraft carrying four nuclearweapons crashed onto the sea ice ~11 km from ThuleAir Base in northwest Greenland (see Section 2.4). As aconsequence, the benthic marine environment of BylotSound (180 to 230 m deep) became contaminated by239,240Pu. The site was revisited in August 1997, 29years after the accident. Sections 3.7.5.1. to 3.7.5.4. areextracted from Dahlgaard et al. (2001).
3.7.5.1. Plutonium in water and seaweed
Activity concentrations of 239,240Pu in Fucus distichus(a brown alga) around Thule and 750 km to the southnear Uummannaq ranged from 0.15 to 1.14 Bq/kg dw.The source of most of this Pu is global fallout – exceptpossibly the highest value seen in a single sample nearthe accident site. With the exception of a near-bottomwater sample taken at the point of impact containing30 mBq/m3, no clear effect of the accident was seen inany of the water samples. Of this elevated level, 42%was particulate indicating that resuspended sedimentscontaining accident-related Pu are an importantsource. The general level of 239,240Pu within BylotSound was 5 to 10 mBq/m3 in unfiltered surface water,which is regarded as global fallout background. Thesedata indicate that Pu from contaminated sedimentsis not transported into surface waters in significantquantities.
AMAP Assessment 2002: Radioactivity in the Arctic50
1
2
3
4
0.04
0.04
0.04
0.03
0.03
0.03
0.03
10 km
γ dose rate, µSv/hSeptember 1977
55°00'E54°40'E54°20'E54°00'E
73°40'N
73°50'N
Table 3·18. Radionuclide profiles for soils (Bq/kg (10–9 Ci/kg)) col-lected in 1977 from the epicenter of the near-surface nuclear explo-sion conducted in 1957 in the area of Chernaya Inlet, NovayaZemlya (Ivanov et al., 1997; Logachev, 2000).––––––––––––––––––––––––––––––––––––––––––––––––––––––––––
Depth, cm 137Cs 60Co 152Eu––––––––––––––––––––––––––––––––––––––––––––––––––––––––––
Site 10-1 67000 (1800) 52000 (1400) Trace1-2 70000 (1900) 44000 (1200) Trace2-3 44000 (1200) 33000 (900) 17000 (460)3-4 19000 (520) 22000 (590) 18000 (480)4-5 12000 (320) 22000 (590) 22000 (590)
10-15 2300 (61) 27000 (720) 54000 (1450)20-25 – 8700 (235) 17000 (460)30-35 70 (1.9) 13000 (360) 2500 (67)40-45 330 (8.9) 190 (5.1) 440 (12)50-55 230 (6.1) – –60-65 160 (4.2) – –
Site 20-2 41000 (1100) 32000 (870) 4400 (120)2-4 46000 (1250) 26000 (710) 6700 (180)4-6 50000 (1350) 26000 (715) 7000 (190)6-8 27000 (725) 16000 (425) 8000 (215)8-10 23000 (610) 12000 (325) 7800 (210)
10-15 16000 (430) 13000 (360) 6800 (185)20-25 13000 (360) 4100 (110) 8500 (230)30-35 190 (5) – 1900 (50)40-45 110 (3) 120 (3.3) 250 (6.8)50-55 – – –60-65 46000 (3.8) – –
––––––––––––––––––––––––––––––––––––––––––––––––––––––––––
Figure 3·59. The radiation situation on the Sukhoy Nos Peninsulain September 1977. The radiation dose rate was in excess of naturalbackground (Logachev, 2000). Red dots and associated numbers in-dicate contaminated sites referred to in the text.
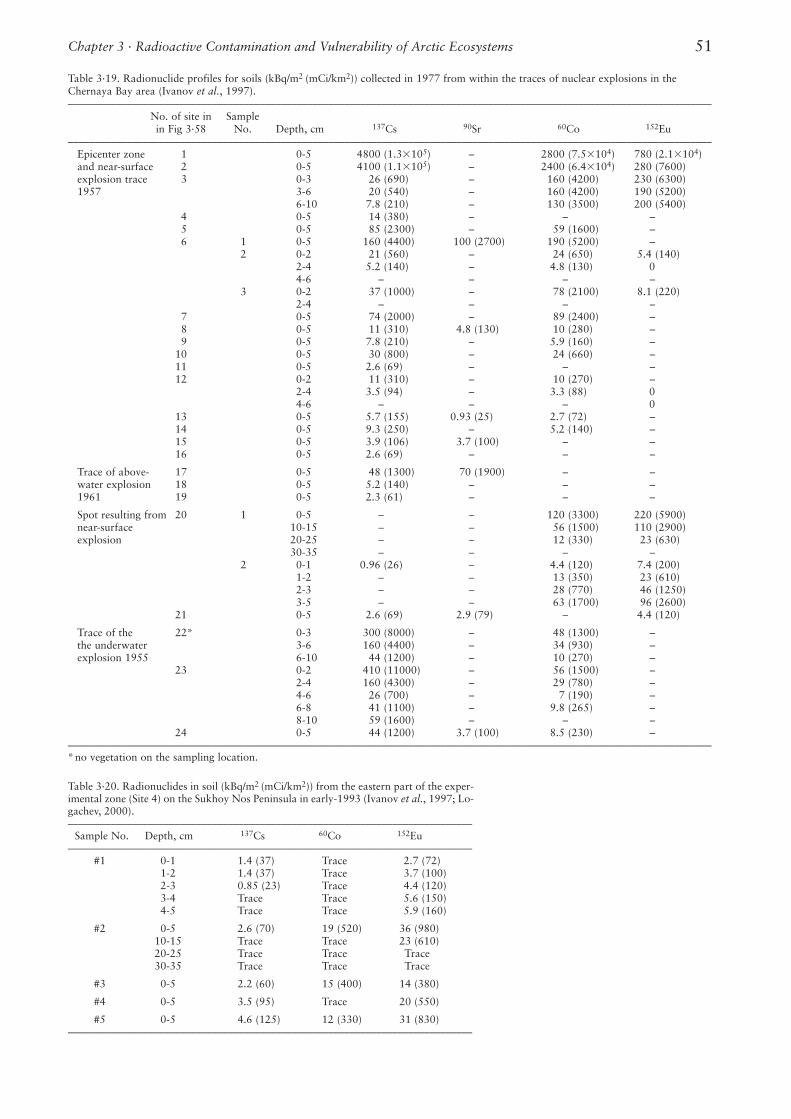
Chapter 3 · Radioactive Contamination and Vulnerability of Arctic Ecosystems 51
Table 3·19. Radionuclide profiles for soils (kBq/m2 (mCi/km2)) collected in 1977 from within the traces of nuclear explosions in theChernaya Bay area (Ivanov et al., 1997).–––––––––––––––––––––––––––––––––––––––––––––––––––––––––––––––––––––––––––––––––––––––––––––––––––––––––––––––––––––––––
No. of site in Samplein Fig 3·58 No. Depth, cm 137Cs 90Sr 60Co 152Eu
–––––––––––––––––––––––––––––––––––––––––––––––––––––––––––––––––––––––––––––––––––––––––––––––––––––––––––––––––––––––––Epicenter zone 1 0-5 4800 (1.3�105) – 2800 (7.5�104) 780 (2.1�104)and near-surface 2 0-5 4100 (1.1�105) – 2400 (6.4�104) 280 (7600)explosion trace 3 0-3 26 (690) – 160 (4200) 230 (6300)1957 3-6 20 (540) – 160 (4200) 190 (5200)
6-10 7.8 (210) – 130 (3500) 200 (5400)4 0-5 14 (380) – – –5 0-5 85 (2300) – 59 (1600) –6 1 0-5 160 (4400) 100 (2700) 190 (5200) –
2 0-2 21 (560) – 24 (650) 5.4 (140)2-4 5.2 (140) – 4.8 (130) 04-6 – – – –
3 0-2 37 (1000) – 78 (2100) 8.1 (220)2-4 – – – –
7 0-5 74 (2000) – 89 (2400) –8 0-5 11 (310) 4.8 (130) 10 (280) –9 0-5 7.8 (210) – 5.9 (160) –
10 0-5 30 (800) – 24 (660) –11 0-5 2.6 (69) – – –12 0-2 11 (310) – 10 (270) –
2-4 3.5 (94) – 3.3 (88) 04-6 – – – 0
13 0-5 5.7 (155) 0.93 (25) 2.7 (72) –14 0-5 9.3 (250) – 5.2 (140) –15 0-5 3.9 (106) 3.7 (100) – –16 0-5 2.6 (69) – – –
Trace of above- 17 0-5 48 (1300) 70 (1900) – –water explosion 18 0-5 5.2 (140) – – –1961 19 0-5 2.3 (61) – – –
Spot resulting from 20 1 0-5 – – 120 (3300) 220 (5900)near-surface 10-15 – – 56 (1500) 110 (2900)explosion 20-25 – – 12 (330) 23 (630)
30-35 – – – –2 0-1 0.96 (26) – 4.4 (120) 7.4 (200)
1-2 – – 13 (350) 23 (610)2-3 – – 28 (770) 46 (1250)3-5 – – 63 (1700) 96 (2600)
21 0-5 2.6 (69) 2.9 (79) – 4.4 (120)
Trace of the 22* 0-3 300 (8000) – 48 (1300) –the underwater 3-6 160 (4400) – 34 (930) –explosion 1955 6-10 44 (1200) – 10 (270) –
23 0-2 410 (11000) – 56 (1500) –2-4 160 (4300) – 29 (780) –4-6 26 (700) – 7 (190) –6-8 41 (1100) – 9.8 (265) –8-10 59 (1600) – – –
24 0-5 44 (1200) 3.7 (100) 8.5 (230) –––––––––––––––––––––––––––––––––––––––––––––––––––––––––––––––––––––––––––––––––––––––––––––––––––––––––––––––––––––––––– *no vegetation on the sampling location.
Table 3·20. Radionuclides in soil (kBq/m2 (mCi/km2)) from the eastern part of the exper-imental zone (Site 4) on the Sukhoy Nos Peninsula in early-1993 (Ivanov et al., 1997; Lo-gachev, 2000).––––––––––––––––––––––––––––––––––––––––––––––––––––––––––––––––––––––––––––
Sample No. Depth, cm 137Cs 60Co 152Eu––––––––––––––––––––––––––––––––––––––––––––––––––––––––––––––––––––––––––––
#1 0-1 1.4 (37) Trace 2.7 (72)1-2 1.4 (37) Trace 3.7 (100)2-3 0.85 (23) Trace 4.4 (120)3-4 Trace Trace 5.6 (150)4-5 Trace Trace 5.9 (160)
#2 0-5 2.6 (70) 19 (520) 36 (980)10-15 Trace Trace 23 (610)20-25 Trace Trace Trace30-35 Trace Trace Trace
#3 0-5 2.2 (60) 15 (400) 14 (380)
#4 0-5 3.5 (95) Trace 20 (550)
#5 0-5 4.6 (125) 12 (330) 31 (830)––––––––––––––––––––––––––––––––––––––––––––––––––––––––––––––––––––––––––––
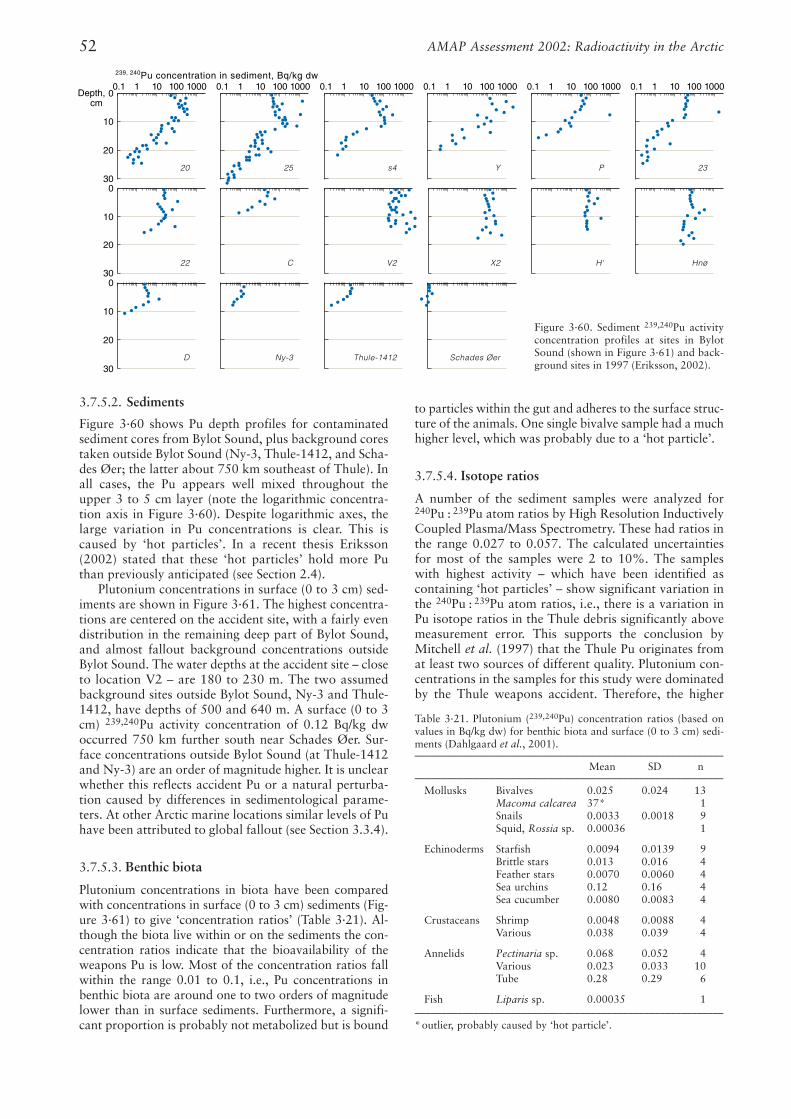
3.7.5.2. Sediments
Figure 3·60 shows Pu depth profiles for contaminatedsediment cores from Bylot Sound, plus background corestaken outside Bylot Sound (Ny-3, Thule-1412, and Scha-des Øer; the latter about 750 km southeast of Thule). Inall cases, the Pu appears well mixed throughout theupper 3 to 5 cm layer (note the logarithmic concentra-tion axis in Figure 3·60). Despite logarithmic axes, thelarge variation in Pu concentrations is clear. This iscaused by ‘hot particles’. In a recent thesis Eriksson(2002) stated that these ‘hot particles’ hold more Puthan previously anticipated (see Section 2.4).
Plutonium concentrations in surface (0 to 3 cm) sed-iments are shown in Figure 3·61. The highest concentra-tions are centered on the accident site, with a fairly evendistribution in the remaining deep part of Bylot Sound,and almost fallout background concentrations outsideBylot Sound. The water depths at the accident site – closeto location V2 – are 180 to 230 m. The two assumedbackground sites outside Bylot Sound, Ny-3 and Thule-1412, have depths of 500 and 640 m. A surface (0 to 3cm) 239,240Pu activity concentration of 0.12 Bq/kg dwoccurred 750 km further south near Schades Øer. Sur-face concentrations outside Bylot Sound (at Thule-1412and Ny-3) are an order of magnitude higher. It is unclearwhether this reflects accident Pu or a natural perturba-tion caused by differences in sedimentological parame-ters. At other Arctic marine locations similar levels of Puhave been attributed to global fallout (see Section 3.3.4).
3.7.5.3. Benthic biota
Plutonium concentrations in biota have been comparedwith concentrations in surface (0 to 3 cm) sediments (Fig-ure 3·61) to give ‘concentration ratios’ (Table 3·21). Al-though the biota live within or on the sediments the con-centration ratios indicate that the bioavailability of theweapons Pu is low. Most of the concentration ratios fallwithin the range 0.01 to 0.1, i.e., Pu concentrations inbenthic biota are around one to two orders of magnitudelower than in surface sediments. Furthermore, a signifi-cant proportion is probably not metabolized but is bound
to particles within the gut and adheres to the surface struc-ture of the animals. One single bivalve sample had a muchhigher level, which was probably due to a ‘hot particle’.
3.7.5.4. Isotope ratios
A number of the sediment samples were analyzed for240Pu : 239Pu atom ratios by High Resolution InductivelyCoupled Plasma/Mass Spectrometry. These had ratios inthe range 0.027 to 0.057. The calculated uncertaintiesfor most of the samples were 2 to 10%. The sampleswith highest activity – which have been identified ascontaining ‘hot particles’ – show significant variation inthe 240Pu : 239Pu atom ratios, i.e., there is a variation inPu isotope ratios in the Thule debris significantly abovemeasurement error. This supports the conclusion byMitchell et al. (1997) that the Thule Pu originates fromat least two sources of different quality. Plutonium con-centrations in the samples for this study were dominatedby the Thule weapons accident. Therefore, the higher
AMAP Assessment 2002: Radioactivity in the Arctic52
100 10001010.1 100 10001010.1 100 10001010.1 100 10001010.1 100 10001010.1 100 10001010.1
30
20
10
0Depth,cm
30
20
10
0
30
20
10
0
239, 240Pu concentration in sediment, Bq/kg dw
20 25 s4 Y P 23
22 C V2 X2 H' Hnø
D Ny-3 Thule-1412 Schades Øer
Table 3·21. Plutonium (239,240Pu) concentration ratios (based onvalues in Bq/kg dw) for benthic biota and surface (0 to 3 cm) sedi-ments (Dahlgaard et al., 2001). ––––––––––––––––––––––––––––––––––––––––––––––––––––––––––
Mean SD n––––––––––––––––––––––––––––––––––––––––––––––––––––––––––
Mollusks Bivalves 0.025 0.024 13Macoma calcarea 37* 1Snails 0.0033 0.0018 9Squid, Rossia sp. 0.00036 1
Echinoderms Starfish 0.0094 0.0139 9Brittle stars 0.013 0.016 4Feather stars 0.0070 0.0060 4Sea urchins 0.12 0.16 4Sea cucumber 0.0080 0.0083 4
Crustaceans Shrimp 0.0048 0.0088 4Various 0.038 0.039 4
Annelids Pectinaria sp. 0.068 0.052 4Various 0.023 0.033 10Tube 0.28 0.29 6
Fish Liparis sp. 0.00035 1–––––––––––––––––––––––––––––––––––––––––––––––––––––––––– *outlier, probably caused by ‘hot particle’.
Figure 3·60. Sediment 239,240Pu activityconcentration profiles at sites in BylotSound (shown in Figure 3·61) and back-ground sites in 1997 (Eriksson, 2002).
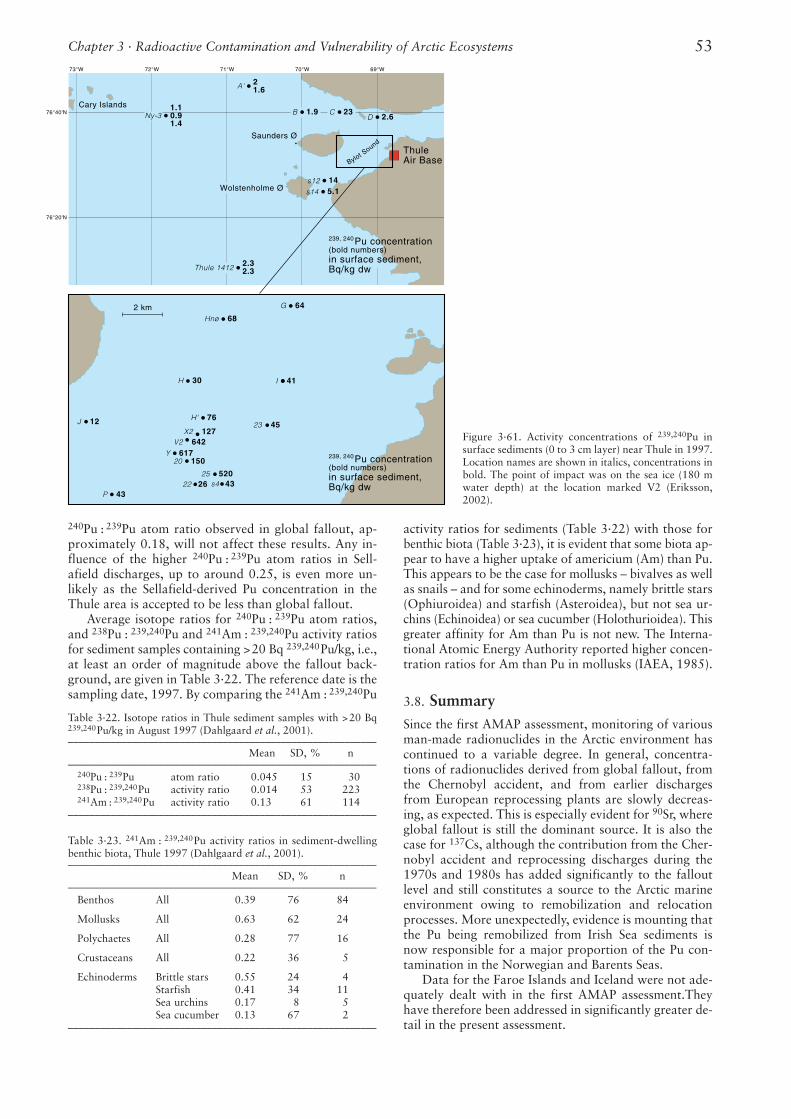
240Pu : 239Pu atom ratio observed in global fallout, ap-proximately 0.18, will not affect these results. Any in-fluence of the higher 240Pu : 239Pu atom ratios in Sell-afield discharges, up to around 0.25, is even more un-likely as the Sellafield-derived Pu concentration in theThule area is accepted to be less than global fallout.
Average isotope ratios for 240Pu : 239Pu atom ratios,and 238Pu : 239,240Pu and 241Am : 239,240Pu activity ratiosfor sediment samples containing >20 Bq 239,240Pu/kg, i.e.,at least an order of magnitude above the fallout back-ground, are given in Table 3·22. The reference date is thesampling date, 1997. By comparing the 241Am : 239,240Pu
activity ratios for sediments (Table 3·22) with those forbenthic biota (Table 3·23), it is evident that some biota ap-pear to have a higher uptake of americium (Am) than Pu.This appears to be the case for mollusks – bivalves as wellas snails – and for some echinoderms, namely brittle stars(Ophiuroidea) and starfish (Asteroidea), but not sea ur-chins (Echinoidea) or sea cucumber (Holothurioidea). Thisgreater affinity for Am than Pu is not new. The Interna-tional Atomic Energy Authority reported higher concen-tration ratios for Am than Pu in mollusks (IAEA, 1985).
3.8. SummarySince the first AMAP assessment, monitoring of variousman-made radionuclides in the Arctic environment hascontinued to a variable degree. In general, concentra-tions of radionuclides derived from global fallout, fromthe Chernobyl accident, and from earlier dischargesfrom European reprocessing plants are slowly decreas-ing, as expected. This is especially evident for 90Sr, whereglobal fallout is still the dominant source. It is also thecase for 137Cs, although the contribution from the Cher-nobyl accident and reprocessing discharges during the1970s and 1980s has added significantly to the falloutlevel and still constitutes a source to the Arctic marineenvironment owing to remobilization and relocationprocesses. More unexpectedly, evidence is mounting thatthe Pu being remobilized from Irish Sea sediments isnow responsible for a major proportion of the Pu con-tamination in the Norwegian and Barents Seas.
Data for the Faroe Islands and Iceland were not ade-quately dealt with in the first AMAP assessment.Theyhave therefore been addressed in significantly greater de-tail in the present assessment.
Chapter 3 · Radioactive Contamination and Vulnerability of Arctic Ecosystems 53
ThuleAir Base
Wolstenholme Ø
Saunders Ø
Cary IslandsNy-3
1.10.91.4
D 2.6
s12 14
Thule 1412 2.32.3
G 64
Hnø 68
H 30 I 41
J 12 H' 76
X2 127V2 642
Y 61720 150
25 520
P 4322 26
23 45
s4 43
s14 5.1
B 1.9 C 23
A' 21.6
239, 240Pu concentration(bold numbers)in surface sediment, Bq/kg dw
239, 240Pu concentration(bold numbers)in surface sediment, Bq/kg dw
73°W
76°40'N
76°20'N
72°W 71°W 70°W 69°W
dnuoStolyB
2 km
Table 3·22. Isotope ratios in Thule sediment samples with >20 Bq239,240Pu/kg in August 1997 (Dahlgaard et al., 2001).––––––––––––––––––––––––––––––––––––––––––––––––––––––––––
Mean SD, % n––––––––––––––––––––––––––––––––––––––––––––––––––––––––––
240Pu : 239Pu atom ratio 0.045 15 30238Pu : 239,240Pu activity ratio 0.014 53 223241Am : 239,240Pu activity ratio 0.13 61 114
––––––––––––––––––––––––––––––––––––––––––––––––––––––––––
Table 3·23. 241Am : 239,240Pu activity ratios in sediment-dwellingbenthic biota, Thule 1997 (Dahlgaard et al., 2001).––––––––––––––––––––––––––––––––––––––––––––––––––––––––––
Mean SD, % n––––––––––––––––––––––––––––––––––––––––––––––––––––––––––
Benthos All 0.39 76 84
Mollusks All 0.63 62 24
Polychaetes All 0.28 77 16
Crustaceans All 0.22 36 5
Echinoderms Brittle stars 0.55 24 4Starfish 0.41 34 11Sea urchins 0.17 8 5Sea cucumber 0.13 67 2
––––––––––––––––––––––––––––––––––––––––––––––––––––––––––
Figure 3·61. Activity concentrations of 239,240Pu insurface sediments (0 to 3 cm layer) near Thule in 1997.Location names are shown in italics, concentrations inbold. The point of impact was on the sea ice (180 mwater depth) at the location marked V2 (Eriksson,2002).
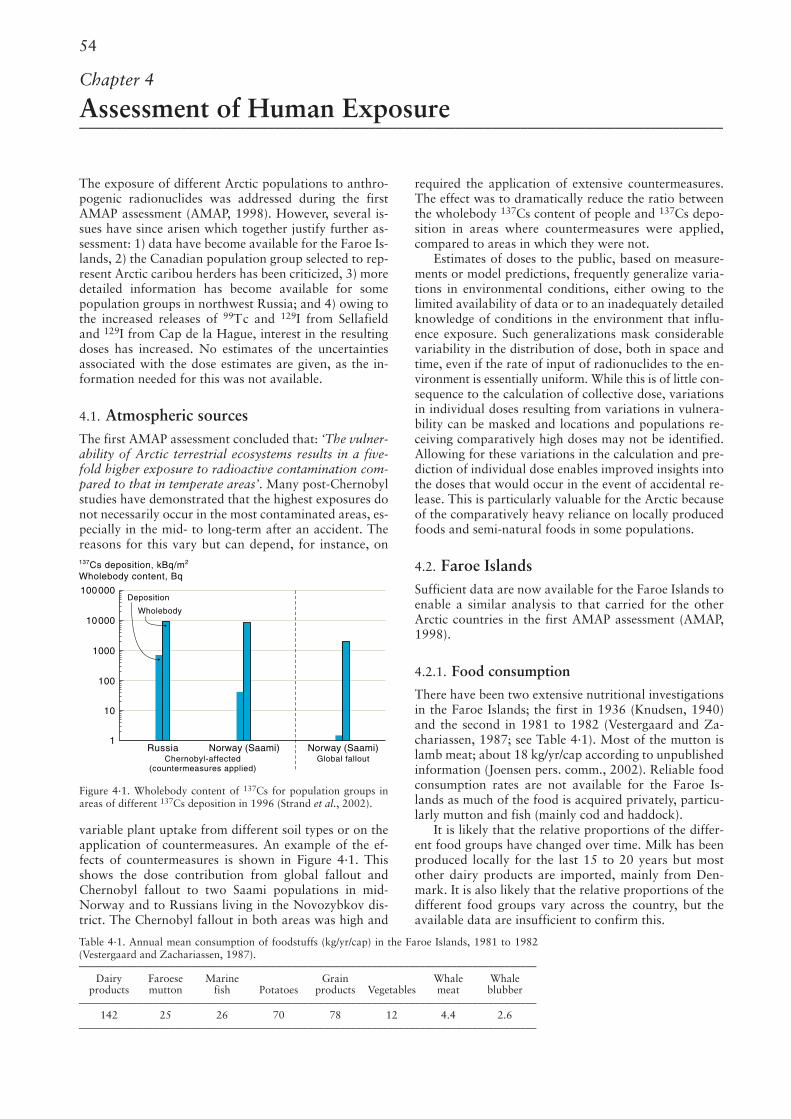
The exposure of different Arctic populations to anthro-pogenic radionuclides was addressed during the firstAMAP assessment (AMAP, 1998). However, several is-sues have since arisen which together justify further as-sessment: 1) data have become available for the Faroe Is-lands, 2) the Canadian population group selected to rep-resent Arctic caribou herders has been criticized, 3) moredetailed information has become available for somepopulation groups in northwest Russia; and 4) owing tothe increased releases of 99Tc and 129I from Sellafieldand 129I from Cap de la Hague, interest in the resultingdoses has increased. No estimates of the uncertaintiesassociated with the dose estimates are given, as the in-formation needed for this was not available.
4.1. Atmospheric sourcesThe first AMAP assessment concluded that: ‘The vulner-ability of Arctic terrestrial ecosystems results in a five-fold higher exposure to radioactive contamination com-pared to that in temperate areas’. Many post-Chernobylstudies have demonstrated that the highest exposures donot necessarily occur in the most contaminated areas, es-pecially in the mid- to long-term after an accident. Thereasons for this vary but can depend, for instance, on
variable plant uptake from different soil types or on theapplication of countermeasures. An example of the ef-fects of countermeasures is shown in Figure 4·1. Thisshows the dose contribution from global fallout andChernobyl fallout to two Saami populations in mid-Norway and to Russians living in the Novozybkov dis-trict. The Chernobyl fallout in both areas was high and
required the application of extensive countermeasures.The effect was to dramatically reduce the ratio betweenthe wholebody 137Cs content of people and 137Cs depo-sition in areas where countermeasures were applied,compared to areas in which they were not.
Estimates of doses to the public, based on measure-ments or model predictions, frequently generalize varia-tions in environmental conditions, either owing to thelimited availability of data or to an inadequately detailedknowledge of conditions in the environment that influ-ence exposure. Such generalizations mask considerablevariability in the distribution of dose, both in space andtime, even if the rate of input of radionuclides to the en-vironment is essentially uniform. While this is of little con-sequence to the calculation of collective dose, variationsin individual doses resulting from variations in vulnera-bility can be masked and locations and populations re-ceiving comparatively high doses may not be identified.Allowing for these variations in the calculation and pre-diction of individual dose enables improved insights intothe doses that would occur in the event of accidental re-lease. This is particularly valuable for the Arctic becauseof the comparatively heavy reliance on locally producedfoods and semi-natural foods in some populations.
4.2. Faroe IslandsSufficient data are now available for the Faroe Islands toenable a similar analysis to that carried for the otherArctic countries in the first AMAP assessment (AMAP,1998).
4.2.1. Food consumption
There have been two extensive nutritional investigationsin the Faroe Islands; the first in 1936 (Knudsen, 1940)and the second in 1981 to 1982 (Vestergaard and Za-chariassen, 1987; see Table 4·1). Most of the mutton islamb meat; about 18 kg/yr/cap according to unpublishedinformation (Joensen pers. comm., 2002). Reliable foodconsumption rates are not available for the Faroe Is-lands as much of the food is acquired privately, particu-larly mutton and fish (mainly cod and haddock).
It is likely that the relative proportions of the differ-ent food groups have changed over time. Milk has beenproduced locally for the last 15 to 20 years but mostother dairy products are imported, mainly from Den-mark. It is also likely that the relative proportions of thedifferent food groups vary across the country, but theavailable data are insufficient to confirm this.
54
Chapter 4
Assessment of Human Exposure –––––––––––––––––––––––––––––––––––––––––––––––––––––––––––––––––––––––––––––––––––––––––
Deposition
Wholebody
Russia Norway (Saami) Norway (Saami)Global fallout
137Cs deposition, kBq/m2
Wholebody content, Bq
100000
10000
1000
100
10
1
Chernobyl-affected(countermeasures applied)
Table 4·1. Annual mean consumption of foodstuffs (kg/yr/cap) in the Faroe Islands, 1981 to 1982(Vestergaard and Zachariassen, 1987).––––––––––––––––––––––––––––––––––––––––––––––––––––––––––––––––––––––––––––––––––––––
Dairy Faroese Marine Grain Whale Whaleproducts mutton fish Potatoes products Vegetables meat blubber
––––––––––––––––––––––––––––––––––––––––––––––––––––––––––––––––––––––––––––––––––––––142 25 26 70 78 12 4.4 2.6
––––––––––––––––––––––––––––––––––––––––––––––––––––––––––––––––––––––––––––––––––––––
Figure 4·1. Wholebody content of 137Cs for population groups inareas of different 137Cs deposition in 1996 (Strand et al., 2002).
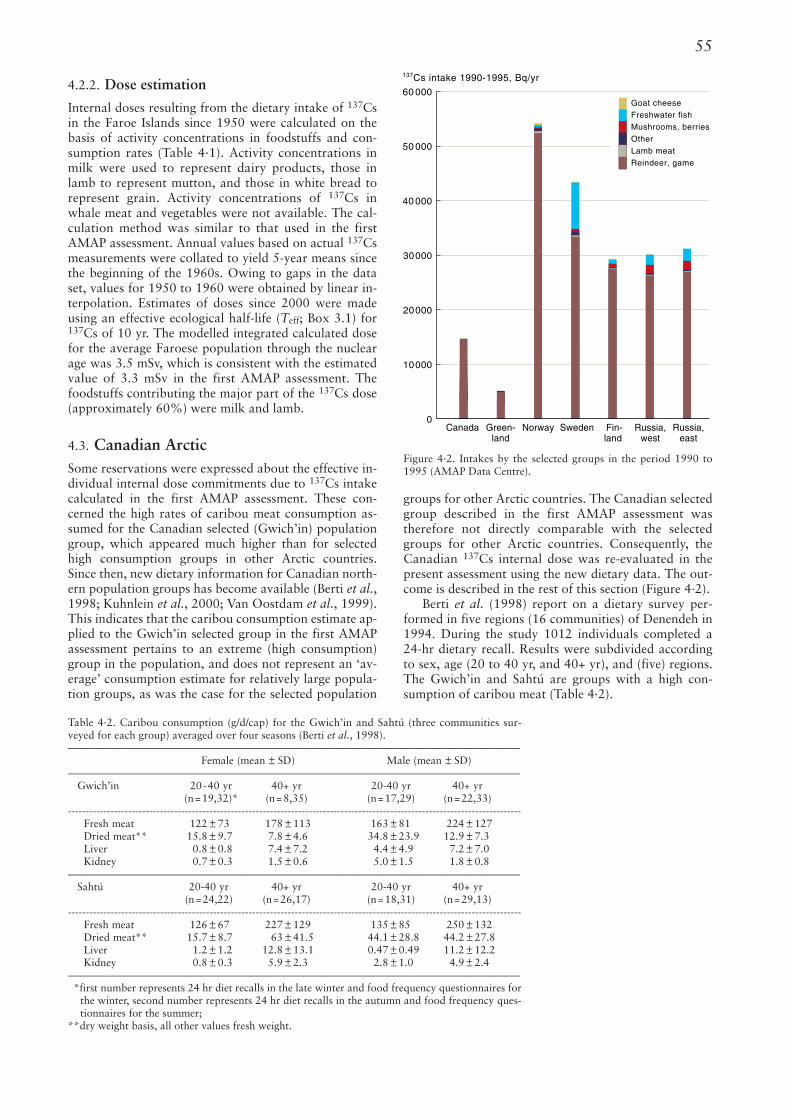
4.2.2. Dose estimation
Internal doses resulting from the dietary intake of 137Csin the Faroe Islands since 1950 were calculated on thebasis of activity concentrations in foodstuffs and con-sumption rates (Table 4·1). Activity concentrations inmilk were used to represent dairy products, those inlamb to represent mutton, and those in white bread torepresent grain. Activity concentrations of 137Cs inwhale meat and vegetables were not available. The cal-culation method was similar to that used in the firstAMAP assessment. Annual values based on actual 137Csmeasurements were collated to yield 5-year means sincethe beginning of the 1960s. Owing to gaps in the dataset, values for 1950 to 1960 were obtained by linear in-terpolation. Estimates of doses since 2000 were madeusing an effective ecological half-life (Teff; Box 3.1) for137Cs of 10 yr. The modelled integrated calculated dosefor the average Faroese population through the nuclearage was 3.5 mSv, which is consistent with the estimatedvalue of 3.3 mSv in the first AMAP assessment. Thefoodstuffs contributing the major part of the 137Cs dose(approximately 60%) were milk and lamb.
4.3. Canadian ArcticSome reservations were expressed about the effective in-dividual internal dose commitments due to 137Cs intakecalculated in the first AMAP assessment. These con-cerned the high rates of caribou meat consumption as-sumed for the Canadian selected (Gwich’in) populationgroup, which appeared much higher than for selectedhigh consumption groups in other Arctic countries.Since then, new dietary information for Canadian north-ern population groups has become available (Berti et al.,1998; Kuhnlein et al., 2000; Van Oostdam et al., 1999).This indicates that the caribou consumption estimate ap-plied to the Gwich’in selected group in the first AMAPassessment pertains to an extreme (high consumption)group in the population, and does not represent an ‘av-erage’ consumption estimate for relatively large popula-tion groups, as was the case for the selected population
groups for other Arctic countries. The Canadian selectedgroup described in the first AMAP assessment wastherefore not directly comparable with the selectedgroups for other Arctic countries. Consequently, theCanadian 137Cs internal dose was re-evaluated in thepresent assessment using the new dietary data. The out-come is described in the rest of this section (Figure 4·2).
Berti et al. (1998) report on a dietary survey per-formed in five regions (16 communities) of Denendeh in1994. During the study 1012 individuals completed a24-hr dietary recall. Results were subdivided accordingto sex, age (20 to 40 yr, and 40+ yr), and (five) regions.The Gwich’in and Sahtú are groups with a high con-sumption of caribou meat (Table 4·2).
55
Canada Green-land
Norway Sweden Fin-land
Russia,west
Russia,east
60 000
50 000
40 000
30000
20000
10000
0
137Cs intake 1990-1995, Bq/yr
Goat cheese
Freshwater fish
Mushrooms, berries
Other
Lamb meat
Reindeer, game
Table 4·2. Caribou consumption (g/d/cap) for the Gwich’in and Sahtú (three communities sur-veyed for each group) averaged over four seasons (Berti et al., 1998).–––––––––––––––––––––––––––––––––––––––––––––––––––––––––––––––––––––––––––––––––––––
Female (mean ± SD) Male (mean ± SD)–––––––––––––––––––––––––––––––––––––––––––––––––––––––––––––––––––––––––––––––––––––
Gwich’in 20-40 yr 40+ yr 20-40 yr 40+ yr(n=19,32)* (n=8,35) (n=17,29) (n=22,33)
--------------------------------------------------------------------------------------------------------------------------------Fresh meat 122 ± 73 178 ± 113 163 ± 81 224 ± 127Dried meat** 15.8 ± 9.7 7.8 ± 4.6 34.8 ± 23.9 12.9 ± 7.3Liver 0.8 ± 0.8 7.4 ± 7.2 4.4 ± 4.9 7.2 ± 7.0Kidney 0.7 ± 0.3 1.5 ± 0.6 5.0 ± 1.5 1.8 ± 0.8
–––––––––––––––––––––––––––––––––––––––––––––––––––––––––––––––––––––––––––––––––––––Sahtú 20-40 yr 40+ yr 20-40 yr 40+ yr
(n=24,22) (n=26,17) (n=18,31) (n=29,13)--------------------------------------------------------------------------------------------------------------------------------
Fresh meat 126 ± 67 227 ± 129 135 ± 85 250 ± 132Dried meat** 15.7 ± 8.7 63 ± 41.5 44.1 ± 28.8 44.2 ± 27.8Liver 1.2 ± 1.2 12.8 ± 13.1 0.47 ± 0.49 11.2 ± 12.2Kidney 0.8 ± 0.3 5.9 ± 2.3 2.8 ± 1.0 4.9 ± 2.4
–––––––––––––––––––––––––––––––––––––––––––––––––––––––––––––––––––––––––––––––––––––*first number represents 24 hr diet recalls in the late winter and food frequency questionnaires for
the winter, second number represents 24 hr diet recalls in the autumn and food frequency ques-tionnaires for the summer;
**dry weight basis, all other values fresh weight.
Figure 4·2. Intakes by the selected groups in the period 1990 to1995 (AMAP Data Centre).
The Canadian Inuit also exhibit high intakes of cari-bou meat and other caribou products. Average dailyconsumption data for four Inuit regions are presentedin Table 4·3. These data are based on 24 hr dietary re-calls for individuals that had eaten caribou within theprevious 24 hours (Kuhnlein et al., 2000). The data re-veal a high degree of variability in the frequency andamount of caribou consumed. Table 4·3 shows the av-erage consumption for the groups as whole. Withineach of these groups it is evident that the heaviest con-sumers had a fresh caribou meat intake of around 500to 850 g/d on the days that they ate caribou during au-tumn and winter. Adding the consumption of othercaribou products, especially dried meat, meant the totalindividual caribou product consumption rates couldexceed 1 kg/d on certain days. Obviously, these highconsumers represent a limited proportion of the popu-lation as a whole. Average consumption rates in the Can-adian north are more typically around 100 to 400 g/d(Kuhnlein et al., 2000; Table 4·3). These new data donot support the average consumption rate of 1000 g/dused in the first AMAP assessment, which would implythat individuals were consuming 1000 g of cariboumeat per day seven days a week throughout the year.
Although this new information indicates that the con-sumption rates for caribou meat in the selected Gwich’inpopulation group, for which exposure calculations wereperformed in the first AMAP assessment, may havebeen substantially overestimated, it appears that thereare individuals within the Canadian Arctic that period-ically have consumption rates of a comparable mag-nitude.
The selected groups from the other Arctic countriesrepresent ‘average consumers’ among larger groups in-volved in caribou/reindeer herding. The values for cari-bou/reindeer consumption were therefore lower thanthose used for Canada. The first AMAP assessment con-cluded that ‘It cannot be ruled out that there are smallnumbers of individuals within other Arctic countrieshaving similar dietary habits as the selected Canadiancommunity. Accordingly, comparable or higher dosesthan those calculated for the Canadian selected groupmay exist within the Arctic’.
Figure 4·2 shows a revised comparison of 137Cs in-take among selected groups using the new Canadian in-take data (Berti et al., 1998). The data for the selectedCanadian group are now more comparable with thosefor the selected groups in other Arctic countries.
AMAP Assessment 2002: Radioactivity in the Arctic56
Table 4·3. Average daily intakes (g ±SE) of caribou in Arctic Canada (after Kuhnlein et al., 2000).–––––––––––––––––––––––––––––––––––––––––––––––––––––––––––––––––––––––––––––––––––––––––––––––––––
15-19 yr n 20-40 yr n 41-60 yr n 61+ yr n–––––––––––––––––––––––––––––––––––––––––––––––––––––––––––––––––––––––––––––––––––––––––––––––––––
Inuvialuit – malesMeat 88 24 132 100 114 32 72 14Dried meat* – 24 22 100 12 32 18 14Ribs – 24 7 100 27 32 16 14Bone marrow – 24 1 100 4 32 – 14Liver – 24 – 100 4 32 – 14Heart – 24 – 100 4 32 – 14Kidney – 24 – 100 4 32 – 14
-----------------------------------------------------------------------------------------------------------------------------------------------------Kivalliq – males
Meat 428 7 259 87 365 33 440 15Fat – 7 12 87 – 33 56 15Ribs – 7 3 87 – 33 5 15Dried meat* – 7 4 87 – 33 7 15Bone marrow – 7 2 87 23 33 – 15Tongue – 7 – 87 – 33 14 15Intestine – 7 1 87 – 33 – 15Stomach contents – 7 2 87 – 33 – 15Stomach – 7 1 87 – 33 – 15
----------------------------------------------------------------------------------------------------------------------------------------------------- Baffin – males
Meat 204 24 106 112 164 82 235 20Fat – 24 4 112 10 82 – 20Dried meat* 2 24 3 112 6 82 – 20Intestine – 24 – 112 6 82 – 20Stomach – 24 – 112 10 82 – 20Bone marrow – 24 – 112 10 82 – 20Liver – 24 – 112 6 82 – 20Kidney – 24 2 112 0.1 82 – 20Cartilage – 24 2 112 – 82 – 20
----------------------------------------------------------------------------------------------------------------------------------------------------- Labrador – males
Meat 142 18 148 80 135 68 74 21Dried meat* – 18 13 80 2 68 – 21Heart – 18 6 80 – 68 25 21Ribs – 18 6 80 – 68 – 21Tongue – 18 – 80 – 68 6 21Bone marrow – 18 – 80 0.5 68 – 21
––––––––––––––––––––––––––––––––––––––––––––––––––––––––––––––––––––––––––––––––––––––––––––––––––– n = number of 24 hr diet recalls and food frequency questionnaires in the autumn and late winter; *dry weight basis, all other values fresh weight.
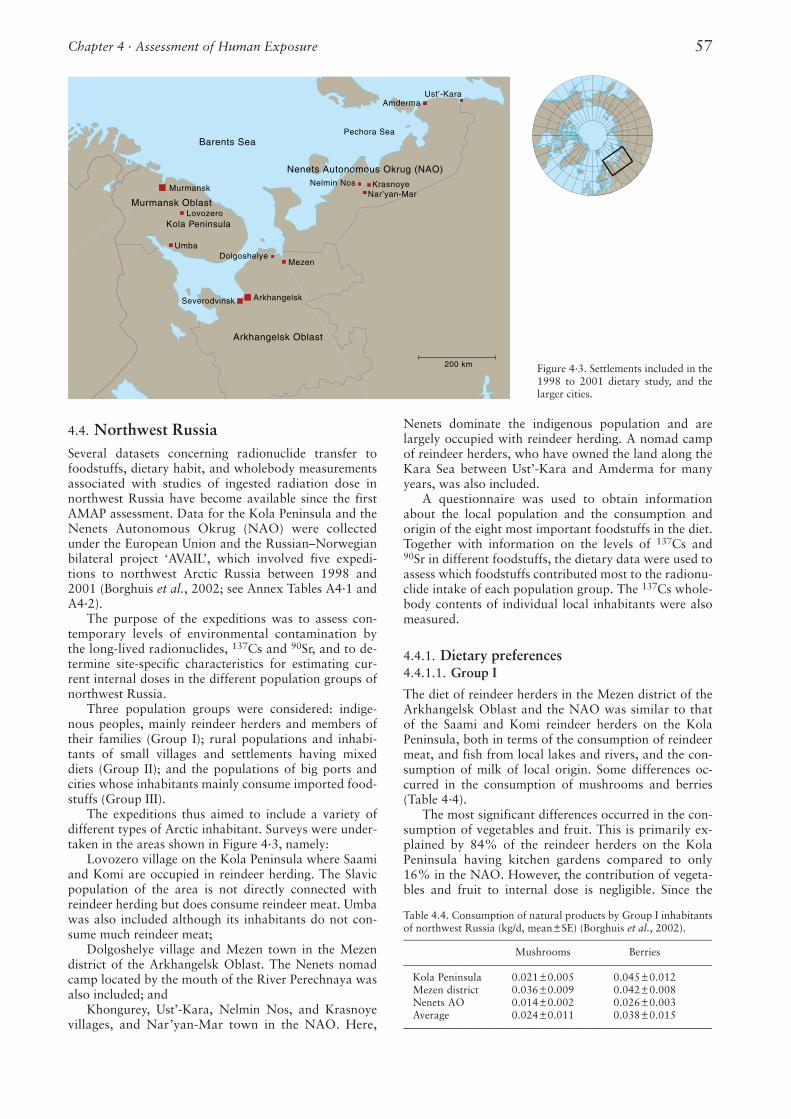
4.4. Northwest RussiaSeveral datasets concerning radionuclide transfer tofoodstuffs, dietary habit, and wholebody measurementsassociated with studies of ingested radiation dose innorthwest Russia have become available since the firstAMAP assessment. Data for the Kola Peninsula and theNenets Autonomous Okrug (NAO) were collectedunder the European Union and the Russian–Norwegianbilateral project ‘AVAIL’, which involved five expedi-tions to northwest Arctic Russia between 1998 and2001 (Borghuis et al., 2002; see Annex Tables A4·1 andA4·2).
The purpose of the expeditions was to assess con-temporary levels of environmental contamination bythe long-lived radionuclides, 137Cs and 90Sr, and to de-termine site-specific characteristics for estimating cur-rent internal doses in the different population groups ofnorthwest Russia.
Three population groups were considered: indige-nous peoples, mainly reindeer herders and members oftheir families (Group I); rural populations and inhabi-tants of small villages and settlements having mixeddiets (Group II); and the populations of big ports andcities whose inhabitants mainly consume imported food-stuffs (Group III).
The expeditions thus aimed to include a variety ofdifferent types of Arctic inhabitant. Surveys were under-taken in the areas shown in Figure 4·3, namely:
Lovozero village on the Kola Peninsula where Saamiand Komi are occupied in reindeer herding. The Slavicpopulation of the area is not directly connected withreindeer herding but does consume reindeer meat. Umbawas also included although its inhabitants do not con-sume much reindeer meat;
Dolgoshelye village and Mezen town in the Mezendistrict of the Arkhangelsk Oblast. The Nenets nomadcamp located by the mouth of the River Perechnaya wasalso included; and
Khongurey, Ust’-Kara, Nelmin Nos, and Krasnoyevillages, and Nar’yan-Mar town in the NAO. Here,
Nenets dominate the indigenous population and arelargely occupied with reindeer herding. A nomad campof reindeer herders, who have owned the land along theKara Sea between Ust’-Kara and Amderma for manyyears, was also included.
A questionnaire was used to obtain informationabout the local population and the consumption andorigin of the eight most important foodstuffs in the diet.Together with information on the levels of 137Cs and90Sr in different foodstuffs, the dietary data were used toassess which foodstuffs contributed most to the radionu-clide intake of each population group. The 137Cs whole-body contents of individual local inhabitants were alsomeasured.
4.4.1. Dietary preferences4.4.1.1. Group I
The diet of reindeer herders in the Mezen district of theArkhangelsk Oblast and the NAO was similar to thatof the Saami and Komi reindeer herders on the KolaPeninsula, both in terms of the consumption of reindeermeat, and fish from local lakes and rivers, and the con-sumption of milk of local origin. Some differences oc-curred in the consumption of mushrooms and berries(Table 4·4).
The most significant differences occurred in the con-sumption of vegetables and fruit. This is primarily ex-plained by 84% of the reindeer herders on the KolaPeninsula having kitchen gardens compared to only16% in the NAO. However, the contribution of vegeta-bles and fruit to internal dose is negligible. Since the
Chapter 4 · Assessment of Human Exposure 57
Barents SeaPechora Sea
Kola Peninsula
Arkhangelsk Oblast
Murmansk Oblast
Nenets Autonomous Okrug (NAO)
Murmansk
Arkhangelsk
Mezen
Lovozero
UmbaDolgoshelye
Nar’yan-MarKrasnoye
AmdermaUst’-Kara
Severodvinsk
200 km
Nelmin Nos
Figure 4·3. Settlements included in the1998 to 2001 dietary study, and thelarger cities.
Table 4.4. Consumption of natural products by Group I inhabitantsof northwest Russia (kg/d, mean±SE) (Borghuis et al., 2002).––––––––––––––––––––––––––––––––––––––––––––––––––––––––––
Mushrooms Berries––––––––––––––––––––––––––––––––––––––––––––––––––––––––––
Kola Peninsula 0.021±0.005 0.045±0.012Mezen district 0.036±0.009 0.042±0.008Nenets AO 0.014±0.002 0.026±0.003Average 0.024±0.011 0.038±0.015
––––––––––––––––––––––––––––––––––––––––––––––––––––––––––
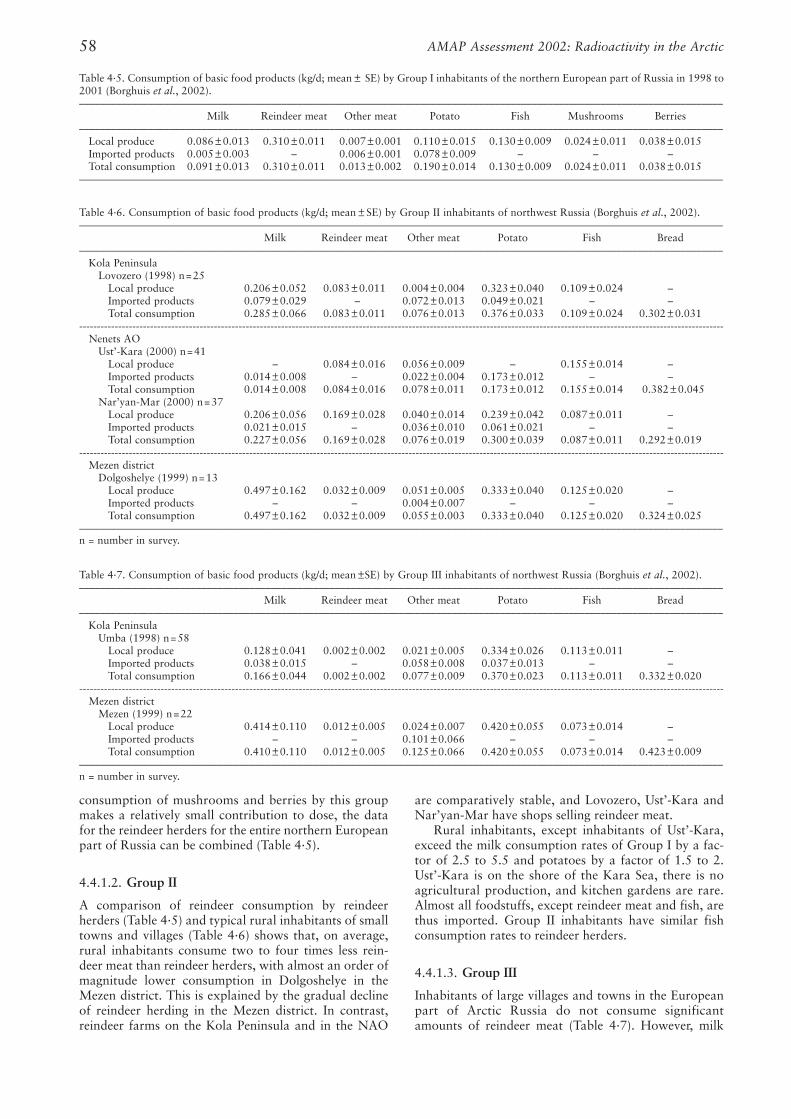
consumption of mushrooms and berries by this groupmakes a relatively small contribution to dose, the datafor the reindeer herders for the entire northern Europeanpart of Russia can be combined (Table 4·5).
4.4.1.2. Group II
A comparison of reindeer consumption by reindeerherders (Table 4·5) and typical rural inhabitants of smalltowns and villages (Table 4·6) shows that, on average,rural inhabitants consume two to four times less rein-deer meat than reindeer herders, with almost an order ofmagnitude lower consumption in Dolgoshelye in theMezen district. This is explained by the gradual declineof reindeer herding in the Mezen district. In contrast,reindeer farms on the Kola Peninsula and in the NAO
are comparatively stable, and Lovozero, Ust’-Kara andNar’yan-Mar have shops selling reindeer meat.
Rural inhabitants, except inhabitants of Ust’-Kara,exceed the milk consumption rates of Group I by a fac-tor of 2.5 to 5.5 and potatoes by a factor of 1.5 to 2.Ust’-Kara is on the shore of the Kara Sea, there is noagricultural production, and kitchen gardens are rare.Almost all foodstuffs, except reindeer meat and fish, arethus imported. Group II inhabitants have similar fishconsumption rates to reindeer herders.
4.4.1.3. Group III
Inhabitants of large villages and towns in the Europeanpart of Arctic Russia do not consume significantamounts of reindeer meat (Table 4·7). However, milk
AMAP Assessment 2002: Radioactivity in the Arctic58
Table 4·5. Consumption of basic food products (kg/d; mean ± SE) by Group I inhabitants of the northern European part of Russia in 1998 to2001 (Borghuis et al., 2002).–––––––––––––––––––––––––––––––––––––––––––––––––––––––––––––––––––––––––––––––––––––––––––––––––––––––––––––––––––––––––
Milk Reindeer meat Other meat Potato Fish Mushrooms Berries–––––––––––––––––––––––––––––––––––––––––––––––––––––––––––––––––––––––––––––––––––––––––––––––––––––––––––––––––––––––––
Local produce 0.086±0.013 0.310±0.011 0.007±0.001 0.110±0.015 0.130±0.009 0.024±0.011 0.038±0.015Imported products 0.005±0.003 – 0.006±0.001 0.078±0.009 – – –Total consumption 0.091±0.013 0.310±0.011 0.013±0.002 0.190±0.014 0.130±0.009 0.024±0.011 0.038±0.015
–––––––––––––––––––––––––––––––––––––––––––––––––––––––––––––––––––––––––––––––––––––––––––––––––––––––––––––––––––––––––
Table 4·6. Consumption of basic food products (kg/d; mean ± SE) by Group II inhabitants of northwest Russia (Borghuis et al., 2002).–––––––––––––––––––––––––––––––––––––––––––––––––––––––––––––––––––––––––––––––––––––––––––––––––––––––––––––––––––––––––
Milk Reindeer meat Other meat Potato Fish Bread–––––––––––––––––––––––––––––––––––––––––––––––––––––––––––––––––––––––––––––––––––––––––––––––––––––––––––––––––––––––––
Kola PeninsulaLovozero (1998) n=25
Local produce 0.206±0.052 0.083±0.011 0.004±0.004 0.323±0.040 0.109±0.024 –Imported products 0.079±0.029 – 0.072±0.013 0.049±0.021 – –Total consumption 0.285±0.066 0.083±0.011 0.076±0.013 0.376±0.033 0.109±0.024 0.302±0.031
--------------------------------------------------------------------------------------------------------------------------------------------------------------------------------------Nenets AO
Ust’-Kara (2000) n=41Local produce – 0.084±0.016 0.056±0.009 – 0.155±0.014 –Imported products 0.014±0.008 – 0.022±0.004 0.173±0.012 – –Total consumption 0.014±0.008 0.084±0.016 0.078±0.011 0.173±0.012 0.155±0.014 0.382±0.045
Nar’yan-Mar (2000) n=37Local produce 0.206±0.056 0.169±0.028 0.040±0.014 0.239±0.042 0.087±0.011 –Imported products 0.021±0.015 – 0.036±0.010 0.061±0.021 – –Total consumption 0.227±0.056 0.169±0.028 0.076±0.019 0.300±0.039 0.087±0.011 0.292±0.019
-------------------------------------------------------------------------------------------------------------------------------------------------------------------------------------- Mezen district
Dolgoshelye (1999) n=13Local produce 0.497±0.162 0.032±0.009 0.051±0.005 0.333±0.040 0.125±0.020 –Imported products – – 0.004±0.007 – – –Total consumption 0.497±0.162 0.032±0.009 0.055±0.003 0.333±0.040 0.125±0.020 0.324±0.025
––––––––––––––––––––––––––––––––––––––––––––––––––––––––––––––––––––––––––––––––––––––––––––––––––––––––––––––––––––––––– n = number in survey.
Table 4·7. Consumption of basic food products (kg/d; mean ±SE) by Group III inhabitants of northwest Russia (Borghuis et al., 2002).–––––––––––––––––––––––––––––––––––––––––––––––––––––––––––––––––––––––––––––––––––––––––––––––––––––––––––––––––––––––––
Milk Reindeer meat Other meat Potato Fish Bread–––––––––––––––––––––––––––––––––––––––––––––––––––––––––––––––––––––––––––––––––––––––––––––––––––––––––––––––––––––––––
Kola PeninsulaUmba (1998) n=58
Local produce 0.128±0.041 0.002±0.002 0.021±0.005 0.334±0.026 0.113±0.011 –Imported products 0.038±0.015 – 0.058±0.008 0.037±0.013 – –Total consumption 0.166±0.044 0.002±0.002 0.077±0.009 0.370±0.023 0.113±0.011 0.332±0.020
-------------------------------------------------------------------------------------------------------------------------------------------------------------------------------------- Mezen district
Mezen (1999) n=22Local produce 0.414±0.110 0.012±0.005 0.024±0.007 0.420±0.055 0.073±0.014 –Imported products – – 0.101±0.066 – – –Total consumption 0.410±0.110 0.012±0.005 0.125±0.066 0.420±0.055 0.073±0.014 0.423±0.009
–––––––––––––––––––––––––––––––––––––––––––––––––––––––––––––––––––––––––––––––––––––––––––––––––––––––––––––––––––––––––n = number in survey.
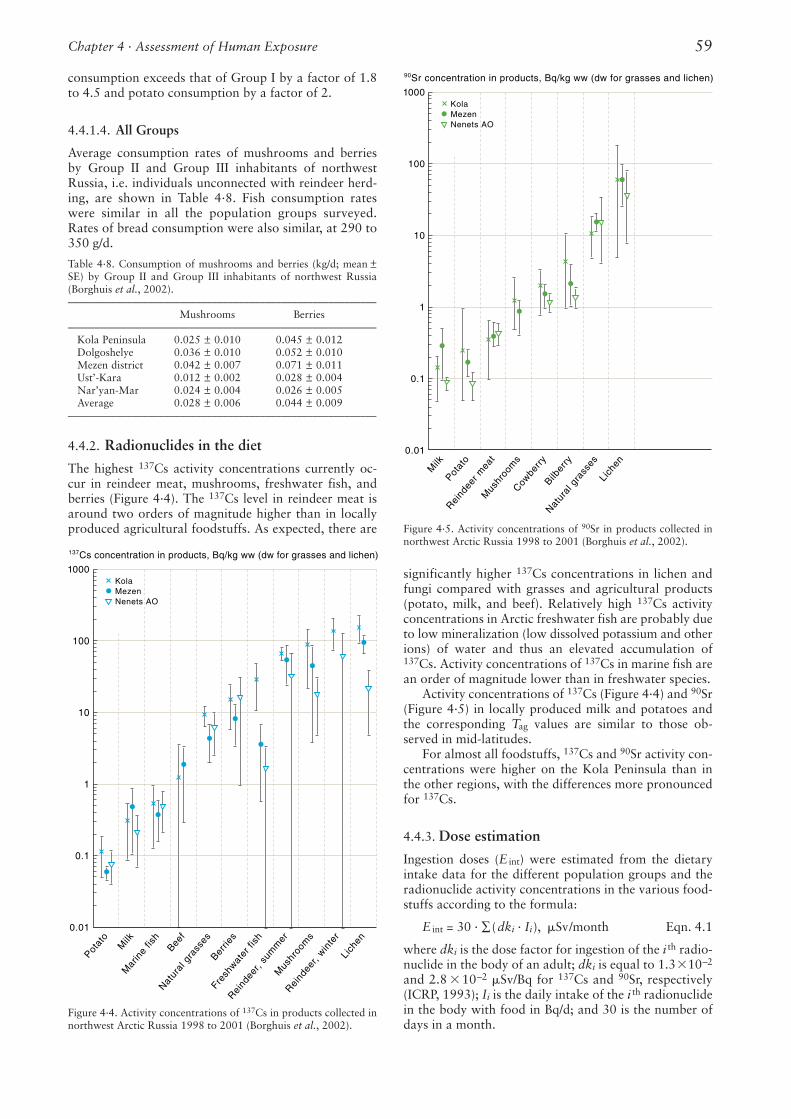
consumption exceeds that of Group I by a factor of 1.8to 4.5 and potato consumption by a factor of 2.
4.4.1.4. All Groups
Average consumption rates of mushrooms and berriesby Group II and Group III inhabitants of northwestRussia, i.e. individuals unconnected with reindeer herd-ing, are shown in Table 4·8. Fish consumption rateswere similar in all the population groups surveyed.Rates of bread consumption were also similar, at 290 to350 g/d.
4.4.2. Radionuclides in the diet
The highest 137Cs activity concentrations currently oc-cur in reindeer meat, mushrooms, freshwater fish, andberries (Figure 4·4). The 137Cs level in reindeer meat isaround two orders of magnitude higher than in locallyproduced agricultural foodstuffs. As expected, there are
significantly higher 137Cs concentrations in lichen andfungi compared with grasses and agricultural products(potato, milk, and beef). Relatively high 137Cs activityconcentrations in Arctic freshwater fish are probably dueto low mineralization (low dissolved potassium and otherions) of water and thus an elevated accumulation of137Cs. Activity concentrations of 137Cs in marine fish arean order of magnitude lower than in freshwater species.
Activity concentrations of 137Cs (Figure 4·4) and 90Sr(Figure 4·5) in locally produced milk and potatoes andthe corresponding Tag values are similar to those ob-served in mid-latitudes.
For almost all foodstuffs, 137Cs and 90Sr activity con-centrations were higher on the Kola Peninsula than inthe other regions, with the differences more pronouncedfor 137Cs.
4.4.3. Dose estimation
Ingestion doses (E int) were estimated from the dietaryintake data for the different population groups and theradionuclide activity concentrations in the various food-stuffs according to the formula:
E int = 30 · ∑ (dki · Ii), �Sv/month Eqn. 4.1
where dki is the dose factor for ingestion of the i th radio-nuclide in the body of an adult; dki is equal to 1.3�10–2
and 2.8 �10–2 �Sv/Bq for 137Cs and 90Sr, respectively(ICRP, 1993); Ii is the daily intake of the i th radionuclidein the body with food in Bq/d; and 30 is the number ofdays in a month.
Chapter 4 · Assessment of Human Exposure 59
Potat
o
Milk
Mar
ine
fish
Beef
Natur
al g
rass
esBer
ries
Fresh
water
fish
Reind
eer,
sum
mer
Mus
hroo
ms
Reind
eer,
winte
rLi
chen
137Cs concentration in products, Bq/kg ww (dw for grasses and lichen)
KolaMezenNenets AO
1000
100
10
1
0.1
0.01
Milk
Potat
o
Reind
eer m
eat
Mus
hroo
ms
Cowbe
rryBilb
erry
Natur
al g
rass
esLi
chen
90Sr concentration in products, Bq/kg ww (dw for grasses and lichen)
KolaMezenNenets AO
1000
100
10
1
0.1
0.01
Table 4·8. Consumption of mushrooms and berries (kg/d; mean ±SE) by Group II and Group III inhabitants of northwest Russia(Borghuis et al., 2002).––––––––––––––––––––––––––––––––––––––––––––––––––––––––––
Mushrooms Berries––––––––––––––––––––––––––––––––––––––––––––––––––––––––––
Kola Peninsula 0.025 ± 0.010 0.045 ± 0.012Dolgoshelye 0.036 ± 0.010 0.052 ± 0.010Mezen district 0.042 ± 0.007 0.071 ± 0.011Ust’-Kara 0.012 ± 0.002 0.028 ± 0.004Nar’yan-Mar 0.024 ± 0.004 0.026 ± 0.005Average 0.028 ± 0.006 0.044 ± 0.009
––––––––––––––––––––––––––––––––––––––––––––––––––––––––––
Figure 4·4. Activity concentrations of 137Cs in products collected innorthwest Arctic Russia 1998 to 2001 (Borghuis et al., 2002).
Figure 4·5. Activity concentrations of 90Sr in products collected innorthwest Arctic Russia 1998 to 2001 (Borghuis et al., 2002).
The daily radionuclide intake is estimated by com-bining the intake of different foodstuffs:
Ii = ∑p (Cip · Vip · Kip), Bq/d Eqn. 4.2
where (Cip(t) is the concentration of the ith radionuclidein the pth foodstuff in Bq/kg; Vip is the daily consump-tion rate of the pth foodstuff in kg/d; and Kip is the foodprocessing factor accounting for the loss of the ith radio-nuclide during cooking of the pth foodstuff.
The internal dose to inhabitants from 137Cs may alsobe assessed on the basis of measured activities in the hu-man body. The mean monthly effective dose through in-ternal exposure in adult inhabitants from 137Cs (E137),based on wholebody measurements, was calculated usingthe formula:
E137 = 30 · kd137 · Q/M, �Sv/month Eqn. 4.3
where Q is the 137Cs activity in the body of a personunder investigation in Bq; M is the mass of the body ofthe person in kg; kd137 is the dose rate coefficient con-verting the specific activity of 137Cs in the body, Q/M, to
the effective dose rate; kd137 = 6.3 � 10–3 (�Sv/kg perBq/d) (ICRP, 1993).
4.4.3.1. Group I
Table 4·9 shows the average daily 137Cs and 90Sr intakesfrom local foodstuffs in reindeer herders from Lovozerovillage. The consumption of reindeer meat in summerprovides 83% of the 137Cs internal dose. Fish and mush-rooms and berries are also significant sources (at 8%and 9%, respectively). The average monthly internaldose from 137Cs in summer 1998 was 10 �Sv/month.
The diet of the reindeer herders was the same inspring as in summer. This is to be expected as the foodsupply of the indigenous population is generally stablethroughout the year. Again, the major contributor to theinternal dose was reindeer meat, at 88%, with the restfrom local freshwater fish, and mushrooms and berries.As in summer, the contribution from milk was small.The average daily intake of 137Cs by reindeer herders in
AMAP Assessment 2002: Radioactivity in the Arctic60
Table 4·9. Average daily intake of 137Cs and 90Sr in summer 1998 for Group I inhabitants of Lovozerovillage (Borghuis et al., 2002).–––––––––––––––––––––––––––––––––––––––––––––––––––––––––––––––––––––––––––––––––––––––
Activity concen- Intake,tration, Bq/kg Bq/d
------------------------- Consump-, Food pro- -----------------------137Cs 90Sr tion, kg/d cessing factor 137Cs 90Sr
––––––––––––––––––––––––––––––––––––––––––––––––––––––––––––––––––––––––––––––––––––––– Milk 0.39 0.15 0.10 1.0 0.04 0.015Reindeer meat 70 – 0.30 1.0 20.9 –Mushrooms 58 0.13 0.021 0.5 0.61 0.0014Berries 19 3.4 0.045 1.0 0.86 0.153Potatoes 0.12 0.25 0.31 0.8 0.03 0.062Fish 20 – 0.10 1.0 2.1 –Total 24.5 0.23
–––––––––––––––––––––––––––––––––––––––––––––––––––––––––––––––––––––––––––––––––––––––
Table 4·10. Average daily intake of 137Cs and 90Sr in summer 1998 for Group II inhabitants of Lovo-zero village (Borghuis et al., 2002).–––––––––––––––––––––––––––––––––––––––––––––––––––––––––––––––––––––––––––––––––––––––
Activity concen- Intake,tration, Bq/kg Bq/d
------------------------- Consump-, Food pro- -----------------------137Cs 90Sr tion, kg/d cessing factor 137Cs 90Sr
––––––––––––––––––––––––––––––––––––––––––––––––––––––––––––––––––––––––––––––––––––––– Milk 0.39 0.15 0.28 1.0 0.11 0.042Reindeer meat 70 – 0.083 1.0 5.8 –Mushrooms 58 0.13 0.025 0.5 0.73 0.002Berries 19 3.4 0.045 1.0 0.86 0.153Potatoes 0.12 0.08 0.38 0.8 0.04 0.024Freshwater fish 20 – 0.085 1.0 1.7 –Total 9.2 0.22
–––––––––––––––––––––––––––––––––––––––––––––––––––––––––––––––––––––––––––––––––––––––
Table 4·11. Average daily intake of 137Cs and 90Sr in summer 1998 by Group III inhabitants of Umba(Borghuis et al., 2002).–––––––––––––––––––––––––––––––––––––––––––––––––––––––––––––––––––––––––––––––––––––––
Activity concen- Intake,tration, Bq/kg Bq/d
------------------------- Consump-, Food pro- -----------------------137Cs 90Sr tion, kg/d cessing factor 137Cs 90Sr
––––––––––––––––––––––––––––––––––––––––––––––––––––––––––––––––––––––––––––––––––––––– Milk 0.49 0.17 0.128 1.0 0.063 0.022Mushrooms 59 – 0.021* 0.5 0.62 –Berries 3.7 – 0.045* 1.0 0.17 –Potatoes 0.12 0.18 0.33 0.8 0.032 0.048Fish 2.-20** – 0.11 1.0 0.22-2.2Total 1.1-3.1 0.07
––––––––––––––––––––––––––––––––––––––––––––––––––––––––––––––––––––––––––––––––––––––– **consumption assumed to be the same as at Lovozero village; **first number corresponds to the average 137Cs activity concentration in marine fish and the second
to freshwater fish.
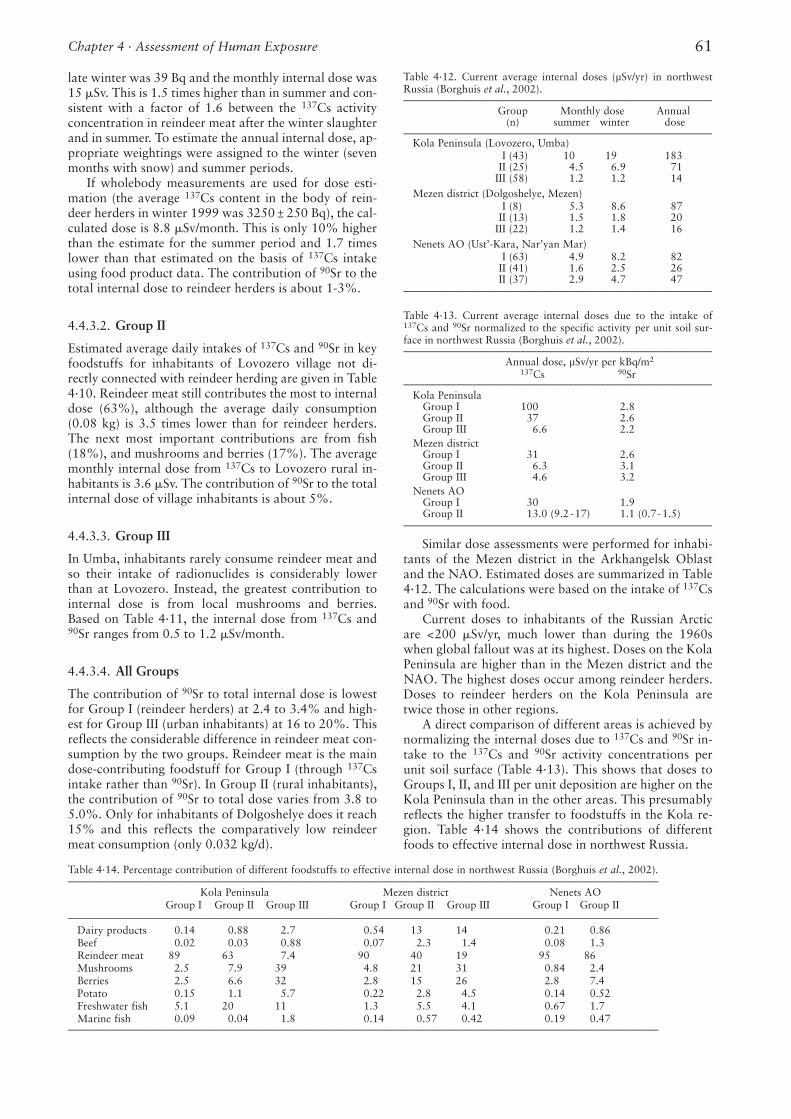
late winter was 39 Bq and the monthly internal dose was15 �Sv. This is 1.5 times higher than in summer and con-sistent with a factor of 1.6 between the 137Cs activityconcentration in reindeer meat after the winter slaughterand in summer. To estimate the annual internal dose, ap-propriate weightings were assigned to the winter (sevenmonths with snow) and summer periods.
If wholebody measurements are used for dose esti-mation (the average 137Cs content in the body of rein-deer herders in winter 1999 was 3250 ± 250 Bq), the cal-culated dose is 8.8 �Sv/month. This is only 10% higherthan the estimate for the summer period and 1.7 timeslower than that estimated on the basis of 137Cs intakeusing food product data. The contribution of 90Sr to thetotal internal dose to reindeer herders is about 1-3%.
4.4.3.2. Group II
Estimated average daily intakes of 137Cs and 90Sr in keyfoodstuffs for inhabitants of Lovozero village not di-rectly connected with reindeer herding are given in Table4·10. Reindeer meat still contributes the most to internaldose (63%), although the average daily consumption(0.08 kg) is 3.5 times lower than for reindeer herders.The next most important contributions are from fish(18%), and mushrooms and berries (17%). The averagemonthly internal dose from 137Cs to Lovozero rural in-habitants is 3.6 �Sv. The contribution of 90Sr to the totalinternal dose of village inhabitants is about 5%.
4.4.3.3. Group III
In Umba, inhabitants rarely consume reindeer meat andso their intake of radionuclides is considerably lowerthan at Lovozero. Instead, the greatest contribution tointernal dose is from local mushrooms and berries.Based on Table 4·11, the internal dose from 137Cs and90Sr ranges from 0.5 to 1.2 �Sv/month.
4.4.3.4. All Groups
The contribution of 90Sr to total internal dose is lowestfor Group I (reindeer herders) at 2.4 to 3.4% and high-est for Group III (urban inhabitants) at 16 to 20%. Thisreflects the considerable difference in reindeer meat con-sumption by the two groups. Reindeer meat is the maindose-contributing foodstuff for Group I (through 137Csintake rather than 90Sr). In Group II (rural inhabitants),the contribution of 90Sr to total dose varies from 3.8 to5.0%. Only for inhabitants of Dolgoshelye does it reach15% and this reflects the comparatively low reindeermeat consumption (only 0.032 kg/d).
Similar dose assessments were performed for inhabi-tants of the Mezen district in the Arkhangelsk Oblastand the NAO. Estimated doses are summarized in Table4·12. The calculations were based on the intake of 137Csand 90Sr with food.
Current doses to inhabitants of the Russian Arcticare <200 �Sv/yr, much lower than during the 1960swhen global fallout was at its highest. Doses on the KolaPeninsula are higher than in the Mezen district and theNAO. The highest doses occur among reindeer herders.Doses to reindeer herders on the Kola Peninsula aretwice those in other regions.
A direct comparison of different areas is achieved bynormalizing the internal doses due to 137Cs and 90Sr in-take to the 137Cs and 90Sr activity concentrations perunit soil surface (Table 4·13). This shows that doses toGroups I, II, and III per unit deposition are higher on theKola Peninsula than in the other areas. This presumablyreflects the higher transfer to foodstuffs in the Kola re-gion. Table 4·14 shows the contributions of differentfoods to effective internal dose in northwest Russia.
Chapter 4 · Assessment of Human Exposure 61
Table 4·12. Current average internal doses (µSv/yr) in northwestRussia (Borghuis et al., 2002).––––––––––––––––––––––––––––––––––––––––––––––––––––––––––
Group Monthly dose Annual(n) summer winter dose
––––––––––––––––––––––––––––––––––––––––––––––––––––––––––Kola Peninsula (Lovozero, Umba)
I (43) 10 19 183II (25) 4.5 6.9 71
III (58) 1.2 1.2 14Mezen district (Dolgoshelye, Mezen)
I (8) 5.3 8.6 87II (13) 1.5 1.8 20
III (22) 1.2 1.4 16Nenets AO (Ust’-Kara, Nar’yan Mar)
I (63) 4.9 8.2 82II (41) 1.6 2.5 26II (37) 2.9 4.7 47
––––––––––––––––––––––––––––––––––––––––––––––––––––––––––
Table 4·13. Current average internal doses due to the intake of137Cs and 90Sr normalized to the specific activity per unit soil sur-face in northwest Russia (Borghuis et al., 2002).––––––––––––––––––––––––––––––––––––––––––––––––––––––––––
Annual dose, µSv/yr per kBq/m2
137Cs 90Sr––––––––––––––––––––––––––––––––––––––––––––––––––––––––––
Kola PeninsulaGroup I 100 2.8Group II 37 2.6Group III 6.6 2.2
Mezen districtGroup I 31 2.6Group II 6.3 3.1Group III 4.6 3.2
Nenets AOGroup I 30 1.9Group II 13.0 (9.2-17) 1.1 (0.7-1.5)
––––––––––––––––––––––––––––––––––––––––––––––––––––––––––
Table 4·14. Percentage contribution of different foodstuffs to effective internal dose in northwest Russia (Borghuis et al., 2002).–––––––––––––––––––––––––––––––––––––––––––––––––––––––––––––––––––––––––––––––––––––––––––––––––––––––––––––––
Kola Peninsula Mezen district Nenets AOGroup I Group II Group III Group I Group II Group III Group I Group II
–––––––––––––––––––––––––––––––––––––––––––––––––––––––––––––––––––––––––––––––––––––––––––––––––––––––––––––––Dairy products 0.14 0.88 2.7 0.54 13 14 0.21 0.86Beef 0.02 0.03 0.88 0.07 2.3 1.4 0.08 1.3Reindeer meat 89 63 7.4 90 40 19 95 86Mushrooms 2.5 7.9 39 4.8 21 31 0.84 2.4Berries 2.5 6.6 32 2.8 15 26 2.8 7.4Potato 0.15 1.1 5.7 0.22 2.8 4.5 0.14 0.52Freshwater fish 5.1 20 11 1.3 5.5 4.1 0.67 1.7Marine fish 0.09 0.04 1.8 0.14 0.57 0.42 0.19 0.47
–––––––––––––––––––––––––––––––––––––––––––––––––––––––––––––––––––––––––––––––––––––––––––––––––––––––––––––––
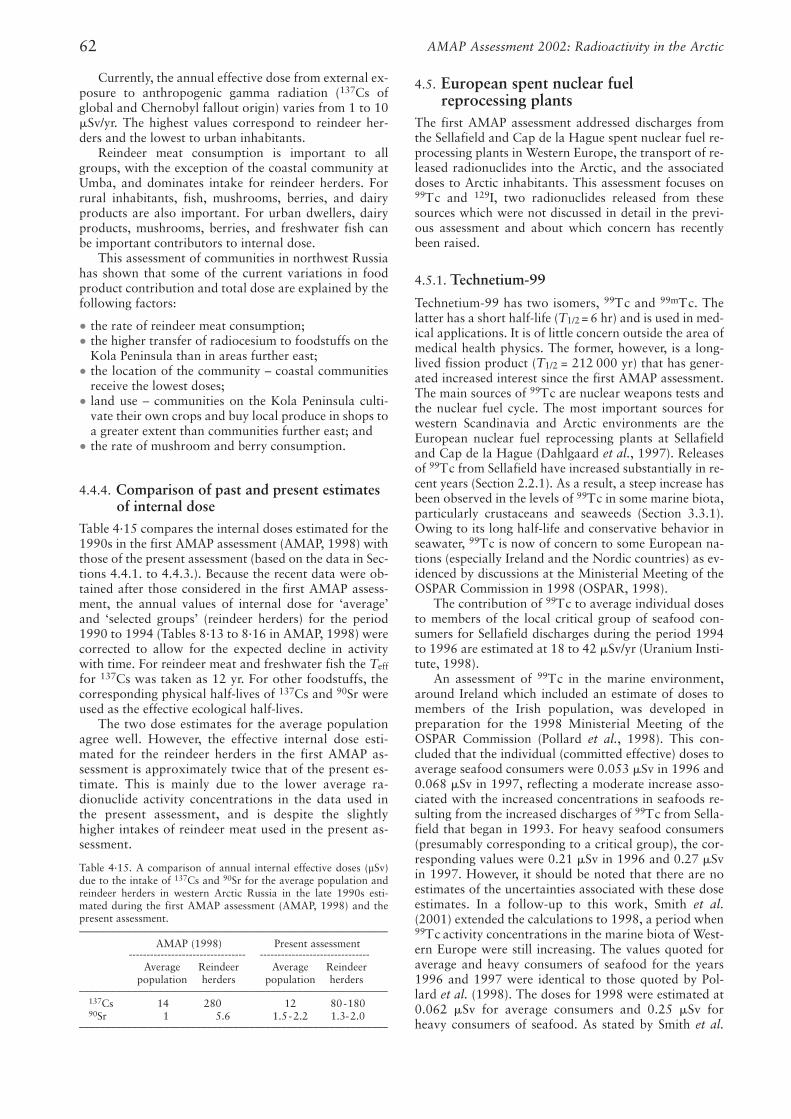
Currently, the annual effective dose from external ex-posure to anthropogenic gamma radiation (137Cs ofglobal and Chernobyl fallout origin) varies from 1 to 10�Sv/yr. The highest values correspond to reindeer her-ders and the lowest to urban inhabitants.
Reindeer meat consumption is important to allgroups, with the exception of the coastal community atUmba, and dominates intake for reindeer herders. Forrural inhabitants, fish, mushrooms, berries, and dairyproducts are also important. For urban dwellers, dairyproducts, mushrooms, berries, and freshwater fish canbe important contributors to internal dose.
This assessment of communities in northwest Russiahas shown that some of the current variations in foodproduct contribution and total dose are explained by thefollowing factors:
• the rate of reindeer meat consumption;• the higher transfer of radiocesium to foodstuffs on the
Kola Peninsula than in areas further east;• the location of the community – coastal communities
receive the lowest doses;• land use – communities on the Kola Peninsula culti-
vate their own crops and buy local produce in shops toa greater extent than communities further east; and
• the rate of mushroom and berry consumption.
4.4.4. Comparison of past and present estimates of internal dose
Table 4·15 compares the internal doses estimated for the1990s in the first AMAP assessment (AMAP, 1998) withthose of the present assessment (based on the data in Sec-tions 4.4.1. to 4.4.3.). Because the recent data were ob-tained after those considered in the first AMAP assess-ment, the annual values of internal dose for ‘average’and ‘selected groups’ (reindeer herders) for the period1990 to 1994 (Tables 8·13 to 8·16 in AMAP, 1998) werecorrected to allow for the expected decline in activitywith time. For reindeer meat and freshwater fish the Teff
for 137Cs was taken as 12 yr. For other foodstuffs, thecorresponding physical half-lives of 137Cs and 90Sr wereused as the effective ecological half-lives.
The two dose estimates for the average populationagree well. However, the effective internal dose esti-mated for the reindeer herders in the first AMAP as-sessment is approximately twice that of the present es-timate. This is mainly due to the lower average ra-dionuclide activity concentrations in the data used inthe present assessment, and is despite the slightlyhigher intakes of reindeer meat used in the present as-sessment.
4.5. European spent nuclear fuelreprocessing plants
The first AMAP assessment addressed discharges fromthe Sellafield and Cap de la Hague spent nuclear fuel re-processing plants in Western Europe, the transport of re-leased radionuclides into the Arctic, and the associateddoses to Arctic inhabitants. This assessment focuses on99Tc and 129I, two radionuclides released from thesesources which were not discussed in detail in the previ-ous assessment and about which concern has recentlybeen raised.
4.5.1. Technetium-99
Technetium-99 has two isomers, 99Tc and 99mTc. Thelatter has a short half-life (T1/2 = 6 hr) and is used in med-ical applications. It is of little concern outside the area ofmedical health physics. The former, however, is a long-lived fission product (T1/2 = 212 000 yr) that has gener-ated increased interest since the first AMAP assessment.The main sources of 99Tc are nuclear weapons tests andthe nuclear fuel cycle. The most important sources forwestern Scandinavia and Arctic environments are theEuropean nuclear fuel reprocessing plants at Sellafieldand Cap de la Hague (Dahlgaard et al., 1997). Releasesof 99Tc from Sellafield have increased substantially in re-cent years (Section 2.2.1). As a result, a steep increase hasbeen observed in the levels of 99Tc in some marine biota,particularly crustaceans and seaweeds (Section 3.3.1).Owing to its long half-life and conservative behavior inseawater, 99Tc is now of concern to some European na-tions (especially Ireland and the Nordic countries) as ev-idenced by discussions at the Ministerial Meeting of theOSPAR Commission in 1998 (OSPAR, 1998).
The contribution of 99Tc to average individual dosesto members of the local critical group of seafood con-sumers for Sellafield discharges during the period 1994to 1996 are estimated at 18 to 42 �Sv/yr (Uranium Insti-tute, 1998).
An assessment of 99Tc in the marine environment,around Ireland which included an estimate of doses tomembers of the Irish population, was developed inpreparation for the 1998 Ministerial Meeting of theOSPAR Commission (Pollard et al., 1998). This con-cluded that the individual (committed effective) doses toaverage seafood consumers were 0.053 �Sv in 1996 and0.068 �Sv in 1997, reflecting a moderate increase asso-ciated with the increased concentrations in seafoods re-sulting from the increased discharges of 99Tc from Sella-field that began in 1993. For heavy seafood consumers(presumably corresponding to a critical group), the cor-responding values were 0.21 �Sv in 1996 and 0.27 �Svin 1997. However, it should be noted that there are noestimates of the uncertainties associated with these doseestimates. In a follow-up to this work, Smith et al.(2001) extended the calculations to 1998, a period when99Tc activity concentrations in the marine biota of West-ern Europe were still increasing. The values quoted foraverage and heavy consumers of seafood for the years1996 and 1997 were identical to those quoted by Pol-lard et al. (1998). The doses for 1998 were estimated at0.062 �Sv for average consumers and 0.25 �Sv forheavy consumers of seafood. As stated by Smith et al.
AMAP Assessment 2002: Radioactivity in the Arctic62
Table 4·15. A comparison of annual internal effective doses (µSv)due to the intake of 137Cs and 90Sr for the average population andreindeer herders in western Arctic Russia in the late 1990s esti-mated during the first AMAP assessment (AMAP, 1998) and thepresent assessment.––––––––––––––––––––––––––––––––––––––––––––––––––––––––––
AMAP (1998) Present assessment---------------------------------------------------------------------------------------
Average Reindeer Average Reindeerpopulation herders population herders
––––––––––––––––––––––––––––––––––––––––––––––––––––––––––137Cs 14 280 12 80-18090Sr 1 5.6 1.5-2.2 1.3-2.0
––––––––––––––––––––––––––––––––––––––––––––––––––––––––––
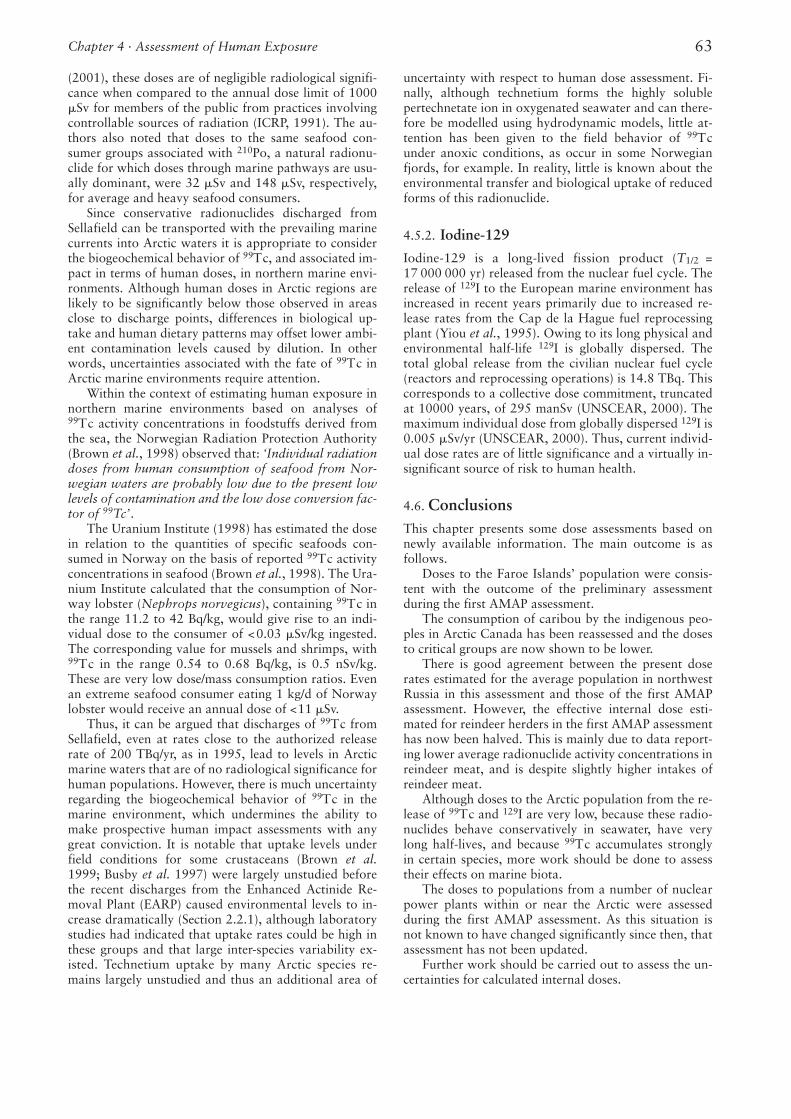
(2001), these doses are of negligible radiological signifi-cance when compared to the annual dose limit of 1000�Sv for members of the public from practices involvingcontrollable sources of radiation (ICRP, 1991). The au-thors also noted that doses to the same seafood con-sumer groups associated with 210Po, a natural radionu-clide for which doses through marine pathways are usu-ally dominant, were 32 �Sv and 148 �Sv, respectively,for average and heavy seafood consumers.
Since conservative radionuclides discharged fromSellafield can be transported with the prevailing marinecurrents into Arctic waters it is appropriate to considerthe biogeochemical behavior of 99Tc, and associated im-pact in terms of human doses, in northern marine envi-ronments. Although human doses in Arctic regions arelikely to be significantly below those observed in areasclose to discharge points, differences in biological up-take and human dietary patterns may offset lower ambi-ent contamination levels caused by dilution. In otherwords, uncertainties associated with the fate of 99Tc inArctic marine environments require attention.
Within the context of estimating human exposure innorthern marine environments based on analyses of99Tc activity concentrations in foodstuffs derived fromthe sea, the Norwegian Radiation Protection Authority(Brown et al., 1998) observed that: ‘Individual radiationdoses from human consumption of seafood from Nor-wegian waters are probably low due to the present lowlevels of contamination and the low dose conversion fac-tor of 99Tc’.
The Uranium Institute (1998) has estimated the dosein relation to the quantities of specific seafoods con-sumed in Norway on the basis of reported 99Tc activityconcentrations in seafood (Brown et al., 1998). The Ura-nium Institute calculated that the consumption of Nor-way lobster (Nephrops norvegicus), containing 99Tc inthe range 11.2 to 42 Bq/kg, would give rise to an indi-vidual dose to the consumer of <0.03 �Sv/kg ingested.The corresponding value for mussels and shrimps, with99Tc in the range 0.54 to 0.68 Bq/kg, is 0.5 nSv/kg.These are very low dose/mass consumption ratios. Evenan extreme seafood consumer eating 1 kg/d of Norwaylobster would receive an annual dose of <11 �Sv.
Thus, it can be argued that discharges of 99Tc fromSellafield, even at rates close to the authorized releaserate of 200 TBq/yr, as in 1995, lead to levels in Arcticmarine waters that are of no radiological significance forhuman populations. However, there is much uncertaintyregarding the biogeochemical behavior of 99Tc in themarine environment, which undermines the ability tomake prospective human impact assessments with anygreat conviction. It is notable that uptake levels underfield conditions for some crustaceans (Brown et al.1999; Busby et al. 1997) were largely unstudied beforethe recent discharges from the Enhanced Actinide Re-moval Plant (EARP) caused environmental levels to in-crease dramatically (Section 2.2.1), although laboratorystudies had indicated that uptake rates could be high inthese groups and that large inter-species variability ex-isted. Technetium uptake by many Arctic species re-mains largely unstudied and thus an additional area of
uncertainty with respect to human dose assessment. Fi-nally, although technetium forms the highly solublepertechnetate ion in oxygenated seawater and can there-fore be modelled using hydrodynamic models, little at-tention has been given to the field behavior of 99Tcunder anoxic conditions, as occur in some Norwegianfjords, for example. In reality, little is known about theenvironmental transfer and biological uptake of reducedforms of this radionuclide.
4.5.2. Iodine-129
Iodine-129 is a long-lived fission product (T1/2 =17 000 000 yr) released from the nuclear fuel cycle. Therelease of 129I to the European marine environment hasincreased in recent years primarily due to increased re-lease rates from the Cap de la Hague fuel reprocessingplant (Yiou et al., 1995). Owing to its long physical andenvironmental half-life 129I is globally dispersed. Thetotal global release from the civilian nuclear fuel cycle(reactors and reprocessing operations) is 14.8 TBq. Thiscorresponds to a collective dose commitment, truncatedat 10000 years, of 295 manSv (UNSCEAR, 2000). Themaximum individual dose from globally dispersed 129I is0.005 �Sv/yr (UNSCEAR, 2000). Thus, current individ-ual dose rates are of little significance and a virtually in-significant source of risk to human health.
4.6. ConclusionsThis chapter presents some dose assessments based onnewly available information. The main outcome is asfollows.
Doses to the Faroe Islands’ population were consis-tent with the outcome of the preliminary assessmentduring the first AMAP assessment.
The consumption of caribou by the indigenous peo-ples in Arctic Canada has been reassessed and the dosesto critical groups are now shown to be lower.
There is good agreement between the present doserates estimated for the average population in northwestRussia in this assessment and those of the first AMAPassessment. However, the effective internal dose esti-mated for reindeer herders in the first AMAP assessmenthas now been halved. This is mainly due to data report-ing lower average radionuclide activity concentrations inreindeer meat, and is despite slightly higher intakes ofreindeer meat.
Although doses to the Arctic population from the re-lease of 99Tc and 129I are very low, because these radio-nuclides behave conservatively in seawater, have verylong half-lives, and because 99Tc accumulates stronglyin certain species, more work should be done to assesstheir effects on marine biota.
The doses to populations from a number of nuclearpower plants within or near the Arctic were assessedduring the first AMAP assessment. As this situation isnot known to have changed significantly since then, thatassessment has not been updated.
Further work should be carried out to assess the un-certainties for calculated internal doses.
Chapter 4 · Assessment of Human Exposure 63
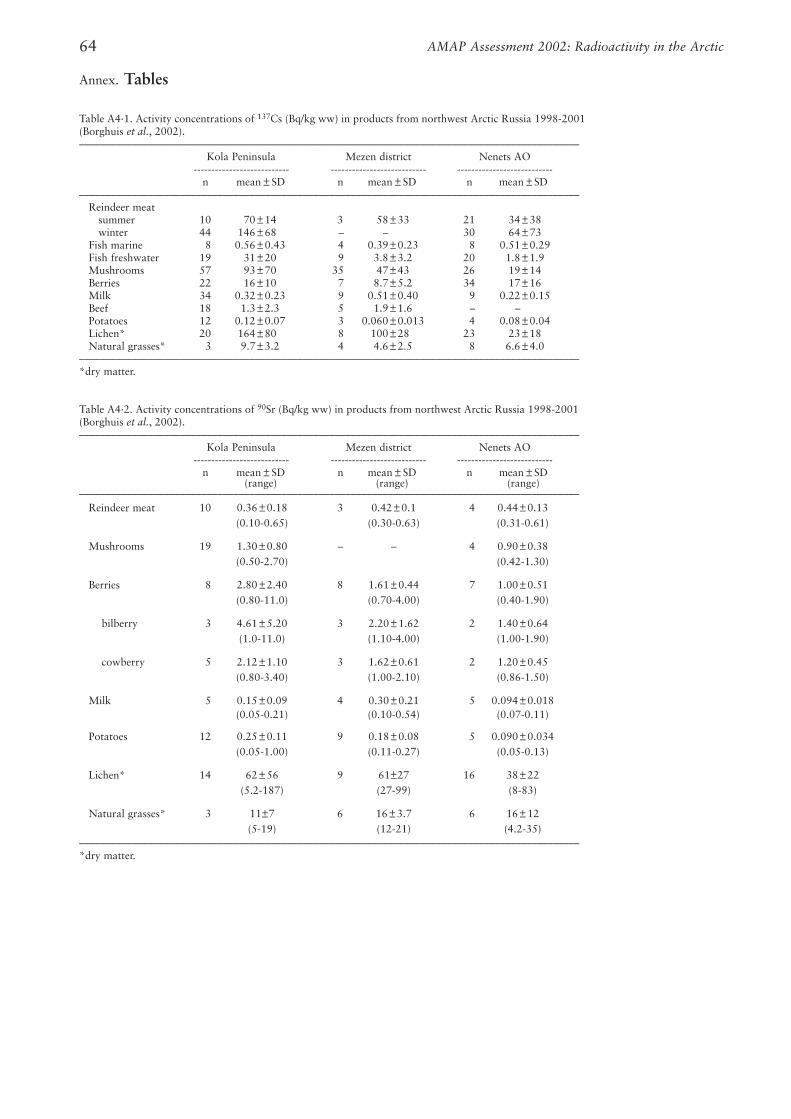
AMAP Assessment 2002: Radioactivity in the Arctic64
Annex. Tables
Table A4·1. Activity concentrations of 137Cs (Bq/kg ww) in products from northwest Arctic Russia 1998-2001 (Borghuis et al., 2002).––––––––––––––––––––––––––––––––––––––––––––––––––––––––––––––––––––––––––––––––––––––––––––––
Kola Peninsula Mezen district Nenets AO--------------------------- --------------------------- ---------------------------
n mean ± SD n mean ± SD n mean ± SD––––––––––––––––––––––––––––––––––––––––––––––––––––––––––––––––––––––––––––––––––––––––––––––
Reindeer meatsummer 10 70±14 3 58±33 21 34±38winter 44 146±68 – – 30 64±73
Fish marine 8 0.56±0.43 4 0.39±0.23 8 0.51±0.29Fish freshwater 19 31±20 9 3.8±3.2 20 1.8±1.9Mushrooms 57 93±70 35 47±43 26 19±14Berries 22 16±10 7 8.7±5.2 34 17±16Milk 34 0.32±0.23 9 0.51±0.40 9 0.22±0.15Beef 18 1.3±2.3 5 1.9±1.6 – –Potatoes 12 0.12±0.07 3 0.060±0.013 4 0.08±0.04Lichen* 20 164±80 8 100±28 23 23±18Natural grasses* 3 9.7±3.2 4 4.6±2.5 8 6.6±4.0
–––––––––––––––––––––––––––––––––––––––––––––––––––––––––––––––––––––––––––––––––––––––––––––– *dry matter.
Table A4·2. Activity concentrations of 90Sr (Bq/kg ww) in products from northwest Arctic Russia 1998-2001(Borghuis et al., 2002).––––––––––––––––––––––––––––––––––––––––––––––––––––––––––––––––––––––––––––––––––––––––––––––
Kola Peninsula Mezen district Nenets AO--------------------------- --------------------------- ---------------------------
n mean ± SD n mean ± SD n mean ± SD(range) (range) (range)
–––––––––––––––––––––––––––––––––––––––––––––––––––––––––––––––––––––––––––––––––––––––––––––– Reindeer meat 10 0.36±0.18 3 0.42±0.1 4 0.44±0.13
(0.10-0.65) (0.30-0.63) (0.31-0.61)
Mushrooms 19 1.30±0.80 – – 4 0.90±0.38(0.50-2.70) (0.42-1.30)
Berries 8 2.80±2.40 8 1.61±0.44 7 1.00±0.51(0.80-11.0) (0.70-4.00) (0.40-1.90)
bilberry 3 4.61±5.20 3 2.20±1.62 2 1.40±0.64(1.0-11.0) (1.10-4.00) (1.00-1.90)
cowberry 5 2.12±1.10 3 1.62±0.61 2 1.20±0.45(0.80-3.40) (1.00-2.10) (0.86-1.50)
Milk 5 0.15±0.09 4 0.30±0.21 5 0.094±0.018(0.05-0.21) (0.10-0.54) (0.07-0.11)
Potatoes 12 0.25±0.11 9 0.18±0.08 5 0.090±0.034(0.05-1.00) (0.11-0.27) (0.05-0.13)
Lichen* 14 62±56 9 61±27 16 38±22(5.2-187) (27-99) (8-83)
Natural grasses* 3 11±7 6 16±3.7 6 16±12(5-19) (12-21) (4.2-35)
––––––––––––––––––––––––––––––––––––––––––––––––––––––––––––––––––––––––––––––––––––––––––––––*dry matter.
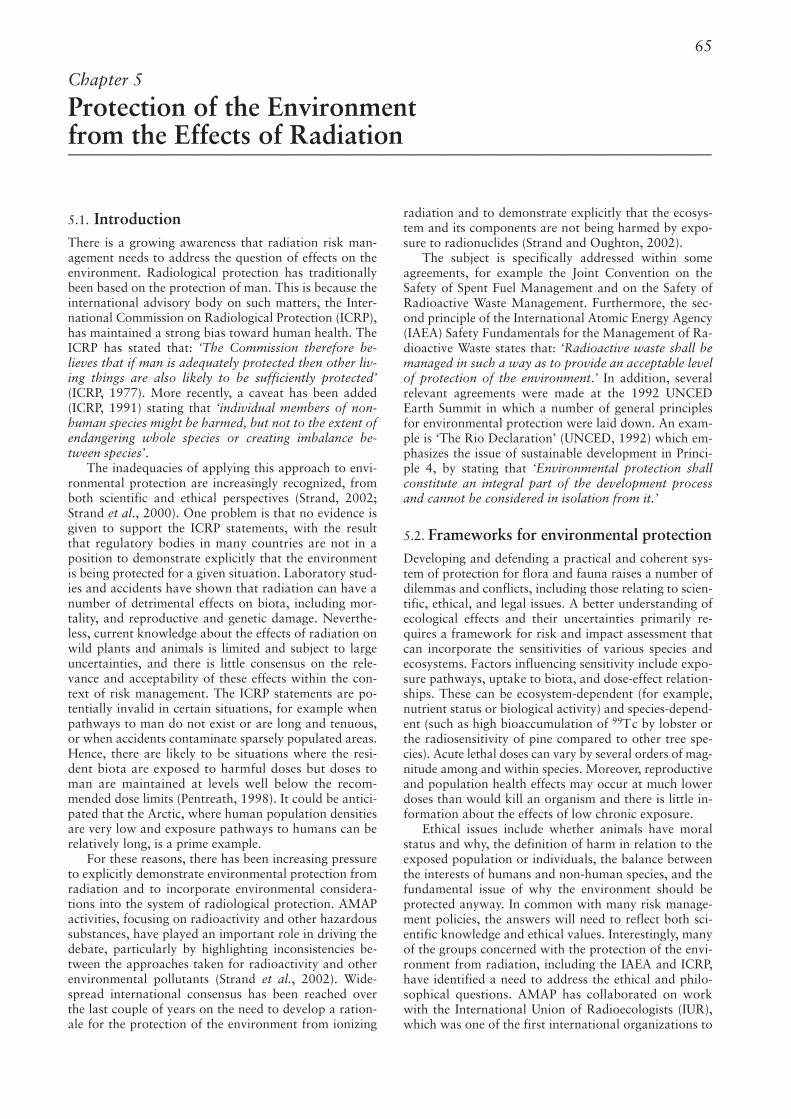
radiation and to demonstrate explicitly that the ecosys-tem and its components are not being harmed by expo-sure to radionuclides (Strand and Oughton, 2002).
The subject is specifically addressed within someagreements, for example the Joint Convention on theSafety of Spent Fuel Management and on the Safety ofRadioactive Waste Management. Furthermore, the sec-ond principle of the International Atomic Energy Agency(IAEA) Safety Fundamentals for the Management of Ra-dioactive Waste states that: ‘Radioactive waste shall bemanaged in such a way as to provide an acceptable levelof protection of the environment.’ In addition, severalrelevant agreements were made at the 1992 UNCEDEarth Summit in which a number of general principlesfor environmental protection were laid down. An exam-ple is ‘The Rio Declaration’ (UNCED, 1992) which em-phasizes the issue of sustainable development in Princi-ple 4, by stating that ‘Environmental protection shallconstitute an integral part of the development processand cannot be considered in isolation from it.’
5.2. Frameworks for environmental protectionDeveloping and defending a practical and coherent sys-tem of protection for flora and fauna raises a number ofdilemmas and conflicts, including those relating to scien-tific, ethical, and legal issues. A better understanding ofecological effects and their uncertainties primarily re-quires a framework for risk and impact assessment thatcan incorporate the sensitivities of various species andecosystems. Factors influencing sensitivity include expo-sure pathways, uptake to biota, and dose-effect relation-ships. These can be ecosystem-dependent (for example,nutrient status or biological activity) and species-depend-ent (such as high bioaccumulation of 99Tc by lobster orthe radiosensitivity of pine compared to other tree spe-cies). Acute lethal doses can vary by several orders of mag-nitude among and within species. Moreover, reproductiveand population health effects may occur at much lowerdoses than would kill an organism and there is little in-formation about the effects of low chronic exposure.
Ethical issues include whether animals have moralstatus and why, the definition of harm in relation to theexposed population or individuals, the balance betweenthe interests of humans and non-human species, and thefundamental issue of why the environment should beprotected anyway. In common with many risk manage-ment policies, the answers will need to reflect both sci-entific knowledge and ethical values. Interestingly, manyof the groups concerned with the protection of the envi-ronment from radiation, including the IAEA and ICRP,have identified a need to address the ethical and philo-sophical questions. AMAP has collaborated on workwith the International Union of Radioecologists (IUR),which was one of the first international organizations to
65
5.1. IntroductionThere is a growing awareness that radiation risk man-agement needs to address the question of effects on theenvironment. Radiological protection has traditionallybeen based on the protection of man. This is because theinternational advisory body on such matters, the Inter-national Commission on Radiological Protection (ICRP),has maintained a strong bias toward human health. TheICRP has stated that: ‘The Commission therefore be-lieves that if man is adequately protected then other liv-ing things are also likely to be sufficiently protected’(ICRP, 1977). More recently, a caveat has been added(ICRP, 1991) stating that ‘individual members of non-human species might be harmed, but not to the extent ofendangering whole species or creating imbalance be-tween species’.
The inadequacies of applying this approach to envi-ronmental protection are increasingly recognized, fromboth scientific and ethical perspectives (Strand, 2002;Strand et al., 2000). One problem is that no evidence isgiven to support the ICRP statements, with the resultthat regulatory bodies in many countries are not in aposition to demonstrate explicitly that the environmentis being protected for a given situation. Laboratory stud-ies and accidents have shown that radiation can have anumber of detrimental effects on biota, including mor-tality, and reproductive and genetic damage. Neverthe-less, current knowledge about the effects of radiation onwild plants and animals is limited and subject to largeuncertainties, and there is little consensus on the rele-vance and acceptability of these effects within the con-text of risk management. The ICRP statements are po-tentially invalid in certain situations, for example whenpathways to man do not exist or are long and tenuous,or when accidents contaminate sparsely populated areas.Hence, there are likely to be situations where the resi-dent biota are exposed to harmful doses but doses toman are maintained at levels well below the recom-mended dose limits (Pentreath, 1998). It could be antici-pated that the Arctic, where human population densitiesare very low and exposure pathways to humans can berelatively long, is a prime example.
For these reasons, there has been increasing pressureto explicitly demonstrate environmental protection fromradiation and to incorporate environmental considera-tions into the system of radiological protection. AMAPactivities, focusing on radioactivity and other hazardoussubstances, have played an important role in driving thedebate, particularly by highlighting inconsistencies be-tween the approaches taken for radioactivity and otherenvironmental pollutants (Strand et al., 2002). Wide-spread international consensus has been reached overthe last couple of years on the need to develop a ration-ale for the protection of the environment from ionizing
Chapter 5
Protection of the Environmentfrom the Effects of Radiation –––––––––––––––––––––––––––––––––––––––––––––––––––––––––––––––––––––––––––––––––––––––––
actively promote the need to focus on non-human biotaand to propose a system for impact assessment.
Any framework for the protection of the environ-ment from radiation should be compatible with protec-tion systems for other environmental stressors. How-ever, it is important to be aware that this area of law isunder continuing development. There is general world-wide consensus on the issue of human rights (althoughnot total agreement on how those principles might beapplied in practice), which simplifies the management ofhuman radiation exposure in some respects. Nothinglike the same level of agreement has been reached on en-vironmental principles however, although progress isbeing made and is pertinent to the present assessment.There are three major points to bear in mind when ad-dressing the development of frameworks for protectionof the environment from radiation. First, legislation forenvironmental protection is relatively new and still un-dergoing development. Second, the issue is global, isdeemed important by governments and the public alike,and has stimulated action on an international scale.Third, practical solutions are not without conflict andcontroversy. Not withstanding these difficulties, exam-ples of environmental law can be found in the nationallaws of every country. Although their scope and detailvary considerably, progress during the last 30 years hasled to a certain amount of agreement on what is meantby the ‘environment’ and its ‘protection’ and whichprinciples should guide that protection (see Box 5·1).
5.2.1. General legal and ethical principles
A two-stage approach is useful when assessing the legaland ethical basis for the development of a frameworkfor environmental protection, namely: to consider somegeneral and/or common legal and ethical principles usedin environmental protection; and then to derive somepolicy or management principles on the basis of thesebeing specifically relevant and pertinent to protectionfrom radiation.
The following principles are drawn from interna-tional and national environmental policy (i.e., the RioDeclaration; and policy arising from the EuropeanUnion, the U.S. Environmental Protection Agency, andthe U.K. Environment Agency) or from environmentalethics. The list is not exclusive and reflects the broad is-sues and spirit of international and national law.
1. It is the responsibility of all humankind, where possi-ble, to prevent detriment to the environment and to pre-serve and protect the health and integrity of the Earth’secosystem. (Principle of responsibility).
2. The use and exploitation of natural resources mustbe sustainable and should equitably meet the develop-mental and environmental needs of present and futuregenerations. (Principle of sustainable development).
3. Society must recognize the serious impact of humansin causing extinction and a loss in species and activelypromote conservation measures to preserve the Earth’sbiodiversity. (Conservation/biodiversity principle).
4. Humans should avoid causing suffering to other liv-ing organisms. (Welfare principle).
5. Humans should respect the inherent and intrinsicworth of nature, recognizing that the environment has avalue beyond its direct impact on human interest. (Prin-ciple of respect).
6. Environmental management needs to be combinedwith concerns for economic and social justice (particu-larly in developing countries) and with the informedparticipation of affected citizens. (Principle of environ-mental justice).
7. Decisions on environmental issues should reflect sci-entific understanding, acknowledge uncertainties, and rec-ognize the identity, role, culture, and specific knowledgeof indigenous peoples, traditional practices, and localcommunities. (Transparency and participation principle).
8. In order to protect the environment, a precautionaryapproach should be encouraged. Where there are threatsof serious or irreversible damage, lack of full scientificcertainty should not be used as a reason for postponingcost-effective measures to prevent environmental degra-dation. (Precautionary principle).
9. Authorities should promote the internalization of en-vironmental costs taking into account that the pollutershould bear the costs of pollution, including those con-nected to liability and compensation. (Polluter paysprinciple).
10. The need to prevent environmental damage atsource requires that environmental impact assessmentsshould be carried out for all new developments, propos-als, and technologies. (Environmental impact; justifica-tion principle).
AMAP Assessment 2002: Radioactivity in the Arctic66
Box 5·1. Definitions
The term environment has been defined in a number of national and international laws. Common to most definitions is the notionthat the environment consists of man, biota (e.g., microorganisms, plants, and animals), abiota (e.g., soil, water, and air), physicalsurroundings (e.g., climate, and light), and their interactions. Some definitions extend to both natural and man-made features ofthe environment (i.e., cultural heritage, and buildings); some limit the definition to those external factors having a direct effect onliving organisms.
Protection of the environment is predominantly perceived as the prevention of detriment to the environment and its living com-ponents. But the term can also encompass restoration, enhancement, and maintenance of environmental quality. While recogniz-ing natural environmental stressors, most legislation and international conventions deal specifically with anthropogenic effects.
In the broadest sense protection of the environment from ionizing radiation might include all biotic and abiotic components of theEarth’s biosphere. In a more practical sense, the abiotic component of the biosphere is known to be unaffected directly by the ef-fects of radiation under all but the most extreme of conditions. In some instances, an interpretation of ‘damage’ might reflect thatan environment is contaminated per se, particularly for ecosystems perceived as ‘pristine’ such as the Arctic. However, in mostcases, efforts to quantify systematically the consequences of radiation exposure and to develop a system for protection might bemore constructively focused on the most sensitive components of the biosphere, i.e., living organisms, but not totally excluding theabiotic environment.
At present, the only part of the environment explicitly considered for protection from ionizing radiation is man.
Depending on the context, some principles may bedeemed more relevant than others and some more fun-damental than others. In practice, the principles may evenconflict (e.g., 5 and 6). Principles 1 to 5 concern the ques-tion of why it is necessary to protect the environment,and 6 to 10 how to achieve this protection in practice.
The IAEA recently concluded that despite the appar-ent diversity of values in the different ethical outlooks,consensus on principles of environmental protection wassufficient to identify five common principles, namely:conservation of habitat and species; maintenance of bio-diversity; sustainability; environmental justice; and hu-man dignity (IAEA, 2002). Clear support for these fiveprinciples was obtained at the IUR consensus conferencein 2001, which was attended by participants represent-ing a wide range of disciplines connected to radiationprotection and environmental protection. Participantsidentified a need for ‘development of policy in an open,transparent, and participatory manner’, considered that‘the best available technology, including considerationof economic costs and environmental benefits, should beapplied to control any release of radionuclides into theenvironment’, and supported a precautionary approachto risk management (Strand and Oughton, 2002).
5.2.2. Management of environmental risk
In general, programs addressing the management of en-vironmental risk can be grouped (although somewhatarbitrarily) into three categories:
• management through pathway-based analysis of ex-posure, often involving environmental standards (e.g.,radiation dose to certain organisms or concentrationsof radionuclides in environmental media);
• management through process standards relevant tospecific source(s) based on best available technology(BAT) and similar criteria of technical status and per-formance; and
• pure management standards, which may include certi-fication schemes or schemes that ensure that positive ac-tion is taken to protect the environment and where conti-nuous performance improvement is sought. An exampleis the EC Eco-Management and Audit Scheme (EMAS).
Pathway-based schemes are generally considered mostrelevant to the development of assessment frameworksfor the environment, but aspects of other schemes maybe incorporated when appropriate.
5.2.3. System for environmental impact assessment
A coherent and logical environmental impact assessmentmethodology for ionizing radiation is essential (Pen-treath, 1999). Components that could form the basis forsuch a system include:
• a set of reference organisms – not all organisms can bestudied, necessitating a selection procedure;
• a set of quantities and units to express doses to biota.Currently, doses are expressed in Grays per unit time,which does not reflect the variable biological effectsarising from equal absorbed doses of differing radia-tion types;
• a defined set of dose models for a number of referenceflora and fauna. Methodologies exist which allow the
calculation of doses to organisms with varying geome-tries (e.g., consensus is required in adapting these al-gorithms for use within a protection framework); and
• a set of dose–effect relationships for reference organ-isms that could include data from low-exposure (e.g.,cytogenetic effects) to high-exposure (e.g., lethal ef-fects) situations.
Discussion within the scientific community has led tothe adoption of these points into a proposed strategycomprising three key components (IUR, 2000), namely:exposure pathways and retention of radionuclides bybiota; dose calculations; and dose-effect relationships.
5.2.3.1. Exposure pathways and retention of radionuclides by biota
The outcome of the work on exposure pathways will bebased on the acquisition and synthesis of informationconcerning ecological characteristics and radionuclideuptake within selected ecosystems. Simple reference mod-els could be developed for the simulation of radionuclidemigration and uptake to the whole organism (and or-gans if applicable) for those reference species living inrepresentative terrestrial and aquatic ecosystems.
5.2.3.2. Dose calculations
Radiation dosimetry models will be developed for the ref-erence organisms. These will be designed to estimate theactual or potential absorbed dose rates to the organismsfrom internal and external sources of �-, �-, and �-radia-tion. The final output will be a tabulation of absorbeddose rate coefficients (Gy/hr per unit radionuclide activityconcentration in the relevant environmental compart-ment) for each reference organism for the radionuclides ofconcern. It is likely that the reproductive organs will beimportant targets for inclusion in the dosimetry models.
5.2.3.3. Dose–effect relationships
Endpoints of concern in individual generic organismscould be defined and dose rate/response relationships forthe chosen endpoints tabulated. This would involve the in-tegration of data from earlier reviews, and assessments ofthe potential impacts of radiation in the environment, as-sessments of the wider radiobiological literature, and as-sessments of newly available information from the Kysh-tym (see Section 7.5.1) and Chernobyl accidents. Relevanteffects of radiation will probably include, but not neces-sarily be limited to, changes in morbidity, mortality, fer-tility, fecundity, and mutation rate. Information will beorganized so as to indicate the approximate dose rate/re-sponse relationships. An attempt should be made to quan-tify the intrinsic uncertainty in these threshold dose rates(e.g., through the extrapolation of laboratory data to nat-ural conditions) and to indicate possible modifying influen-ces (e.g., the influence of other environmental variables).
5.2.4. Target level of biological hierarchy
It is generally recognized that protective action shouldbe taken in such a way as to ensure that populations oforganisms receive an adequate level of protection (IAEA,
Chapter 5 · Protection of the Environment from the Effects of Radiation 67
1992, 2000) and that the functioning of their associatedecosystems is unaffected by the presence of a contami-nant. A practical approach to ensure that unacceptableeffects on populations are avoided is to target protectiveaction at the organizational level below populations, i.e.,individuals. This is justified on the basis of a number ofprecepts, including:
• population effects are unlikely to be manifested if indi-viduals are unaffected;
• population effects are more complex to assess than ef-fects on individuals and more likely to be masked bythe normal range of spatial and temporal ecosystemvariability;
• scientific information on population effects is compar-atively scarce; and
• in protecting threatened or endangered species, con-sideration of individuals is necessary.
However, the reasoning is not straightforward in allcases, bearing in mind that:
• for a variety of species (e.g., with asexual or vegetativepropagation), individuals and populations in the con-ventional sense may be difficult to differentiate;
• there are cases where individuals may be affected (e.g.,in the case of endocrine disrupters) while populationsremain unaffected; and
• in the case of stochastic effects, effects may be observedin individuals while not affecting the viability of thepopulation.
5.2.5. Dose or dose rate as an indicator of actual or potential impact
One approach to environmental assessment involves thecalculation of the dose or dose rate to reference organ-isms. The rationale being that biological effects of radia-tion are mediated through the absorbed dose and muchinformation is available linking the severity of effects tothe dose or dose rate.
Alternatively, assessments could be based on ra-dionuclide activity concentrations. However, the dose isfurther modified by the type of radionuclide and exter-nal and internal geometry, as well as other factors suchas lifespan and size. Activity concentrations could be ofrelevance in compliance discussions, e.g., by comparingexpected/observed concentration data with data fromdose standards (e.g., U.S. DOE, 2002). However, for as-sessing effects, including the radiation dose or dose rateadds transparency.
Several dosimetry models are available for aquaticand terrestrial environments, although these are notnecessarily sufficiently comprehensive for developing aframework for environmental protection. For the aquaticenvironment, the generic models relate to: small andlarge phytoplankton; pelagic and benthic crustaceans;benthic molluscs; and pelagic and benthic fish. Thesehave been developed to the point at which dose rate fac-tors have been tabulated for a range of radionuclides inenvironmental media (Amiro, 1997; Pentreath and Wood-head, 1988). It is envisaged that future work will focuson the development of the dosimetry models, and the as-sociated dose conversion factors that relate directly tothe reference organisms (and their local environment).
5.2.6. Practical and ethical advantages of the framework
A number of practical and ethically-relevant advantagesof this framework can be highlighted; the frameworkis site- and case-specific, transparent, involves stake-holder participation, enables comparison with otherenvironmental contaminants, is ‘bottom-up’; is applic-able to individuals and populations; and is compatiblewith anthropocentric and ecocentric environmental phil-osophies.
5.2.6.1. Site- and case-specific
That the framework is site- and case-specific promotesthe notion that there may be a number of different rea-sons for protecting the environment. For example, thecase may depend on available alternatives, the ecosystemitself (e.g., a protected habitat or common resource),and/or the organisms it contains (e.g., endangered spe-cies). There is also uncertainty in going from a measure-ment of concentrations in abiotic compartments (e.g.,soil, water), to calculations of accumulation and dosesin organisms, and to estimates of cellular up to ecosys-tem effects. Source-specific, site-specific, species-specific,and individual-specific variability all contribute to suchuncertainty. This complexity has the disadvantage of in-troducing difficulties and there may be cases where asimple approach is sufficient. Until better scientific evi-dence is available to support such judgments, oversim-plification should be avoided.
5.2.6.2. Transparency
The framework is transparent in that it indicates the po-tential consequences of actions and how these were de-rived. It also provides information relevant to the issueof ‘risk’, for example, uncertainties as to outcome, prob-abilities of harmful effect, errors in dose-risk calcula-tions, and model sensitivity. Honesty about the level ofscientific knowledge (meaning some distinction betweenwhat is widely acknowledged as fact, generally accepted,disputed, difficult to predict, unknown, etc.) is funda-mental to building public trust; short-sightedness or dis-honesty is one of the fastest ways to lose this trust.
5.2.6.3. Stakeholder participation
The framework promotes a more open debate on theacceptability of the consequences of radiation exposureto biota, and encourages public and stakeholder par-ticipation in such debates. A simple statement that ‘re-leases are below dose limits’ tends to beg the question asto where the limits came from and whether they are ap-propriate. It is also questionable whether the public issufficiently competent to participate in such debates,and whether the perceptions influencing attitudes to theirown risk – for example, whether voluntary or imposed –are equally relevant to the question of what is acceptableto animals and other living organisms. The public is notalways ‘rational’ and consistent in the way it valuesanimals (dogs and pandas being more important thanmosquitoes and worms). Who decides which factors arerelevant?
AMAP Assessment 2002: Radioactivity in the Arctic68
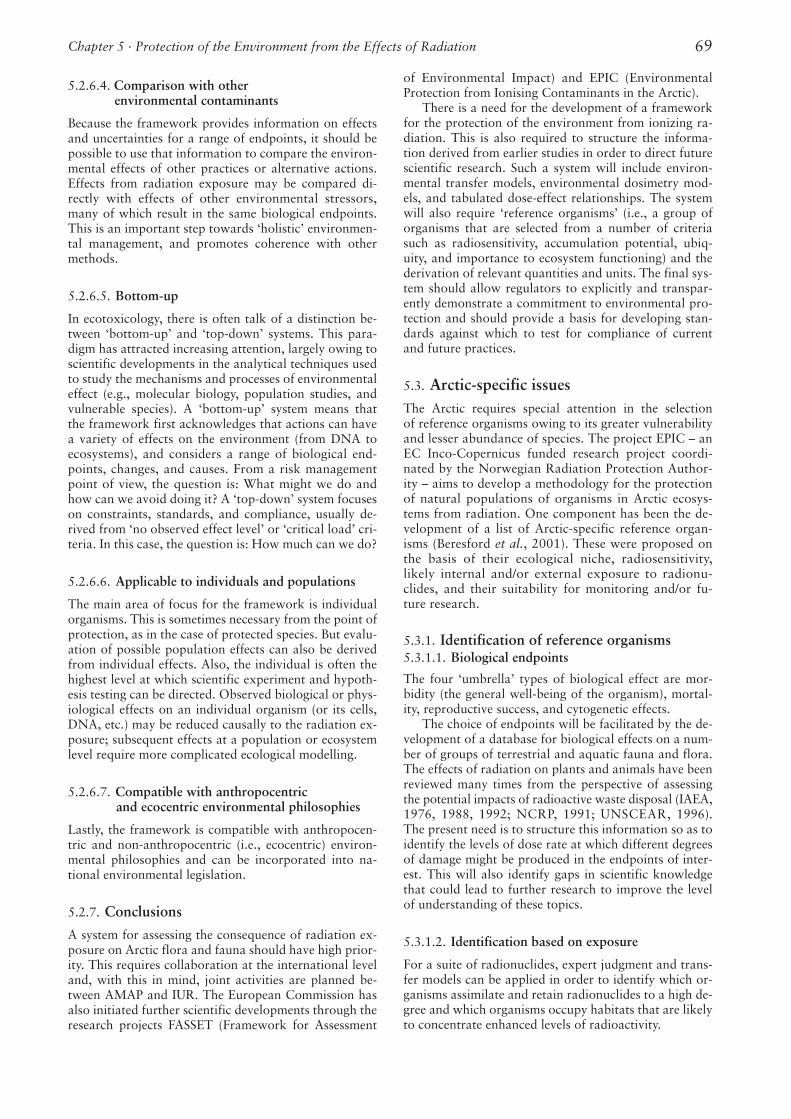
5.2.6.4. Comparison with other environmental contaminants
Because the framework provides information on effectsand uncertainties for a range of endpoints, it should bepossible to use that information to compare the environ-mental effects of other practices or alternative actions.Effects from radiation exposure may be compared di-rectly with effects of other environmental stressors,many of which result in the same biological endpoints.This is an important step towards ‘holistic’ environmen-tal management, and promotes coherence with othermethods.
5.2.6.5. Bottom-up
In ecotoxicology, there is often talk of a distinction be-tween ‘bottom-up’ and ‘top-down’ systems. This para-digm has attracted increasing attention, largely owing toscientific developments in the analytical techniques usedto study the mechanisms and processes of environmentaleffect (e.g., molecular biology, population studies, andvulnerable species). A ‘bottom-up’ system means thatthe framework first acknowledges that actions can havea variety of effects on the environment (from DNA toecosystems), and considers a range of biological end-points, changes, and causes. From a risk managementpoint of view, the question is: What might we do andhow can we avoid doing it? A ‘top-down’ system focuseson constraints, standards, and compliance, usually de-rived from ‘no observed effect level’ or ‘critical load’ cri-teria. In this case, the question is: How much can we do?
5.2.6.6. Applicable to individuals and populations
The main area of focus for the framework is individualorganisms. This is sometimes necessary from the point ofprotection, as in the case of protected species. But evalu-ation of possible population effects can also be derivedfrom individual effects. Also, the individual is often thehighest level at which scientific experiment and hypoth-esis testing can be directed. Observed biological or phys-iological effects on an individual organism (or its cells,DNA, etc.) may be reduced causally to the radiation ex-posure; subsequent effects at a population or ecosystemlevel require more complicated ecological modelling.
5.2.6.7. Compatible with anthropocentric and ecocentric environmental philosophies
Lastly, the framework is compatible with anthropocen-tric and non-anthropocentric (i.e., ecocentric) environ-mental philosophies and can be incorporated into na-tional environmental legislation.
5.2.7. Conclusions
A system for assessing the consequence of radiation ex-posure on Arctic flora and fauna should have high prior-ity. This requires collaboration at the international leveland, with this in mind, joint activities are planned be-tween AMAP and IUR. The European Commission hasalso initiated further scientific developments through theresearch projects FASSET (Framework for Assessment
of Environmental Impact) and EPIC (EnvironmentalProtection from Ionising Contaminants in the Arctic).
There is a need for the development of a frameworkfor the protection of the environment from ionizing ra-diation. This is also required to structure the informa-tion derived from earlier studies in order to direct futurescientific research. Such a system will include environ-mental transfer models, environmental dosimetry mod-els, and tabulated dose-effect relationships. The systemwill also require ‘reference organisms’ (i.e., a group oforganisms that are selected from a number of criteriasuch as radiosensitivity, accumulation potential, ubiq-uity, and importance to ecosystem functioning) and thederivation of relevant quantities and units. The final sys-tem should allow regulators to explicitly and transpar-ently demonstrate a commitment to environmental pro-tection and should provide a basis for developing stan-dards against which to test for compliance of currentand future practices.
5.3. Arctic-specific issuesThe Arctic requires special attention in the selectionof reference organisms owing to its greater vulnerabilityand lesser abundance of species. The project EPIC – anEC Inco-Copernicus funded research project coordi-nated by the Norwegian Radiation Protection Author-ity – aims to develop a methodology for the protectionof natural populations of organisms in Arctic ecosys-tems from radiation. One component has been the de-velopment of a list of Arctic-specific reference organ-isms (Beresford et al., 2001). These were proposed onthe basis of their ecological niche, radiosensitivity,likely internal and/or external exposure to radionu-clides, and their suitability for monitoring and/or fu-ture research.
5.3.1. Identification of reference organisms5.3.1.1. Biological endpoints
The four ‘umbrella’ types of biological effect are mor-bidity (the general well-being of the organism), mortal-ity, reproductive success, and cytogenetic effects.
The choice of endpoints will be facilitated by the de-velopment of a database for biological effects on a num-ber of groups of terrestrial and aquatic fauna and flora.The effects of radiation on plants and animals have beenreviewed many times from the perspective of assessingthe potential impacts of radioactive waste disposal (IAEA,1976, 1988, 1992; NCRP, 1991; UNSCEAR, 1996).The present need is to structure this information so as toidentify the levels of dose rate at which different degreesof damage might be produced in the endpoints of inter-est. This will also identify gaps in scientific knowledgethat could lead to further research to improve the levelof understanding of these topics.
5.3.1.2. Identification based on exposure
For a suite of radionuclides, expert judgment and trans-fer models can be applied in order to identify which or-ganisms assimilate and retain radionuclides to a high de-gree and which organisms occupy habitats that are likelyto concentrate enhanced levels of radioactivity.
Chapter 5 · Protection of the Environment from the Effects of Radiation 69
The habits and habitat of different life stages of someorganisms may vary considerably (e.g., bird and egg, lar-val and adult insects) and this may lead to different ex-posure pathways. This should be considered when se-lecting reference organisms. A selection of candidate ref-erence organisms for European ecosystems based purelyon radioecological criteria were drawn up by Strand etal. (2001).
5.3.1.3. Identification based on ecological relevance
Ecological sensitivity is defined in terms of the role ofthe organism in the ecosystem concerned. A number offactors are relevant, e.g., population size; trophic level;reproductive strategy, including generation time; size;habitat; seasonal variations; physiological features; andbiological complexity.
The simple approach, as used in EPIC, is to assess therequirements for representation of each trophic level.Dominant organisms at each trophic level are responsi-ble for the major energy and nutrient flows in the eco-systems; therefore, it could be argued that protection ofthese organisms (by their selection as reference organ-isms) will ensure the protection of the ecosystem as awhole.
5.3.1.4. Identification based on radiosensitivity
The effects of ionizing radiation on living organismshave been reviewed extensively (Rose, 1992; UN-SCEAR, 1996). The comparative sensitivity of differentorganisms to radiation in terms of acute lethal dose isshown in Figure 5·1. Although other radiation-inducedeffects (e.g., morbidity, fertility, and fecundity) may alsobe important; as a thorough review of these ‘other’ fac-tors has not yet been conducted the comparative lethaldose (mortality) was used to aid the selection of refer-ence organisms.
Available data on acute lethal dose exposures indi-cate that mammals and birds are the most radiosensitivegroups, although the radiosensitivity ranges are large
and sensitivities for different groups overlap consider-ably. These criteria indicate that mammals and birdsshould be included in any suite of reference organisms.
5.3.1.5. Distribution and practicality for research and monitoring
There is little point selecting reference organisms thatare not widely distributed through at least one of thethree Arctic zones (High-, Low-, and subarctic). Speciesknown to occur in these zones, for those groups forwhich there is sufficient information, are listed in theEPIC report (Beresford et al., 2001). The practicality ofcollecting the organisms for monitoring purposes (to de-termine the radionuclide content or to assess effects dueto exposure) or to enable further radiosensitivity andradioecological studies is a further consideration. Forsome groups, this would be difficult owing to their pro-tected status (e.g., raptors, marine mammals) or theirperceived public sentiment (e.g., marine mammals, largeterrestrial carnivores). Also, some potential reference or-ganisms are of commercial importance, for example,macroalgae (in the Norwegian, Barents, and White Seas),benthic fish (haddock, Greenland halibut, Europeanplaice) and pelagic carnivorous fish (Atlantic cod). Tak-ing these factors into account, a selection of appropriateorganism groups are listed in Table 5·1.
5.3.1.6. Examples of reference organisms
A search for candidate reference organisms occurredduring the EPIC project. In this respect, it must be em-phasized that the term ‘reference organism’ does notimply a particular species, but serves as a surrogate.Thus, in principle, it should be possible to identify spe-cific plants and animals that are listed under the heading‘reference organism’ (Table 5.1). In the practical applica-tion of the system, ‘secondary reference organisms’ mayneed to be defined at the species level. For example, inthe case of a carnivorous terrestrial mammal, the Arcticfox (Alopex lagopus) might be selected and in the case ofa marine benthos-eating bird, the common eider (Soma-teria mollissima). The selection process is driven by fac-tors such as ubiquity and practicability for monitoring.
AMAP Assessment 2002: Radioactivity in the Arctic70
Mollusks
Viruses
Protozoa
Bacteria
Moss, lichen, algae
Insects
Crustaceans
Reptiles
Amphibians
Fish
Higher plants
Birds
Mammals
10 000Acute lethal dose, Gy1000100101
Figure 5·1. Comparative radiosensitivity of different organisms rep-resented by the acute lethal dose ranges (UNSCEAR, 1996).
Table 5·1. Groups from which aquatic and terrestrial reference or-ganisms should be selected (Beresford et al., 2001).––––––––––––––––––––––––––––––––––––––––––––––––––––––––––
Aquatic Terrestrialreference organisms reference organisms
––––––––––––––––––––––––––––––––––––––––––––––––––––––––––Benthic bacteria Lichens and bryophytesMacroalgae (marine) GymnospermsAquatic plants (freshwater) MonocotyledonsPhytoplankton DicotyledonsZooplankton Soil microorganismsMolluscs Soil invertebratesPolychaetes (marine) Herbivorous mammalsInsect larvae (freshwater – benthos) Carnivorous mammalsPelagic fish (planktotrophic) Bird eggsPelagic fish (carnivorous)Benthic fishCarnivorous mammalsBenthos-eating birdsFish eggs
––––––––––––––––––––––––––––––––––––––––––––––––––––––––––
tection in low dose regimes is the assumption that therisk of effects on humans is proportional to radiationdose without the assumption of any threshold. Whilethere is ongoing debate on the validity of this assump-tion (Koblinger, 2000) and on the approaches to itspractical application in situations of very low level expo-sure (Clarke, 1999), this is the primary type of risk ad-dressed and is of immediate relevance to existing expo-sures to radiation from anthropogenic sources and activ-ities, i.e., practices in International Commission on Ra-diological Protection (ICRP) terminology (ICRP, 1991).The principles of radiological protection require thatsources and practices are optimized to reduce doses to theextent achievable under the prevailing technical, social,and economic climate. Thus, optimization addresses thereduction of risks associated with operational and acci-dental exposures. Risk management involves the assess-ment of potential consequences of events at nuclear fa-cilities that could result in additional exposure to radia-tion and the probability that any such event occurs.Here, the emphasis is on potential risks of exposure as-sociated with exceptional events such as accidents at ex-isting nuclear facilities within, or near, the Arctic.
While the risk management approach outlined in Sec-tion 6.3 concerns radioactivity from nuclear operationsand activities, this approach can be used for all types ofcontaminants.
6.3. The approach to risk managementThe first AMAP assessment identified known sources ofradioactivity in the Arctic. These range from atmos-pheric fallout from nuclear weapons tests, past and pres-ent nuclear power reactor operations, nuclear-poweredvessels, spent nuclear fuel management, and the Cher-nobyl accident. The presence of radionuclides in theArctic from some of these sources will diminish withtime. Nevertheless, spent nuclear fuel management andpotential nuclear accidents present risks of additionalexposure to Arctic populations and the environment.
In its most basic form, the risk management processconsists of a sequence of steps. Namely:
• identification of hazards (in this case, current or pro-posed sources and practices);
• initial assessment of the risks presented by these haz-ards;
• identification and analysis of options for risk reduc-tion through the imposition of preventive measures toabate risks;
• design and application of preparedness and responsemeasures to reduce the consequences to society; and
• refinement of the selection of associated performanceevaluation measures and the corresponding risk as-sessment.
Initial estimates of risk can be based on simple assump-tions and relatively simple analyses. These warrant fur-
71
6.1. IntroductionThis chapter considers nuclear safety initiatives relatingto the eight Arctic countries. However, as many of thepractices that impact upon or present a hazard to theArctic environment are sited in northwest Russia, the em-phasis of this chapter is on that region. Safety initiativesmostly relate to safety assessments of nuclear installa-tions, particularly nuclear power plants (NPPs); otherinitiatives address regulatory improvements, arrange-ments for physical protection, and nuclear safeguards.
Production of weapons-grade nuclear materials, op-eration of NPPs, nuclear fuel cycle facilities, nuclear-powered ships, and other activities involving the use ofnuclear energy and radioactive materials in the territoryof the Russian Federation have resulted in the accumula-tion of significant amounts of radioactive waste andspent nuclear fuel in Arctic Russia. Their managementpresents a major challenge.
Nuclear safety support programs are designed tocontribute to the prevention of serious nuclear accidentsat nuclear facilities. Their purpose is to provide assis-tance to the operators of nuclear facilities and the na-tional safety bodies that regulate these facilities. Otherinternational programs address risks associated with nu-clear waste, illicit trafficking, and terrorism involvingnuclear materials. While terrorism has always been ofconcern to bodies such as the International Atomic En-ergy Agency (IAEA), interest in the wider communityhas been renewed following the 11 September 2001 at-tacks (Lubenau and Strom, 2002). The initiatives are notspecific to the Arctic; however, the break-up of the for-mer Soviet Union has meant that administrative controlsand competence require strengthening to prevent terror-ists obtaining nuclear material (Webb, 2002).
6.2. The purpose of risk managementRisk management is a process designed to assess, priori-tize, and control risks with the specific goal of reducingrisks in a manner that optimizes the use of resources andachieves the greatest reductions in risk for a given re-source investment. A major fundamental underlying riskmanagement is to ensure that planned activities, includ-ing monitoring and assessment, are formulated withinthe context of comparative risk. Thus, resource invest-ments are justified on the basis of their relevance to thepredominant risks or to improving the characterizationof risks. The characterization of absolute and relativerisks should consider both the risks posed by exposuresfrom the planned operation of existing sources and prac-tices and the hazards associated with proposed futuresources and practices.
Owing to the stochastic nature of effects associatedwith low-level exposures, risk management within thecontext of radiological protection must deal with a num-ber of categories of risk. The basis for radiological pro-
Chapter 6
Nuclear Safety Initiatives –––––––––––––––––––––––––––––––––––––––––––––––––––––––––––––––––––––––––––––––––––––––––
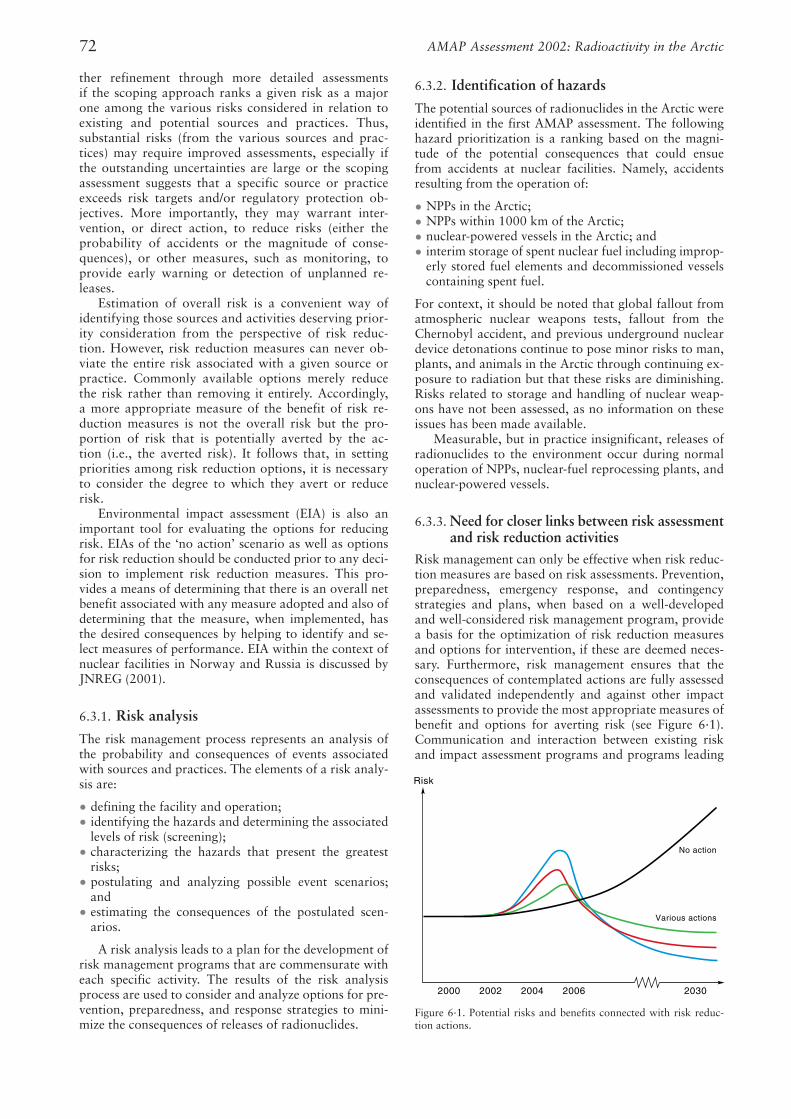
ther refinement through more detailed assessmentsif the scoping approach ranks a given risk as a majorone among the various risks considered in relation toexisting and potential sources and practices. Thus,substantial risks (from the various sources and prac-tices) may require improved assessments, especially ifthe outstanding uncertainties are large or the scopingassessment suggests that a specific source or practiceexceeds risk targets and/or regulatory protection ob-jectives. More importantly, they may warrant inter-vention, or direct action, to reduce risks (either theprobability of accidents or the magnitude of conse-quences), or other measures, such as monitoring, toprovide early warning or detection of unplanned re-leases.
Estimation of overall risk is a convenient way ofidentifying those sources and activities deserving prior-ity consideration from the perspective of risk reduc-tion. However, risk reduction measures can never ob-viate the entire risk associated with a given source orpractice. Commonly available options merely reducethe risk rather than removing it entirely. Accordingly,a more appropriate measure of the benefit of risk re-duction measures is not the overall risk but the pro-portion of risk that is potentially averted by the ac-tion (i.e., the averted risk). It follows that, in settingpriorities among risk reduction options, it is necessaryto consider the degree to which they avert or reducerisk.
Environmental impact assessment (EIA) is also animportant tool for evaluating the options for reducingrisk. EIAs of the ‘no action’ scenario as well as optionsfor risk reduction should be conducted prior to any deci-sion to implement risk reduction measures. This pro-vides a means of determining that there is an overall netbenefit associated with any measure adopted and also ofdetermining that the measure, when implemented, hasthe desired consequences by helping to identify and se-lect measures of performance. EIA within the context ofnuclear facilities in Norway and Russia is discussed byJNREG (2001).
6.3.1. Risk analysis
The risk management process represents an analysis ofthe probability and consequences of events associatedwith sources and practices. The elements of a risk analy-sis are:
• defining the facility and operation;• identifying the hazards and determining the associated
levels of risk (screening);• characterizing the hazards that present the greatest
risks;• postulating and analyzing possible event scenarios;
and• estimating the consequences of the postulated scen-
arios.
A risk analysis leads to a plan for the development ofrisk management programs that are commensurate witheach specific activity. The results of the risk analysisprocess are used to consider and analyze options for pre-vention, preparedness, and response strategies to mini-mize the consequences of releases of radionuclides.
6.3.2. Identification of hazards
The potential sources of radionuclides in the Arctic wereidentified in the first AMAP assessment. The followinghazard prioritization is a ranking based on the magni-tude of the potential consequences that could ensuefrom accidents at nuclear facilities. Namely, accidentsresulting from the operation of:
• NPPs in the Arctic;• NPPs within 1000 km of the Arctic; • nuclear-powered vessels in the Arctic; and• interim storage of spent nuclear fuel including improp-
erly stored fuel elements and decommissioned vesselscontaining spent fuel.
For context, it should be noted that global fallout fromatmospheric nuclear weapons tests, fallout from theChernobyl accident, and previous underground nucleardevice detonations continue to pose minor risks to man,plants, and animals in the Arctic through continuing ex-posure to radiation but that these risks are diminishing.Risks related to storage and handling of nuclear weap-ons have not been assessed, as no information on theseissues has been made available.
Measurable, but in practice insignificant, releases ofradionuclides to the environment occur during normaloperation of NPPs, nuclear-fuel reprocessing plants, andnuclear-powered vessels.
6.3.3. Need for closer links between risk assessment and risk reduction activities
Risk management can only be effective when risk reduc-tion measures are based on risk assessments. Prevention,preparedness, emergency response, and contingencystrategies and plans, when based on a well-developedand well-considered risk management program, providea basis for the optimization of risk reduction measuresand options for intervention, if these are deemed neces-sary. Furthermore, risk management ensures that theconsequences of contemplated actions are fully assessedand validated independently and against other impactassessments to provide the most appropriate measures ofbenefit and options for averting risk (see Figure 6·1).Communication and interaction between existing riskand impact assessment programs and programs leading
AMAP Assessment 2002: Radioactivity in the Arctic72
2000 2002 2004 2006 2030
No action
Various actions
Risk
Figure 6·1. Potential risks and benefits connected with risk reduc-tion actions.
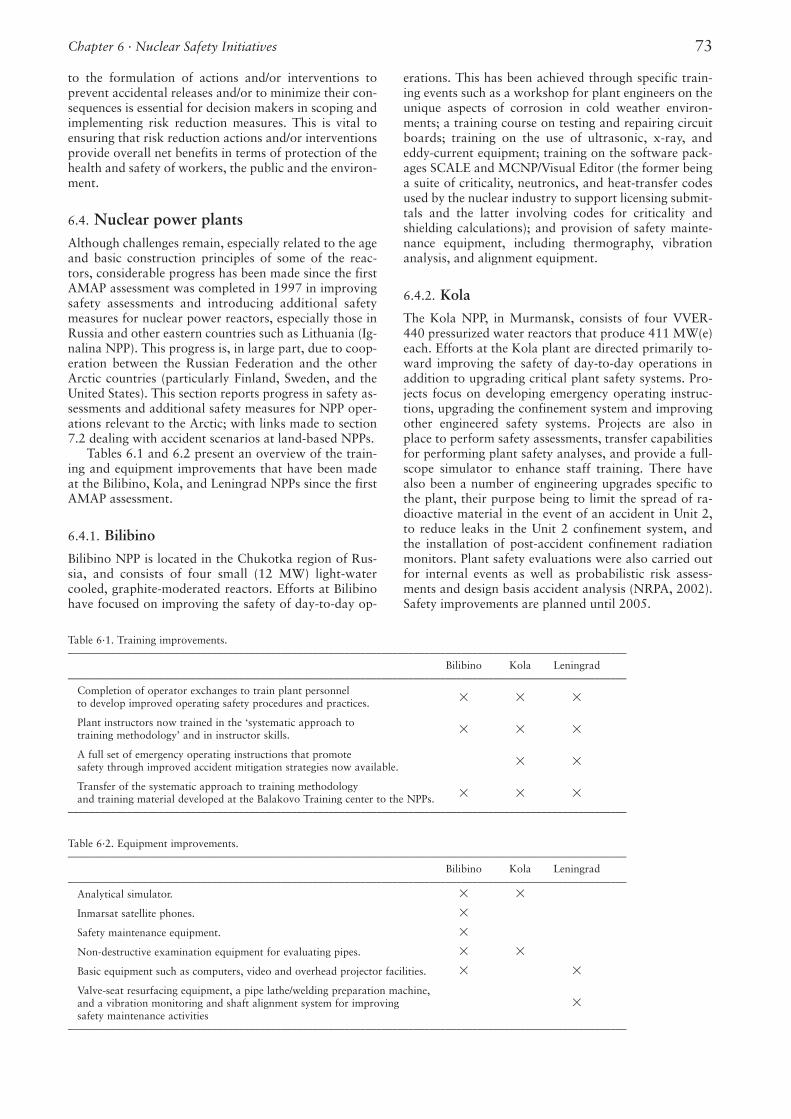
to the formulation of actions and/or interventions toprevent accidental releases and/or to minimize their con-sequences is essential for decision makers in scoping andimplementing risk reduction measures. This is vital toensuring that risk reduction actions and/or interventionsprovide overall net benefits in terms of protection of thehealth and safety of workers, the public and the environ-ment.
6.4. Nuclear power plantsAlthough challenges remain, especially related to the ageand basic construction principles of some of the reac-tors, considerable progress has been made since the firstAMAP assessment was completed in 1997 in improvingsafety assessments and introducing additional safetymeasures for nuclear power reactors, especially those inRussia and other eastern countries such as Lithuania (Ig-nalina NPP). This progress is, in large part, due to coop-eration between the Russian Federation and the otherArctic countries (particularly Finland, Sweden, and theUnited States). This section reports progress in safety as-sessments and additional safety measures for NPP oper-ations relevant to the Arctic; with links made to section7.2 dealing with accident scenarios at land-based NPPs.
Tables 6.1 and 6.2 present an overview of the train-ing and equipment improvements that have been madeat the Bilibino, Kola, and Leningrad NPPs since the firstAMAP assessment.
6.4.1. Bilibino
Bilibino NPP is located in the Chukotka region of Rus-sia, and consists of four small (12 MW) light-watercooled, graphite-moderated reactors. Efforts at Bilibinohave focused on improving the safety of day-to-day op-
erations. This has been achieved through specific train-ing events such as a workshop for plant engineers on theunique aspects of corrosion in cold weather environ-ments; a training course on testing and repairing circuitboards; training on the use of ultrasonic, x-ray, andeddy-current equipment; training on the software pack-ages SCALE and MCNP/Visual Editor (the former beinga suite of criticality, neutronics, and heat-transfer codesused by the nuclear industry to support licensing submit-tals and the latter involving codes for criticality andshielding calculations); and provision of safety mainte-nance equipment, including thermography, vibrationanalysis, and alignment equipment.
6.4.2. Kola
The Kola NPP, in Murmansk, consists of four VVER-440 pressurized water reactors that produce 411 MW(e)each. Efforts at the Kola plant are directed primarily to-ward improving the safety of day-to-day operations inaddition to upgrading critical plant safety systems. Pro-jects focus on developing emergency operating instruc-tions, upgrading the confinement system and improvingother engineered safety systems. Projects are also inplace to perform safety assessments, transfer capabilitiesfor performing plant safety analyses, and provide a full-scope simulator to enhance staff training. There havealso been a number of engineering upgrades specific tothe plant, their purpose being to limit the spread of ra-dioactive material in the event of an accident in Unit 2,to reduce leaks in the Unit 2 confinement system, andthe installation of post-accident confinement radiationmonitors. Plant safety evaluations were also carried outfor internal events as well as probabilistic risk assess-ments and design basis accident analysis (NRPA, 2002).Safety improvements are planned until 2005.
Chapter 6 · Nuclear Safety Initiatives 73
Table 6·1. Training improvements.–––––––––––––––––––––––––––––––––––––––––––––––––––––––––––––––––––––––––––––––––––––––––––––––––––––––––
Bilibino Kola Leningrad–––––––––––––––––––––––––––––––––––––––––––––––––––––––––––––––––––––––––––––––––––––––––––––––––––––––––
Completion of operator exchanges to train plant personnel to develop improved operating safety procedures and practices. � � �
Plant instructors now trained in the ‘systematic approach to training methodology’ and in instructor skills. � � �
A full set of emergency operating instructions that promote safety through improved accident mitigation strategies now available. � �
Transfer of the systematic approach to training methodology and training material developed at the Balakovo Training center to the NPPs. � � �
–––––––––––––––––––––––––––––––––––––––––––––––––––––––––––––––––––––––––––––––––––––––––––––––––––––––––
Table 6·2. Equipment improvements. –––––––––––––––––––––––––––––––––––––––––––––––––––––––––––––––––––––––––––––––––––––––––––––––––––––––––
Bilibino Kola Leningrad–––––––––––––––––––––––––––––––––––––––––––––––––––––––––––––––––––––––––––––––––––––––––––––––––––––––––
Analytical simulator. � �
Inmarsat satellite phones. �
Safety maintenance equipment. �
Non-destructive examination equipment for evaluating pipes. � �
Basic equipment such as computers, video and overhead projector facilities. � �
Valve-seat resurfacing equipment, a pipe lathe/welding preparation machine, and a vibration monitoring and shaft alignment system for improving �safety maintenance activities
–––––––––––––––––––––––––––––––––––––––––––––––––––––––––––––––––––––––––––––––––––––––––––––––––––––––––
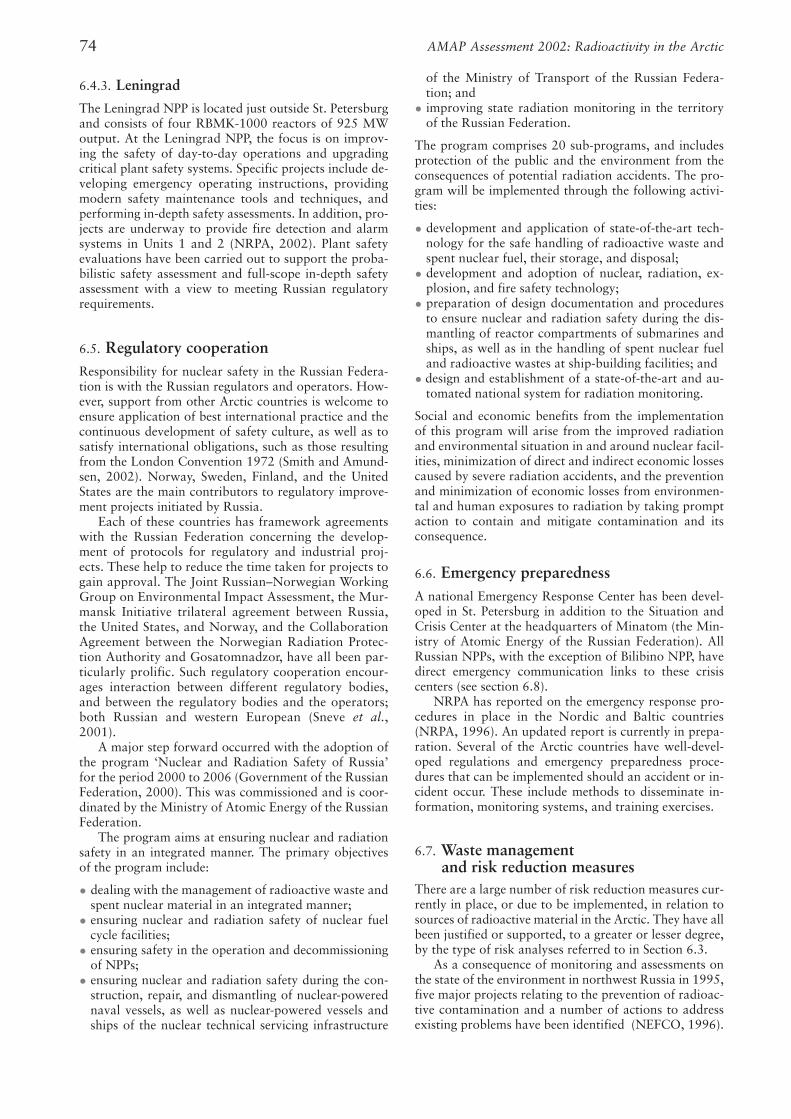
6.4.3. Leningrad
The Leningrad NPP is located just outside St. Petersburgand consists of four RBMK-1000 reactors of 925 MWoutput. At the Leningrad NPP, the focus is on improv-ing the safety of day-to-day operations and upgradingcritical plant safety systems. Specific projects include de-veloping emergency operating instructions, providingmodern safety maintenance tools and techniques, andperforming in-depth safety assessments. In addition, pro-jects are underway to provide fire detection and alarmsystems in Units 1 and 2 (NRPA, 2002). Plant safetyevaluations have been carried out to support the proba-bilistic safety assessment and full-scope in-depth safetyassessment with a view to meeting Russian regulatoryrequirements.
6.5. Regulatory cooperationResponsibility for nuclear safety in the Russian Federa-tion is with the Russian regulators and operators. How-ever, support from other Arctic countries is welcome toensure application of best international practice and thecontinuous development of safety culture, as well as tosatisfy international obligations, such as those resultingfrom the London Convention 1972 (Smith and Amund-sen, 2002). Norway, Sweden, Finland, and the UnitedStates are the main contributors to regulatory improve-ment projects initiated by Russia.
Each of these countries has framework agreementswith the Russian Federation concerning the develop-ment of protocols for regulatory and industrial proj-ects. These help to reduce the time taken for projects togain approval. The Joint Russian–Norwegian WorkingGroup on Environmental Impact Assessment, the Mur-mansk Initiative trilateral agreement between Russia,the United States, and Norway, and the CollaborationAgreement between the Norwegian Radiation Protec-tion Authority and Gosatomnadzor, have all been par-ticularly prolific. Such regulatory cooperation encour-ages interaction between different regulatory bodies,and between the regulatory bodies and the operators;both Russian and western European (Sneve et al.,2001).
A major step forward occurred with the adoption ofthe program ‘Nuclear and Radiation Safety of Russia’for the period 2000 to 2006 (Government of the RussianFederation, 2000). This was commissioned and is coor-dinated by the Ministry of Atomic Energy of the RussianFederation.
The program aims at ensuring nuclear and radiationsafety in an integrated manner. The primary objectivesof the program include:
• dealing with the management of radioactive waste andspent nuclear material in an integrated manner;
• ensuring nuclear and radiation safety of nuclear fuelcycle facilities;
• ensuring safety in the operation and decommissioningof NPPs;
• ensuring nuclear and radiation safety during the con-struction, repair, and dismantling of nuclear-powerednaval vessels, as well as nuclear-powered vessels andships of the nuclear technical servicing infrastructure
of the Ministry of Transport of the Russian Federa-tion; and
• improving state radiation monitoring in the territoryof the Russian Federation.
The program comprises 20 sub-programs, and includesprotection of the public and the environment from theconsequences of potential radiation accidents. The pro-gram will be implemented through the following activi-ties:
• development and application of state-of-the-art tech-nology for the safe handling of radioactive waste andspent nuclear fuel, their storage, and disposal;
• development and adoption of nuclear, radiation, ex-plosion, and fire safety technology;
• preparation of design documentation and proceduresto ensure nuclear and radiation safety during the dis-mantling of reactor compartments of submarines andships, as well as in the handling of spent nuclear fueland radioactive wastes at ship-building facilities; and
• design and establishment of a state-of-the-art and au-tomated national system for radiation monitoring.
Social and economic benefits from the implementationof this program will arise from the improved radiationand environmental situation in and around nuclear facil-ities, minimization of direct and indirect economic lossescaused by severe radiation accidents, and the preventionand minimization of economic losses from environmen-tal and human exposures to radiation by taking promptaction to contain and mitigate contamination and itsconsequence.
6.6. Emergency preparednessA national Emergency Response Center has been devel-oped in St. Petersburg in addition to the Situation andCrisis Center at the headquarters of Minatom (the Min-istry of Atomic Energy of the Russian Federation). AllRussian NPPs, with the exception of Bilibino NPP, havedirect emergency communication links to these crisiscenters (see section 6.8).
NRPA has reported on the emergency response pro-cedures in place in the Nordic and Baltic countries(NRPA, 1996). An updated report is currently in prepa-ration. Several of the Arctic countries have well-devel-oped regulations and emergency preparedness proce-dures that can be implemented should an accident or in-cident occur. These include methods to disseminate in-formation, monitoring systems, and training exercises.
6.7. Waste management and risk reduction measures
There are a large number of risk reduction measures cur-rently in place, or due to be implemented, in relation tosources of radioactive material in the Arctic. They have allbeen justified or supported, to a greater or lesser degree,by the type of risk analyses referred to in Section 6.3.
As a consequence of monitoring and assessments onthe state of the environment in northwest Russia in 1995,five major projects relating to the prevention of radioac-tive contamination and a number of actions to addressexisting problems have been identified (NEFCO, 1996).
AMAP Assessment 2002: Radioactivity in the Arctic74

Since 1996, several sub-projects have resulted in signifi-cant risk reductions to the population and the environ-ment. Some have been undertaken through the NordicEnvironment Finance Corporation, while others havebeen addressed and funded by other international bodiesand collaborations. The Contact Expert Group, set upunder sponsorship by the IAEA, has facilitated interna-tional collaboration (CEG, 2002). The remainder of sec-tion 6.7 details some of the major projects that involvefacilities other than NPPs.
6.7.1. Rehabilitation of the Murmansk RADON center
The Russian RADON interim storage for low and inter-mediate level radioactive waste located in the Mur-mansk area ceased operation in 1993 because it did notmeet Russian quality requirements. Decommissioning ofthis facility with European Union assistance is now be-ing considered. Recently, a proposal for a regional in-terim storage facility sited at the NERPA dockyard withthe capacity to store all conditioned low and intermedi-ate level waste from the Murmansk region, includingthat from the RADON facility, has been completed.
6.7.2. Submarine spent fuel management in northwest Russia
Under a bilateral assistance program to help tackle nu-clear related clean-up in northwest Russia announced bythe United Kingdom in February 1999, assistance isbeing provided for the management and interim storageon land of spent nuclear fuel from decommissioned nu-clear submarines. This involves the creation of an in-terim storage facility for spent nuclear fuel comprising astorage pad for up to 50 casks and a number of certifiedRussian 40 t dual-purpose casks at either NERPA orPolyarnyi, two Russian shipyards.
6.7.3. Improved reprocessing facilities at Mayak
All reprocessable naval spent fuel should be sent to theMayak reprocessing facility. However, current storagefacilities are full and the lack of interim facilities has cre-ated a bottleneck in the decommissioning program. TheEuropean Commission, France, Norway, Sweden, Rus-sia, and the United Kingdom collaborated in a study toinvestigate three possible interim storage options. Thechosen option was a new dry store and additional in-terim storage for the spent nuclear fuel casks on-site. Theproject is due to be funded solely by the United States aspart of the Co-operative Threat Reduction program.Other projects relating to improvements at Mayak arebeing funded by European countries and the EuropeanCommission.
6.7.4. Treatment of liquid radioactive waste
This project involves the construction and deploymentof mobile processing facilities to decontaminate and re-duce the volume of liquid radioactive wastes. The inten-tion is to site treatment plants at Severodvinsk and inSnezhnogorsk (NERPA). These plants are based on a ce-mentation process and are intended to be mobile and
transportable by sea. Particular emphasis is placed onthe processing of liquid wastes from the decommission-ing of nuclear-powered submarines.
6.7.5. Atomflot
There are three consortium projects with Atomflot andthe Russian Northern Fleet for the treatment of liquidradioactive waste with permanently-sited and moveableequipment. Trilateral collaboration between Norway,the United States, and Russia has been particularly suc-cessful in the expansion and upgrading of facilities atAtomflot. A notable success is the inclusion of qualityassurance procedures in Russian methods and the use ofenvironmentally friendly technology during implemen-tation. The start of operation of the purification plant,however, has been seriously delayed, and in 2003 it wasstill not operational.
In addition, the Finnish NURES system for purifyingliquid radioactive wastes has been successfully used atAtomflot. It has been proposed for use in a Norwe-gian–U.S.–Russian project to deal with military wastesin Murmansk although progress has been delayed by ac-cess restrictions.
6.7.6. Repository at Novaya Zemlya
A Russian-lead project developed designs for a low tomedium level waste repository in the permafrost of No-vaya Zemlya. The technical designs were peer reviewedby several international organizations, under the coordi-nation of the European Commission. There was wide-spread support for the facility although more detailedsafety assessments were required. Early in 2002, Russiandesigns for the repository were approved by the Ecolog-ical Expert Commission and are currently awaiting ap-proval from the State Committee for EnvironmentalProtection (Goscomecology). Following approval, de-tailed design and construction plans can be made. Large-scale international finance is required to implement theproject as the estimated cost of such a facility is US$ 70to 90 million.
6.7.7. Andreyeva Bay
At Andreyeva Bay there are 21000 spent fuel elementsfrom the Northern Fleet’s decommissioned submarinesstored in three concrete tanks. These tanks are in verypoor condition and the spent fuel elements need to be re-covered. In 2001, a Norwegian–Russian bilateral agree-ment resulted in the initiation of several projects. Engi-neering infrastructure improvements and feasibilitystudies have been established and the main tasksplanned involve the stabilization of current spent nu-clear fuel storage units, treatment or removal of liquidradioactive waste, conditioning of solid wastes and theirremoval to a regional store, and decontamination andfinal remediation of the site.
6.7.8. The Lepse
The Lepse is a decommissioned service vessel of the Rus-sian icebreaker fleet that is docked in Murmansk andused as a storage facility for spent nuclear fuel and other
Chapter 6 · Nuclear Safety Initiatives 75
radioactive wastes. The ship is in a very poor state of re-pair and there has long been a desire to offload andtransfer the radioactive wastes and damaged spent fuelto land-based storage.
Since the first AMAP assessment, there has been littleprogress in the work to decommission the Lepse. How-ever, the Murmansk 80 t Cask Project, which will pro-vide transport and interim storage for spent nuclear fuelfrom Russian nuclear submarines and icebreakers cur-rently stored on barges and service vessels, and in a low-level radioactive waste treatment facility in Murmansk,is addressing the transfer to storage of the spent fuel thatis not suitable for processing owing to its damaged state.A cooperative venture between Norway, Sweden, andGosatomnadzor (Russia’s State Committee for Supervi-sion of the Safety of Work in Nuclear Power Engineer-ing) is tasked with identifying means of dealing with thewastes stored on the Lepse.
The results of Phase 1 of the Lepse Regulatory Pro-ject were published in April 2001 (Sneve et al., 2001).The main results were a set of three regulatory guidancedocuments and increased mutual understanding of thedifferences in the regulatory systems and processes for li-censing nuclear activities in the Russian Federation com-pared to other western countries, notably Sweden, Nor-way, and the United Kingdom. The guidance documentsprovide specifications for:
• documentation to substantiate nuclear and radiationsafety assurance measures for submission by operatorswhen applying for a license from Gosatomnadzor toimplement the Lepse Project, as described by theNRPA (2001);
• the quality assurance program for unloading spent fuelassemblies from the Lepse; and
• the safety analysis report required to support a licenseapplication for unloading spent fuel assemblies fromthe Lepse.
This regulatory guidance is intended to help focus onsafe implementation. In addition, considerable emphasisis being given to EIAs and their role in determining thesuitability of specific mechanisms for unloading spentfuel from the Lepse. Phase 2 of the Lepse RegulatoryProject will comprise the review of license applicationdocuments submitted to the appropriate Russian au-thorities, primarily the Gosatomnadzor.
6.7.9. Environmental impact assessments of other hazardous Russian facilities
A working group under the Joint Norwegian–RussianExpert Group for the Investigation of Radioactive Con-tamination of Northern Areas compared EIA systemsin Russia with those in Norway and other western coun-tries (JNREG, 2001) and concluded that the principlesand methods used in Norway and Russia are broadlysimilar. They are based on the common principles ofprevention, openness, and obligation to conduct EIAsfor all projects likely to significantly influence the en-vironment. Concerns have been expressed howeverabout the degree to which transboundary impacts areconsidered under Russian procedures and the lack of at-tention to the effects of ionizing radiation on fauna andflora.
The working group also noted that, in the planningphase of projects having potential radiation hazards,close contact between the developer and the governmentbodies responsible for health protection, environmentalprotection, and nuclear safety is essential. It is importantthat those undertaking EIAs are well informed about theinformation required and the system for approving plan-ning activities. This ensures the overall aims of EIAs aremet; namely selection of the optimum location, appro-priate technology, and methods for the protection ofhuman health and the environment.
6.8. Alarm, notification, and radiation measurement systems in northwest Russia
Radiation monitoring in the Arctic is of great impor-tance because Russia is the largest country in the re-gion and operates many relevant sources and practices.A major area of work for AMAP involves risk and im-pact assessment, including monitoring systems. Much ofthis occurs within the context of a general Barentsregion environmental and human health monitoringsystem. There are also plans for a risk and impact as-sessment for workers and members of the public thatmay be affected by military and civilian sources; devel-opment of a monitoring system for environmental re-leases of radioactivity from such sources; provision of anemergency and monitoring system in the ArchangelskOblast; and construction of a regional laboratory forsurveillance and early warning systems. The first AMAPassessment provided useful input to these developments.
In 1992, the Finnish Radiation and Nuclear SafetyAuthority (STUK), in cooperation with Gosatomnadzor,installed push button alarm panels and satellite commu-nication systems in the site offices of Gosatomnadzor atthe Leningrad and Kola NPPs and at the Atomflot Re-pair Technical Plant near Murmansk. These facilitate theprompt transmission by Gosatomnadzor local safety in-spectors of a selected pre-programmed emergency or in-cident telex message. These can be transmitted to the 24-hour emergency response systems of STUK, otherNordic countries, and the Emergency Response Centerin Moscow operated by the Federal Nuclear and Radia-tion Safety Authority of Russia. The notification systemis independent of local ground communications and hasbattery back-up to ensure continuous operation. It isalso tested automatically each week and manually eachmonth to all Nordic receivers and to Moscow. There hasbeen no actual emergency use of this system since its in-stallation.
In 1994, eight environmental monitoring stations ofFinnish origin were installed on the Kola Peninsula.These operate under local supervision and without auto-matic connections to the central system at Roshydrometin Murmansk for their data acquisition and alarm sys-tems. Data collection is manual and the data are trans-mitted by telephone and telex. Reliable automatic oper-ation of these stations would be difficult as the localtelecommunications environment is prone to interfer-ence and other disturbances. In 1998, STUK and theNRPA signed a joint agreement on the development ofthe Roshydromet environmental radiation measuringsystem. Radiation monitoring stations would be up-
AMAP Assessment 2002: Radioactivity in the Arctic76
graded and the telecommunication connections en-hanced. Progress on this project is conditional upon theconclusion and implementation of a general agreementon this work between Norway and Russia.
In 2000, the nuclear and radiation safety authoritiesin the Nordic countries signed a framework agreementconcerning joint Nordic financing for upgrading alarmand notification systems.
6.9. Security (including physical security)Safety and security of radiation sources has acquired anew significance since the terrorist attacks in the UnitedStates on 11 September 2001. Special security measuresto protect against terrorism should be part of safety as-sessments (Lubenau and Strom, 2002). There are a num-ber of orphaned sources (i.e., sources that are no longerunder regular institutional control) in the Russian Feder-ation that should be located and brought back under in-stitutional control. The European Commission and theUnited States are funding programs to do this.
A ‘safeguard’ is generally understood to be a methodfor controlling fissile/fissionable material. Six of the eightArctic countries have signed IAEA safeguard agreementsto contribute to non-proliferation obligations. Safeguardsupport programs have constituted the primary meansof bilateral Finnish assistance to the Ukraine, the BalticStates, and the Russian Federation. Their objectives areto assist in establishing and improving national systemsfor accounting and control of nuclear material. The rele-vant regulatory bodies are assisted in the development ofregulations, guides, and inspection procedures. Traininghas also been extended to border-control authorities inthe detection and control of radioactive and nuclear ma-terials. Training courses were organized for the Russianborder controls using experts from the Finnish Radia-tion and Nuclear Safety Authority (STUK) and from otherinstitutes within the European Union (STUK, 2000).
A bilateral Russian–Norwegian project was startedin 1998 to replace the radioisotopic power sources atfour Russian lighthouses in Varanger Fjord by solarpowered technology. The aim is to reduce the likelihoodof radioactive contamination of the northern marine en-vironment. When the project is complete, all radioiso-topic power sources in the Russian parts of VarangerFjord will have been replaced by solar panels. A Russianinformation video has been made in connection withthis project. The radioisotope thermoelectric generatorswill be stored at Atomflot before transport to the Mi-natom Institute for Technical and Atomic Physics andthen to Mayak for final treatment and storage.
6.10. ConclusionsThe main criterion of success for a nuclear safety projectis its net contribution to the improvement of nuclearsafety (NRPA, 2002). Owing to the difficult economicsituation in Russia, improvement initiatives in the regionare often only possible through international collabora-tion. Lack of funds and/or difficulties in developing bi-lateral/multilateral agreements can delay the start of nu-clear safety initiatives; nevertheless, the Arctic countriesare committed to further improvements. Priorities forrisk reduction are being identified through a process ofrisk analysis. In addition, projects are being supportedonly within the context of demonstrated compliancewith Russian regulatory requirements. That context in-cludes safety assessments and EIAs incorporating a vari-ety of risk analyses to demonstrate compliance with riskobjectives relating to environmental and human healthprotection. Risk assessments and EIAs should also beused to select and/or prioritize risk reduction projects, tooptimize the use of resources. Resources and effort willcontinue to be focused on the areas of greatest risk andon the operations and facilities that pose the greatest po-tential threats.
Chapter 6 · Nuclear Safety Initiatives 77
7.1. IntroductionThis chapter considers the nature and scale of conse-quences arising from potential accidental releases of ra-dioactivity into the Arctic environment from sourcesunder human control. The sources considered to war-rant accident assessment are those described in Chapter2. All scenarios are described in more detail in the rele-vant literature. Relevant accidents and subsequent im-pact assessments are reviewed and, where possible, ex-trapolated to provide perspectives on the consequencesof accidents associated with other sources. The chapterconcludes with recommendations for further impact as-sessments.
Scenario analysis begins with a consideration of thedifferent possibilities for sequences of events and pro-cesses (such as containment failure mechanisms) thatcan lead to radionuclide release. These depend upon thespecific management and engineering features of the fa-cilities under consideration. The release mechanisms andcharacteristics are important determinants of the envi-ronmental and human health impacts. Relevant vari-ables might include: isotopic composition; amounts ofeach isotope released; physical-chemical form of release(gas, solution, aerosol, etc.); time development of the re-lease; release point and plume height; and the energycontent of the release.
The scenarios discussed here were not necessarily de-veloped for the same purposes as the AMAP assessment.They are illustrative of selected aspects of the possibleconsequences of radionuclide release rather than repre-sentative of comprehensive risk or scenario analyses forthe Arctic.
The radionuclide release information provides in-put to a radionuclide transport model that is used topredict the subsequent environmental distribution ofcontamination. For accident scenarios resulting in re-leases to the atmosphere, the assumed (or actual, if as-sessing the consequences of past accidents) meteoro-logical data are very important as they can radicallyaffect the degree of atmospheric dispersion. Similarly,for releases to the aquatic environment, the hydrody-namic characteristics of the receiving environment areequally important. Distribution following releases to theground are strongly dependent upon surface geologyand hydrology. The radiation characteristics of the ra-dionuclides and their environmental mobility are alsoimportant determinants of the magnitude of the conse-quences following release. The receiving environmentsthemselves also influence the scale of the consequences,since some are more susceptible to incorporating ra-dionuclides into human exposure chains than others, asdiscussed in Chapter 4 (NRPA, 1999; Skuterud et al.,1999). Radiation doses to humans and other biota areassessed using assumptions about the ways in whichthey interact with contaminated media. Finally, the im-pact on human and environmental health is assessed
using assumptions relating radiation doses to healthimpacts. Such information is essential for risk manage-ment.
7.1.1. Risk management
Risk management includes the analysis of accident sce-narios and consequences and, where possible, an assess-ment of the probabilities of accidents and their conse-quences. Sources may occur within the Arctic, in whichcase these ‘point sources’ require analysis, and outsidethe Arctic. The potential for accidents occurring outsidethe Arctic to contaminate the Arctic environment de-pends on the dispersal characteristics.
Generally, the larger the inventory of radionuclides,the greater the hazard. In most cases, the inventory inBecquerels (Bq) is well established owing to the applica-tion of well-proven technology and associated regulatoryrequirements. However, in some cases, the informationmay be less complete, as for example, in the case of oldwaste storage facilities for which information is limited.
The risks associated with hazardous sources mayalso be modified by measures to control the source term.That is, consideration of the risks must address both thescale of the consequences and the likelihood of their oc-currence. Thus, while a very large source term may pres-ent the greatest hazard (potential for harm), measures toreduce the chances of release may reduce the risks to atolerable level (HSE, 1988). Nuclear safety initiatives toreduce the likelihood of accidents are discussed in Chap-ter 6. Other ways of reducing risk include measures toreduce the consequences of potential accidents. Riskmanagement must account for both. A simple example isthe case of spent nuclear fuel, which is a significant ra-dioactive source term. Left on the surface with limitedcontainment, the chance of releases into the environ-ment, before radioactive decay has reduced the hazardsignificantly, whether as a result of waste container de-gradation or by human sabotage, is relatively high. Deepdisposal is considered to reduce the risks by reducing thelikelihood of gross and acute environmental releases.See, for example, discussions concerning high level wastedisposal in Japan (JNC, 2000).
Another aspect of risk management is the introduc-tion of measures to mitigate the impact of accidental re-lease. International guidance concerning countermea-sures is provided by the International Commission onRadiological Protection (ICRP, 1992). Examples includeevacuation, advice to remain indoors, and the distribu-tion of iodine tablets. Interventions should be basedupon evaluations of their benefit, expressed as averteddoses, and disbenefits, especially those of an economicor social nature. Assessments of the consequences of ac-cidents should take account of the planned emergencyresponse in the early and latter phases of the accident; inthe long-term the effects of clean-up measures may beimportant, see Brown et al. (2000).
78
Chapter 7
Potential Accident Scenarios –––––––––––––––––––––––––––––––––––––––––––––––––––––––––––––––––––––––––––––––––––––––––
7.1.2. First AMAP assessment
The first AMAP assessment concluded that of greatestconcern were the possible accidents associated with: nu-clear power plant (NPP) operation; nuclear weaponshandling and storage; decommissioning of nuclear sub-marines; and the management of spent fuel from nu-clear-powered vessels.
Consideration is given to the consequences of each ofthese types of accident. Also, to additional or modifiedpotential accident sources, particularly reactors in sunkensubmarines such as the Kursk (Amundsen et al., 2002a)and the management of damaged spent fuel, as stored onthe Lepse (NRPA, 2001).
7.2. Land-based nuclear power plantsOperational land-based NPPs in the Arctic include theKola and Bilibino NPPs. The Kola plant comprises fourVVER-440 pressurized water reactors each with a de-sign output of 1375 MW(th) and 411 MW(e). The Bili-bino NPP is located in the Chukotka region in easternRussia and comprises four light-water cooled, graphite-moderated reactors each of output 62 MW(th) and 12MW(e).
Owing to design differences, a direct comparison ofthe risks posed by the Kola and Bilibino NPPs is notstraightforward. Risk assessments need to include a con-sideration of the engineered features and management atthe respective plants, but for assessing significant re-leases, there are obvious differences owing to the reac-tors at the Kola NPP being more than 20 times larger.
The power plants on the Kola Peninsula clearly rep-resent the major potential reactor accident source withinthe Arctic.
7.2.1. Accident scenarios and consequences for the Kola NPP
The Kola NPP is located in Murmansk Oblast in north-west Russia and severe accidents at the site have the po-tential to substantially contaminate both northwest Rus-sia and northern Fennoscandia. Studies by Stokke (1997),including a review of the Kola reactor safety systems,have provided detailed information on the Kola plantand its reactor inventories.
7.2.1.1. Initiating events
Initiating events that may lead to core melt sequences inpressurized water reactors are generally grouped intothree classes: loss of coolant accidents (LOCAs), tran-sients, and common cause initiators (CCIs).
LOCAs may be initiated by large leaks or breaks inthe primary circuit, which in turn may be caused by me-chanical failure (such as pipe breaks, fire, and corrosion)resulting from poor maintenance. The loss of coolingmay take place early in the sequence or at a later stage.Early loss of cooling is potentially the most dangerous asit gives little time to re-establish cooling and because sig-nificant decay of short-lived radioisotopes will not haveoccurred.
Transients can be failures in power supply, reactiv-ity transients (sudden increases in reactivity), failures
79
in control systems (e.g., control rod ejection), and lossof flow.
CCIs (e.g., power transients and earthquakes) lead tomultiple failures and may affect several components inthe system.
According to Stokke (1997), loss of coolant in pres-surized water reactors does not immediately signify alarge radioactive release. The vessel should be able tocontain an overheated core for a period that may be suf-ficient to allow restoration of adequate core cooling. Ifthere is extensive core damage, it is unavoidable that ra-dioactivity leaks occur. A core melt by itself, however,does not create an explosive situation unless reactorcontainment fails. A source term for the Kola NPP hav-ing a very high radioactive plume rise and thus exposureof core and fuel to the open air has therefore a low prob-ability. Nevertheless, releases of noble gases and volatileradioactive compounds should be expected in a severecore damage accident.
There are differences between the two older and thetwo newer plants. For the older Model 230 reactors, theeffectiveness of the confinement structure in containingthe radioactive steam–gas mixture after a LOCA is un-certain. The airtightness of the confining structure is notassured and there may be considerable leakage evenwithout open valves or other penetrations. Breaks in thelargest coolant pipes may generate a steam pressure thatcould crack or rupture the confinement structure andcreate an open passage from the core to the environ-ment, although the reactor vessel would still be intact(Stokke, 1997).
7.2.1.2. Probabilities
The probability that a severe accident may occur is de-pendent on many factors such as design features, con-struction quality, and human performance. The proba-bility that an event may lead to an unintentional coremelt can be assessed on the basis of engineering judg-ment or by performing a Probabilistic Safety Assessmentwhere, in principle, all realistic chains of events leadingto core melt are analyzed and their probabilities of oc-currence calculated. The sum of all probabilities for allpossible initiating events to cause a core melt is the CoreMelt Frequency (CMF), given as the probability per re-actor operating year. The CMF does not include theprobability of human failure, sabotage, or terrorist at-tack (Stokke, 1997). For modern NPPs, the CMF is con-sidered to be within the range 10–4 to 10–5. At present,there is no CMF for the Kola NPP for use in accidentconsequence analysis. However, the InternationalAtomic Energy Agency (IAEA) has reported a prelimi-nary estimate of 5.5�10–3 per year for the oldest Kolareactors (Stokke, 1997).
7.2.1.3. Accident source terms
Accident source terms depend on the initiating events,which may result in different accident scenarios. Ex-amples of scenario development are provided by Stokke(1997). Worst case scenarios concern situations in whichthe reactor core contains the maximum number of prod-ucts and maximum activity concentrations of radio-nuclides at the end of the normal fuel burn-up cycle.
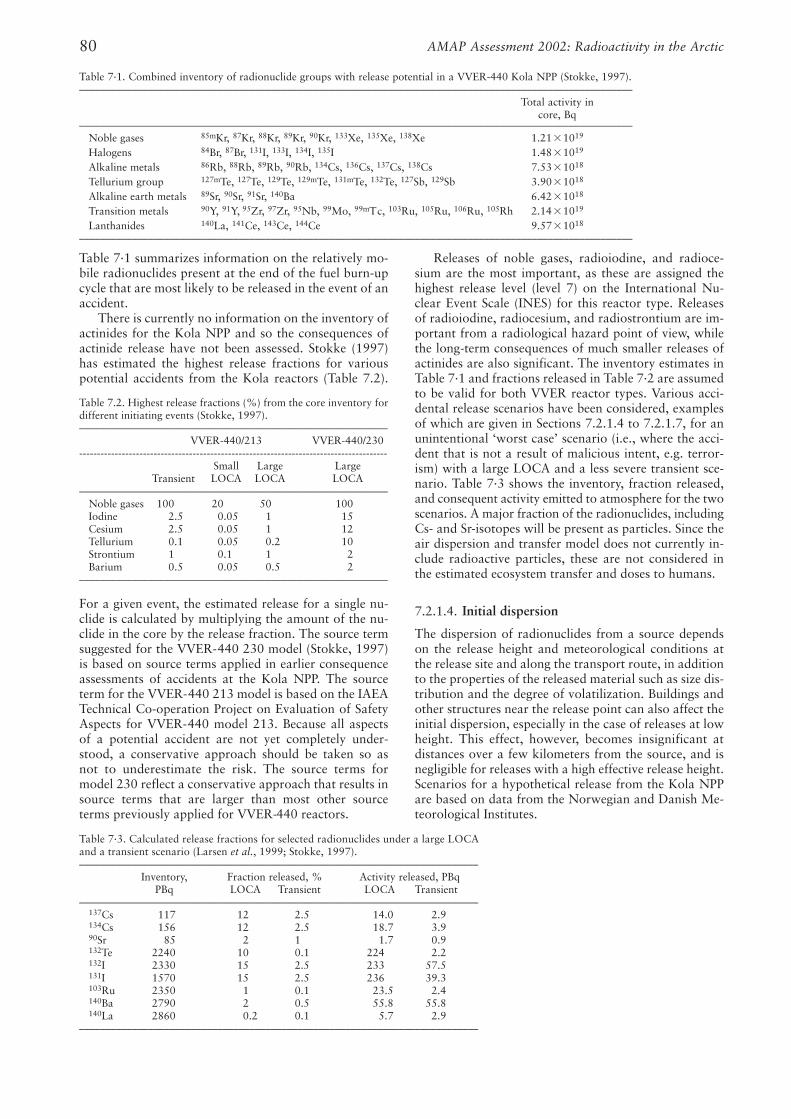
Table 7·1 summarizes information on the relatively mo-bile radionuclides present at the end of the fuel burn-upcycle that are most likely to be released in the event of anaccident.
There is currently no information on the inventory ofactinides for the Kola NPP and so the consequences ofactinide release have not been assessed. Stokke (1997)has estimated the highest release fractions for variouspotential accidents from the Kola reactors (Table 7.2).
For a given event, the estimated release for a single nu-clide is calculated by multiplying the amount of the nu-clide in the core by the release fraction. The source termsuggested for the VVER-440 230 model (Stokke, 1997)is based on source terms applied in earlier consequenceassessments of accidents at the Kola NPP. The sourceterm for the VVER-440 213 model is based on the IAEATechnical Co-operation Project on Evaluation of SafetyAspects for VVER-440 model 213. Because all aspectsof a potential accident are not yet completely under-stood, a conservative approach should be taken so asnot to underestimate the risk. The source terms formodel 230 reflect a conservative approach that results insource terms that are larger than most other sourceterms previously applied for VVER-440 reactors.
Releases of noble gases, radioiodine, and radioce-sium are the most important, as these are assigned thehighest release level (level 7) on the International Nu-clear Event Scale (INES) for this reactor type. Releasesof radioiodine, radiocesium, and radiostrontium are im-portant from a radiological hazard point of view, whilethe long-term consequences of much smaller releases ofactinides are also significant. The inventory estimates inTable 7·1 and fractions released in Table 7·2 are assumedto be valid for both VVER reactor types. Various acci-dental release scenarios have been considered, examplesof which are given in Sections 7.2.1.4 to 7.2.1.7, for anunintentional ‘worst case’ scenario (i.e., where the acci-dent that is not a result of malicious intent, e.g. terror-ism) with a large LOCA and a less severe transient sce-nario. Table 7·3 shows the inventory, fraction released,and consequent activity emitted to atmosphere for the twoscenarios. A major fraction of the radionuclides, includingCs- and Sr-isotopes will be present as particles. Since theair dispersion and transfer model does not currently in-clude radioactive particles, these are not considered inthe estimated ecosystem transfer and doses to humans.
7.2.1.4. Initial dispersion
The dispersion of radionuclides from a source dependson the release height and meteorological conditions atthe release site and along the transport route, in additionto the properties of the released material such as size dis-tribution and the degree of volatilization. Buildings andother structures near the release point can also affect theinitial dispersion, especially in the case of releases at lowheight. This effect, however, becomes insignificant atdistances over a few kilometers from the source, and isnegligible for releases with a high effective release height.Scenarios for a hypothetical release from the Kola NPPare based on data from the Norwegian and Danish Me-teorological Institutes.
AMAP Assessment 2002: Radioactivity in the Arctic80
Table 7·1. Combined inventory of radionuclide groups with release potential in a VVER-440 Kola NPP (Stokke, 1997).––––––––––––––––––––––––––––––––––––––––––––––––––––––––––––––––––––––––––––––––––––––––––––––––––––––––
Total activity incore, Bq
––––––––––––––––––––––––––––––––––––––––––––––––––––––––––––––––––––––––––––––––––––––––––––––––––––––––Noble gases 85mKr, 87Kr, 88Kr, 89Kr, 90Kr, 133Xe, 135Xe, 138Xe 1.21�1019
Halogens 84Br, 87Br, 131I, 133I, 134I, 135I 1.48�1019
Alkaline metals 86Rb, 88Rb, 89Rb, 90Rb, 134Cs, 136Cs, 137Cs, 138Cs 7.53�1018
Tellurium group 127mTe, 127Te, 129Te, 129mTe, 131mTe, 132Te, 127Sb, 129Sb 3.90�1018
Alkaline earth metals 89Sr, 90Sr, 91Sr, 140Ba 6.42�1018
Transition metals 90Y, 91Y, 95Zr, 97Zr, 95Nb, 99Mo, 99mTc, 103Ru, 105Ru, 106Ru, 105Rh 2.14�1019
Lanthanides 140La, 141Ce, 143Ce, 144Ce 9.57�1018
––––––––––––––––––––––––––––––––––––––––––––––––––––––––––––––––––––––––––––––––––––––––––––––––––––––––
Table 7.2. Highest release fractions (%) from the core inventory fordifferent initiating events (Stokke, 1997).––––––––––––––––––––––––––––––––––––––––––––––––––––––––––
VVER-440/213 VVER-440/230---------------------------------------------------------------------------------------
Small Large LargeTransient LOCA LOCA LOCA
––––––––––––––––––––––––––––––––––––––––––––––––––––––––––Noble gases 100 20 50 100Iodine 2.5 0.05 1 15Cesium 2.5 0.05 1 12Tellurium 0.1 0.05 0.2 10Strontium 1 0.1 1 2Barium 0.5 0.05 0.5 2
––––––––––––––––––––––––––––––––––––––––––––––––––––––––––
Table 7·3. Calculated release fractions for selected radionuclides under a large LOCA and a transient scenario (Larsen et al., 1999; Stokke, 1997).–––––––––––––––––––––––––––––––––––––––––––––––––––––––––––––––––––––––––––
Inventory, Fraction released, % Activity released, PBqPBq LOCA Transient LOCA Transient
––––––––––––––––––––––––––––––––––––––––––––––––––––––––––––––––––––––––––– 137Cs 117 12 2.5 14.0 2.9134Cs 156 12 2.5 18.7 3.990Sr 85 2 1 1.7 0.9132Te 2240 10 0.1 224 2.2132I 2330 15 2.5 233 57.5131I 1570 15 2.5 236 39.3103Ru 2350 1 0.1 23.5 2.4140Ba 2790 2 0.5 55.8 55.8140La 2860 0.2 0.1 5.7 2.9
–––––––––––––––––––––––––––––––––––––––––––––––––––––––––––––––––––––––––––
The information was supplemented by a study of themeteorology and transport of radioactive contaminationfrom the Kola NPP (Bartnicki and Saltbones, 1997; Salt-bones et al., 1997). The Norwegian Meteorological In-stitute defined the meteorology in the area, calculatedthe transport times, and investigated the likelihood ofnuclear contamination at specific locations. Three sce-narios were selected as initial conditions for the disper-sion model (Saltbones et al., 1995). The scenarios usedthree sets of weather situations that would provide par-ticularly unfavorable consequences for Norway. Two ofthe three situations were relevant to Arctic Norway.
Scenario A, with a rapid transit time to northernNorway, where one-eighth of the released material wasdeposited within 72 hr.
Scenario B, with precipitation during the passage ofthe plume over northern Norway, with wet depositionsuch that nine-tenths of the release was deposited overNorwegian territory.
7.2.1.5. Consequences
There have been recent assessments of both the short-term and long-term doses from hypothetical accidents atthe Kola NPP. The analysis of short-term doses was con-fined to Norway and to external and inhalation doses.The short-term analysis did not include ingestion dosesbased on the assumption that the accident occurred out-side the short growing period, when dairy animalswould be housed; a situation which prevails for most ofthe year in the Arctic. The long-term doses were esti-mated for northern Norway and for various regions ofnorthwest Russia and considered external and ingestiondoses arising from the mobile, long-lived radionuclides,radiocesium and radiostrontium only. For both assess-ments, the unintentional worst-case accident was se-lected for an assessment of radiation levels and doses.
7.2.1.6. Short-term assessment
The assessment included more than 50 radionuclides.The dispersion model results were based on the releaseof particles with a given mathematical mass and musttherefore be combined with information about the ra-dioactive emission in order to calculate the atmosphericand ground levels of the various radionuclides. Activityconcentrations and ground deposited activity were usedas a starting point for calculating doses from the variousexposure pathways associated with inhalation and ex-ternal irradiation from radionuclide deposits on theground and in the air.
Although foodstuffs are the major contributor to thetotal long-term dose, the focus of the short-term conse-quence assessment was on external exposure and inhala-tion. There is a very short growing season in the Arcticand the implicit assumption is that the accident occurredoutside this period.
For an adult, the effective dose was calculated atabout 1 mSv for Scenarios A and B. In both cases, thecontribution from radionuclides deposited on theground predominates, especially where precipitation ishigh and wet deposition considerable.
Throughout the first year, external irradiation fromthe ground is the most important exposure pathway: cal-
Chapter 7 · Potential Accident Scenarios 81
culated effective doses are 3.5 mSv and 5.1 mSv for Sce-narios A and B, respectively, with 134Cs and 137Cs themost important contributors (60 to 70%). High activityof deposited radiocesium is the main reason for the higherannual dose in Scenario B, the precipitation scenario.
External irradiation from airborne radionuclides is arelatively insignificant exposure pathway a week ormore after the hypothetical accident. However, duringcloud passage, airborne radionuclides, such as noblegases with very short half-lives (e.g., 133Xe), could be ofsome significance for the dose rate.
Owing to large quantities of short-lived radionu-clides emitted during the hypothetical accident, a consid-erable fraction of the external dose will occur during thefirst few days after contamination. In Scenario A, wherethe atmospheric transport of radioactivity occurs rap-idly, about 20% of the effective external dose will resultfrom irradiation during the first week after deposition.In Scenario B, where the transport is considerablyslower, the corresponding value was estimated at about10%. Furthermore, if radionuclide migration throughsoil profiles, and the subsequent radioactive shielding byoverlying soil, is considered, then the external dose re-ceived from the first few days may be of even greater rel-ative importance than that estimated.
Of the 50 radionuclides considered, only a few aresignificant contributors to the total external dose. Overa short time-scale (days or weeks) the dominant nuclidesare 132Te/132I, 131I, 103Ru, and 140Ba/140La. After thesedecay the external dose is dominated by 134Cs and 137Cs.
The effective dose from inhaled radionuclides is pre-dicted to be <1 mSv for both scenarios and is generallyhighest for young individuals. The dominant nuclide is131I, which contributes 50 to 70% to the total inhaleddose, depending on the scenario and age group. Equiva-lent doses to the thyroid gland were calculated at 4.6 to10.6 mSv (Scenario A) and 1.6 to 3.6 mSv (Scenario B).
The doses calculated for the two scenarios are as-sumed to represent the worst possible consequences of asevere nuclear accident at the Kola NPP. Nevertheless,the received doses are much too low to result in anyacute radiation injuries.
International guidance concerning countermeasures(e.g., ICRP, 1992), such as evacuation, staying indoors,or the distribution of iodine tablets is based on evalua-tions of the benefits and disadvantages of implementa-tion, expressed as saved (averted) doses. This assessmentindicates that the saving potential is too low to justifythe direct implementation of countermeasures; however,this must be investigated further. The uncertainties in thecalculations are large, and an evaluation of the pros andcons for an actual situation can result in the use of dif-ferent countermeasures, e.g., for special groups.
7.2.1.7. Long-term assessment
The first AMAP assessment concluded that the vulnera-bility of the Arctic (defined as the relationship betweendose and atmospheric deposition of nuclides) is higherthan in most other areas of the world, particularly for137Cs. This reflects the transfer of radionuclides de-posited from the atmosphere through terrestrial foodchains to human radiation exposure. The long-term as-sessment estimated the long-term impact of radioactive
contamination from a hypothetical LOCA at the KolaNPP on the two northernmost counties of Norway(Troms and Finnmark), and on the Murmansk Oblast inRussia. The weather pattern for the Russian scenariowas based on predicted ground deposition provided bythe Danish Meteorological Institute, with most deposi-tion occurring on the Kola Peninsula.
The study considered radionuclide deposition, trans-fer to and contamination of locally produced foodstuffs,and external and ingestion doses for reindeer herdersand other inhabitants. A spatial model was developedwithin a geographical information system to predict thelong-term consequences of radionuclide deposition onnorthern Norway and northwest Russia. As no site spe-cific data were available, general transfer factors wereused in the model (JNREG, 2002a,b,c).
External dosesThe highest individual external �-doses occur in thoseareas receiving most accident deposition, but are negligi-ble compared to ingestion doses. Individual external �-doses for reindeer herders are twice those of the other in-habitants owing to the tendency of the latter to occupyareas with higher shielding (i.e., buildings).
Internal dosesRadionuclide transfer to foodstuffs was modelled usingaggregated transfer coefficients (Tag ; Box 3·2) and effec-tive ecological half-lives (Teff ; Box 3·1). Long-term pre-dictions were made for the spatial variation in activityconcentrations in foodstuffs, individual external and in-gestion doses for reindeer herders and other inhabitants,and radionuclide fluxes (total Bq output from contami-nated land areas over specified time periods).
Data were collated for each study area to derive area-specific Tag and Teff values for radiocesium and 90Sr(JNREG, 2002a). The biggest difference was the 3-foldhigher Tag value for 137Cs transfer to reindeer meat forthe Murmansk Oblast compared to Norway, and thelonger associated half-life. Together, these were responsi-ble for the greater intakes predicted for radiocesium inreindeer meat per unit deposition, and the greater per-sistence in reindeer meat and thus Russian reindeerherders. In addition, the Tag value for 137Cs transfer topotato and to a lesser extent berries, was lower for Nor-way than Russia. Teff values for freshwater fish werelower for Norway than Russia. The Teff value used for90Sr in milk was much greater for Russia than that as-sumed for Norway. For 90Sr, Tag values for Russian dairyproducts and potatoes were lower than for Norway,while those for most other products were higher.
The most obvious difference between the diets of theNorwegian and Russian inhabitants is in the consump-tion of dairy products; these are important in Norwaybut much less so in the Murmansk Oblast. Reindeermeat consumption is highest in the male reindeer herd-ers in Lovozero in Russia. Sheep and goat meat is onlyconsumed in Norway. Potato and freshwater fish con-sumption is also greater in Russia.
Under the scenarios considered, high activity concen-trations persist in foodstuffs owing to the high Teff val-ues. Activity concentrations for 90Sr in foodstuffs aremuch lower than for radiocesium. In the first year afteraccident deposition, the highest radiocesium activity
concentrations were predicted to occur in reindeer meat,sheep meat, mushrooms, and berries, and the highest90Sr activity concentrations in berries and potatoes.After fifty years, the highest activity concentrations pre-dicted for foodstuffs were for 137Cs in mushrooms, rein-deer meat, and berries.
As for foodstuffs, predicted annual individual inges-tion doses for reindeer herders and other inhabitantsvary spatially according to differences in deposition andland cover. Annual ingestion doses for all populationgroups in the first year after deposition were predictedto exceed 1 mSv. Annual individual radiocesium inges-tion doses for reindeer herders are significantly greaterthan for other inhabitants. In the first year after deposi-tion, the most significant contributor to annual individ-ual radiocesium ingestion dose is reindeer meat for allpopulation groups, with the exception of other Norwe-gian inhabitants for whom dairy products and muttonare important contributors. Potatoes and dairy productsare the largest contributors to the much lower annual in-dividual 90Sr ingestion doses for all population groups.Berries are another important 90Sr contributor to thetwo Russian population groups, while reindeer meat isalso a source of 90Sr for Russian reindeer herders.
Under all accident scenarios, reindeer herder annualingestion doses are predicted to exceed 1 mSv for manydecades after accident deposition (and are much higherin the first few years); for the other population group,ingestion doses exceed 1 mSv for a few years after acci-dent deposition in northern Norway and for a decade inMurmansk Oblast. Fifty years after accident deposition,individual 137Cs ingestion doses for reindeer herders areover two orders of magnitude lower than during the firstyear; those for the other population group are more than30 times lower. The largest contributors to annual indi-vidual 137Cs ingestion doses for Norwegian reindeerherders fifty years after accident deposition are reindeermeat, freshwater fish, and dairy products, with dairyproducts, freshwater fish, mushrooms, and reindeermeat the most important contributors to the other Nor-wegian population group. Reindeer meat and mush-rooms are the largest contributors to annual individual137Cs ingestion doses to the Russian population groups50 years after accident deposition.
Sr-90 is a much less important contributor to inges-tion dose and the predicted consequences of the accidentscenarios are much less certain owing to the paucity ofrelevant data for the Arctic, in particular for milk. Forreindeer herders, freshwater fish, potatoes, berries, andreindeer meat, provide the largest contribution to annualindividual 90Sr doses, while potatoes, freshwater fish,and berries, are the most significant contributors for theother inhabitants.
The most significant contributor to total doses for allpopulation groups is radiocesium ingestion. Vulnerabil-ity to 90Sr contamination is much lower than to radioce-sium for both reindeer herders and other inhabitants.
There are substantial differences in agricultural pro-duction within the various areas of northern Norway.Production of almost all agricultural products in Tromsis 2- to 5-fold higher than in Finnmark, whereas reindeerproduction is 20-fold higher in Finnmark where most ofreindeer herders live. Detailed production data were notavailable for Murmansk Oblast. Annual radionuclide
AMAP Assessment 2002: Radioactivity in the Arctic82
fluxes have been predicted for all locally grown food-stuffs (production of mushrooms, berries, and freshwa-ter fish was estimated by multiplying diet and popula-tion). In the first year after deposition, the highest ra-dionuclide fluxes are predicted to coincide with theareas receiving the highest accident deposition. Thelargest contributors to radiocesium fluxes are reindeermeat and dairy products, while dairy products and pota-toes are the largest contributors to annual 90Sr fluxes.The contribution of different foodstuffs to radionuclidefluxes changes with time. Fifty years after accident dep-osition, the highest radionuclide fluxes do not necessar-ily occur in those areas receiving the greatest accidentdeposition. High radionuclide fluxes can occur in areaswith high food production. In general, reindeer meatand dairy products remain the significant contributorsto 137Cs fluxes in the fiftieth year, while berries, pota-toes, and freshwater fish are the largest contributors tothe lower annual 90Sr fluxes.
This study confirms the outcome of the first AMAPassessment, i.e., that Arctic residents are particularly vul-nerable to radiocesium contamination and that the vul-nerability would persist for many years after deposition.Reindeer herders are particularly vulnerable due to theirhigher levels of reindeer meat consumption. Neverthe-less, other inhabitants of northern Norway and Russiawould also be potentially exposed to high doses, espe-cially if consuming many local products. While reindeerproduction is the most vulnerable pathway, freshwaterfish, lamb meat, dairy products, mushrooms, and berriesare also vulnerable foodstuffs. Although game was notincluded in this study, post-Chernobyl studies show highand persistent contamination of some game animals.
The location of communities and their types of agri-cultural production are important variables determiningvulnerability; if high deposition occurred in the majorreindeer production areas (Finnmark in Norway andLovozero in the Murmansk Oblast) the impact would bemuch higher than if deposition occurred in areas whereother types of agriculture predominated. Conversely, be-cause dairy cattle are inside for much of the year, vulner-ability increases if an accident occurs during the shortsummer grazing period, especially for 90Sr.
Major factors contributing to the uncertainties in theestimates of doses and fluxes are the limited number ofnuclides being considered, as well as the use of generalrather than site specific transfer factors. Also, the scenar-ios address releases of gaseous and aerosol componentsbut potential releases of radioactive particles are not takeninto account. The effects of countermeasures were notevaluated in this assessment. Doses and fluxes were pre-dicted assuming no mitigating actions having been taken.However, the results clearly indicate the need for an ef-fective emergency response, including the application ofcountermeasures, should an accident of the scale consid-ered in this assessment ever occur at the Kola NPP.
7.2.2. Barents region environmental center study of atmospheric transport pathways from the Kola NPP
An assessment of atmospheric transport pathways fromthe Kola NPP was undertaken for four geographical re-gions: Scandinavia, Europe, the central former Soviet
Chapter 7 · Potential Accident Scenarios 83
Union (CFSU), and the Taymir Peninsula. Several ap-proaches were used to determine the probability that airwould be transported from the Kola NPP to each ofthese regions, transport times, and seasonal variations inatmospheric transport.
The assessment indicated that Scandinavia would beaffected by a release for 44.5% of days between 1991and 1995, Europe for 8.1%, the CFSU for 43.2%, andthe Taymir Peninsula for 55.5%. The airflow probabil-ity field had a similar pattern to that for the one avail-able assessment of the consequences of hypothetical ac-cidents at the Kola NPP, where the released materialswere distributed in an almost circular pattern extendingslightly in a northeasterly direction (Baklanov et al., 2002).Seasonal variations influenced the transport pattern.
Two cases of rapid transport from the Kola NPP toScandinavia were selected for more detailed study. Inboth scenarios, 60 PBq of 137Cs were released over a pe-riod of 20 hr in a plume rising 400 to 600 m. The areascontaminated by 137Cs to a level exceeding 30 kBq were190 000 and 250 000 km2.
Mean individual doses, collective doses, and collec-tive risks were calculated for one of the two scenarios,based on assumptions of the relative importance of vari-ous nuclides and exposure pathways to the total dose re-sulting from the effects of the Chernobyl accident onScandinavia. The highest mean individual doses, 1.15mSv, occurred in northern Norway. The collective dosefor the area affected was calculated as 1100 manSv, cor-responding to a collective risk of 54 cases of additionalcancer.
7.3. Nuclear-powered vesselsThe reactors of nuclear-powered vessels located aroundthe Kola Peninsula represent the greatest density of nu-clear reactors in the world. Several types of release havebeen registered from these vessels, particularly fromthose operating at sea. However, releases have also oc-curred at bases on shore, for example in Andreyeva Bayand Gremikha Bay. Limited effort has been made re-garding impact assessments for accident scenarios re-lated to operating vessels, decommissioned vessels, orvessel components after dismantling, owing to the tradi-tional secrecy surrounding these vessels, their reactors,and the composition of their fuel. There is a need tostandardize the existing studies comparing Russian andwestern efforts and to complete the assessments. Never-theless, some significant contributions have already beenmade, such as the IAEA assessment of the risks fromthe dumped reactors close to Novaya Zemlya (IAEA,1998a). Other more recent efforts include the pilot studyby the NATO Committee on the Challenges of the Mod-ern Society concerning an environmental risk assessmentfor decommissioned Russian nuclear submarines stillcontaining fuel, and an evaluation of the potential im-pact of large releases from the Kursk at the time of sink-ing and during subsequent recovery operations (Bak-lanov et al., 2003).
The operation, maintenance, decommissioning, anddismantling of a nuclear vessel fleet is a complex processinvolving a large number of smaller operations. The ac-tivities include: different modes of operation (training,patrolling, tracking, etc.); assignments in port, changes
of crew; docking for maintenance and repair; refuellingand defuelling; storage onboard of fuelled reactors; on-and off-loading of fresh and spent fuel from vessels andtransport ships; mode of fuel transport; and storage ofdamaged reactors /damaged fuel.
To date, some of these operations have been coveredby risk assessments. Hopefully, the most serious scen-arios involving potential releases have been covered;however, as this work and international efforts to assistRussia in these tasks are reaching new levels of advance-ment and maturity, new facts and scenarios are beingidentified. The most recent and relevant efforts towardcomprehensive impact assessments are presented in therest of this section. These have been subdivided into ves-sels in operation (Sections 7.3.1. and 7.3.2.), decommis-sioned vessels still containing spent fuel on board (Sec-tion 7.3.3.), and accident scenarios involving spent fueland radioactive waste after dismantling of the vessel(Section 7.3.4.). The focus is on the presence of spentfuel because 90 to 99% of the radioactivity resideswithin the fuel. However, the reactor compartments, andthe solid and liquid high-level, medium-level, and low-level radioactive waste also constitute formidable prob-lems, mainly in the remediation of the bases and sites.The latter requires further evaluation as remedial workinvolving international participation is to begin shortly.
7.3.1. Military vessels
There are around 33 operative nuclear submarineswithin the Russian North Fleet. According to Ølgaard(2001), these comprise 12 ballistic missile submarines(Typhoon and Delta Classes), 4 cruise missile sub-marines (Oscar Class), 12 attack submarines (Akula,Sierra, Yankee, and Victor Classes), 1 cruiser (KirovClass), and 4 other submarines (Yankee, Uniform, andX-ray Classes). These regularly patrol the nearby oceansas part of their contribution to the Russian defenseforce. During service, four Russian nuclear submarineshave sunk, 36 accidents have occurred, and there havebeen 378 associated fatalities (Ølgaard, 2001).
The first AMAP assessment made reference to designand beyond-design accident scenarios prepared in rela-tion to Russian nuclear-powered submarine refuelling.No new assessments of this type were available for thepresent assessment and so that in AMAP (1998) remainsthe most appropriate. A submarine incident in a ship re-pair yard in Chazhma Bay on the Russian Pacific coaston 10 August 1985 (Sarkisov, 1999; Sivintsev et al., 1994)involved inadvertent criticality in a reactor core. Thiscan be used to illustrate the potential circumstances andthe nature, scale, and consequences of such accidents.The accident claimed ten lives and gave rise to 39 casesof acute radiation effects. Subsequent on-site observa-tions and radioecological investigations showed that theaccident did not have a measurable radiological impacton Vladivostok or the nearby Shkotovo-22 village.Residual long-lived radioactive contamination in theChazhma Bay region is localized and does not give riseto serious radioecological concern.
Risk estimates of criticality events during refuellinghave been performed by NATO (NATO, 1998). Theprobability of a severe accident in the Russian navy is es-timated to be 2�10–3 per refuelling.
7.3.1.1. Kursk
The latest accident involving a Russian submarine wasthat of the Kursk in August 2000. The sinking, and sub-sequent recovery operation, raised considerable concernabout possible consequences. The accident represented asignificant challenge for the nuclear emergency prepared-ness organization; from the day of the accident until thelarger part of the submarine was brought into dock atRoslyakovo in October 2001.
Owing to considerable concern in Norway, the Nor-wegian Radiation Protection Authority undertook anenvironmental risk assessment for four scenarios; com-bining two inventory calculations and two release sce-narios. The Kursk inventory calculations were based oninformation for the Russian cargo ship Sevmorput withsome adjustment of the technical input data. The hypo-thetical release rate for radionuclides depends stronglyon release conditions. These range from instantaneousrelease owing to the explosion of torpedoes or cruisemissiles within the submarine, to the slow long-termcorrosion of fuel material. The latter may occur whenseawater has penetrated the fuel cladding. If the clad-ding is zirconium, penetration may take several hundredyears. However, if conditions for galvanic corrosion arepresent, the cladding could be fully corroded in less thana year.
Two radionuclide release scenarios were considered.
1. An abnormal event one year after the accident, i.e.,during the salvage operation, in which 100% of theinventory in both reactors is released instantaneously.
2. The assumption that all barriers, for all practical pur-poses, have been removed after 100 years, and that100% of the inventory of both reactors is then re-leased.
Two versions of operational history, resulting in burn-ups of 12 000 (Version 1) and 24 000 (Version 2) MW-days respectively, were considered for each scenario.Both versions were based on the submarine being opera-tional for an average of 50 days per year for each yearsince commissioning at the end of 1994. Version 2 in-cludes extensive operation of the reactors for electricalpower in port, as has been reported to occur by severalsources in recent years. An estimated release of 100% ofthe inventory, a very pessimistic approach, was chosento demonstrate the consequences of a simple scenario,even if not realistic, to the public concerned. There is alack of comprehensive environmental assessments of ac-cidents involving submarines in operation and the asso-ciated release mechanisms and source terms. Earlier stud-ies concentrated on releases from sunken submarines tothe marine environment (Eriksen, 1990; IAEA, 1997) orreleases from decommissioned non-defuelled submarines(NATO, 1998) to sea and air. A consideration of sub-marines in operation, such as the Kursk, might indicatemore severe consequences owing to the greater amountof short-lived radionuclides present.
Estimates of the radiological consequences for themarine environment of potential radionuclide releasesfrom the Kursk were performed for Scenarios 1 and 2,using a box model to estimate radionuclide transportover large distances (>1000 km) and long time-scales
AMAP Assessment 2002: Radioactivity in the Arctic84
(up to centuries or millennia). The model included termsthat describe the dispersion of radionuclides into themarine environment over time (Iosjpe and Strand, 1999;Iosjpe et al., 1997, 2002).
Transport, transfer to fish, and collective doses tohumans were modelled for a range of radionuclidespresent in the reactors. However, most attention was fo-cused on 137Cs because this has a relatively long physicalhalf-life (30 years), readily dissolves in water, and accu-mulates in edible parts of fish and shellfish. For 137Csdispersion in oceanic surface water for the worst casepotential accidental release, with immediate release ofspent fuel and high burn-up (Scenario 1, Version 2), themodel predicted that 0.5 years after a hypothetical acci-dental release of 100% of the inventory, the average ac-tivity concentration in Barents Sea water would be 160to 210 Bq/m3 in the vicinity of the submarine. Activityconcentrations would decrease rapidly and after ten yearsthe average incremental water activity concentration inthe Barents Sea was estimated at 0.1 to 2.8 Bq/m3.
For 137Cs activity concentrations in fish from theBarents Sea region (also for Scenario 1, Version 2) thecalculations indicate that during the first few years ofpotential dispersion, the activity concentrations wouldvary widely depending on the habitat of the fish. Duringthe early stages of dispersion, the Barents Sea wouldcontain areas with relatively high levels of contamina-tion and areas that were completely unaffected. The cal-culated transfer to fish is subject to large uncertaintiesand other transfer pathways, such as particle ingestion,were not considered. The maximum 137Cs activity con-centration in fish was calculated as between 0 and 100Bq/kg during the first year after a hypothetical leak fromthe Kursk. By comparison, the intervention level for137Cs in basic foodstuffs, as recommended by the ECand adopted by several countries, including Norway, is600 Bq/kg.
For Scenario 1, the collective dose to man is domi-nated by the contribution from 137Cs. Calculations showthat a collective dose of 61 manSv would be attributableto the intake of 137Cs from the Barents Sea alone, whilethe total collective dose from all radionuclides from thewhole marine area would be 97 manSv. For the latter,contributions from 137Cs and 239Pu correspond to col-lective doses of 69 and 5.5 manSv, respectively. For com-parison, collective doses from other radionuclides forScenario 1 are estimated at 6.5, 4.3, 2.2, 0.37, and 0.27manSv for 90Sr, 134Cs, 241Am, 147Pm, and 106Ru, respec-tively. For Scenario 2, Version1, the total collective dosewas estimated at 8.4 manSv. Furthermore, approxi-mately 80% of the collective dose from the Barents Seawas attributable to 137Cs exposure. There is no signifi-cant contribution from 239Pu to the collective dose forScenario 1. For Scenario 2, however, the contribution of239Pu is comparable to that of 137Cs. This mainly resultsfrom the comparatively short radioactive half-life for137Cs of 30 years.
No indications of leakage from the Kursk submarinewere observed during the expeditions to the site in Au-gust and October 2000. Elevated levels of radioactivitywere not observed in any dose-rate readings or in anyenvironmental samples from close to or inside the sub-marine, even after the submarine was taken ashore inRoslyakovo.
Chapter 7 · Potential Accident Scenarios 85
7.3.1.2. Komsomolets
The Komsomolets submarine sank in 1989 in the Nor-wegian Sea, south of Bear Island (Bjørnøya). The ra-dioactive inventory at the time of the accident is esti-mated at 2.8�1015 Bq of 90Sr and 3.1�1015 Bq of 137Csin the reactor, and 1.6�1013 Bq of plutonium in thewarheads. Minor releases of radioactivity from the reac-tor compartment have been detected but large-scale re-leases are thought to be unlikely as the containment bar-riers will prevent corrosion of reactor fuel for at least athousand years.
7.3.1.3. Other nuclear submarines
There are 70 decommissioned submarines moored aroundthe Kola Peninsula at the bases from which they oper-ated, some close to international borders. Fifty-two arewaiting to be defuelled and are in various states of re-pair. Some have damaged cores due to accidents, whichhas prevented the removal of the fuel from the reactorcompartment. Decommissioning submarines with dam-aged cores is a major problem requiring large investmentand often significant radiation risk to workers.
In 1993, the International Arctic Seas Assessment Pro-ject (IAEA, 1997) began a study of the radiological andenvironmental hazard posed by the reactor compart-ments dumped in the Barents and Kara Seas in the 1960sand 1970s. Six were dumped with spent nuclear fuel on-board (two being complete submarines) and ten weredumped without fuel. An environmental survey of thedisposal sites found limited evidence of contaminationthat could be attributed to the reactor compartments(Strand et al., 1997). Transport and dispersion modelsusing isotope release rates indicated that the maximumannual dose would be received by local populations, al-though this was <0.1 �Sv/yr. However, military person-nel that patrol Novaya Zemlya were projected to receivea potential annual dose of up to 700 �Sv (comparable tonatural background doses). The global collective doseover the next 1000 years from 14C in the inventory wasestimated at 8 manSv.
NATO has considered accident analysis in some de-tail (NATO, 1998). For an environmental release tooccur, an event with sufficient energy to dislodge the ra-dioactive material from its normal location and a failureof the containment boundary are required. Fuel withinthe reactor compartment is the most probable area forsuch an event to take place due to existing defects, me-chanical damage, or overheating. Events can be internalor external (specific to the mooring location) and themain concern is core overheating or a LOCA. This isused as the reference event and indicates the upper limitfor consequences arising from other events. The activityrelease from a core containing spent fuel is estimated at100 TBq of 90Sr and 600 TBq of 137Cs immediately afterthe event. The NATO report does not attempt to esti-mate the quantity of radioactivity that could be releasedfor each internal event analyzed.
The number of potentially hazardous radionuclideslikely to be dispersed following a criticality accident on adecommissioned but non-defuelled submarine is rela-tively small, taking into account core activity, the releasefraction, and exposure pathways for radiological effects.
Actinides and fission products provide the greatest po-tential hazard. Short-lived radionuclides may dominateimmediately after an accident and their presence is im-portant in the vicinity of the accident site, but they donot cause extensive spatial contamination. The majorityof the dose from an atmospheric release is contributedby 137Cs, 134Cs, and 90Sr, with source terms estimated at350, 35, and 70 TBq, respectively.
A decommissioned, non-defuelled moored subma-rine can sink and release radioactivity to the sea as a re-sult of lapsed maintenance. The consequences are notnecessarily severe since reactors and submarines are de-signed to withstand considerable pressure. There may besome activity release from corrosion of the outer sur-faces of the nuclear reactor. However, if the reactor com-partment was breached, as for example in the event of acollision, corrosion of the fuel could occur rapidly andrelease fission products to the sea. Estimates based onmodels using data from Ara Bay, near Murmansk, sug-gest that the release in the year of the accident would be1.6 PBq, with actinides providing <1 TBq of the releaseand fission products dominating. Over time, the pre-dominant isotopes would change owing to differentialdecay and mobilization.
It is also possible for an undamaged submarine tosink and such a scenario was examined for Ara Bay.Sinking in such shallow water (a few tens of meters) isunlikely to damage a submarine’s primary systems. Re-leases of the four major activation isotopes, 60Co, 59Ni,63Ni, and 14C, were estimated at around 300 MBq oneyear after sinking, decreasing to 180 MBq after 20 years(IAEA, 1997). Except for 14C, these isotopes would ad-sorb onto coastal sediments and ultimately settle to thesea floor or remain on the hull. Models indicate little ac-tivity in the waters of Ara Bay and even less 1.5 km fromthe release site.
Such studies indicate that recovery of sunken sub-marines or reactor compartments is not too difficult ifthe reactor is undamaged but that the effects of a criti-cality accident are difficult to predict, making the conse-quences difficult to estimate. Nevertheless, the risks ofradionuclide release to the Arctic are considered to benegligible.
7.3.2. Civilian icebreakers
The Murmansk Shipping Company operates the Russianicebreaker fleet. According to Ølgaard (2001) the fleetcurrently comprises six operational icebreakers (Ark-tika, Rossiya, Sovetskiy Soyuz, Yamal, Taymyr, andVaigach), and one icebreaking container ship (Sevmor-put). These are stationed at the Atomflot Repair Techni-cal Plant near Murmansk. Two icebreakers have beendecommissioned and defuelled (Lenin and Sibir). A newicebreaker, 50 let Pobyedy (50 Years of Victory), is cur-rently under construction at the Baltiysky shipyard in St.Petersburg.
7.3.3. Decommissioned, currently-fuelled submarines
The decommissioning of Russian nuclear submarines inthe Arctic has caused considerable concern since the endof the Cold War. In 1992 and under the auspices of the
NATO Committee on the Challenges of the Modern So-ciety, Norway initiated a study on cross-border defense-related environmental problems. At an early stage, theworking group decided to focus on decommissioned butstill fuelled submarines. Operational submarines and nu-clear weapons were beyond the scope of the workinggroup. A direct comparison of the risks was not under-taken.
Three scenarios were used to examine releases to thesea: sinking of an undamaged submarine; sinking of adamaged submarine; and a criticality accident followedby sinking. Using the release rate model established dur-ing the International Arctic Seas Assessment Project, thedose rate to an individual on a small craft in the harborof Ara Bay, chosen as the location of the sunken subma-rine, was 100 �Sv/hr. At 2 km north of the site, averagedose rates from the water surface to personnel in a smallcraft decreased to about 10 �Sv/hr. At the mouth of AraBay, the level decreased to 1 �Sv/hr. This work did notinclude uptake by edible fish species; however, Klopkhinet al. (1997), based on model considerations of a ra-dionuclide plume in water, suggest that fish swimming inthe plume do not accumulate enough activity to justifyrestricting their consumption.
Of the many scenarios discussed, only criticality acci-dents, LOCAs, and hull damage due to sinking or shipcollision were considered potential causes of cross-bor-der contamination. Weather conditions during an inci-dent may lead to contamination of foreign territory. Forexample, using Ara Bay as the accident venue a Gauss-ian puff model was used to calculate the dispersion ofradioactivity for stable weather conditions with windstoward Kirkenes and the county of Finnmark in Nor-way. Kirkenes is an urban environment, whereas Finn-mark represents a critical group with a high consump-tion of locally produced foodstuffs. For dry depositiononly, the 137Cs deposition at Kirkenes was about 10kBq/m2 and for 134Cs and 90Sr was typically a factor often lower. The maximum annual effective dose for adultmembers of the public for the two cross-border receptorareas assuming a ‘worst-case’ scenario (NATO, 1998) isshown in Table 7·4. With dry conditions during the pas-sage of the radioactive cloud, the average individual ef-fective radiation dose received in the first year is <1 mSv.Rainfall during cloud passage may lead to enhanceddeposition of radioactivity, which would cause signifi-cantly higher long-term radiation doses.
7.3.4. Storage of spent fuel
Russian marine reactors and spent fuel are of interna-tional concern. One hundred and eighty-eight nuclearsubmarines have been decommissioned in Russia. Ofthese, 48 have been dismantled, 28 are being disman-tled, and 112 are waiting for dismantling to start. Moststill contain loaded reactors. While the focus on militarynuclear issues and spent fuel began around 1990, the in-famous service ship Lepse, containing more than 600spent fuel assemblies, is still harbored near Murmansk.According to the CEG (2003), fuel arising from 130submarine nuclear reactor cores is currently being storedin northwestern Russia, while fuel from an additional 20cores is located in far eastern Russia. An average reactorcore has approximately 455 fuel assemblies. In Decem-
AMAP Assessment 2002: Radioactivity in the Arctic86
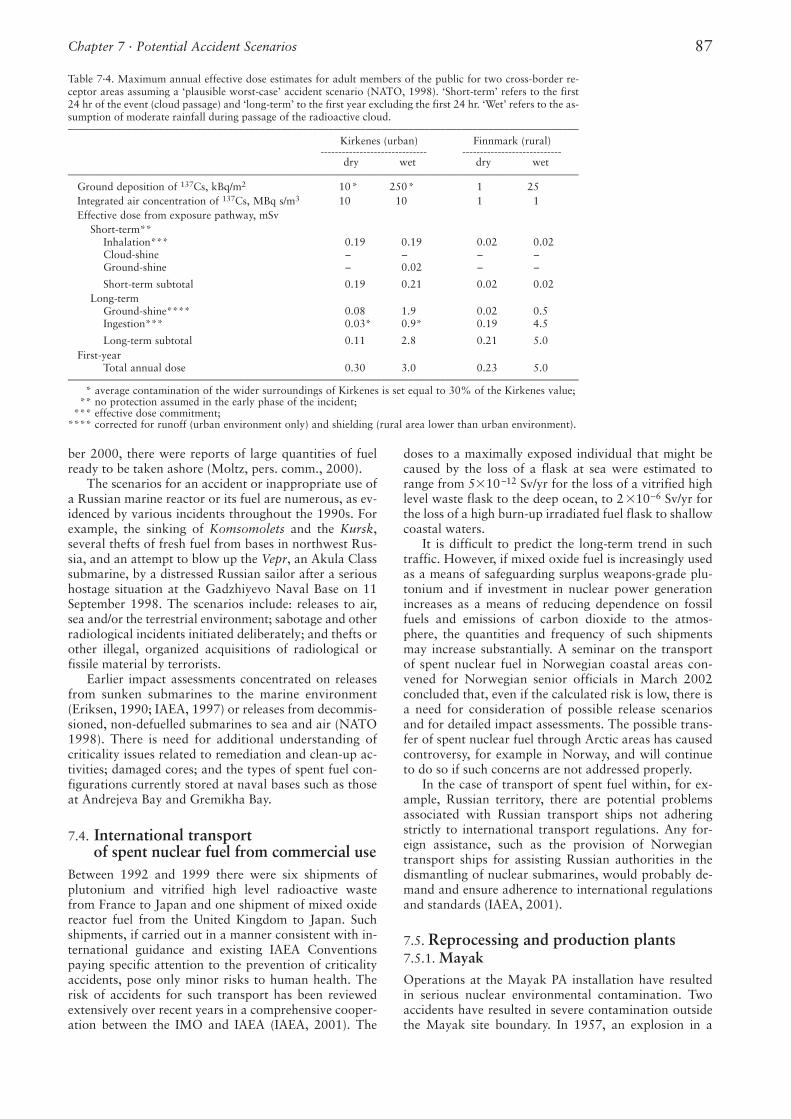
ber 2000, there were reports of large quantities of fuelready to be taken ashore (Moltz, pers. comm., 2000).
The scenarios for an accident or inappropriate use ofa Russian marine reactor or its fuel are numerous, as ev-idenced by various incidents throughout the 1990s. Forexample, the sinking of Komsomolets and the Kursk,several thefts of fresh fuel from bases in northwest Rus-sia, and an attempt to blow up the Vepr, an Akula Classsubmarine, by a distressed Russian sailor after a serioushostage situation at the Gadzhiyevo Naval Base on 11September 1998. The scenarios include: releases to air,sea and/or the terrestrial environment; sabotage and otherradiological incidents initiated deliberately; and thefts orother illegal, organized acquisitions of radiological orfissile material by terrorists.
Earlier impact assessments concentrated on releasesfrom sunken submarines to the marine environment(Eriksen, 1990; IAEA, 1997) or releases from decommis-sioned, non-defuelled submarines to sea and air (NATO1998). There is need for additional understanding ofcriticality issues related to remediation and clean-up ac-tivities; damaged cores; and the types of spent fuel con-figurations currently stored at naval bases such as thoseat Andrejeva Bay and Gremikha Bay.
7.4. International transport of spent nuclear fuel from commercial use
Between 1992 and 1999 there were six shipments ofplutonium and vitrified high level radioactive wastefrom France to Japan and one shipment of mixed oxidereactor fuel from the United Kingdom to Japan. Suchshipments, if carried out in a manner consistent with in-ternational guidance and existing IAEA Conventionspaying specific attention to the prevention of criticalityaccidents, pose only minor risks to human health. Therisk of accidents for such transport has been reviewedextensively over recent years in a comprehensive cooper-ation between the IMO and IAEA (IAEA, 2001). The
doses to a maximally exposed individual that might becaused by the loss of a flask at sea were estimated torange from 5�10–12 Sv/yr for the loss of a vitrified highlevel waste flask to the deep ocean, to 2�10–6 Sv/yr forthe loss of a high burn-up irradiated fuel flask to shallowcoastal waters.
It is difficult to predict the long-term trend in suchtraffic. However, if mixed oxide fuel is increasingly usedas a means of safeguarding surplus weapons-grade plu-tonium and if investment in nuclear power generationincreases as a means of reducing dependence on fossilfuels and emissions of carbon dioxide to the atmos-phere, the quantities and frequency of such shipmentsmay increase substantially. A seminar on the transportof spent nuclear fuel in Norwegian coastal areas con-vened for Norwegian senior officials in March 2002concluded that, even if the calculated risk is low, there isa need for consideration of possible release scenariosand for detailed impact assessments. The possible trans-fer of spent nuclear fuel through Arctic areas has causedcontroversy, for example in Norway, and will continueto do so if such concerns are not addressed properly.
In the case of transport of spent fuel within, for ex-ample, Russian territory, there are potential problemsassociated with Russian transport ships not adheringstrictly to international transport regulations. Any for-eign assistance, such as the provision of Norwegiantransport ships for assisting Russian authorities in thedismantling of nuclear submarines, would probably de-mand and ensure adherence to international regulationsand standards (IAEA, 2001).
7.5. Reprocessing and production plants7.5.1. MayakOperations at the Mayak PA installation have resultedin serious nuclear environmental contamination. Twoaccidents have resulted in severe contamination outsidethe Mayak site boundary. In 1957, an explosion in a
Chapter 7 · Potential Accident Scenarios 87
Table 7·4. Maximum annual effective dose estimates for adult members of the public for two cross-border re-ceptor areas assuming a ‘plausible worst-case’ accident scenario (NATO, 1998). ‘Short-term’ refers to the first24 hr of the event (cloud passage) and ‘long-term’ to the first year excluding the first 24 hr. ‘Wet’ refers to the as-sumption of moderate rainfall during passage of the radioactive cloud.––––––––––––––––––––––––––––––––––––––––––––––––––––––––––––––––––––––––––––––––––––––––––––––––
Kirkenes (urban) Finnmark (rural)--------------------------------------------------------------------
dry wet dry wet––––––––––––––––––––––––––––––––––––––––––––––––––––––––––––––––––––––––––––––––––––––––––––––––
Ground deposition of 137Cs, kBq/m2 10.* 250.* 1 25Integrated air concentration of 137Cs, MBq s/m3 10 10 1 1Effective dose from exposure pathway, mSv
Short-term**Inhalation*** 0.19 0.19 0.02 0.02Cloud-shine – – – –Ground-shine – 0.02 – –
Short-term subtotal 0.19 0.21 0.02 0.02Long-term
Ground-shine**** 0.08 1.9 0.02 0.5Ingestion*** 0.03* 0.9* 0.19 4.5
Long-term subtotal 0.11 2.8 0.21 5.0First-year
Total annual dose 0.30 3.0 0.23 5.0–––––––––––––––––––––––––––––––––––––––––––––––––––––––––––––––––––––––––––––––––––––––––––––––– **** average contamination of the wider surroundings of Kirkenes is set equal to 30% of the Kirkenes value; **** no protection assumed in the early phase of the incident; **** effective dose commitment; **** corrected for runoff (urban environment only) and shielding (rural area lower than urban environment).
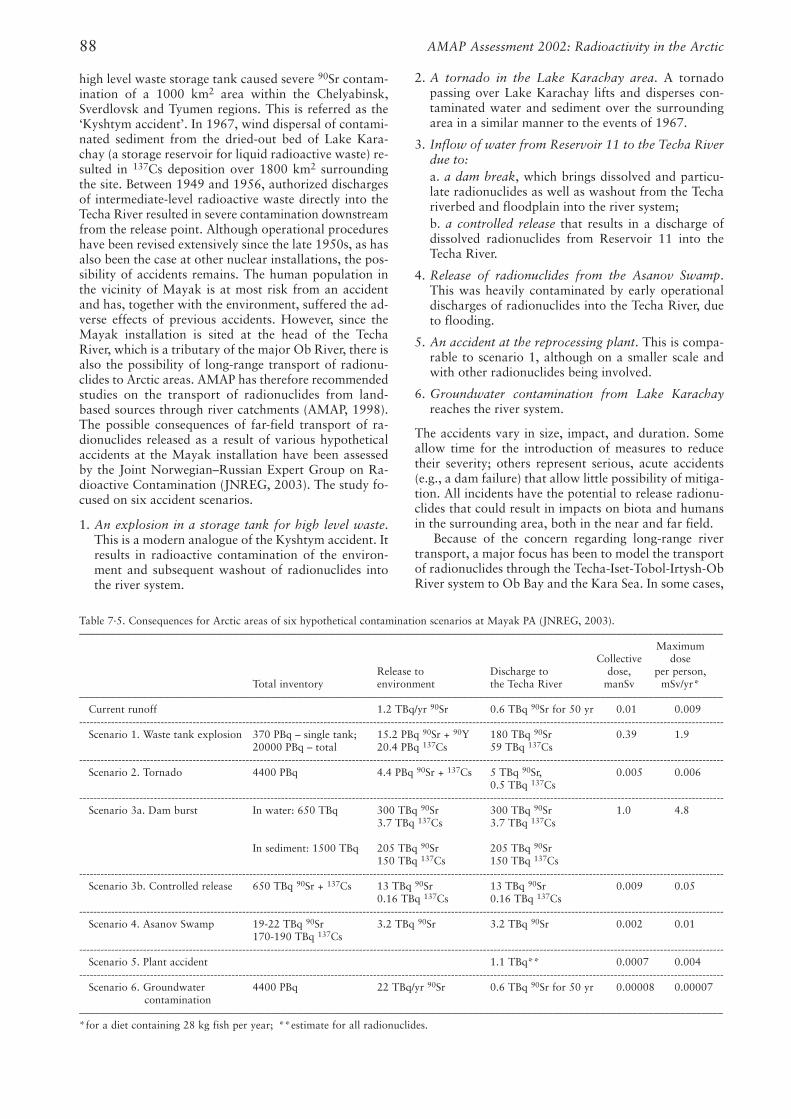
high level waste storage tank caused severe 90Sr contam-ination of a 1000 km2 area within the Chelyabinsk,Sverdlovsk and Tyumen regions. This is referred as the‘Kyshtym accident’. In 1967, wind dispersal of contami-nated sediment from the dried-out bed of Lake Kara-chay (a storage reservoir for liquid radioactive waste) re-sulted in 137Cs deposition over 1800 km2 surroundingthe site. Between 1949 and 1956, authorized dischargesof intermediate-level radioactive waste directly into theTecha River resulted in severe contamination downstreamfrom the release point. Although operational procedureshave been revised extensively since the late 1950s, as hasalso been the case at other nuclear installations, the pos-sibility of accidents remains. The human population inthe vicinity of Mayak is at most risk from an accidentand has, together with the environment, suffered the ad-verse effects of previous accidents. However, since theMayak installation is sited at the head of the TechaRiver, which is a tributary of the major Ob River, there isalso the possibility of long-range transport of radionu-clides to Arctic areas. AMAP has therefore recommendedstudies on the transport of radionuclides from land-based sources through river catchments (AMAP, 1998).The possible consequences of far-field transport of ra-dionuclides released as a result of various hypotheticalaccidents at the Mayak installation have been assessedby the Joint Norwegian–Russian Expert Group on Ra-dioactive Contamination (JNREG, 2003). The study fo-cused on six accident scenarios.
1. An explosion in a storage tank for high level waste.This is a modern analogue of the Kyshtym accident. Itresults in radioactive contamination of the environ-ment and subsequent washout of radionuclides intothe river system.
2. A tornado in the Lake Karachay area. A tornadopassing over Lake Karachay lifts and disperses con-taminated water and sediment over the surroundingarea in a similar manner to the events of 1967.
3. Inflow of water from Reservoir 11 to the Techa Riverdue to:a. a dam break, which brings dissolved and particu-late radionuclides as well as washout from the Techariverbed and floodplain into the river system; b. a controlled release that results in a discharge ofdissolved radionuclides from Reservoir 11 into theTecha River.
4. Release of radionuclides from the Asanov Swamp.This was heavily contaminated by early operationaldischarges of radionuclides into the Techa River, dueto flooding.
5. An accident at the reprocessing plant. This is compa-rable to scenario 1, although on a smaller scale andwith other radionuclides being involved.
6. Groundwater contamination from Lake Karachayreaches the river system.
The accidents vary in size, impact, and duration. Someallow time for the introduction of measures to reducetheir severity; others represent serious, acute accidents(e.g., a dam failure) that allow little possibility of mitiga-tion. All incidents have the potential to release radionu-clides that could result in impacts on biota and humansin the surrounding area, both in the near and far field.
Because of the concern regarding long-range rivertransport, a major focus has been to model the transportof radionuclides through the Techa-Iset-Tobol-Irtysh-ObRiver system to Ob Bay and the Kara Sea. In some cases,
AMAP Assessment 2002: Radioactivity in the Arctic88
Table 7·5. Consequences for Arctic areas of six hypothetical contamination scenarios at Mayak PA (JNREG, 2003).–––––––––––––––––––––––––––––––––––––––––––––––––––––––––––––––––––––––––––––––––––––––––––––––––––––––––––––––––––––––––
MaximumCollective dose
Release to Discharge to dose, per person,Total inventory environment the Techa River manSv mSv/yr*
–––––––––––––––––––––––––––––––––––––––––––––––––––––––––––––––––––––––––––––––––––––––––––––––––––––––––––––––––––––––––Current runoff 1.2 TBq/yr 90Sr 0.6 TBq 90Sr for 50 yr 0.01 0.009
--------------------------------------------------------------------------------------------------------------------------------------------------------------------------------------Scenario 1. Waste tank explosion 370 PBq – single tank; 15.2 PBq 90Sr + 90Y 180 TBq 90Sr 0.39 1.9
20000 PBq – total 20.4 PBq 137Cs 59 TBq 137Cs--------------------------------------------------------------------------------------------------------------------------------------------------------------------------------------
Scenario 2. Tornado 4400 PBq 4.4 PBq 90Sr + 137Cs 5 TBq 90Sr, 0.005 0.0060.5 TBq 137Cs
-------------------------------------------------------------------------------------------------------------------------------------------------------------------------------------- Scenario 3a. Dam burst In water: 650 TBq 300 TBq 90Sr 300 TBq 90Sr 1.0 4.8
3.7 TBq 137Cs 3.7 TBq 137Cs
In sediment: 1500 TBq 205 TBq 90Sr 205 TBq 90Sr150 TBq 137Cs 150 TBq 137Cs
--------------------------------------------------------------------------------------------------------------------------------------------------------------------------------------Scenario 3b. Controlled release 650 TBq 90Sr + 137Cs 13 TBq 90Sr 13 TBq 90Sr 0.009 0.05
0.16 TBq 137Cs 0.16 TBq 137Cs--------------------------------------------------------------------------------------------------------------------------------------------------------------------------------------
Scenario 4. Asanov Swamp 19-22 TBq 90Sr 3.2 TBq 90Sr 3.2 TBq 90Sr 0.002 0.01170-190 TBq 137Cs
--------------------------------------------------------------------------------------------------------------------------------------------------------------------------------------Scenario 5. Plant accident 1.1 TBq** 0.0007 0.004
--------------------------------------------------------------------------------------------------------------------------------------------------------------------------------------Scenario 6. Groundwater 4400 PBq 22 TBq/yr 90Sr 0.6 TBq 90Sr for 50 yr 0.00008 0.00007
contamination–––––––––––––––––––––––––––––––––––––––––––––––––––––––––––––––––––––––––––––––––––––––––––––––––––––––––––––––––––––––––*for a diet containing 28 kg fish per year; **estimate for all radionuclides.
other transport processes (e.g., atmospheric transport ofradioactive debris) have also been considered. The mod-els, developed by scientists at Mayak PA and SPA Ty-phoon, include radionuclide transport in river systems,and tornado, flood, and groundwater contamination.Where possible, the models are based on existing scien-tific knowledge concerning the transport and behaviorof radionuclides in the area surrounding Mayak and onthe outcome of previous accidents, both at Mayak andother installations. Information on the physico-chemicalforms of radionuclides and the influence of speciationon transport processes and mechanisms was also in-cluded. Finally, major uncertainties, variability, and modelsensitivity has been assessed.
The models required particular variables (release in-ventory, radionuclide composition, meteorological con-ditions, etc.) for each scenario. Each scenario will varyaccording to the course of events, particularly concern-ing the quantity of radionuclides released, which couldbe more or less than the hypothetical estimate. There-fore, the estimates derived using the models have largeuncertainties. Worst-case conditions were generally con-sidered for each scenario.
The outcome of the modelling exercise is comparedwith current run-off in Table 7·5. For each scenario, thetable presents estimates for the total radionuclide inven-tory and estimates of radioactive releases to the environ-ment outside the Mayak PA area. Radioactive dischargesto the upper Techa-Iset-Tobol-Irtysh-Ob River system(mainly into the Techa River) can be much lower thanthose to the environment, if for example, contaminationis due to washout from the water catchment area. Doseswere estimated for Ob Bay and the Kara Sea for a 50-year period after the hypothetical accidents.
Scenarios 1 and 3a result in a very high radioactivedischarge to the Techa River. The other scenarios resultin much lower radioactive contamination of the TechaRiver.
The models indicate that 90Sr transport through theriver system will lead to a significant increase in contam-ination in the lower reaches of the Ob River comparedto current levels. For example, the additional 90Sr activ-ity concentration for the first year after the dam break isestimated to be five times higher than background. Con-tamination of Ob Bay and the Kara Sea by other ra-dionuclides is much lower. The longer-lived radionu-clides released, 137Cs and Pu, are less mobile in river sys-tems than 90Sr. For all six scenarios, the estimated activ-ity concentration is much lower than the norms regu-lated by modern radiation safety standards. Overall, itwas concluded that the potential doses to Arctic biotaand human populations from hypothetical accidents atthe Mayak PA installation are very low. However, forthe local population, the consequences may be severe.
7.5.2. Sellafield
The U.K. Health and Safety Executive have producedsafety assessment principles for nuclear plants (HSE,1992) that address safety issues, including accident sce-narios for the Sellafield site. There are a number of prin-ciples to ensure that safety is maintained throughout op-erations and in the event of design or beyond-designbased accidents. During operation there are a number of
Chapter 7 · Potential Accident Scenarios 89
design features that can mitigate an accident before itreaches a critical state. In the event of a design-based ac-cident, the safety assessment principles state that ‘thereis no release of radioactivity except in the most severe ofcases, and even then, no person will receive an effectivedose of 100 mSv or more’.
The storage of Highly Active Liquor (HAL) is an im-portant source of concern for severe accidents at the Sel-lafield site. HAL is a waste product from the reprocess-ing of irradiated nuclear fuel and is currently stored on-site in water-cooled storage tanks. It is converted intosolid form via the process of vitrification (incorporationinto borosilicate glass) at a rate limited by the capacityof the vitrification plant. The Nuclear Installations In-spectorate has instructed British Nuclear Fuels (BNFL)to vitrificate HAL from a current volume of about 1300 m3
(1999) to a buffer volume of 200 m3 (to feed the vitrifi-cation process) by 2015 in response to the potential haz-ard associated with these wastes (HSE, 2000). The mainpart of the activity in a typical HAL tank is due to 137Csand 90Sr. There are in total 21 tanks containing about7�1018 Bq of 137Cs and 4.8�1018 Bq of 90Sr (Turveyand Hone, 2000). Vitrified wastes are also stored on-siteat Sellafield and are generally thought to be safer thanHAL because the fission products are immobilized in asolid matrix and cooled by the circulation of air. Theyare thus not dependent on an active cooling system.
A major BNFL safety case for HAL stores was com-pleted in 1994. This was followed by a Nuclear Installa-tions Inspectorate assessment (HSE, 2000). The assess-ment concluded that the BNFL approach to accidentanalysis was incomplete and not best practice. In 1999,BNFL completed the Continued Operation Safety Re-port (COSR), which is the latest safety analysis associ-ated with the HAL stores. Although this report is notpublicly available, the Radiation Protection Institute ofIreland (RPII) was given access to the BNFL safety docu-mentation and has published an evaluation report of theCOSR (Turvey and Hone, 2000). The objectives of theRPII examination of the safety material were to deter-mine whether the COSR includes all significant hazards;to evaluate the conclusions of the COSR on the proba-bility of occurrence of a number of accident scenarios; todetermine whether confidence can be placed in the data-base used in the COSR and to assess the significance ofany shortcomings; and to assess the need for further im-provements in safety. Turvey and Hone (2000) concludethat the risks of a severe accident associated with theHAL stores are low but identify some areas where therisks could be reduced further. The report also statesthat the risk of damage from a severe earthquake has notbeen fully analyzed. According to Turvey and Hone(2000), all other major accident scenarios appear tohave been considered in the COSR. Despite the proba-bility of an accident involving a significant release of ra-dioactivity being considered low, Turvey and Hone(2000) identify certain safety weaknesses, e.g., that thewater supplies for cooling the tanks are not fully inde-pendent of each other, that there is no instrumentationfor detecting possible hydrogen build-up in the storagetanks, and that the consequences of very severe acci-dents have not been adequately assessed.
Low probability but high consequence events appearto pose the greatest environmental risk at Sellafield, and
could even impact upon the Arctic. These include: seis-mic events; fire or explosion due to hydrogen generationas a result of radiolysis of HAL or red oil reactions (hotorganic liquid and aqueous nitrate solution); extremeweather conditions; aircraft crashes; other man-madehazards (toxic gases); criticality; beyond-design basis ac-cidents; and accidents as a result of human factors.
These issues have been considered by BNFL and theU.K. Health and Safety Executive (HSE, 1992, 2000)but estimates of the radiological consequences (i.e., radi-ation doses) of each accident scenario have not been as-sessed.
After 11 September 2001, the possibility of a terror-ist attack on, or an airplane crash into, nuclear plantshas received much attention. A report prepared for theEuropean Parliament by an external contractor, WISE-Paris (WISE-Paris, 2001a), mentions this briefly and ad-dresses the subject in greater detail in a later report(WISE-Paris, 2001b). The HAL stores are identified asthe major risk for radioactivity releases. An assessmentis made based on an estimated release of half the total137Cs content in the HAL tank, and then compared withconsequences from the Chernobyl accident. However,these estimations are controversial and have receivedsome criticism.
7.6. ConclusionsRisk assessments are important for establishing priori-ties. Even though the absolute results from these assess-ments have large uncertainties, their relative magnitudes
may be compared in order to help identify where tofocus efforts for risk reduction. The outcome of risk as-sessments and actual accidents indicate that the conse-quences of releases to the atmosphere, and subsequentfallout to the terrestrial environment, are greater thanfor releases to the marine environment.
This assessment has addressed the unintentional po-tential releases from reprocessing plants in central andsouthern Russia in detail. The first AMAP assessmentconcluded that possible consequences of accidents atthese plants should be assessed for the Arctic populationand environments, owing to the possible transport of ra-dionuclides through the river systems. The present as-sessment shows that the consequences of such accidentsfor the Arctic are likely to be much less than previouslyexpected.
That many of the sources to be evaluated in risk as-sessments are within the military domain, e.g., naval re-actors and nuclear weapons, is a problem. Necessary in-formation is often restricted. Openness regarding mili-tary sources should be promoted, such that risks to soci-ety as a whole can be compared and resources for riskreduction programs used optimally.
The increased awareness of terrorist activities since2001 has also forced the nuclear industry to reassess theprobability and consequences of a terrorist event. Al-though AMAP does not address security issues, and thismatter has therefore not been discussed further, it shouldbe noted that, with negative intentions, the results of an‘accident’ could be worse than those estimated in thepresent scenarios.
AMAP Assessment 2002: Radioactivity in the Arctic90
during the first AMAP assessment, whereas the new esti-mates for doses to the indigenous populations in Canadaand northwest Russia were lower and higher, respec-tively. In both cases, the difference was due to revised es-timates of the intake of reindeer/caribou meat.
Previously, the focus of radiation protection has beenthe protection of human health. A new initiative, high-lighted in this assessment, is an attempt to develop abasis for protecting the environment from the effects ofradiation. An international consensus has emerged forthe rapid development of a system and framework forthe protection of the environment. The InternationalUnion of Radioecology, with support from AMAP, wasone of the first international organizations to promotethis. It is recommended that AMAP be asked to take anactive part in continued efforts to address environmentalprotection, taking special responsibility for the Arctic.This should focus on the scientific needs associated withprotection of the environment, and the development ofassociated monitoring strategies and assessment tools.
The major concern regarding potential environmen-tal contamination relates to accidents involving nuclearmaterial, especially accidents at nuclear power plants.Models show that a major accident at the Kola nuclearpower plant in Russia resulting in substantial release ofradioactive material to the atmosphere would requirecountermeasures to avoid high radiation doses to thepopulation, which may then need to be applied for sev-eral years. Vulnerability, expressed as dose from a givenfallout, can vary considerably, even over small areas.Owing to high transfer rates and long ecological half-lives, previous deposition must be quantified when esti-mating the consequences of potential accidents. It is rec-ommended that AMAP be asked to clarify the vulnera-bility and impact of radioactivity on the Arctic environ-ment and the consequences for emergency preparednessplanning.
Major efforts are underway to reduce radiation risksassociated with nuclear reactors and radioactive wastehandling. Nevertheless, further improvements are war-ranted. The main criterion of success for a nuclear safetyproject is its net contribution to the improvement of nu-clear safety. Projects must be undertaken within a con-text that includes safety assessments and environmentalimpact assessments that incorporate a variety of riskanalyses, to demonstrate compliance with risk objectivesrelating to environmental and human health protection.Future effort will continue to be concentrated on theareas of greatest risk and the operations and facilitiesthat pose the greatest potential threat. To reduce risk, tomitigate the consequences of possible future accidents,and to optimize the use of resources, work has been un-dertaken on risk management and risk analysis of nu-clear activities and on assessments of the vulnerability ofArctic areas. This provides a basis for improved emer-gency prevention, preparedness, and response to nuclearincidents, with the optimal use of resources.
91
New information on actual and potential sources of ra-dioactive contamination in the Arctic environment hasbeen provided for this assessment. More detailed knowl-edge for several sources has enabled new impact assess-ments; however the major sources of radioactive contam-ination of the Arctic environment are still fallout fromatmospheric nuclear weapons tests conducted between1945 and 1980, discharges from European spent nuclearfuel reprocessing plants, and fallout from the accident atthe Chernobyl nuclear power plant in the Ukraine in1986. Doses to humans are derived mainly from globalfallout and fallout from the Chernobyl accident.
A topic new to this assessment is the loss of the sub-marine Kursk of the Russian Northern Fleet off Mur-mansk in August 2000 after an explosion on board. TheKursk has now been recovered and monitoring showsthat the accident did not result in any measurable re-leases of radionuclides to the Arctic environment.
In general, levels of radionuclides in the Arctic aredeclining. The exceptions are seawater concentrations ofthe long-lived water-soluble fission products 99Tc and129I. This is due to increased releases from nuclear fuelreprocessing in Western Europe and supports the recom-mendation by AMAP in 2000 that the Arctic Councilencourage the United Kingdom to reduce the releasesfrom Sellafield to the marine environment of tech-netium, by implementing best available technology.
There is evidence that sediments are now a source ofPu and 137Cs to the Arctic. Previous releases, such asthose from Sellafield that have deposited in Irish Sea sed-iments, are being remobilized such that these depositsnow act as sources to the Arctic. Thus, even if opera-tional releases from reprocessing plants are reduced, ra-dionuclides remobilized from contaminated sediments inthe Irish Sea and the Baltic Sea will continue to be ob-served in the Arctic. Nevertheless, present doses to Arc-tic peoples from radionuclides originating from spentnuclear fuel reprocessing plants are small, although theuncertainty surrounding the pathways to and effects ofsuch radionuclides in the Arctic indicates the need forfurther assessment. Impacts on the Arctic should be con-sidered when evaluating discharge reduction measures,and it is recommended that the Arctic Council support amore detailed study on the remobilization of radionu-clides from sediment and its potential long-term effectson the Arctic.
Despite the decline in current levels, there is continu-ing uncertainty about the amount of radionuclides pres-ent at a number of sources and potential sources in theArctic. Access to information about civilian and militarysources continues to be a problem. It is recommendedthat the Arctic Council promotes more openness for re-stricted information.
New work has been done on doses to populations inthe Faroe Islands, Canada, and northwest Russia. Dosesto the non-indigenous populations in Russia and to theFaroe Islands’ population were the same as estimated
Chapter 8
Summary –––––––––––––––––––––––––––––––––––––––––––––––––––––––––––––––––––––––––––––––––––––––––
It is recommended that risk and impact assessmentprograms, including uncertainty estimates, be performedbefore action is taken to reduce risk. Risk and impact as-sessments, including accident scenarios, should be un-dertaken for the transport of nuclear waste and fuelwithin the Arctic and nearby areas, and with regard tostorage and reprocessing within the Arctic and nearbyareas. Since the first AMAP assessment, nuclear safetyprograms have been undertaken in Russia at nuclearpower plants and other nuclear installations relevant tothe Arctic. It is recommended that the Arctic Councilcontinue its cooperation with Russia to improve thesafety and safeguarding of nuclear installations andwaste sites.
Co-operation is required between relevant authori-ties on the development of initiatives concerning healthand safety, and preparedness. Of particular interest are
health and safety risks immediately before, during, andafter a risk reducing initiative. Although such coopera-tion has not been prioritized to date, current coopera-tion between the authorities responsible for radiationprotection, environmental protection, and nuclear safetyis working well and contributing to effective interna-tional programs. Such efforts are not costly and con-tribute significantly to the development of large multi-lateral internationally funded projects. At the same time,they have wider significance – one consequence is thatRussian management practices and demands relating toradiation protection are now becoming more transpar-ent and more compatible with international guidelines.A further strengthening of the Russian authorities re-sponsible for nuclear protection would increase theirability to effectively implement these improved manage-ment practices.
AMAP Assessment 2002: Radioactivity in the Arctic92
93
Personal communications–––––––––––––––––––––––––––––––––––––––––––––––––––––––––––––––––––––––––––––––––––––––––––––––––Eikelmann, I-M., 2002. Norwegian Radiation Protection Authority,
Østerås, NorwayJoensen, H.P., 2002. University of The Faroe Islands, Argir, Faroe
Islands.
Moltz, C., 2000. Institute of International Studies, Monterey, CA,USA.
Rissanen, K., 2003. Finnish Radiation and Nuclear Safety Authority.Salbu, B., 2001. Agricultural University of Norway, Ås, Norway.
References–––––––––––––––––––––––––––––––––––––––––––––––––––––––––––––––––––––––––––––––––––––––––––––––––
Aaltonen V., J. Paatero, J. Hatakka and Y. Viisanen, 2002a. Air-borne Cesium-137 in Northern Finland in the early 1960'sbased on the measurement of archived air filter samples. NKS-70/April 2002. In: E. Ilus (ed.). Proceedings of the eighth NordicSeminar on Radioecology. Finnish Radiation and Nuclear SafetyAuthority (STUK), Helsinki. pp.149-151.
Aaltonen V., J. Paatero, J. Hatakka and Y. Viisanen, 2002b. Air-borne Cesium-137 in Finland after the Chernobyl Accident basedon the measurements of archived air filter samples. STUK-A195/June 2003. In: V. Paile (ed.). Radiological Protection in the2000s – Theory and Practice. Turku, Finland, August 25-29,2002. Nordic Society for Radiation Protection, Roskilde. pp.465-468
Aarkrog, A. 1971. Radioecological investigation of plutonium in anarctic marine environment. Health Physics, 20:31-47.
Aarkrog, A. 1977. Environmental behaviour of plutonium acciden-tally released at Thule, Greenland. Health Physics, 32:271-284.
Aarkrog, A., H. Dahlgaard and K. Nilsson, 1984. Further studies ofplutonium and americium at Thule, Greenland. Health Physics,46:29-44.
Aarkrog, A., S. Boelskifte, H. Dahlgaard, S. Duniec, E. Holm andJ.N. Smith, 1987. Studies of transuranics in an arctic marine en-vironment. Journal of Radioanalytical and Nuclear Chemistry-Articles, 115:39-50.
Aarkrog, A., E. Buch, Q.J. Chen, G.C. Christensen, H. Dahlgaard,H. Hansen, E. Holm, S.P. Nielsen and M. Strandberg, 1994.Environmental Radioactivity in the North Atlantic Region in-cluding the Faroe Islands and Greenland, 1990 and 1991. RisøNational Laboratory, Roskilde, Denmark, 88p.
Åhman, B., and T. Nylén. 1998. Radiocesium i ren i relation tillmarkbeläggning och halter i växter samt till årstid och diet (Ra-diocaesium in reindeer in relation to ground deposition, levelsin vegetation, season and diet) – Progress report to the SwedishRadiation Protection Institute, Reindeer Husbandry Unit, Swed-ish University of Agricultural sciences, Uppsala. In Swedish.
Akhunov, V.D., V.N. Kovalenko, A.D. Ruzahkin, S.G. Testov, A.P.Vasiliev, A.V. Grigorev, V.G. Aden, S.U. Bulkin, V.K. Bulygin,V.V. Vazinger, U.A. Ivanov and N.G. Sandler, 2001. Spent nu-clear fuel and waste management at Andreeva Bay. Workshopon Russian Federation reports, conditions, priorities and re-sponse options. Hosted by the U.S. DoE, U.S. DoD, U.S. DoS.Idaho Falls, October 23-25 2001.
AMAP, 1997. Arctic Pollution Issues: A State of the Arctic Environ-ment Report. Arctic Monitoring and Assessment Programme(AMAP), Oslo, 188p.
AMAP, 1998. AMAP Assessment Report: Arctic Pollution Issues.Arctic Monitoring and Assessment Programme (AMAP), Oslo,xii + 859p.
Amiro, B.D., 1997. Radiological dose conversion factors for genericnon-human biota used for screening potential ecological im-pacts. Journal of Environmental Radioactivity, 35(1):37-51.
Amundsen, I., B. Lind and A. Nikitin, 2002a. Environmental moni-toring of radionuclides before, during and after the raising ofthe nuclear submarine the Kursk. In: Strand P. and T. Jølle(eds.). Proceedings of the fifth International Conference on Ra-dioactive Contamination in the Arctic and Antarctic, St Peters-burg, June 16-20, 2002, pp. 31-34.
Amundsen, I., B. Lind, O. Reistad, K. Gussgaard, M. Iosjpe and M.Sickel, 2002b. The accidental sinking of the nuclear submarine,the Kursk; monitoring of radioactivity and the preliminary as-sessment of the potential impact of radioactive releases. MarinePollution, 44:459-468.
Anon, 2001. Monitoring of radioactive contamination of marineenvironment when preparing for the Kursk raising, during the
raising operation and after it. Report on works carried out inpursuit of the Directive of Roshydromet No. 140-26 of03.08.2001. On participation of the staff of Roshydromet inthe special purpose expedition. SPA Typhoon (Obninsk).
Arnalds, Ó., 1999. Soils and soil erosion in Iceland. In: Ármanns-son H. (ed.). Proceedings of the fifth International Conferenceon the Geochemistry of the Earth’s Surface, pp. 135-138.Balkema, Rotterdam.
Baklanov, A., A. Mahura, D. Jaffe, L. Thaning, R. Bergman and R.Andres, 2002. Atmospheric transport patterns and possibleconsequences for the European north after a nuclear accident.Journal of Environmental Radioactivity, 60(1-2):23-48.
Baklanov, A., A. Mahura and J.H. Sørensen, 2003. Methodologyfor prediction and estimation of consequences of possible at-mospheric releases of hazardous matter: ‘Kursk’ submarine study.Atmospheric Chemistry and Physics Discussions, 3:1515-1556.
Bartnicki, J. and J. Saltbones, 1997. Analysis of atmospheric trans-port and deposition of radioactive material released during apotential accident at Kola Nuclear Power Plant. Research Re-port No. 43. Det Norske Meteorologiske Institutt, Oslo.
Beasley, T.M., L.W. Cooper, J.M. Grebmeier, L.R. Kilius and H.A.Synal, 1997. 36Cl and 129I in the Yenisei, Kolyma, and Macken-zie Rivers. Environmental Science & Technology, 31:1834-1836.
Beresford, N.A., S.M. Wright and T. Sazykina (eds.), 2001. Refer-ence Arctic Organisms. A deliverable report for EPIC. EC Inco-Copernicus project, ICA2-CT-2000-10032, Centre for Ecologyand Hydrology, UK.
Berti, P.R., H.M. Chan, O. Receveur, C.R. MacDonald and H.V.Kuhnlein, 1998. Population exposure to radioactivity from con-sumption of caribou among Dene/Métis of Denendeh (WesternNorthwest Territories, Canada). Journal of Exposure Analysisand Environmental Epidemiology, 8(2)145-158.
Blaylock, B.G., 1982. Radionuclide data bases available for bioac-cumulation factors for freshwater biota. Nuclear Safety, 23(4):427-438.
BNFL, 2000. Annual Report on Discharges and Monitoring of theEnvironment in the United Kingdom, 1999. British Nu-clear Fuels, UK.
Borghuis, A.M., A. Liland and P. Strand, (eds.), 2002. Arctic vul-nerability to radioactive contamination. EU contract No. ERBIC15-CT98-0201. Final report for the period 1998.09.01-2001.08.31. Norwegian Radiation Protection Authority, Østerås.
Brown, J.E., A.K. Kostad, A.L. Brungot, B. Lind, A.L. Rudjord andP. Strand, 1999. Levels of 99Tc in biota and seawater samplesfrom Norwegian coastal waters and adjacent sea. Marine Pollu-tion Bulletin, 38:560-571.
Brown, J., A.K. Kolstad, B. Lind, A.L. Rudjord and P. Strand, 1998.Technetium-99 contamination in the North Sea and in Norwe-gian coastal areas 1996 and 1997. StrålevernRapport 1998:3,Norwegian Radiation Protection Authority, Østerås.
Brown, J., J.R. Cooper, J.A. Jones, L. Flaws, R. McGeary and J.Spooner, 2000. Review of Decontamination and Clean-upTechniques for use in the UK following Accidental Releases ofRadioactivity to the Environment. DOE/RAS/96.009.
Busby, R., M. McCartney and P. McDonald, 1997. Technetium-99concentration factors in Cumbrian seafood. Radioprotection -Colloques, 32:311-316.
Cappelen, J. and E.V. Laursen, 1998. The Climate of the Faroe Is-lands – with Climatological Standard Normals, 1961-1990.Technical Report No. 98-14, Danish Meteorological Institute,Copenhagen, 62p.
CEC, 1990. The radiological exposure of the population of the Eu-ropean Community from radioactivity in North European ma-
rine waters. Project ‘Marina’ CEC Radiation protection – 47EUR 12483. Commission of the European Communities, 571p.
CEG, 2002. Working material for the 14th meeting of the ContactExpert Group for International Radwaste Projects in the Russ-ian Federation. Volume I, Information on cooperation projects.International Atomic Energy Agency, Vienna.
CEG, 2003. Main problems of spent nuclear fuel and radioactivewaste management in the Russian Federation. Contact ExpertGroup for International Radwaste Projects in the Russian Fed-eration. International Atomic Energy Agency, Vienna.
Claassen, H.C., 1978. Hydrologic processes and radionuclide distri-bution in a cavity and chimney produced by the Cannikin nu-clear explosion, Amchitka Island, Alaska. Geological SurveyProfessional Paper 712-D, U.S. Government Print Office,Washington DC.
Clarke, R., 1999. Control of low-level radiation exposure: time fora change? Journal of Radiological Protection, 19:107-115.
Cochran, J.K., S.B. Moran, N.S. Fisher, T.M. Beasley and J.M. Kel-ley, 2000. Sources and transport of anthropogenic radionu-clides in the Ob River system, Siberia. Earth and Planetary Sci-ence Letters, 179:125-137.
Cook, G.T., A.B. Mackenzie, P. McDonald and S.R. Jones, 1997.Remobilization of Sellafield-derived radionuclides and trans-port from the north-east Irish Sea. Journal of EnvironmentalRadioactivity, 35:227-241.
Cooper, L.W., T.M. Beasley, X.L. Zhao, C. Soto, K.L. Vinogradovaand K.H. Dunton, 1998. Iodine-129 and plutonium isotopes inArctic kelp as historical indicators of transport of nuclear fuel-reprocessing wastes from mid-to-high latitudes in the AtlanticOcean. Marine Biology, 131:391-399.
Cooper, L.W., T. Beasley, K. Aagaard, J.M. Kelley, I.L. Larsen andJ.M. Grebmeier, 1999. Distributions of nuclear fuel-reprocess-ing tracers in the Arctic Ocean: Indications of Russian river in-fluence. Journal of Marine Research, 57:715-738.
Cooper, L.W., J.M. Kelley, L.A. Bond, K.A. Orlandini and J.M.Grebmeier, 2000. Sources of the transuranic elements pluto-nium and neptunium in Arctic marine sediments. Marine Chem-istry, 69:253-276.
Crochet, P., 2002. A linear model for mapping precipitation in Ice-land. Report No. 02028. Icelandic Meteorological Office,Reykjavik.
Dahlgaard, H., 1994. Sources of Cs-137, Sr-90 and Tc-99 in the EastGreenland Current. Journal of Environmental Radioactivity,25:37-55.
Dahlgaard, H., 2002. Baltic 137Cs outflow through the DanishStraits indicates remobilisation. In: Børretzen P, T. Jølle and P.Strand (eds.). Proceedings of the International Conference onRadioactivity in the Environment, Monaco, September 1-5,2002, pp. 516-520.
Dahlgaard, H., Q. Chen, J. Herrmann, H. Nies, R.D. Ibbett and P.J.Kershaw, 1995. On the background level of Tc-99, Sr-90 andCs-137 in the North Atlantic. Journal of Marine Systems,6:571-578.
Dahlgaard, H., T.D.S. Bergan and G.C. Christensen, 1997. Tech-netium-99 and caesium-137 time series at the Norwegian coastmonitored by the brown alga Fucus vesiculosus. Radioprotec-tion – Colloques, 32, 353-358.
Dahlgaard, H., M. Eriksson, E. Ilus, T. Ryan, C.A. McMahon andS.P. Nielsen, 2001. Plutonium in the marine environment atThule, NW-Greenland after a nuclear weapons accident. In:Kudo, A. (ed.). Plutonium in the Environment, pp. 15-30. Else-vier Science, UK.
Dasher, D., W. Hanson, S. Read, S. Faller, D. Farmer, W. Efurd, J.Kelley and R. Patrick, 2002. An assessment of the reportedleakage of anthropogenic radionuclides from the undergroundnuclear test sites at Amchitka Island, Alaska, USA to the surfaceenvironment. Journal of Environmental Radioactivity, 60:165-187.
Dudley, W.W. Jr., W.C. Balance and V.M. Glanzman, 1977. Hydrol-ogy. In: Merritt, M.L. and G.R. Fuller (eds.). The Environmentof Amchitka Island, Alaska, pp. 35-51. Report TID-26712,U.S. Energy Research and Development Administration.
Eichelberger, J., J. Freymueller, G. Hill and M. Patrick, 2002. Nu-clear stewardship: Lessons from a not-so-remote island. Geot-imes, 47(3):20-23.
Energgoatomizdat, 1998. Norms of radiation safety (NRB76/87).
Basic sanitary regulations. OSP-72/87 3rd edition. Energgo-atomizdat, Moscow.
Eriksen, V.O., 1990. Sunken nuclear submarines: a threat to the en-vironment. Norwegian University Press, Oslo, 176p.
Eriksson, M., 2002. On weapons plutonium in the Arctic environ-ment (Thule, Greenland). Risø-R-1321, Risø National Labora-tory, Roskilde, 150p.
Eriksson, M., H. Dahlgaard, E. Ilus, T. Ryan, Q.J. Chen, E. Holmand S.P. Nielsen, 1999. Plutonium in the marine environmentoff Thule Air Base, N.W. Greenland. Inventories and distribu-tion in sediments 29 years after the accident. In: Strand, P. andT. Jølle (eds.). Proceedings of the fourth International Confer-ence on Environmental Radioactivity in the Arctic, Edinburgh,20-23 September, 1999, pp. 60-62.
Fadeev, S.L., V.A. Balakin, V.S. Koltunov, N.N. Krasnov, A.APurstovalov and V.V. Fedorov, 1980. Development and produc-tion of radionuclides, radioisotope sources of heat and radioac-tive sources of ionizing radiation. Isotopes in the USSR. Specialissue: Materials of the science and technical conference: 30years of production and application of isotopes in the USSR,Obninsk, October 1978, No 59. State Committee of the USSRon application of atomic energy (Atomizdat), Moscow. pp. 9-19. In Russian.
Faller, S.H. and D.E. Farmer, 1998. Long Term Hydrological Mon-itoring Program, Amchitka Island, Alaska 1997. EPA-402-R-98-002. U.S. Environmental Protection Agency. 25p.
Fehn, U. and G. Snyder, 2000. 129I in the Southern Hemisphere:Global redistribution of an anthropogenic isotope. Nuclear In-struments & Methods in Physics Research, 172:366-371.
Fehn, U., G.R. Holdren, D. Elmore, T. Brunelle, R. Teng and P.W.Kubik, 1986. Determination of natural and anthropogenic 129Iin marine sediments. Geophysical Research Letters, 13:137-139.
Fylkesmannen i Finnmark, 2001. Miljøprosjekt 2001, Avfallsbe-handling av Radioisotopiske Termoelektriske Generatorer påKolahalvøya. Miljøvernavdelingen, Fylkesmannen i Finnmark,Kirkenes. In Norwegian and Russian.
Gedeonov, A.D., E.R. Petrov, V.G. Alexeev, I.N. Kuleshova, M.L.Savopulo, I.S. Burtsev, V.Yu. Shkroev and V.I. Arkhipov, 1999.Residual radioactive contamination at the peaceful nuclear ex-plosion sites ‘Craton-3’ and ‘Crystal’ in the Republic of Sakha(Yakutia). Strand, P. and T. Jølle (eds.) Proceedings of the fourthInternational Conference on Radioactive Contamination in theArctic, Edinburgh, September 20-23, 1999, pp. 43-46.
Goscomsanepidnadzor, 1996. Norms of radiation safety (NRB-96)Hygienic regulations -M. Goscomsanepidnadzor publishers,Russia, 127p.
Government of the Russian Federation, 2000. Resolution No. 149of 22 February 2000, Moscow, on the federal targeted program‘Nuclear and radiation safety of Russia’ for the period 2000-2006.
Gray, J., S.R. Jones and A.D. Smith, 1995. Discharges to the envi-ronment from the Sellafield site. Journal of Radiological Protec-tion, 15:99-131.
GRNC, 1999. Inventaire des rejets radioactifs des installations nu-cléaires. Groupe Radioecologie Nord Cotentin, 1: juillet. InFrench.
Grøttheim, S., 2000. Artificial radionuclides in the northern Euro-pean marine environment in 1995. Distribution of radiocae-sium, plutonium and americium in sea water and sediments.StrålevernRapport 2000:1, Norwegian Radiation ProtectionAuthority, Østerås. 102p.
Hameedi, M.J., D.W. Efurd, M.R. Harmon, N.J. Valette-Silver andA. Robertson, 1999. Levels and sources of radionuclides in sed-iment and biota of the eastern Bering Sea (US Arctic). In:Strand, P. and T. Jølle (eds.). Proceedings of the fourth Interna-tional Conference on Radioactive Contamination in the Arctic,Edinburgh, September 20-23, 1999, pp. 16-19.
Herrmann, J., H. Nies and I. Goroncy, 1998. Plutonium in the deeplayers of the Norwegian and Greenland Seas. Radiation Protec-tion Dosimetry, 75:237-245.
Hou, X.L., H. Dahlgaard and S.P. Nielsen, 2000a. Iodine-129 timeseries in Danish, Norwegian and northwest Greenland coastsand the Baltic Sea by seaweed. Estuarine, Coastal and Shelf Sci-ence, 51:571-578.
Hou, X.L., H. Dahlgaard, S.P. Nielsen and W.J. Ding, 2000b. Io-
AMAP Assessment 2002: Radioactivity in the Arctic94
dine-129 in human thyroid and seaweed in China. Science ofthe Total Environment, 246:285-291.
Hove, K., H. Lönsjö, I. Andersson, R. Sormunen-Cristian, H. Sol-heim Hansen, K. Indridason, H.P. Joensen, V. Kossila, A. Liken,S. Magnússon, S.P. Nielsen, A. Paasikallio, S.E. Pálsson, K.Rosén, T. Selnes, P. Strand and T. Vestergaard, 1994. Radiocae-sium transfer to grazing sheep in Nordic environments. In: H.Dahlgaard (ed.). Nordic Radioecology, the Transfer of Ra-dionuclides through Nordic Ecosystems to Man, pp. 211-227.Elsevier Science, Amsterdam.
Howard, B.J., 2000. The concept of radioecological sensitivity. Ra-diation Protection Dosimetry, 92:29-34.
HSE, 1988. The Tolerability of Risk from Nuclear Power Stations.U.K. Health and Safety Executive.
HSE, 1992. Safety Assessment Principles for Nuclear Plants. U.K.Health and Safety Executive.
HSE, 2000. The storage of liquid high level waste at BNFL, Sell-afield - an updated review of safety. U.K. Health and Safety Ex-ecutive.
Huizenga, D.G., 2001. Letter to Doug Dasher of ADEC Re: JointUS Department of Energy and US Air Force environmental as-sessment of the disposition of radioisotope thermoelectric gen-erators (DOE/EA-1351). March 28, 2001, 4p.
Hunt, G.J. and P.J. Kershaw, 1990. Remobilisation of artificial ra-dionuclides from the sediment of the Irish Sea. Journal of Radi-ological Protection, 10:147-151.
IAEA, 1976. Effects of Ionizing Radiation on Aquatic Organismsand Ecosystems. IAEA Technical Report No. 172. InternationalAtomic Energy Agency, Vienna.
IAEA, 1985. Sediment Kds and Concentration Factors for Radionu-clides in the Marine Environment. IAEA Technical Report No.247. International Atomic Energy Agency, Vienna. 73p.
IAEA, 1988. Assessing the Impact of Deep Sea Disposal of LowLevel Radioactive Waste on Living Marine Resources. IAEATechnical Report No. 288. International Atomic EnergyAgency, Vienna.
IAEA, 1992. Effects of Ionising Radiation on Plants and Animals atLevels implied by Current Radiation Protection Standards.IAEA Technical Report No. 332. International Atomic EnergyAgency, Vienna.
IAEA, 1997. Radionuclide release from marine reactors dumped inthe Kara Sea. International Arctic Seas Assessment Project.IAEA Technical Report No. 837, International Atomic EnergyAgency, Vienna.
IAEA, 1998a. Radiological conditions of the western Kara Sea. In-ternational Arctic Seas Assessment Project. International AtomicEnergy Agency, Vienna.
IAEA, 1998b. The Radiological Situation at the Atolls of Mururoaand Fangataufa. International Atomic Energy Agency, Vienna.
IAEA, 2000. Protection of the environment from the effects of ion-izing radiation: international perspectives, 29 August – 1 Sep-tember 2000, Vienna. Report of specialists meeting (reference:723-J9-SP-1114.2). International Atomic Energy Agency, Vi-enna.
IAEA, 2001. Severity, Probability and Risk of Accidents duringMaritime Transport of Radioactive Material: Final report of aco-ordinated research project, 1995-1999. IAEA Technical Re-port No. 1231. International Atomic Energy Agency, Vienna.
IAEA, 2002. Ethical Considerations in Protection of the Environ-ment from the Effects of Ionizing Radiation. IAEA Technicalreport No. 1270. International Atomic Energy Agency, Vienna.
ICRP, 1977. Recommendations of the International Commission onRadiological Protection. ICRP Publication No. 26. Annals ofthe ICRP, 1(3).
ICRP, 1991. Recommendations of the International Commission onRadiological Protection. ICRP Publication No. 60. Annals ofthe ICRP, 21(1-3).
ICRP, 1992. Principles for intervention for protection of the publicin a radiological emergency. International Commission on Ra-diological Protection, ICRP Publication No. 63. Annals of theICRP, 22(4).
ICRP, 1993. Age-dependent doses to members of the public fromintake of radionuclides: Part 2. Ingestion Dose Coefficients.ICRP Publication No. 67. Annals of the ICRP, 23(3-4).
Iosjpe, M., 2002. Box modeling approach for evaluation of influ-ence of ice transport of radionuclides for doses to man. In: E.
Ilus (ed.). Proceedings of the eighth Nordic Seminar on Radioe-cology. Finnish Radiation and Nuclear Safety Authority(STUK), Helsinki.
Iosjpe, M. and A. Borghuis, 2000. Box model improving. In: M.Iosjpe (ed.). Transport and Fate of Contaminants in the North-ern Seas. Norwegian Radiation Protection Authority, Østerås.pp. 2-31.
Iosjpe, M. and P. Strand, 1999. New approach for box modellingfor marine environment. In: Strand, P. and T. Jølle (eds.). Pro-ceedings of the fourth International Conference on Environ-mental Radioactivity in the Arctic. Edinburgh, 20-23 Septem-ber, 1999, pp. 63-66.
Iosjpe, M. and P. Strand (eds.), 2002. Radiological assessment ofconsequences from radioactive contamination of Arctic marineareas (ARCTICMAR), Final report. Contract IC 15-CT98-0209. Norwegian Radiation Protection Authority, Østerås.
Iosjpe, M., P. Strand and B. Salbu, 1997. Estimations of significanceof some processes for modelling of consequences from releasesin the Arctic Ocean. In: P. Strand (ed.). Proceedings of the thirdInternational Conference on Environmental Radioactivity inthe Arctic. Tromsø, June 1997, pp 74-75.
Iosjpe, M., J. Brown and P. Strand, 2002. Modified approach forbox modelling of radiological consequences from releases intothe marine environment. Journal of Environmental Radioactiv-ity, 60(1-2):91-103.
IUR, 2000. Doses and effects in non-human systems. InternationalUnion of Radioecology, Report No. 1.
Ivanov, A.V., G.A. Krasilov, V.A. Logachev, A.M. Matushchenkoand V.G. Safranov, 1997. The north testing site Novaya Zem-lya. Radioecological consequences of nuclear testing. State In-stitute of Applied Ecology, Moscow. In Russian.
Izrael, Yu.A., E.D. Stukin, S.V. Konstantinov, V.N. Soifer and A.V.Smetankin, 2000. Previous results of the radioecological expe-dition in the region of loss of the nuclear submarine ‘Kursk’. In:Proceedings of the International Conference on Radioactivityafter Nuclear Explosions and Accidents, pp. 24-25. Moscow,April 24-26, 2000.
JNC, 2000. H12: Project to establish the scientific and technicalbasis for HLW disposal in Japan. Project overview report.Japan Nuclear Cycle Development Institute (JNC), TN14102000-001.
Joensen, H.P., 1999. Long-term variation of radiocaesium in thefood chain of lamb in the Faroe Islands. Journal of Environ-mental Radioactivity, 46:345-360.
JNREG, 2001. EIA in Norway and Russia – report from the work-ing group on EIA systems in Norway and Russia. The JointNorwegian–Russian Commission on Environmental Protectionand the Ministry of Environment of Norway.
JNREG, 2002a. Long-term consequences of potential radioactivecontamination in the Northern areas: Northern Norway. JointNorwegian–Russian Expert Group on Radioactive Contamina-tion of the Northern Areas, Norwegian Radiation ProtectionAuthority, Østerås.
JNREG, 2002b. Long-term consequences of potential radioactivecontamination in the Northern areas: Murmansk region. JointNorwegian–Russian Expert Group on Radioactive Contamina-tion of the Northern Areas, Norwegian Radiation ProtectionAuthority, Østerås.
JNREG, 2002c. Long-term consequences of potential radioactivecontamination in the Northern areas: Summary report. JointNorwegian–Russian Expert Group on Radioactive Contamina-tion of the Northern Areas, Norwegian Radiation ProtectionAuthority, Østerås.
JNREG, 2003. Impacts on man and the environment in Ob Bay andthe Kara Sea resulting from hypothetical accidents at the‘Mayak’ production association, Urals, Russia. Joint Norwe-gian–Russian Expert Group on Radioactive Contamination ofthe Northern Areas, Norwegian Radiation Protection Author-ity, Østerås.
Karcher, M.J., S. Gerland, I.H. Harms, M. Iosjpe, H.E. Heldal andP.J. Kershaw, 2002. The dispersion of technetium-99 in theNordic Seas and the Arctic Ocean in the 1990s according tomodel results and observations. In: Børretzen, P., T. Jølle and P.Strand (eds.). Proceedings of the International Conference onRadioactivity in the Environment. Monaco, 1-5 September,2002, pp. 511-515.
References 95
Karcher, M.J., R..Gerdes, F. Kauker and C. Koeberle, 2003. Arcticwarming – evolution and spreading of the 1990s warm event inthe Nordic Seas and the Arctic Ocean. Journal of GeophysicalResearch, 108:C2,10.1029/2001JC001265.
Kershaw, P.J., D.S. Woodhead, M.B. Lovett and K.S. Leonard,1995. Plutonium from European reprocessing operations – Itsbehaviour in the marine environment. Applied Radiation Iso-topes, 46:1121-1134.
Kershaw, P.J., D.C. Denoon and D.S. Woodhead, 1999. Observa-tions on the redistribution of plutonium and americium in theIrish Sea sediments, 1978 to 1996: concentrations and invento-ries. Journal of Environmental Radioactivity, 44:191-221.
Khlopkin, N.S., V.V. Elatomtsev, B.G. Lystsov, B.G. Pologikh, Y.V.Sivintsev, A.S. Timonin and A.P. Zotov, 1997. Nuclear safetyassessment of stored afloat non-defuelled decommissioned nu-clear submarines. Report No. 31/8010, RRC Kurchatov Insti-tute. Norwegian Defence Research Establishment, Kjeller.
Knudsen, Sk.V., 1940. Ærnæringsekspedition til Færøerne 1936-37(Nutritional expedition to the Faroe Islands 1936-37). NytNordisk Forlag. In Danish.
Koblinger, L., 2000. Can we put aside the LNT dilemma by the in-troduction of the controllable dose? Journal of RadiologicalProtection, 20:5-8.
Kodyukov, V.M., N.A. Gorshkov, A.A. Pustovalov, Yu.A. Greben-shchikov, Yu.D. Gubanov, S.P. Lalykin, B.G. Maslennikov, A.D.Dolnik, V.I. Peresypkin and S.M. Mansurov, 1980. Applicationof radioisotope thermoelectric generators on the base of Sr-90for power supply of the systems of navigation, self-containedmeteorological and magnetic variation stations. Isotopes in theUSSR. Special issue: Materials of the science and technical con-ference: 30 years of production and application of isotopes inthe USSR, Obninsk, October 1978, No 59. State Committee ofthe USSR on application of atomic energy (Atomizdat), Mos-cow. pp. 80-89.
Kolehmainen, S., E. Häsänen and J.K. Miettinen, 1966. 137Cs levelsin fish of different limnological types of lake in Finland during1963. Health Physics, 12:917-922.
Kolehmainen, S., E. Häsänen and J.K. Miettinen, 1967. 137Cs infish, plankton and plants in Finnish lakes. In: Åberg B. and F.P.Hungate (eds.). Proceedings of the International Symposium onRadioecological Concentration Processes, pp. 913-919. Stock-holm, April 25-29, 1966.
Kolstad, A. and B. Lind, 2002. Radioactivity in the marine environ-ment 2000 and 2001. Technetium-99 concentrations in Norwe-gian coastal waters and biota. StrålevernRapport 2002:6. Nor-wegian Radiation Protection Authority, Østerås. 19p.
Kostiainen, E. and K. Rissanen, 2003. 137Cs and 90Sr in dairy andfarm milk in Finnish Lapland 1960-2000. In: V. Paile (ed.). Ra-diological Protection in the 2000s – Theory and Practice. Tur-ku, Finland, August 25-29, 2002. Nordic Society for RadiationProtection, Roskilde. pp. 493-497
Krey, P.W., E.P. Hardy, C. Pachucki, F. Rourke, J. Coluzza and W.K.Benson, 1976. Mass isotopic composition of global fall-out plu-tonium in soil. In: Transuranium Nuclides in the Environment,pp. 671-678. International Atomic Energy Agency, Vienna.
Kryshev, I.I. and E.P. Riazantsev, 2000. Ecological Safety of Nu-clear-energy Complex in Russia. IzdAT, Moscow.
Kudelsky, A.V., J.T. Smith, S.V. Ovsiannikova and J. Hilton, 1996.Mobility of Chernobyl-derived 137Cs in a peat bog systemwithin the catchment of the Pripyat River, Belarus. Science ofthe Total Environment, 188(2-3):101-113.
Kuhnlein, H.V., O. Receveur, H.M. Chan and E. Loring, 2000. As-sessment of dietary benefit/risk in Inuit communities. Centre forIndigenous Peoples Nutrition and Environment (CINE), McGillUniversity, and Inuit Tapirisat of Canada, Ottawa. 377p + App.
Kuznetsov, Yu.V., 1995. An assessment of the contribution by theEnisey and Ob into total radioactive contamination of the KaraSea. In: Strand P. and A. Cooke (eds.). Proceedings of the sec-ond International Conference on Environmental Radioactivityin the Arctic. Oslo, 21-25 August, 1995, pp. 72-74.
Lamp T. 1994. Power system assessment for the Burnt Mountainseismic observatory. Report #W1-TR-94-2026. Aeropropulsionand Power Directorate, Wright Patterson Air Force Base, OH,81p.
Larsen, E., Holo, E.N., Saltbones, J. and E. Stokke, 1999. Kola kon-sekvensanalyse, Vurdering av dosemessige konsekvenser av en
eventuell ulykke ved kjernekraftverk, StrålevernRapport 1999.No 10. Norwegian Radiation Protection Authority, Østerås. InNorwegian.
Lavkovsky, S.A., 1998. Project 101B-96. Review of the project andits preliminary results. In: Afterword to the ‘White Book’(Yablokov Commission), pp. 8-18. Proceedings of the Interna-tional Seminar, January 19-21, 1998. International Science andTechnology Center, CDB ‘Lazurit’ – Nizhni Novgorod.
Leonard, K.S., D. McCubbin, P. Blowers and B.R. Taylor, 1999.Dissolved plutonium and americium in surface waters of theIrish Sea, 1973-1996. Journal of Environmental Radioactivity,44:129-158.
Logachev, V.A. (ed.), 2000. Nuclear tests of the USSR: the NovayaZemlya testing site. Ensuring general and radiation safety ofnuclear tests. Facts, evidence, recollections. Federal Departmentof Medical and Biological and Extreme Problems at the Min-istry of Health of the Russian Federation, Moscow. 487p.
Lubenau, J.O. and D.J. Strom, 2002. Safety and security of radia-tion sources in the aftermath of 11 September 2001. HealthPhysics, 83(2):155-164.
Lysgaard, L. 1969. Foreløbig oversigt over klimaet på Færøerne.Hovedsagelig baseret på observationer i normalperioden 1931-60 og en del observationer fra et kortere åremål. Meddelelser.Danish Meteorological Institute, Copenhagen. In Danish.
Matishov, G.G., D.G. Matishov, A.E. Namjatov, J.N. Smith, J. Car-roll and S. Dahle, 2002. Radioactivity near the sunken subma-rine ‘Kursk’ in the southern Barents Sea. Environmental Science& Technology, 36:1919-1922.
Mayall, A., 2002. The regulation of technetium-99 discharges atSellafield. In: International Conference on Issues and Trends inRadioactive Waste Management, Vienna. December 9-13 2002.pp. 1-11.
Meili, M., A. Aldahan and G. Possnert, 2002. 129I in Arctic fresh-waters: local or global sources? In: Strand, P. and T. Jølle (eds.).Proceedings of the fifth International Conference on Radioac-tive Contamination in the Arctic and Antarctic. St Petersburg,16-20 June, 2002, pp. 62.
Miller, P. and N. Buske, 1996. Nuclear flashback: the return to Am-chitka. Report of a Greenpeace Scientific Expedition to Am-chitka Island, Alaska. Greenpeace.
Minzdrav, 1999. Norms of radiation safety (NRB-99). Hygienicregulations. Minzdrav of Russia, 1999, 116 p.
Mitchell, P.I., L.L. Vintro, H. Dahlgaard, C. Gasco and J.A. San-chezcabeza, 1997. Perturbation in the Pu-240/Pu-239 globalfallout ratio in local sediments following the nuclear accidentsat Thule (Greenland) and Palomares (Spain). Science of theTotal Environment, 202:147-153.
Moran, J.E., S. Oktay, P.H. Santschi and D.R. Schink, 1999. At-mospheric dispersal of 129iodine from nuclear fuel reprocessingfacilities. Environmental Science & Technology, 33:2536-2542.
Mortensen, L.E., 2002. Arctic mountain meteorology at the Sorn-felli mountain in year 2000 in the Faroe Islands. Annales Soci-etatis Scientiarum Færoensis (Fró∂skaparrit), Vol. 50.
NATO, 1998. Cross-border environmental problems emanatingfrom defense related installations and activities, Phase II: 1995-1998. Final Report. Vol. 4: Environmental risk assessment fortwo defense-related problems, Report No. 227. North AtlanticTreaty Organization.
NCRP, 1991. Effects of ionising radiation on aquatic organisms.NCRP Report No. 109. National Council on Radiation Protec-tion and Measurements, Bethesda.
NEFCO, 1996. Proposals for environmentally sound investmentprojects in the Russian part of the Barents Region, Volume 2:Radioactive contamination. The Nordic Environment FinanceCorporation, Barents Region Environmental Programme, PhaseI report, prepared by the AMAP Expert Group. AMAP, Oslo.41p
Noie, A., P.H. Park, Yu.S. Tsaturov and M.S. Baxter, 1997. Investi-gation of the environmental radioactivity in waste dumpingareas in the Northwest Pacific Ocean. Results from the secondstage Japanese-Korean-Russian joint expedition 1995. JointJapanese–Korean–Russian–IAEA Expert Group.
NRPA, 1993. A survey of artificial radionuclides in the Kara Sea.Results from the Russian-Norwegian 1992 expedition to theBarents and Kara seas. Norwegian Radiation Protection Au-thority, Østerås.
AMAP Assessment 2002: Radioactivity in the Arctic96
NRPA, 1996. Håndbok for atomberedskap i Norden. NorwegianRadiation Protection Authority, Østerås. In Norwegian.
NRPA, 1999. NRPA Bulletin, Seminar on waste treatment and dis-posal. StrålevernInfo, pp. 3-99. Norwegian Radiation Protec-tion Authority, Østerås.
NRPA, 2001. Support in the development of regulatory proceduresfor licensing Lepse waste management operations. Final Re-port. Norwegian Radiation Protection Authority, Østerås.
NRPA, 2002. The Norwegian assistance program for increased re-actor safety in Eastern Europe. StrålevernRapport 2002:3. Nor-wegian Radiation Protection Authority, Østerås.
Ølgaard, P., 2001. The potential risks from Russian nuclear ships.NKS-57. Nordic Society for Radiation Protection, Roskilde.
OSPAR, 1998. Report of the Ministerial Meeting of the OSPARCommission. Sintra, Portugal, 22-23 July, 1998. OSPAR Com-mission, London.
Paatero, J., T. Jaakkola and T.K. Ikäheimonen, 2002. Regional dis-tribution of Chernobyl-derived plutonium deposition in Fin-land. Journal of Radioanalytical and Nuclear Chemistry-Arti-cles, 252(2):407-412.
Pálsson, S.E., 1996. Fallout from atmospheric nuclear tests in thesixties. Review of data from Iceland. In: Proceedings of the sev-enth Nordic Seminar on Radioecology. Reykjavík, pp. 379-384.
Pálsson, S.E., B.J. Howard and S.M. Wright, 2002a. Optimisingmethods of averaging when using precipitation data to predictradionuclide deposition. In: Børretzen, P., T. Jølle and P. Strand(eds.). Proceedings of the International Conference on Radioac-tivity in the Environment, CD. Monaco, 1-5 September, 2002.
Pálsson, S.E., Ó. Arnalds, M.A. Sigurgeirsson, K. Gudnason, B.J.Howard, S.M. Wright and Th. Pálsdóttir, 2002b. Cs-137 fall-out inventories in Iceland – estimating deposition from precipi-tation data. Radioprotection, 37(C1):1223-1228.
Panteleyev, G.P., H.D. Livingston, F.L. Sayles and O.N. Medkova,1995. Deposition of plutonium isotopes and Cs-137 in sedi-ments of the Ob delta from the beginning of the nuclear age. In:Strand, P. and A. Cooke (eds.). Proceedings of the second Inter-national Conference on Environmental Radioactivity in theArctic. Oslo, pp. 57-64.
Pentreath, R.J., 1998. Radiological protection criteria for the natu-ral environment. Radiation Protection Dosimetry, 75:175-179.
Pentreath, R.J., 1999. A system for radiological protection of theenvironment: some initial thoughts and ideas. Journal of Radio-logical Protection, 19:117-128.
Pentreath, R.J. and D.S. Woodhead, 1988. Towards the develop-ment of criteria for the protection of marine fauna in relation tothe disposal of radioactive wastes into the sea. Radiation Pro-tection in Nuclear Energy, Vol. 2: 213-243. InternationalAtomic Energy Agency, Vienna.
Pfirman, S.L., H. Eicken, D. Bauch and W.F. Weeks, 1995. The po-tential transport of pollutants by Arctic sea ice. Science of theTotal Environment, 159(2-3):129-156.
Pfirman, S.L., J.W. Kogeler and I. Rigor, 1997. Potential for rapidtransport of contaminants from the Kara Sea. Science of theTotal Environment, 202:111-122.
Pollard, D., V. Smith., M. Fegan and J.D. Cunningham, 1998. Tech-netium-99 contamination in the Irish marine environment,1988-1998. Internal meeting document no. OSPAR 98/4/8,OSPAR Commission, London, 14p.
Poole, A.J., D.C. Denoon and D.S. Woodhead, 1997. The distribu-tion and inventory of 137Cs in sub-tidal sediments of the IrishSea. In: Guegueniat, P., P. Germain and H. Metivier (eds.). Pro-ceedings of the International Symposium on Radionuclides inthe Oceans, pp. 263-270. Cherbourg, 7-11 October, 1996.
Raisbeck, G.M. and F. Yiou, 1999. 129I in the oceans: origins andapplications. Science of the Total Environment, 237/238:31-41.
Rioseco, J.L., 1987. Technetium-99: radioanalytical and radioeco-logical studies. PhD. Thesis. Department of Radiation Physics,Lund University.
Rissanen, K. and T.K. Ikäheimonen, 2000. Cesium and plutoniumconcentrations in salmon caught in the river Teno (NorwegianSea) and in river Tornionjoki (Gulf of Bothnia). In: S.P. Nielsen(ed.). The Radiological Exposure to the Population of the Euro-pean Community to Radioactivity in the Baltic Sea, pp. 439-448. Commission of the European Communities, Luxembourg.
Rissanen, K, T. Rahola and E. Illukka, 1987. Radioactivity in plantsand foodstuffs in Lapland 1979-1986. Studies on Environmen-
tal Radioactivity in Finland in 1986. STUK-A55, June 1987.pp. 25-55.
Rissanen, K., D. Matishov and G.G. Matishov, 1995. Radioactivitylevels in Barents, Pechora, Kara, Laptev and White Seas. In:Strand, P. and A. Cooke (eds). Proceedings of the second Inter-national Conference on Environmental Radioactivity in theArctic. Oslo, 21-25 August, 1995. pp. 208-214.
Rissanen, K., T.K. Ikäheimonen, D. Matishov and G.G. Matishov,2000. Radioactivity levels in fish, benthic fauna, seals andseabirds collected in the northwest Arctic of Russia. Radiopro-tection – Colloques, 32(C2):323-331.
Rissanen, K., T.K. Ikäheimonen, J. Ylipieti, D.G. Matishov andG.G. Matishov, 2001. Plutonium in algae, sediments and biotain the Barents, Pechora and Kara Seas. In: Inaba, J., S. Hisa-matsu and Y. Ohtsuka (eds.). Distribution and Speciation ofRadionuclides in the Environment, pp. 107-114. Institute forEnvironmental Sciences, Aomori.
Rissanen, K., J. Ylipieti and Y. Norokorpi, 2002. 137Cs concentra-tions in mushrooms collected in 1989-2000 at different foreststands in Kivalo experimental area. In: S.E. Pálsson (ed.). Sum-maries of studies carried out in the NKS/BOK-2 project, Tech-nical Report, NKS-35. pp. 65-69.
Rose, K.S.B., 1992. Lower limits of radiosensitivity in organismsexcluding man. Journal of Environmental Radioactivity, 15:113-133.
Roshydromet, 1993. The Radiation Situation in the Territory ofRussia and Adjacent States in 1992. Annual book. K.P.Makhonko (ed.). Russian Federal Service for Hydrometeorol-ogy and Monitoring of the Environment (Roshydromet).
Roshydromet, 1998. The Radiation Situation in the Territory ofRussia and Adjacent Countries in 1997. K.P. Makhonko (ed.).Russian Federal Service for Hydrometeorology and Monitoringof the Environment (Roshydromet). Hydrometoizdat, St. Pe-tersburg.
Roshydromet, 2000. The Radiation Situation in the Territory ofRussia and Adjacent States in 1998. K.P. Makhonko (ed.).Russian Federal Service for Hydrometeorology and Monitoringof the Environment (Roshydromet). Hydrometoizdat, St. Pe-tersburg.
Roshydromet, 2001. The Radiation Situation in the Territory ofRussia and Adjacent States in 1999. K.P. Makhonko (ed.).Russian Federal Service for Hydrometeorology and Monitoringof the Environment (Roshydromet). Hydrometoizdat, St. Pe-tersburg.
RTCP, 1999. Long-term consequences of radioactive contaminationin the Northern Areas. Interim report from the fieldwork per-formed in 1998-1999 in co-operation with the Norwegian Ra-diation Protection Authority. M.I. Balonov (ed.). Research andTechnical Center ‘Protection’ (St. Petersburg).
RTCP, 2000. Long-term consequences of radioactive contaminationin the Northern Areas. Interim report from the fieldwork per-formed in 1990-2000 in co-operation with the Norwegian Ra-diation Protection Authority. M.I. Balonov (ed.). Research andTechnical Center ‘Protection’ (St. Petersburg).
Saltbones, J., A. Foss and J. Bartnicki, 1995. SNAP: Severe NuclearAccident Program. A Real Time Dispersion Model for MajorNuclear Emergency Management. DNMI Research report No.15. Det norske meteorologiske institutt, Oslo.
Saltbones, J., J. Bartnicki and A. Foss, 1997. Atmospheric Trans-port and Deposition from a Potential Accident at Kola NuclearPower Plant. Part 2: Worst Case Scenarios. DNMI Research re-port No. 56. Det norske meteorologiske institutt, Oslo.
Sarkisov, A.A., 1999. Radiological consequences of the radiationaccident on nuclear submarine in Chazhma Bay. In: Strand, P.and T. Jølle (eds.). Proceedings of the fourth International Con-ference on Environmental Radioactivity in the Arctic. Edin-burgh, 20-23 September, 1999, pp. 78-80.
Sayles, F.L., T.C. Kenna and H.D. Livingston, 1999. Release andtransport of artificial radionuclides from nuclear weapons re-lated activities in the Ob river, Siberia, over the course of thenuclear age. In: Proceedings of an International Symposium onMarine Pollution, pp. 565-567. Monaco, October 5-9, 1998.International Atomic Energy Agency, Vienna.
Saxen, R., 2003. Long-term behaviour of 90Sr and 137Cs in surfacewaters in Finland. In: V. Paile (ed.). Radiological Protection inthe 2000s – Theory and Practice. Turku, Finland, August 25-
References 97
29, 2002. Nordic Society for Radiation Protection, Roskilde.pp. 479-483.
Saxen, R. and E. Ilus, 2001. Discharge of Cs-137 and Sr-90 byFinnish rivers to the Baltic Sea in 1986-1996. Journal of Envi-ronmental Radioactivity, 54:275-291.
Schink, D.R., P.H. Santschi, O. Corapcioglu, P. Sharma and U.Fehn, 1995. 129I in Gulf of Mexico waters. Earth and PlanetaryScience Letters, 135:131-138.
Shutov, V.N., G.Ya. Bruk, I.G. Travnikova, M.I. Balonov, M.V.Kaduka, L.N. Basalaevam, L. Skuterud, H. Mehli and P. Strand,1999. The current radioactive contamination of the environ-ment and foodstuffs in the Kola region of Russia. In: Strand, P.and T. Jølle (eds.). Proceedings of the fourth International Con-ference on Radioactive Contamination in the Arctic, Edin-burgh, pp. 307-309.
Sigurgeirsson, M.Á., Ó. Arnalds, S.E. Pálsson, K. Gu∂nason andB.J. Howard, 2002. Behaviour of radiocaesium fallout in vol-canic soils in Iceland. The fifth International Conference on En-vironmental Radioactivity in the Arctic and Antarctic. St. Pe-tersburg, pp. 294-296.
Sivintsev, Yu and O. Kiknadze, 1998. Components of nuclear reac-tors dumped in the Kara Sea and the Sea of Japan, and assess-ment of radionuclides contained in them. In: Afterword to the‘White Book’ (Yablokov Commission), pp. 172-181. Proceed-ings of the International Seminar, January 19-21, 1998. Interna-tional Science and Technology Center, CDB ‘Lazurit’- NizhniNovgorod.
Sivintsev, Yu.V., V.L. Vyotsky and V.A. Danilyan, 1994. Radiologi-cal impact of radiation accident on nuclear submarine inChazhma Bay. Atomic Energy, 76:158-160.
Skuterud, L., L.D. Blytt, S. Borghuis, P. Strand and B. Howard,1999. Assessment of relative importance of food productionsystems in Europe – A first approach. Technical deliverablefrom the project ‘Spatial analysis of vulnerable ecosystems inEurope (SAVE)’. EC Contract FI14-CT95-0015. NorwegianRadiation Protection Authority, Østerås..
Smith, G. and A. Amundsen, 2002. Overview of Norwegian bilat-eral initiatives on environmental protection and nuclear safetyin north west Russia. In: Strand, P. and T. Jølle (eds.). Proceed-ings of the fifth International Conference on Radioactive Cont-amination in the Arctic and Antarctic. St Petersburg, 16-20June, 2002. pp. 141.
Smith, J.N., K.M. Ellis and L.R. Kilius, 1998. 129I and 137Cs tracermeasurements in the Arctic Ocean. Deep-Sea Research I, 45:959-984.
Smith, J.N., K.M. Ellis and T. Boyd, 1999. Circulation features inthe central Arctic Ocean revealed by nuclear fuel reprocessingtracers from Scientific Ice Expeditions 1995 and 1996. Journalof Geophysical Research, 104:29663-29667.
Smith, V., M. Fegan, D. Pollard, S. Long, E. Hayden and T.P. Ryan,2001. Technetium-99 in the Irish marine environment. Journalof Environmental Radioactivity, 56:269-284.
Sneve, M.K., C. Bergman, M. Westerlind, I. Sokolova and V.Markarov, 2001. Phase 1 of the regulatory Lepse project: proj-ect report. StrålevernRapport 2001:4. Norwegian RadiationProtection Authority, Østerås. 121p.
State of Alaska and Aleutian/Pribilof Island Association, 2001.White Paper: radiological assessment and long-term steward-ship, Amchitka Island, Alaska, underground nuclear test area.Alaska Department of Environmental Conservation, 5p.
Stokke, E., 1997. Kola nuclear power plant. Consequence assess-ment for hypothetical severe accidents. Source term assessment.Research report. IFE/HR/F-97/1088. Institute for Energy Tech-nology, Halden.
Strand, P., 2002. Protection of the environment and radioecology.In: Børretzen, P., T. Jølle and P. Strand (eds.). Proceedings of theInternational Conference on Radioactivity in the Environment.Monaco, 1-5 September, 2002, pp. 17-21.
Strand, P. and D.H. Oughton, 2002. Radiation protection in the21st century: Ethical, philosophical and environmental issues.Consensus conference on protection of the environment fromionising radiation. Norwegian Radiation Protection Authorityand Agricultural University of Norway.
Strand, P., M. Sickel, A. Aarkrog, J.M. Bewers, Y. Tsaturov and S.Magnusson, 1996. Radioactive contamination of the Arcticmarine environment. In: Radionuclides in the Oceans. Inputs
and Inventories, pp. 96-119. Institut de Protection et de SûretéNucléaire, Cherbourg.
Strand, P., A.I. Nikitin, B. Lind, B. Salbu and G.C. Christensen,1997. Dumping of radioactive waste and investigation of ra-dioactive contamination in the Kara sea. Results from 3 yearsof investigations (1992-1994) in the Kara Sea. Joint Norwe-gian-Russian Expert Group for investigation of radioactive con-tamination in the northern areas. Norwegian Radiation Protec-tion Authority, Østerås.
Strand, P., J.E. Brown, D.S. Woodhead and C-M. Larsson, 2000.Delivering a system and framework for the protection of the en-vironment from ionising radiation. In: Proceedings of the tenthInternational Congress of the International Radiation Protec-tion Association. Hiroshima. (CD Publication).
Strand, P., N. Beresford, R. Avila, S. Jones and C-M. Larsson, 2001.Identification of candidate reference organisms from a radia-tion exposure pathways perspective. Deliverable of the FASSETproject. Swedish Radiation Protection Institute, Stockholm.
Strand, P., B.J. Howard, A. Aarkrog, M. Balonov, Y. Tsaturov, J.M.Bewers, A. Salo, M. Sickel, and K. Rissanen, 2002. Radioactivecontamination in the Arctic – sources, dose assessment and po-tential risks. Journal of Environmental Radioactivity, 60:5-21.
STUK, 1983. Studies on environmental radioactivity in Finland1982. Annual Report. Report STL-A47. Finnish Radiation andNuclear Safety Authority (STUK), Helsinki.
STUK, 1992. Limitation of public exposure in the environment ofand limitation of radioactive releases from nuclear power plants(YVL 7). Finnish Radiation and Nuclear Safety Authority(STUK), Helsinki.
STUK, 1998. Compliance with the general regulations for the safetyof nuclear power plants (Decision 395/1991) – The Loviisaplant (STUK-B-YTO 179) and the Olkiluoto plant (STUK-B-YTO 180). Finnish Radiation and Nuclear Safety Authority(STUK), Helsinki.
STUK, 2000. Finnish support programme for nuclear safety:progress report biannual summary 2000. Finnish Radiation andNuclear Safety Authority (STUK), Helsinki. 57p + Ann.
Tossavainen, K. (ed.), 1998. Regulatory control of nuclear safety inFinland. Annual report 1997. STUK-B-YTO 175. Finnish Radi-ation and Nuclear Safety Authority (STUK), Helsinki.
Tossavainen, K. (ed.), 1999. Regulatory control of nuclear safety inFinland. Annual report 1998. STUK-B-YTO 192. Finnish Radi-ation and Nuclear Safety Authority (STUK), Helsinki.
Tossavainen, K. (ed.), 2000. Regulatory control of nuclear safety inFinland. Annual report 1999. STUK-B-YTO 202. Finnish Radi-ation and Nuclear Safety Authority (STUK), Helsinki.
Tossavainen, K. (ed.) 2001. Regulatory control of nuclear safety inFinland. Annual report 2000. STUK-B-YTO 216. Finnish Radi-ation and Nuclear Safety Authority (STUK), Helsinki.
Tossavainen, K. (ed.), 2002. Regulatory control of nuclear safety inFinland. Annual report 2001. STUK-B-YTO 216. Finnish Radi-ation and Nuclear Safety Authority (STUK), Helsinki. 43p. +App. 22p.
Turvey, F.J. and C. Hone, 2000. Storage of Liquid High-level Ra-dioactive Waste at Sellafield. Radiation Protection Institute ofIreland, Report RPII-00/3.
UNCED, 1992. Report of the United Nations Conference on Envi-ronment and Development. Rio Declaration on Environmentand Development. United Nations, New York.
UNSCEAR, 1996. Effects of radiation on the environment. Annex1. In: Sources and Effects of Ionizing Radiation. UNSCEAR1996 Report to the United Nations General Assembly. UnitedNations Scientific Committee on the Effects of Atomic Radia-tion.
UNSCEAR, 2000. Sources and Effects of Ionizing Radiation,United Nations Scientific Committee on the Effects of AtomicRadiation UNSCEAR 2000 Report to the United Nations Gen-eral Assembly with scientific annexes. Volume I: Sources.
Uranium Institute, 1998. Technetium-99 discharges from Sellafield.Internal meeting document No. OSPAR 98/4/NGO.2. OSPARCommission, London, 11p.
U.S. Air Force, 1970. Project Crested Ice. USAF Nuclear Safety,65:1-97.
U.S. Air Force, 1999. Environmental assessment for the BurntMountain seismic array power supply. 354 CES/CEVP, EielsonAir Force Base, Alaska.
AMAP Assessment 2002: Radioactivity in the Arctic98
U.S. Congress, 1994. Power sources for remote Arctic applications.OTA-BP-ETI-129. Office of Technology Assessment, Washing-ton DC.
U.S. DOE, 2002. DOE Standard. A graded approach for evaluatingradiation doses to aquatic and terrestrial biota. DOE STD-1153-2002. U.S. Department of Energy, Washington DC.
U.S.S.R. Goshydromet, 1991. The radiation situation in the terri-tory of Russia and adjacent states in 1990. K.P. Makhonko(ed.). SPA Typhoon, Obninsk.
Vakulovsky, S.M., 1993. Transport of artificial radioactivity by theOb to the Arctic Seas. In: Strand, P. and E. Holm (eds.). Pro-ceedings of the International Conference on Environmental Ra-dioactivity in the Arctic and Antarctic. Kirkenes, 23-27 August,1993, pp. 107-110.
Vakulovsky, S.M., I.I. Kryshev, A.I. Nikitin, Yu.V. Savitsky, S.V.Malyshev and E.G. Tertyshnik, 1995. Radioactive contamina-tion of the Yenisei River. Journal of Environmental Radioactiv-ity, 29(3):225-236.
Van Oostdam, J., A. Gilman, E. Dewailly, P. Usher, B. Wheatley, H.Kuhnlein, S. Neve, J. Walker, B. Tracy, M. Feeley, V. Jerome andB. Kwavnick, 1999. Human health implications of environmen-tal contaminants in Arctic Canada: a review. Science of theTotal Environment, 230:1-82.
Ve∂ráttan, 1959-1983. [A general reference to Ve∂ráttan – amonthly journal of the Icelandic Meteorological Office, Reyk-javik].
Vestergaard, T. and P. Zachariassen, 1987. Fø∂slukanning 1981-82(Nutritional investigation 1981-82). Annales Societatis Scien-tiarum Færoensis (Fró∂skaparrit), vol. 33. In Faroese.
Vintró, L.L., C.A. McMahon, P.I. Mitchell, D. Josefson, E. Holmand P. Roos, 2002. Transport of plutonium in surface and sub-surface waters from the Arctic shelf to the North Pole via theLomonosov Ridge. Journal of Environmental Radioactivity,60(1-2):73-89.
Webb, G., 2002. International approaches to prevention of and re-sponse to radiological terrorism. Forty-seventh Annual meetingof the Health Physics Society, abstracts of papers presented atthe meeting. Health Physics, 82(6):S146.
Weeks, W., 1994. Possible roles of sea ice in the transport of haz-ardous material. Arctic Research of the United States, 8:34-52.
Wheatcraft, S.W., 1995. Sea water intrusion model of Amchitka Is-land, Alaska. U.S. Department of Energy, Report#DOE/NV/10845-59.
WISE-Paris, 2001a. Possible toxic effects from the nuclear repro-cessing plants at Sellafield (UK) and Cap de La Hague (France).Final report for STOA (European Parliament Scientific andTechnical Options Assessment). August 2001.
WISE-Paris, 2001b. Airliner crash on nuclear facilities – the Sell-afield case. WISE-Paris. October 2001.
Wright, S.M., B.J. Howard, P. Strand, T. Nylén and M.A.K. Sickel,1999. Prediction of 137Cs deposition from atmospheric nuclearweapons tests within the Arctic. Environmental Pollution, 104:131-143.
Yablokov, (ed.), 1993. Facts and Problems Related to RadioactiveWaste Disposal in Seas Adjacent to the Territory of the RussianFederation. (‘Yablokov’ Report’). In Russian (Report of theGovernmental Commission, Moscow). In English (Albu-querque, Small World Publishers), 82 p.
Yiou, F., G.M. Raisbeck, Z.Q. Zhou, L.R. Kilius and P.J. Kershaw,1995. Improved estimates of oceanic discharges of 129I from Sel-lafield and la Hague. In: Strand, P. and A. Cooke (eds.). Pro-ceedings of the second International Conference on Environ-mental Radioactivity in the Arctic, pp 113-116. Oslo, August21-25, 1995.
Yiou, F., G.M. Raisbeck, G.C. Christensen and E. Holm, 2002.129I/127I, 129I/137Cs and 129I/99Tc in the Norwegian coastal cur-rent from 1980 to 1998. Journal of Environmental Radioactiv-ity, 60:61-71.
References 99
Abbreviations
AMAP . . . . . . Arctic Monitoring and Assessment Programme
AO . . . . . . . . Autonomous OkrugBAT . . . . . . . Best available technologyBNFL . . . . . . British Nuclear FuelsCCI. . . . . . . . Common cause initiatorCEG . . . . . . . (IAEA) Contact Expert GroupCFSU . . . . . . . central former Soviet UnionCMF . . . . . . . Core Melt FrequencyCOSR . . . . . . Continued Operation Safety ReportDNA . . . . . . . Deoxyribonucleic aciddw . . . . . . . . dry weight (basis of determination)EARP. . . . . . . Enhanced Actinide Removal PlantEC . . . . . . . . European CommissionEIA . . . . . . . . Environmental impact assessmentEMAS . . . . . . (EC) Eco-Management and Audit
SchemeEPIC . . . . . . . Environmental Protection from Ion-
ising Contaminants in the Arctic(project)
EU . . . . . . . . European UnionFASSET. . . . . . Framework for Assessment of
Environmental Impact (project)HAL . . . . . . . Highly Active LiquorHSE . . . . . . . (U.K.) Health and Safety ExecutiveIAEA . . . . . . . (UN) International Atomic Energy
AgencyIASAP. . . . . . . International Arctic Seas Assessment
ProjectICRP . . . . . . . International Commission on Radio-
logical ProtectionIMO . . . . . . . (UN) International Maritime Organ-
izationINES . . . . . . . International Nuclear Event ScaleIUR. . . . . . . . International Union of Radioecol-
ogistsJNREG . . . . . . Joint Norwegian–Russian Expert
Group on Environmental Coop-eration
KMCIC . . . . . Krasnoyarsk Mining and Chemical Industrial Complex
LOCA . . . . . . Loss of coolant accidentsNAO . . . . . . . Nenets Autonomous OkrugNATO . . . . . . North Atlantic Treaty OrganizationNEFCO. . . . . . Nordic Environment Finance Cor-
porationNPP. . . . . . . . Nuclear power plantNRPA . . . . . . Norwegian Radiation Protection
AuthorityOSPAR . . . . . . Oslo and Paris CommissionsRHS . . . . . . . Radioisotopic heat sourceRPII . . . . . . . Radiation Protection Institute of
Ireland
RTG . . . . . . . Radioisotope thermoelectric generator
SCC . . . . . . . Siberian Chemical CombineSD . . . . . . . . Standard deviationSIPEX . . . . . . Site Ion-Exchange Effluent PlantSTUK. . . . . . . Finnish Radiation and Nuclear
Safety AuthorityTag . . . . . . . . Aggregated transfer coefficient
(see Box 3.2)Tec . . . . . . . . Ecological half-life (see Box 3.1)Teff . . . . . . . . Effective ecological half-life
(see Box 3.1)TNT . . . . . . . trinitrotolueneU.K. . . . . . . . United KingdomUNSCEAR . . . . United Nations Scientific Commit-
tee on the Effects of Atomic Radi-ation
US DOE . . . . . United States Department of Energyww . . . . . . . . wet weight (or fresh weight)
(basis of determination)
Main radionuclides discussed
Am . . . . . . . . AmericiumCs . . . . . . . . Cesium, caesiumI . . . . . . . . . IodinePu . . . . . . . . PlutoniumSr . . . . . . . . . StrontiumTc . . . . . . . . TechnetiumU . . . . . . . . . Uranium
Prefixes
µ . . . . . . . . . micro-, 10–6, e.g. µSvG . . . . . . . . . giga-, 109, e.g. Gwk . . . . . . . . . kilo-, 103, e.g. kt, kBqm . . . . . . . . . milli-, 10–3, e.g. mBqM . . . . . . . . mega-, 106, e.g. Mt, MW, MBqP . . . . . . . . . peta-, 1015, e.g. PBqT . . . . . . . . . tera-, 1012, e.g. TBq
Units
Bq . . . . . . . . BecquerelCi . . . . . . . . Curied . . . . . . . . . day(s)Gy . . . . . . . . Grayh . . . . . . . . . hour(s)Mt . . . . . . . . MegatonMW(e) . . . . . . Megawatt (electrical energy)MW(th) . . . . . Megawatt (thermal energy)Sv. . . . . . . . . Sievertt . . . . . . . . . tonne (1000 kg)yr . . . . . . . . . year(s)
AMAP Assessment 2002: Radioactivity in the Arctic100
Glossary –––––––––––––––––––––––––––––––––––––––––––––––––––––––––––––––––––––––––––––––––––––––––
Recommended


