IOSR Journal of Mechanical and Civil Engineering (IOSR-JMCE)
e-ISSN : 2278-1684, p-ISSN : 2320–334X
PP 40 -49
www.iosrjournals.org
Innovation in engineering science and technology (NCIEST-2015) 40 | Page
JSPM’S Rajarshi Shahu College Of Engineering,Pune-33,Maharashtra ,India
Analysis and Design of 220 kV Transmission Line Tower
(A conventional method of analysis and Indian Code based
Design)
D.B.Sonowal1 , J.D.Bharali
2, M.K.Agarwalla
3, N. Sarma
4, P. Hazarika
5
Department of Civil Engineering. Tezpur University, Napaam 784028, Assam, India
*Corresponding author: Email: [email protected], Phone: +91-3712-275962
Abstract: Transmission line tower constitute about 28 to 42 percent of the cost of the transmission power line
project. The increasing demand for electricity can be made more economical by developing different light
weight configuration of transmission line tower. In this study an attempt is made to model, analyse and design a
220KV transmission line tower using manual calculations. The tower is designed in wind zone – V with base
width 1/5th
of total height of the tower. This objective is made by choosing a 220 KV single circuit transmission
line carried by square base self-supporting tower with a view to optimize the existing geometry and then
analysis of the tower has been carried out as a 2-D structure. Structure is made determinate by excluding the
horizontal members and axial forces are calculated using method of joints and design is carried out as per IS
800:2007.
Keywords: Transmission towers, Geometry of tower, Self-supporting tower, Configuration oftower, unit load,
method of joint, deflection, design.
I. INTRODUCTION: India has a large population residing all over the country and the electricity supply need of this
population creates requirement of large transmission and distribution system. Also, the disposition of the
primary resources for electrical power generation viz., coal, hydro potential is quite uneven, thus again adding to
the transmission requirements. Transmission line is an integrated system consisting of conductor subsystem,
ground wire subsystem and one subsystem for each category of support structure. Mechanical support of
transmission line represents a significant portion of the cost of the line and they play an important role in the
reliable power transmission. They are designed and constructed in wide variety of shapes, types, sizes,
configuration and materials. The supporting structure types used in transmission line generally fall into one of
the three categories: lattice, pole and guyed.
The supports of high voltage transmission lines are normally steel lattice towers. The cost of tower
constitutes about quarter to half of the cost of transmission line and hence optimum tower design will bring in
substantial savings. The selection of an optimum outline together with right type of bracing system contributes
to a large extent in developing an economical design of transmission line tower. The height of tower is fixed by
the user and the structural designer has the task of designing the general configuration and member and joint
details. In this paper, the sag tension calculation is carried for conductor and ground wire using parabolic
equation. Then different loading format including normal condition, top conductor broken, earth wire broken
condition is evaluated.The wind loading is calculated on the longitudinal face of the towers and then two
dimensional analysis of the tower is carried outand accordingly the design is completed for different members.
II. Transmission Line Components: 2.1. Transmission Line Tower
The following parameters for transmission line and its components are assumed from I.S. 802: Part 1:
Sec: 1:1995, I.S. 5613: Part 2: Sec: 1:1989.
Transmission Line Voltage: 220 kV (A. / C.) No. of Circuits: Single Circuit
Right of Way (recommended): 35, 000 mm Tower Configuration: Vertical Conductor
Configuration
Angle of Line Deviation: 0 to 2 degrees Bracing Pattern: Pratt system
Terrain Type Considered: Plain Cross Arm: Pointed
IOSR Journal of Mechanical and Civil Engineering (IOSR-JMCE)
e-ISSN : 2278-1684, p-ISSN : 2320–334X
PP 40 -49
www.iosrjournals.org
Innovation in engineering science and technology (NCIEST-2015) 41 | Page
JSPM’S Rajarshi Shahu College Of Engineering,Pune-33,Maharashtra ,India
Terrain Category: 2 (Normal cross country lines
with very few obstacles)
Inclination of the tower legs: 70 (with vertical)
Return Period: 50 years Shielding Angle: 30°
Wind Zone: 5 Insulator Type: I String
Basic Wind Speed: 50 m/s Number of Insulator Discs: 15
Design Wind Pressure: 793 N/sqm Size of Insulator Disc: 255 × 145 mm (Skirt
Diameter)
Tower Type: Self-Supporting, Type “A” Length of Insulator String: 2,500 mm
Tower Geometry: Square Base Tower Creep Effect: Not Considered
2.2. Conductor
A substance or a material which allows the electric current to pass through its body when it is subjected
to a difference of electric potential is known as Conductor. The properties of the conductor considered here are
tabulated in Table1.
Table 1: Conductor mechanical and electrical properties.
Conductor material ACSR
Code name Panther
Conductor size 30/7/3.00 mm
Area of the conductor (for all strands), A 2.6155 cm2
Overall diameter of the conductor (d) 21 mm
Weight of the conductor (w) 0.973 kg/m
Bearing strength of the conductor (UTS) 9130 kg
Coefficient of linear expansion (α) 17.73 × 10⁻⁶
/˚C
Modulus of elasticity Final (E1) 0.787 × 10⁶kgf/cm
2
Modulus of elasticity Initial (E2) 0.626 × 10⁶kgf/cm
2
2.3. Earthwire
The earthwire is used for protection against direct lightning strokes and the high voltage surges
resulting there from. There will be one or two earthwire depending upon the shielding angle or protection angle.
The earthwire considered for transmission line has the following properties as mentioned in Table 2.
Table 2: Earthwire mechanical and electrical properties
Material of earthwire Galvanized steel
No of earthwire one
Stranding/wire diameter 7/3.15mm
Total sectional area 54.55mm2
Overall diameter 9.45 mm
Approximate weight 428kg/km
Calculated D.C. resistance at 20˚C 3.375ohm/km
Mini UTS 5710 kg
Modulus of elasticity 19361 kg/mm2
Coefficient of linear expansion 11.50 × 10⁻⁶
/˚C
Maximum allowable temperature 53˚C
2.4. Insulator Strings
Insulators are devices used in the electrical system to support the conductors or to support the
conductors carrying at given voltages.The insulators separate thecurrent carrying conductors of a transmission
line from their support structures to prevent the flow of current through the structure to ground and to provide
necessary mechanical support to the conductors at a safer height above the ground level.
IOSR Journal of Mechanical and Civil Engineering (IOSR-JMCE)
e-ISSN : 2278-1684, p-ISSN : 2320–334X
PP 40 -49
www.iosrjournals.org
Innovation in engineering science and technology (NCIEST-2015) 42 | Page
JSPM’S Rajarshi Shahu College Of Engineering,Pune-33,Maharashtra ,India
III. Sag tension for conductor and ground wire: Indian standard codes of practice for use of structural steel in over-head transmission line towers have
prescribed following conditions for the sagtension calculations for the conductor and the ground wire:
Maximum temperature (75°C for ASCR and 53°C for ground wire) with design wind pressure (0% and
36%).
Every day temperature (32°C) and design wind pressure (100%, 75% and 0%).
Minimum temperature (0°C) with design wind pressure (0% and 36%).
IS 802: part 1:sec 1: 1995 states that conductor/ ground wire tension at every day temperature and without
external load should not exceed 25 % (up to 220 kV) for conductors and 20% for ground wires oftheir ultimate
tensile strength. Sag tensions are calculated by using the parabolic equations as discussed in the I.S. 5613: Part
2: Sec: 1: 1989 for both the conductor and ground wire. In this paper, the consideration of the sag of ground
wire as 90% the sag of the conductor at 0°C and 100% wind condition. The sag tension values are mentioned in
the Table 3.
3.1. Parabolic Equation
(F2 – (K – α.t.E)) = (1)
Take, K = F1 - (2)
Table 3. Sag tension for conductor (ASCR)
Temperature variation°C 0 32 75
Wind variation % 0 0. 36 0 0.75 1.0 0
Tension (kg) 2282.5 3733.0 3246.24 3108.30 3416.27 2367.23
All tension values are giving F.O.S < 4.
So, we consider the minimum tension(tension for F.O.S = 4.) to find the maximum sagging in all condition.
So, sagging = = = 5.46m
By increasing 4% of calculated sag we get= 5.46 × 4%= 5.70 m.
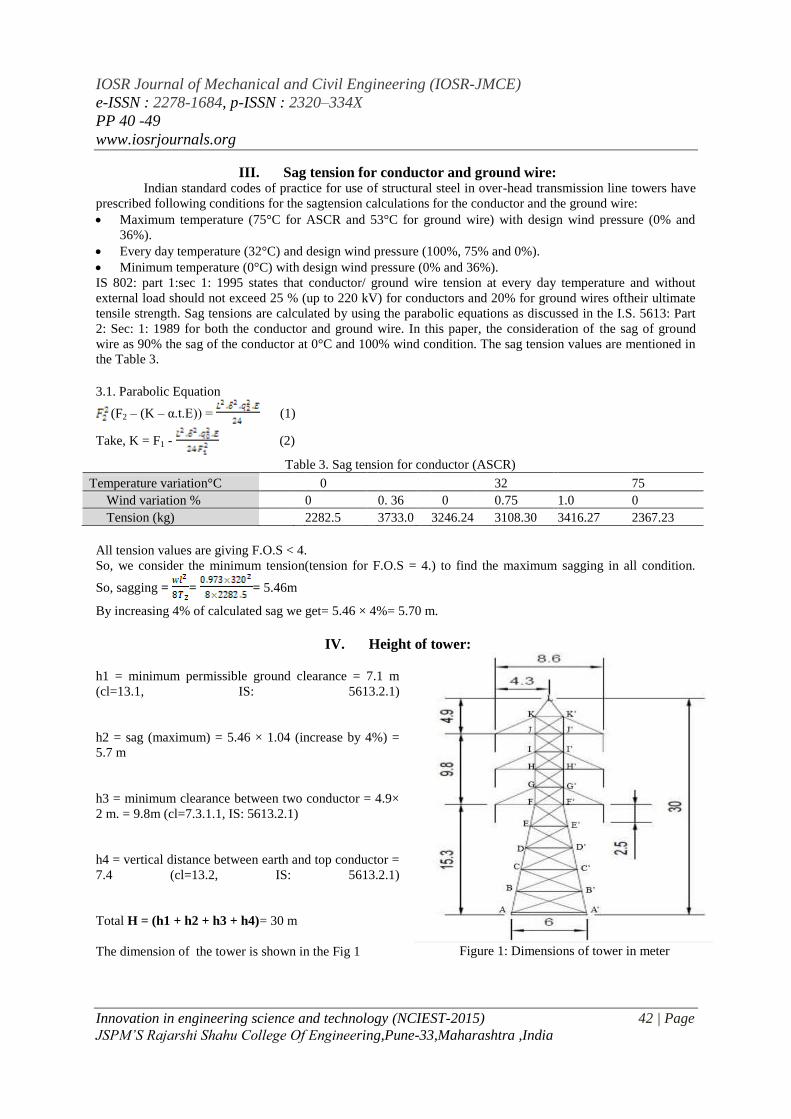
IV. Height of tower:
h1 = minimum permissible ground clearance = 7.1 m
(cl=13.1, IS: 5613.2.1)
h2 = sag (maximum) = 5.46 × 1.04 (increase by 4%) =
5.7 m
h3 = minimum clearance between two conductor = 4.9×
2 m. = 9.8m (cl=7.3.1.1, IS: 5613.2.1)
h4 = vertical distance between earth and top conductor =
7.4 (cl=13.2, IS: 5613.2.1)
Total H = (h1 + h2 + h3 + h4)= 30 m
The dimension of the tower is shown in the Fig 1
Figure 1: Dimensions of tower in meter
IOSR Journal of Mechanical and Civil Engineering (IOSR-JMCE)
e-ISSN : 2278-1684, p-ISSN : 2320–334X
PP 40 -49
www.iosrjournals.org
Innovation in engineering science and technology (NCIEST-2015) 43 | Page
JSPM’S Rajarshi Shahu College Of Engineering,Pune-33,Maharashtra ,India
V. Wind loads on tower: Wind loads on all the towers are calculated separately by developing excel programs by following
Indian Standards. For finding the drag coefficients for the members of triangular tower, the solidity ratio is
derived from Table 30 –IS-875 (part 3)-1987 in the similar fashion as prescribed in the IS- 826 (part-1/sec 1)-
1995.
5.1. Design Wind Pressure
To calculate design wind pressure on conductor, ground wire, insulator and panels:Pd=0.6× Vd2 (3)
Where,Pd = design wind pressure in N/m2
Vd = design wind speed in m/s
To calculate design wind pressure ,Vd = VR× K1×K2 (4)
VR = 10min wind speed (or) reduced wind speed
VR = Vb/k0 (5)
Vb = basic wind speed
K0 =1.375 [conversion factor]
K1 = risk coefficient
K2 = terrain roughness coefficient.
5.2. Wind Loads on Conductor/Ground Wire
To calculate wind loads on conductor and ground wire, Fwc= Pd×Cdc×L×D×GC (6)
Fwc = wind load on conductor
Pd = design wind pressure
Cdc = drag coefficient for ground wire=1.2 drag coefficient for conductor = 1.0
L = wind span
d = diameter of conductor/ground wire
Gc = gust response.
5.3. Wind Load on Insulator
To calculate wind load on insulator, Fw=Pd×Cdi×AI×GI (7)
where,AI = 50% area of insulator projected parallel to the longitudinal axis of string
GI = gust response factor for insulator
Cdi = drag coefficient, to be taken as 1.2150 mm
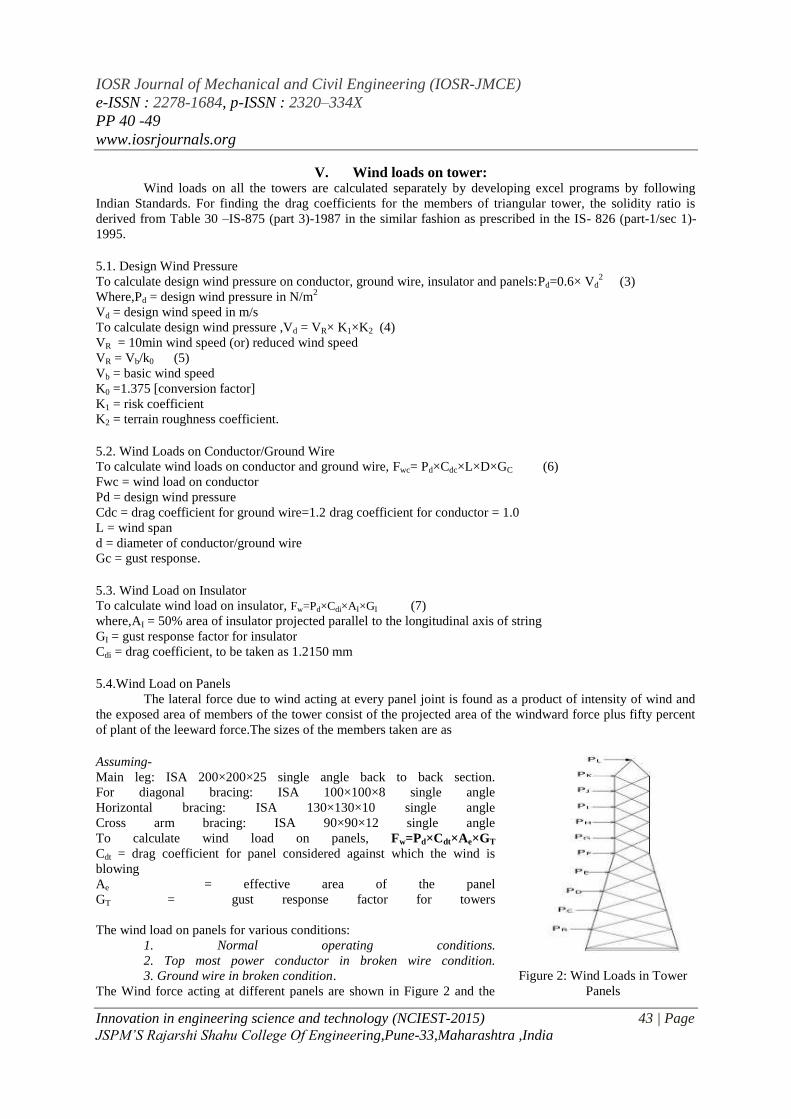
5.4.Wind Load on Panels
The lateral force due to wind acting at every panel joint is found as a product of intensity of wind and
the exposed area of members of the tower consist of the projected area of the windward force plus fifty percent
of plant of the leeward force.The sizes of the members taken are as
Assuming-
Main leg: ISA 200×200×25 single angle back to back section.
For diagonal bracing: ISA 100×100×8 single angle
Horizontal bracing: ISA 130×130×10 single angle
Cross arm bracing: ISA 90×90×12 single angle
To calculate wind load on panels, Fw=Pd×Cdt×Ae×GT
Cdt = drag coefficient for panel considered against which the wind is
blowing
Ae = effective area of the panel
GT = gust response factor for towers
The wind load on panels for various conditions:
1. Normal operating conditions.
2. Top most power conductor in broken wire condition.
3. Ground wire in broken condition.
The Wind force acting at different panels are shown in Figure 2 and the
Figure 2: Wind Loads in Tower
Panels
IOSR Journal of Mechanical and Civil Engineering (IOSR-JMCE)
e-ISSN : 2278-1684, p-ISSN : 2320–334X
PP 40 -49
www.iosrjournals.org
Innovation in engineering science and technology (NCIEST-2015) 44 | Page
JSPM’S Rajarshi Shahu College Of Engineering,Pune-33,Maharashtra ,India
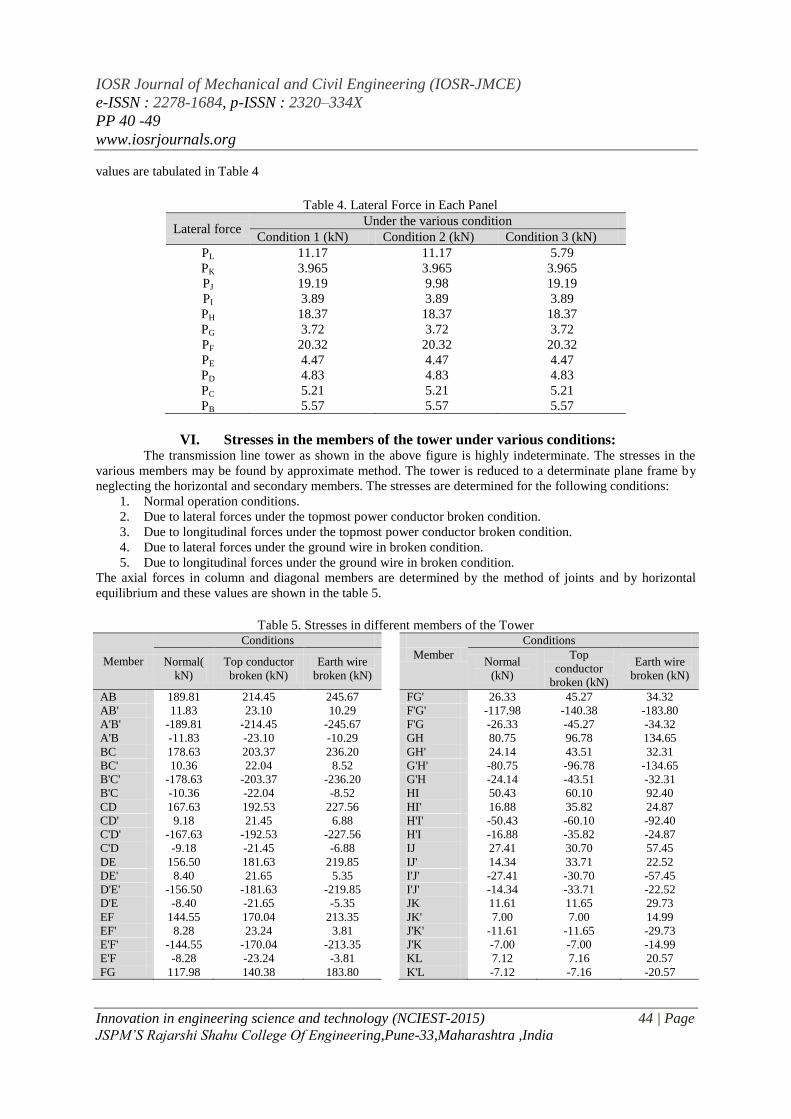
values are tabulated in Table 4
Table 4. Lateral Force in Each Panel
Lateral force Under the various condition
Condition 1 (kN) Condition 2 (kN) Condition 3 (kN)
PL 11.17 11.17 5.79
PK 3.965 3.965 3.965
PJ 19.19 9.98 19.19
PI 3.89 3.89 3.89
PH 18.37 18.37 18.37
PG 3.72 3.72 3.72
PF 20.32 20.32 20.32
PE 4.47 4.47 4.47
PD 4.83 4.83 4.83
PC 5.21 5.21 5.21
PB 5.57 5.57 5.57
VI. Stresses in the members of the tower under various conditions: The transmission line tower as shown in the above figure is highly indeterminate. The stresses in the
various members may be found by approximate method. The tower is reduced to a determinate plane frame by
neglecting the horizontal and secondary members. The stresses are determined for the following conditions:
1. Normal operation conditions.
2. Due to lateral forces under the topmost power conductor broken condition.
3. Due to longitudinal forces under the topmost power conductor broken condition.
4. Due to lateral forces under the ground wire in broken condition.
5. Due to longitudinal forces under the ground wire in broken condition.
The axial forces in column and diagonal members are determined by the method of joints and by horizontal
equilibrium and these values are shown in the table 5.
Table 5. Stresses in different members of the Tower
Member
Conditions Conditions
Normal(
kN)
Top conductor
broken (kN)
Earth wire
broken (kN)
Member Normal
(kN)
Top
conductor
broken (kN)
Earth wire
broken (kN)
AB 189.81 214.45 245.67 FG' 26.33 45.27 34.32
AB' 11.83 23.10 10.29 F'G' -117.98 -140.38 -183.80
A'B' -189.81 -214.45 -245.67 F'G -26.33 -45.27 -34.32
A'B -11.83 -23.10 -10.29 GH 80.75 96.78 134.65
BC 178.63 203.37 236.20 GH' 24.14 43.51 32.31
BC' 10.36 22.04 8.52 G'H' -80.75 -96.78 -134.65
B'C' -178.63 -203.37 -236.20 G'H -24.14 -43.51 -32.31
B'C -10.36 -22.04 -8.52 HI 50.43 60.10 92.40
CD 167.63 192.53 227.56 HI' 16.88 35.82 24.87
CD' 9.18 21.45 6.88 H'I' -50.43 -60.10 -92.40
C'D' -167.63 -192.53 -227.56 H'I -16.88 -35.82 -24.87
C'D -9.18 -21.45 -6.88 IJ 27.41 30.70 57.45
DE 156.50 181.63 219.85 IJ' 14.34 33.71 22.52
DE' 8.40 21.65 5.35 I'J' -27.41 -30.70 -57.45
D'E' -156.50 -181.63 -219.85 I'J' -14.34 -33.71 -22.52
D'E -8.40 -21.65 -5.35 JK 11.61 11.65 29.73
EF 144.55 170.04 213.35 JK' 7.00 7.00 14.99
EF' 8.28 23.24 3.81 J'K' -11.61 -11.65 -29.73
E'F' -144.55 -170.04 -213.35 J'K -7.00 -7.00 -14.99
E'F -8.28 -23.24 -3.81 KL 7.12 7.16 20.57
FG 117.98 140.38 183.80 K'L -7.12 -7.16 -20.57
IOSR Journal of Mechanical and Civil Engineering (IOSR-JMCE)
e-ISSN : 2278-1684, p-ISSN : 2320–334X
PP 40 -49
www.iosrjournals.org
Innovation in engineering science and technology (NCIEST-2015) 45 | Page
JSPM’S Rajarshi Shahu College Of Engineering,Pune-33,Maharashtra ,India
Note: The positive value shown indicates tension and the negative value shown indicates compression for the
various members of the tower and greater value under different conditions are highlighted.
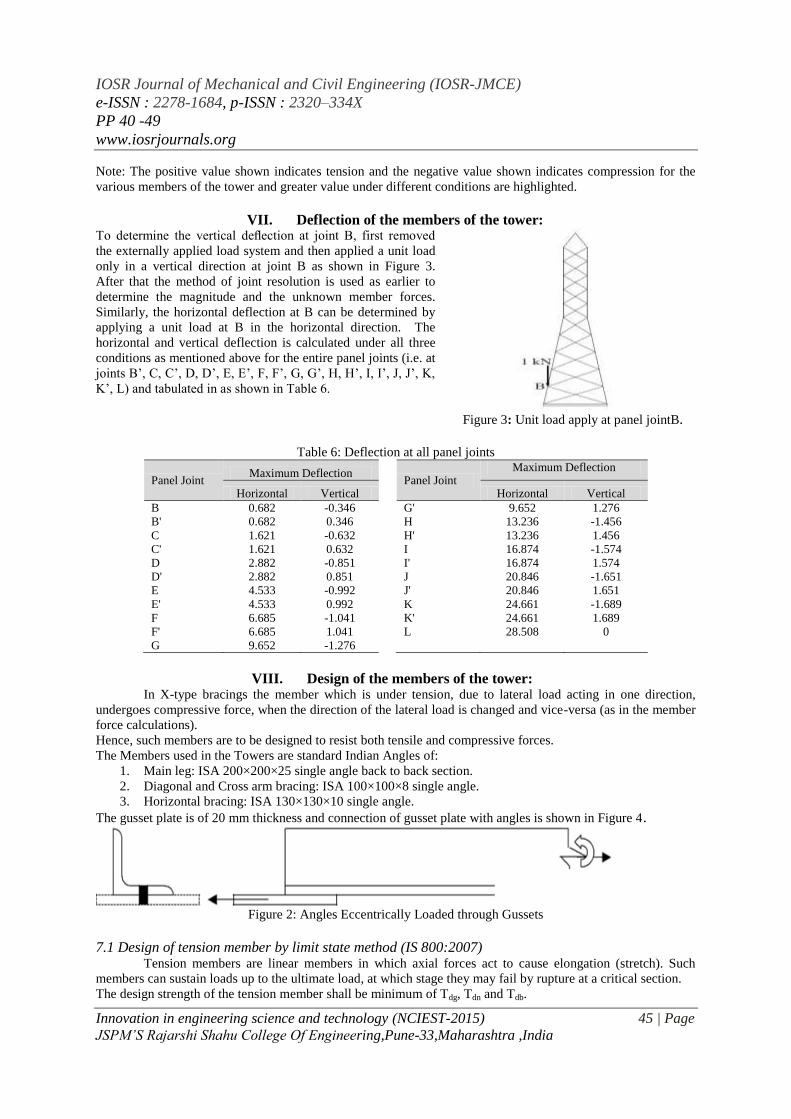
VII. Deflection of the members of the tower: To determine the vertical deflection at joint B, first removed
the externally applied load system and then applied a unit load
only in a vertical direction at joint B as shown in Figure 3.
After that the method of joint resolution is used as earlier to
determine the magnitude and the unknown member forces.
Similarly, the horizontal deflection at B can be determined by
applying a unit load at B in the horizontal direction. The
horizontal and vertical deflection is calculated under all three
conditions as mentioned above for the entire panel joints (i.e. at
joints B’, C, C’, D, D’, E, E’, F, F’, G, G’, H, H’, I, I’, J, J’, K,
K’, L) and tabulated in as shown in Table 6.
Figure 3: Unit load apply at panel jointB.
Table 6: Deflection at all panel joints
Panel Joint Maximum Deflection
Panel Joint
Maximum Deflection
Horizontal Vertical
Horizontal Vertical
B 0.682 -0.346 G' 9.652 1.276
B' 0.682 0.346 H 13.236 -1.456
C 1.621 -0.632 H' 13.236 1.456
C' 1.621 0.632 I 16.874 -1.574
D 2.882 -0.851 I' 16.874 1.574
D' 2.882 0.851 J 20.846 -1.651
E 4.533 -0.992 J' 20.846 1.651
E' 4.533 0.992 K 24.661 -1.689
F 6.685 -1.041 K' 24.661 1.689
F' 6.685 1.041 L 28.508 0
G 9.652 -1.276
VIII. Design of the members of the tower: In X-type bracings the member which is under tension, due to lateral load acting in one direction,
undergoes compressive force, when the direction of the lateral load is changed and vice-versa (as in the member
force calculations).
Hence, such members are to be designed to resist both tensile and compressive forces.
The Members used in the Towers are standard Indian Angles of:
1. Main leg: ISA 200×200×25 single angle back to back section.
2. Diagonal and Cross arm bracing: ISA 100×100×8 single angle.
3. Horizontal bracing: ISA 130×130×10 single angle.
The gusset plate is of 20 mm thickness and connection of gusset plate with angles is shown in Figure 4.
Figure 2: Angles Eccentrically Loaded through Gussets
7.1 Design of tension member by limit state method (IS 800:2007) Tension members are linear members in which axial forces act to cause elongation (stretch). Such
members can sustain loads up to the ultimate load, at which stage they may fail by rupture at a critical section.
The design strength of the tension member shall be minimum of Tdg, Tdn and Tdb.
IOSR Journal of Mechanical and Civil Engineering (IOSR-JMCE)
e-ISSN : 2278-1684, p-ISSN : 2320–334X
PP 40 -49
www.iosrjournals.org
Innovation in engineering science and technology (NCIEST-2015) 46 | Page
JSPM’S Rajarshi Shahu College Of Engineering,Pune-33,Maharashtra ,India
7.1.1 Strength Due To Yielding of Gross Section
The design strength in the member under axial tension is given by:
Tdg = fy Ag/ γmo, where
γmo = the partial safety factor for failure in tension by yielding. The value of γmo according to IS800:2007 is
1.10.
7.1.2 Design Strength Due To Rupture of Critical Section
Tension rupture of the plate at the net cross-section is given by:
Tdn = 0.9fuAn / γml, where
γml = the partial safety factor against ultimate tension failure by rupture (γml = 1.25)
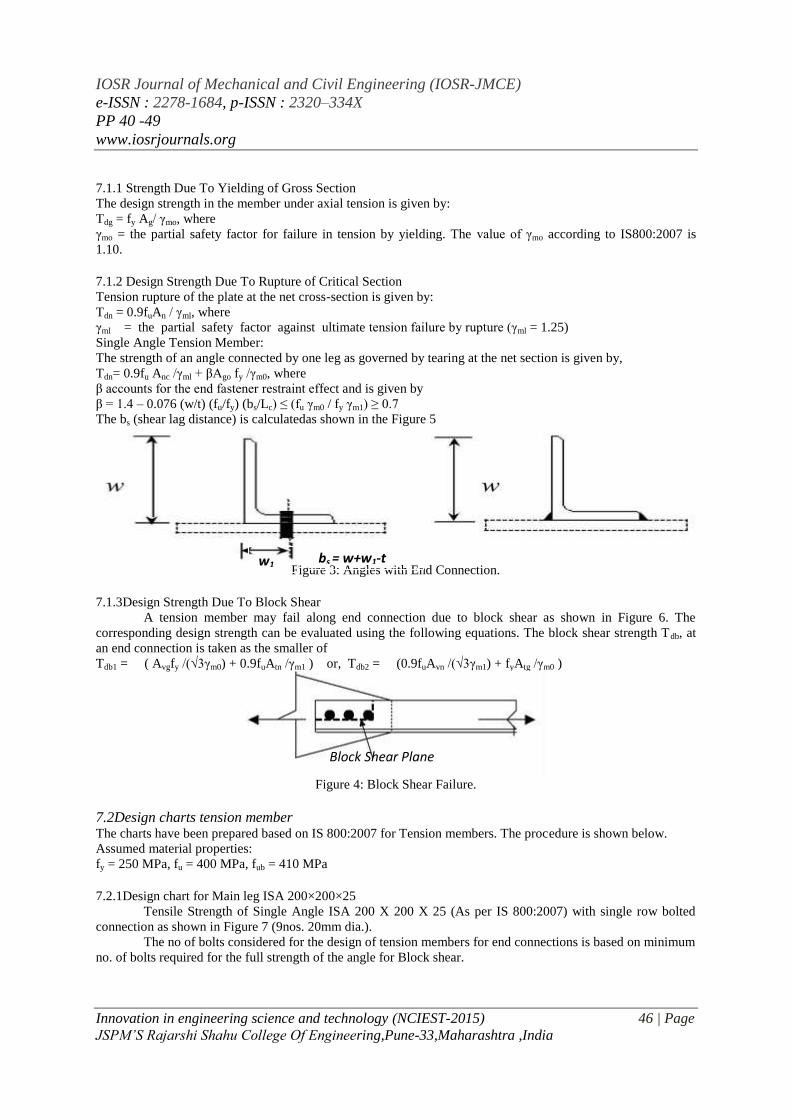
Single Angle Tension Member:
The strength of an angle connected by one leg as governed by tearing at the net section is given by,
Tdn= 0.9fu Anc /γml + βAgo fy /γm0, where
β accounts for the end fastener restraint effect and is given by
β = 1.4 – 0.076 (w/t) (fu/fy) (bs/Lc) ≤ (fu γm0 / fy γm1) ≥ 0.7
The bs (shear lag distance) is calculatedas shown in the Figure 5
Figure 3: Angles with End Connection.
7.1.3Design Strength Due To Block Shear
A tension member may fail along end connection due to block shear as shown in Figure 6. The
corresponding design strength can be evaluated using the following equations. The block shear strength Tdb, at
an end connection is taken as the smaller of
Tdb1 = ( Avgfy /(√3γm0) + 0.9fuAtn /γm1 ) or, Tdb2 = (0.9fuAvn /(√3γm1) + fyAtg /γm0 )
Figure 4: Block Shear Failure.
7.2Design charts tension member The charts have been prepared based on IS 800:2007 for Tension members. The procedure is shown below.
Assumed material properties:
fy = 250 MPa, fu = 400 MPa, fub = 410 MPa
7.2.1Design chart for Main leg ISA 200×200×25
Tensile Strength of Single Angle ISA 200 X 200 X 25 (As per IS 800:2007) with single row bolted
connection as shown in Figure 7 (9nos. 20mm dia.).
The no of bolts considered for the design of tension members for end connections is based on minimum
no. of bolts required for the full strength of the angle for Block shear.
w1
Block Shear Plane
bs = w+w1-t
IOSR Journal of Mechanical and Civil Engineering (IOSR-JMCE)
e-ISSN : 2278-1684, p-ISSN : 2320–334X
PP 40 -49
www.iosrjournals.org
Innovation in engineering science and technology (NCIEST-2015) 47 | Page
JSPM’S Rajarshi Shahu College Of Engineering,Pune-33,Maharashtra ,India
Figure 7: Design Details of leg member (All Dimensions are in mm).
Design strength due to yielding of gross section
Tdg = fy Ag/ γmo
Ag= 9380 mm2 (from steel table), γm0 = 1.1
Tdg= 250×9380/1.1 = 2131.818 kN
7.2.1.1 Design Strength due to rupture of critical section
e = 40 mm, p = 60 mm
Tdn= 0.9fu Anc /γml + βAgo fy /γm0
Anc = (200 – 22 – 25/2) ×25 = 4137.5 mm2
Ago = (200 – 25/2) ×25 = 4687.5 mm2
β = 1.4 – 0.076 (w/t) (fu/fy) (bs/Lc) ≤ (fu γm0 / fy γm1) ≥ 0.7
Lc = 60×8 = 480, bs = 200+140-25 = 315
β = 1.4 – 0.076(200/25) (250/410) ((315)/480) = 1.156 (> 0.7)
1.156 < (fu γm0 / fy γm1) = (410×1.1)/ (250×1.25) = 1.44
Therefore, Tdn= (0.9×4137.5×410)/1.25 + (1.15×4687.5×250)/1.1 = 2446.5 kN
7.2.1.2 Design strength due to block shear
The block shear strength Tdb, at an end connection is taken as the smaller of
Tdb1 = ( Avgfy /(√3γm0) + 0.9fuAtn /γm1 ) or, Tdb2 = (0.9fuAvn /(√3γm1) + fyAtg /γm0 )
Avg = (40+60×8) ×25 = 13000 mm2
Avn = (40+60×8-22×7.5) ×25 = 8325 mm2
Atg = (60×25) = 1500 mm2
Atn = (60-0.5×22) ×25 = 1225 mm2
Tdb1 = ((13000×250)/ (√3×1.1)) + ((0.9×1225×410)/1.25) = 2067 kN
Or, Tdb2 = ((0.9×8325×410)/ (√3×1.25)) + ((1500×250)/1.1) = 1759 kN
Therefore, the block shear strength is Tdb = 1759 kN
Now, Strength of the single angle Tension member should be least of the above three values (i.e. 2131.81 kN,
2446.5 kN and 1759 kN) which is equal to 1759 kN.
As per our calculation we get that the maximum tension force is in the leg member of the ground panel which is
245.67 kN i.e. factored load = 245.67×1.5 = 368.5 kN is lesser than the above three values. Therefore our design
is safe for maximum tension.
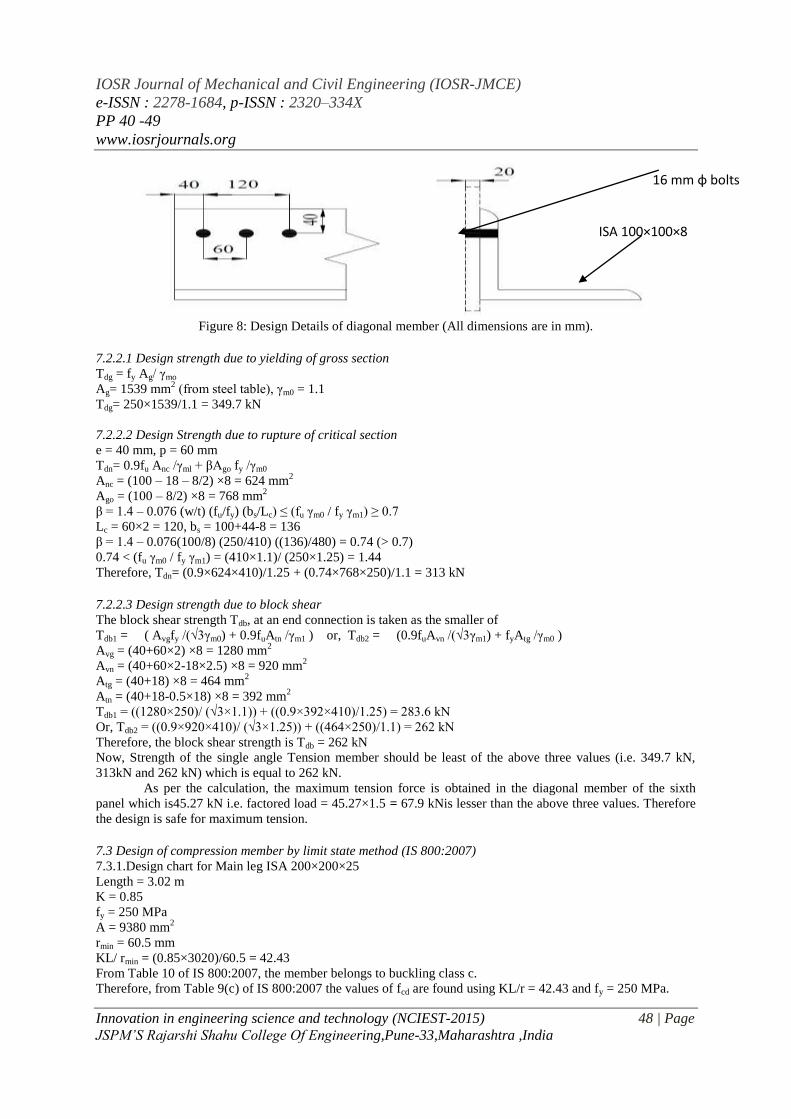
7.2.2 Design chart for Diagonal member ISA 100×100×8
Tensile Strength of Single Angle ISA 100 X 100 X 8 (As per IS 800:2007) with single row bolted
connection as shown in Figure 8 (3nos 16mm dia.).
The no of bolts considered for the design of tension members for end connections is based on minimum
no. of bolts required for the full strength of the angle for Block shear.
ISA 200×200×25
20 mm φ bolts
IOSR Journal of Mechanical and Civil Engineering (IOSR-JMCE)
e-ISSN : 2278-1684, p-ISSN : 2320–334X
PP 40 -49
www.iosrjournals.org
Innovation in engineering science and technology (NCIEST-2015) 48 | Page
JSPM’S Rajarshi Shahu College Of Engineering,Pune-33,Maharashtra ,India
Figure 8: Design Details of diagonal member (All dimensions are in mm).
7.2.2.1 Design strength due to yielding of gross section
Tdg = fy Ag/ γmo
Ag= 1539 mm2 (from steel table), γm0 = 1.1
Tdg= 250×1539/1.1 = 349.7 kN
7.2.2.2 Design Strength due to rupture of critical section
e = 40 mm, p = 60 mm
Tdn= 0.9fu Anc /γml + βAgo fy /γm0
Anc = (100 – 18 – 8/2) ×8 = 624 mm2
Ago = (100 – 8/2) ×8 = 768 mm2
β = 1.4 – 0.076 (w/t) (fu/fy) (bs/Lc) ≤ (fu γm0 / fy γm1) ≥ 0.7
Lc = 60×2 = 120, bs = 100+44-8 = 136
β = 1.4 – 0.076(100/8) (250/410) ((136)/480) = 0.74 (> 0.7)
0.74 < (fu γm0 / fy γm1) = (410×1.1)/ (250×1.25) = 1.44
Therefore, Tdn= (0.9×624×410)/1.25 + (0.74×768×250)/1.1 = 313 kN
7.2.2.3 Design strength due to block shear
The block shear strength Tdb, at an end connection is taken as the smaller of
Tdb1 = ( Avgfy /(√3γm0) + 0.9fuAtn /γm1 ) or, Tdb2 = (0.9fuAvn /(√3γm1) + fyAtg /γm0 )
Avg = (40+60×2) ×8 = 1280 mm2
Avn = (40+60×2-18×2.5) ×8 = 920 mm2
Atg = (40+18) ×8 = 464 mm2
Atn = (40+18-0.5×18) ×8 = 392 mm2
Tdb1 = ((1280×250)/ (√3×1.1)) + ((0.9×392×410)/1.25) = 283.6 kN
Or, Tdb2 = ((0.9×920×410)/ (√3×1.25)) + ((464×250)/1.1) = 262 kN
Therefore, the block shear strength is Tdb = 262 kN
Now, Strength of the single angle Tension member should be least of the above three values (i.e. 349.7 kN,
313kN and 262 kN) which is equal to 262 kN.
As per the calculation, the maximum tension force is obtained in the diagonal member of the sixth
panel which is45.27 kN i.e. factored load = 45.27×1.5 = 67.9 kNis lesser than the above three values. Therefore
the design is safe for maximum tension.
7.3 Design of compression member by limit state method (IS 800:2007)
7.3.1.Design chart for Main leg ISA 200×200×25 Length = 3.02 m
K = 0.85
fy = 250 MPa
A = 9380 mm2
rmin = 60.5 mm
KL/ rmin = (0.85×3020)/60.5 = 42.43
From Table 10 of IS 800:2007, the member belongs to buckling class c.
Therefore, from Table 9(c) of IS 800:2007 the values of fcd are found using KL/r = 42.43 and fy = 250 MPa.
ISA 100×100×8
16 mm φ bolts
IOSR Journal of Mechanical and Civil Engineering (IOSR-JMCE)
e-ISSN : 2278-1684, p-ISSN : 2320–334X
PP 40 -49
www.iosrjournals.org
Innovation in engineering science and technology (NCIEST-2015) 49 | Page
JSPM’S Rajarshi Shahu College Of Engineering,Pune-33,Maharashtra ,India
Here,
For, KL/r = 40 => fcd = 198 MPa
KL/r = 50 => fcd = 183 MPa
Therefore, for KL/r = 42.43
fcd = 194.35 N/mm2
Thus, strength of the angle as column
Pd = A× fcd = 9380×194.35 = 1823050 N = 1823 kN
Working load = 1823/1.5 = 1215 kN > 245.67 kN
Therefore, the section is safe for maximum compressive force.
IX. CONCLUSIONS The transmission line tower is a statically indeterminate structure and the manual analysis of such a
structure is very complex. A rigorous analysis considering three dimensional space actions is quite difficult. The
development and application of computer analysis opened up a new and practically unlimited possibilities for
the exact solution of these statically indeterminate structures with precise statically analysis of their three
dimensional performance. However the adopted method of analysis presented in this paper considering linear
behavior with two dimensional approaches gives satisfactory results which should be further verified with
advanced software like STAAD Pro, Ansys etc. As per the design concern all section we consider are found safe
against worst condition. In summary, the study presented here would certainly useful for Design Engineers
basically for the new learners for better understanding the behaviors and the method of analysis and design of
the transmission tower as per Indian Standard Codes of practice in a very simple and easy manner.
REFERENCES [1]. Ch. Sudheer; K. Rajashekar; P. Padmanabha Reddy; Y. Bhargava Gopi Krishna, (2013) Analysis And Design Of 220kv
Transmission Line Tower In Different Zones I & V With Different Base Widths- A comparative Study, ISSN 2347-4289.
[2]. C. Preeti; K. Jagan Mohan, (2013) Analysis of Transmission Towers with Different Configurations, Jordan Journal of Civil
Engineering, Volume 7, No. 4. [3]. Gopi Sudam Punse, (2014) Analysis and Design of Transmission Tower, International Journal of Modern Engineering Research,
ISSN: 2249-6645.
[4]. Ram Chandra, (2008) Design of Steel Structures-2, Standard Publishers (India). [5]. A.S. Arya; J.L. Ajmani, (Fifth Edition) Design of Steel Structures, Nem Chand & Bros, Roorkee
[6]. S.S. Bhavikatti, (2009) Design of Steel Structures, International Publishing House Pvt. Ltd.
[7]. IS 802 (Part1/ Sec1): 1995 Use Of Structural Steel in Overhead Transmission Line Towers - Code of Practice (Part 1 Materials, Loads and Permissible Stresses Sec 1 Materials and Loads).
[8]. IS 5613 (Part2/ Sec1): 1985 Code of Practice for Design, Installation and Maintenance of Overhead Power Lines (Part 2 Lines
above 11kv and up to and including 220kv Sec 1 Design). [9]. IS 5613 (Part1/ Sec1): 1985 Code of Practice for Design, Installation and Maintenance of Overhead Power Lines (Part 1 Lines up to
and including 11kv Sec 1 Design).
[10]. I.S 800: 2007 General Constructions in Steel - Code of Practice.
Recommended
![Producent Nazwa projektu Moc MVA Napięcie I AC [kV] Napięcie II AC [kV] Napięcie DC](https://img.pdfslide.net/doc/110x75/6319c9dcbc8291e22e0f4526/producent-nazwa-projektu-moc-mva-napiecie-i-ac-kv-napiecie-ii-ac-kv-napiecie.jpg)


