Rural Finance Development Project (RRP BHU 53307)
Bhutan Development Bank
Institutional Strengthening Plan
TABLE OF CONTENTS
TABLE OF CONTENTS ..................................................................................................................... I
TABLES ........................................................................................................................................ II
FIGURES ...................................................................................................................................... IV
PREFACE AND DISCLAIMER ........................................................................................................... V
ABBREVIATIONS .......................................................................................................................... VI
EXECUTIVE SUMMARY ................................................................................................................. 1
1 BHUTAN ................................................................................................................................. 2
2 BACKGROUND, SUMMARY DATA AND FINANCIAL HIGHLIGHTS ............................................... 6
3 STRATEGIC PLANNING ............................................................................................................ 7
4 GOVERNANCE ...................................................................................................................... 10
5 ORGANIZATIONAL STRUCTURE ............................................................................................. 13
6 HUMAN RESOURCES ............................................................................................................. 15
7 INFORMATION TECHNOLOGY ............................................................................................... 19
8 INTERNAL AUDIT .................................................................................................................. 21
9 RISK MANAGEMENT ............................................................................................................. 25
10 PRODUCTS ........................................................................................................................... 26
11 COMMUNITY CENTERS ......................................................................................................... 40
12 CREDIT ................................................................................................................................ 41
13 FINANCIAL AND OPERATIONAL PERFORMANCE ..................................................................... 51
14 BDB INSTITUTIONAL STRENGTHENING/FINANCIAL STRENGTHENING PLAN - KEY ACTIONS ..... 59
ii
15 POLICY MATRIX BHUTAN RURAL FINANCE SECTOR DEVELOPMENT PROGRAM ............... ERROR!
BOOKMARK NOT DEFINED.
16 BHUTAN DEVELOPMENT BANK OPERATIONAL INSTITUTIONAL STRENGTHENING PLAN KEY
PERFORMANCE TARGETS ........................................................................................................... 67
ANNEX I – MEETING PARTICIPANTS ............................................................................................ 68
ANNEX II - FINANCIAL RATIOS DEFINITION .................................................................................. 69
ANNEX III – BDB FINANCIAL PROJECTIONS .................................................................................. 70
ANNEX IV – INDICATIVE TERMS OF REFERENCE DEPUTY CEO IN CHARGE OF CREDIT OPERATIONS 74
ANNEX V – BDB MANAGEMENT COMMENTS .............................................................................. 76
TABLES
Table 1 - Financial Sector. Evolution of Main Figures and Indicators .................................... 2
Table 2 - Bhutan Banking Sector – Financial Highlights by Bank .......................................... 3
Table 3 - Loan Classification - RMA Regulation .................................................................... 4
Table 4 - BDB Summary Data and Financial Highlights ........................................................ 6
Table 5 - 2015-2019 Business Plan Targets vs Actual ........................................................ 10
Table 6 - Personnel Number and Turnover ......................................................................... 15
Table 7 - Cases of Fraud in the Last Five Years ................................................................. 23
Table 8 - Savings Accounts Interest Rate 2019................................................................... 26
Table 9 - Bhutan Banks Savings Account Interest Rate December 2019 ............................ 26
Table 10 - BDB and Competitors Individual Term Deposit Rates as of December 2019 ...... 27
Table 11 – BDB and Competitors Corporate Term Deposit Rates. December 2019 ............ 27
Table 12 - List of Loan Products – Total Gross Loan Outstanding ...................................... 31
Table 13 – Main Products – Term and Rates ...................................................................... 32
Table 14 - Grace Period Criteria ......................................................................................... 32
Table 15 - Summary Data on Selected Loan Products as of June 30, 2019 ........................ 34
Table 16 - Group Guarantee Lending Accounts - June 2019 ............................................... 35
Table 17 - Loan Classification by Size ................................................................................ 35
Table 18 - Loan Segmentation by Size - June 2019 ............................................................ 36
Table 19 - Loan Interest Rates Across Banks – June 2019 ................................................. 37
Table 20 - Loans by Size and Product Type ........................................................................ 38
Table 21 - Portfolio Quality Evolution – Summary ............................................................... 41
Table 22 - Branches with Largest NPLs as of June 2019 .................................................... 44
Table 23 – Indicative Write Off Exercise of Legacy Loan Losses – June 2019 .................... 46
Table 24 – Loan Approval Limits ......................................................................................... 48
Table 25 - NPL by Approval Segment Sanctioned Loans – June 2019 ............................... 48
Table 26 - BDB Ratio Benchmarking with Countries in South and East Asia ....................... 53
Table 27 - BDB Benchmarking with Rural Banks in East Asia and the Pacific ..................... 54
Table 28 - BDB Balance Sheets .......................................................................................... 55
Table 29 – BDB Income Statements ................................................................................... 55

iii
Table 30 – BDB Ratios Evolution ........................................................................................ 56
Table 31 – BDB Status Quo Scenario assumptions ............................................................ 57
Table 32 - BDB Status Quo Scenario Results ..................................................................... 57
Table 33 – BDB Assumptions of Improvement ADB Assistance Scenario ........................... 58
Table 34 - BDB Improvement ADB Assistance Scenario Projected Results ........................ 58
Table 35 - Summary of Proposed Actions ........................................................................... 63
iv
Figures
Figure 1 - GNI per Capita Evolution (Current US$) ............................................................... 2
Figure 2 - Financial System. Evolution of Loans and NPL Ratio ............................................ 3
Figure 3 – Word Cloud Example ........................................................................................... 7
Figure 4 - Example of SWOT Analysis for BDB ..................................................................... 9
Figure 5 - BDB Organization Chart ...................................................................................... 13
Figure 6 - Proposed Organization ....................................................................................... 14
Figure 7 - Total Staff Evolution ............................................................................................ 15
Figure 8 – Deposits Market Share as of December 2018 .................................................... 28
Figure 9 - System Deposits and BDB Share Evolution ........................................................ 28
Figure 10 – BDB Deposit Evolution ..................................................................................... 28
Figure 11 - Share of Largest Loan Products ........................................................................ 30
Figure 12 - Gross Loan Outstanding – Evolution by Product ............................................... 32
Figure 13 - Participation by Size Segment in Loan Outstanding - June 2019 ...................... 36
Figure 14 - Loan Classification Evolution ............................................................................ 42
Figure 15 - NPL and PAR Evolution .................................................................................... 42
Figure 16 - Portfolio at Risk % for Different Loan Sizes as of June 2019 ............................. 43
Figure 17 - PAR and NPL by Product June 2019 ................................................................ 44
Figure 18 - BDB Agricultural Loans Vintage Analysis – June 2019 ...................................... 45
Figure 19 - NPL by Disbursement Year. June 2019 ............................................................ 46
Figure 20 - BDB Profitability Evolution ................................................................................ 51
Figure 21 - BDB - Net Interest Margin Evolution .................................................................. 51
Figure 22 - BDB Gross Portfolio, Yield and Operating Expense Ratio ................................. 52
Figure 23 - BDB Portfolio Yield vs Expense Ratios ............................................................. 52
Figure 24 - BDB Employee and Loan Officer Productivity ................................................... 53
v
Preface and Disclaimer
This Draft Report has been produced by the Technical Advisor under the Technical Assistance
TA-9805 BHU: Diagnostic Study and Strategy Development for Rural Finance Sector Development - 01 Banks and Financial Institutions Specialist (53307-002)
All data on BDB set forth in this report have been represented to the Technical Advisor as materially true and correct by BDB and their representatives.
The Technical Advisor has relied on information provided by the institutions and other third parties (including public sources and summaries thereof) without independent verification. While the author believes these sources to be true and accurate, he makes no warranty thereof.
The author has received full collaboration from BDB and information requests have been handled with diligence, and therefore expresses his gratitude.
This report was prepared with data available as of December 31, 2019. It does not take into consideration the economic effects of the coronavirus disease (COVID-19) pandemic.
vi
Abbreviations
BDB Bhutan Development Bank Limited
BOD Board of Directors
CAGR Compounded Average Growth Rate
CAR Capital Adequacy Ratio
CC Community Centers
CCO Chief Credit Officer
CEO Chief Executive Office
CBS Core Banking System
CIB Customer Information Bureau
COO Chief Operating Officer
CRR Cash Reserve Ratio
CSI Cottage and Small Industries
FITI Financial Institutions Training Institute, Bhutan
FOB Farmers Outreach Banking
GNI Gross National Income
NCSIB National CSI Development Bank Limited
MCSM Micro, Cottage, Small, Medium enterprises
MFI Micro Finance Institution
MIS Management Information System
MLR Minimum Lending Rate
MOF Ministry of Finance
NIM Net Interest Margin
NPL Non-Performing Loan
OECD Organization for Economic Cooperation and Development
PAR Portfolio at Risk (over 30 days)
REDCL Rural Enterprise Development Corporation Ltd
RMA Royal Monetary Authority
ROAA Return on Average Assets
ROAE Return on Average Equity
RWA Risk Weighted Assets
SME Small Medium Enterprise
SOE State Owned Enterprise
1
Executive Summary
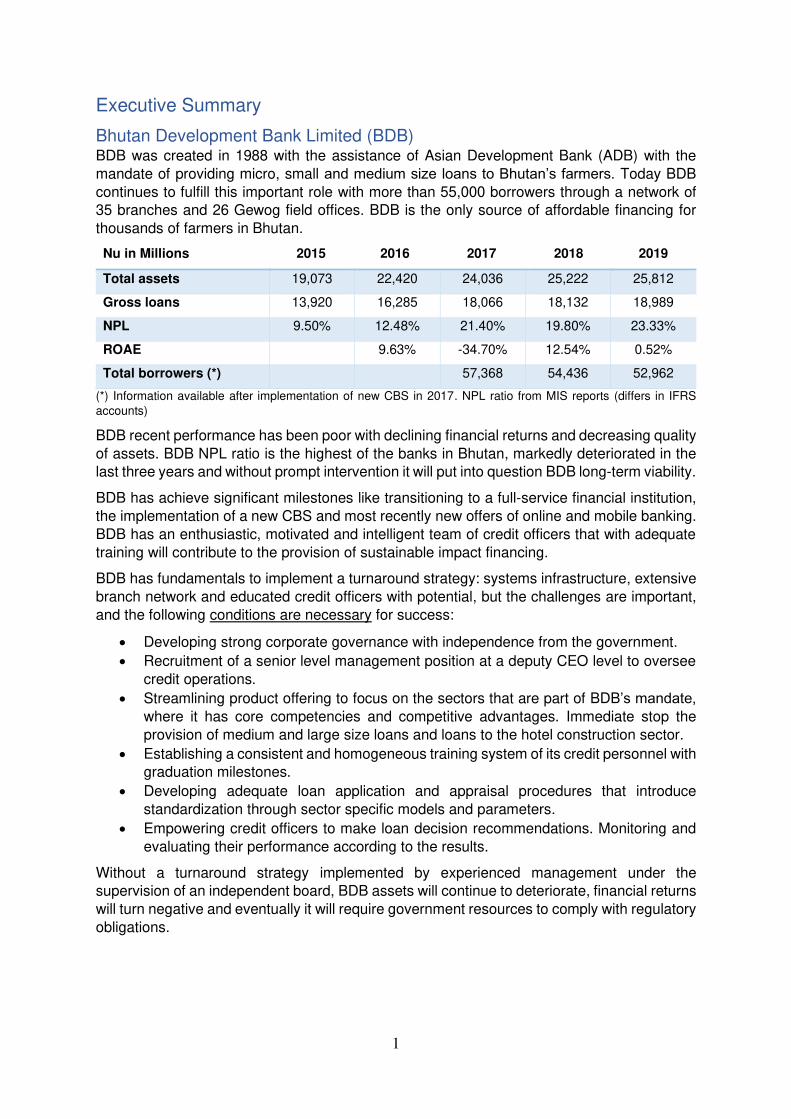
Bhutan Development Bank Limited (BDB) BDB was created in 1988 with the assistance of Asian Development Bank (ADB) with the
mandate of providing micro, small and medium size loans to Bhutan’s farmers. Today BDB
continues to fulfill this important role with more than 55,000 borrowers through a network of 35 branches and 26 Gewog field offices. BDB is the only source of affordable financing for
thousands of farmers in Bhutan.
Nu in Millions 2015 2016 2017 2018 2019
Total assets 19,073 22,420 24,036 25,222 25,812
Gross loans 13,920 16,285 18,066 18,132 18,989
NPL 9.50% 12.48% 21.40% 19.80% 23.33%
ROAE
9.63% -34.70% 12.54% 0.52%
Total borrowers (*)
57,368 54,436 52,962
(*) Information available after implementation of new CBS in 2017. NPL ratio from MIS reports (differs in IFRS
accounts)
BDB recent performance has been poor with declining financial returns and decreasing quality
of assets. BDB NPL ratio is the highest of the banks in Bhutan, markedly deteriorated in the last three years and without prompt intervention it will put into question BDB long-term viability.
BDB has achieve significant milestones like transitioning to a full-service financial institution,
the implementation of a new CBS and most recently new offers of online and mobile banking.
BDB has an enthusiastic, motivated and intelligent team of credit officers that with adequate
training will contribute to the provision of sustainable impact financing.
BDB has fundamentals to implement a turnaround strategy: systems infrastructure, extensive
branch network and educated credit officers with potential, but the challenges are important,
and the following conditions are necessary for success:
• Developing strong corporate governance with independence from the government.
• Recruitment of a senior level management position at a deputy CEO level to oversee
credit operations.
• Streamlining product offering to focus on the sectors that are part of BDB’s mandate, where it has core competencies and competitive advantages. Immediate stop the
provision of medium and large size loans and loans to the hotel construction sector.
• Establishing a consistent and homogeneous training system of its credit personnel with graduation milestones.
• Developing adequate loan application and appraisal procedures that introduce
standardization through sector specific models and parameters.
• Empowering credit officers to make loan decision recommendations. Monitoring and
evaluating their performance according to the results.
Without a turnaround strategy implemented by experienced management under the supervision of an independent board, BDB assets will continue to deteriorate, financial returns
will turn negative and eventually it will require government resources to comply with regulatory
obligations.
2
1 Bhutan
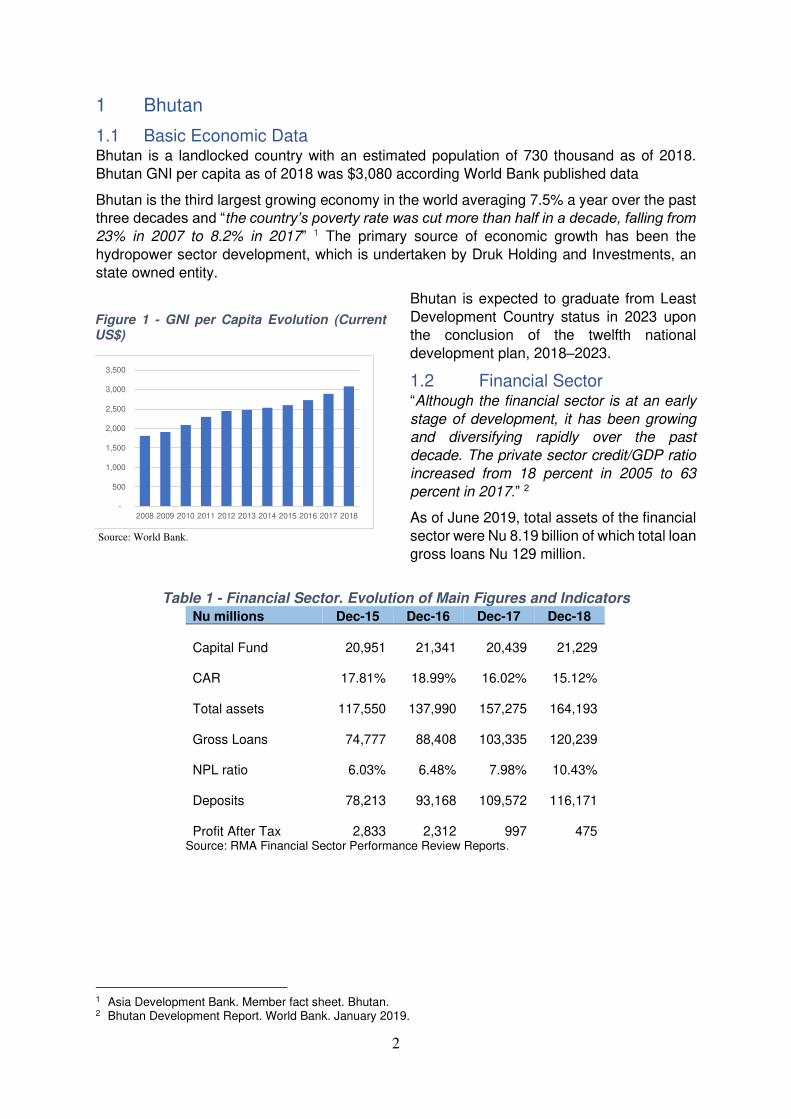
1.1 Basic Economic Data Bhutan is a landlocked country with an estimated population of 730 thousand as of 2018.
Bhutan GNI per capita as of 2018 was $3,080 according World Bank published data
Bhutan is the third largest growing economy in the world averaging 7.5% a year over the past three decades and “the country’s poverty rate was cut more than half in a decade, falling from 23% in 2007 to 8.2% in 2017” 1 The primary source of economic growth has been the
hydropower sector development, which is undertaken by Druk Holding and Investments, an
state owned entity.
Bhutan is expected to graduate from Least
Development Country status in 2023 upon
the conclusion of the twelfth national
development plan, 2018–2023.
1.2 Financial Sector “Although the financial sector is at an early
stage of development, it has been growing
and diversifying rapidly over the past
decade. The private sector credit/GDP ratio
increased from 18 percent in 2005 to 63
percent in 2017.” 2
As of June 2019, total assets of the financial
sector were Nu 8.19 billion of which total loan
gross loans Nu 129 million.
Table 1 - Financial Sector. Evolution of Main Figures and Indicators Nu millions Dec-15 Dec-16 Dec-17 Dec-18
Capital Fund
20,951
21,341
20,439 21,229
CAR 17.81% 18.99% 16.02% 15.12%
Total assets
117,550
137,990
157,275
164,193
Gross Loans
74,777
88,408
103,335
120,239
NPL ratio 6.03% 6.48% 7.98% 10.43%
Deposits
78,213
93,168
109,572
116,171
Profit After Tax
2,833
2,312 997 475 Source: RMA Financial Sector Performance Review Reports.
1 Asia Development Bank. Member fact sheet. Bhutan. 2 Bhutan Development Report. World Bank. January 2019.
Figure 1 - GNI per Capita Evolution (Current US$)
Source: World Bank.
-
500
1,000
1,500
2,000
2,500
3,000
3,500
2008 2009 2010 2011 2012 2013 2014 2015 2016 2017 2018
3
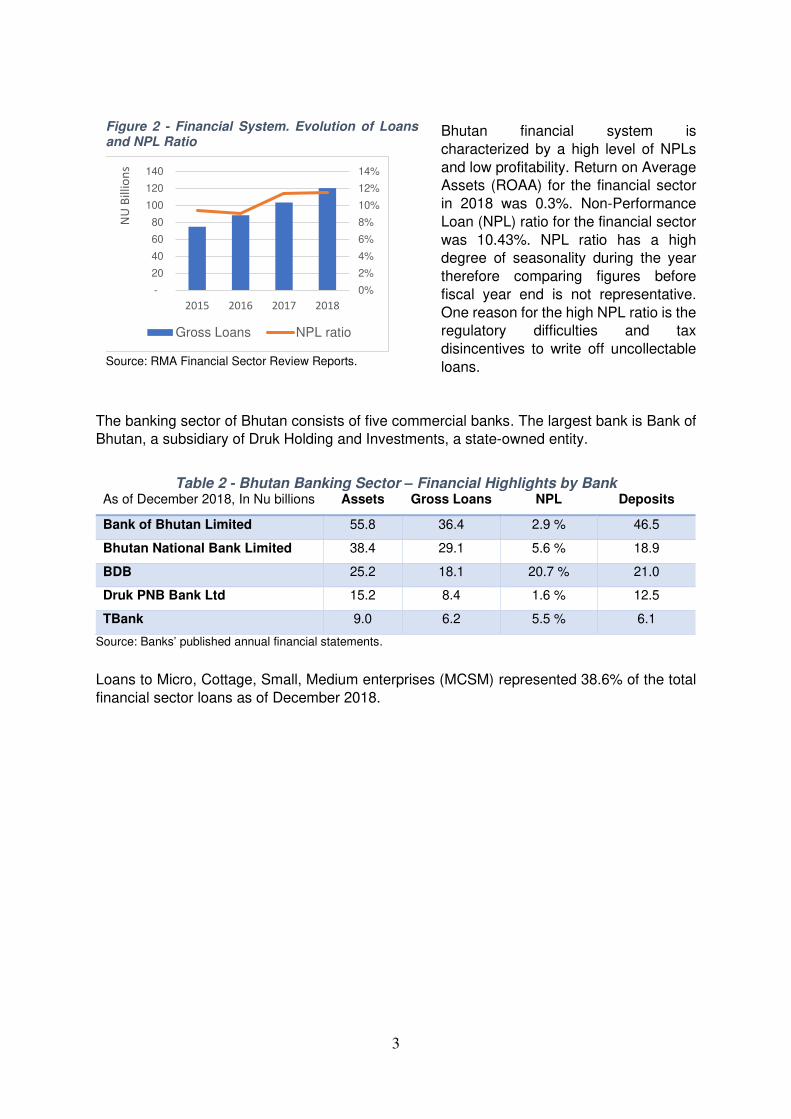
Bhutan financial system is
characterized by a high level of NPLs
and low profitability. Return on Average Assets (ROAA) for the financial sector
in 2018 was 0.3%. Non-Performance
Loan (NPL) ratio for the financial sector
was 10.43%. NPL ratio has a high degree of seasonality during the year
therefore comparing figures before
fiscal year end is not representative.
One reason for the high NPL ratio is the regulatory difficulties and tax
disincentives to write off uncollectable
loans.
The banking sector of Bhutan consists of five commercial banks. The largest bank is Bank of Bhutan, a subsidiary of Druk Holding and Investments, a state-owned entity.
Table 2 - Bhutan Banking Sector – Financial Highlights by Bank
As of December 2018, In Nu billions Assets Gross Loans NPL Deposits
Bank of Bhutan Limited 55.8 36.4 2.9 % 46.5
Bhutan National Bank Limited 38.4 29.1 5.6 % 18.9
BDB 25.2 18.1 20.7 % 21.0
Druk PNB Bank Ltd 15.2 8.4 1.6 % 12.5
TBank 9.0 6.2 5.5 % 6.1
Source: Banks’ published annual financial statements.
Loans to Micro, Cottage, Small, Medium enterprises (MCSM) represented 38.6% of the total
financial sector loans as of December 2018.
Figure 2 - Financial System. Evolution of Loans and NPL Ratio
Source: RMA Financial Sector Review Reports.
0%
2%
4%
6%
8%
10%
12%
14%
-
20
40
60
80
100
120
140
2015 2016 2017 2018
NU
Bil
lio
ns
Gross Loans NPL ratio
4
1.3 MFI Sector There are five Micro-Finance Institutions (MFI) that had been registered by the RMA.
• Rural Enterprise Development Corporation Ltd (REDCL)
• RENEW Micro-Finance Pvt. Ltd (RENEW)
• Bhutan Care Credit Ltd (BCC)
• Bhutan Association of Women Entrepreneurs (BAOWE)
• Tarayana Foundation
1.4 Regulatory Framework The financial services act of Bhutan 2011 establishes the Royal Monetary Authority (RMA) as
the regulatory entity that promotes the stability and soundness of the financial system and
determines the regulatory framework for financial services in the country.
The prudential regulations for the financial system have been issued by the RMA on 2017. The regulation establishes a minimum Capital Adequacy Ratio (CAR) for financial institutions
of 10%. In addition, institutions must maintain a Capital Conservation Buffer of 2.5%.
Every bank is required to maintain a Cash Reserve Ratio (CRR) in the form of a current
account deposit with RMA. CRR currently is at 10% of customer deposits.
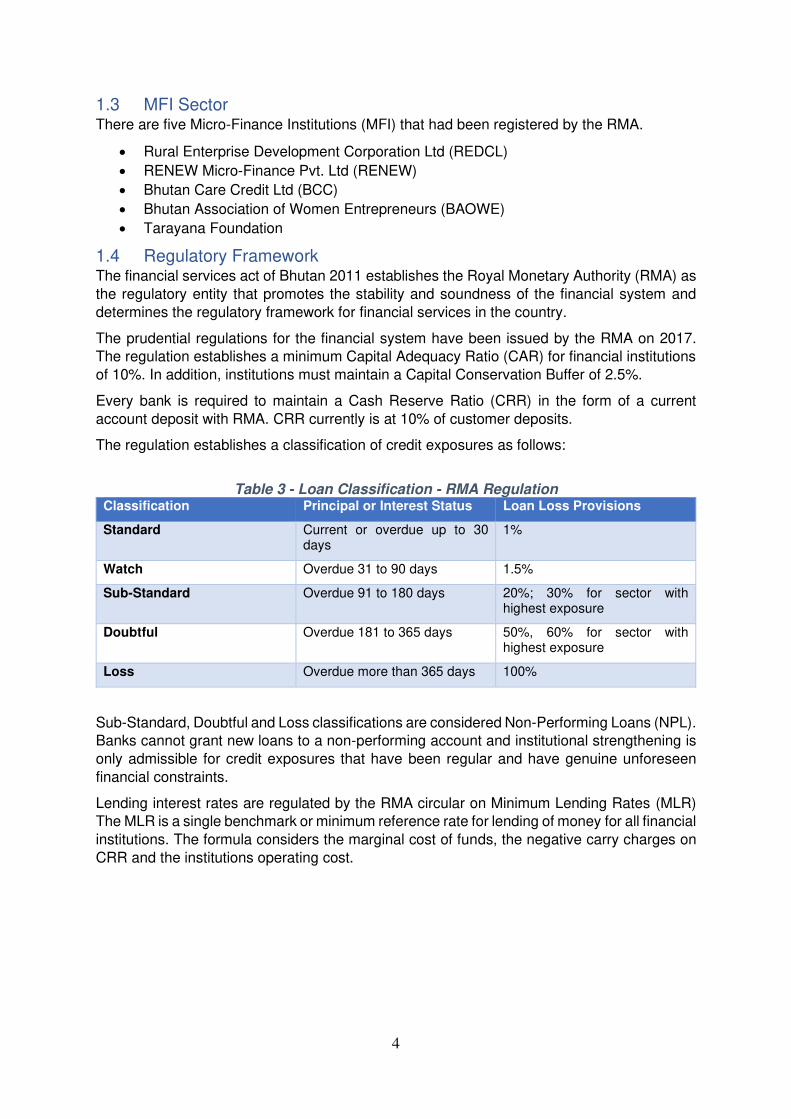
The regulation establishes a classification of credit exposures as follows:
Table 3 - Loan Classification - RMA Regulation
Classification Principal or Interest Status Loan Loss Provisions
Standard Current or overdue up to 30 days
1%
Watch Overdue 31 to 90 days 1.5%
Sub-Standard Overdue 91 to 180 days 20%; 30% for sector with highest exposure
Doubtful Overdue 181 to 365 days 50%, 60% for sector with highest exposure
Loss Overdue more than 365 days 100%
Sub-Standard, Doubtful and Loss classifications are considered Non-Performing Loans (NPL). Banks cannot grant new loans to a non-performing account and institutional strengthening is
only admissible for credit exposures that have been regular and have genuine unforeseen
financial constraints.
Lending interest rates are regulated by the RMA circular on Minimum Lending Rates (MLR) The MLR is a single benchmark or minimum reference rate for lending of money for all financial
institutions. The formula considers the marginal cost of funds, the negative carry charges on
CRR and the institutions operating cost.
5
Cottage and Small Industry (CSI) Banks are regulated by the RMA rules and regulations
published to that effect on 2018 with the intention of “Develop, promote, assist and support
the establishment of, expansion or improvement of cottage and small industries by granting
credit facilities.” Under the regulation CSI banks can be either deposit taking or not deposit
taking institutions. CSI loans have been categorized as follows:
• investment size up to Nu.1 million categorized as “cottage” • and investment size above Nu. 1 million but up to Nu. 10 million categorized as “small”
industry.
CSI banks have a minimum paid up equity capital requirement of Nu 150 million for non-
deposit taking CSI banks and Nu 300 million for deposit taking CSI banks. CSI banks are
required to maintain a minimum CAR of 15% of Risk Weighted Assets (RWA)
The rate of interest on loans shall be based on Minimum Lending Rate Framework. However, a CSI bank wishing for waiver of income tax on interest income earned through preferential
lending to CSI enterprises shall be governed by the Fiscal Incentives of Government issued
by the Ministry of Finance.
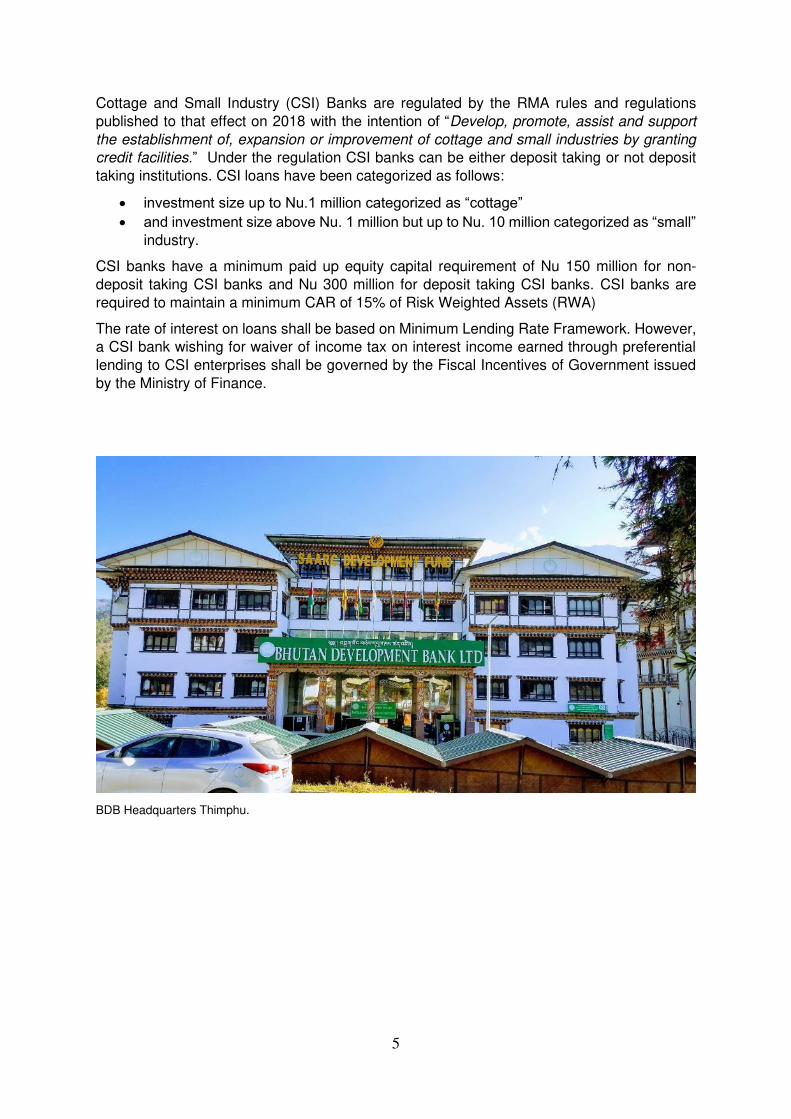
BDB Headquarters Thimphu.
6
2 Background, Summary Data and Financial Highlights
Bhutan Development Bank Limited (BDB) was incorporated by the Royal Charter, in January
1988, with assistance of the Asian Development Bank (ADB). BDB was created to attend to the credit needs of small entrepreneurs and farmers to foster industrial and agricultural
development BDB is registered as a company under the Companies Act 2000 and licensed
under the Financial Institutions Act 1992.
BDB articles of incorporation establishes the main objective of the company to promote the industrial, agricultural and commercial development of the economy of Bhutan.
The Royal Government of Bhutan (RGB) owns 96% of its paid-up share capital. The
Government’s shares are held by the Ministry of Finance. Other SOE own the rest.
BDB obtained its banking license in March 2010 in order to diversify its funding sources as a deposit taking institution.
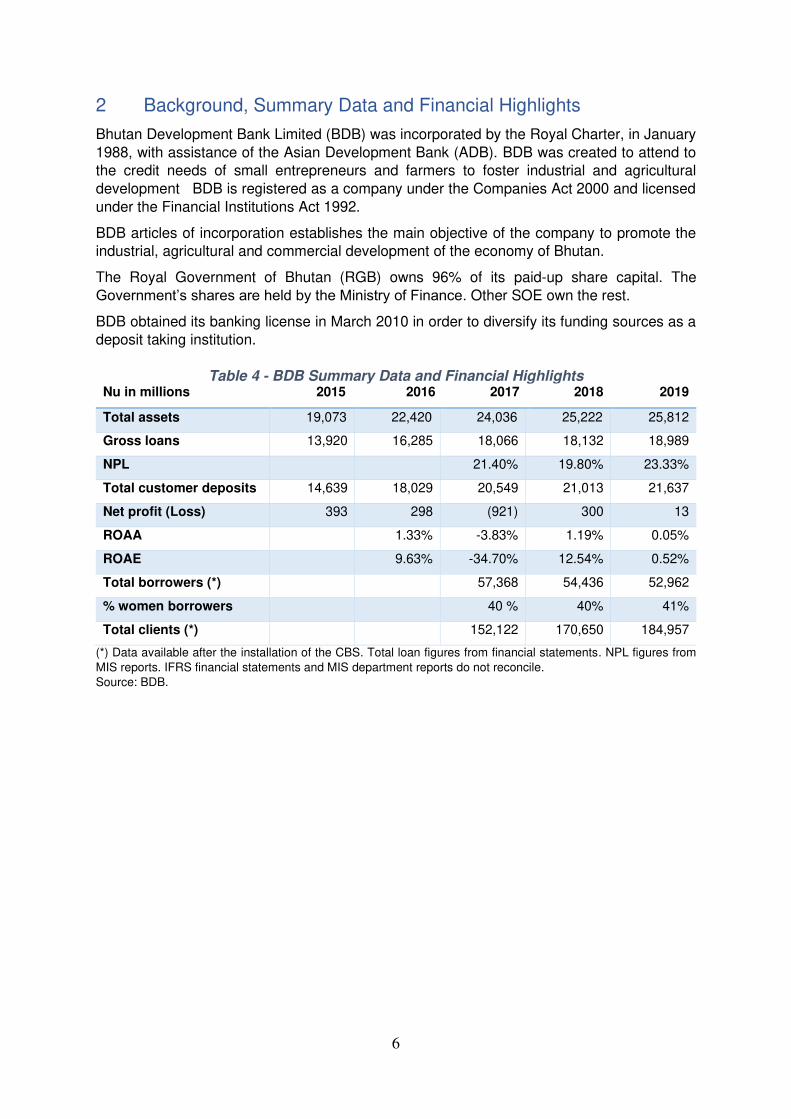
Table 4 - BDB Summary Data and Financial Highlights
Nu in millions 2015 2016 2017 2018 2019
Total assets 19,073 22,420 24,036 25,222 25,812
Gross loans 13,920 16,285 18,066 18,132 18,989
NPL
21.40% 19.80% 23.33%
Total customer deposits 14,639 18,029 20,549 21,013 21,637
Net profit (Loss) 393 298 (921) 300 13
ROAA
1.33% -3.83% 1.19% 0.05%
ROAE
9.63% -34.70% 12.54% 0.52%
Total borrowers (*)
57,368 54,436 52,962
% women borrowers 40 % 40% 41%
Total clients (*)
152,122 170,650 184,957
(*) Data available after the installation of the CBS. Total loan figures from financial statements. NPL figures from
MIS reports. IFRS financial statements and MIS department reports do not reconcile.
Source: BDB.
7
3 Strategic Planning
3.1 Vision and Mission The Business Plan 2015-2019 document establishes the following vision and mission
statements, and core values.
Vision To be the strong, dependable and customer focused Bank that contributes towards
achievement of Gross National Happiness
An effective vision statement has the following characteristics
• Concrete and specific
• Bold, challenging and exciting
• Positive and inspiring
• A goal worth “stretching” for
• Attainable
In this respect BDB vision statement is too general and doesn’t capture BDB mandate to
provide access to finance to provide micro, small and medium financial services for the
development and modernization of agricultural, commercial and industrial enterprises in the
country.
As part of BDB strategic planning effort, BDB management and
Board of Directors should engage
in a session to produce a more
effective statement. During the session participants should think
what an ideal outcome of BDB
activities in the long term would be,
what the institution wants to become and how Bhutan has
gotten better because of BDB
impact. BDB employees can
participate in the process by presenting their views on the future
of the organization. Their answers
should be taking into consideration
and can be summarized in a word cloud graph as the one presented in Figure 3 – Word Cloud Example for the consideration of
the decision makers.
Vision statement is a very important part of the strategic planning process and it needs
ownership from the institution leadership. It cannot be redacted in abstract, however the following ideas might be considered as part of a vision statement:
• Agricultural, commercial and industrial enterprises in Bhutan.
• Sustainability.
• Equitable access to finance to micro and CSI market.
Figure 3 – Word Cloud Example
8
Mission
A premier development bank with focus on rural prosperity through prompt, efficient and
effective financial services on a sustainable basis.
The purpose of a mission statement is to provide motivation, build consensus, solidify the
organization and give an image to clients and constituents. It describes what an organization
does, what services provides, what makes it unique and what is its purpose.
BDB current mission statement is adequate. A similar exercise to the one proposed to the vision statement can be used to further refine the mission statement and introduce other
important aspects of BDB purpose such as:
• Outreach to unbanked populations
• Transparency/financial literacy
• Customer service
• Branch network
There is a need for better communication with customers and an effort to improve their
financial literacy. Inclusion of this important aspect in the mission statement should help as a
reminder of the need to fulfill this need.
Core values According to BDB strategic plan “The values that employees of the Bank should embrace in the execution of the duty reflect the important role the Bank play in the development of the country. The values are known by the acronym “PEOPLE” which depicts the one of the core objectives of the Bank in providing services to the people.” • Professionalism – Give your Best
• Excellence – Aim for higher ideals
• Ownership - Own your Bank and Care for your customers
• Partnership – Work together for growth
• Loyalty – Be true to oneself and stakeholders
• Efficiency – Deliver Prompt Service It is important to convey to employees the value of integrity and honesty. As described in this
report there have been many recent instances of fraud and misappropriation of funds. While
certainly a core value statement would not be enough to address this important problem, the
institution message should be clear that integrity is a fundamental value and dishonest behavior will not be tolerated.
9
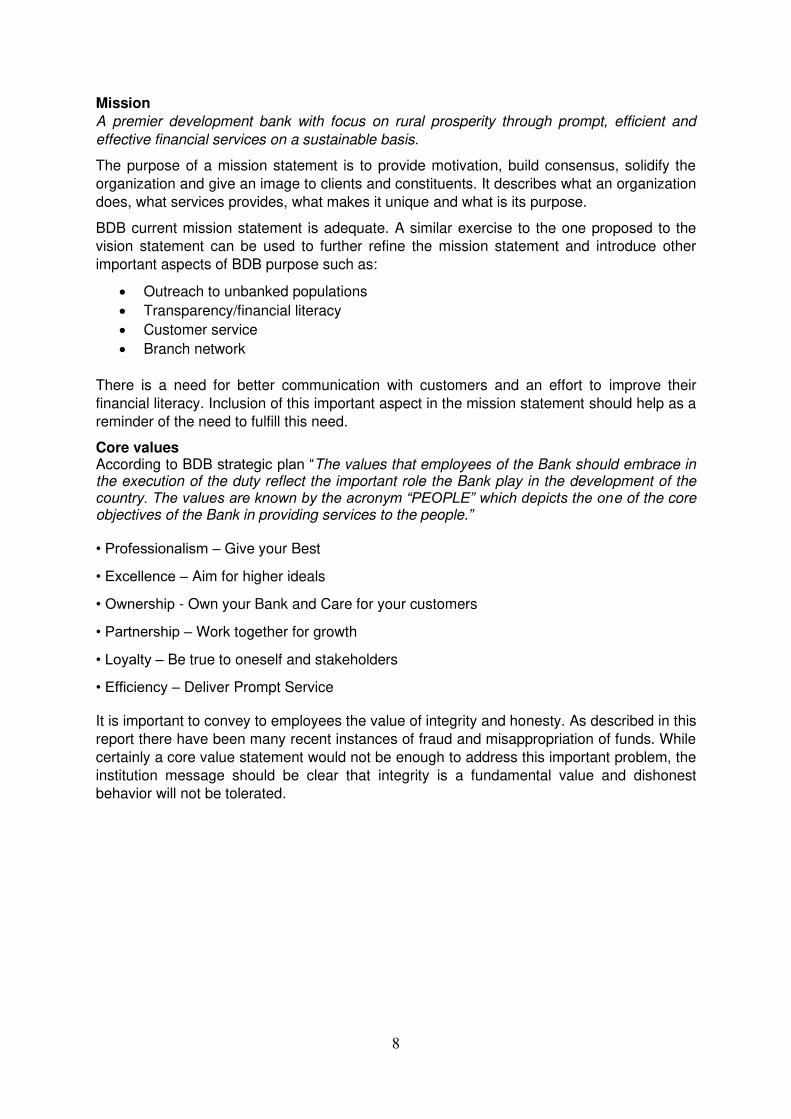
3.2 SWOT Analysis The ubiquitous Strength, Weakness, Opportunity and Threats analysis is a common tool to
start a strategic planning process. This exercise should be conducted with the input of the
Board, management and key personnel. The figure that follows only presents ideas for a
SWOT, but it doesn’t intend to be a comprehensive list.
Figure 4 - Example of SWOT Analysis for BDB
3.3 Strategic planning process
2015-2019 business plan The 2015-2019 business plan was the last formal strategic planning exercise conducted by
the bank, which states that “Preparing the business due consideration has been given to fulfillment of its social mandates but without compromising its sustainability and stability” 3
The 2015-2019 business plan recognized the need of upgrading the information system of the bank and implementing a customer centric CBS system that enables customer relationship management, document management system, internet and mobile making, among other functionalities needed to operate a modern bank. This important part of the strategic plan was carried out and now BDB has a proper CBS system. However the migration proved to be troublesome and the CBS implementation still needs to be improved. (7.2 Core Banking System and Management Information Systems) In terms of financial and operational targets BDB management didn’t meet the targets of the 2015-2019 business plan.
3 BDB 2015-2019 Business Plan.
10
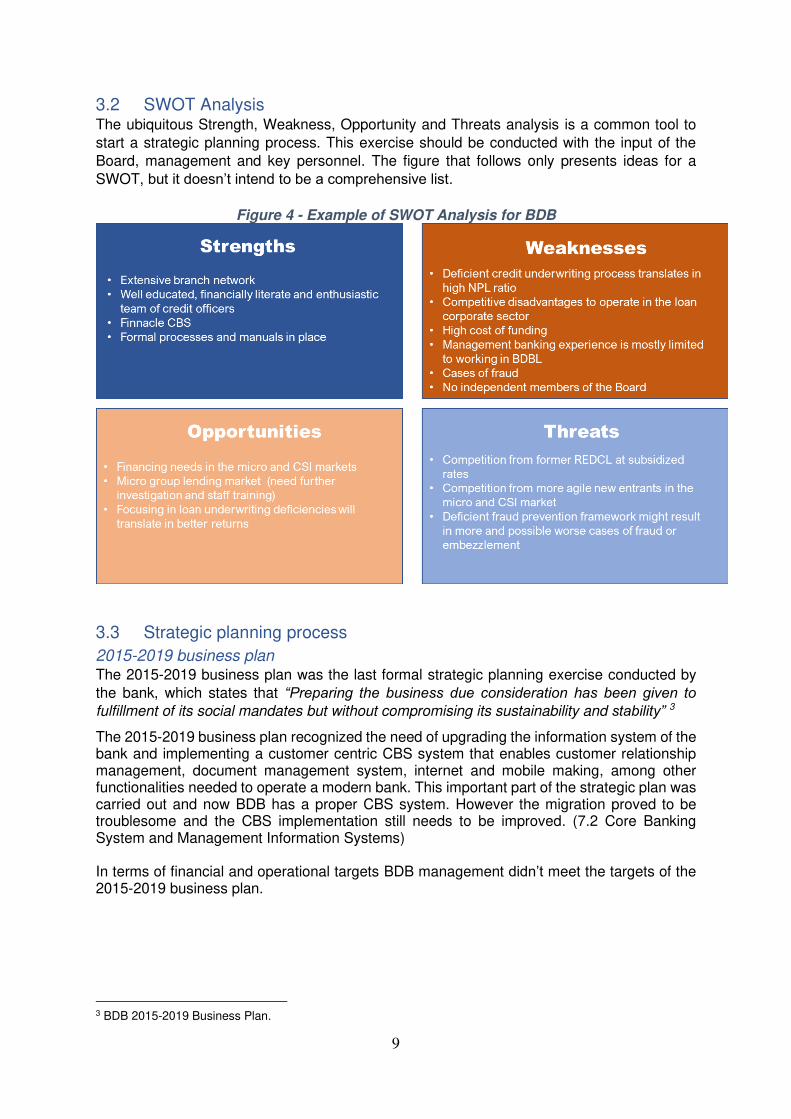
Table 5 - 2015-2019 Business Plan Targets vs Actual Performance Measure 2019 Target December 2019 Actual
Total credit customers 74,000 57,319 Loan portfolio Net (Nu billion) 22.3 19.9 Agriculture and livestock loans % 30% 27% PAR 7.7% 36.6% Total deposits (Nu billion) 25.4 21.0
There are no documented efforts of attempts to follow up on performance against targets prescribed in the 2015-2019 business plan and no other formal strategic planning effort have
taking place since 2015. BDLB has no financial projections.
Recommendations
Strategic planning should be an on-going process and not a discrete event that takes place every five years. BDB performs an annual workshop each year to analyze prior year
performance and set expectations for the following year. However, strategic planning requires
a longer horizon, the yearly workshop should be also an opportunity to review the medium and
long term goals. Management should be accountable to deviations not only of yearly budget targets but also for performance on medium and long term goals
In the 2015-2019 either the targets were over ambitious and the strategic planning process
defective or management did not deliver on the expectations.
BDB management should present to the BOD for its consideration a five-year business plan inclusive of financial projections.
4 Governance
As SOE, BDB corporate governance is contained in the Corporate Governance Guidelines
(CG Guidelines 2019) for State Enterprises 2019 as sanctioned by MOF, Royal Government of Bhutan. The preface of the guidelines points out that “The CG Guidelines 2019 were
developed by MOF in close consultation with relevant agencies and was reviewed by a
Technical Committee comprising members from RMA, Companies Registrar, DHI and
representative from State Enterprises. Further, it was also reviewed by experts from the World
Bank and IFC.”
“The Government’s share in the State Enterprises and portfolio companies shall be held by the Minister of Finance who shall then be primarily responsible for monitoring and reporting
the performance of State Enterprises.” 4
The CG Guidelines 2019 enumerates the responsibilities of the MOF. Among them:
• establishing well-structured, merit-based, and transparent nomination of Board and endorsement of CEO appointment;
• establishing clear remuneration guidelines for State Enterprise that fosters the long- and medium-term interest of the enterprise;
• fixing sitting fees of the Board;
• monitoring the performance of State Enterprise;
• endorse the Articles of Incorporation of State Enterprises and any amendments thereto;
• set targets and monitor performances of State Enterprises;
• evaluate the performance of the Board as per the Performance Evaluation Framework (PEF)
4 Corporate Governance Guidelines for State Enterprises 2019.
11
4.1 Board of Directors “The governing body of a State Enterprise shall be the Board of Directors (BOD). The BOD is
the ultimate decision-making body of the Company except with respect to those matters
reserved to the shareholders. The Board shall meet at least once in every three months or no
less than four times per year and as frequently as may be deemed necessary to deal with the
business of the Company.”5
Among the BOD responsibilities:
• ensuring that the policy objectives of the Company are attained and that the Company
operates in an efficient and effective manner,
• reviewing and guiding corporate strategy, major plans of action, risk policy, annual
budgets, business plans and set performance targets,
• monitoring implementation and corporate performance; and overseeing major capital
expenditures, acquisitions and divestitures.
MOF nominates and recommend to the Government for endorsement the nomination of the
BOD members, including the Chairperson.
The CG guidelines 2019 prescribes that the BOD should have three to nine members. BDB BOD consists of seven members and that the Board shall be collectively accountable for the
governance of the Company.
Five BOD members are current or former civil servants. One is the current CEO of REDCL
and the other is BDB CEO as established in the normative (also a former civil servant)
The current chairperson is Mr. Lekzang Dorji, Director General, Department of Macro
Economic Affairs, MOF.
4.2 Chief Executive Officer The BOD is responsible to select the CEO through open competition that includes due
diligence of applicants, checks on integrity and records of past performance, short list and
interview process. BOD shall select the highest ranked candidate and recommend the selected candidate to MOF for endorsement and finalization of the remuneration package.
Ministry of Finance will review the Board’s recommendation and submit to Lhengye Zhungtshog (Prime minister and cabinet) for endorsement.
The current Chief Executive Officer since March 2016 is Mr. Phub Dorji. Mr. Dorji has a master’s in public administration (MPA) from Harvard Kennedy School, Harvard University, a
long career in civil service in the Ministry of Economic Affairs and he is in author of various
publications on economic issues and entrepreneurship.
Recommendation
• Independent BOD with the inclusion of members with business and banking experience.
The MOF guidelines dictates that “The Board shall have a balance of diverse skills, core
competencies and capabilities, knowledge and experience to aid informed, independent and
objective decision making”
The OECD Guidelines on Corporate Governance of SOEs indicates that “For SOEs engaged
in economic activities, it is recommended that board members have sufficient commercial,
financial and sectoral expertise to effectively carry out their duties. In this respect, private
sector experience can be useful” 6
5 Corporate Governance Guidelines for State Enterprises 2019. 6 OECD Guidelines on Corporate Governance of State-Owned Enterprises.2015
12
BDB BOD is composed almost exclusively by professionals with long current or former careers
as civil servants. Positions in ministries such as Agriculture, Economic Affairs or Finance are
certainly relevant experiences to bring to corporate decisions and in countries like Bhutan with limited private sector development there could be few options. However, there are other
perspectives and experiences that are also important, and it is in direct contradiction to the
normative that asks for a “balance of diverse skills”.
A risk of state-owned banks is that they will be subject to political influence that might interfere in decision making. A board formed exclusively by members whose careers might be
dependent on government decisions magnifies this problem. Management indicated that there
had been instances where the BOD overrode credit and interest setting, resulting in decisions
against the interest of BDB. This board overreaching is ineffective and reflective of poor governance.
BDB BOD should at least have four members with experience in the financial sector from
Bhutan, other countries or in International Financial Institutions. BDB needs to implement
challenging changes to secure its sustainability and fulfill its mandate. The presence in the BOD of independent, qualified and reputable professionals with a sharp understanding of
banking, microfinance and SME lending is a condition necessary for a successful turnaround
of the institution.
The inclusion of independent directors can eventually lead to an independent chair as suggested in the World Bank’s Corporate Governance Guidelines for SOEs toolkit: “Over time,
the independent representation could be gradually increased to a significant number of such
directors and eventually to a majority of directors, including a chair who is independent of the
government. Experienced foreign nationals—particularly for large and complex SOEs—may
be considered as the pool of local talent grows. While the issue is often politically sensitive,
foreign directors can increase the quality of the board, introduce new ideas and expertise, and
help insulate SOEs from political interference and corruption, as foreign board members are
less politically vulnerable.” 7
REDCL CEO (now NCSIB) is a member of the board. This is a conflict of interest even
if both institutions are state owned and should be avoided.
• Presence of management with banking, microfinance/SME lending experience outside
BDB
BDB management is motivated to fulfil the mandate given to the institution. It is
knowledgeable, have participated in numerous training programs and it is aware of the challenges facing the institution.
However, currently the top-level management of BDB is formed with professionals without a
relevant banking experience outside the institution. BDB has the framework, processes in
place and enthusiastic staff to embark in a process to turn around the institution, but such a process requires of experienced leadership without an insular perspective.
BDB BOD should recruit a senior level management position at a deputy CEO level to oversee
credit operations. This professional should ideally have more than 15 years of experience in
• banking/lending, having occupied a senior role in a financial institution outside BDB,
• microfinance/SME lending
• agriculture/livestock value chain
7 World Bank’s Corporate Governance Guidelines for SOEs A toolkit. 2014.
13
• turnaround situations
Annex IV presents indicative terms of reference for the position.
5 Organizational Structure
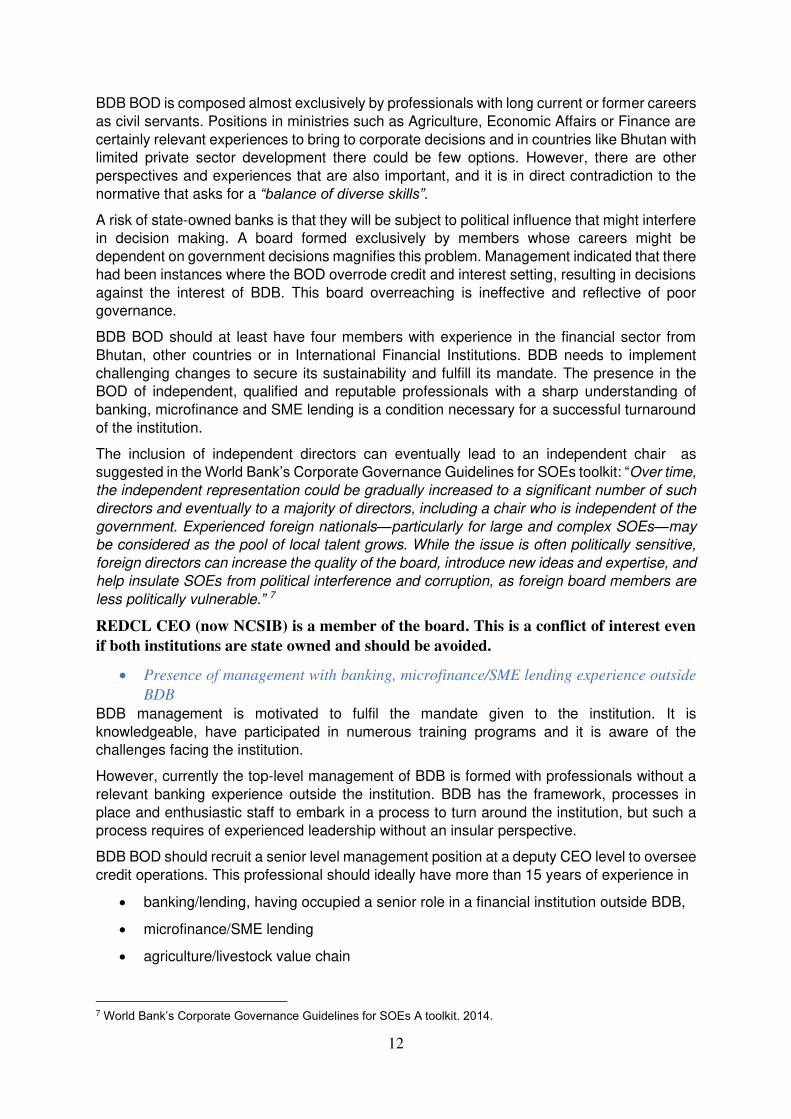
BDB current organization structure was approved by the Board on December 2019.
Figure 5 - BDB Organization Chart
5.1 Assessment and Recommendation
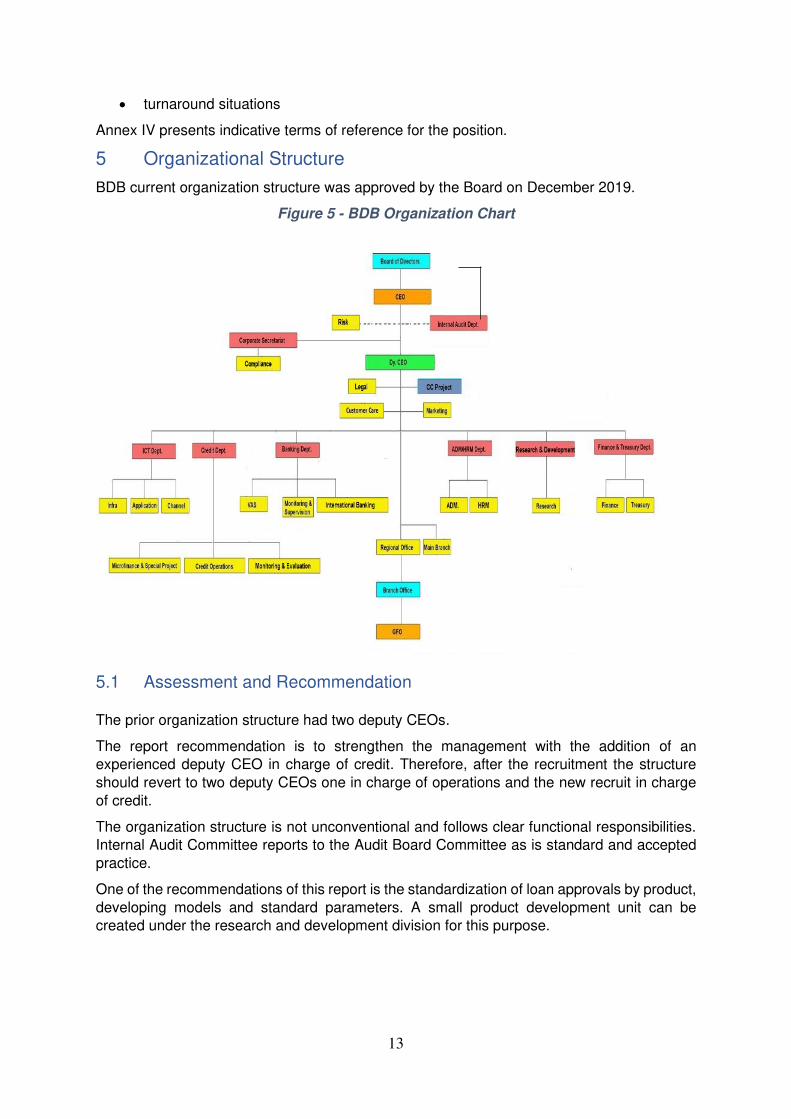
The prior organization structure had two deputy CEOs.
The report recommendation is to strengthen the management with the addition of an experienced deputy CEO in charge of credit. Therefore, after the recruitment the structure
should revert to two deputy CEOs one in charge of operations and the new recruit in charge
of credit.
The organization structure is not unconventional and follows clear functional responsibilities. Internal Audit Committee reports to the Audit Board Committee as is standard and accepted
practice.
One of the recommendations of this report is the standardization of loan approvals by product,
developing models and standard parameters. A small product development unit can be created under the research and development division for this purpose.
14
Figure 6 - Proposed Organization
BOD
CEO
Deputy CEO
Support and
Corporate Strategy
Information
Technology
Infrastructure
Manage
Information
Systems
Research and
Development
Research
Product
Development
Administration and
Human Resources
Administration
Human Resources
Deputy CEO
Credit and
Operations
Credit Department
Credit Operations
Microfinance &
Special Project
Monitoring &
Evaluation
Banking
Department
VAS
FOREX
Reconciliation
Finance and
Treasury
Finance
Treasury
Regional Office
Branch Office
RiskCorporate
Secretariat
Compliance
Internal Audit
Department
15
6 Human Resources
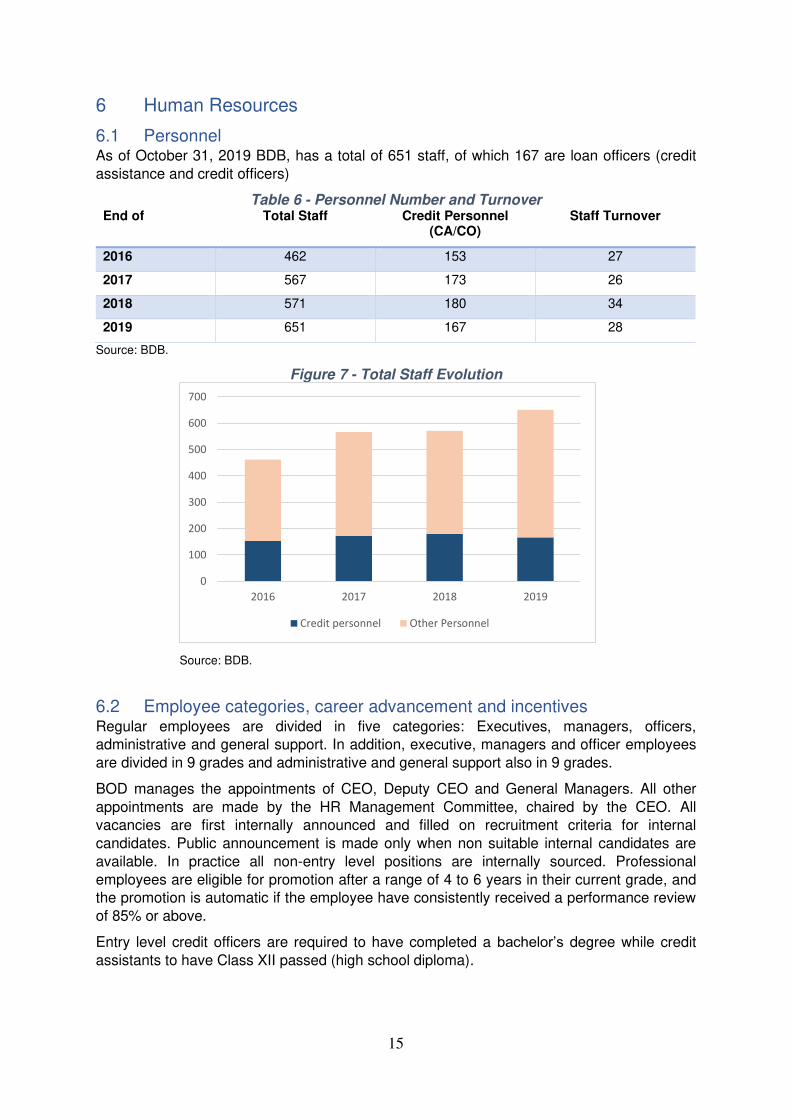
6.1 Personnel As of October 31, 2019 BDB, has a total of 651 staff, of which 167 are loan officers (credit
assistance and credit officers)
Table 6 - Personnel Number and Turnover End of Total Staff Credit Personnel
(CA/CO) Staff Turnover
2016 462 153 27
2017 567 173 26
2018 571 180 34
2019 651 167 28
Source: BDB.
Figure 7 - Total Staff Evolution
Source: BDB.
6.2 Employee categories, career advancement and incentives Regular employees are divided in five categories: Executives, managers, officers, administrative and general support. In addition, executive, managers and officer employees
are divided in 9 grades and administrative and general support also in 9 grades.
BOD manages the appointments of CEO, Deputy CEO and General Managers. All other
appointments are made by the HR Management Committee, chaired by the CEO. All vacancies are first internally announced and filled on recruitment criteria for internal
candidates. Public announcement is made only when non suitable internal candidates are
available. In practice all non-entry level positions are internally sourced. Professional
employees are eligible for promotion after a range of 4 to 6 years in their current grade, and the promotion is automatic if the employee have consistently received a performance review
of 85% or above.
Entry level credit officers are required to have completed a bachelor’s degree while credit
assistants to have Class XII passed (high school diploma).
0
100
200
300
400
500
600
700
2016 2017 2018 2019
Credit personnel Other Personnel
16
For general and regional managers, the mandatory retirement age is 60, for all other
employees is 58. Upon retirement employees are entitled to a gratuity payment of his or her
last basic salary per year of service.
The basic payment scale for employees is determined by the MOF. According to management
salary at the bank is considerably lower than similar positions in the private sector. However,
this does not seem to have an effect in turnover which is low. Employees are entitled to a 2.5%
annual increase (if they meet minimum performance grade). Employees with good performance are entitled to a bonus payment up to the equivalent of four months’ salary.
6.3 Performance evaluation system BDB implements a yearly performance evaluation system for its employees. All employees
are required to develop individual performance plans. Performance is measured in quantitative
and qualitative targets. Supervisors are required to provide feedback at frequent intervals. At
the end of the year overall performance is evaluated.
Credit assistant and officers are given annual total loan, deposit balances and PAR>90
targets. These quantitative targets account for 60% of their evaluation score. Qualitative rating
accounts for the rest of the score and is given by managers based on documentation quality,
customer relationship, accuracy and timeliness of reporting, teamwork, reliability, discipline, initiative, and integrity.
All employees scores translate to the following performance scale: outstanding, excellent,
good, satisfactory and needs improvement.
In case of consistent non-performance several strategies are utilized, including training managers on performance management, employee development, review of work
responsibilities, improvement of job environment and workload, transfer/reassignment and
disciplinary actions including termination.
The Human Resources manual delineates the overall performance evaluation system process
and follows standard managerial practices.
6.4 Capacity Development and Training
Credit training Credit officers are recruited from university upon completion of their bachelor’s degree by an
open process. Assistant officers are required to have Class XII diploma (high school) New
recruits are given a one-week training course conducted by an experienced loan officer. Both
loan and assistant officers assist to the same course. The training course consist of the exposure to basic principles of credit, case studies and BDB credit procedures. Quizzes are
part of the program to ensure proper understanding of the concepts, however there is no
examination at the end, and nobody fails the course. The trainer interviewed was
knowledgeable and had a well-structured presentation. She did not receive any formal training in credit courses.
Subsequently, new recruits receive on the job training by their supervisors.
Management indicated that during the first two years credit officers attend training abroad,
most prominently in the National Institute of Bank Management Training (NIBM) in Pune, India. The 10 days program is focused on credit assessment and financial statement analysis,
includes case analysis and a visit to a local financial institution. Also, some credit officers
attended the five days training program on credit appraisal and loan recovery training course
provided by Bangkok School of Management.
In interviews with credit officers it became apparent that some of them have not received the training abroad even after more than three years in the bank. After reviewing information
17
requested to BDB, 25 credit officers that have been in the bank since 2016 and 2017 have not
received the training abroad.
Other training In country training is provided on an ad-hoc basis to the employees based on specific needs. In 2019 training offered to the employees included: leadership training (3 attendees), training
of trainers (12 attendees), currency management (26 attendees), loans for startups and
entrepreneurs (2 attendees), and risk management of SME lending (2 attendees).
International training in other areas than credit appraisal included customer care, microfinance, IFRS and other areas in courses in Thailand, Vietnam, India and SRI Lanka,
among other locations.
6.4.1 Assessment Interviews with credit officers identified in some instances the need of a better understanding
of some elements of credit analysis. The differences among the officers in their understanding
suggests the lack of a homogeneous training system.
Credit officers are recruited directly from University and are bright young women and men among the best performing students. While some have taking formal courses in finances and
accounting others might come from other valid fields but without a finance background. BDB
does not have a training program to take advantage of the talented professionals it recruits.
A one-week course is clearly insufficient to prepare young graduates to make credit decisions. On the job training is important but ineffective in creating a minimum knowledge standard that
can be expected of a credit officer after one year in the bank. The same course is currently
attended by both credit assistant (high school education) and credit officers (university
education). The needs of both groups are clearly different, and the course curricula should also be different.
Training abroad is seeing by the employees and management in many cases more as a
motivational tool than a training exercise. All officers interviewed were appreciative of this
opportunity and expressed that the course was productive, increased their knowledge and broadened their perspective by studying case studies and visiting financial institutions in India.
This practice should continue but all officers should go through the same syllabus and
preferably same location.
The main training facility in Bhutan is the Financial Institutions Training Institute Limited (FITI). FITI was established in the year 2011 by RMA in collaboration with Financial Institutions
Association of Bhutan (FIAB), as an autonomous apex institution for training, research and
consultancy with the objective to train and build the human resource capacity of financial
sector. ADB provided technical assistance in the formation and institutionalization of FITI. BDB is a shareholder of FITI along with other financial institutions, however it does not use the
services. Exploring using FITI resources might be an option. The consultant interviewed FITI’s management and was presented with the curricula of several banking and credit courses. The
courses syllabus looked comprehensive but an assessment of FITI capabilities exceeds the terms of reference of the assignment, therefore no recommendation it is given herewith as to
the quality of the instruction and its suitability for BDB needs.
6.4.2 Recommendation BDB needs to implement a more formal, academically rigorous, and homogeneous training
process for credit assistant and credit officers. The credit and human resources departments
should create a committee to establish the new plan and follow up on its implementation.
18
Introductory/Induction course The introductory course should be at least a three weeks program in a formal classroom
setting. An examination should be mandatory for participants, and a minimum grade require
for employment as a credit assistant or officer of BDB.
The course can be taught by either i) experienced BDB credit officers (current approach) or ii)
outside instructors from training institutes like FITI or outsourced from experienced trainers
(from Bhutan or internationally). If approach i) is selected, then BDB trainers should be
prepared in training techniques and a course syllabus should be prepared with the assistance of experienced educators/trainers in the field of credit analysis.
Separate curricula should be developed for credit officers and assistants
The course should cover areas such as:
• Financial analysis and modeling. Financial statement analysis, including a clear understanding of the differences between income and cash flow.
• Preparation of cash flow and debt service coverage projections.
• SME/microfinance fundamentals.
• Calculation and interpretation of key financial ratios.
• Risk management. Identification of potential liquidity problems and collateral quality.
• Agriculture/Livestock credit fundamentals and cash drivers.
• Introduction to BDB credit models (to be developed)
• Client relationship management and due diligence. Challenges of dealing with customers without financial literacy.
• Loan file preparation
Continuing education/first two years During the first two years junior credit personnel should attend online and classroom setting
courses following up on the fundamentals of the introductory/induction course. Senior credit
officers, branch and credit management should assess the progress of the junior credit personnel and provide instruction in areas of need. Substandard performers should be
reassigned to other areas within the bank.
Two Years Junior graduation/course abroad After two years of service junior credit personnel should receive a formal evaluation by their
supervisors in addition of their annual review. Only those recommended by their supervisors and with the approval of the credit department deputy general manager should continue in the
credit department. In their third year of service all recommended credit personnel should
attend the credit training abroad, currently NIBM, India.
Credit officers are the cornerstone of a successful MFI. Only those with the right aptitude should proceed with a career in credit, for those that are not considered suitable for the career
other opportunities can be present in the bank.
Training on agriculture production and supply chains All credit personnel should go through specialized training in agriculture production and supply
chain fundamentals. Credit officers should be able to assess the cash generating capacity of different agricultural businesses, the underlying risks and success factors.
19
FITI instructional material
7 Information Technology
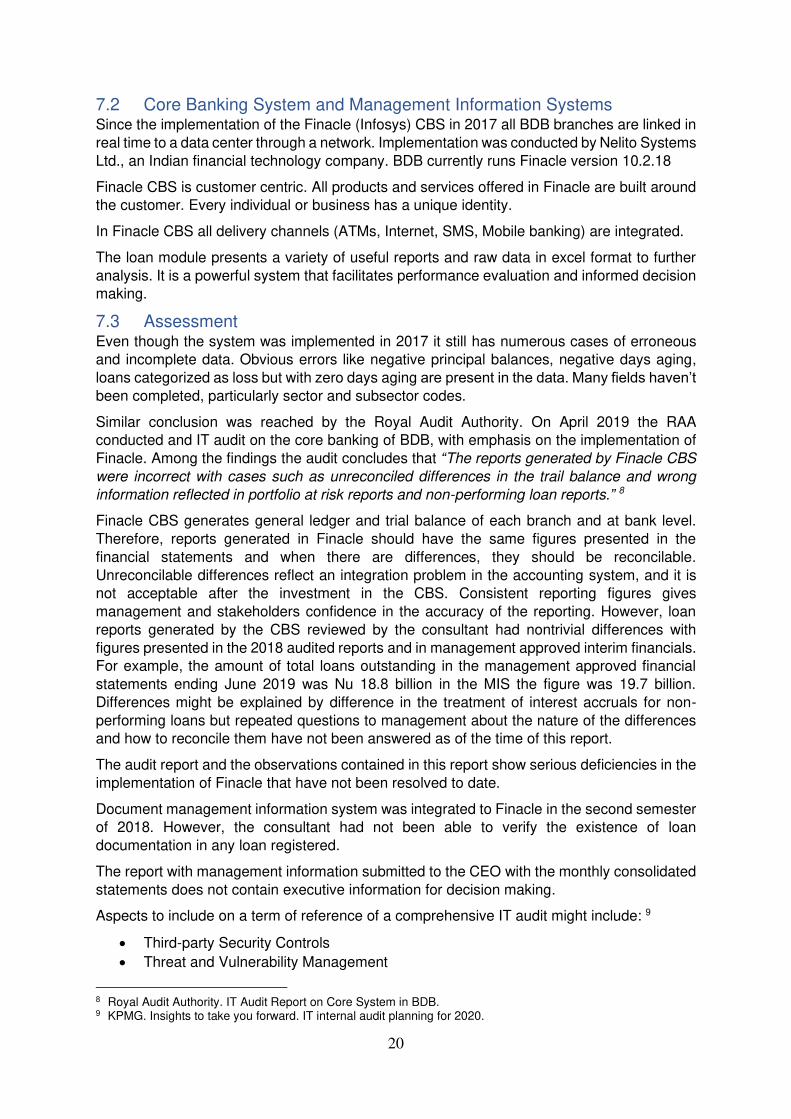
7.1 Hardware and Servers The following hardware is used for the CBS
• Data Center
• Sparc T7 – 4 Production Server 1
• Sparc T7 – 4 Production Server 2
• Sparc T7 – 1 UAT Server
• Oracle Server X6 – 2 OPS/ OSB
• Oracle Server X6-2L
Switch Server, Citrix
• ORACLE SERVER X6-2L
Switch Server, Citrix
• Oracle ZS3-2 Controller1
• Oracle ZS3-2 Controller2
• Oracle ZS3-2 DE2-24P-1
(JBOD-1)
• Oracle ZS3-2 DE2-24P-2
(JBOB-2)
• SL-150
• (3) Oracle Switch ES1-24
10G Ethernet Switch
• (2) Radware Alteon NLB
• Disaster recovery site:
• SPARC T7-4
• SPARC T7-1
Switch Server, Citrix
• Oracle ZS3-2 Controller1
• Oracle ZS3-2 Controller2
• Oracle ZS3-2 DE2-24P-1
(JBOD-1)
• Oracle ZS3-2 DE2-24P-1
(JBOD-2)
• San Switch
• Oracle Switch ES1-24
10G Ethernet Switch
20
7.2 Core Banking System and Management Information Systems Since the implementation of the Finacle (Infosys) CBS in 2017 all BDB branches are linked in
real time to a data center through a network. Implementation was conducted by Nelito Systems
Ltd., an Indian financial technology company. BDB currently runs Finacle version 10.2.18
Finacle CBS is customer centric. All products and services offered in Finacle are built around the customer. Every individual or business has a unique identity.
In Finacle CBS all delivery channels (ATMs, Internet, SMS, Mobile banking) are integrated.
The loan module presents a variety of useful reports and raw data in excel format to further
analysis. It is a powerful system that facilitates performance evaluation and informed decision making.
7.3 Assessment Even though the system was implemented in 2017 it still has numerous cases of erroneous and incomplete data. Obvious errors like negative principal balances, negative days aging,
loans categorized as loss but with zero days aging are present in the data. Many fields haven’t been completed, particularly sector and subsector codes.
Similar conclusion was reached by the Royal Audit Authority. On April 2019 the RAA conducted and IT audit on the core banking of BDB, with emphasis on the implementation of
Finacle. Among the findings the audit concludes that “The reports generated by Finacle CBS
were incorrect with cases such as unreconciled differences in the trail balance and wrong
information reflected in portfolio at risk reports and non-performing loan reports.” 8
Finacle CBS generates general ledger and trial balance of each branch and at bank level.
Therefore, reports generated in Finacle should have the same figures presented in the
financial statements and when there are differences, they should be reconcilable.
Unreconcilable differences reflect an integration problem in the accounting system, and it is not acceptable after the investment in the CBS. Consistent reporting figures gives
management and stakeholders confidence in the accuracy of the reporting. However, loan
reports generated by the CBS reviewed by the consultant had nontrivial differences with
figures presented in the 2018 audited reports and in management approved interim financials. For example, the amount of total loans outstanding in the management approved financial
statements ending June 2019 was Nu 18.8 billion in the MIS the figure was 19.7 billion.
Differences might be explained by difference in the treatment of interest accruals for non-
performing loans but repeated questions to management about the nature of the differences and how to reconcile them have not been answered as of the time of this report.
The audit report and the observations contained in this report show serious deficiencies in the
implementation of Finacle that have not been resolved to date.
Document management information system was integrated to Finacle in the second semester of 2018. However, the consultant had not been able to verify the existence of loan
documentation in any loan registered.
The report with management information submitted to the CEO with the monthly consolidated
statements does not contain executive information for decision making.
Aspects to include on a term of reference of a comprehensive IT audit might include: 9
• Third-party Security Controls
• Threat and Vulnerability Management
8 Royal Audit Authority. IT Audit Report on Core System in BDB. 9 KPMG. Insights to take you forward. IT internal audit planning for 2020.
21
• Identity and Access Management
• Security Strategy and Governance
• Security Incident Response and Testing Exercises
• Cyber Hygiene
• Personal Security/Insider Threat
• Remote, Mobile, and Wireless Security
• Network Security
• Security Awareness
• Product Security
• Logging and Monitoring
• Operational Technology
• Physical Security
BDB has never conducted an IT Audit.
7.4 Recommendation Finacle is a great instrument to provide up to date actionable information for decision making.
But any system is at the end as good as the quality of the data that has been entered.
In particular:
• Data in the system should be reviewed, errors rectified, and information incorporated
in blank data fields.
• There should be no unreconcilable discrepancies between the output of Finacle and
the information in the financial statements. If any difference exists, it should be easily
explained and reconciled. This should be rectified with urgency.
• All new loan documentation should be inputted in Finacle’s document management
system. An effort should be made to input existing loan documentation with certain deadlines, for example by the end of fiscal year 2020 all loans approved from 2018
should have updated documentation in the system.
• Information from Finacle system should be summarized in easily readable tables and
graphs and presented to management periodically.
• Nelito Systems Ltd quality of services should be reviewed against the specifications in
the contract.
• The results of the RAA and the assessment of this report bring into consideration the
need to conduct an independent IT audit of BDB systems by an experienced firm. This
should be done prior to the conclusion of the 2020 fiscal year.
8 Internal Audit
8.1 Board Audit Committee “The Audit Committee (BAC) has oversight responsibility on behalf of the Board and the
Shareholders to monitor and provide advices and directives on the operation of the Internal
Control system and Internal Activities, Financial reporting, External audit, Account and Legal
compliance of the Bank” 10
The BAC has two or three members with the General Manager of the Internal Audit
Department as member secretary. BAC meets quarterly or in extraordinary meeting if needed or directed by the Board. The Chairman of the Board and the CEO are not be members of the
BAC, following internationally accepted practices of internal audit.
10 BDB Board Audit Charter 2019.

22
The Board Audit charter documents BAC activities clearly and comprehensively.
8.2 Internal Audit Department The internal audit department (IAD) has eleven employees and is headed by a General
Manager that reports to the BAC. The Internal Audit Manual 2019 (IAM) regulates de
standards of practice for the Internal Audit Department. The audit services are classified into regular audit, surprise audit and investigation audit. The auditable units are all financial
services delivery units and support services that use resources of the Bank while discharging
their functions. The regular audit in the auditable units is done at least once in every three
years among the IAD, Royal Audit Authority and external auditors for mitigation of the risk of the bank. The IAM is a comprehensive manual and follows best practices.
23
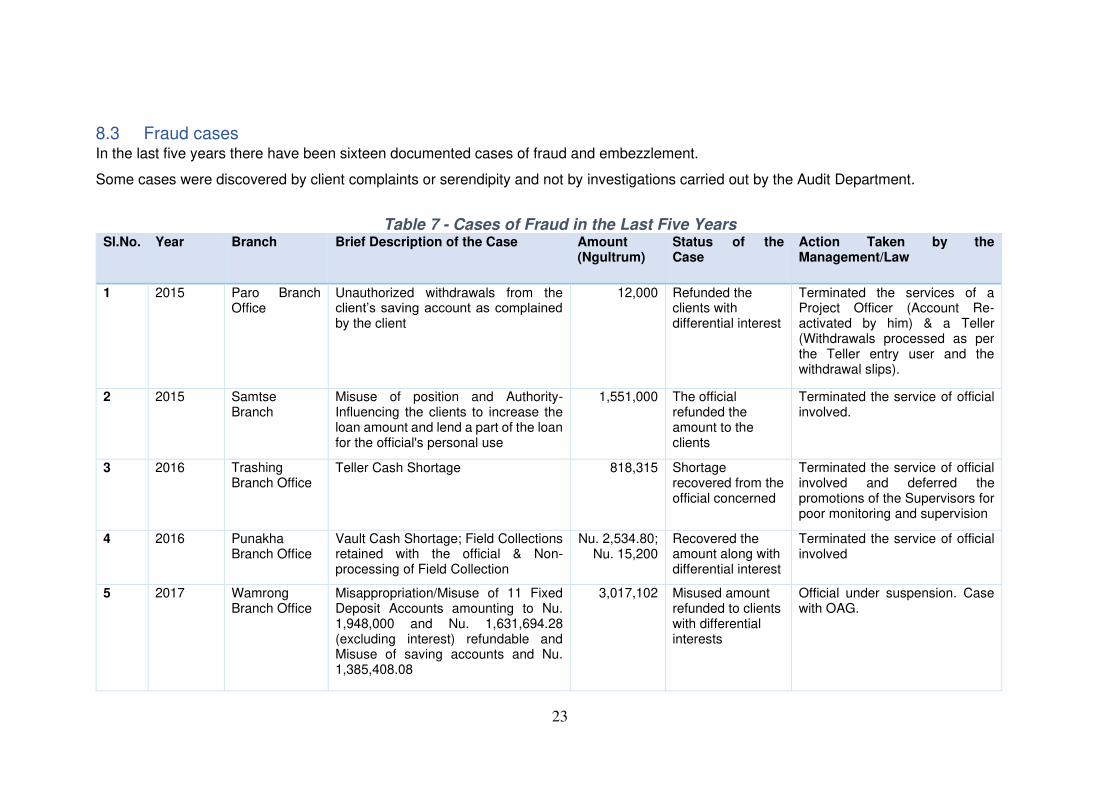
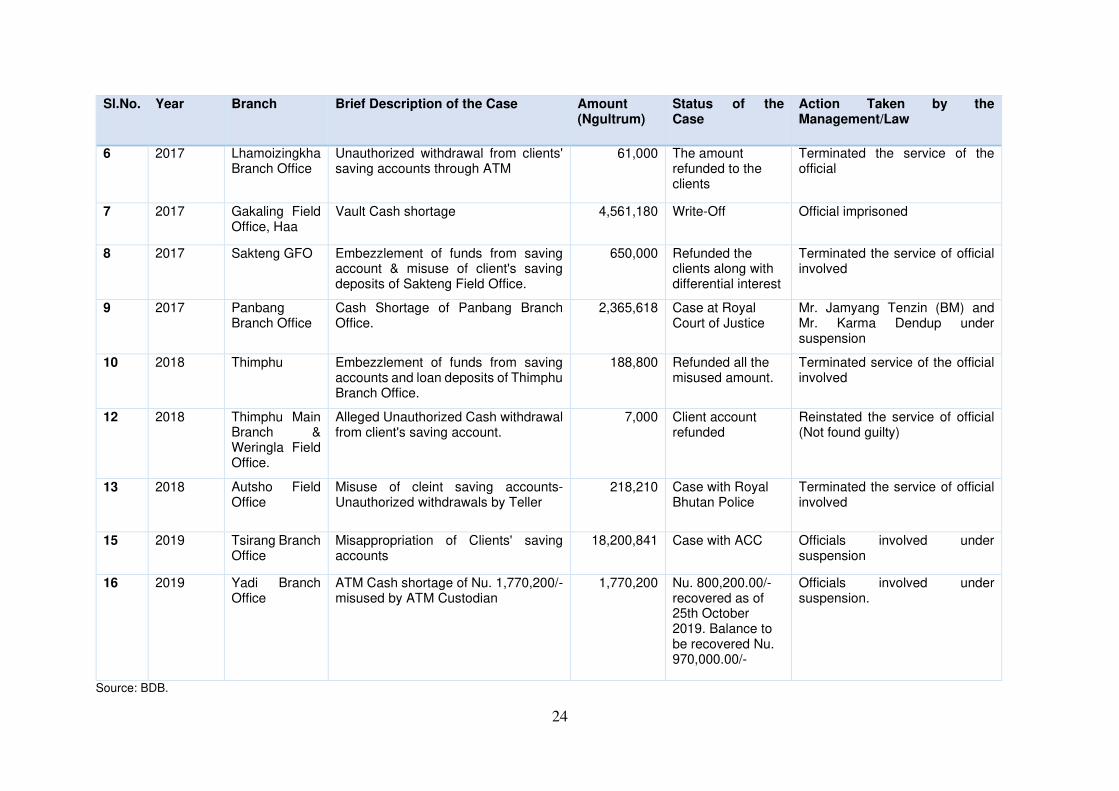
8.3 Fraud cases In the last five years there have been sixteen documented cases of fraud and embezzlement.
Some cases were discovered by client complaints or serendipity and not by investigations carried out by the Audit Department.
Table 7 - Cases of Fraud in the Last Five Years Sl.No. Year Branch Brief Description of the Case Amount
(Ngultrum) Status of the Case
Action Taken by the Management/Law
1 2015 Paro Branch Office
Unauthorized withdrawals from the client’s saving account as complained by the client
12,000 Refunded the clients with differential interest
Terminated the services of a Project Officer (Account Re-activated by him) & a Teller (Withdrawals processed as per the Teller entry user and the withdrawal slips).
2 2015 Samtse Branch
Misuse of position and Authority- Influencing the clients to increase the loan amount and lend a part of the loan for the official's personal use
1,551,000 The official refunded the amount to the clients
Terminated the service of official involved.
3 2016 Trashing Branch Office
Teller Cash Shortage 818,315 Shortage recovered from the official concerned
Terminated the service of official involved and deferred the promotions of the Supervisors for poor monitoring and supervision
4 2016 Punakha Branch Office
Vault Cash Shortage; Field Collections retained with the official & Non-processing of Field Collection
Nu. 2,534.80; Nu. 15,200
Recovered the amount along with differential interest
Terminated the service of official involved
5 2017 Wamrong Branch Office
Misappropriation/Misuse of 11 Fixed Deposit Accounts amounting to Nu. 1,948,000 and Nu. 1,631,694.28 (excluding interest) refundable and Misuse of saving accounts and Nu. 1,385,408.08
3,017,102 Misused amount refunded to clients with differential interests
Official under suspension. Case with OAG.
24
Sl.No. Year Branch Brief Description of the Case Amount (Ngultrum)
Status of the Case
Action Taken by the Management/Law
6 2017 Lhamoizingkha Branch Office
Unauthorized withdrawal from clients' saving accounts through ATM
61,000 The amount refunded to the clients
Terminated the service of the official
7 2017 Gakaling Field Office, Haa
Vault Cash shortage 4,561,180 Write-Off Official imprisoned
8 2017 Sakteng GFO Embezzlement of funds from saving account & misuse of client's saving deposits of Sakteng Field Office.
650,000 Refunded the clients along with differential interest
Terminated the service of official involved
9 2017 Panbang Branch Office
Cash Shortage of Panbang Branch Office.
2,365,618 Case at Royal Court of Justice
Mr. Jamyang Tenzin (BM) and Mr. Karma Dendup under suspension
10 2018 Thimphu Embezzlement of funds from saving accounts and loan deposits of Thimphu Branch Office.
188,800 Refunded all the misused amount.
Terminated service of the official involved
12 2018 Thimphu Main Branch & Weringla Field Office.
Alleged Unauthorized Cash withdrawal from client's saving account.
7,000 Client account refunded
Reinstated the service of official (Not found guilty)
13 2018 Autsho Field Office
Misuse of cleint saving accounts- Unauthorized withdrawals by Teller
218,210 Case with Royal Bhutan Police
Terminated the service of official involved
15 2019 Tsirang Branch Office
Misappropriation of Clients' saving accounts
18,200,841 Case with ACC Officials involved under suspension
16 2019 Yadi Branch Office
ATM Cash shortage of Nu. 1,770,200/- misused by ATM Custodian
1,770,200 Nu. 800,200.00/- recovered as of 25th October 2019. Balance to be recovered Nu. 970,000.00/-
Officials involved under suspension.
Source: BDB.
25
The largest case was uncovered in 2019:
Misappropriation of clients’ savings accounts The total refundable amount to clients for misappropriation were Nu 18.7 million.
Two tellers stole from client’s savings accounts through issuance of fake receipts, by forging the clients’ signatures and manipulating saving accounts in the system. The embezzlement
scheme went through from 2012.
The Internal Audit Department investigation cites as causes of the lapse in control:
• Poor staff integrity
• Poor supervisory control and huge leeway given to the tellers. It is not proper for the tellers who are responsible for the front office transactions to also carry out back office
transactions.
• Loan and savings balance confirmation not done. Practice is to carry out loans and
savings balance confirmation at least once a year. If practice would have been followed
the fraud would have not taken place.
• Staff transfer not done in time.
• System password sharing. Tellers used passwords allegedly shared by a project officer
and the branch assistant.
8.4 Assessment and Recommendations BDB has in place all the procedures and manuals necessary to minimize the fraud cases.
Most of the cases identified were the consequence of lapses in following procedures in place,
particularly the dual “maker and checker” process and the segregation of duties principle. The
lapses are not the product of poor procedures but a failure to apply them.
Management explains these lapses by not having enough personnel in every branch. If a
branch is not viable with the cost of having enough personnel to operate with the controls
established in the procedures of the bank, then consideration should be given to its closure or
continuing operations with adequate staffing and a cross subsidy from profitable branches. Under no circumstances exceptions to control procedures should be allowed. Internal audit
should include an assessment of the appropriateness of each branch staffing to adequately
follow procedures. Branch managers should be adequately informed of a zero-tolerance policy
and cases of no compliance taken seriously with the potential of separation of employment
from the bank.
9 Risk Management
BDB has a Risk Management Division, a Risk Management Committee, and a Risk
Management Board Committee.
The Risk Management Division is staffed with two credit officers and a division head. It produces monthly reports that are circulated to the CEO and BDB general managers.
The report is well organized and summarizes the risk status for five risk categories: Credit risk,
operational risk, reputational risk, market risk and liquidity risk. Areas in which the reporting
can be improved include branch analysis, asset liability maturity mismatch and scenario analysis. The report should include a more detail analysis of the credit management, including
the analysis and graphs presented in section 10.2 of this report.
26
10 Products
10.1 Deposits 11
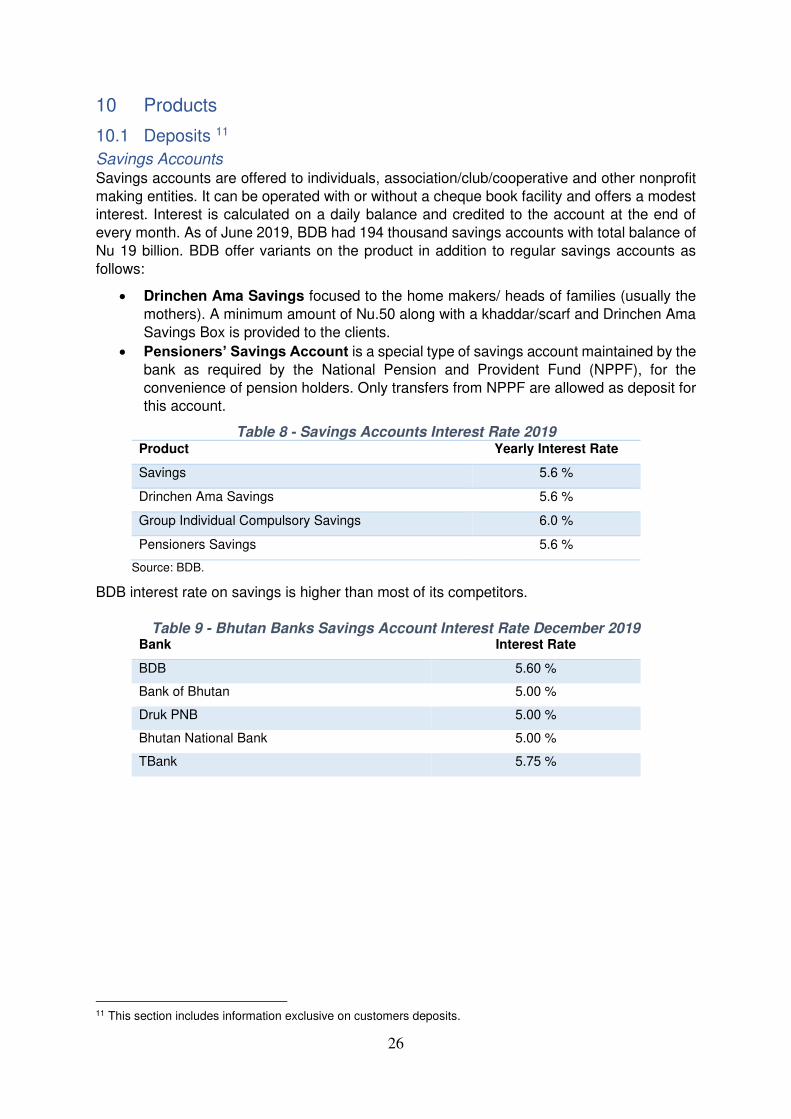
Savings Accounts Savings accounts are offered to individuals, association/club/cooperative and other nonprofit
making entities. It can be operated with or without a cheque book facility and offers a modest interest. Interest is calculated on a daily balance and credited to the account at the end of
every month. As of June 2019, BDB had 194 thousand savings accounts with total balance of
Nu 19 billion. BDB offer variants on the product in addition to regular savings accounts as
follows:
• Drinchen Ama Savings focused to the home makers/ heads of families (usually the
mothers). A minimum amount of Nu.50 along with a khaddar/scarf and Drinchen Ama
Savings Box is provided to the clients.
• Pensioners’ Savings Account is a special type of savings account maintained by the
bank as required by the National Pension and Provident Fund (NPPF), for the
convenience of pension holders. Only transfers from NPPF are allowed as deposit for this account.
Table 8 - Savings Accounts Interest Rate 2019 Product Yearly Interest Rate
Savings 5.6 %
Drinchen Ama Savings 5.6 %
Group Individual Compulsory Savings 6.0 %
Pensioners Savings 5.6 %
Source: BDB.
BDB interest rate on savings is higher than most of its competitors.
Table 9 - Bhutan Banks Savings Account Interest Rate December 2019 Bank Interest Rate
BDB 5.60 %
Bank of Bhutan 5.00 %
Druk PNB 5.00 %
Bhutan National Bank 5.00 %
TBank 5.75 %
11 This section includes information exclusive on customers deposits.
27
Current Deposit Accounts Current deposit accounts are not-interest bearing deposit accounts that enable customer to
handle their transactions, collect checks/bills and make payments. Individuals, firms,
associations, limited companies and government departments can open current deposit accounts. The bank does not charge a maintenance fee for current accounts. As of October
2019, BDB had 117 corporate current deposit accounts.
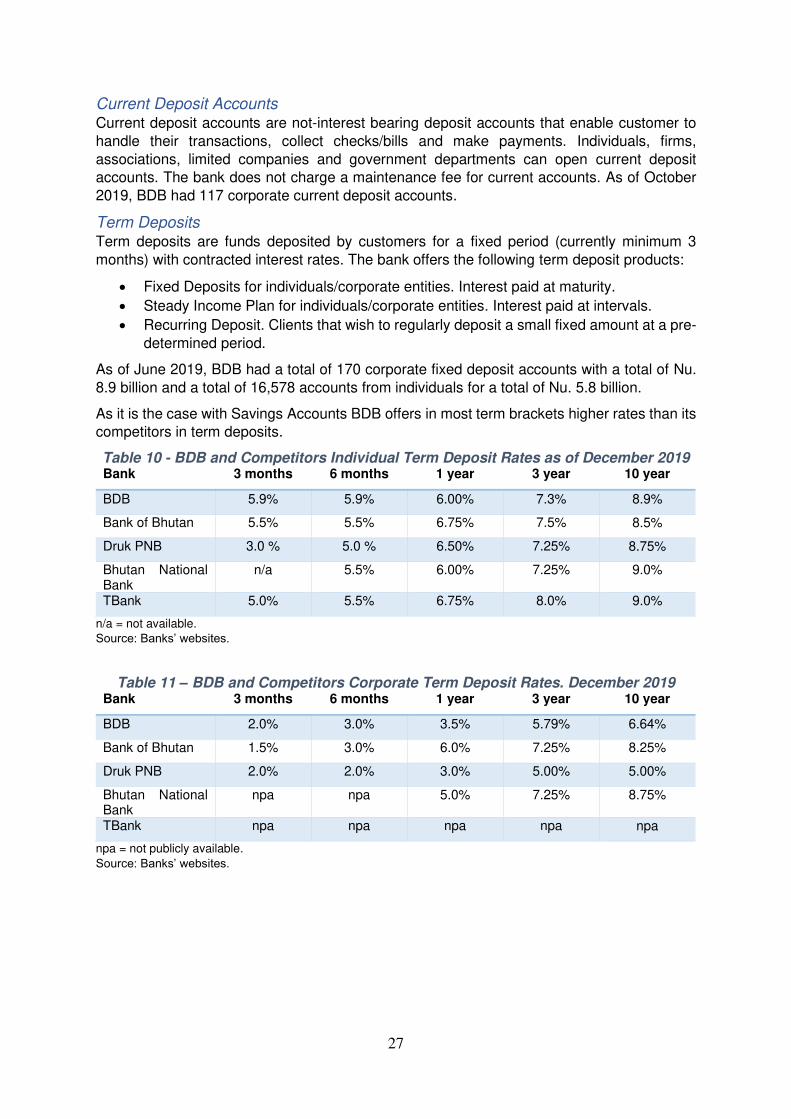
Term Deposits Term deposits are funds deposited by customers for a fixed period (currently minimum 3
months) with contracted interest rates. The bank offers the following term deposit products:
• Fixed Deposits for individuals/corporate entities. Interest paid at maturity.
• Steady Income Plan for individuals/corporate entities. Interest paid at intervals.
• Recurring Deposit. Clients that wish to regularly deposit a small fixed amount at a pre-
determined period.
As of June 2019, BDB had a total of 170 corporate fixed deposit accounts with a total of Nu.
8.9 billion and a total of 16,578 accounts from individuals for a total of Nu. 5.8 billion.
As it is the case with Savings Accounts BDB offers in most term brackets higher rates than its competitors in term deposits.
Table 10 - BDB and Competitors Individual Term Deposit Rates as of December 2019 Bank 3 months 6 months 1 year 3 year 10 year
BDB 5.9% 5.9% 6.00% 7.3% 8.9%
Bank of Bhutan 5.5% 5.5% 6.75% 7.5% 8.5%
Druk PNB 3.0 % 5.0 % 6.50% 7.25% 8.75%
Bhutan National Bank
n/a 5.5% 6.00% 7.25% 9.0%
TBank 5.0% 5.5% 6.75% 8.0% 9.0%
n/a = not available.
Source: Banks’ websites.
Table 11 – BDB and Competitors Corporate Term Deposit Rates. December 2019 Bank 3 months 6 months 1 year 3 year 10 year
BDB 2.0% 3.0% 3.5% 5.79% 6.64%
Bank of Bhutan 1.5% 3.0% 6.0% 7.25% 8.25%
Druk PNB 2.0% 2.0% 3.0% 5.00% 5.00%
Bhutan National Bank
npa npa 5.0% 7.25% 8.75%
TBank npa npa npa npa npa
npa = not publicly available.
Source: Banks’ websites.
28
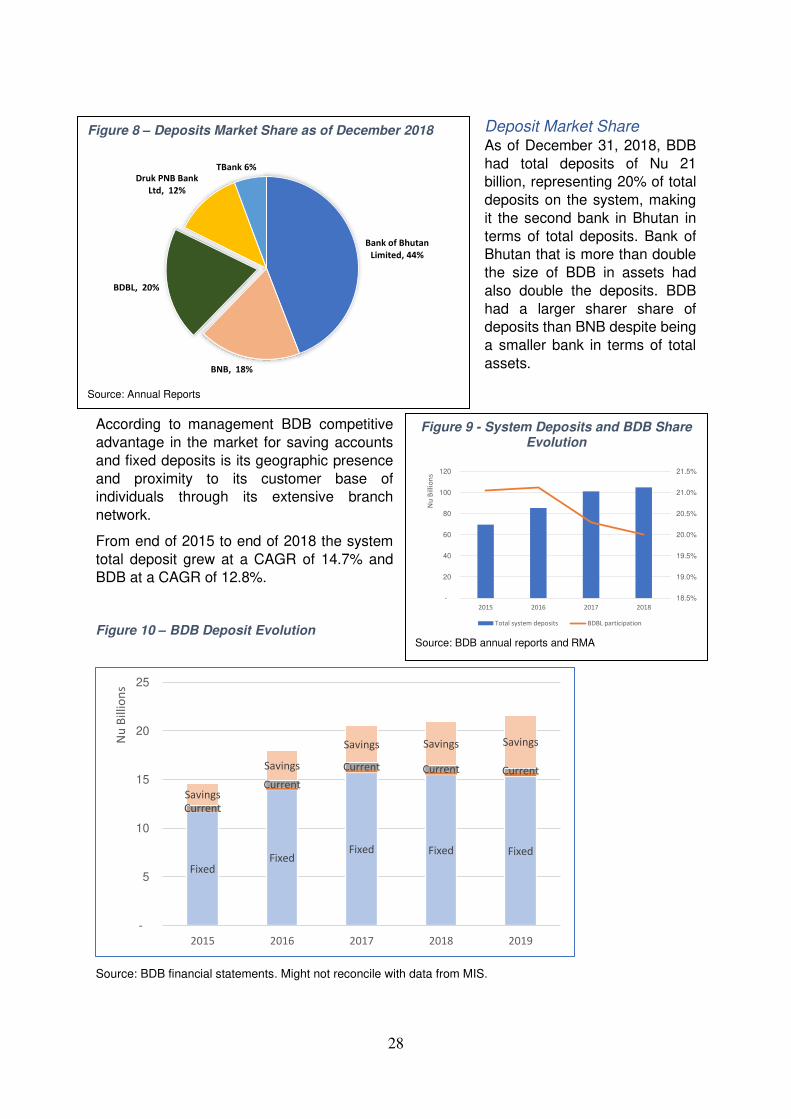
Deposit Market Share As of December 31, 2018, BDB
had total deposits of Nu 21 billion, representing 20% of total
deposits on the system, making
it the second bank in Bhutan in
terms of total deposits. Bank of Bhutan that is more than double
the size of BDB in assets had
also double the deposits. BDB
had a larger sharer share of deposits than BNB despite being
a smaller bank in terms of total
assets.
According to management BDB competitive
advantage in the market for saving accounts
and fixed deposits is its geographic presence
and proximity to its customer base of individuals through its extensive branch
network.
From end of 2015 to end of 2018 the system
total deposit grew at a CAGR of 14.7% and BDB at a CAGR of 12.8%.
Figure 10 – BDB Deposit Evolution
Source: BDB financial statements. Might not reconcile with data from MIS.
FixedFixed
Fixed Fixed Fixed
Current
Current
Current Current Current
Savings
Savings
Savings Savings Savings
-
5
10
15
20
25
2015 2016 2017 2018 2019
Nu
Bil
lio
ns
Figure 8 – Deposits Market Share as of December 2018
Source: Annual Reports
Bank of Bhutan
Limited, 44%
BNB, 18%
BDBL, 20%
Druk PNB Bank
Ltd, 12%
TBank 6%
Figure 9 - System Deposits and BDB Share Evolution
Source: BDB annual reports and RMA
18.5%
19.0%
19.5%
20.0%
20.5%
21.0%
21.5%
-
20
40
60
80
100
120
2015 2016 2017 2018
Nu
Bil
lio
ns
Total system deposits BDBL participation
29
From 2015 to 2018 interest bearing deposits represented the largest portion of BDB deposits.
BDB was able to increase the participation of lower yielding savings deposits in the mix.
Delivery channels BDB customers can have access through the network of 35 branches and 26 Geog field offices, ATMs in 39 locations and -since 2020- through internet and mobile banking (BDB
epay) BDB epay offers account statements, fund transfers, bill payment, loan repayment,
mobile eload and cardless cash withdrawal.
Deposits - Assessment and Recommendations BDB has a market share of deposits in relation with its size and further increasing it might not be possible.
BDB has a disproportionate higher share on fixed deposits (29% of the market) because of its
higher interest rates and a negligible share of current deposits (2% of the market). In
December 2018 the market mix of current accounts/total deposits was 23% while BDB was only 3%. This difference in the deposit mix to the market translates in a higher cost of funding
for BDB than that of other commercial banks.
Management indicated that one reason behind the low participation in current accounts is that
Bhutan’s government and SOEs operate through Bank of Bhutan. Also, government employees have their salaries directedly deposit to Bank of Bhutan. Management is
negotiating with the government to have access to its funds, particularly in the gewogs, where
BDB can provide better service than the competition.
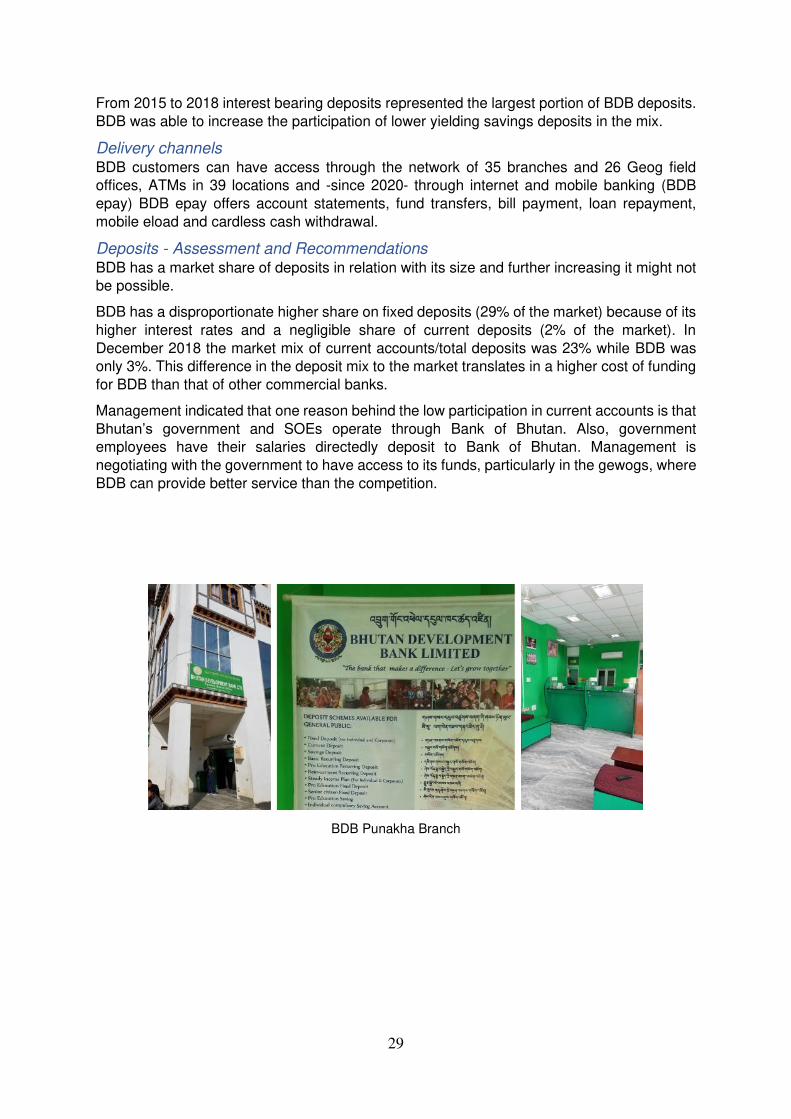
BDB Punakha Branch
30
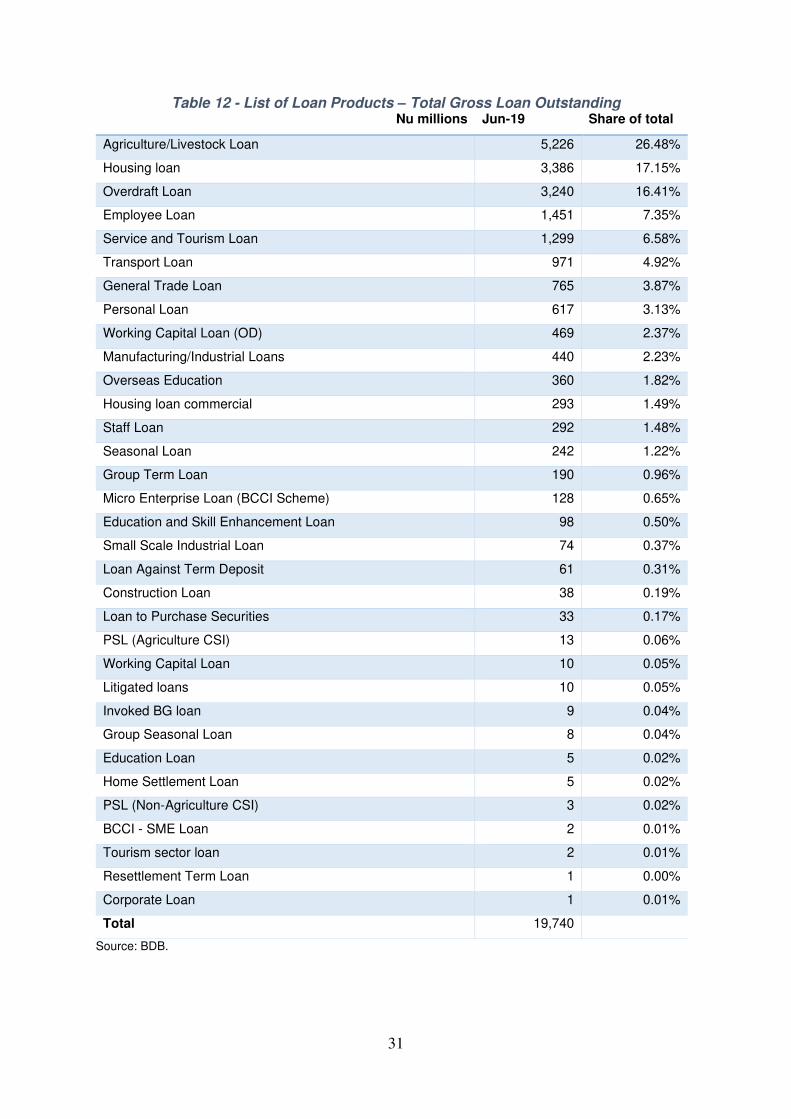
10.2 Loans 12
Loan Products According to the lending rates directives of the BOD BDB has a list of 33 active loan products.
Finacle MIS includes a data field for type of loan product. The 2019 credit manual does not
offer a list of products but a categorization by sector that does not match the product list.
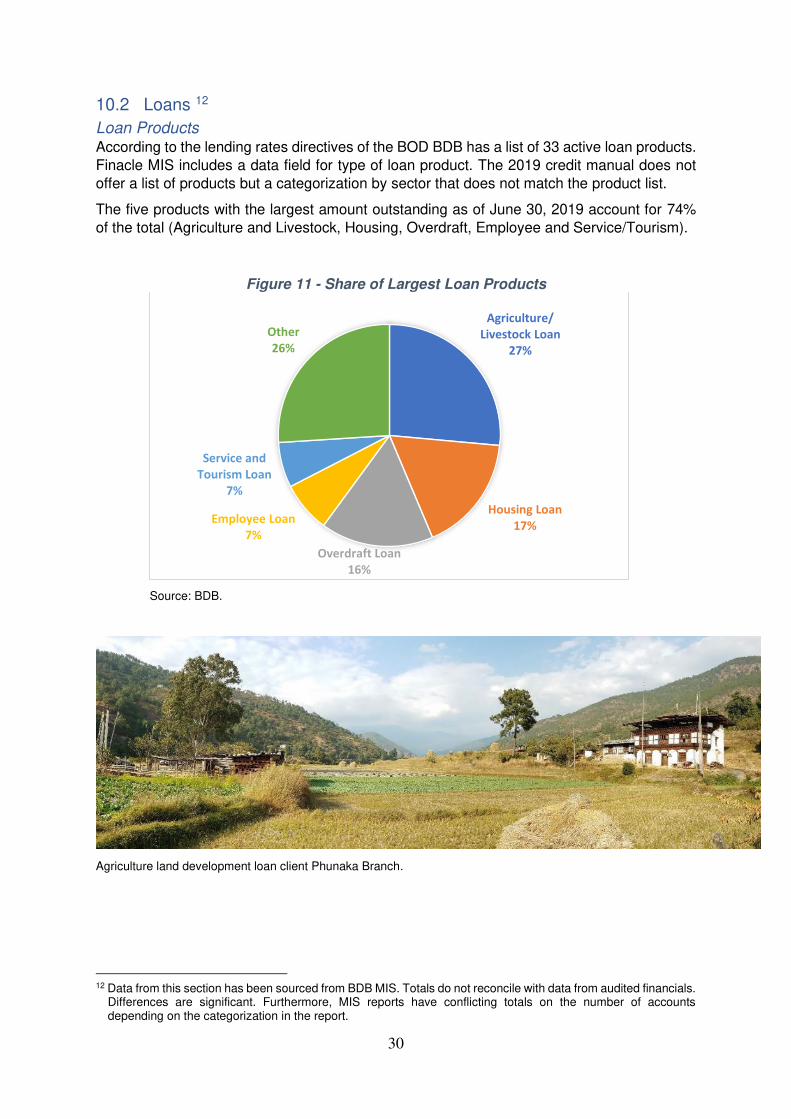
The five products with the largest amount outstanding as of June 30, 2019 account for 74%
of the total (Agriculture and Livestock, Housing, Overdraft, Employee and Service/Tourism).
Figure 11 - Share of Largest Loan Products
Source: BDB.
Agriculture land development loan client Phunaka Branch.
12 Data from this section has been sourced from BDB MIS. Totals do not reconcile with data from audited financials.
Differences are significant. Furthermore, MIS reports have conflicting totals on the number of accounts depending on the categorization in the report.
Agriculture/
Livestock Loan
27%
Housing Loan
17%
Overdraft Loan
16%
Employee Loan
7%
Service and
Tourism Loan
7%
Other
26%
31
Table 12 - List of Loan Products – Total Gross Loan Outstanding Nu millions Jun-19 Share of total
Agriculture/Livestock Loan 5,226 26.48%
Housing loan 3,386 17.15%
Overdraft Loan 3,240 16.41%
Employee Loan 1,451 7.35%
Service and Tourism Loan 1,299 6.58%
Transport Loan 971 4.92%
General Trade Loan 765 3.87%
Personal Loan 617 3.13%
Working Capital Loan (OD) 469 2.37%
Manufacturing/Industrial Loans 440 2.23%
Overseas Education 360 1.82%
Housing loan commercial 293 1.49%
Staff Loan 292 1.48%
Seasonal Loan 242 1.22%
Group Term Loan 190 0.96%
Micro Enterprise Loan (BCCI Scheme) 128 0.65%
Education and Skill Enhancement Loan 98 0.50%
Small Scale Industrial Loan 74 0.37%
Loan Against Term Deposit 61 0.31%
Construction Loan 38 0.19%
Loan to Purchase Securities 33 0.17%
PSL (Agriculture CSI) 13 0.06%
Working Capital Loan 10 0.05%
Litigated loans 10 0.05%
Invoked BG loan 9 0.04%
Group Seasonal Loan 8 0.04%
Education Loan 5 0.02%
Home Settlement Loan 5 0.02%
PSL (Non-Agriculture CSI) 3 0.02%
BCCI - SME Loan 2 0.01%
Tourism sector loan 2 0.01%
Resettlement Term Loan 1 0.00%
Corporate Loan 1 0.01%
Total 19,740
Source: BDB.
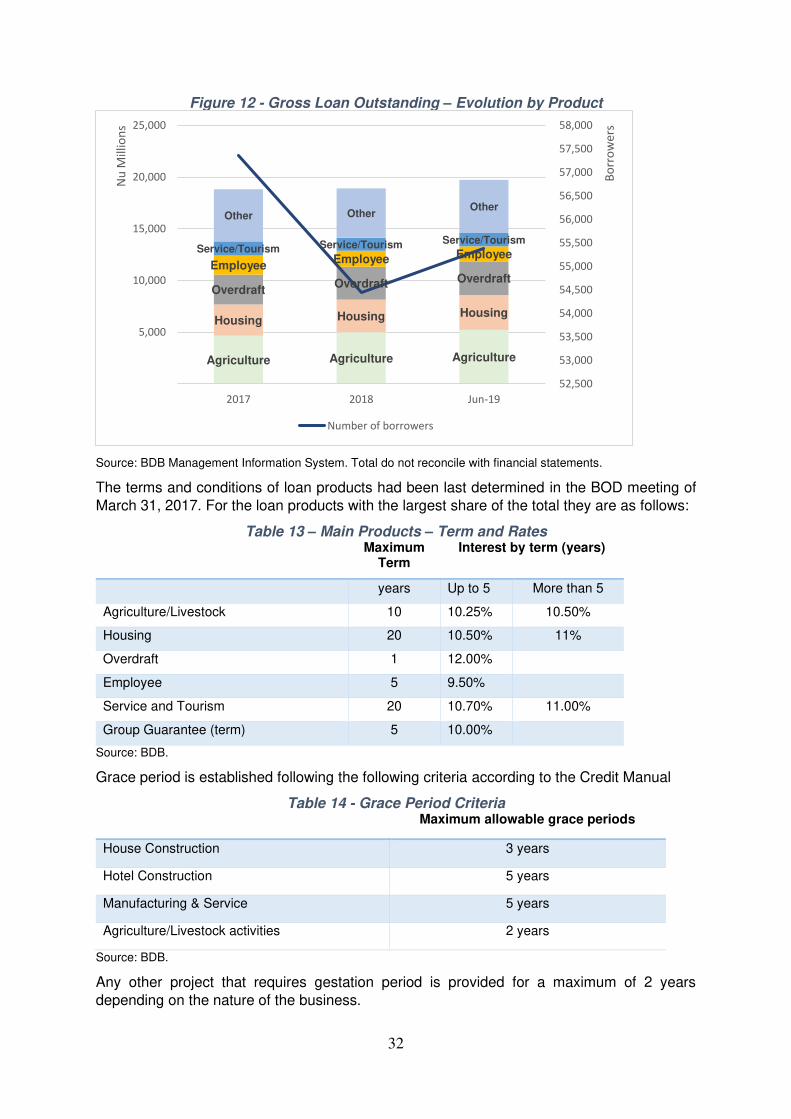
32
Figure 12 - Gross Loan Outstanding – Evolution by Product
Source: BDB Management Information System. Total do not reconcile with financial statements.
The terms and conditions of loan products had been last determined in the BOD meeting of March 31, 2017. For the loan products with the largest share of the total they are as follows:
Table 13 – Main Products – Term and Rates Maximum
Term Interest by term (years)
years Up to 5 More than 5
Agriculture/Livestock 10 10.25% 10.50%
Housing 20 10.50% 11%
Overdraft 1 12.00%
Employee 5 9.50%
Service and Tourism 20 10.70% 11.00%
Group Guarantee (term) 5 10.00%
Source: BDB.
Grace period is established following the following criteria according to the Credit Manual
Table 14 - Grace Period Criteria Maximum allowable grace periods
House Construction 3 years
Hotel Construction 5 years
Manufacturing & Service 5 years
Agriculture/Livestock activities 2 years
Source: BDB.
Any other project that requires gestation period is provided for a maximum of 2 years depending on the nature of the business.
Agriculture Agriculture Agriculture
Housing Housing Housing
Overdraft Overdraft Overdraft
Employee Employee Employee
Service/Tourism Service/Tourism Service/Tourism
Other OtherOther
52,500
53,000
53,500
54,000
54,500
55,000
55,500
56,000
56,500
57,000
57,500
58,000
5,000
10,000
15,000
20,000
25,000
2017 2018 Jun-19
Bo
rro
we
rs
Nu
Mil
lio
ns
Number of borrowers
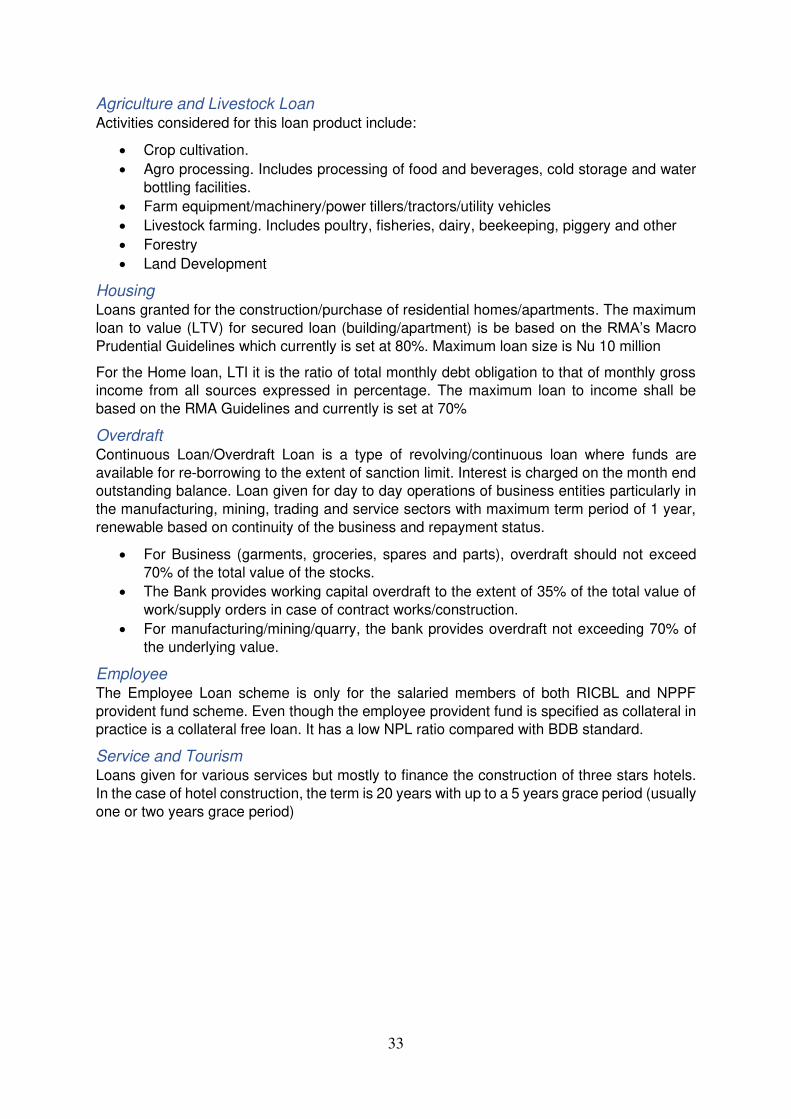
33
Agriculture and Livestock Loan Activities considered for this loan product include:
• Crop cultivation.
• Agro processing. Includes processing of food and beverages, cold storage and water
bottling facilities.
• Farm equipment/machinery/power tillers/tractors/utility vehicles
• Livestock farming. Includes poultry, fisheries, dairy, beekeeping, piggery and other
• Forestry
• Land Development
Housing Loans granted for the construction/purchase of residential homes/apartments. The maximum
loan to value (LTV) for secured loan (building/apartment) is be based on the RMA’s Macro Prudential Guidelines which currently is set at 80%. Maximum loan size is Nu 10 million
For the Home loan, LTI it is the ratio of total monthly debt obligation to that of monthly gross income from all sources expressed in percentage. The maximum loan to income shall be
based on the RMA Guidelines and currently is set at 70%
Overdraft Continuous Loan/Overdraft Loan is a type of revolving/continuous loan where funds are
available for re-borrowing to the extent of sanction limit. Interest is charged on the month end outstanding balance. Loan given for day to day operations of business entities particularly in
the manufacturing, mining, trading and service sectors with maximum term period of 1 year,
renewable based on continuity of the business and repayment status.
• For Business (garments, groceries, spares and parts), overdraft should not exceed
70% of the total value of the stocks.
• The Bank provides working capital overdraft to the extent of 35% of the total value of
work/supply orders in case of contract works/construction.
• For manufacturing/mining/quarry, the bank provides overdraft not exceeding 70% of
the underlying value.
Employee The Employee Loan scheme is only for the salaried members of both RICBL and NPPF
provident fund scheme. Even though the employee provident fund is specified as collateral in practice is a collateral free loan. It has a low NPL ratio compared with BDB standard.
Service and Tourism Loans given for various services but mostly to finance the construction of three stars hotels.
In the case of hotel construction, the term is 20 years with up to a 5 years grace period (usually
one or two years grace period)
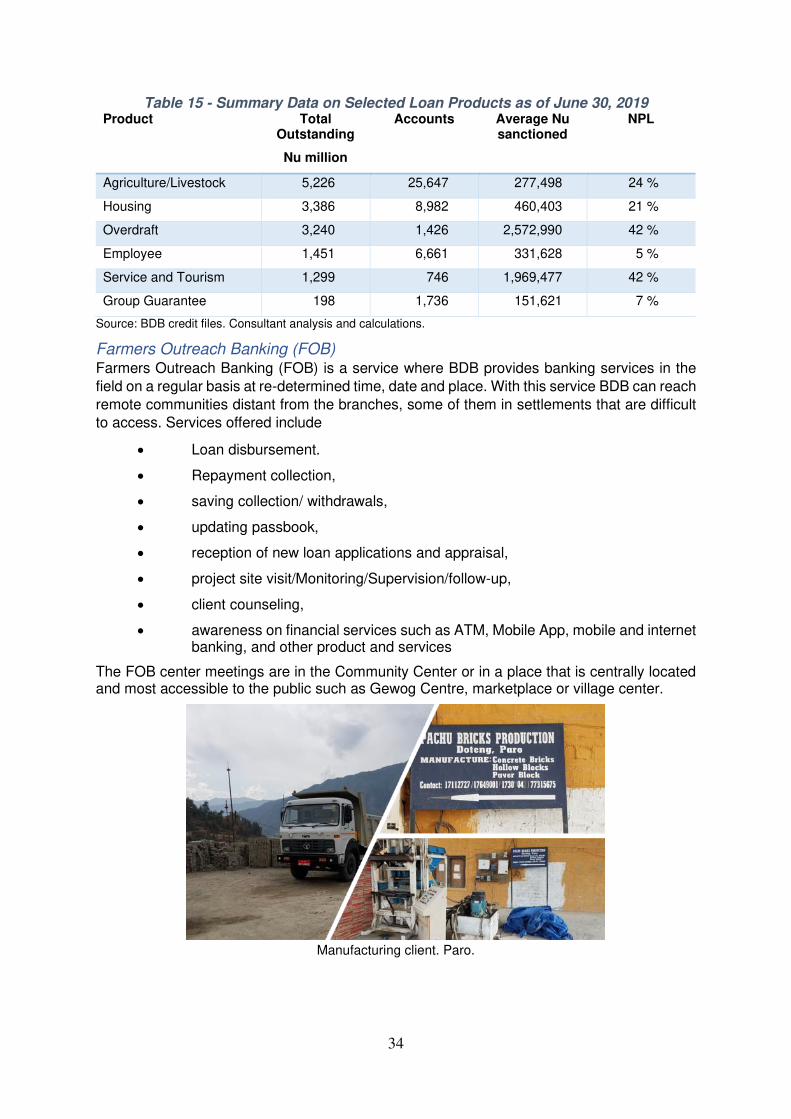
34
Table 15 - Summary Data on Selected Loan Products as of June 30, 2019 Product Total
Outstanding
Nu million
Accounts Average Nu sanctioned
NPL
Agriculture/Livestock 5,226 25,647 277,498 24 %
Housing 3,386 8,982 460,403 21 %
Overdraft 3,240 1,426 2,572,990 42 %
Employee 1,451 6,661 331,628 5 %
Service and Tourism 1,299 746 1,969,477 42 %
Group Guarantee 198 1,736 151,621 7 %
Source: BDB credit files. Consultant analysis and calculations.
Farmers Outreach Banking (FOB) Farmers Outreach Banking (FOB) is a service where BDB provides banking services in the
field on a regular basis at re-determined time, date and place. With this service BDB can reach
remote communities distant from the branches, some of them in settlements that are difficult to access. Services offered include
• Loan disbursement.
• Repayment collection,
• saving collection/ withdrawals,
• updating passbook,
• reception of new loan applications and appraisal,
• project site visit/Monitoring/Supervision/follow-up,
• client counseling,
• awareness on financial services such as ATM, Mobile App, mobile and internet banking, and other product and services
The FOB center meetings are in the Community Center or in a place that is centrally located and most accessible to the public such as Gewog Centre, marketplace or village center.
Manufacturing client. Paro.
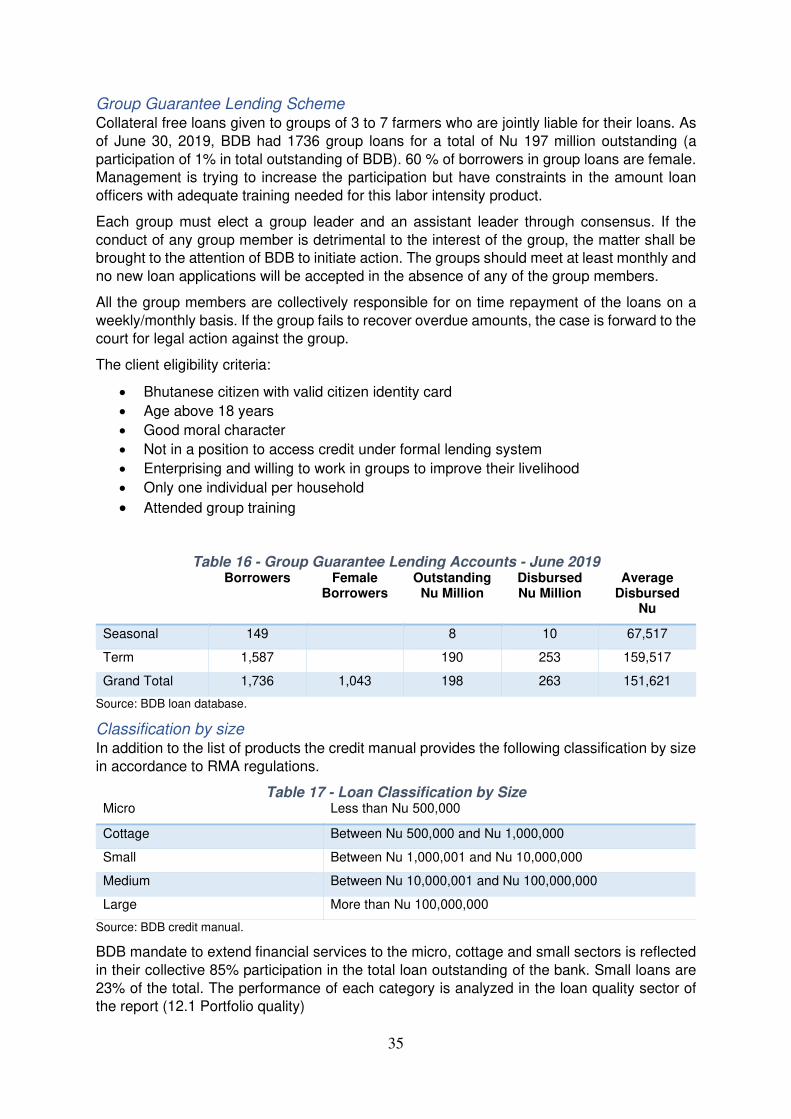
35
Group Guarantee Lending Scheme Collateral free loans given to groups of 3 to 7 farmers who are jointly liable for their loans. As
of June 30, 2019, BDB had 1736 group loans for a total of Nu 197 million outstanding (a
participation of 1% in total outstanding of BDB). 60 % of borrowers in group loans are female. Management is trying to increase the participation but have constraints in the amount loan
officers with adequate training needed for this labor intensity product.
Each group must elect a group leader and an assistant leader through consensus. If the
conduct of any group member is detrimental to the interest of the group, the matter shall be brought to the attention of BDB to initiate action. The groups should meet at least monthly and
no new loan applications will be accepted in the absence of any of the group members.
All the group members are collectively responsible for on time repayment of the loans on a
weekly/monthly basis. If the group fails to recover overdue amounts, the case is forward to the court for legal action against the group.
The client eligibility criteria:
• Bhutanese citizen with valid citizen identity card
• Age above 18 years
• Good moral character
• Not in a position to access credit under formal lending system
• Enterprising and willing to work in groups to improve their livelihood
• Only one individual per household
• Attended group training
Table 16 - Group Guarantee Lending Accounts - June 2019 Borrowers Female
Borrowers Outstanding
Nu Million Disbursed Nu Million
Average Disbursed
Nu
Seasonal 149 8 10 67,517
Term 1,587 190 253 159,517
Grand Total 1,736 1,043 198 263 151,621
Source: BDB loan database.
Classification by size In addition to the list of products the credit manual provides the following classification by size
in accordance to RMA regulations.
Table 17 - Loan Classification by Size Micro Less than Nu 500,000
Cottage Between Nu 500,000 and Nu 1,000,000
Small Between Nu 1,000,001 and Nu 10,000,000
Medium Between Nu 10,000,001 and Nu 100,000,000
Large More than Nu 100,000,000
Source: BDB credit manual.
BDB mandate to extend financial services to the micro, cottage and small sectors is reflected
in their collective 85% participation in the total loan outstanding of the bank. Small loans are
23% of the total. The performance of each category is analyzed in the loan quality sector of the report (12.1 Portfolio quality)
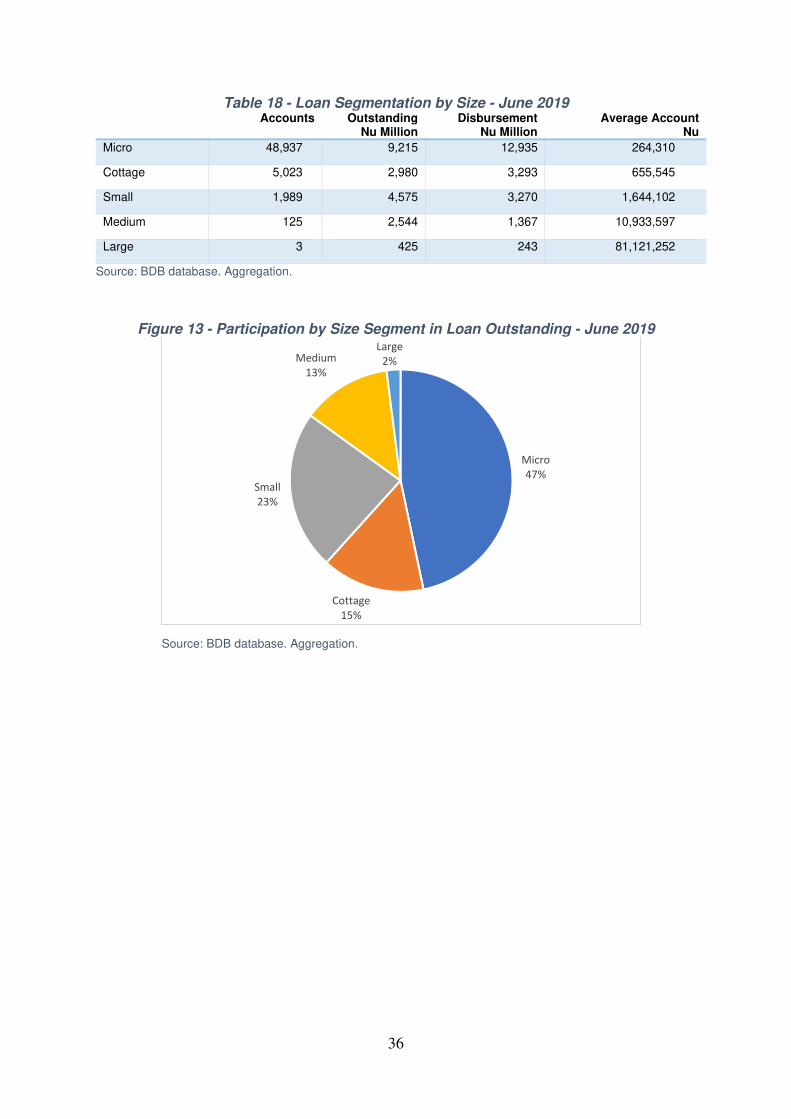
36
Table 18 - Loan Segmentation by Size - June 2019 Accounts Outstanding
Nu Million Disbursement
Nu Million Average Account
Nu
Micro 48,937 9,215 12,935 264,310
Cottage 5,023 2,980 3,293 655,545
Small 1,989 4,575 3,270 1,644,102
Medium 125 2,544 1,367 10,933,597
Large 3 425 243 81,121,252
Source: BDB database. Aggregation.
Figure 13 - Participation by Size Segment in Loan Outstanding - June 2019
Source: BDB database. Aggregation.
Micro
47%
Cottage
15%
Small
23%
Medium
13%
Large
2%
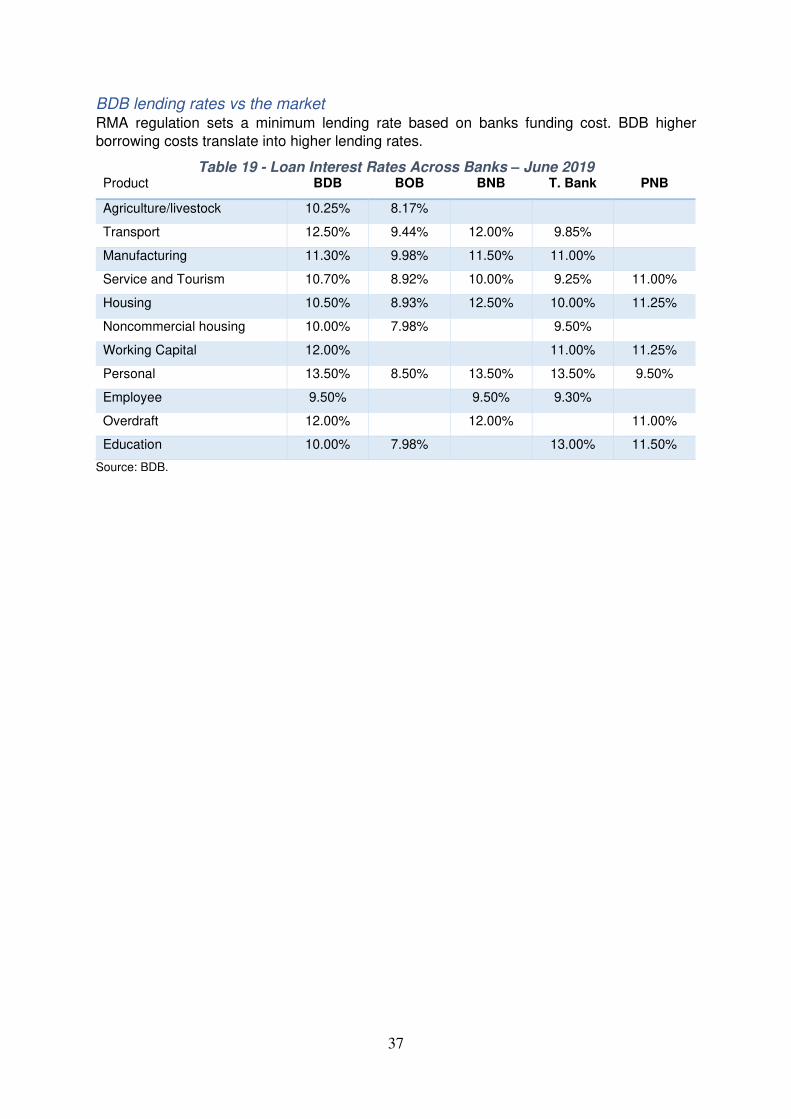
37
BDB lending rates vs the market RMA regulation sets a minimum lending rate based on banks funding cost. BDB higher
borrowing costs translate into higher lending rates.
Table 19 - Loan Interest Rates Across Banks – June 2019 Product BDB BOB BNB T. Bank PNB
Agriculture/livestock 10.25% 8.17%
Transport 12.50% 9.44% 12.00% 9.85%
Manufacturing 11.30% 9.98% 11.50% 11.00%
Service and Tourism 10.70% 8.92% 10.00% 9.25% 11.00%
Housing 10.50% 8.93% 12.50% 10.00% 11.25%
Noncommercial housing 10.00% 7.98% 9.50%
Working Capital 12.00% 11.00% 11.25%
Personal 13.50% 8.50% 13.50% 13.50% 9.50%
Employee 9.50% 9.50% 9.30%
Overdraft 12.00% 12.00% 11.00%
Education 10.00% 7.98% 13.00% 11.50%
Source: BDB.
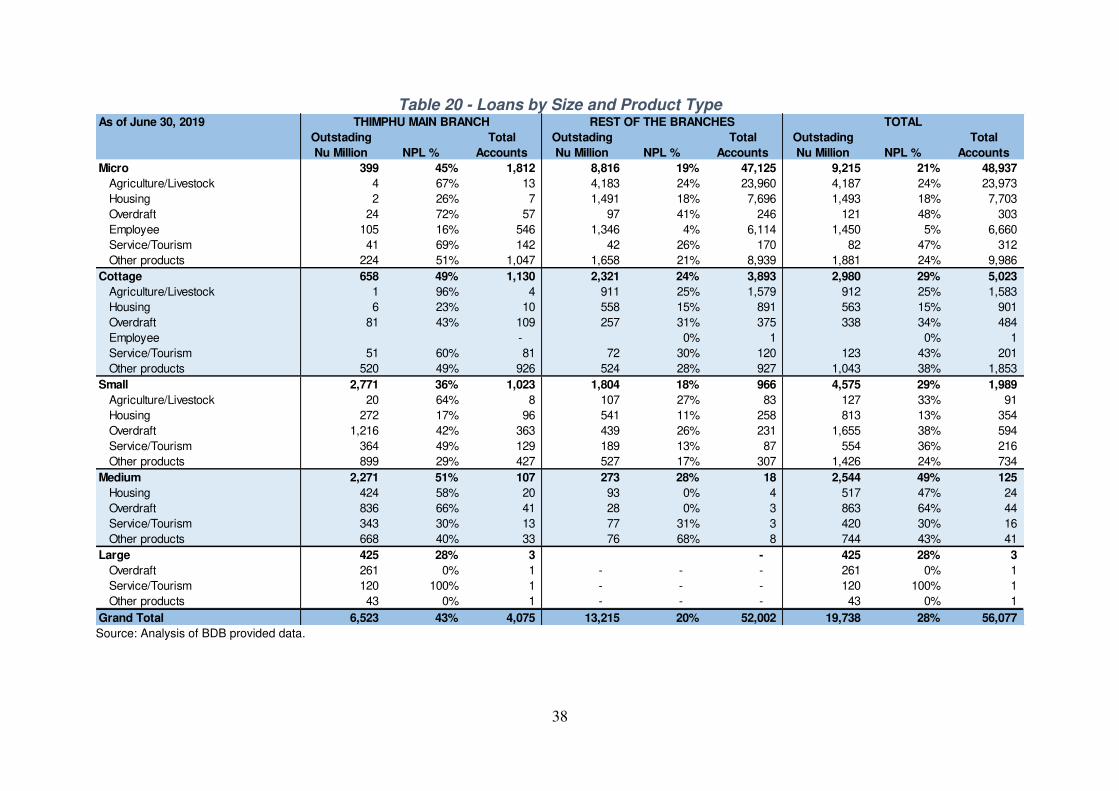
38
Table 20 - Loans by Size and Product Type
Source: Analysis of BDB provided data.
As of June 30, 2019
Outstading Total Outstading Total Outstading Total
Nu Million NPL % Accounts Nu Million NPL % Accounts Nu Million NPL % Accounts
Micro 399 45% 1,812 8,816 19% 47,125 9,215 21% 48,937
Agriculture/Livestock 4 67% 13 4,183 24% 23,960 4,187 24% 23,973
Housing 2 26% 7 1,491 18% 7,696 1,493 18% 7,703
Overdraft 24 72% 57 97 41% 246 121 48% 303
Employee 105 16% 546 1,346 4% 6,114 1,450 5% 6,660
Service/Tourism 41 69% 142 42 26% 170 82 47% 312
Other products 224 51% 1,047 1,658 21% 8,939 1,881 24% 9,986
Cottage 658 49% 1,130 2,321 24% 3,893 2,980 29% 5,023
Agriculture/Livestock 1 96% 4 911 25% 1,579 912 25% 1,583
Housing 6 23% 10 558 15% 891 563 15% 901
Overdraft 81 43% 109 257 31% 375 338 34% 484
Employee - 0% 1 0% 1
Service/Tourism 51 60% 81 72 30% 120 123 43% 201
Other products 520 49% 926 524 28% 927 1,043 38% 1,853
Small 2,771 36% 1,023 1,804 18% 966 4,575 29% 1,989
Agriculture/Livestock 20 64% 8 107 27% 83 127 33% 91
Housing 272 17% 96 541 11% 258 813 13% 354
Overdraft 1,216 42% 363 439 26% 231 1,655 38% 594
Service/Tourism 364 49% 129 189 13% 87 554 36% 216
Other products 899 29% 427 527 17% 307 1,426 24% 734
Medium 2,271 51% 107 273 28% 18 2,544 49% 125
Housing 424 58% 20 93 0% 4 517 47% 24
Overdraft 836 66% 41 28 0% 3 863 64% 44
Service/Tourism 343 30% 13 77 31% 3 420 30% 16
Other products 668 40% 33 76 68% 8 744 43% 41
Large 425 28% 3 - 425 28% 3
Overdraft 261 0% 1 - - - 261 0% 1
Service/Tourism 120 100% 1 - - - 120 100% 1
Other products 43 0% 1 - - - 43 0% 1
Grand Total 6,523 43% 4,075 13,215 20% 52,002 19,738 28% 56,077
THIMPHU MAIN BRANCH REST OF THE BRANCHES TOTAL
39
Loan Products - Assessment and Recommendation
• Streamlining and focus of product list
BDB mandate to cater to micro, cottage and small financing needs to foster Bhutan agricultural
and industrial development is absent from the formal list of products.
BDB product definition is confusing and the total number of products difficult to manage. More than product definition is a categorization of different loan instruments. There is a need to
streamline the offerings and better focus on core products. BDB should focus on products that
are part of its mandate and where it has competitive advantages. As the interest rate table
shows, there are many products where BDB is at a clear pricing disadvantage with the competition and these should not be part of BDB offering (further analysis in the loan quality
section of the report). BDB should evaluate the need to focus on products with small
participation in the total as it represents a diversion of management resources.
A streamlined product list could be structured as follows
1. Agriculture
2. Livestock
3. Other Microenterprise
4. Other Small enterprise 5. Group based
6. Housing
7. Consumer
8. Employee 9. Education
10. Transport
Each of the categories should be further subdivided in the credit manual as needed to reflect
specific terms and grace periods according to size, underlying risk and activity. For example, livestock can be subdivided in eggs, pig rearing, cattle, and others. Agriculture/Livestock
represents more than one quarter of loan outstanding, but it is poorly defined. In this category
there are loans sanctioned for more than Nu 1.5 million (the largest loan in this category is for
Nu 8 million) together with loans sanctioned for Nu 20 thousand or less. Further subcategorization should include micro, cottage and small agricultural/livestock enterprises.
Each subcategory should have specific loan forms, critical success factors, ratios, and models.
• Increment focus on group lending
The collateral requirement in agricultural loans hinders the extension of loans to poor
recipients who might not be able to comply. Group lending loans currently represent less than 1% of BDB portfolio even though loan performance is better than BDB NPL ratio. BDB should
strive to provide more inclusion opportunities to unbanked people as part of its rural mandate.
In order to be effective this inclusion initiative should be concurrent with financial literacy and
industry specific training.
• The credit manual should be rewritten to better correlate with the product
offering.
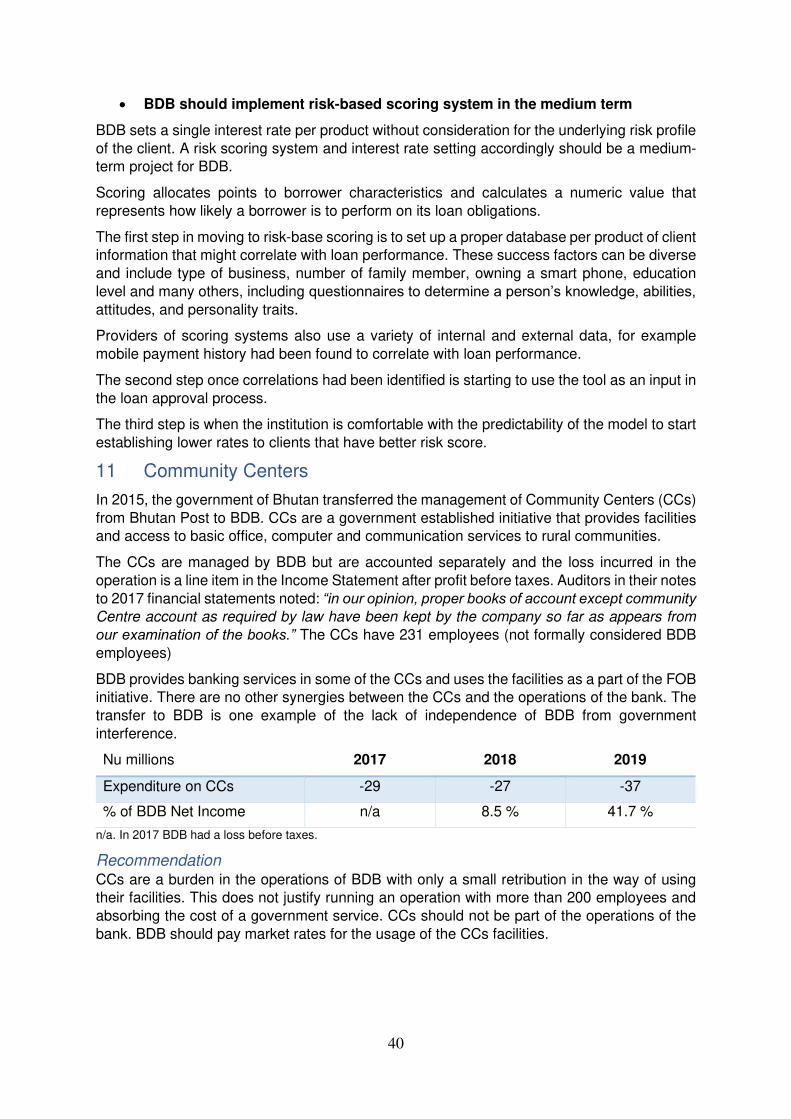
40
• BDB should implement risk-based scoring system in the medium term
BDB sets a single interest rate per product without consideration for the underlying risk profile
of the client. A risk scoring system and interest rate setting accordingly should be a medium-term project for BDB.
Scoring allocates points to borrower characteristics and calculates a numeric value that
represents how likely a borrower is to perform on its loan obligations.
The first step in moving to risk-base scoring is to set up a proper database per product of client information that might correlate with loan performance. These success factors can be diverse
and include type of business, number of family member, owning a smart phone, education
level and many others, including questionnaires to determine a person’s knowledge, abilities, attitudes, and personality traits.
Providers of scoring systems also use a variety of internal and external data, for example
mobile payment history had been found to correlate with loan performance.
The second step once correlations had been identified is starting to use the tool as an input in
the loan approval process.
The third step is when the institution is comfortable with the predictability of the model to start
establishing lower rates to clients that have better risk score.
11 Community Centers
In 2015, the government of Bhutan transferred the management of Community Centers (CCs)
from Bhutan Post to BDB. CCs are a government established initiative that provides facilities and access to basic office, computer and communication services to rural communities.
The CCs are managed by BDB but are accounted separately and the loss incurred in the
operation is a line item in the Income Statement after profit before taxes. Auditors in their notes
to 2017 financial statements noted: “in our opinion, proper books of account except community Centre account as required by law have been kept by the company so far as appears from
our examination of the books.” The CCs have 231 employees (not formally considered BDB
employees)
BDB provides banking services in some of the CCs and uses the facilities as a part of the FOB initiative. There are no other synergies between the CCs and the operations of the bank. The
transfer to BDB is one example of the lack of independence of BDB from government
interference.
Nu millions 2017 2018 2019
Expenditure on CCs -29 -27 -37
% of BDB Net Income n/a 8.5 % 41.7 %
n/a. In 2017 BDB had a loss before taxes.
Recommendation CCs are a burden in the operations of BDB with only a small retribution in the way of using their facilities. This does not justify running an operation with more than 200 employees and
absorbing the cost of a government service. CCs should not be part of the operations of the
bank. BDB should pay market rates for the usage of the CCs facilities.
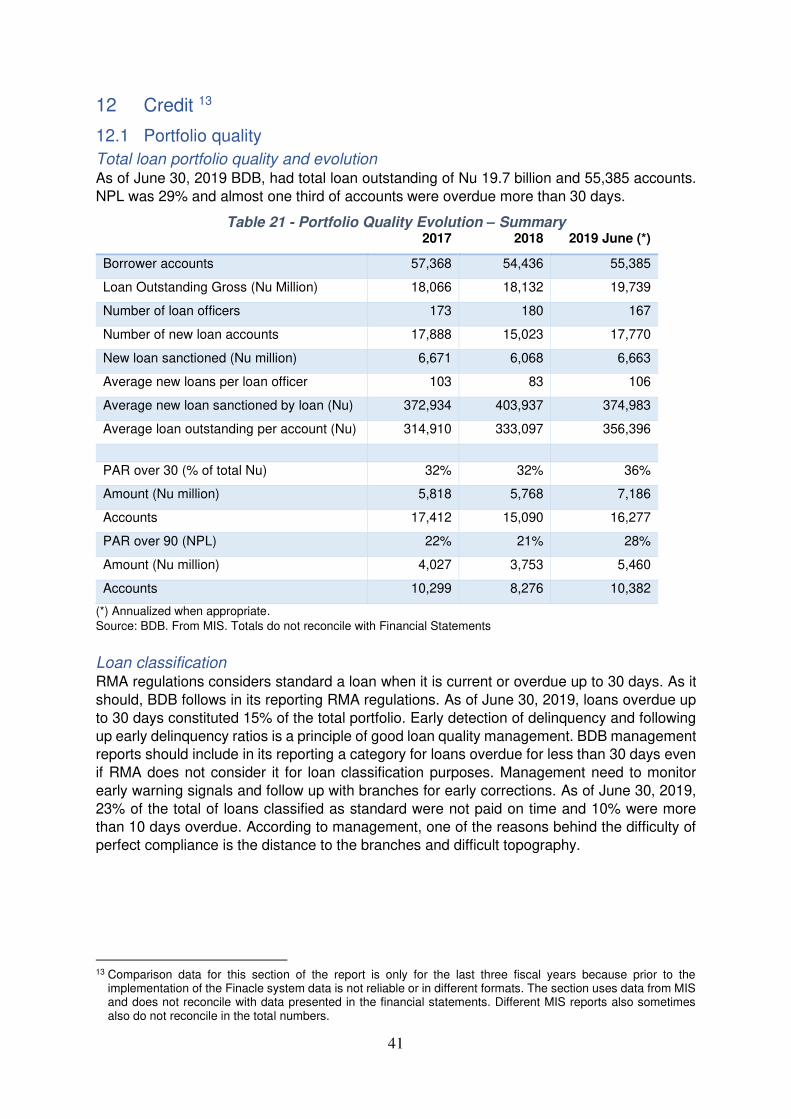
41
12 Credit 13
12.1 Portfolio quality
Total loan portfolio quality and evolution As of June 30, 2019 BDB, had total loan outstanding of Nu 19.7 billion and 55,385 accounts.
NPL was 29% and almost one third of accounts were overdue more than 30 days.
Table 21 - Portfolio Quality Evolution – Summary 2017 2018 2019 June (*)
Borrower accounts 57,368 54,436 55,385
Loan Outstanding Gross (Nu Million) 18,066 18,132 19,739
Number of loan officers 173 180 167
Number of new loan accounts 17,888 15,023 17,770
New loan sanctioned (Nu million) 6,671 6,068 6,663
Average new loans per loan officer 103 83 106
Average new loan sanctioned by loan (Nu) 372,934 403,937 374,983
Average loan outstanding per account (Nu) 314,910 333,097 356,396
PAR over 30 (% of total Nu) 32% 32% 36%
Amount (Nu million) 5,818 5,768 7,186
Accounts 17,412 15,090 16,277
PAR over 90 (NPL) 22% 21% 28%
Amount (Nu million) 4,027 3,753 5,460
Accounts 10,299 8,276 10,382
(*) Annualized when appropriate.
Source: BDB. From MIS. Totals do not reconcile with Financial Statements
Loan classification RMA regulations considers standard a loan when it is current or overdue up to 30 days. As it
should, BDB follows in its reporting RMA regulations. As of June 30, 2019, loans overdue up
to 30 days constituted 15% of the total portfolio. Early detection of delinquency and following
up early delinquency ratios is a principle of good loan quality management. BDB management reports should include in its reporting a category for loans overdue for less than 30 days even
if RMA does not consider it for loan classification purposes. Management need to monitor
early warning signals and follow up with branches for early corrections. As of June 30, 2019,
23% of the total of loans classified as standard were not paid on time and 10% were more than 10 days overdue. According to management, one of the reasons behind the difficulty of
perfect compliance is the distance to the branches and difficult topography.
13 Comparison data for this section of the report is only for the last three fiscal years because prior to the
implementation of the Finacle system data is not reliable or in different formats. The section uses data from MIS and does not reconcile with data presented in the financial statements. Different MIS reports also sometimes also do not reconcile in the total numbers.
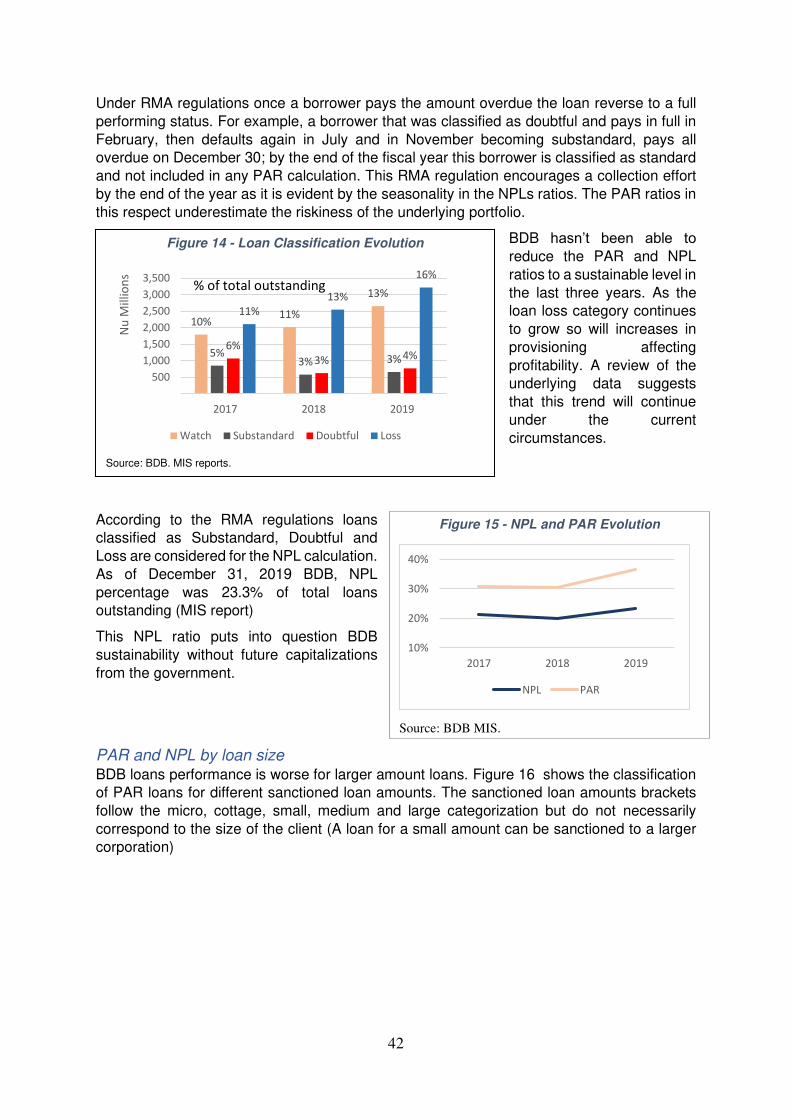
42
Under RMA regulations once a borrower pays the amount overdue the loan reverse to a full
performing status. For example, a borrower that was classified as doubtful and pays in full in
February, then defaults again in July and in November becoming substandard, pays all overdue on December 30; by the end of the fiscal year this borrower is classified as standard
and not included in any PAR calculation. This RMA regulation encourages a collection effort
by the end of the year as it is evident by the seasonality in the NPLs ratios. The PAR ratios in
this respect underestimate the riskiness of the underlying portfolio.
BDB hasn’t been able to reduce the PAR and NPL
ratios to a sustainable level in
the last three years. As the loan loss category continues
to grow so will increases in
provisioning affecting
profitability. A review of the underlying data suggests
that this trend will continue
under the current
circumstances.
According to the RMA regulations loans
classified as Substandard, Doubtful and
Loss are considered for the NPL calculation.
As of December 31, 2019 BDB, NPL
percentage was 23.3% of total loans outstanding (MIS report)
This NPL ratio puts into question BDB
sustainability without future capitalizations
from the government.
PAR and NPL by loan size BDB loans performance is worse for larger amount loans. Figure 16 shows the classification of PAR loans for different sanctioned loan amounts. The sanctioned loan amounts brackets
follow the micro, cottage, small, medium and large categorization but do not necessarily
correspond to the size of the client (A loan for a small amount can be sanctioned to a larger corporation)
Figure 15 - NPL and PAR Evolution
Source: BDB MIS.
Figure 14 - Loan Classification Evolution
Source: BDB. MIS reports.
10%
20%
30%
40%
2017 2018 2019
NPL PAR
10%11%
13%
5%3% 3%
6%
3% 4%
11%
13%
16%
500
1,000
1,500
2,000
2,500
3,000
3,500
2017 2018 2019
Nu
Mil
lio
ns
Watch Substandard Doubtful Loss
% of total outstanding
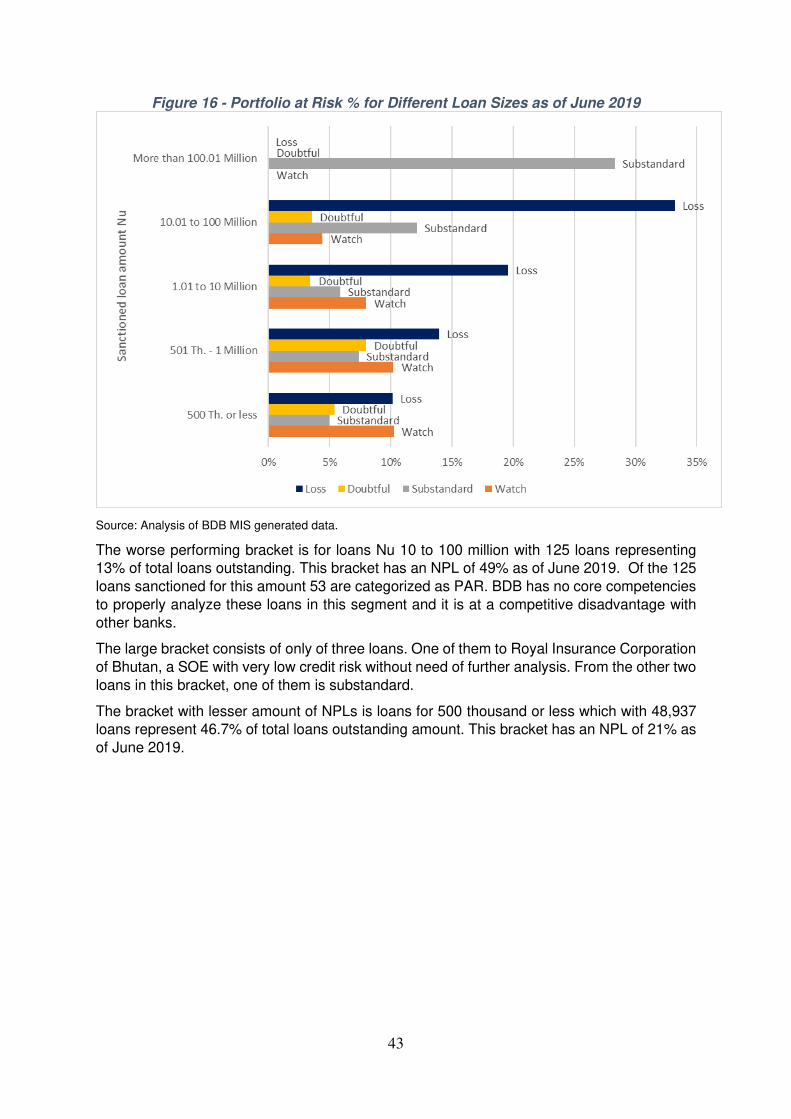
43
Figure 16 - Portfolio at Risk % for Different Loan Sizes as of June 2019
Source: Analysis of BDB MIS generated data.
The worse performing bracket is for loans Nu 10 to 100 million with 125 loans representing 13% of total loans outstanding. This bracket has an NPL of 49% as of June 2019. Of the 125
loans sanctioned for this amount 53 are categorized as PAR. BDB has no core competencies
to properly analyze these loans in this segment and it is at a competitive disadvantage with
other banks.
The large bracket consists of only of three loans. One of them to Royal Insurance Corporation
of Bhutan, a SOE with very low credit risk without need of further analysis. From the other two
loans in this bracket, one of them is substandard.
The bracket with lesser amount of NPLs is loans for 500 thousand or less which with 48,937 loans represent 46.7% of total loans outstanding amount. This bracket has an NPL of 21% as
of June 2019.
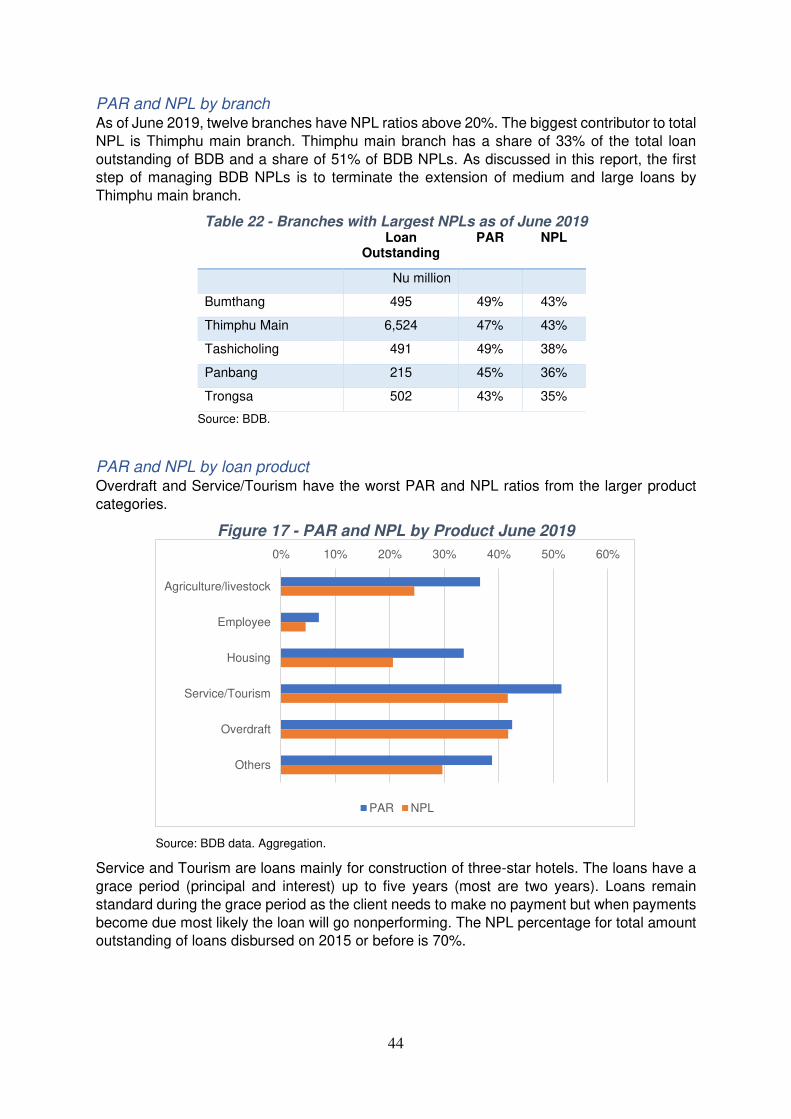
44
PAR and NPL by branch As of June 2019, twelve branches have NPL ratios above 20%. The biggest contributor to total
NPL is Thimphu main branch. Thimphu main branch has a share of 33% of the total loan
outstanding of BDB and a share of 51% of BDB NPLs. As discussed in this report, the first step of managing BDB NPLs is to terminate the extension of medium and large loans by
Thimphu main branch.
Table 22 - Branches with Largest NPLs as of June 2019 Loan
Outstanding PAR NPL
Nu million
Bumthang 495 49% 43%
Thimphu Main 6,524 47% 43%
Tashicholing 491 49% 38%
Panbang 215 45% 36%
Trongsa 502 43% 35%
Source: BDB.
PAR and NPL by loan product Overdraft and Service/Tourism have the worst PAR and NPL ratios from the larger product
categories.
Figure 17 - PAR and NPL by Product June 2019
Source: BDB data. Aggregation.
Service and Tourism are loans mainly for construction of three-star hotels. The loans have a
grace period (principal and interest) up to five years (most are two years). Loans remain
standard during the grace period as the client needs to make no payment but when payments
become due most likely the loan will go nonperforming. The NPL percentage for total amount outstanding of loans disbursed on 2015 or before is 70%.
0% 10% 20% 30% 40% 50% 60%
Agriculture/livestock
Employee
Housing
Service/Tourism
Overdraft
Others
PAR NPL
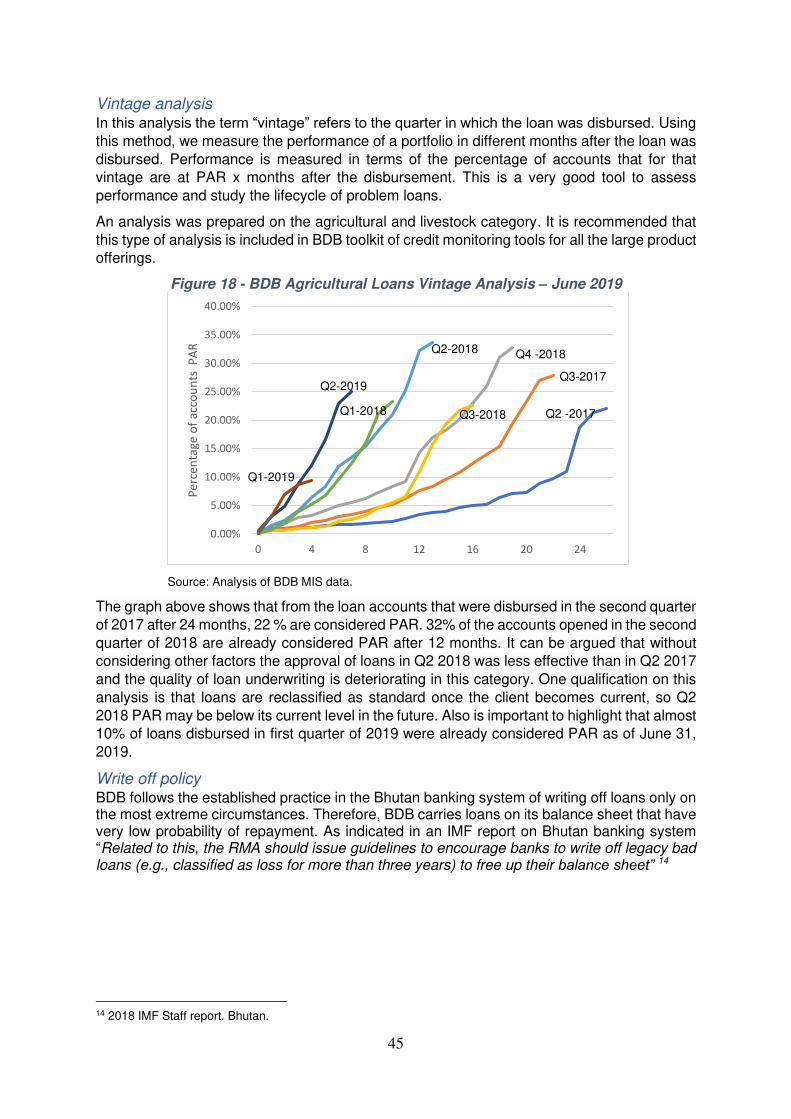
45
Vintage analysis In this analysis the term “vintage” refers to the quarter in which the loan was disbursed. Using
this method, we measure the performance of a portfolio in different months after the loan was
disbursed. Performance is measured in terms of the percentage of accounts that for that vintage are at PAR x months after the disbursement. This is a very good tool to assess
performance and study the lifecycle of problem loans.
An analysis was prepared on the agricultural and livestock category. It is recommended that
this type of analysis is included in BDB toolkit of credit monitoring tools for all the large product offerings.
Figure 18 - BDB Agricultural Loans Vintage Analysis – June 2019
Source: Analysis of BDB MIS data.
The graph above shows that from the loan accounts that were disbursed in the second quarter
of 2017 after 24 months, 22 % are considered PAR. 32% of the accounts opened in the second
quarter of 2018 are already considered PAR after 12 months. It can be argued that without considering other factors the approval of loans in Q2 2018 was less effective than in Q2 2017
and the quality of loan underwriting is deteriorating in this category. One qualification on this
analysis is that loans are reclassified as standard once the client becomes current, so Q2
2018 PAR may be below its current level in the future. Also is important to highlight that almost 10% of loans disbursed in first quarter of 2019 were already considered PAR as of June 31,
2019.
Write off policy BDB follows the established practice in the Bhutan banking system of writing off loans only on the most extreme circumstances. Therefore, BDB carries loans on its balance sheet that have very low probability of repayment. As indicated in an IMF report on Bhutan banking system “Related to this, the RMA should issue guidelines to encourage banks to write off legacy bad loans (e.g., classified as loss for more than three years) to free up their balance sheet” 14
14 2018 IMF Staff report. Bhutan.
0.00%
5.00%
10.00%
15.00%
20.00%
25.00%
30.00%
35.00%
40.00%
0 4 8 12 16 20 24
Pe
rce
nta
ge
of
acc
ou
nts
P
AR
Q3-2017
Q4 -2018
Q3-2018
Q2-2018
Q1-2018
Q2-2019
Q1-2019
Q2 -2017
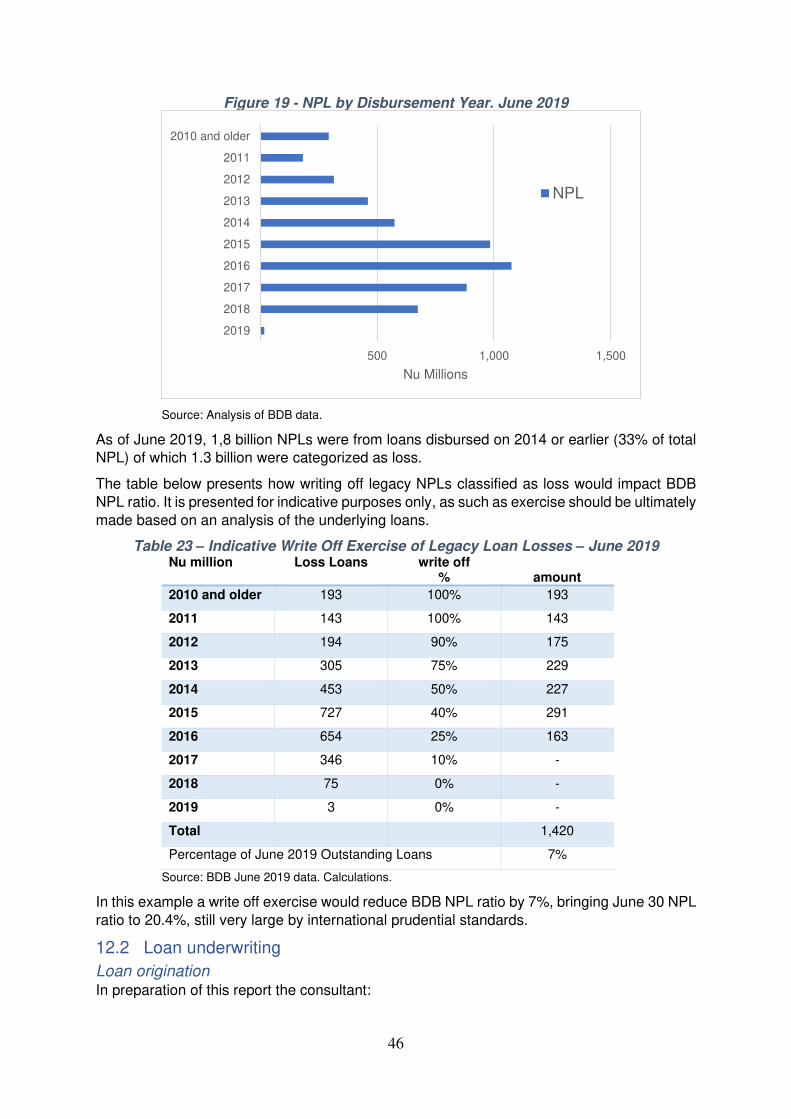
46
Figure 19 - NPL by Disbursement Year. June 2019
Source: Analysis of BDB data.
As of June 2019, 1,8 billion NPLs were from loans disbursed on 2014 or earlier (33% of total NPL) of which 1.3 billion were categorized as loss.
The table below presents how writing off legacy NPLs classified as loss would impact BDB
NPL ratio. It is presented for indicative purposes only, as such as exercise should be ultimately
made based on an analysis of the underlying loans.
Table 23 – Indicative Write Off Exercise of Legacy Loan Losses – June 2019 Nu million Loss Loans write off
%
amount
2010 and older 193 100% 193
2011 143 100% 143
2012 194 90% 175
2013 305 75% 229
2014 453 50% 227
2015 727 40% 291
2016 654 25% 163
2017 346 10% -
2018 75 0% -
2019 3 0% -
Total
1,420
Percentage of June 2019 Outstanding Loans 7%
Source: BDB June 2019 data. Calculations.
In this example a write off exercise would reduce BDB NPL ratio by 7%, bringing June 30 NPL
ratio to 20.4%, still very large by international prudential standards.
12.2 Loan underwriting
Loan origination In preparation of this report the consultant:
500 1,000 1,500
2019
2018
2017
2016
2015
2014
2013
2012
2011
2010 and older
Nu Millions
NPL
47
• Interviewed eight credit officers and the branch managers of Thimphu Main Branch
(33% of loan outstanding as of June 2019), Paro (6%) and Punakha (3%)
• Reviewed ten loan files selected by the consultant to get a sample of different
industries, sizes and performance classification (no for statistical representation but for general indication of the quality of the files and the analysis)
• Conducted field visits of clients selected by BDB for convenience of their location.
The consultant had full cooperation of BDB personnel in conducting the review of the lending
process. All the credit officers were intelligent, knowledgeable, committed and enthusiastic
young women and men that are aware of their responsibility and the importance of their mission. The credit officer’s team with proper training and empowerment should be the
foundation of BDB turnaround strategy.
The loan process in BDB begins either at the branch with clients presenting their applications
or in the field in the case of FOB. BDB does not conduct targeted marketing to potential good prospects. The loan approval follows a check the box approach with little financial evaluation
or input from the credit officers.
In some of the files inspected information on the business was minimal and containing
information that would contradict the decision of giving the loan. In one file inspected on a loan for Nu. 500,000 the only information on the project was the objective (land development) and
no single information on cash flow. Repayment source was quoted as income from a karaoke
bar also owned by the borrower.
Loan approval is centered in evaluating the CIB report of the applicant, the title certificate of the mortgage property, recommendation of the head of the gewog and police certificate of
good conduct, among other formal requirements. Agricultural loans above Nu 500,000 need
an approval from the local agriculture office.
The credit manual instructs the credit officer to:
1) Conduct a site visit for verification (sketch map along with distance from the
road/Gewog center/economic activities/arability, etc. and photographs of the
mortgaged property).
2) Prepare appraisal report.
3) Present proposals to the Credit Committee.
Interviews with credit officers indicated that the challenges of the topography and their workload do not allow for site visits, relying in photos of the sites in most cases. Only loans in
excess of Nu 700 thousand always get the required site visit. In practice most small and
cottage agriculture loans initiated in the branch are approved without this requirement met.
The loan appraisal in Thimphu main branch is poor. This is concerning considering that the branch handles BDB largest loans equivalent to 33% of total loan outstanding. Projections
were present on income statements, but cash flows absent and therefore no indications of
cash flow to debt ratio.
Loan Approval Final decision on approval is taken by the appropriate credit committee as indicated in the
following table.
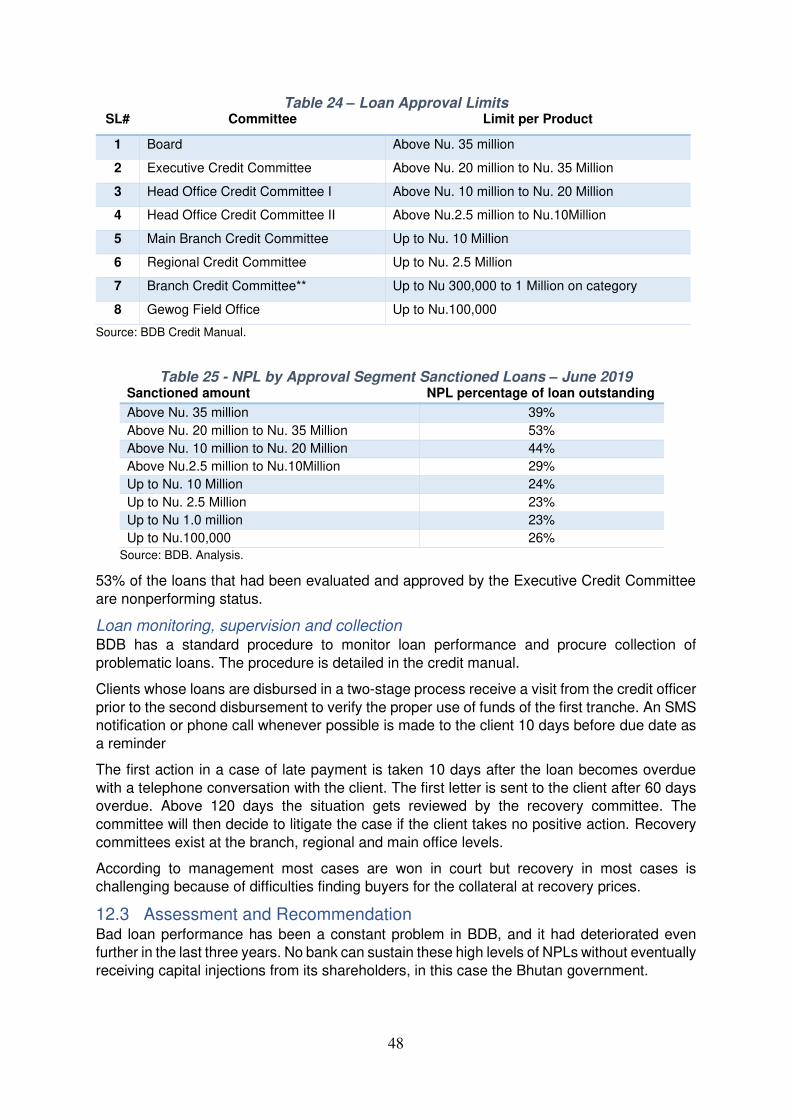
48
Table 24 – Loan Approval Limits SL# Committee Limit per Product
1 Board Above Nu. 35 million
2 Executive Credit Committee Above Nu. 20 million to Nu. 35 Million
3 Head Office Credit Committee I Above Nu. 10 million to Nu. 20 Million
4 Head Office Credit Committee II Above Nu.2.5 million to Nu.10Million
5 Main Branch Credit Committee Up to Nu. 10 Million
6 Regional Credit Committee Up to Nu. 2.5 Million
7 Branch Credit Committee** Up to Nu 300,000 to 1 Million on category
8 Gewog Field Office Up to Nu.100,000
Source: BDB Credit Manual.
Table 25 - NPL by Approval Segment Sanctioned Loans – June 2019 Sanctioned amount NPL percentage of loan outstanding
Above Nu. 35 million 39%
Above Nu. 20 million to Nu. 35 Million 53%
Above Nu. 10 million to Nu. 20 Million 44%
Above Nu.2.5 million to Nu.10Million 29%
Up to Nu. 10 Million 24%
Up to Nu. 2.5 Million 23%
Up to Nu 1.0 million 23%
Up to Nu.100,000 26%
Source: BDB. Analysis.
53% of the loans that had been evaluated and approved by the Executive Credit Committee
are nonperforming status.
Loan monitoring, supervision and collection BDB has a standard procedure to monitor loan performance and procure collection of
problematic loans. The procedure is detailed in the credit manual.
Clients whose loans are disbursed in a two-stage process receive a visit from the credit officer
prior to the second disbursement to verify the proper use of funds of the first tranche. An SMS notification or phone call whenever possible is made to the client 10 days before due date as
a reminder
The first action in a case of late payment is taken 10 days after the loan becomes overdue
with a telephone conversation with the client. The first letter is sent to the client after 60 days overdue. Above 120 days the situation gets reviewed by the recovery committee. The
committee will then decide to litigate the case if the client takes no positive action. Recovery
committees exist at the branch, regional and main office levels.
According to management most cases are won in court but recovery in most cases is challenging because of difficulties finding buyers for the collateral at recovery prices.
12.3 Assessment and Recommendation Bad loan performance has been a constant problem in BDB, and it had deteriorated even further in the last three years. No bank can sustain these high levels of NPLs without eventually
receiving capital injections from its shareholders, in this case the Bhutan government.
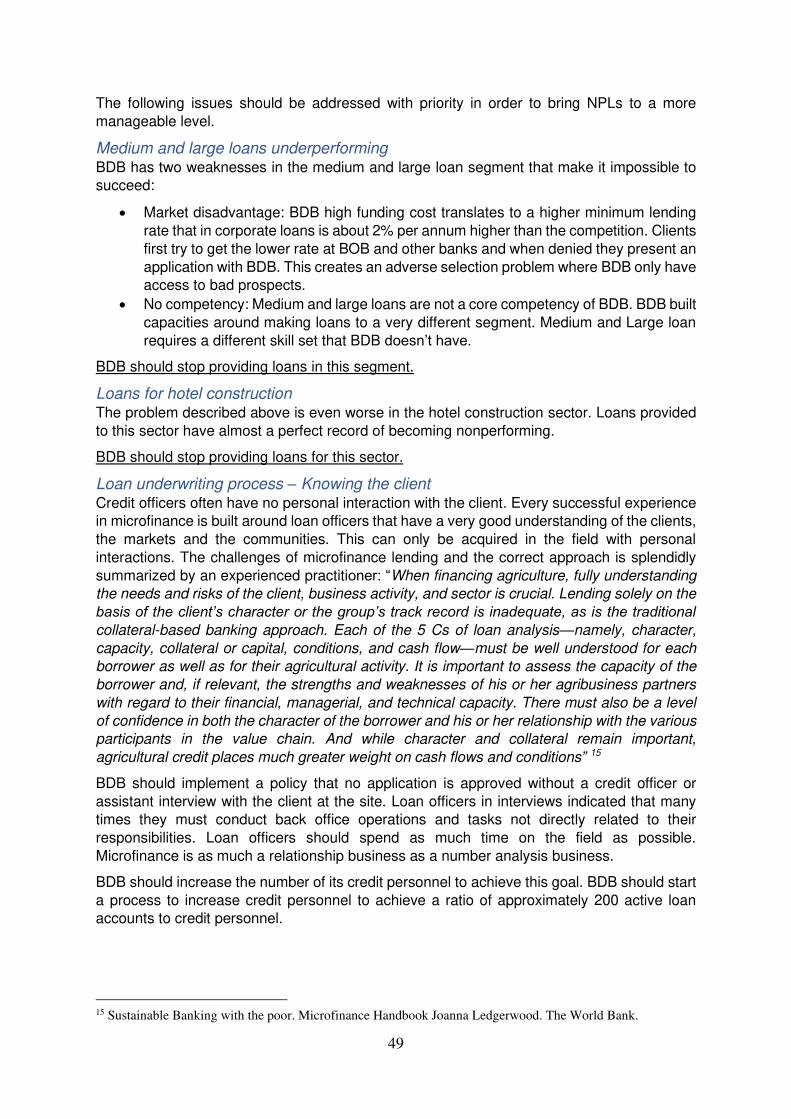
49
The following issues should be addressed with priority in order to bring NPLs to a more
manageable level.
Medium and large loans underperforming BDB has two weaknesses in the medium and large loan segment that make it impossible to succeed:
• Market disadvantage: BDB high funding cost translates to a higher minimum lending
rate that in corporate loans is about 2% per annum higher than the competition. Clients
first try to get the lower rate at BOB and other banks and when denied they present an
application with BDB. This creates an adverse selection problem where BDB only have access to bad prospects.
• No competency: Medium and large loans are not a core competency of BDB. BDB built
capacities around making loans to a very different segment. Medium and Large loan
requires a different skill set that BDB doesn’t have.
BDB should stop providing loans in this segment.
Loans for hotel construction The problem described above is even worse in the hotel construction sector. Loans provided
to this sector have almost a perfect record of becoming nonperforming.
BDB should stop providing loans for this sector.
Loan underwriting process – Knowing the client Credit officers often have no personal interaction with the client. Every successful experience in microfinance is built around loan officers that have a very good understanding of the clients,
the markets and the communities. This can only be acquired in the field with personal
interactions. The challenges of microfinance lending and the correct approach is splendidly
summarized by an experienced practitioner: “When financing agriculture, fully understanding
the needs and risks of the client, business activity, and sector is crucial. Lending solely on the
basis of the client’s character or the group’s track record is inadequate, as is the traditional collateral-based banking approach. Each of the 5 Cs of loan analysis—namely, character,
capacity, collateral or capital, conditions, and cash flow—must be well understood for each
borrower as well as for their agricultural activity. It is important to assess the capacity of the
borrower and, if relevant, the strengths and weaknesses of his or her agribusiness partners
with regard to their financial, managerial, and technical capacity. There must also be a level
of confidence in both the character of the borrower and his or her relationship with the various
participants in the value chain. And while character and collateral remain important,
agricultural credit places much greater weight on cash flows and conditions” 15
BDB should implement a policy that no application is approved without a credit officer or
assistant interview with the client at the site. Loan officers in interviews indicated that many times they must conduct back office operations and tasks not directly related to their
responsibilities. Loan officers should spend as much time on the field as possible.
Microfinance is as much a relationship business as a number analysis business.
BDB should increase the number of its credit personnel to achieve this goal. BDB should start
a process to increase credit personnel to achieve a ratio of approximately 200 active loan accounts to credit personnel.
15 Sustainable Banking with the poor. Microfinance Handbook Joanna Ledgerwood. The World Bank.
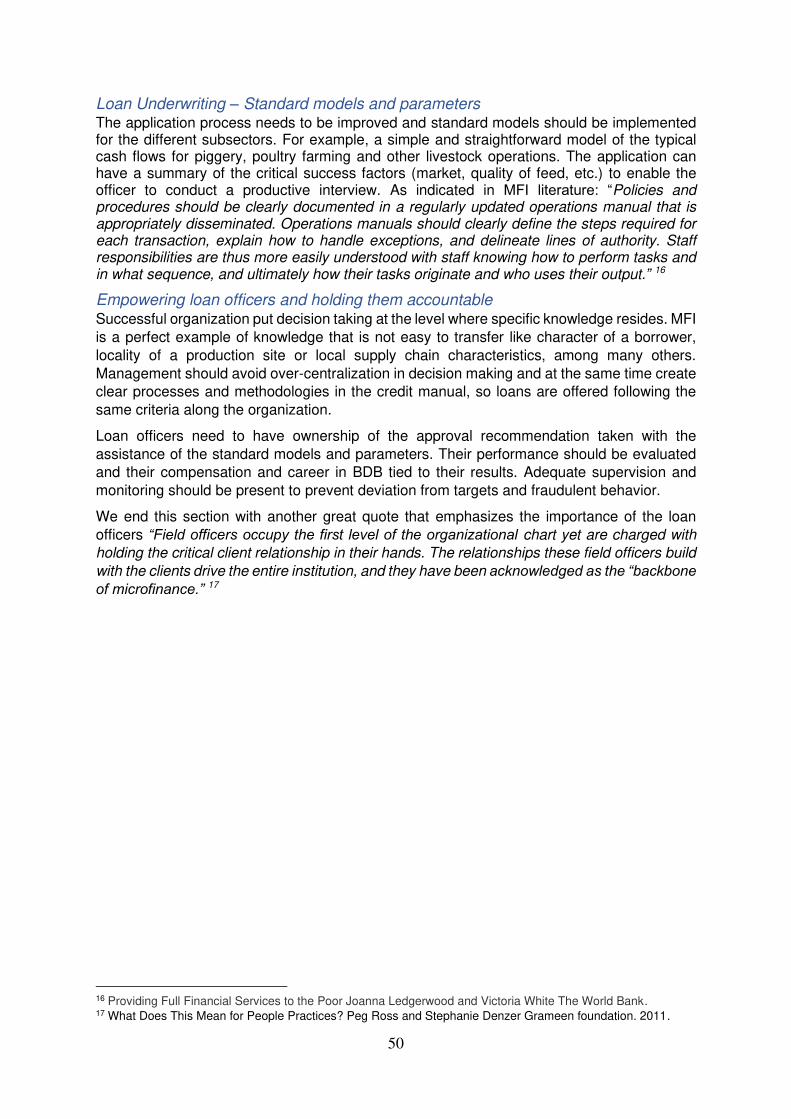
50
Loan Underwriting – Standard models and parameters The application process needs to be improved and standard models should be implemented for the different subsectors. For example, a simple and straightforward model of the typical cash flows for piggery, poultry farming and other livestock operations. The application can have a summary of the critical success factors (market, quality of feed, etc.) to enable the officer to conduct a productive interview. As indicated in MFI literature: “Policies and procedures should be clearly documented in a regularly updated operations manual that is appropriately disseminated. Operations manuals should clearly define the steps required for each transaction, explain how to handle exceptions, and delineate lines of authority. Staff responsibilities are thus more easily understood with staff knowing how to perform tasks and in what sequence, and ultimately how their tasks originate and who uses their output.” 16
Empowering loan officers and holding them accountable Successful organization put decision taking at the level where specific knowledge resides. MFI
is a perfect example of knowledge that is not easy to transfer like character of a borrower,
locality of a production site or local supply chain characteristics, among many others.
Management should avoid over-centralization in decision making and at the same time create clear processes and methodologies in the credit manual, so loans are offered following the
same criteria along the organization.
Loan officers need to have ownership of the approval recommendation taken with the
assistance of the standard models and parameters. Their performance should be evaluated and their compensation and career in BDB tied to their results. Adequate supervision and
monitoring should be present to prevent deviation from targets and fraudulent behavior.
We end this section with another great quote that emphasizes the importance of the loan
officers “Field officers occupy the first level of the organizational chart yet are charged with
holding the critical client relationship in their hands. The relationships these field officers build
with the clients drive the entire institution, and they have been acknowledged as the “backbone of microfinance.” 17
16 Providing Full Financial Services to the Poor Joanna Ledgerwood and Victoria White The World Bank. 17 What Does This Mean for People Practices? Peg Ross and Stephanie Denzer Grameen foundation. 2011.
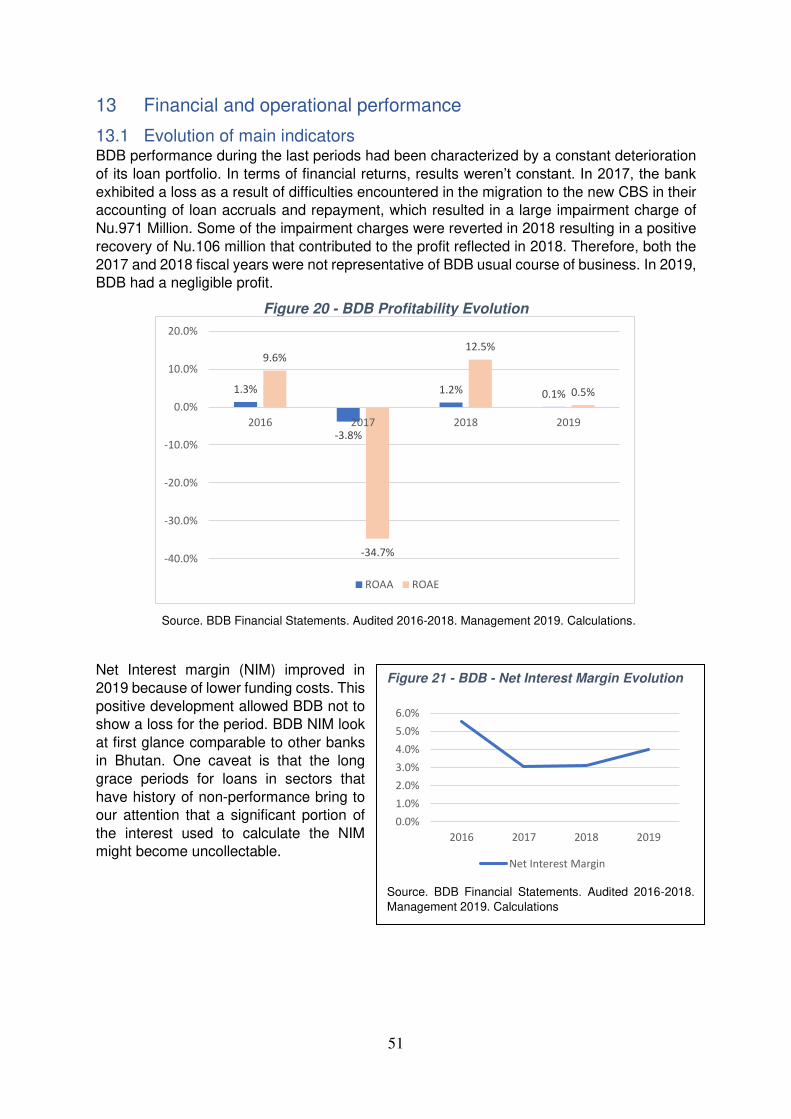
51
13 Financial and operational performance
13.1 Evolution of main indicators BDB performance during the last periods had been characterized by a constant deterioration
of its loan portfolio. In terms of financial returns, results weren’t constant. In 2017, the bank exhibited a loss as a result of difficulties encountered in the migration to the new CBS in their accounting of loan accruals and repayment, which resulted in a large impairment charge of
Nu.971 Million. Some of the impairment charges were reverted in 2018 resulting in a positive
recovery of Nu.106 million that contributed to the profit reflected in 2018. Therefore, both the
2017 and 2018 fiscal years were not representative of BDB usual course of business. In 2019, BDB had a negligible profit.
Figure 20 - BDB Profitability Evolution
Source. BDB Financial Statements. Audited 2016-2018. Management 2019. Calculations.
Net Interest margin (NIM) improved in
2019 because of lower funding costs. This
positive development allowed BDB not to show a loss for the period. BDB NIM look
at first glance comparable to other banks
in Bhutan. One caveat is that the long
grace periods for loans in sectors that
have history of non-performance bring to our attention that a significant portion of
the interest used to calculate the NIM might become uncollectable.
1.3%
-3.8%
1.2% 0.1%
9.6%
-34.7%
12.5%
0.5%
-40.0%
-30.0%
-20.0%
-10.0%
0.0%
10.0%
20.0%
2016 2017 2018 2019
ROAA ROAE
Figure 21 - BDB - Net Interest Margin Evolution
Source. BDB Financial Statements. Audited 2016-2018.
Management 2019. Calculations
0.0%
1.0%
2.0%
3.0%
4.0%
5.0%
6.0%
2016 2017 2018 2019
Net Interest Margin
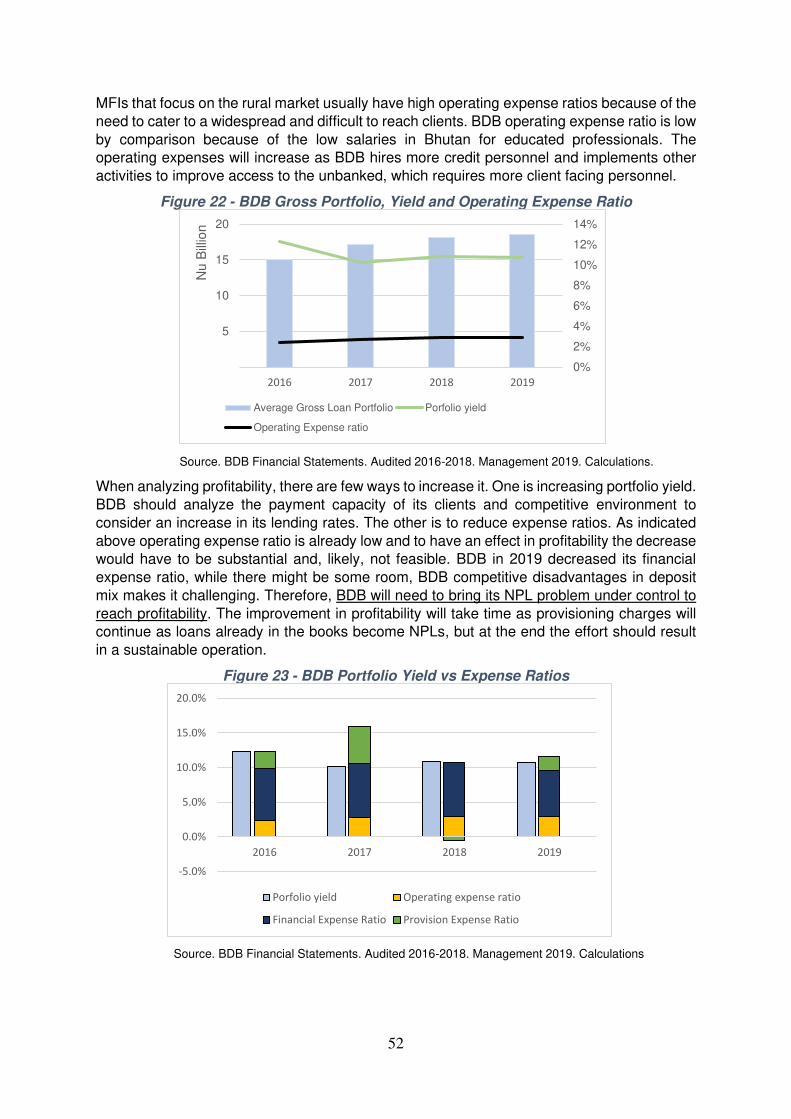
52
MFIs that focus on the rural market usually have high operating expense ratios because of the
need to cater to a widespread and difficult to reach clients. BDB operating expense ratio is low
by comparison because of the low salaries in Bhutan for educated professionals. The operating expenses will increase as BDB hires more credit personnel and implements other
activities to improve access to the unbanked, which requires more client facing personnel.
Figure 22 - BDB Gross Portfolio, Yield and Operating Expense Ratio
Source. BDB Financial Statements. Audited 2016-2018. Management 2019. Calculations.
When analyzing profitability, there are few ways to increase it. One is increasing portfolio yield.
BDB should analyze the payment capacity of its clients and competitive environment to
consider an increase in its lending rates. The other is to reduce expense ratios. As indicated
above operating expense ratio is already low and to have an effect in profitability the decrease would have to be substantial and, likely, not feasible. BDB in 2019 decreased its financial
expense ratio, while there might be some room, BDB competitive disadvantages in deposit
mix makes it challenging. Therefore, BDB will need to bring its NPL problem under control to
reach profitability. The improvement in profitability will take time as provisioning charges will continue as loans already in the books become NPLs, but at the end the effort should result
in a sustainable operation.
Figure 23 - BDB Portfolio Yield vs Expense Ratios
Source. BDB Financial Statements. Audited 2016-2018. Management 2019. Calculations
0%
2%
4%
6%
8%
10%
12%
14%
5
10
15
20
2016 2017 2018 2019
Nu B
illio
n
Average Gross Loan Portfolio Porfolio yield
Operating Expense ratio
-5.0%
0.0%
5.0%
10.0%
15.0%
20.0%
2016 2017 2018 2019
Porfolio yield Operating expense ratio
Financial Expense Ratio Provision Expense Ratio
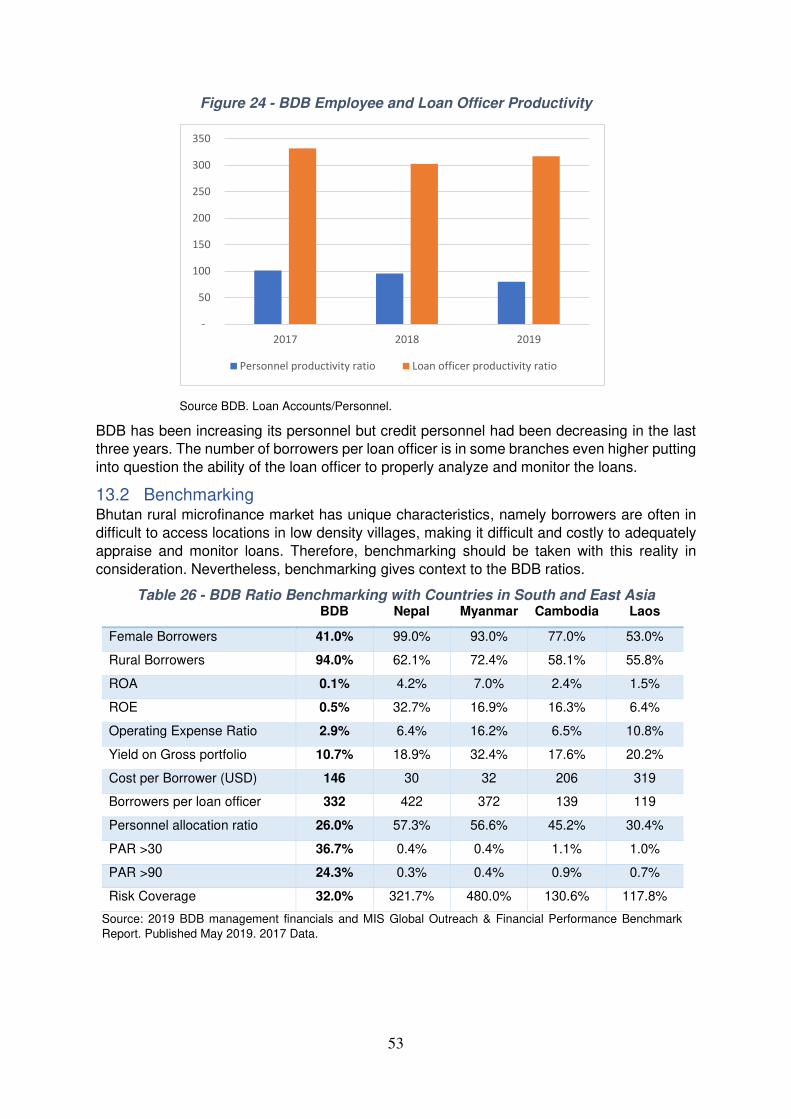
53
Figure 24 - BDB Employee and Loan Officer Productivity
Source BDB. Loan Accounts/Personnel.
BDB has been increasing its personnel but credit personnel had been decreasing in the last three years. The number of borrowers per loan officer is in some branches even higher putting
into question the ability of the loan officer to properly analyze and monitor the loans.
13.2 Benchmarking Bhutan rural microfinance market has unique characteristics, namely borrowers are often in
difficult to access locations in low density villages, making it difficult and costly to adequately
appraise and monitor loans. Therefore, benchmarking should be taken with this reality in
consideration. Nevertheless, benchmarking gives context to the BDB ratios.
Table 26 - BDB Ratio Benchmarking with Countries in South and East Asia BDB Nepal Myanmar Cambodia Laos
Female Borrowers 41.0% 99.0% 93.0% 77.0% 53.0%
Rural Borrowers 94.0% 62.1% 72.4% 58.1% 55.8%
ROA 0.1% 4.2% 7.0% 2.4% 1.5%
ROE 0.5% 32.7% 16.9% 16.3% 6.4%
Operating Expense Ratio 2.9% 6.4% 16.2% 6.5% 10.8%
Yield on Gross portfolio 10.7% 18.9% 32.4% 17.6% 20.2%
Cost per Borrower (USD) 146 30 32 206 319
Borrowers per loan officer 332 422 372 139 119
Personnel allocation ratio 26.0% 57.3% 56.6% 45.2% 30.4%
PAR >30 36.7% 0.4% 0.4% 1.1% 1.0%
PAR >90 24.3% 0.3% 0.4% 0.9% 0.7%
Risk Coverage 32.0% 321.7% 480.0% 130.6% 117.8%
Source: 2019 BDB management financials and MIS Global Outreach & Financial Performance Benchmark
Report. Published May 2019. 2017 Data.
-
50
100
150
200
250
300
350
2017 2018 2019
Personnel productivity ratio Loan officer productivity ratio
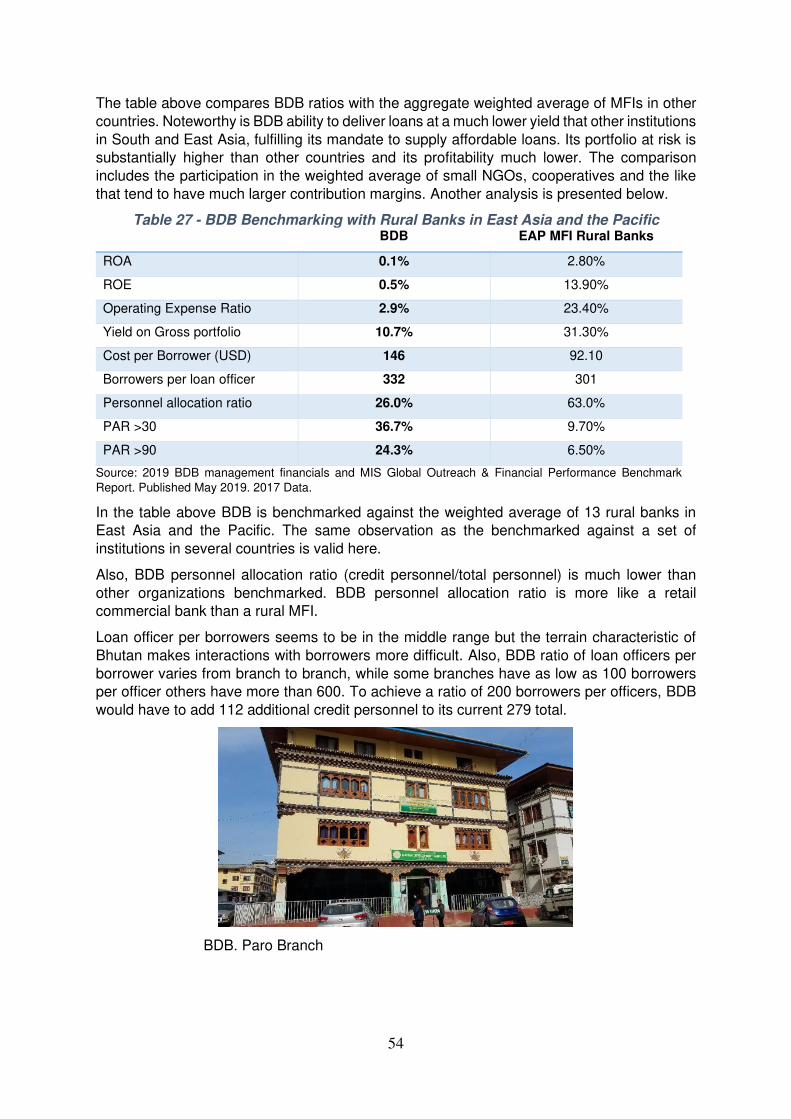
54
The table above compares BDB ratios with the aggregate weighted average of MFIs in other
countries. Noteworthy is BDB ability to deliver loans at a much lower yield that other institutions
in South and East Asia, fulfilling its mandate to supply affordable loans. Its portfolio at risk is substantially higher than other countries and its profitability much lower. The comparison
includes the participation in the weighted average of small NGOs, cooperatives and the like
that tend to have much larger contribution margins. Another analysis is presented below.
Table 27 - BDB Benchmarking with Rural Banks in East Asia and the Pacific BDB EAP MFI Rural Banks
ROA 0.1% 2.80%
ROE 0.5% 13.90%
Operating Expense Ratio 2.9% 23.40%
Yield on Gross portfolio 10.7% 31.30%
Cost per Borrower (USD) 146 92.10
Borrowers per loan officer 332 301
Personnel allocation ratio 26.0% 63.0%
PAR >30 36.7% 9.70%
PAR >90 24.3% 6.50%
Source: 2019 BDB management financials and MIS Global Outreach & Financial Performance Benchmark
Report. Published May 2019. 2017 Data.
In the table above BDB is benchmarked against the weighted average of 13 rural banks in East Asia and the Pacific. The same observation as the benchmarked against a set of
institutions in several countries is valid here.
Also, BDB personnel allocation ratio (credit personnel/total personnel) is much lower than
other organizations benchmarked. BDB personnel allocation ratio is more like a retail commercial bank than a rural MFI.
Loan officer per borrowers seems to be in the middle range but the terrain characteristic of
Bhutan makes interactions with borrowers more difficult. Also, BDB ratio of loan officers per
borrower varies from branch to branch, while some branches have as low as 100 borrowers per officer others have more than 600. To achieve a ratio of 200 borrowers per officers, BDB
would have to add 112 additional credit personnel to its current 279 total.
BDB. Paro Branch
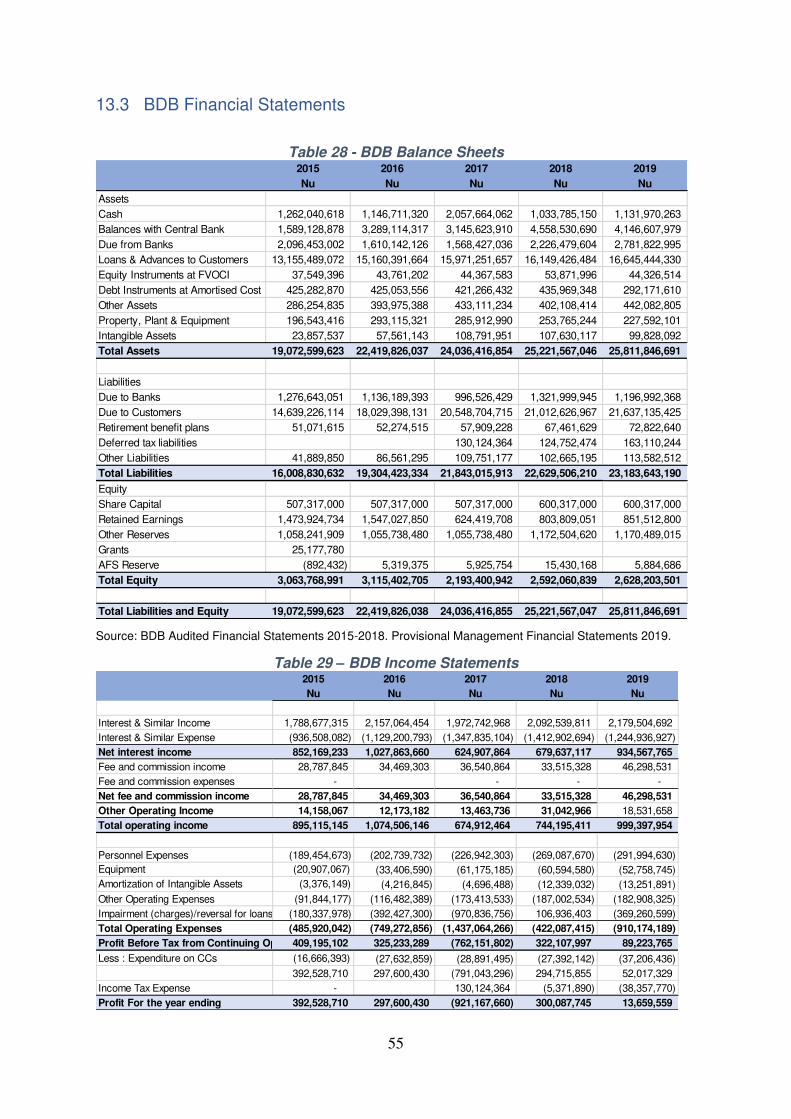
55
13.3 BDB Financial Statements
Table 28 - BDB Balance Sheets
Source: BDB Audited Financial Statements 2015-2018. Provisional Management Financial Statements 2019.
Table 29 – BDB Income Statements
2015 2016 2017 2018 2019
Nu Nu Nu Nu Nu
Assets
Cash 1,262,040,618 1,146,711,320 2,057,664,062 1,033,785,150 1,131,970,263
Balances with Central Bank 1,589,128,878 3,289,114,317 3,145,623,910 4,558,530,690 4,146,607,979
Due from Banks 2,096,453,002 1,610,142,126 1,568,427,036 2,226,479,604 2,781,822,995
Loans & Advances to Customers 13,155,489,072 15,160,391,664 15,971,251,657 16,149,426,484 16,645,444,330
Equity Instruments at FVOCI 37,549,396 43,761,202 44,367,583 53,871,996 44,326,514
Debt Instruments at Amortised Cost 425,282,870 425,053,556 421,266,432 435,969,348 292,171,610
Other Assets 286,254,835 393,975,388 433,111,234 402,108,414 442,082,805
Property, Plant & Equipment 196,543,416 293,115,321 285,912,990 253,765,244 227,592,101
Intangible Assets 23,857,537 57,561,143 108,791,951 107,630,117 99,828,092
Total Assets 19,072,599,623 22,419,826,037 24,036,416,854 25,221,567,046 25,811,846,691
Liabilities
Due to Banks 1,276,643,051 1,136,189,393 996,526,429 1,321,999,945 1,196,992,368
Due to Customers 14,639,226,114 18,029,398,131 20,548,704,715 21,012,626,967 21,637,135,425
Retirement benefit plans 51,071,615 52,274,515 57,909,228 67,461,629 72,822,640
Deferred tax liabilities 130,124,364 124,752,474 163,110,244
Other Liabilities 41,889,850 86,561,295 109,751,177 102,665,195 113,582,512
Total Liabilities 16,008,830,632 19,304,423,334 21,843,015,913 22,629,506,210 23,183,643,190
Equity
Share Capital 507,317,000 507,317,000 507,317,000 600,317,000 600,317,000
Retained Earnings 1,473,924,734 1,547,027,850 624,419,708 803,809,051 851,512,800
Other Reserves 1,058,241,909 1,055,738,480 1,055,738,480 1,172,504,620 1,170,489,015
Grants 25,177,780
AFS Reserve (892,432) 5,319,375 5,925,754 15,430,168 5,884,686
Total Equity 3,063,768,991 3,115,402,705 2,193,400,942 2,592,060,839 2,628,203,501
Total Liabilities and Equity 19,072,599,623 22,419,826,038 24,036,416,855 25,221,567,047 25,811,846,691
2015 2016 2017 2018 2019
Nu Nu Nu Nu Nu
Interest & Similar Income 1,788,677,315 2,157,064,454 1,972,742,968 2,092,539,811 2,179,504,692
Interest & Similar Expense (936,508,082) (1,129,200,793) (1,347,835,104) (1,412,902,694) (1,244,936,927)
Net interest income 852,169,233 1,027,863,660 624,907,864 679,637,117 934,567,765
Fee and commission income 28,787,845 34,469,303 36,540,864 33,515,328 46,298,531
Fee and commission expenses - - - -
Net fee and commission income 28,787,845 34,469,303 36,540,864 33,515,328 46,298,531
Other Operating Income 14,158,067 12,173,182 13,463,736 31,042,966 18,531,658
Total operating income 895,115,145 1,074,506,146 674,912,464 744,195,411 999,397,954
Personnel Expenses (189,454,673) (202,739,732) (226,942,303) (269,087,670) (291,994,630)
Equipment (20,907,067) (33,406,590) (61,175,185) (60,594,580) (52,758,745)
Amortization of Intangible Assets (3,376,149) (4,216,845) (4,696,488) (12,339,032) (13,251,891)
Other Operating Expenses (91,844,177) (116,482,389) (173,413,533) (187,002,534) (182,908,325)
Impairment (charges)/reversal for loans (180,337,978) (392,427,300) (970,836,756) 106,936,403 (369,260,599)
Total Operating Expenses (485,920,042) (749,272,856) (1,437,064,266) (422,087,415) (910,174,189)
Profit Before Tax from Continuing Op 409,195,102 325,233,289 (762,151,802) 322,107,997 89,223,765
Less : Expenditure on CCs (16,666,393) (27,632,859) (28,891,495) (27,392,142) (37,206,436)
392,528,710 297,600,430 (791,043,296) 294,715,855 52,017,329
Income Tax Expense - 130,124,364 (5,371,890) (38,357,770)
Profit For the year ending 392,528,710 297,600,430 (921,167,660) 300,087,745 13,659,559
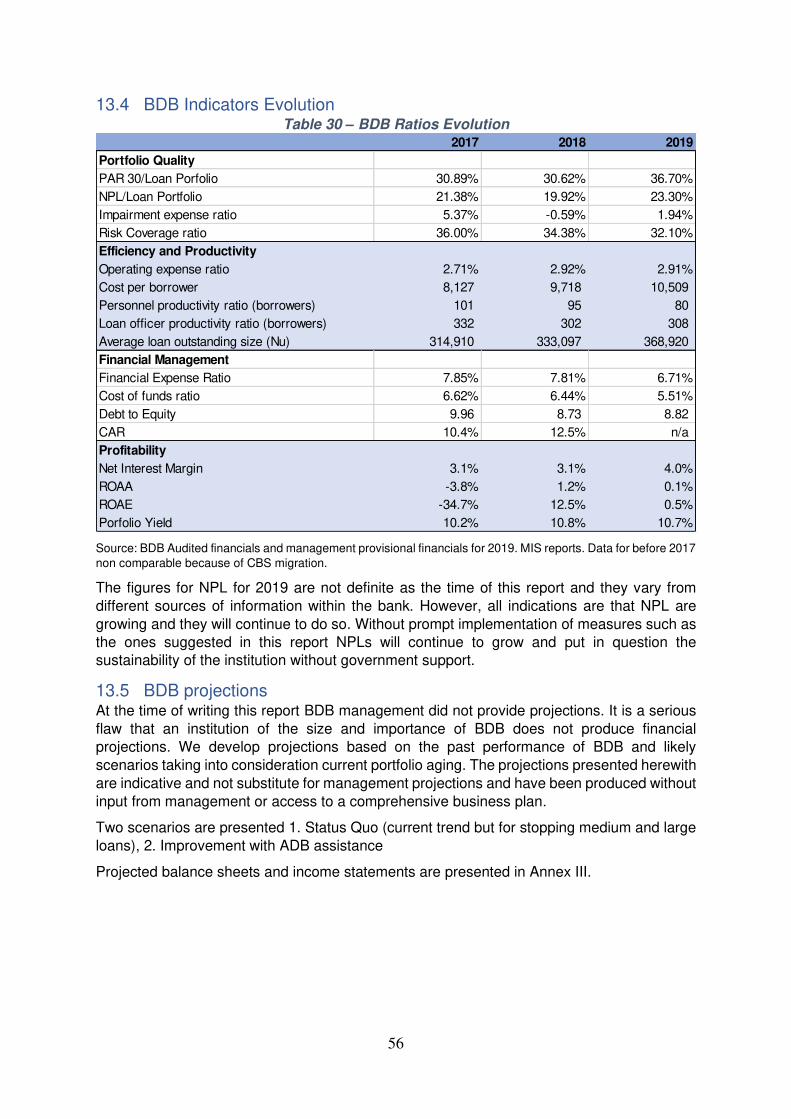
56
13.4 BDB Indicators Evolution Table 30 – BDB Ratios Evolution
Source: BDB Audited financials and management provisional financials for 2019. MIS reports. Data for before 2017
non comparable because of CBS migration.
The figures for NPL for 2019 are not definite as the time of this report and they vary from
different sources of information within the bank. However, all indications are that NPL are
growing and they will continue to do so. Without prompt implementation of measures such as the ones suggested in this report NPLs will continue to grow and put in question the sustainability of the institution without government support.
13.5 BDB projections At the time of writing this report BDB management did not provide projections. It is a serious
flaw that an institution of the size and importance of BDB does not produce financial projections. We develop projections based on the past performance of BDB and likely
scenarios taking into consideration current portfolio aging. The projections presented herewith
are indicative and not substitute for management projections and have been produced without
input from management or access to a comprehensive business plan.
Two scenarios are presented 1. Status Quo (current trend but for stopping medium and large
loans), 2. Improvement with ADB assistance
Projected balance sheets and income statements are presented in Annex III.
2017 2018 2019
Portfolio Quality
PAR 30/Loan Porfolio 30.89% 30.62% 36.70%
NPL/Loan Portfolio 21.38% 19.92% 23.30%
Impairment expense ratio 5.37% -0.59% 1.94%
Risk Coverage ratio 36.00% 34.38% 32.10%
Efficiency and Productivity
Operating expense ratio 2.71% 2.92% 2.91%
Cost per borrower 8,127 9,718 10,509
Personnel productivity ratio (borrowers) 101 95 80
Loan officer productivity ratio (borrowers) 332 302 308
Average loan outstanding size (Nu) 314,910 333,097 368,920
Financial Management
Financial Expense Ratio 7.85% 7.81% 6.71%
Cost of funds ratio 6.62% 6.44% 5.51%
Debt to Equity 9.96 8.73 8.82
CAR 10.4% 12.5% n/a
Profitability
Net Interest Margin 3.1% 3.1% 4.0%
ROAA -3.8% 1.2% 0.1%
ROAE -34.7% 12.5% 0.5%
Porfolio Yield 10.2% 10.8% 10.7%
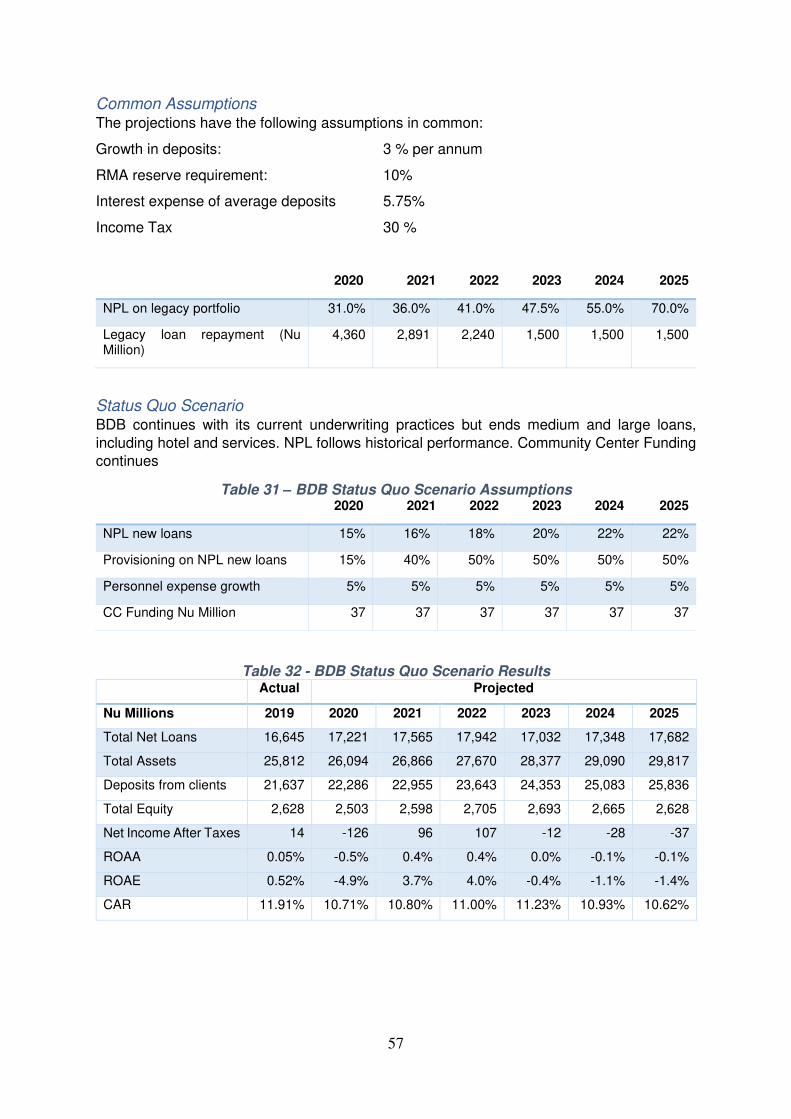
57
Common Assumptions The projections have the following assumptions in common:
Growth in deposits: 3 % per annum
RMA reserve requirement: 10%
Interest expense of average deposits 5.75%
Income Tax 30 %
2020 2021 2022 2023 2024 2025
NPL on legacy portfolio 31.0% 36.0% 41.0% 47.5% 55.0% 70.0%
Legacy loan repayment (Nu Million)
4,360 2,891 2,240 1,500 1,500 1,500
Status Quo Scenario BDB continues with its current underwriting practices but ends medium and large loans,
including hotel and services. NPL follows historical performance. Community Center Funding continues
Table 31 – BDB Status Quo Scenario Assumptions 2020 2021 2022 2023 2024 2025
NPL new loans 15% 16% 18% 20% 22% 22%
Provisioning on NPL new loans 15% 40% 50% 50% 50% 50%
Personnel expense growth 5% 5% 5% 5% 5% 5%
CC Funding Nu Million 37 37 37 37 37 37
Table 32 - BDB Status Quo Scenario Results Actual Projected
Nu Millions 2019 2020 2021 2022 2023 2024 2025
Total Net Loans 16,645 17,221 17,565 17,942 17,032 17,348 17,682
Total Assets 25,812 26,094 26,866 27,670 28,377 29,090 29,817
Deposits from clients 21,637 22,286 22,955 23,643 24,353 25,083 25,836
Total Equity 2,628 2,503 2,598 2,705 2,693 2,665 2,628
Net Income After Taxes 14 -126 96 107 -12 -28 -37
ROAA 0.05% -0.5% 0.4% 0.4% 0.0% -0.1% -0.1%
ROAE 0.52% -4.9% 3.7% 4.0% -0.4% -1.1% -1.4%
CAR 11.91% 10.71% 10.80% 11.00% 11.23% 10.93% 10.62%
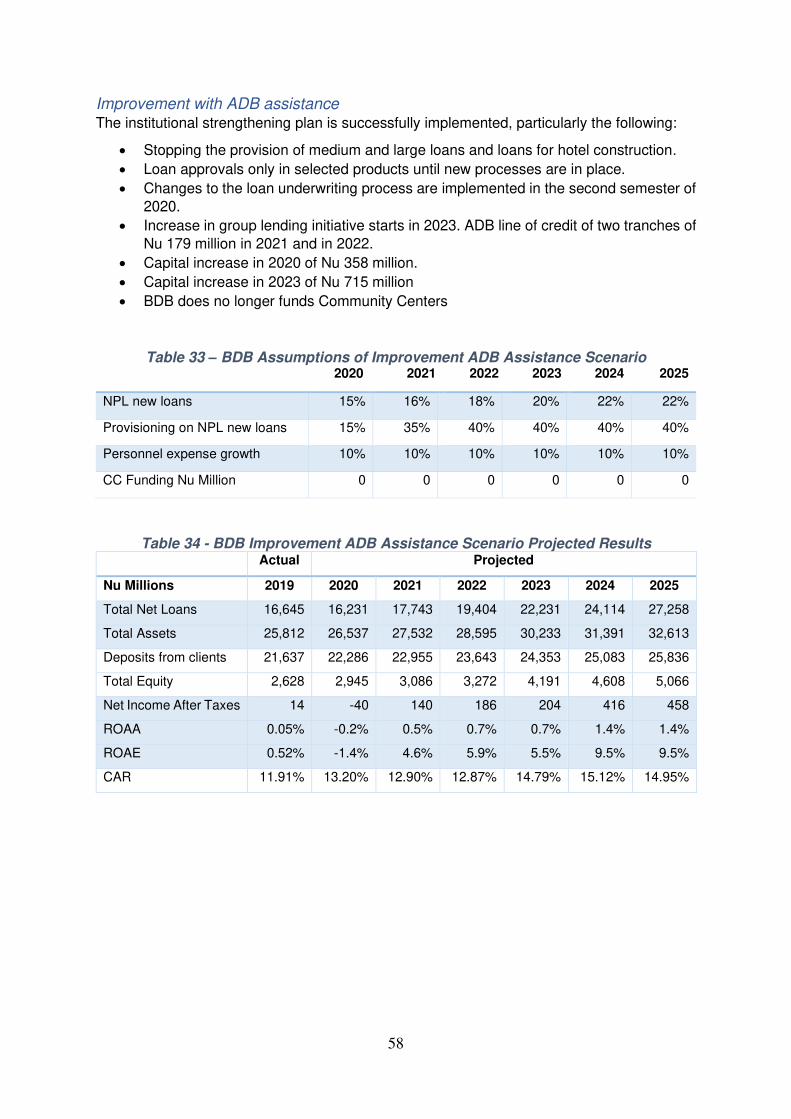
58
Improvement with ADB assistance The institutional strengthening plan is successfully implemented, particularly the following:
• Stopping the provision of medium and large loans and loans for hotel construction.
• Loan approvals only in selected products until new processes are in place.
• Changes to the loan underwriting process are implemented in the second semester of
2020.
• Increase in group lending initiative starts in 2023. ADB line of credit of two tranches of
Nu 179 million in 2021 and in 2022.
• Capital increase in 2020 of Nu 358 million.
• Capital increase in 2023 of Nu 715 million
• BDB does no longer funds Community Centers
Table 33 – BDB Assumptions of Improvement ADB Assistance Scenario 2020 2021 2022 2023 2024 2025
NPL new loans 15% 16% 18% 20% 22% 22%
Provisioning on NPL new loans 15% 35% 40% 40% 40% 40%
Personnel expense growth 10% 10% 10% 10% 10% 10%
CC Funding Nu Million 0 0 0 0 0 0
Table 34 - BDB Improvement ADB Assistance Scenario Projected Results Actual Projected
Nu Millions 2019 2020 2021 2022 2023 2024 2025
Total Net Loans 16,645 16,231 17,743 19,404 22,231 24,114 27,258
Total Assets 25,812 26,537 27,532 28,595 30,233 31,391 32,613
Deposits from clients 21,637 22,286 22,955 23,643 24,353 25,083 25,836
Total Equity 2,628 2,945 3,086 3,272 4,191 4,608 5,066
Net Income After Taxes 14 -40 140 186 204 416 458
ROAA 0.05% -0.2% 0.5% 0.7% 0.7% 1.4% 1.4%
ROAE 0.52% -1.4% 4.6% 5.9% 5.5% 9.5% 9.5%
CAR 11.91% 13.20% 12.90% 12.87% 14.79% 15.12% 14.95%
59
14 BDB institutional strengthening/financial strengthening plan - Key
actions
This section summarizes the assessment and recommendations contained through the report for ease of reference.
14.1 Strategic Planning Objective: Board should approve a strategic plan for BDB for the next five years. Each year
management performance should be evaluated against the plan and the plan revised to reflect
the performance and new market developments.
Key Actions:
• Vision statement. Reviewing and drafting a more concrete statement in a collaborative effort with the involvement of board, management and staff.
• Mission statement. Adding other aspects such as transparency/financial literacy,
customers service and branch network. Also, through a collaborative process
• Core statement. Adding integrity and honesty
• Business plan. BDB management should present to the BOD a five-year business plan
inclusive of financial projections. Each year management should present to the BOD an analysis of deviations from the targets, proposed corrective actions if required and
revised projections. Management should be held accountable for meeting targets.
14.2 Corporate governance Objective: Development a strong corporate governance framework to enable BDB to operate
with independence from the government. Management leadership with banking and MFI
experience outside BDB.
Key actions:
• Appointment of directors with business and banking experience following OECD
principles.
• Strengthen BDB management team with the inclusion of a Deputy CEO in charge of
credit. (Refer to Annex IV for indicative Terms of Reference for the position)
• Corporate structure should be revised to include two deputy CEOs.
14.3 Training Objective: Development of consistent, homogeneous and academically rigorous training
program.
Key actions:
• Introduction of a three-week introductory course with separate curricula for high school
(credit assistants) and university (credit officers) recruits.
• Introduction course should culminate with a fail or pass examination.
• Continuing education courses during first two years
• Performance review after two years to decide suitability for continuing employment in
the credit division. Only those recommended by their supervisors and with the approval
of the credit department deputy general manager should continue in the credit department. In their third year of service all recommended credit personnel should
attend the credit training abroad, currently NIBM, India.
• Introduction of industry sector training, particularly in agricultural supply chain and
production. Group base lending and microfinance.
60
14.4 Credit Personnel Recruitment Objective: Increase the number of credit assistants and officers to have better customer reach
Key Actions:
• Increase credit personnel by 20% a year until reaching a ration or 200 active loan
accounts per credit assistant/officer.
• Redeploy credit personnel to avoid a large disparity in credit personnel efficiency ratios
by branch.
14.5 Management Information System Objective: Full implementation of Finacle CBS with reliable reporting.
Key actions:
• Data in the system should be reviewed, errors rectified, and information incorporated
in blank data fields.
• There should be no unreconcilable discrepancies between the output of Finacle and
the information in the financial statements.
• All new loan documentation should be inputted in Finacle’s document management system.
• Information from Finacle system should be summarized in easily readable tables and
graphs and presented to management periodically.
• Nelito Systems Ltd (implementation firm) quality of services should be reviewed
against the specifications in the contract.
• The results of the RAA audit and the assessment of this report bring into consideration
the need to conduct an independent IT audit of BDB systems by an experienced firm. This should be done prior to the conclusion of the 2020 fiscal year
14.6 Internal Audit/Fraud prevention Objective: Avoid or minimize the fraud and/or embezzlement.
Key Action:
• Branches should operate with the staff needed to follow the controls established in the
bank’s procedures. Under no circumstances should be exceptions. Branch managers should be informed of a zero tolerance for deviations from control policies and of the consequences that should include separation of employment for repetitive or serious
lapses.
• Internal audit of branches should always contain an assessment of personnel needs
and an opinion if the quality and quantity of staff is sufficient to conduct activities
following BDB manuals, particularly maker-checker procedures.
61
14.7 Loan Products and Credit Manual Objective: BDB should have a loan product list that focuses on its mandate of providing micro,
small and medium financial services for the development and modernization of agricultural,
commercial and industrial enterprises.
Key Actions:
• Streamline the offerings and better focus on core products. Discontinue offerings
where BDB is at a competitive disadvantage or where the target market is too small to
justify the need to concentrate efforts.
• Differentiate the offering in agriculture/livestock for micro, cottage and small loans.
• Increment focus on group lending. Group lending loans currently represent less than
1% of BDB portfolio even though loan performance is better than BDB NPL ratio. Identify three geographic areas were group lending would be a good match and
establish pilot programs under trained loan officers. Evaluate implementing a peer
pressure model instead of joint liability for seasonal loans.
• The credit manual should be rewritten to better correlate with the product offering.
• BDB should implement risk-based scoring system in the medium term
14.8 Community Centers (CCs) Objective: BDB should not be responsible for the provision of services that have no significant
relation with its mission of being a development bank for the provision of loans to rural communities. CCs are a burden to BDB and there are no synergies in the operations. CCs
should be separated from BDB and BDB should only be responsible to pay market rates for
the usage of facilities when appropriate.
14.9 Credit Management and Loan Underwriting Objective: Improve loan performance and reduce the NPL level.
Key Actions:
• Discontinue extending medium and large loans.
• Discontinue loans in the hotel construction sector
• No loan application should be recommended for approval without a client interview
with a credit assistant or credit officer.
• Credit assistant and credit officers should spend more time on the field and get to know
the clients and the communities better.
• Improve the quality of the loan applications and the loan files
• Establish standard loan approval analysis models and set parameters por specific
subsectors.
• Empowering loan officers to make recommendations on loans and hold them
accountable.
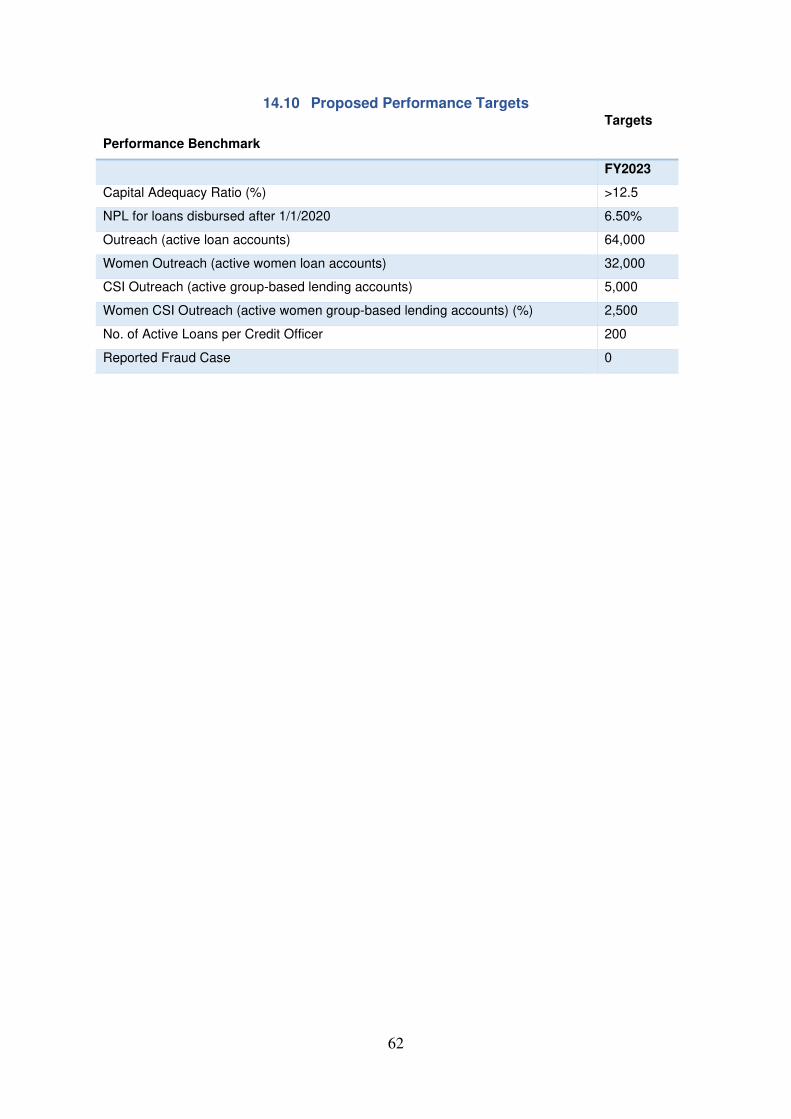
62
14.10 Proposed Performance Targets
Performance Benchmark
Targets
FY2023
Capital Adequacy Ratio (%) >12.5
NPL for loans disbursed after 1/1/2020 6.50%
Outreach (active loan accounts) 64,000
Women Outreach (active women loan accounts) 32,000
CSI Outreach (active group-based lending accounts) 5,000
Women CSI Outreach (active women group-based lending accounts) (%) 2,500
No. of Active Loans per Credit Officer 200
Reported Fraud Case 0
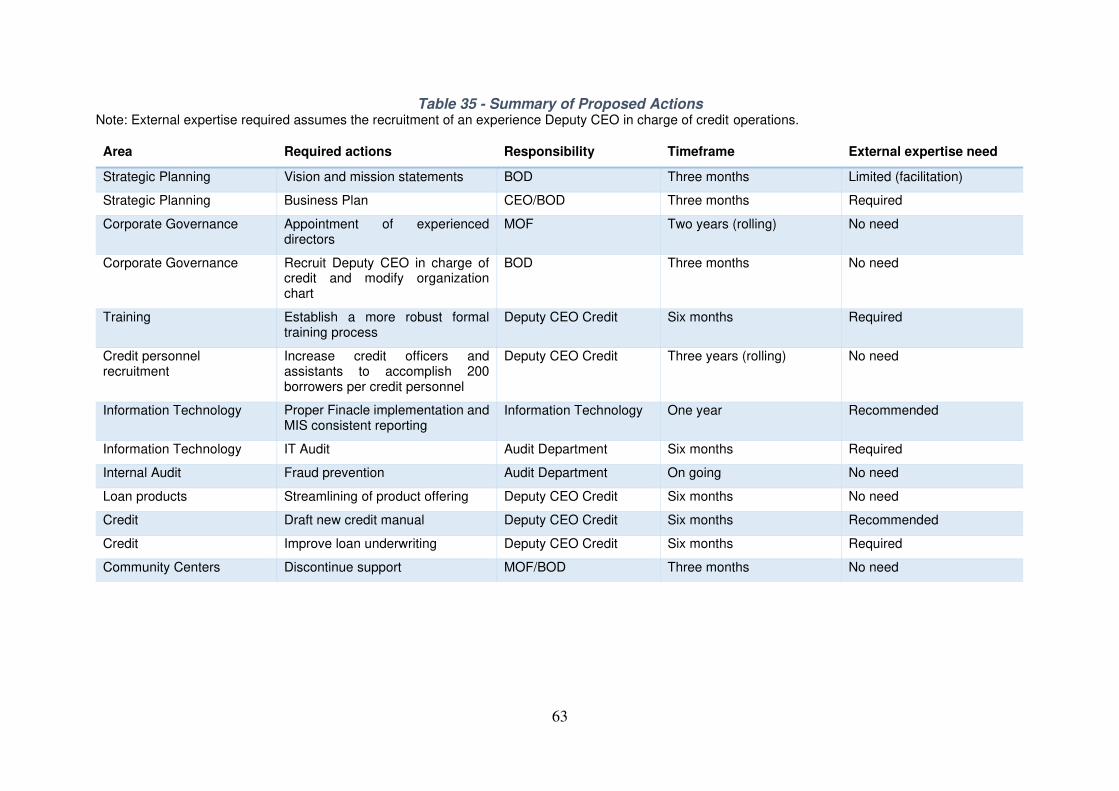
63
Table 35 - Summary of Proposed Actions Note: External expertise required assumes the recruitment of an experience Deputy CEO in charge of credit operations.
Area Required actions Responsibility Timeframe External expertise need
Strategic Planning Vision and mission statements BOD Three months Limited (facilitation)
Strategic Planning Business Plan CEO/BOD Three months Required
Corporate Governance Appointment of experienced directors
MOF Two years (rolling) No need
Corporate Governance Recruit Deputy CEO in charge of credit and modify organization chart
BOD Three months No need
Training Establish a more robust formal training process
Deputy CEO Credit Six months Required
Credit personnel recruitment
Increase credit officers and assistants to accomplish 200 borrowers per credit personnel
Deputy CEO Credit Three years (rolling) No need
Information Technology Proper Finacle implementation and MIS consistent reporting
Information Technology One year Recommended
Information Technology IT Audit Audit Department Six months Required
Internal Audit Fraud prevention Audit Department On going No need
Loan products Streamlining of product offering Deputy CEO Credit Six months No need
Credit Draft new credit manual Deputy CEO Credit Six months Recommended
Credit Improve loan underwriting Deputy CEO Credit Six months Required
Community Centers Discontinue support MOF/BOD Three months No need
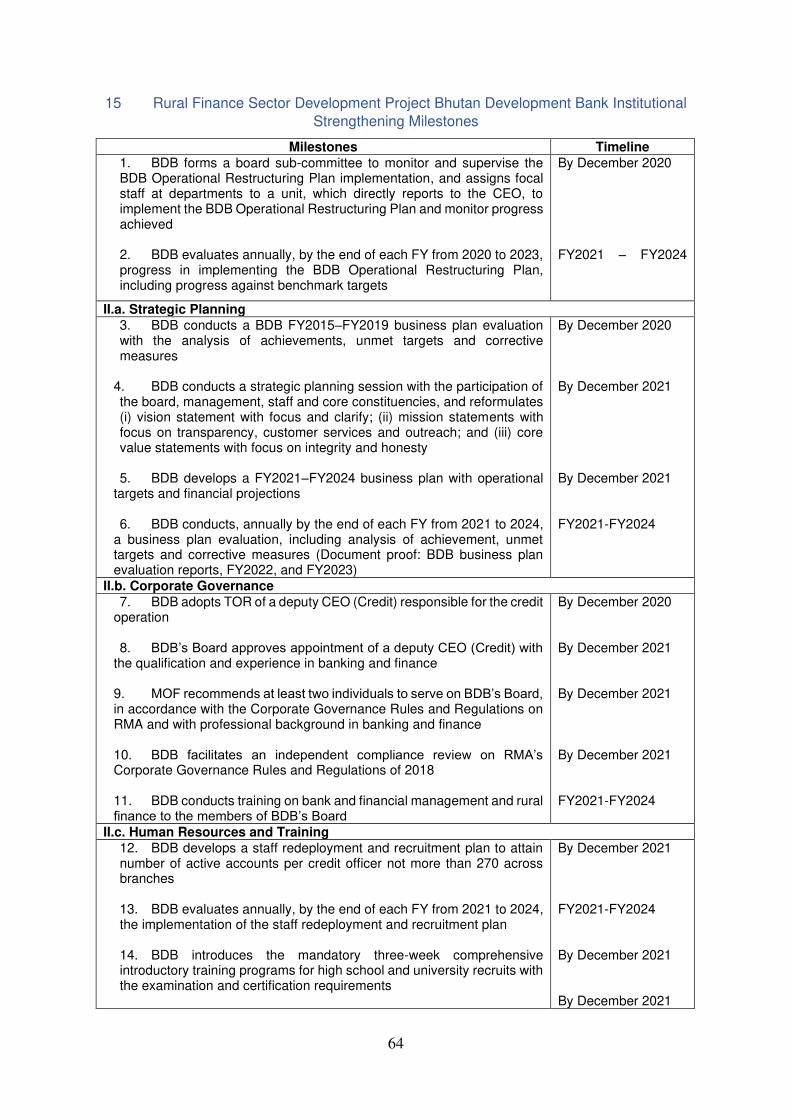
64
15 Rural Finance Sector Development Project Bhutan Development Bank Institutional
Strengthening Milestones
Milestones Timeline
1. BDB forms a board sub-committee to monitor and supervise the BDB Operational Restructuring Plan implementation, and assigns focal staff at departments to a unit, which directly reports to the CEO, to implement the BDB Operational Restructuring Plan and monitor progress achieved 2. BDB evaluates annually, by the end of each FY from 2020 to 2023, progress in implementing the BDB Operational Restructuring Plan, including progress against benchmark targets
By December 2020 FY2021 – FY2024
II.a. Strategic Planning
3. BDB conducts a BDB FY2015–FY2019 business plan evaluation with the analysis of achievements, unmet targets and corrective measures
4. BDB conducts a strategic planning session with the participation of the board, management, staff and core constituencies, and reformulates (i) vision statement with focus and clarify; (ii) mission statements with focus on transparency, customer services and outreach; and (iii) core value statements with focus on integrity and honesty
5. BDB develops a FY2021–FY2024 business plan with operational
targets and financial projections 6. BDB conducts, annually by the end of each FY from 2021 to 2024,
a business plan evaluation, including analysis of achievement, unmet targets and corrective measures (Document proof: BDB business plan evaluation reports, FY2022, and FY2023)
By December 2020 By December 2021 By December 2021 FY2021-FY2024
II.b. Corporate Governance
7. BDB adopts TOR of a deputy CEO (Credit) responsible for the credit operation 8. BDB’s Board approves appointment of a deputy CEO (Credit) with
the qualification and experience in banking and finance
9. MOF recommends at least two individuals to serve on BDB’s Board, in accordance with the Corporate Governance Rules and Regulations on RMA and with professional background in banking and finance 10. BDB facilitates an independent compliance review on RMA’s Corporate Governance Rules and Regulations of 2018
11. BDB conducts training on bank and financial management and rural finance to the members of BDB’s Board
By December 2020 By December 2021 By December 2021 By December 2021 FY2021-FY2024
II.c. Human Resources and Training
12. BDB develops a staff redeployment and recruitment plan to attain number of active accounts per credit officer not more than 270 across branches 13. BDB evaluates annually, by the end of each FY from 2021 to 2024, the implementation of the staff redeployment and recruitment plan 14. BDB introduces the mandatory three-week comprehensive introductory training programs for high school and university recruits with the examination and certification requirements
By December 2021 FY2021-FY2024 By December 2021 By December 2021
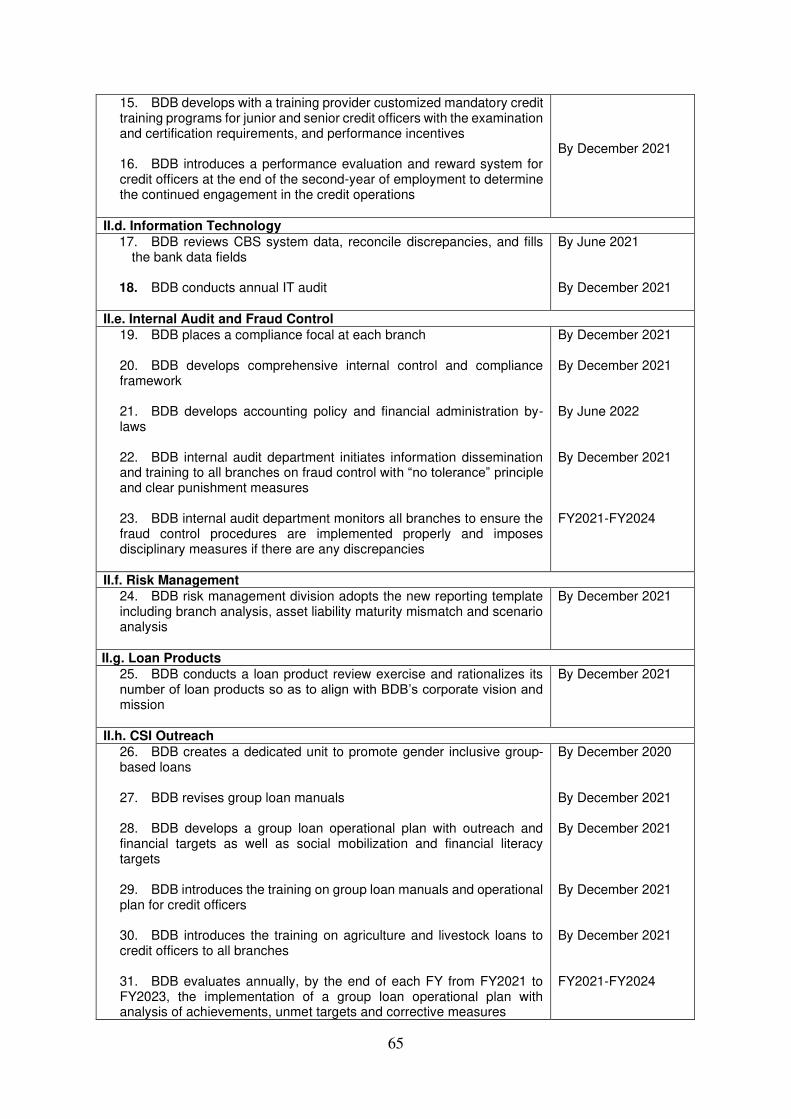
65
15. BDB develops with a training provider customized mandatory credit training programs for junior and senior credit officers with the examination and certification requirements, and performance incentives 16. BDB introduces a performance evaluation and reward system for credit officers at the end of the second-year of employment to determine the continued engagement in the credit operations
By December 2021
II.d. Information Technology
17. BDB reviews CBS system data, reconcile discrepancies, and fills the bank data fields
18. BDB conducts annual IT audit
By June 2021 By December 2021
II.e. Internal Audit and Fraud Control
19. BDB places a compliance focal at each branch 20. BDB develops comprehensive internal control and compliance framework
21. BDB develops accounting policy and financial administration by-laws 22. BDB internal audit department initiates information dissemination and training to all branches on fraud control with “no tolerance” principle and clear punishment measures 23. BDB internal audit department monitors all branches to ensure the fraud control procedures are implemented properly and imposes disciplinary measures if there are any discrepancies
By December 2021 By December 2021 By June 2022 By December 2021 FY2021-FY2024
II.f. Risk Management
24. BDB risk management division adopts the new reporting template including branch analysis, asset liability maturity mismatch and scenario analysis
By December 2021
II.g. Loan Products
25. BDB conducts a loan product review exercise and rationalizes its number of loan products so as to align with BDB’s corporate vision and mission
By December 2021
II.h. CSI Outreach
26. BDB creates a dedicated unit to promote gender inclusive group-based loans 27. BDB revises group loan manuals
28. BDB develops a group loan operational plan with outreach and financial targets as well as social mobilization and financial literacy targets
29. BDB introduces the training on group loan manuals and operational plan for credit officers
30. BDB introduces the training on agriculture and livestock loans to credit officers to all branches
31. BDB evaluates annually, by the end of each FY from FY2021 to FY2023, the implementation of a group loan operational plan with analysis of achievements, unmet targets and corrective measures
By December 2020 By December 2021 By December 2021 By December 2021 By December 2021 FY2021-FY2024
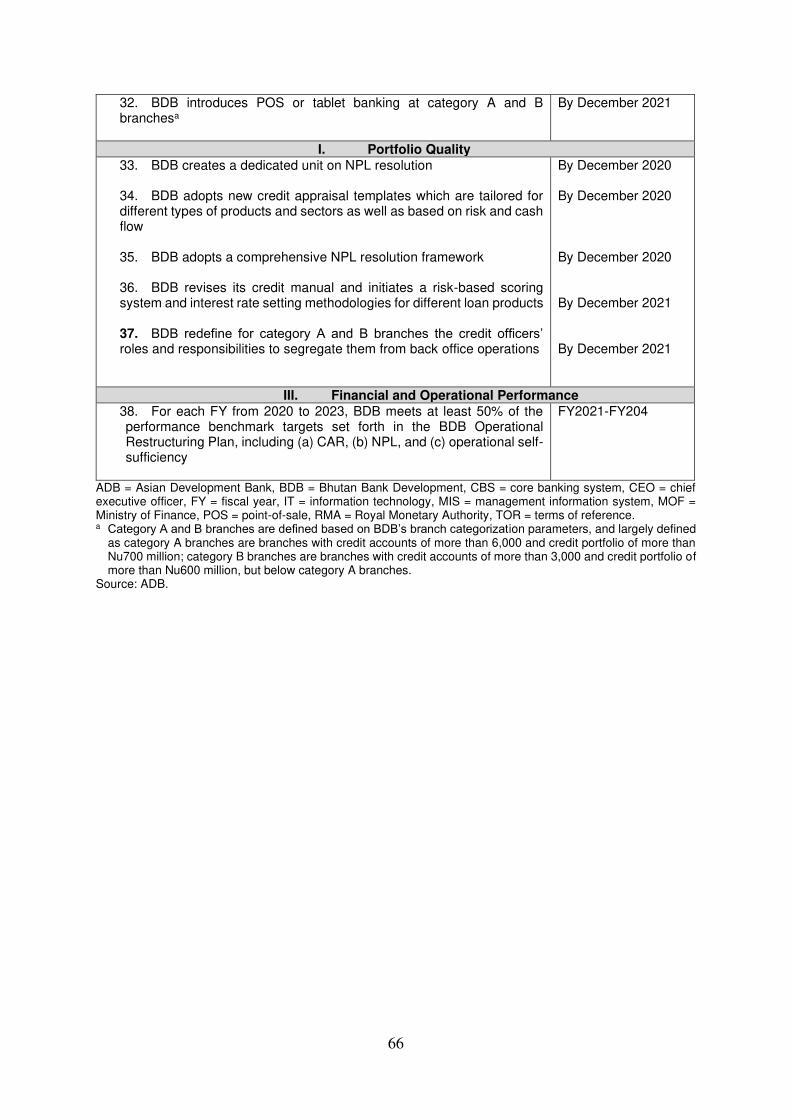
66
32. BDB introduces POS or tablet banking at category A and B branchesa
By December 2021
I. Portfolio Quality
33. BDB creates a dedicated unit on NPL resolution 34. BDB adopts new credit appraisal templates which are tailored for different types of products and sectors as well as based on risk and cash flow
35. BDB adopts a comprehensive NPL resolution framework
36. BDB revises its credit manual and initiates a risk-based scoring system and interest rate setting methodologies for different loan products 37. BDB redefine for category A and B branches the credit officers’ roles and responsibilities to segregate them from back office operations
By December 2020 By December 2020 By December 2020 By December 2021 By December 2021
III. Financial and Operational Performance
38. For each FY from 2020 to 2023, BDB meets at least 50% of the performance benchmark targets set forth in the BDB Operational Restructuring Plan, including (a) CAR, (b) NPL, and (c) operational self-sufficiency
FY2021-FY204
ADB = Asian Development Bank, BDB = Bhutan Bank Development, CBS = core banking system, CEO = chief executive officer, FY = fiscal year, IT = information technology, MIS = management information system, MOF = Ministry of Finance, POS = point-of-sale, RMA = Royal Monetary Authority, TOR = terms of reference. a Category A and B branches are defined based on BDB’s branch categorization parameters, and largely defined
as category A branches are branches with credit accounts of more than 6,000 and credit portfolio of more than Nu700 million; category B branches are branches with credit accounts of more than 3,000 and credit portfolio of more than Nu600 million, but below category A branches.
Source: ADB.
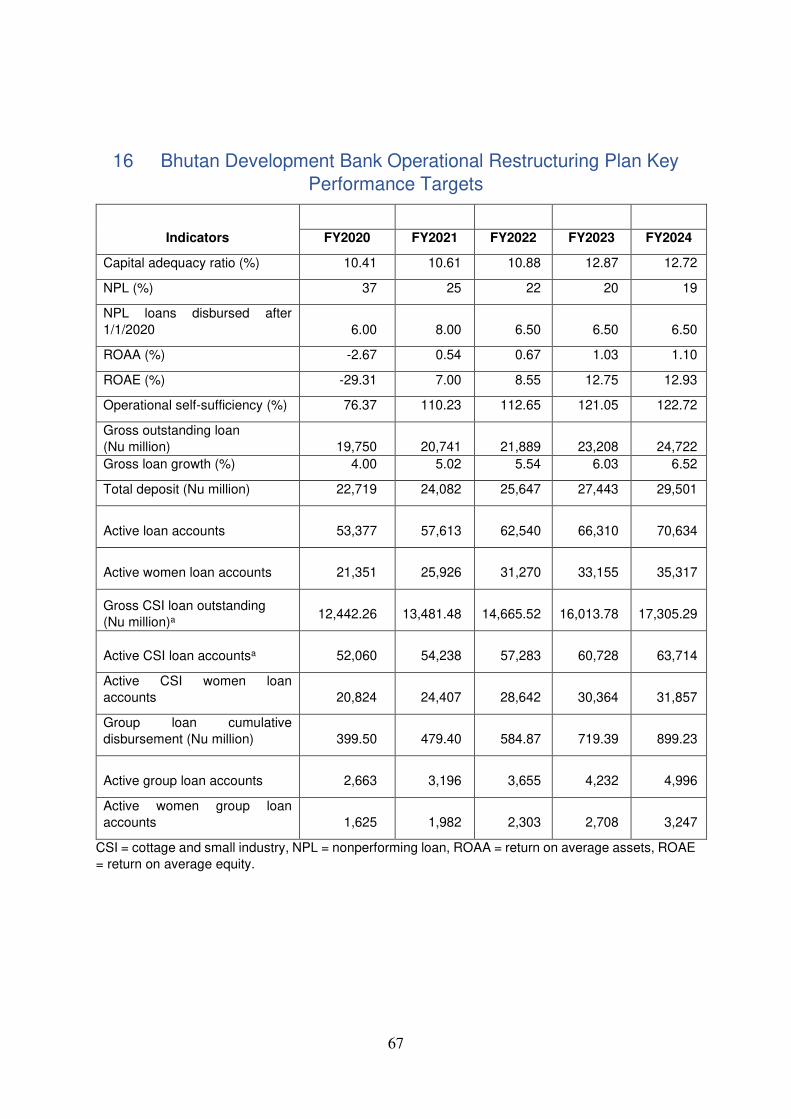
67
16 Bhutan Development Bank Operational Restructuring Plan Key
Performance Targets
Indicators
FY2020 FY2021 FY2022 FY2023 FY2024
Capital adequacy ratio (%) 10.41 10.61 10.88 12.87 12.72
NPL (%) 37 25 22 20 19
NPL loans disbursed after
1/1/2020 6.00 8.00 6.50 6.50 6.50
ROAA (%) -2.67 0.54 0.67 1.03 1.10
ROAE (%) -29.31 7.00 8.55 12.75 12.93
Operational self-sufficiency (%) 76.37 110.23 112.65 121.05 122.72
Gross outstanding loan
(Nu million) 19,750 20,741 21,889 23,208 24,722
Gross loan growth (%) 4.00 5.02 5.54 6.03 6.52
Total deposit (Nu million) 22,719 24,082 25,647 27,443 29,501
Active loan accounts
53,377
57,613
62,540
66,310
70,634
Active women loan accounts
21,351
25,926
31,270
33,155
35,317
Gross CSI loan outstanding
(Nu million)a
12,442.26
13,481.48
14,665.52
16,013.78
17,305.29
Active CSI loan accountsa
52,060
54,238
57,283
60,728
63,714
Active CSI women loan
accounts 20,824 24,407 28,642 30,364 31,857
Group loan cumulative
disbursement (Nu million)
399.50
479.40
584.87
719.39
899.23
Active group loan accounts
2,663
3,196
3,655
4,232
4,996
Active women group loan
accounts
1,625
1,982
2,303
2,708
3,247
CSI = cottage and small industry, NPL = nonperforming loan, ROAA = return on average assets, ROAE
= return on average equity.
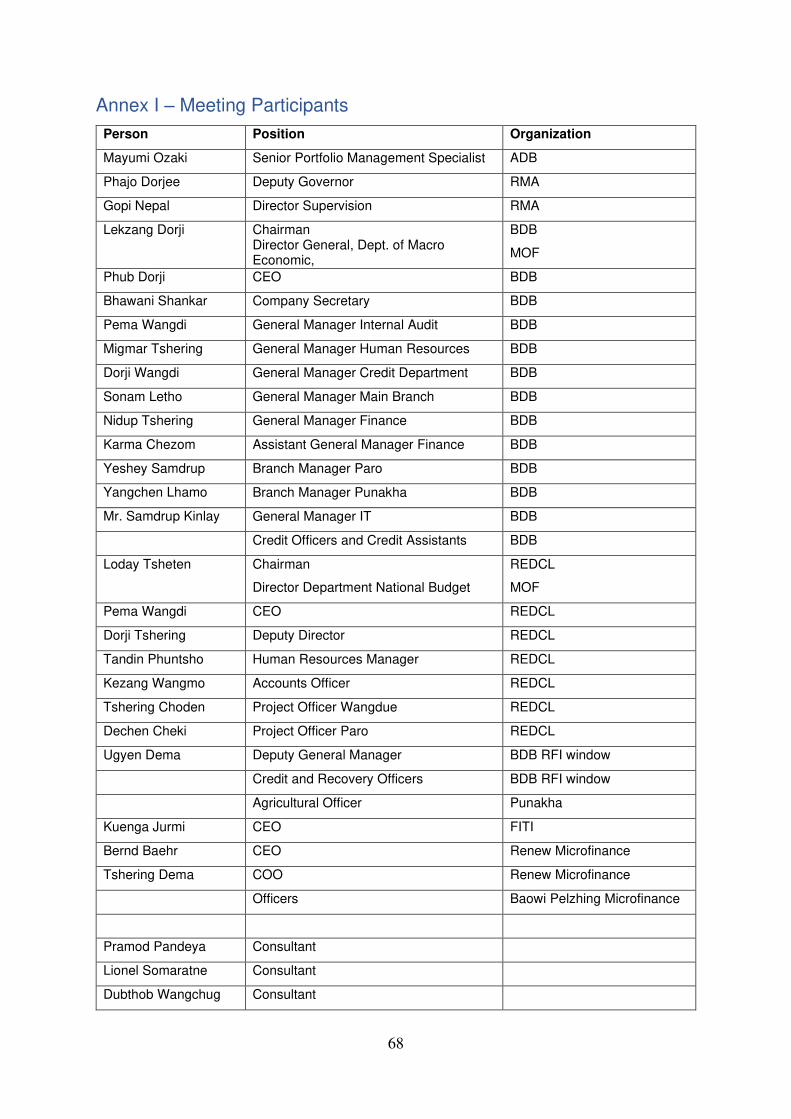
68
Annex I – Meeting Participants
Person Position Organization
Mayumi Ozaki Senior Portfolio Management Specialist ADB
Phajo Dorjee Deputy Governor RMA
Gopi Nepal Director Supervision RMA
Lekzang Dorji Chairman Director General, Dept. of Macro Economic,
BDB
MOF
Phub Dorji CEO BDB
Bhawani Shankar Company Secretary BDB
Pema Wangdi General Manager Internal Audit BDB
Migmar Tshering General Manager Human Resources BDB
Dorji Wangdi General Manager Credit Department BDB
Sonam Letho General Manager Main Branch BDB
Nidup Tshering General Manager Finance BDB
Karma Chezom Assistant General Manager Finance BDB
Yeshey Samdrup Branch Manager Paro BDB
Yangchen Lhamo Branch Manager Punakha BDB
Mr. Samdrup Kinlay General Manager IT BDB
Credit Officers and Credit Assistants BDB
Loday Tsheten Chairman
Director Department National Budget
REDCL
MOF
Pema Wangdi CEO REDCL
Dorji Tshering Deputy Director REDCL
Tandin Phuntsho Human Resources Manager REDCL
Kezang Wangmo Accounts Officer REDCL
Tshering Choden Project Officer Wangdue REDCL
Dechen Cheki Project Officer Paro REDCL
Ugyen Dema Deputy General Manager BDB RFI window
Credit and Recovery Officers BDB RFI window
Agricultural Officer Punakha
Kuenga Jurmi CEO FITI
Bernd Baehr CEO Renew Microfinance
Tshering Dema COO Renew Microfinance
Officers Baowi Pelzhing Microfinance
Pramod Pandeya Consultant
Lionel Somaratne Consultant
Dubthob Wangchug Consultant

69
Annex II - Financial Ratios Definition
Term Definition
Impairment expense ratio Impairment charges/gross outstanding loans
Risk coverage ratio Loan provisions/PAR>30
Operating expense ratio Operating expenses (less impairment)/Average gross loans
Financial expense ratio Financial expenses/Average gross loans
Cost of funds ratio Financial expenses/Average funding liabilities
Portfolio yield Interest Income on loans/Average gross loans
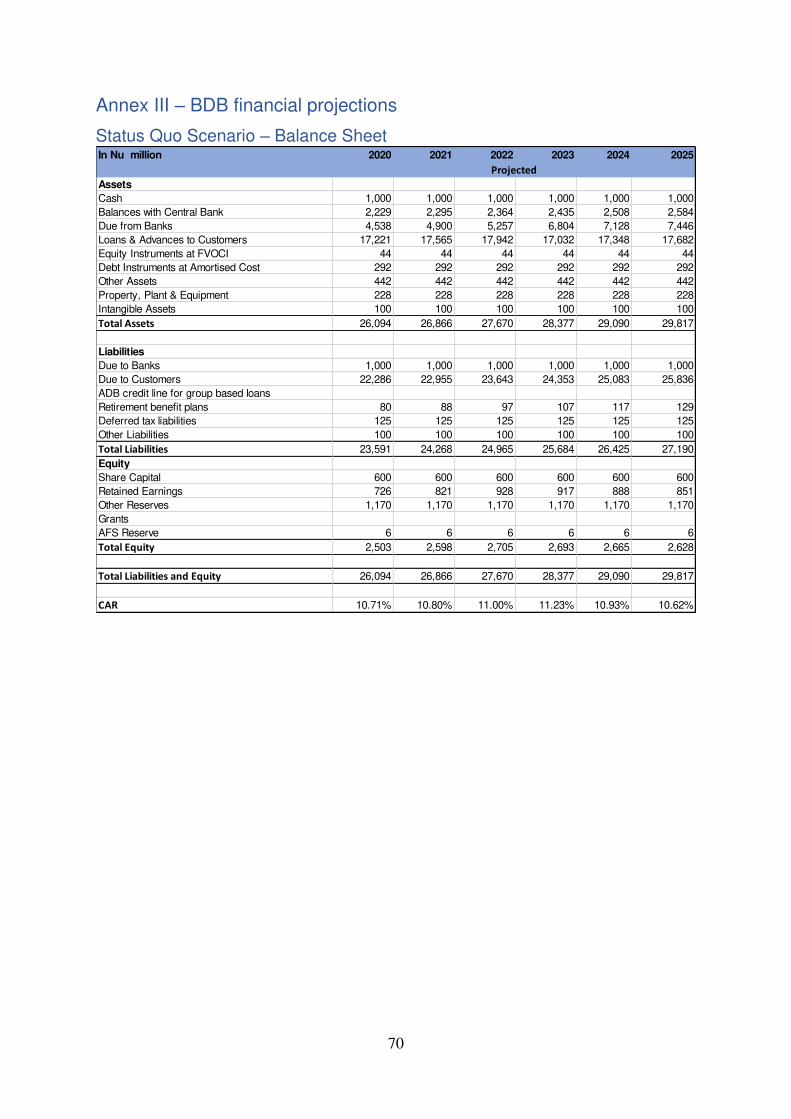
70
Annex III – BDB financial projections
Status Quo Scenario – Balance Sheet
In Nu million 2020 2021 2022 2023 2024 2025
Assets
Cash 1,000 1,000 1,000 1,000 1,000 1,000
Balances with Central Bank 2,229 2,295 2,364 2,435 2,508 2,584
Due from Banks 4,538 4,900 5,257 6,804 7,128 7,446
Loans & Advances to Customers 17,221 17,565 17,942 17,032 17,348 17,682
Equity Instruments at FVOCI 44 44 44 44 44 44
Debt Instruments at Amortised Cost 292 292 292 292 292 292
Other Assets 442 442 442 442 442 442
Property, Plant & Equipment 228 228 228 228 228 228
Intangible Assets 100 100 100 100 100 100
Total Assets 26,094 26,866 27,670 28,377 29,090 29,817
Liabilities
Due to Banks 1,000 1,000 1,000 1,000 1,000 1,000
Due to Customers 22,286 22,955 23,643 24,353 25,083 25,836
ADB credit line for group based loans
Retirement benefit plans 80 88 97 107 117 129
Deferred tax liabilities 125 125 125 125 125 125
Other Liabilities 100 100 100 100 100 100
Total Liabilities 23,591 24,268 24,965 25,684 26,425 27,190
Equity
Share Capital 600 600 600 600 600 600
Retained Earnings 726 821 928 917 888 851
Other Reserves 1,170 1,170 1,170 1,170 1,170 1,170
Grants
AFS Reserve 6 6 6 6 6 6
Total Equity 2,503 2,598 2,705 2,693 2,665 2,628
Total Liabilities and Equity 26,094 26,866 27,670 28,377 29,090 29,817
CAR 10.71% 10.80% 11.00% 11.23% 10.93% 10.62%
Projected
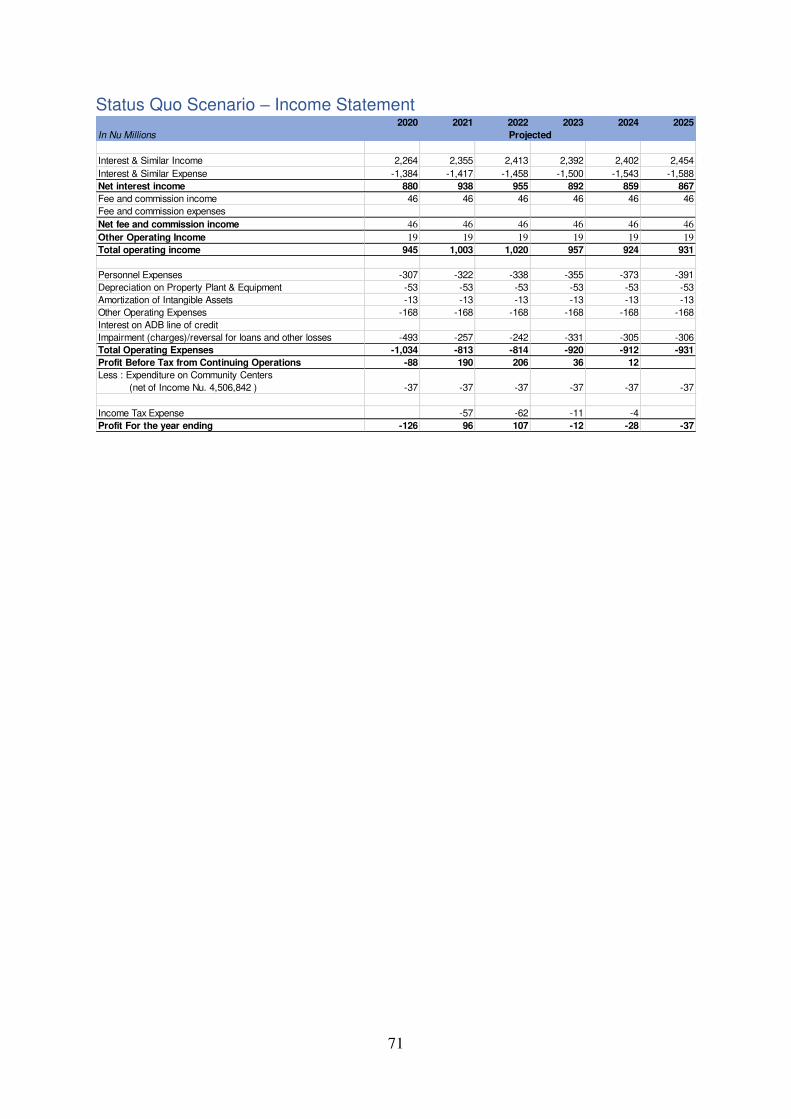
71
Status Quo Scenario – Income Statement
2020 2021 2022 2023 2024 2025
In Nu Millions
Interest & Similar Income 2,264 2,355 2,413 2,392 2,402 2,454
Interest & Similar Expense -1,384 -1,417 -1,458 -1,500 -1,543 -1,588
Net interest income 880 938 955 892 859 867
Fee and commission income 46 46 46 46 46 46
Fee and commission expenses
Net fee and commission income 46 46 46 46 46 46
Other Operating Income 19 19 19 19 19 19
Total operating income 945 1,003 1,020 957 924 931
Personnel Expenses -307 -322 -338 -355 -373 -391
Depreciation on Property Plant & Equipment -53 -53 -53 -53 -53 -53
Amortization of Intangible Assets -13 -13 -13 -13 -13 -13
Other Operating Expenses -168 -168 -168 -168 -168 -168
Interest on ADB line of credit
Impairment (charges)/reversal for loans and other losses -493 -257 -242 -331 -305 -306
Total Operating Expenses -1,034 -813 -814 -920 -912 -931
Profit Before Tax from Continuing Operations -88 190 206 36 12
Less : Expenditure on Community Centers
(net of Income Nu. 4,506,842 ) -37 -37 -37 -37 -37 -37
Income Tax Expense -57 -62 -11 -4
Profit For the year ending -126 96 107 -12 -28 -37
Projected
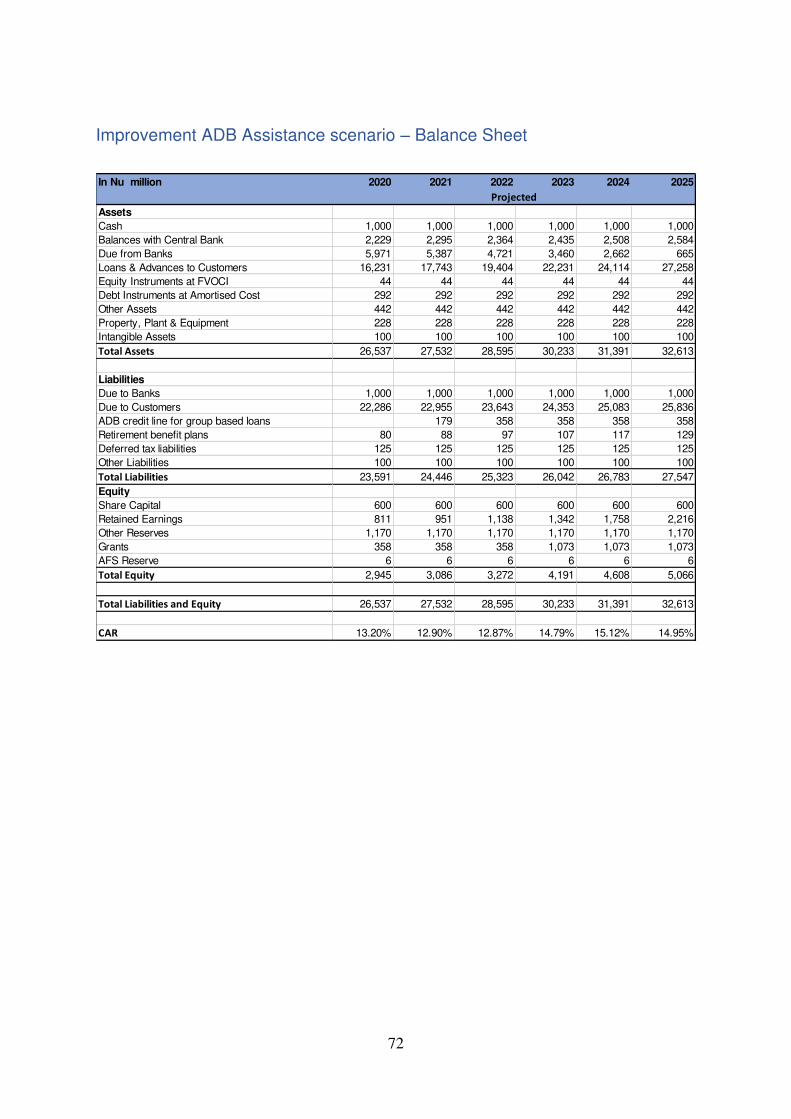
72
Improvement ADB Assistance scenario – Balance Sheet
In Nu million 2020 2021 2022 2023 2024 2025
Assets
Cash 1,000 1,000 1,000 1,000 1,000 1,000
Balances with Central Bank 2,229 2,295 2,364 2,435 2,508 2,584
Due from Banks 5,971 5,387 4,721 3,460 2,662 665
Loans & Advances to Customers 16,231 17,743 19,404 22,231 24,114 27,258
Equity Instruments at FVOCI 44 44 44 44 44 44
Debt Instruments at Amortised Cost 292 292 292 292 292 292
Other Assets 442 442 442 442 442 442
Property, Plant & Equipment 228 228 228 228 228 228
Intangible Assets 100 100 100 100 100 100
Total Assets 26,537 27,532 28,595 30,233 31,391 32,613
Liabilities
Due to Banks 1,000 1,000 1,000 1,000 1,000 1,000
Due to Customers 22,286 22,955 23,643 24,353 25,083 25,836
ADB credit line for group based loans 179 358 358 358 358
Retirement benefit plans 80 88 97 107 117 129
Deferred tax liabilities 125 125 125 125 125 125
Other Liabilities 100 100 100 100 100 100
Total Liabilities 23,591 24,446 25,323 26,042 26,783 27,547
Equity
Share Capital 600 600 600 600 600 600
Retained Earnings 811 951 1,138 1,342 1,758 2,216
Other Reserves 1,170 1,170 1,170 1,170 1,170 1,170
Grants 358 358 358 1,073 1,073 1,073
AFS Reserve 6 6 6 6 6 6
Total Equity 2,945 3,086 3,272 4,191 4,608 5,066
Total Liabilities and Equity 26,537 27,532 28,595 30,233 31,391 32,613
CAR 13.20% 12.90% 12.87% 14.79% 15.12% 14.95%
Projected
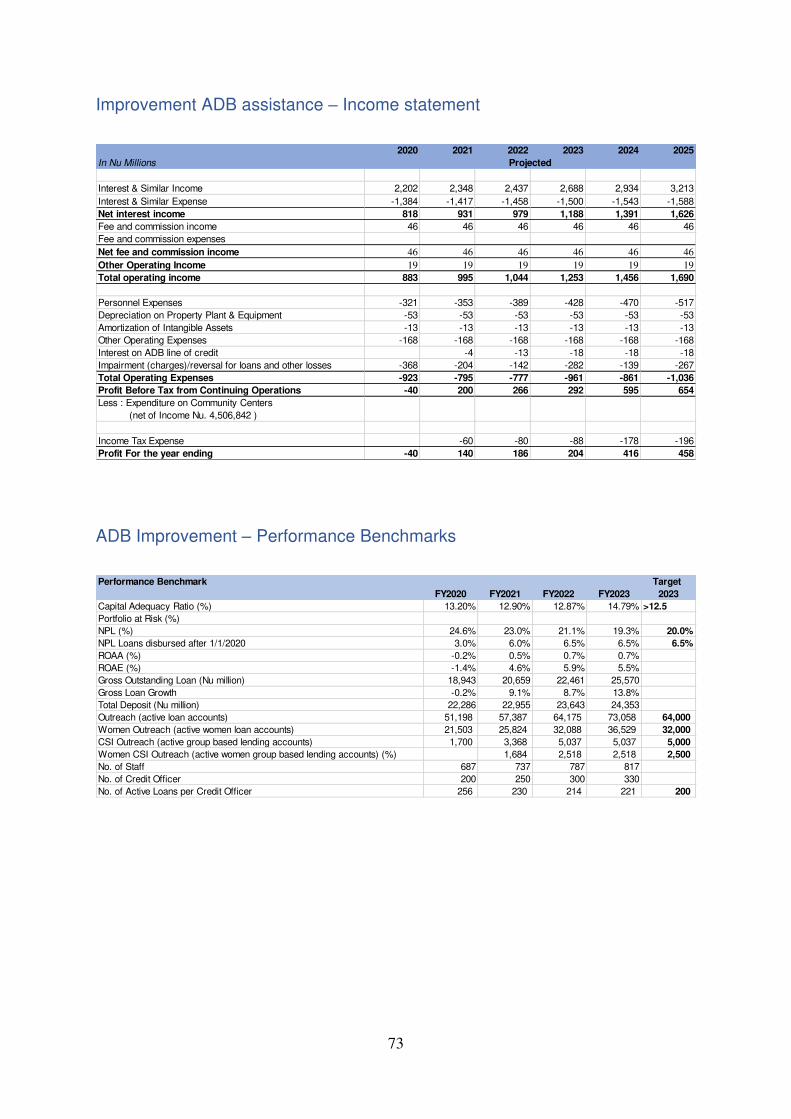
73
Improvement ADB assistance – Income statement
ADB Improvement – Performance Benchmarks
2020 2021 2022 2023 2024 2025
In Nu Millions
Interest & Similar Income 2,202 2,348 2,437 2,688 2,934 3,213
Interest & Similar Expense -1,384 -1,417 -1,458 -1,500 -1,543 -1,588
Net interest income 818 931 979 1,188 1,391 1,626
Fee and commission income 46 46 46 46 46 46
Fee and commission expenses
Net fee and commission income 46 46 46 46 46 46
Other Operating Income 19 19 19 19 19 19
Total operating income 883 995 1,044 1,253 1,456 1,690
Personnel Expenses -321 -353 -389 -428 -470 -517
Depreciation on Property Plant & Equipment -53 -53 -53 -53 -53 -53
Amortization of Intangible Assets -13 -13 -13 -13 -13 -13
Other Operating Expenses -168 -168 -168 -168 -168 -168
Interest on ADB line of credit -4 -13 -18 -18 -18
Impairment (charges)/reversal for loans and other losses -368 -204 -142 -282 -139 -267
Total Operating Expenses -923 -795 -777 -961 -861 -1,036
Profit Before Tax from Continuing Operations -40 200 266 292 595 654
Less : Expenditure on Community Centers
(net of Income Nu. 4,506,842 )
Income Tax Expense -60 -80 -88 -178 -196
Profit For the year ending -40 140 186 204 416 458
Projected
Performance Benchmark Target
FY2020 FY2021 FY2022 FY2023 2023
Capital Adequacy Ratio (%) 13.20% 12.90% 12.87% 14.79% >12.5
Portfolio at Risk (%)
NPL (%) 24.6% 23.0% 21.1% 19.3% 20.0%
NPL Loans disbursed after 1/1/2020 3.0% 6.0% 6.5% 6.5% 6.5%
ROAA (%) -0.2% 0.5% 0.7% 0.7%
ROAE (%) -1.4% 4.6% 5.9% 5.5%
Gross Outstanding Loan (Nu million) 18,943 20,659 22,461 25,570
Gross Loan Growth -0.2% 9.1% 8.7% 13.8%
Total Deposit (Nu million) 22,286 22,955 23,643 24,353
Outreach (active loan accounts) 51,198 57,387 64,175 73,058 64,000
Women Outreach (active women loan accounts) 21,503 25,824 32,088 36,529 32,000
CSI Outreach (active group based lending accounts) 1,700 3,368 5,037 5,037 5,000
Women CSI Outreach (active women group based lending accounts) (%) 1,684 2,518 2,518 2,500
No. of Staff 687 737 787 817
No. of Credit Officer 200 250 300 330
No. of Active Loans per Credit Officer 256 230 214 221 200
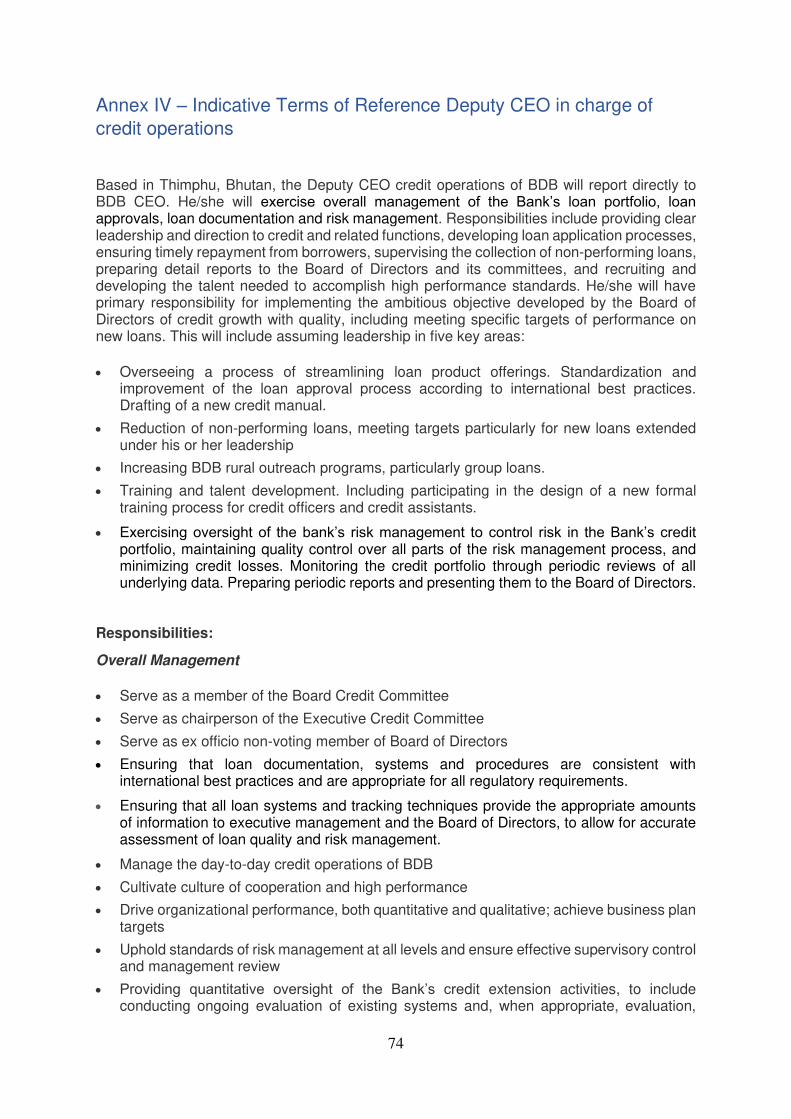
74
Annex IV – Indicative Terms of Reference Deputy CEO in charge of
credit operations
Based in Thimphu, Bhutan, the Deputy CEO credit operations of BDB will report directly to BDB CEO. He/she will exercise overall management of the Bank’s loan portfolio, loan approvals, loan documentation and risk management. Responsibilities include providing clear leadership and direction to credit and related functions, developing loan application processes, ensuring timely repayment from borrowers, supervising the collection of non-performing loans, preparing detail reports to the Board of Directors and its committees, and recruiting and developing the talent needed to accomplish high performance standards. He/she will have primary responsibility for implementing the ambitious objective developed by the Board of Directors of credit growth with quality, including meeting specific targets of performance on new loans. This will include assuming leadership in five key areas:
• Overseeing a process of streamlining loan product offerings. Standardization and improvement of the loan approval process according to international best practices. Drafting of a new credit manual.
• Reduction of non-performing loans, meeting targets particularly for new loans extended under his or her leadership
• Increasing BDB rural outreach programs, particularly group loans.
• Training and talent development. Including participating in the design of a new formal training process for credit officers and credit assistants.
• Exercising oversight of the bank’s risk management to control risk in the Bank’s credit portfolio, maintaining quality control over all parts of the risk management process, and minimizing credit losses. Monitoring the credit portfolio through periodic reviews of all underlying data. Preparing periodic reports and presenting them to the Board of Directors.
Responsibilities:
Overall Management
• Serve as a member of the Board Credit Committee
• Serve as chairperson of the Executive Credit Committee
• Serve as ex officio non-voting member of Board of Directors
• Ensuring that loan documentation, systems and procedures are consistent with international best practices and are appropriate for all regulatory requirements.
• Ensuring that all loan systems and tracking techniques provide the appropriate amounts of information to executive management and the Board of Directors, to allow for accurate assessment of loan quality and risk management.
• Manage the day-to-day credit operations of BDB
• Cultivate culture of cooperation and high performance
• Drive organizational performance, both quantitative and qualitative; achieve business plan targets
• Uphold standards of risk management at all levels and ensure effective supervisory control and management review
• Providing quantitative oversight of the Bank’s credit extension activities, to include conducting ongoing evaluation of existing systems and, when appropriate, evaluation,
75
selection and implementation of new systems to ensure that all policies and procedures are of the highest integrity and consistency.
• Sustain the institution’s social mission and its dedication to financial inclusion.
Human Resource and Talent Development
• Build a strong and effective team of credit officers and assistants.
• Establish an effective and competent participatory management style
• Implement performance management system for the credit department
• Oversee and support the development and implementation of the credit training plan
• Motivate all staff and ensure that staff is dedicated to BDB mission
• Mentor and coach credit personnel.
Qualifications:
• Master’s degree or greater in business or finance.
• At least fifteen years of direct experience in financial services, at least 10 of which should have been in senior credit management position in a retail bank, preferable a microfinance, SME or rural bank.
• At least five years of professional experience in Bhutan or other countries in South East Asia and/or South Asia
• Experience in financial institutions that went through a change management/operational restructuring process is preferable. Demonstrated track record of tangible operational initiatives that have served to enhance their institutions’ policies, procedures and risk disciplines.
• Knowledge of a wide range of micro banking products, particularly loans to the rural sector.
• Advanced knowledge of retail banking operations, products and services as well as knowledge of standard banking compliance regulations, internal operational policies and procedures
• Strengths include a thorough knowledge and proficiency in the use of advanced quantitative tools and techniques such as credit scoring, financial forecasting and modeling.
• Demonstrated experience leading and building cohesive, high performing teams.
• Strong analytical, interpersonal, communication and influencing skills
• Ability to delegate effectively amongst teams and show commitment to the long-term development of the management team through coaching and mentoring
• Commitment to the institution’s social mission and corporate values
• Fluency in English is required
• Willingness to be based in Thimphu, with frequent travel throughout Bhutan.
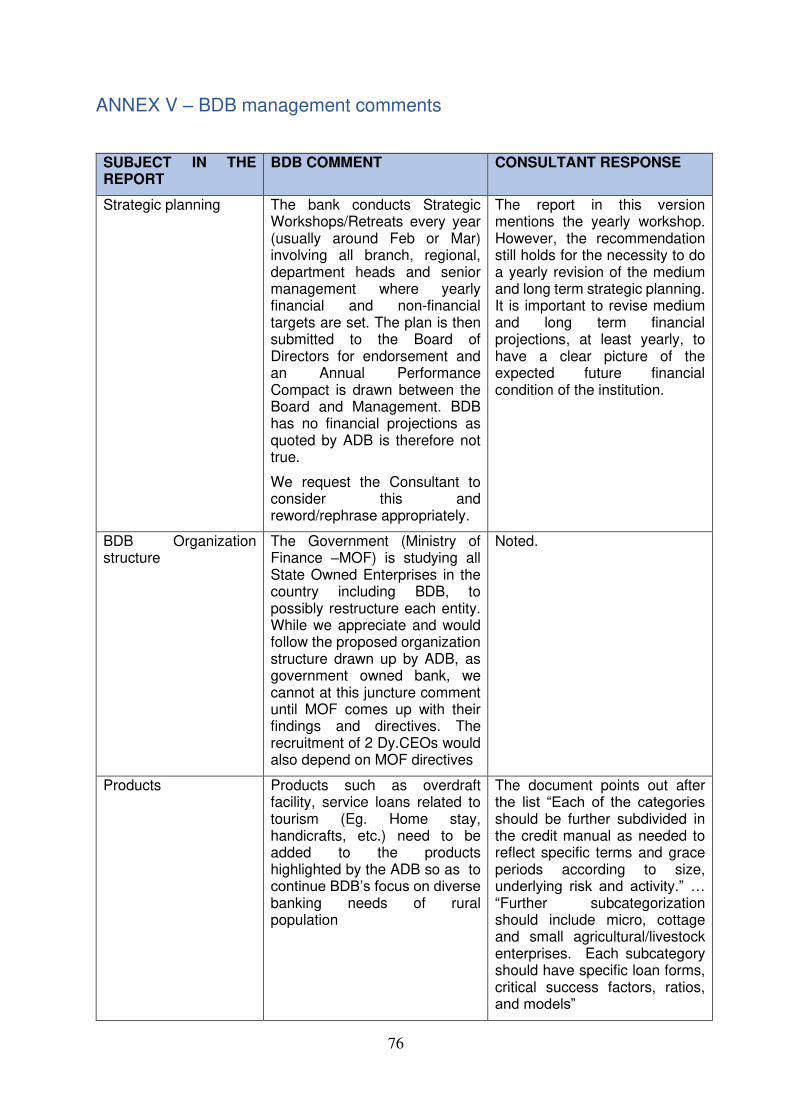
76
ANNEX V – BDB management comments
SUBJECT IN THE REPORT
BDB COMMENT CONSULTANT RESPONSE
Strategic planning The bank conducts Strategic Workshops/Retreats every year (usually around Feb or Mar) involving all branch, regional, department heads and senior management where yearly financial and non-financial targets are set. The plan is then submitted to the Board of Directors for endorsement and an Annual Performance Compact is drawn between the Board and Management. BDB has no financial projections as quoted by ADB is therefore not true.
We request the Consultant to consider this and reword/rephrase appropriately.
The report in this version mentions the yearly workshop. However, the recommendation still holds for the necessity to do a yearly revision of the medium and long term strategic planning. It is important to revise medium and long term financial projections, at least yearly, to have a clear picture of the expected future financial condition of the institution.
BDB Organization structure
The Government (Ministry of Finance –MOF) is studying all State Owned Enterprises in the country including BDB, to possibly restructure each entity. While we appreciate and would follow the proposed organization structure drawn up by ADB, as government owned bank, we cannot at this juncture comment until MOF comes up with their findings and directives. The recruitment of 2 Dy.CEOs would also depend on MOF directives
Noted.
Products Products such as overdraft facility, service loans related to tourism (Eg. Home stay, handicrafts, etc.) need to be added to the products highlighted by the ADB so as to continue BDB’s focus on diverse banking needs of rural population
The document points out after the list “Each of the categories should be further subdivided in the credit manual as needed to reflect specific terms and grace periods according to size, underlying risk and activity.” … “Further subcategorization should include micro, cottage and small agricultural/livestock enterprises. Each subcategory should have specific loan forms, critical success factors, ratios, and models”
77
SUBJECT IN THE REPORT
BDB COMMENT CONSULTANT RESPONSE
Service loans related to industry can be added in the categories 3) Other microfinance or 4) Other small enterprise.
BDB will work towards increasing manpower to achieve 200 active loan accounts per credit personnel. We would appreciate if the consultant could elaborate how could the ratio bring out desired improvement in the loan quality.
The document mentions that the field visits and interviews with loan officers show instances were loans are approved without a loan officer visiting the site or having a conversation with the client. This is not a good practice The document cites Micro-finance best practice literature. The 200 ratio seems reasonable considering international experience benchmarking and the particulars of Bhutan. At the end, the final number might be a matter of experimentation.
As said, the document presents the case of inadequate loan appraisal and poor client diligence. It also presents international best practices literature to back the case on the importance of client diligence and engagement.
Empowering loan officers
The key aspect of loan appraisal (5 Cs), documentation process, sanctioning authority, committee roles and recovery process are clearly outlined in the credit manual. The management is mindful of expediting delivery process by opening up branches in many remote locations, increasing sanctioning limit of branches and regions 2 times in last one and half years. For instance, the regional loan committee sanction limit has been increased to Nu. 2.5 million in July 2019 from Nu. 1.5 million.
Noted
78
SUBJECT IN THE REPORT
BDB COMMENT CONSULTANT RESPONSE
It has been revised yet again to Nu. 5 million recently.
Financial projections As mentioned under 3.3. Strategic planning, the Bank’s yearly business plan that outlines its annual credit growth, loan quality improvement ratio, deposit growth projection, non-financial activities, skill development of employees through trainings, etc. are drawn through series of discussions and meetings with key officials. The plan is then presented to the Board of Directors that endorses and approves the budget estimates. This is an annual feature. Our next 5 year business plan which starts from this financial year however is not ready yet though series of discussions and deliberations have been made to come up with one as required by ADB.
As mentioned by the consultant, it’s a serious flaw for an institution like BDB not to have financial projections, which of course is not the case, as our yearly projections and budget allocations are presented and endorsed by the Board. Annual Performance Agreement (Compact) drawn between Board and Bank provides a summary of both financial and non-financial project of the bank for a particular financial year. The document can be mailed to the consultant if required.
The consultant made several requests to BDB to obtain financial projections before the visit, during the visit and after the visit. As of this day no five year financial projections have been received.
The annual budget is not substitute for medium/long term financial projections.
Management comment “Our next 5 year business plan which starts from this financial year however is not ready yet though series of discussions and deliberations have been made to come up with one as required by ADB.” The point of the report is that a five-year strategic plan to put on a shelf and repeat every five years does not represent thinking strategically. The bank should revise the plan periodically and revised the planning and projections to incorporate changes in circumstances.
A yearly budget is not considered a financial projection in standard strategic planning literature.
Recommended