David C. Wyld et al. (Eds) : COSIT, DMIN, SIGL, CYBI, NMCT, AIAPP - 2014
pp. 121–130, 2014. © CS & IT-CSCP 2014 DOI : 10.5121/csit.2014.4911
COLOR IMAGE RETRIEVAL BASED ON
FULL RANGE AUTOREGRESSIVE MODEL
WITH LOW-LEVEL FEATURES
A. Annamalai Giri
1 and K. Seetharaman
2
1Department of Computer Science, Sri Kuvempu First Grade College , Kengal,
Channapatna, Ramanagara Dist, Bangalore, INDIA, [email protected]
2Department of Computer Science & Engineering,
Annamalai University, Annamalai Nagar, INDIA, [email protected]
ABSTRACT
This paper proposes a novel method, based on Full Range Autoregressive (FRAR) model with
Bayesian approach for color image retrieval. The color image is segmented into various regions
according to its structure and nature. The segmented image is modeled to RGB color space. On
each region, the model parameters are computed. The model parameters are formed as a
feature vector of the image. The Hotlling T2 Statistic distance is applied to measure the distance
between the query and target images. Moreover, the obtained results are compared to that of
the existing methods, which reveals that the proposed method outperforms the existing methods.
KEYWORDS
FRAR model, query image, target image, feature vector, spatial features.
1. INTRODUCTION
In computer vision, feature representation schemes are classified as low-level, intermediate, and
high-level. The low-level features are represented at pixel level while the high-level features are
represented with abstract concepts, and the intermediate-level features represent something in
between them. In this paper, it is believed that the low-level features make clear physical
meanings and also related to high-level perceptual concepts. Because, the low-level features such
as color, texture and spatial orientation of the pixels play vital role in color image formation. The
spatial orientation of the pixels forms a shape or structure in an image. Next, the color features
refine and enhance the shapes, and perceptually distinguish the regions from each other. Thus,
most of the works use low-level features such as color, shape, texture and spatial orientation, and
that are used for mine and retrieve the images. One of the most important issues in an image
retrieval system is the feature extraction process, where the visual content of the images is
mapped into a new space called as feature space. Mainly, the key issue to develop a successful
retrieval system relies on identifying and choosing the right features that represent the images as
strong as possible. Feature representation of the images may include color [1,2,3,4,5,6,9], texture
([3,7,10,11,13] and shape [1,6,7,8] information.
122 Computer Science & Information Technology (CS & IT)
It is observed from the literature that the low-level features such as texture attributes -- fine
texture, coarse texture, texture description, and spatial orientation of the texture play a significant
role in image processing, viz. image classification, segmentation, edge and boundary detection,
etc. Wu et al. [10] proposed a texture descriptor for browsing and similarity retrieval, and they
have reported that the descriptor yield good results. The spatial orientation of the textures is not
still used effectively in image retrieval domain. These texture features are more effective than
other low-level features. This motivated us to develop the proposed method.
In this paper, a novel technique based on Full Range Autoregressive (FRAR) model is proposed,
which characterizes the texture properties such as spatial orientation of the texture and untexture
or structure (edge, boundaries) properties. It also gives unique representation to the characterized
textures. The FRAR model coefficients K, α, θ and ϕ are considered as features, because α
represents the strength of the linear dependency of the pixels on its neighboring pixels; the other
parameters θ and φ are associated with the circular functions sine and cosine and their values
ranging from 0 to 1; K is a real valued function and it follows t-distribution. Since the parameter,
α, represents the strength of the dependency of the pixels, it extracts the textures attributes, i.e.
fine, coarse etc. The FVs are compared region wise to that of the feature vectors of the target
images in the image database. The distance measure Hotlling T2 Square [14] distance is employed
to measure the distance between the query and target images.
2. PROPOSED MODEL FOR IMAGE RETRIEVAL
Let X(k, l) be a two-dimentional random variable that represents the intensity value of a pixel at
location (k, l) in an image. It is assumed that the pixel, X, may include noise and is considered
independent and identical to a distributed Gaussian random variable with discrete time space and
continuous state space with mean zero and variance 2σ and is denoted as ε(k, l), i.e.
),0(N~)l,k( 2σε . Thus, the images are assumed to be affected by a Gaussian random process.
Thus, we propose an FRAR model as in equation (1),
0qp
M
Mqr
M
Mp
l)ε(k, q)l p,X(kl)X(k,
≠=
−=−=∑∑ +++Γ=
(1)
where, α
φθ=Γ
rr
)rcos()rsin(K (2)
and K, α, θ and φ are real parameters. The srΓ are the model coefficients, which are computed by
substituting the model parameters K, α, θ and φ in equation (2). The model parameters are
interrelated.
The initial assumptions on the parameters are K ∈ R, α > 1, and θ, φ ∈ [0, 2π]. Further restriction
on the range of the parameters is placed by examining the identifiability of the model. It is
interesting to note that some of the models used in the previous works such as white noise,
Markov random field models and autoregressive models with finite and infinite orders can be
regarded as a special case of the proposed FRAR model.
Thus,
i ) if we set θ = 0, then the FRAR model reduces to the white noise process.
Computer Science & Information Technology (CS & IT) 123
ii ) when α is large, the coefficients srΓ become negligible as r increases. Hence, the
FRAR model reduces to a AR(r) model approximately, for a suitable value of r, where r
is the order of the model.
iii ) when α is chosen to be less than one, the FRAR model becomes an explosive infinite
order model.
The fact that X(k, l) has regression on its neighborhood pixels gives rise to the terminology of
Markov process. However, in this case, the dependence of X(k, l) on neighborhood values may be
true to some extent. In fact, the process is Gaussian under the assumption that the ε(k, l)s are
Gaussian, and in this case, its probabilistic structure is completely determined by its second order
properties. Second order properties meant for the proposed FRAR model is asymptotically
stationary up to order two, provided 1– α < K < α – 1. Finally, the range of the parameters of the
model is set with the constraints K ∈ R, α > 1, 0 < θ < π, 0 < φ < π/2.
3. PARAMETER ESTIMATION
In order to implement the proposed FRAR model, we have to estimate the parameters. The
parameters, K, α, θ and φ are estimated by taking the suitable prior information for the hyper
parameters β, γ, and δ, based on Bayesian methodology. Only for the computational purpose, the
pixel values of each subimage are arranged as one-dimensional vectors X(t), t =1, 2, 3, . . ., N.
Since, the error term ε(k, l) in equation (1) is independent and identical to distributed Gaussian
random variable, the joint probability density function of the stochastic process {X(t)} is
( )
∑=
∞
=−−
σ−
σ∝
Θ ∑
2N
1t 1rrtXrSKtX
2
1
N/2- 2 XP
2exp (3)
where X = (X1, X2, …, XN) ; Θ = (K, α, θ, φ, σ2 ) and rr
)rcos()rsin(S
α
φθ= .
When we analyse the real data with finite number of N observations, the range of the index r, viz.
1 to ∞, reduces to 1 to N, and so the joint probability density function of the observations is given
in equation (3). The summation ∑∞
= 1r
can be replaced by ∑=
N
1r
which gives
( )
∑=
=−−
σ−
σ∝
Θ ∑
2N
1t
N
1rrtXrSKtX
2
1 exp
2N/-2
XP2
(4)
By expanding the square in the exponent, we get
( ) ( )
∑=
∑=
∑
<=
−++σ
−σ∝−
N
1r
N
1rr 0TrSK2
N
sr
1r,srsTsSrS2K2rrT2
rS2K00T 2
1 exp
ΘXP
2
2 N/2 (5)
124 Computer Science & Information Technology (CS & IT)
where N, . . . , 2 ,1 ,0 s r, , N
1 t st
Xrt
X rs
T == −−
= ∑
The above joint probability density function can be written as
( )
σ−
−
σ∝
Θ 22
Q exp
N/2 2 XP (6)
where ∑∑∑=
<=
−
=
++=N
1rr0
Tr
SK2N
sr
1r,srs
Ts
Sr
S2
K2N
1trr
T2r
S2
K00
TQ
(7)
K ∈ R, α > 1, 0 < θ < π, 0 < φ < π/2 and σ2 > 0.
So, the joint prior density function of Θ is given by
/2. 0 , 0 1, 0,
; )( )/ 1) ( exp( )P(
2
1) ( 22
π<φ<π<θ<>α>σ
σσν−−αβ−β∝Θ +δ−
(8)
where, P is a general notation for the probability density function of the random variables
given within the parentheses following P.
Using (6), (8) and Bayes theorem, the joint posterior density of K, α, θ, φ and σ2 is obtained as
( ) ( ) ; )2Q( )1/2exp( 1))( exp( X
P1
2
N
22
+δ+−
σν+σ−−αβ−∝Θ (9)
.02 and 2/0 ,0 ,1 R,K >σπ<φ<π<θ<>α∈
Integrating (9) with respect to σ2, the posterior density of K, α, θ and φ is obtained as
( ) ( )
δ+−ν+αβ∝φθα −− 2
N
2Q1))(exp( X,,,KP ; (10)
20 ,0 ,1 R,K π<φ<π<θ<>α∈
where,
[ ]
ν++
∑=
∑
<=
−∑=
+=ν+ 2TN
1rr0
Tr
SK2N
sr
1s,rrs
Ts
Sr
S2
K2N
1rrr
T2r
S2
K2Q 00 (11)
That is,
( )
( )
−+=
ν++−=ν+
2
11 1
,200222
bKaC
TKbaKQ
(12)
where,
Computer Science & Information Technology (CS & IT) 125
∑∑
<==
+=
ν+−=
N
sr
srrs
Ts
Sr
SN
rrr
Tr
Sa
a
bTC
1,
2
1
2
2 2
00
∑=
=N
1r
r0r TSb ; C
aa =1 ;
a
bb =1
Thus, the above joint posterior density function of K, α, θ and φ can be rewritten as
( ) { }d
2)1
b(K1
a1 C 1))β(α exp( X φ θ, α, K,P
−
−+−−∝ (13)
2/φ0 π,θ0 1,α R,K π<<<<>∈
where, δ+= 2
N d
This shows that given α, θ and φ the conditional distribution of K is ‘t’ distribution located at b1
with (2d–1) degrees of freedom.
The proper Bayesian inference on K, α, θ and φ can be obtained from their respective posterior
densities. The joint posterior density of α, θ and φ, namely, P(α, θ, φ / X), can be obtained by
integrating (13) with respect to K. Thus, the joint posterior density of α, θ and φ is obtained as
( ) ½1
ad1))C(exp( Xφ θ, α,P −−−αβ−∝ (14)
2/ 0 , 0 ,1 π<φ<π<θ<>α
The point estimates of the parameters α, θ and φ may be taken as the means of the respective
marginal posterior distribution i.e. posterior means. With a view to minimize the computations, we
first obtain the posterior mean of α numerically. Then fix α at its posterior mean and evaluate the
conditional means of θ and φ fixing α at its mean. We fix α, θ and φ at their posterior means
respectively and then evaluate the conditional mean of K.
Thus, the estimates are
).ˆ,ˆ,ˆK̂
)ˆ)ˆˆ(
ˆ
φ=φθ=θα=
α=αφθ=φθ
α=α
/ E(K
and / ,E( ,
)E(
(15)
The estimated parameters K, α, θ and φ are adopted to compute the coefficients srΓ of the model
in equation (1). The model parameters are utilised to compute the autocorrelation coefficient,
which is used to identify the texture primitives and micro textures present in the image.
The parameters of the model are combined together and formed as FVs. The same kind of
features are also extracted from the target image to be retrieved from the image database. These
features are treated as two different FVs xρ
and yρ
.
126 Computer Science & Information Technology (CS & IT)
4. SIMILARITY MEASURE In order find the similarity of the query and target images, the Hotlling T
2 statistic )T(2 [14]
expressed in equation (16) is applied on the feature vectors xρ
and yρ
of the query and target
images.
)YX(A)'YX(nn
nn)Y,X(T 1
yx
yx2d −−
+
⋅= −
(16)
Where,
∑=
=xn
1i
i
x
Xn
1X
,
∑=
=yn
1i
i
y
Yn
1Y
are the sample means, and
1n
)XX)(XX(
Ax
n
1i
Tii
x
x
−
−−
=∑
=
1n
)YY)(YY(
Ay
n
1i
Tii
y
y
−
−−
=∑
=
2nn
AAA
yx
yx
−+
+=
is the unbiased pooled covariance matrix of the query and target images.
If 1pNα;N
yx
yx2d yx
F1pNN
p)2NN(T −−+
−−+
−+≤ , then it is inferred that the query and target images are same or
similar (i.e., belongs to the same class); otherwise, the two images are different (i.e. belongs to
different classes). 1pNα;N yxF −−+ represents values in statistical F-table at the level of significance α
with degrees of freedom 1pNN yx −−+ ; p represents the size of the feature vectors. Based on the
distance values, the images are marked and indexed in ascending order, and the indexed images
are retrieved.
5. MEASURE OF PERFORMANCE In order to validate the performance of the proposed method, the precision and recall measures
[12] are used, which are given in equations (17) and (18).
{ } { }
images retrieved
images releventmagesi retrieved)P(ecisionPr
Ι= (17)
Computer Science & Information Technology (CS & IT) 127
{ } { }Images relevant
images relevantmagesi retrieved)R(callRe
Ι= (18)
Where ⋅ returns the size of the set. The precision (P) represents the ratio of the number of
images relevant to the query image among retrieved images to the number of retrieved images.
The recall (R) represents the ratio of the number of images relevant to the query image among
retrieved images to the number of images relevant to the query image.
6. EXPERIMENTS AND RESULTS
In order to implement the proposed method, 1277 color images of size 512×512 pixels have been
collected from various sources such as 293 texture images from Brodatz Album; 488 images from
Corel image database; 496 images from VisTex image database; and 268 images with size
128×128 are photographed by a digital camera; 257 images with size 128×128 have been
downloaded from various websites. To examine the proposed system is invariant for rotation and
scaling; the images are rotated through 90o, 180
o and 270
o degrees, and scaled. Based on this
image collection, an image database and their FV database are constructed.
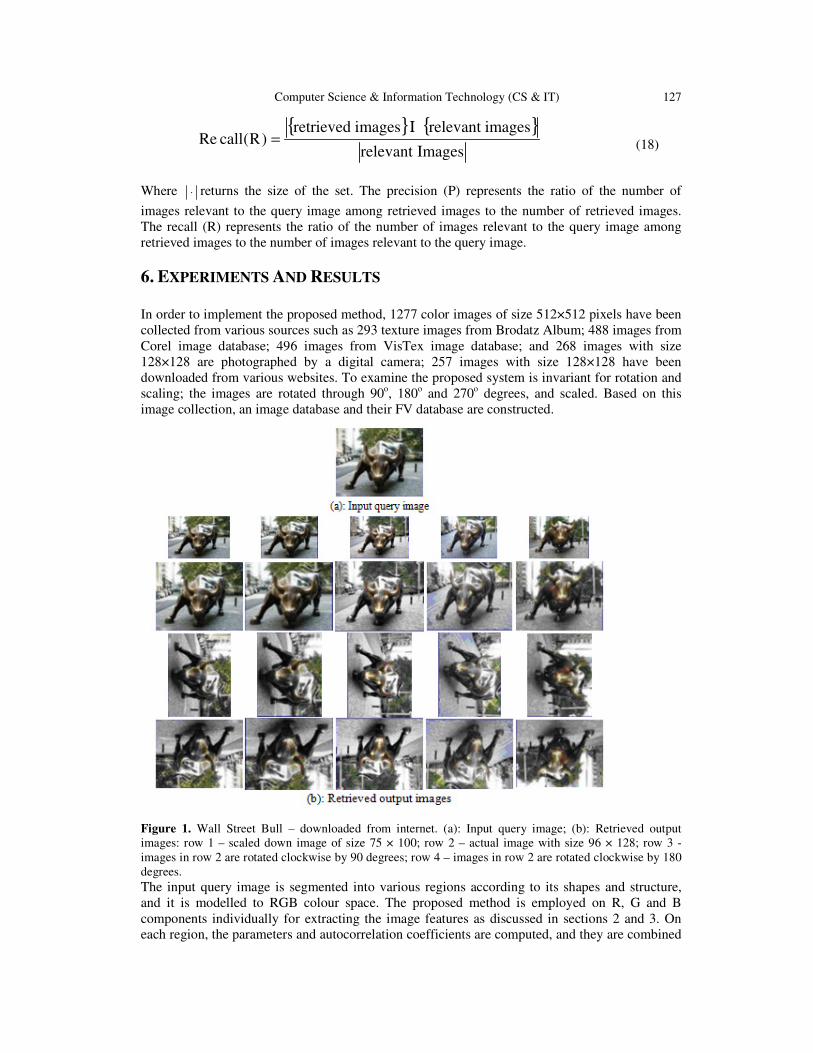
Figure 1. Wall Street Bull – downloaded from internet. (a): Input query image; (b): Retrieved output
images: row 1 – scaled down image of size 75 × 100; row 2 – actual image with size 96 × 128; row 3 -
images in row 2 are rotated clockwise by 90 degrees; row 4 – images in row 2 are rotated clockwise by 180
degrees.
The input query image is segmented into various regions according to its shapes and structure,
and it is modelled to RGB colour space. The proposed method is employed on R, G and B
components individually for extracting the image features as discussed in sections 2 and 3. On
each region, the parameters and autocorrelation coefficients are computed, and they are combined
128 Computer Science & Information Technology (CS & IT)
together and formed as FVs database. The extracted features are classified into various groups
according to their nature using fuzzy c-means algorithm [13]. For each group, median value is
calculated, and based on it the FVs are indexed. Based on the classes of the FVs, images in the
database are classified into different groups, and it establishes a link between the images and the
corresponding FVs of each class. Now, the extracted FVs of the query image are compared to that
of the index of the FVs in the image feature database and is identified using the expression given
in equation (15). Then the FVs of the query image are matched with the FV database, and retrieve
the same or similar images from that class. If the FVs of the query image do not match with any
classes of the FV database, then it is formed as a new FV class.
If the given input image is structured, it is segregated into various regions according to its shapes
and structure; if it is texture image, then it considered as it is for retrieving the same or similar
images from the image database. The input query image is identified whether it is texture or
structure by computing the coefficient of variation (CV), and the CV value is compared to a
threshold value t. If CV > t then it is assumed that the input image is structured image, and if CV
< t then the input image is assumed to be texture image. The threshold t is fixed as 25%.
(a): Input query image
(b): Retrieved output images
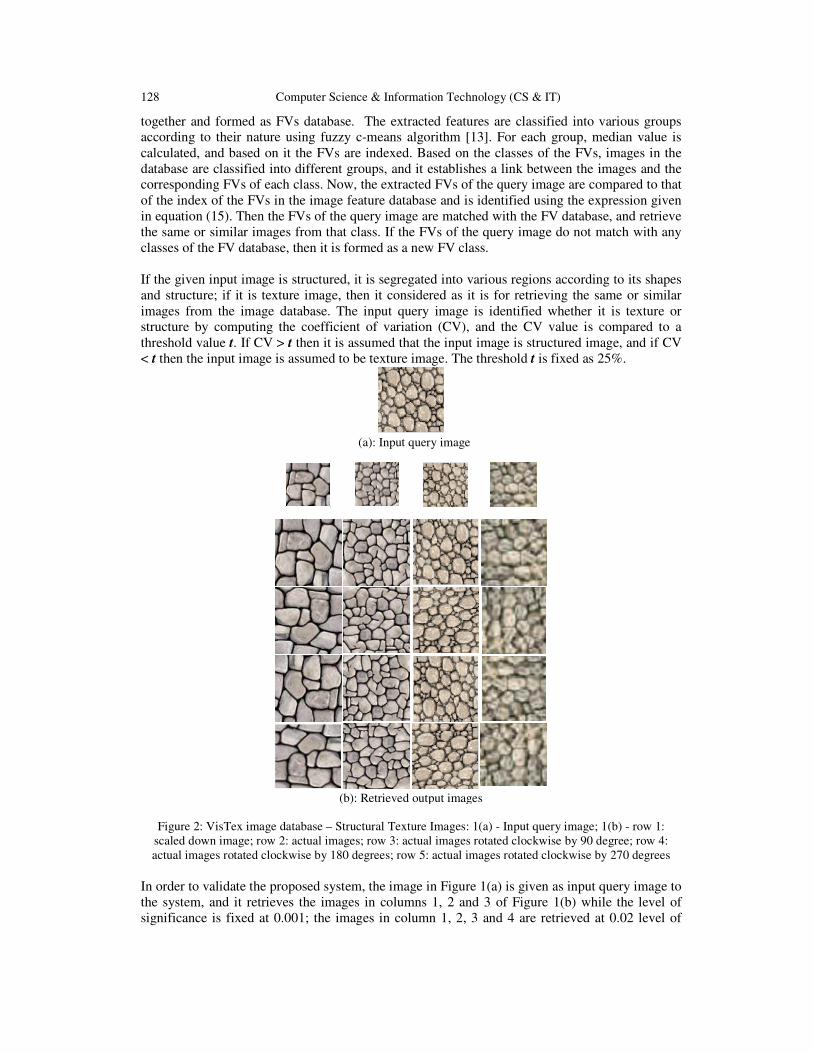
Figure 2: VisTex image database – Structural Texture Images: 1(a) - Input query image; 1(b) - row 1:
scaled down image; row 2: actual images; row 3: actual images rotated clockwise by 90 degree; row 4:
actual images rotated clockwise by 180 degrees; row 5: actual images rotated clockwise by 270 degrees
In order to validate the proposed system, the image in Figure 1(a) is given as input query image to
the system, and it retrieves the images in columns 1, 2 and 3 of Figure 1(b) while the level of
significance is fixed at 0.001; the images in column 1, 2, 3 and 4 are retrieved at 0.02 level of
Computer Science & Information Technology (CS & IT) 129
significance; at 0.01significance level, the system retrieves the images in column 1, 2, 3, 4 and 7;
at the level of significance 0.1, the system retrieves all the images presented in Figure 1(b).
To emphasis the effectiveness and efficiency of the proposed system, another type of structural
texture image with stochastic pattern is given as input, which is presented in Figure 2(a). The
proposed system retrieves the images in columns 3 of the Figure 2(b) when the level of
significance is fixed at 0.001; the images in column 2, 3 and 4 are retrieved at 0.04 level of
significance; at 0.08 level of significance, the system retrieves all the images in Figure 2(b).
7. DISCUSSION AND CONCLUSION
In this paper, a novel scheme is proposed for both structure and texture color image retrieval
based on FRAR model with Bayesian approach. The model coefficients are computed using the
circular functions sine and cosine as discussed in section 2, the proposed scheme characterizes the
structure and texture primitives in the periodic texture patterns also. Since the FRAR model
characterizes the texture primitives and provides unique decimal number, it matches exact images
in the image database and retrieves. Because, the proposed system facilitates the user to fix the
level of significance for the test statistic 2dT , the user can fix the significance level α at a desired
level by which the user can retrieves only the required same or similar images, and not all the
relevant images in the database as in the other existing systems. For example, at or below the
significance level 0.001 (1%), the system retrieves only the same image, and the rotated and
scaled images of the same query image. But there is one disadvantage that if the same image is in
the database, it retrieves the image; otherwise, it results that no image is matching with the query
image. This problem can be overcome by fixing the significance level α at more than 0.001, by
which the system retrieves the similar images. The user can fix the significance level himself at
his convenient. Because the proposed system is a distributional approach, it is also invariant for
rotation and scaling.
REFERENCES
[1] Qiu, G and Lam, K-M, (2003). “Frequency Layered Color Indexing for Content-Based Image
Retrieval”, IEEE Transactions on Image Processing, Vol. 12, No. 1, pp. 102- 113.
[2] Xie, Y., Lu, H. and Yang, M-H., (2013) “Bayesian Saliency via Low and Mid-Level Cues”, IEEE
Transactions on Image Processing, Vol. 22, No 5, pp. 1689-1698.
[3] Zujovic, J., Pappas, T. N. and Neuhoff, D. L., (2013) “Structural Texture Similarity Metrics for Image
Analysis and Retrieval”, IEEE Transactions on Image Processing, Vol. 22, No. 7, pp. 2545-2558.
[4] Y. D. Chun, N. C. Kim, I. H. Jang, (2008), “Content-based image retrieval using multi-resolution
color and texture features”, IEEE Trabsaction on Image Processing, Vol. 10, No.6, pp. 1073-1084.
[5] Mustafa Ozden and Ediz Polat, (2007) “A color image segmentation approach for content-based
image retrieval, ”Pattern Recognition, Vol. 40, pp. 1318-1325.
[6] Yung-Kuan Chan, Yu-An Ho, Yi-Tung Liu and Rung-Ching Chen, (2008) “A ROI image retrieval
method based on CVAAO,” Image and Vision Computing. Vol. 26, pp. 1540-1549.
[7] B. M. Mehtre, M. S. Kankanhalli, W. F. Lee, (1997a), “Shape measures for content based image
retrieval: A comparison,” Information processing and Management, Vol. 33, pp. 319-337.
[8] B. M. Mehtre, M. S. Kankanhalli, W. F. Lee, (1997b) “Content-based image retrieval using a
composite color-shape approach, ”Information processing and Management, Vol. 34, pp. 109-120.
[9] X. Wan, C. C. J. Kuo, (1998), “New approach to image retrieval with hierarchial color clustering,
”IEEE Transactions on Circuits and Systems for Video Technology, Vol. 8, pp. 628-643.
[10] P. Wu, B. S. Manjunath, S. Newsam, H. D. Shin, (2000) “A texture descriptor for browsing and
similarity retrieval, ”Signal Processing.,Vol. 16, pp. 33-43.
[11] N. Nikolaou, N. Papamarkos, (2002) “Color image retrieval using a fractal signature extraction
technique, ”Engineering Applications of Artificial Intelligence, Vol. 15, pp. 81-96.
130 Computer Science & Information Technology (CS & IT)
[12] M. Kokare, B.N. Chatterji, P.K. Biswas, (2003) “Comparison of similarity metrics for texture image
retrieval, ” Proc. IEEE Transactions on TENCON 2003, Conference on Convergent Technologies for
Asia-Pacific Region, Vol. 2, pp. 571-575.
[13] K. Seetharaman and N. Palanivel, (2013) “Texture characterization, representation, description and
classification based on a family of full range gaussian markov random field model, ”International
Journal of Image and Data Fusion, Vol. 4, No. 4, pp. 1-24.
[14] T.W. Anderson, An Introduction to Multivariate Statistical Analysis, third ed., John Wiley & Sons,
Inc., 2003.
AUTHORS
A.Annamalai Giri pursued his MCA from University of Madras, Chennai, India in 2000
and M.Tech.(Information Technology) from Sathyabama University, Chennai India in 2007.
Currently, am pursuing my Ph.D. research degree in M.S. Uuniversity, India, and working
as Associate Professor of Computer Science at Sri Kuvempu First Grade College,
Bangalore,India. His research interests include Statistical Model based Image Mining.
Pattern Recognition, Digital Image Analysis, and Data Mining.
Dr.K.Seetharaman received his M.Sc. degree in Statistics from Annamalai University,
hidambaram, India in 1990 and the M.S. degree in Software Systems from Birla Institute of
Technology and Science, Pilani, India in 1995. He received his Ph.D. degree in Computer
Science & Engg. from Annamalai University in 2006.He is currently working as Associate
Professor in the Department of Computer Science & Engg., Annamalai University. His
research interests include Statistical Pattern Recognition, Scene Analysis, Digital Image
Analysis, and Data Mining and Knowledge Discovery. He is also actively involved in professional
activities, viz. reviewer in journals: Pattern Recognition, Knowledge-based Systems, IEEE Transactions
on Pattern Analysis and Machine Intelligence, He is currently serving as Associate Editor of the
International Journal – Aloy Journal of Soft Computing and Applications, and the Editorial Board Member
of the International Journal of Information Technology and Management Sciences. He is also the member
of the professional societies – IEEE, ACM, IAENG, and Indian Science Congress Association.
Recommended


