Competitive PressureSystems Mapping andManaging MultimarketContact
FALL 2002 VOL.44 NO.1
REPRINT NUMBER 4414
By Richard A. D’Aveni
MITSloanManagement Review
Please note that gray areas reflect artwork that hasbeen intentionally removed. The substantive contentof the article appears as originally published.
FALL 2002 MIT SLOAN MANAGEMENT REVIEW 39
ecent research on multimarket contact — the partial overlap
of two firms’ geographic or product markets — has stimulated
new thinking about how and why firms put pressure on each
other.1 Not surprisingly, overlaps put pressure on competitors
and escalate the rivalry between firms in chess-like matches for
control.2 But under certain conditions, overlapping markets can
also create reciprocal threats that cause firms to reduce their rival-
rous behavior.3 By exchanging footholds (moderate market share
positions) in one another’s important markets, two firms can cre-
ate “mutual forbearance” — a lesser propensity to attack each
other with aggressive price, advertising or innovation wars for fear
of damaging counterattacks in other important markets — and a
greater inclination to seek growth in nonoverlapping markets.4
Most firms don’t do a good job of managing, through com-
petitor and market selection, the pressure they experience. All
organizations sense pressure intuitively, but it is often difficult to
see the overall pressure system — a complex, shifting pattern of
overlapping contacts among rivals that continually alters the cli-
mate of an industry by changing the incentives for players to
compete, mutually forbear or even formally cooperate.
Fortunately, these systems can be mapped and, unlike weather
pressure systems, controlled to a significant extent if they are
understood well enough.
Typically, the competitive pressure within an industry is
thought of as a continuum, running from hypercompetition to col-
lusion. An industry’s competitiveness is traditionally measured by
Richard A. D’Aveni is professor of strategic management at Dartmouth’s Tuck School of Business. Contact him at [email protected].
R
Competitive Pressure SystemsMapping and Managing Multimarket Contact
Managers typically think
that the competitive pressure
their companies experience
is solely the result of the
behavior of their rivals. But,
by mapping the system of
pressures in which they
operate, they can make
the optimal choice of
competitors, allies and
markets to gain superior
strategic influence over the
evolution of their industry
and their organization’s
role in it.
By Richard A. D’Aveni
antitrust experts using an industry’s concentration ratio or
Herfindahl index, both based on the distribution of the market
shares of firms within the industry. But recent multimarket
research indicates that competitive pressure is more complicated
than that. Overlaps between different pairs of competitors vary
widely, reducing or escalating rivalry differently. And pressure is
“asymmetrical”— that is, the pressure firm A places on firm B does
not necessarily equal the pressure that firm B puts on firm A,
because their overlapping markets may differ in importance to
each one’s portfolio.5 Each firm in a system is uniquely affected.
Some are targets, whereas others are aggressors or orchestrators of
the overall pattern of pressure. Still others are isolated from the
brunt of pressure. With all the possible combinations of overlaps
that can exist between numerous rivals, no two pressure systems
are exactly alike, even if the traditional measures of industry com-
petitiveness are identical. (See “About the Research.”)
As difficult as it is, it is vitally important for an organization
to understand its industry’s pressure system. Otherwise it can
find itself the industry’s lightning rod, attracting attacks from
all quarters. It obviously can’t avoid competitive pressure by
cooperating with every competitor in all markets: That’s illegal.
Nor can it put pressure on every competitor everywhere: That’s
suicide. Managers must understand how to use competitive
pressure to create an optimum combination of competition and
cooperation among selected rivals.
Unfortunately, managers almost always lack objective mea-
surements and useful pictures of the pressure patterns they face.
Typically, strategists see competitive pressure as being based on
five forces: buyer power, supplier power, barriers to entry,
threats posed by substitute products and intraindustry rivalry.6
Measurement of intraindustry rivalry has been proxied by fac-
tors affecting the degree of price competition in a market, such
as the number and concentration of competitors, the rate of
growth in demand, the industry’s capital intensity and fixed
costs, the lack of differentiation, switching costs, the diversity of
strategic groups within the industry and the magnitude of exit
barriers.7 However, none of these factors explicitly accounts for
the complexities presented by recent multimarket contact
research nor for the variety of pressure patterns that comprise
and influence intraindustry rivalry.
A map based on measured pressures is essential to answering
questions vital to the dynamic stability of an industry and the
profitability of firms in it. It has important implications for an
organization’s market and competitor selection, growth plans,
product portfolio and diversification strategy, resource alloca-
tion priorities, competitive intelligence system, merger and
acquisition strategy, and scenario planning process.
An overall picture of an industry’s pressure system can allow
managers to proactively and intelligently decide whether to
counter the pressure of a rival or let another competitor do it.
Organizations can apply pressure to mold the strategies of others
and even to create “win-win” situations in which both rivals
advance or protect their positions. They can tailor their selection
of markets or competitors in ways that legally redirect pressure,
create mutual forbearance or encourage indirect competition.
They can avoid entering “attractive” growth markets that will
bring on intense retaliatory pressure from unexpected quarters.
When used moderately, these tactics can prevent an industry from
becoming a pressure cooker. Or they can heat things up when
opportunities for capturing or holding industry leadership arise.
For any organization, measuring and mapping the invisible
pattern of competitive pressure among its rivals is the first step
in creating order out of the confusion that is destroying the
profitability of many highly competitive industries.8 Because of
frequent internal destabilizing actions and occasional external
shocks, pressure systems can never be frozen. The best that can
be achieved is a kind of dynamic stability. Companies must seek
superior position when possible and avoid intolerable pressure
when necessary — but it is most valuable to gain superior strate-
gic influence over the evolution of the system. This results from
superior knowledge plus the resources and intent to carry out a
coherent competitive pressure strategy.
Pressure System MappingThe more two firms’ product or geographic markets overlap,
the more pressure they exert on each other. The pressure is pro-
portional to the importance of markets to each firm and the
degree of penetration by each firm.9 This simple concept
enables organizations to quantify the degree of pressure that
one rival puts on another. (See “Pressure Measurement.”)
When measuring and mapping competitive pressure, it is
not easy to define, on an a priori basis, the boundaries of or key
players in an industry. It is best to do this empirically by begin-
ning with all competitors whose markets overlap significantly
with the focal firm (the one creating the map) and then includ-
ing firms that pressure those competitors. The primary purpose
of pressure mapping is not to illustrate the current use of com-
petitive tactics (i.e., price, advertising or innovation wars) but to
provide insight about who has the potential and the incentive to
make or avoid future use of pressure. By casting the net wide, it
is possible to find tacit allies and to identify potential acquisi-
tions or opportunities to enter new markets that could shift the
balance and direction of pressure applied to selected rivals.
Once relevant rivals are identified and competitive pressures
are quantified, they are mapped with symbols. Companies are
represented by circles, tacit or formal alliances by lines connecting
40 MIT SLOAN MANAGEMENT REVIEW FALL 2002
them, and pressure by arrows
showing its direction. Thick,
solid arrows indicate strong pres-
sure, and thin or dotted arrows
indicate milder pressure. Relative
circle size represents the relative
size of firms. The mapping is
based on hard market share and
revenue data that are often read-
ily available in marketing, com-
petitive intelligence or strategic
planning groups.
An initial pressure map is apt
to be dauntingly complex, a
formless array of sources and
targets of pressure with a
spaghetti-like tangle of lines and
arrows connecting them. It is
often useful to locate the most
focal firm or the most aggressive
or targeted rival at the center of
the map, or to place the industry
leaders at the top of the map to
minimize the number of inter-
secting arrows. Omission of low-pressure relationships and
inconsequential rivals can simplify the map to show only key
relationships that yield clear insights.
Analyzing Pressure Systems:A Look at the Early 1990s Airline IndustryConsider the airline industry as it existed in the early 1990s.
While the industry at that time appeared highly competitive to
most observers, closer investigation reveals embedded patterns
of pressure that mixed incentives to compete and cooperate.
(See “Pressure Map of U.S. Air Carriers in the Early 1990s.”)
The map reflects that the industry leaders in the early 1990s
were American, United and Delta — collectively known as the
“Big Three Supercarriers.” These three had deep pockets and
large hub-and-spoke systems with economies of scale and wider
connectivity than the other carriers. Second-tier players were
large national carriers that were not leaders for a variety of rea-
sons. Some were financially weakened by a combination of hos-
tile unions and excessive post-deregulation growth or
competition (Continental and Eastern). Others were more con-
centrated regionally despite their national reach (Northwest and
US Airways). Two low-cost niche players had arisen after dereg-
ulation: America West and Southwest. America West was built
on a hub-and-spoke system, whereas Southwest focused on
direct flights to secondary airports. Local and regional players,
like Aloha and Alaska Airlines, were engaged in a struggle for the
same geographic markets. And parts of the industry were suffer-
ing from aggressive, sporadic (some might even say almost con-
tinuous) price wars in the late 1980s and early 1990s. Fierce turf
battles were being played out as competitors entered each other’s
markets, resulting in numerous overlapping geographic markets
that had not existed at the time of deregulation in the early ’80s.
When interpreting any pressure map, it is often helpful to
start by looking at the current position and behavior of the
industry leaders. Is there one firm (or a dominant coalition of
firms) that seems to be applying a lot of pressure? Are the lead-
ers aggressively applying pressure among themselves or just
against lesser firms? Has a leader applied pressure that is so great
it constitutes a major invasion or are the leaders avoiding contact
by taking only minor positions in each other’s markets? Is the
pressure exchanged between the leaders asymmetrical or bal-
anced in intensity? Such questions naturally lead to others: Why
are they acting as they do? Are there any explicit, implicit or even
unconscious strategies unfolding? Who is central to the evolu-
tion of the system, driving the actions and position of others?
It is also useful to look for subsystems composed of smaller
numbers of firms tightly organized in pairs or triangular rela-
tionships to see how their interdependence influences their
FALL 2002 MIT SLOAN MANAGEMENT REVIEW 41
Two factors affect the strength of competitive pressure from a given incursion into a rival’sgeographical or product market: the of the market (as measured by the per-centage of the targeted firm’s total revenue represented by the market) and of theincursion (as measured by the market share achieved by the invading firm).
Pressure = (Importance of Market) X (Size of Incursion).
The total pressure on a firm is the sum of the pressures on all of its individual markets.
If the number of overlapping markets is impractically large, it is often useful to eliminatetrivial market overlaps using a decision rule, such as including only overlaps in markets thatare at least 1% of the focal firm’s total sales. The markets can be defined broadly, such aspersonal care products in Europe, or narrowly, such as soap in the south of France. Fine-grained data is better, but more expensive. Some precision may have to be sacrificedbecause of the cost or availability of data.
After computing the magnitude of pressure from each competitor using this formula,the magnitudes should be scaled such that the sum of the pressures from all of a givenfocal firm’s competitors will equal 1. Doing this provides a better predictor of each player’sbehavior, because it depicts pressures relative to each other as they appear to each focalfirm. The heaviest pressure ordinarily gets the quickest or the strongest response. Of course,it is sometimes useful to use unscaled pressure measures to determine which company inan industry is subject to the most absolute pressure and which is causing the most. Thistells you which company may be eliminated as a trivial player and which is taking thestrongest offensive posture.
Pressure Measurement
behavior. Triangles may involve formal alliances or multimarket
contacts that create mutual forbearance between all or just two
of the members. The subset of firms may act as a united bloc,
have a central player that influences the other two, or two mem-
bers that share the third as a common rival.
Consider the incomplete triangle of Delta, Eastern and
American. Although they are fighting over some of the same turf,
Delta is pressuring Eastern, but not vice versa. Delta has taken large
market share in markets important to Eastern, but Eastern has
taken only minor positions in Delta’s important markets, giving
Delta the advantage. This is a clear case of asymmetrical pressure.
Delta lacks incentive to forbear with respect to Eastern’s markets
unless Eastern were to take some moderate footholds in Delta’s
most important markets (an opportunity that Eastern missed). In
contrast, Delta and American each have moderate positions of
about equal strength in the other’s markets. These “hostage mar-
kets” are not big enough to create a struggle over identical turf, as
between Southwest and America West, but just enough to restrain
Delta and American from attacking each other aggressively.
This type of mutual opposing and equally balanced pressure
does not completely eliminate competition between two rivals,
but has the potential to redirect it in two important ways. First,
Delta is free to take on Eastern even more aggressively, without
fear of a two-fronted battle against Eastern and American in
different regions. Second, rigorous research in numerous highly
competitive industries has shown that firms pressuring each
other in this way often improve their profitability, avoid further
expansion in the overlapping rival’s markets, limit aggressive
actions to the rival’s least important markets, and focus on
growth elsewhere. Rivals may even give up share in their weak
markets in exchange for greater share in their strong markets so
they both gain economies of scale.10
Looking at the third leg of the triangle, the mutual forbear-
ance between American and Delta also influences the American-
Eastern relationship. American is deterred from forging a merger
or formal alliance with Eastern that would resuscitate Eastern
with a cash infusion. In fact, after Eastern ceased operations in
1991, Delta benefited by picking up many of Eastern’s markets,
giving it control of some “safe haven” airports. These included
hubs and mini-hubs that were largely untouched by American,
which could have invaded them were it not for the pressure-based
incentives to avoid conflict with Delta.
Examining the pressure map of the early ’90s airline industry,
one can see that several subsystems shaped how the industry
consolidated and which carriers survived. There were four prin-
cipal dynamic forces at work: Two-directional pressure between
American and Delta and between American and United created
a triumvirate of mutual forbearance that freed each company to
put pressure on the second-tier players without the threat of
intervention by another supercarrier. This allowed a division of
labor among the Big Three, with American, Delta and United
each targeting and weakening a different second-tier player. This
further allowed each to focus its resources on one or two tar-
geted carriers at most and enabled a downward pressure cascade,
which tends to cause market consolidation. American was in a
central position in the pressure system and played the role of
enforcer. Whenever Delta and United acted against each other
(because they lacked incentives for mutual forbearance),
American was caught in the crossfire, forced to defend its inter-
ests and perhaps even to use disciplinary actions. These included
the use or the threat of temporary but punishing market entries
and price-based retaliation to keep the rest of the Big Three
focused on the second tier rather than on one another.
Between 1990 and 1995, as a result of these dynamic forces,
Eastern, Pan Am and Braniff all but disappeared. TWA,
Continental and Northwest were financially weakened to the
point that they could never make a play to join the Big Three, even
if they had merged. US Airways acquired its main competitor,
About the Research
42 MIT SLOAN MANAGEMENT REVIEW FALL 2002
The conclusions of this study are derived from an ongoing,multiyear project to map competitive pressure systems inseveral industries, including U.S. airlines, European Internetservice providers (ISPs), European mobile telephony, U.S.automakers, the mutual fund industry, and the globalentertainment and media industries. Earlier data on U.S.airlines were from a published study by Ming-Jer Chen, the E. Thayer Bigelow Research Professor of BusinessAdministration at the Darden School of the University ofVirginia.* The 1995 airline data were collected from thesame public data sources used by Chen as well as marketshare data by airport from securities analyst reports.European mobile telephony and ISP data were collected,analyzed and published with the assistance and permissionof the Nolan Norton Institute of KPMG ManagementConsulting-Netherlands and Prof. Hans Strikwerda of theUniversity of Amsterdam. Research on other industries continues at Dartmouth College’s Tuck School of Businessunder the direction of the author, with the goal of gainingfurther understanding about how pressure systems differfrom industry to industry, how they evolve over time, andhow they influence and incorporate mixtures of competi-tive and cooperative behaviors among rivals.
* M. Chen, “Competitor Analysis and Interfirm Rivalry: Toward a Theoretical Integration,” Academy of Management Review 21, no. 10(1996): 100-134.

Piedmont, but was never
financially strong enough to
make a play for a leadership
position in the industry. And
Southwest won the low-cost
niche, defeating America
West and Midway.
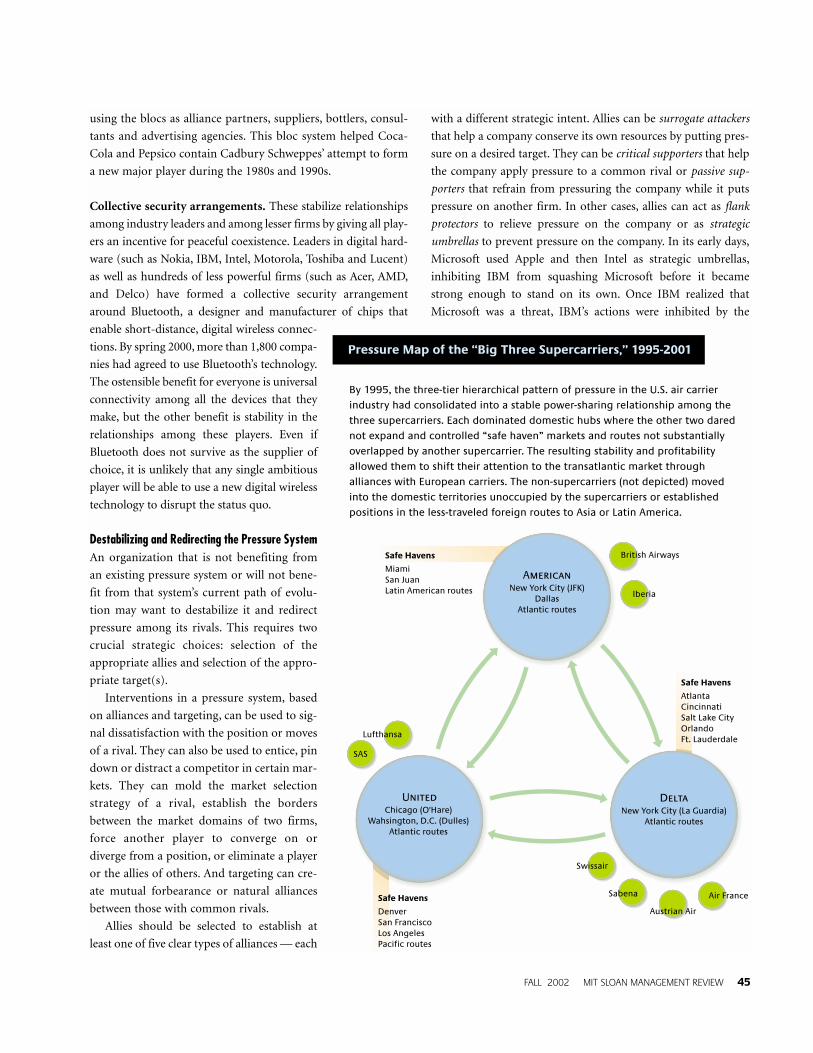
By 1995, the original
three-tier hierarchical pattern
of pressure had consolidated
into a stable power-sharing
among the three supercarri-
ers in which each dominated
domestic hubs where the
other two dared not expand,
thereby improving profitabil-
ity for each. (See “Pressure
Map of the Big Three Super-
carriers, 1995-2001.”) To per-
petuate this favorable pressure
system, they needed to stay
out of each other’s most prof-
itable turf and to refrain from
placing further pressure on
the remaining non-supercar-
riers to avoid antitrust issues.
The non-supercarriers moved
into the domestic territories
not occupied by the Big Three, avoided aggressive competition
in the supercarriers’ hub cities, or established positions in the
less-traveled foreign routes to Asia or Latin America. The price
wars of the early ’90s disappeared, and industry profits shifted
from a $13.1 billion loss in the first five years of the ’90s to a
profit of $23.2 billion from 1995 to 2000, according to the Air
Transport Association’s 2001 annual report.
Funded by a stable home front, the supercarriers shifted
their attention to the transatlantic market through alliances
with European carriers, eventually dividing the market about
equally. They launched their own Web sites and cooperated to
create a joint Web site (Orbitz.com), selling airline tickets at a
discount to put pressure on potential disrupters of the current
pressure system, such as Priceline.com and Travelocity. With
roughly equal market share and deep pockets, the Big Three
competed only indirectly through international growth and
improved operational efficiency from greater volume funneled
from overseas. The pressure system remained more or less in
equilibrium until the external shock caused by the events of
September 11 destabilized it.
Proactive Intervention: Setting a Strategy for Competitive PressureIn any industry, companies can develop competitive strategy by
using a pressure map to answer two critical questions: If the
current pressure pattern continues, what position will my firm
ultimately hold? How can my firm stabilize or shift the direction
of pressure to reduce (or enhance) the predicted impact of the
current pressure system?
Had the airline industry’s second-tier carriers asked these
questions, for instance, they could have countered the four
principal dynamics that enabled the Big Three to control the
downward flow of pressure. For example, the second-tier play-
ers could have weakened American’s enforcer role by attacking it
from all directions. If American were besieged, the other super-
carriers may have joined in the attack because an overwhelmed
American could no longer enforce its threatened use of hostage
markets. While it may seem implausible that simultaneous
attacks by small players could vanquish an industry leader, it
happens frequently. Sears, for instance, fell victim to upstart
discounters, newly consolidated department store chains, new
FALL 2002 MIT SLOAN MANAGEMENT REVIEW 43
Big ThreeSupercarriers
United American Delta
SecondTier Continental Northwest TWA Eastern
Pan Am
USAirways
ThirdTier
AmericaWest
Southwest
Midway
BraniffHawaii Aloha
Piedmont
Key: Pressure
Majorinvasion
AggressivefootholdSolidfootholdToehold
Pressure Map of U.S. Air Carriers in the Early 1990s
This competitive pressure map of the U.S. air carrier industry shows a three-tier alignment. A stablesituation of mutual forbearance existed in the early 1990s among the three dominant airlines —United, American and Delta — with competitive pressure cascading downward to the second tierof large, but not dominant, players and to a third tier of smaller regional and niche players.
specialty catalogues, growing hardware franchisers, new cate-
gory killers in consumer electronics and home appliances, and
Home Depot.
Alternatively, some of the second-tier carriers could have
consolidated and attacked the markets exchanged as hostages
among two of the Big Three. By combining as one major player,
they could also have worked to establish their own mutual for-
bearance with some of the supercarriers. While there would
have been many obstacles to such a merger, it would have
unraveled the triumvirate by forcing some of them to fight with
each other and that would have alleviated the downward cas-
cade of pressure. As a third possibility, Eastern, which was once
one of the largest airlines in the world, might have moved to
undermine the triangle formed by American and Delta by real-
locating its routes to create mutual forbearance with at least one
of those players.
Whether a company is the beneficiary or the victim of the
pressure system in its industry, it can intervene to alter that sys-
tem and gain strategic advantage through competitor and market
selection, mergers and acquisitions or formal alliances, and other
powerful strategic tools described below. Depending on the situ-
ation, the goal may be either to stabilize the current system or to
destabilize it and redirect the existing pressure patterns.
Stabilizing the Pressure System In 19th-century Europe, royal fam-
ilies cooperated in what was known as a “concert of powers” to
control disruptive nations while continuing to compete among
themselves for colonies, economic power and influence. In busi-
ness, most industries have only a few leaders and they frequently
exhibit a similar dynamic, as evidenced by the preceding airline
industry example.
Similar to the “great power nations” of world history, indus-
try leaders generally prefer stable systems and employ five time-
tested mechanisms to achieve that stability: checks and balances;
tit for tat; shared power systems; polarized blocs; and collective secu-
rity arrangements.11 Over time, the use of these mechanisms sig-
nals each leader’s tolerances and limitations to the others. These
mechanisms are used in sequence or in combination, depend-
ing upon the financial and strategic capability and will of an
industry’s leaders to carry them out.
Checks and balances. Industry leaders simultaneously use
competitive pressure to hold ambitious competitors in check
either by containing, constricting or undermining their growth
and economic power. This was the case when the major airlines
took on Peoples Express during the 1980s. Similarly, to support
its Java programming language, Sun Microsystems organized an
informal “everybody-but-Microsoft” alliance of software and
hardware makers in the ’90s to check the power of Microsoft’s
ActiveX language.
Tit for tat. Individual leaders sequentially discipline potential
rivals when they threaten the current pressure pattern, as
American Airlines did when it acted as enforcer during the early
’90s, using selective fare wars to keep the other supercarriers off
its turf. This pattern began at Texas airports during the ’80s when
American played tit for tat against Braniff and Texas Air, two
Texas-based airlines whose strong growth strategies threatened to
preempt American’s home base in the Dallas/Fort Worth hub.
Sharing power. Leaders achieve a consensus that no major com-
petitor will attempt to disrupt the pressure system, as the Big
Three Supercarriers did in the late 1990s. Each is free to pursue
growth in new areas and to poach on nondominant players that
are not cooperating with the coalition. However, if one of the
leaders gains too much power, it will be ostracized and lose its
influence. For example, Sony and Philips Electronics have evolved
a power-sharing arrangement that has both tacit and explicit
aspects. Sony has traditionally focused on the United States and
Asia, while Philips has dominance in Europe and Latin America.
The two share power over traditional Asian “fast followers” and
component suppliers. Recently, the two companies entered into
an agreement to develop a joint operating system for digital
consumer-electronic systems that will network home computers,
television, video games, personal digital assistants, home appli-
ances and audio equipment. The intent seems to be to block
Microsoft’s Windows CE from reaching prominence within the
consumer electronics world. It remains to be seen if Philips’
recent troubles with high manufacturing costs and downsizing
will make Philips a junior partner in the power-sharing arrange-
ment. It also remains to be seen if Matsushita will be invited to
adopt the Sony-Philips standard, forgoing historic rivalries to
fend off the computing hardware makers that are converging on
the digital appliance and home server markets.
Polarized blocs. These are modified shared-power systems.
When there are two or more leaders in an industry, they can enter
into shared power arrangements in separate blocs of opposing
alliances. Unlike shared power systems, a polarized bloc may
include industry nonleaders. Polarized blocs compete with each
other, but strongly encourage nonaligned players to join the
blocs. Nonleaders that align with a bloc benefit from preferred
relationships within the bloc, but can be ostracized if they refuse
to take sides or prove disloyal. Probably the most well-known
polarized blocs are affiliated with Coca-Cola and Pepsico. Their
blocs include other beverage makers that distribute or bottle
44 MIT SLOAN MANAGEMENT REVIEW FALL 2002
using the blocs as alliance partners, suppliers, bottlers, consul-
tants and advertising agencies. This bloc system helped Coca-
Cola and Pepsico contain Cadbury Schweppes’ attempt to form
a new major player during the 1980s and 1990s.
Collective security arrangements. These stabilize relationships
among industry leaders and among lesser firms by giving all play-
ers an incentive for peaceful coexistence. Leaders in digital hard-
ware (such as Nokia, IBM, Intel, Motorola, Toshiba and Lucent)
as well as hundreds of less powerful firms (such as Acer, AMD,
and Delco) have formed a collective security arrangement
around Bluetooth, a designer and manufacturer of chips that
enable short-distance, digital wireless connec-
tions. By spring 2000, more than 1,800 compa-
nies had agreed to use Bluetooth’s technology.
The ostensible benefit for everyone is universal
connectivity among all the devices that they
make, but the other benefit is stability in the
relationships among these players. Even if
Bluetooth does not survive as the supplier of
choice, it is unlikely that any single ambitious
player will be able to use a new digital wireless
technology to disrupt the status quo.
Destabilizing and Redirecting the Pressure SystemAn organization that is not benefiting from
an existing pressure system or will not bene-
fit from that system’s current path of evolu-
tion may want to destabilize it and redirect
pressure among its rivals. This requires two
crucial strategic choices: selection of the
appropriate allies and selection of the appro-
priate target(s).
Interventions in a pressure system, based
on alliances and targeting, can be used to sig-
nal dissatisfaction with the position or moves
of a rival. They can also be used to entice, pin
down or distract a competitor in certain mar-
kets. They can mold the market selection
strategy of a rival, establish the borders
between the market domains of two firms,
force another player to converge on or
diverge from a position, or eliminate a player
or the allies of others. And targeting can cre-
ate mutual forbearance or natural alliances
between those with common rivals.
Allies should be selected to establish at
least one of five clear types of alliances — each
with a different strategic intent. Allies can be surrogate attackers
that help a company conserve its own resources by putting pres-
sure on a desired target. They can be critical supporters that help
the company apply pressure to a common rival or passive sup-
porters that refrain from pressuring the company while it puts
pressure on another firm. In other cases, allies can act as flank
protectors to relieve pressure on the company or as strategic
umbrellas to prevent pressure on the company. In its early days,
Microsoft used Apple and then Intel as strategic umbrellas,
inhibiting IBM from squashing Microsoft before it became
strong enough to stand on its own. Once IBM realized that
Microsoft was a threat, IBM’s actions were inhibited by the
FALL 2002 MIT SLOAN MANAGEMENT REVIEW 45
Safe Havens
MiamiSan JuanLatin American routes
United
American
Delta
Safe Havens
DenverSan FranciscoLos AngelesPacific routes
Chicago (O'Hare)Wahsington, D.C. (Dulles)
Atlantic routes
New York City (JFK)Dallas
Atlantic routes
New York City (La Guardia)Atlantic routes
British Airways
Iberia
SAS
Lufthansa
Swissair
Sabena
Austrian Air
Air France
Safe Havens
AtlantaCincinnatiSalt Lake CityOrlandoFt. Lauderdale
Pressure Map of the “Big Three Supercarriers,” 1995-2001
By 1995, the three-tier hierarchical pattern of pressure in the U.S. air carrierindustry had consolidated into a stable power-sharing relationship among thethree supercarriers. Each dominated domestic hubs where the other two darednot expand and controlled “safe haven” markets and routes not substantiallyoverlapped by another supercarrier. The resulting stability and profitabilityallowed them to shift their attention to the transatlantic market throughalliances with European carriers. The non-supercarriers (not depicted) movedinto the domestic territories unoccupied by the supercarriers or establishedpositions in the less-traveled foreign routes to Asia or Latin America.
potential reactions of the umbrella firms with which Microsoft
had alliances. These five types of alliances can be established
informally by signaling through public announcements or by
applying pressure to create mutual forbearance, or they can be
created formally through joint ventures and long-term contracts.
Desired alliance partners often ignore suitors’ overtures if
they do not currently share interest in a common target or a
common vision for the pressure system’s future. So it is up to the
suitor to shape the potential ally’s interests. Public signals or for-
mal offers of alliance must be preceded by competitive pressure
to put teeth into the signal or offer. Methods for realigning the
willingness of others to ally (or accept common targets) include
the divide and conquer, balancer and assimilator strategies.
Divide and conquer. By separating central players from their
mutual forbearance or alliance relationships, each member of the
coalition can be induced to reassess its position. Coca-Cola did
this when it severed Pepsico’s 50-year Venezuelan distribution
partnership with the Cisneros family by convincing the family to
sign a more lucrative deal with Coke. Pepsico’s market share in its
only real foothold in South America fell from 42% to zero
overnight. American Airlines also used a divide-and-conquer
strategy when it forced the breakup of a US Airways-British
Airways alliance upon making its own controversial alliance with
British Airways for transatlantic travelers. Resistance from gov-
ernment agencies in the United States and Europe ultimately gut-
ted the power of the American-British Airways alliance, but
American kept the alliance, perhaps to block British Airways
from forming an alliance with one of the other Big Three.
Balancer. A balancer throws its weight back and forth between
rivals, enabling it (or the firm that encouraged it to get into the
balancing act) to influence the rivals’ positioning and movement.
For example, in defense contracting, Boeing and Lockheed
Martin compete for major contracts. Winning the contract
depends upon the support of radar and avionics suppliers (e.g.,
Northrop Grumman) and airframe designer/manufacturers
(e.g., British Aerospace) that regularly switch allegiances between
the two defense giants. Their influence is considerable because
contract awards are typically all or nothing. The jet engine man-
ufacturers (e.g., General Electric, Pratt & Whitney and Rolls-
Royce) have chosen not to play this game, often supplying
whoever wins the contract.
Assimilator. This strategy is based on acquiring the tacit or for-
mal alliance partners of your rivals, balancers and/or your rivals’
rivals. Assimilation can be accomplished through merger and
acquisition or through exclusive supply or distribution contracts.
For example, in 1998 and 1999, Microsoft paid $5 billion for a
chunk of AT&T, $600 million for a stake in Nextel, $200 million
for a piece of Qwest Communications, $1 billion for a portion of
Comcast, $400 million for a stake in Canada’s Rogers Cable,
$212.5 million for part of Road Runner cable modem service, as
well as making investments in several dozen other telecom and
cable companies. Sun Microsystems’ CEO Scott McNealy saw
this as an assimilation strategy to squeeze his company, since
Sun’s biggest business at the time was selling Sun’s Solaris Unix
operating systems to communications companies, its largest
customer segment.12
In choosing the right targets, several options exist. A com-
pany may want to take on its biggest threat, the weakest of the
major players, a rising or aggressive player, or a competitor that
doesn’t pressure it directly but represents an attractive market.
The choice usually depends on the targeting firm’s goal for the
pressure system’s future pattern, the feasibility of the action and
the opportunities that present themselves.
Consider AOL’s Internet service provider business in Europe.
Despite coming late to the market, by 2001 AOL had attained the
number three position in a fragmented market with three other
leaders: number one T-Online (based in Germany), number two
Tiscali (Italy) and number four Wanadoo (France). T-Online, a
Deutsche Telekom (DT) subsidiary, is by far the largest European
ISP and holds the leadership position in its home market because
its service is provided, by default, to DT subscribers. T-Online
has had some trouble replicating its success outside of Germany
but does have a presence in several other countries and grew 35%
in fiscal year 2001 to 10.7 million users. Growing-but-weak
Tiscali has made numerous small acquisitions in 15 countries,
but it holds only the number three or four position and has low
brand recognition in most of them. In its home market, it holds
only the fifth spot. Wanadoo has a strong position in its home
market, as well as a strong position in the United Kingdom
because of its acquisition of Freeserve, the country’s top ISP.
In this case, AOL had several options: Attack or acquire into
the leader’s (T-Online’s) home market; target markets not
important to T-Online; go after the home market of the most
vulnerable player (Tiscali); or target no one and grow diffusely
across Europe. While AOL is making inroads across Europe, it
appears to be targeting T-Online. AOL is exerting significant
effort in Germany, packaging its content to keep its users online
2.5 to 4 times longer (by different estimates) than T-Online users,
suing DT over its allegedly favorable telephone rates for T-Online
users in Germany and using massive ad campaigns to capture
German users. Because T-Online lacks any counter-pressure
through a foothold in AOL’s home ISP market (the United
States), AOL has not been constrained from its aggressive efforts.
46 MIT SLOAN MANAGEMENT REVIEW FALL 2002
FALL 2002 MIT SLOAN MANAGEMENT REVIEW 47
Most industry leaders prefer to fight small battles rather than
large, risky ones, so they target the most vulnerable player. However,
this is not always the best choice. It is often better for a company to
redirect pressure away from itself or to weaken several players
simultaneously than to eliminate the weakest player, because the lat-
ter scenario leaves major competitors capable of exerting a lot of
pressure. Not targeting the weakest player may leave more rivals on
the field, but each with reduced focus and power.
Consider General Motors’ position in the automobile indus-
try. Its home market is the United States, but it has a strong
foothold in Europe (its Opel division). Ford presents a strong
challenge in the U.S. and also has a strong position in Europe.
Toyota has the dominant position in Japan, with a strong and
expanding foothold in the U.S. DaimlerChrysler has a strong
position in Europe and a weak position in the U.S. GM could
target the weakest global player, DaimlerChrysler, which is in
financial difficulty, but it would still face two powerful competi-
tors (Ford and Toyota). Or it could target the strongest competi-
tor on each continent: Ford in the U.S., Toyota in Asia and
Daimler in Europe. This seems to be GM’s preferred strategy, as
evidenced by the fact that it has been buying up or taking minor-
ity stakes in the weaker players of Asia and Europe. This strategy
may be difficult to realize, since both Ford and Toyota are strong
in the U.S. and Toyota’s position in Japan is unassailable given
the existing trade and cultural barriers. But in the unlikely event
that GM succeeds, it would become the undisputed global
leader, facing three weakened competitors.
Enhancing the Pressure Map: A Look at the European Wireless Telecom IndustryThe at-a-glance information in a pressure map can be greatly
enhanced in a number of ways. Safe havens (relatively uncon-
tested markets), formal alliances and an industry’s stabilizing
mechanisms can be shown graphically. Circles can be color-
coded to indicate the financial strength of each company.
Interior circles can be included that are proportional to the size
of a company in the markets being considered or in its home
geographic or key product market. The arrows can be color-
coded to reflect relative advantage in price, advertising, innova-
tion quality or service. Dotted arrows can be added to indicate
the migration of the players to markets outside of the industry,
with the size of the dotted arrow representing the magnitude of
resources being devoted to the move.
An enhanced pressure map can concisely present a considerable
United Kingdom
BritishTelecom
Germany
DeutscheTelekom
Pan-European
BellSouth
Netherlands
KPN
France
Orange A/S
France
VivendiSFR
Alliance(France)
Vodafone(Acquired
Mannesmann)Pan-European
Spain
TelefonicaMigratingResources to
LatinAmerica
Italy
TelecomItalia
Pressure
Majorinvasion
AggressivefootholdSolidfootholdToehold
Financial Strength
Great
Moderate
Weakness
Large newentrants with acurrently smallpresence in market
Key:
Revenue
Wirelessrevenue
Totalcompanyrevenue
Alliance
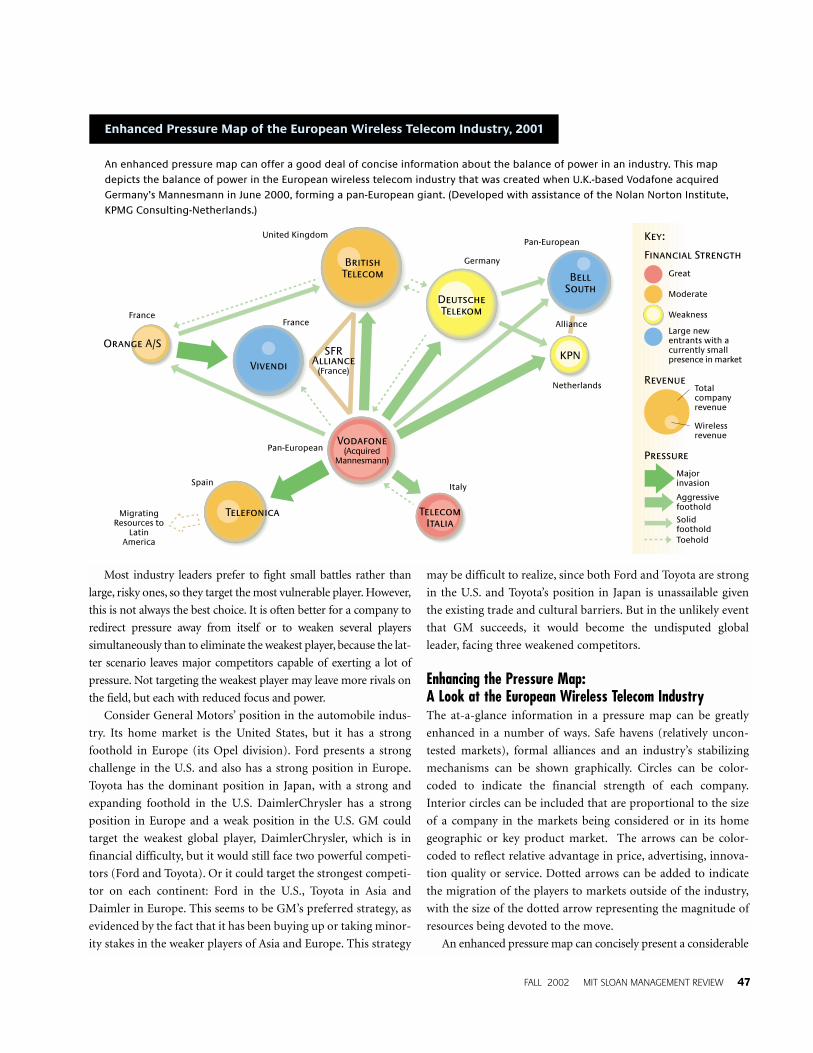
Enhanced Pressure Map of the European Wireless Telecom Industry, 2001
An enhanced pressure map can offer a good deal of concise information about the balance of power in an industry. This mapdepicts the balance of power in the European wireless telecom industry that was created when U.K.-based Vodafone acquiredGermany’s Mannesmann in June 2000, forming a pan-European giant. (Developed with assistance of the Nolan Norton Institute,KPMG Consulting-Netherlands.)
48 MIT SLOAN MANAGEMENT REVIEW FALL 2002
amount of information about the balance of power in an industry.
Look, for example, at the industry landscape that was created when
U.K.-based Vodafone acquired Germany’s Mannesmann in June
2000, forming a pan-European giant with $24 billion in revenues
and 34 million customers — in an industry that had previously
been operated by nationally dominant state-owned or -regulated
firms. (See “Enhanced Pressure Map of the European Wireless
Telecom Industry, 2001.”)
In 2002, Vodafone is the undisputed industry leader with
lower subscriber acquisition costs and greater economies of scale
and connectivity than its competitors. It has strong, positive free
cash flow and holds strong positions — approximately one-third
of the home market — against each of the national wireless lead-
ers in Germany (DT), Italy (Telecom Italia) and Spain
(Telefonica). It’s partnership with Vivendi, SBC Communications
and British Telecom, called SFR, holds a third of the French mar-
ket against France Telecom’s Orange A/S.
The enhanced pressure map of the wireless industry helps
make sense of a seemingly simple situation that has triggered
complex maneuvers with sometimes-obscure rationales. On the
surface, the map indicates clearly that, in 2001, players such as
British Telecom, France Telecom’s Orange A/S and DT were on
the defensive and had to counter Vodafone if they wished to
avoid becoming second-tier players. The simple solution — an
assimilation strategy — would have been to merge their mobile
operations, attract several smaller players and form another pan-
European mobile telecom, a powerful counter-balancing rival to
Vodafone, thereby creating two polarized blocs in the European
wireless industry. But this strategy would have been politically
impossible, given the current nationalistic regulation of
European telephone companies.
Analysis of the map also suggests that the players could check
and balance Vodafone in more complex, but still effective, ways.
That seems to have been the chosen strategy, and, in 2002,
Vodafone has begun to feel the counter-pressure. In Germany,
Vodafone faces a strong defensive counterattack from DT.
Vodafone lost 400,000 subscribers in that country in the first
quarter of 2002 alone. In its home U.K. market, Vodafone is in a
tight market-share race with British Telecom’s Cellnet
(rebranded mmO2), France Telecom’s Orange A/S, and DT-
owned One2One (rebranded T-Mobile). Given its active defense
in Germany, DT is aggressively attacking and taking market
share in the United Kingdom, unfettered by fear of Vodafone
retaliating in the German market. France Telecom’s Orange A/S
is even more aggressive, attacking Vodafone in the United
Kingdom, unconstrained by fear of counterattack in its home
market where it holds 43% market share.
Vodafone appears to be trying to hold its market share posi-
tion against British Telecom and France Telecom’s Orange A/S in
the U.K. to reduce its pressure against DT in Germany and to
concede to Orange A/S in France. Meanwhile, Vodafone’s strat-
egy seems to include attacking Telecom Italia — its financially
strongest opponent but lacking the multimarket contact to
counterattack elsewhere — and Telefonica, which has demon-
strated a lack of commitment to Europe by migrating excessively
(dotted arrow) to Latin America.
The SFR alliance, originally conceived as a counterbalancing
move against France Telecom by two British firms (Vodafone
and British Telecom), is troubled by the conflicting interests of
its partners, including an intense rivalry between Vodafone and
British Telecom in their home market and Vivendi’s redeploy-
ment of resources to the entertainment industry. Vodafone was
reported to be interested in buying out Vivendi’s stake13 — perhaps
to make SFR an aggressive counterbalance against Orange A/S in
France once again — and British Telecom has indicated its will-
ingness to sell out as well.
In addition, Vodafone is reportedly considering exiting its
joint venture with Verizon in the U.S. wireless market to bring
cash home to support its European initiative. This may be nec-
essary because of the rising counterpressure from rivals, the fear
of a consolidation of several rivals if political conditions were to
permit, and the need for funds (for initiatives such as 2.5 and 3G
technology) to remain the leader.
The European wireless industry illustrates how an enhanced
pressure map can enable “what if” exercises and contingency
planning, allowing all players to anticipate with greater accuracy
the outcomes of their own or others’ potential strategies. In fact,
if Vodafone’s competitors had used pressure mapping to do
what-if analyses, it might have stimulated a more aggressive pre-
emptive assimilation or alliance strategy among them before
Vodafone acquired Mannesmann.
Putting Competitive Pressure in ContextAs the old military maxim goes, a good plan never lasts longer
than contact with the enemy. But, by using competitive pressure
maps and a systems approach to understanding the dynamic
patterns underlying multimarket contacts within an industry,
competitors can make a good plan for making contact with ene-
mies and allies alike.
Systems of mixed cooperation, competition and forbearance
exist in every industry and are not necessarily anticompetitive,
collusive oligopolies. Pressure maps are not intended to encour-
age firms to conspire in smoke-filled rooms. They merely indi-
cate and help predict the economic incentives for, and
consequences of, given actions. If taken too far, of course, mutual
forbearance can reach the point of collusion, but there is a lot of
FALL 2002 MIT SLOAN MANAGEMENT REVIEW 49
room for cooperation before it reaches that stage. In fact, if used
properly, pressure mapping can actually reduce the temptation
to collude, drive industry growth to new heights and in new
directions through increased indirect competition, and make
room for clever small players that act as balancers or members of
polarized blocs and collective security agreements. In the end,
use of pressure and mutual forbearance must be responsible and
tailored to avoid violation of antitrust and any other relevant
national laws. As with any strategy, companies should use their
ability to change the pressure situation in their industries for the
greater good of shareholders, customers and society as a whole.
Although the general logic and strategy of pressure systems will
apply to a wide variety of situations involving geographic and
product markets, there are industries in which pressure patterns
are obvious and maps may not be revealing. Still, evidence of sig-
nificant profit impact from pressure based on multimarket con-
tacts has been found for industries as diverse as banking,14
cement,15 hotels,16 knitwear manufacturing,17 mobile telephone
service18 and petroleum19 — on both the global and local levels.
Of course, competitive pressure is not the only force that
affects profitability and survival. To be effective, pressure maps
must be interpreted in the context of the macroeconomy. Major
discontinuities, such as terrorism or technological revolution,
can destroy even the most stabilized systems. And firms can
implode from labor problems, poor management and imple-
mentation errors that shift the balance of power among the play-
ers to stronger players outside the current leadership.
The changing nature of industries and the external forces that
affect them suggest that pressure systems require constant reex-
amination. And pressure mappings can show dynamic shifts in a
visual way. Indeed, if several maps done at periodic intervals are
viewed electronically in rapid sequence, like an animated film, an
industry can be seen evolving, providing a powerful and visceral
understanding of how the world is moving and how the pressure
is flowing.
REFERENCES
1. R.A. D’Aveni, “Strategic Supremacy: How Industry Leaders CreateGrowth, Wealth and Power Through Spheres of Influence” (New York:Free Press, 2001).2. R. McGrath, M. Chen and I. MacMillan, “Multimarket Maneuvering in Uncertain Spheres of Influence: Resource Diversion Strategies,”Academy of Management Review 23, no. 4 (1998): 724-740.3. I. Jans and D.I. Rosenbaum, “Multimarket Contact and Pricing:Evidence From the U.S. Cement Industry,” International Journal ofIndustrial Organization 15 (1997): 391-412; J. Porac, H. Thomas, F. Wilson and S. Kanfer, “Rivalry and the Industry Model of ScottishKnitwear Producers,” Administrative Science Quarterly 40 (1995): 203-217; J. Gimeno and C. Woo, “Hypercompetition in a Multimarket
Environment: The Role of Strategic Similarity and Multimarket Contact inCompetitive De-Escalation,” Organization Science 7 (1996): 322-341;and J. Gimeno, “Reciprocal Threats in Multimarket Rivalry,” StrategicManagement Journal 20 (1999): 101-128.4. H. Haveman and L. Nonnemaker, “Competition in Multiple GeographicMarkets: The Impact on Growth and Market Entry,” AdministrativeScience Quarterly 45 (2000): 232-267.5. M. Chen, “Competitor Analysis and Interfirm Rivalry: Toward aTheoretical Integration,” Academy of Management Review 21, no. 1(1996): 100-134.6. M.E. Porter, “Competitive Strategy: Techniques for Analyzing Industriesand Competitors” (New York: Free Press, 1980).7. Ibid., 17-20.8. J. Gimeno and C.Y. Woo, “Hypercompetition in a MultimarketEnvironment: The Role of Strategic Similarity and Multimarket Contact inCompetitive De-escalation,” Organization Science 7, no. 3 (1996): 322-341.9. M. Chen, “Competitor Analysis and Interfirm Rivalry: Toward aTheoretical Integration,” Academy of Management Review 21, no. 10(1996): 100-134.10. S. Borenstein, “The Dominant Firm Advantage in MultiproductIndustries: Evidence From the Airline Industry,” Quarterly Journal ofEconomics 20 (1991): 344-365; W.N. Evans and I. Kessides, “Living by theGolden Rule: Multimarket Contact in the U.S. Airline Industry,” QuarterlyJournal of Economics 25 (1996): 341-366; J. Baum and H. Haveman, “LoveThey Neighbor? Differential and Spatial Agglomeration in the ManhattanHotel Industry,” Administrative Science Quarterly 42 (1997): 304-338.11. H.J. Morgenthau, “Politics Among Nations” (New York: WCB/McGraw-Hill, 1985).12. D. Kirkpatrick, “Man Bites God: Scott McNealy’s Plan to Punish BillGates,” Fortune, Oct. 25, 1999, 37.13. J. Carreyrou and A. Raghavan, “Leading the News: Vodafone MayBid for Cegetel Stake — Vivendi Could Receive Offer of $4.61 Billion forShare of 44% in Telecom Firm,” Wall Street Journal, July 8, 2002, A3.14. H. Ma and D.B. Jemison, “Effects of Spheres of Influence and FirmResources and Capabilities on the Intensity of Rivalry in Multiple MarketCompetition,” unpublished working paper, Bryant College, Smithfield,Rhode Island, 1994; J.E. Martinez, “The Linked Oligopoly Concept: RecentEvidence From Banking,” Journal of Economic Issues 24 (1990): 589-595;H.A. Haveman and L. Nonnemaker, “Competition in Multiple GeographicMarkets: The Impact on Growth and Market Entry,” Administrative ScienceQuarterly 45 (2000): 232-267.15. I. Jans and D.I. Rosenbaum, “Multimarket Contact and Pricing:Evidence in the U.S. Cement Industry,” International Journal of IndustrialOrganization 15 (1997): 391-412.16. J.A.C. Baum and H.A. Haveman, “Love Thy Neighbor? Differential andSpatial Agglomeration in the Manhattan Hotel Industry,” AdministrativeScience Quarterly 42 (1997): 304-338.17. J.F. Porac, H. Thomas, F. Wilson and S. Kanfer, “Rivalry and theIndustry Model of Scottish Knitwear Producers,” Administrative ScienceQuarterly 40 (1995): 203-217.18. P.M. Parker and L.H. Roller, “Collusive Conduct in Duopolies:Multimarket Conduct and Cross Ownership in the Mobile TelephoneIndustry,” Rand Journal of Economics 28 (1997): 304-322.19. H.G. Broadman, “Intraindustry Structure, Integration Strategies, andPetroleum Firm Performance” (Ph.D. dissertation, University of Michigan,Department of Economics, 1981).
Reprint 4414Copyright Massachusetts Institute of Technology, 2002. All rights reserved.
Reprints/Back IssuesElectronic copies of SMR articles can be purchased onour website: www.mit-smr.comTo order bulk copies of SMRreprints, or to request a freecopy of our reprint index, contact: MIT Sloan Management Review Reprints E60-100 77 Massachusetts AvenueCambridge MA 02139-4307Telephone: 617-253-7170 Toll-free in US or Canada: 877-727-7170 Fax: 617-258-9739 E-mail: [email protected]
Copyright PermissionTo reproduce or transmit oneor more SMR articles by electronic or mechanicalmeans (including photocopyingor archiving in any informationstorage or retrieval system)requires written permission.To request permission to copyarticles, contact: P. Fitzpatrick, Permissions ManagerTelephone: 617-258-7485Fax: 617-258-9739E-mail: [email protected]
MITSloanManagement Review
Recommended


