
http://www.elsevier.com/locate/bba
Biochimica et Biophysica Ac
Regular paper
Divalent ion-dependent swelling of Tomato Bushy Stunt Virus:
A multi-approach study
R. Aramayoa, C. Merigouxb, E. Larquet a, P. Bronc, J. Perezd,
C. Dumase, P. Vachetteb, N. Boisset a,*
aInstitut de Mineralogie et de Physique de la Matiere Condensee, Universite Pierre et Marie Curie UMR7590 CNRS P7 IPGP,
Case Postale 115-75252 Paris Cedex 05, FrancebIBBMC, CNRS UMR 8619 Universite Paris-sud, Batiment 430, F-91405 Orsay Cedex, France
cUniversite Rennes I, UMR 6026 CNRS, Campus de Beaulieu, 35042 Rennes, FrancedSynchrotron SOLEIL, l’Orme des Merisiers, Saint-Aubin-BP 48, 91192 Gif-sur-Yvette Cedex, France
eCentre de Biochimie Structurale, CNRS UMR 5048, INSERM UMR 554, 29 rue de Navacelles, 34090 Montpellier, France
Received 3 March 2005; received in revised form 13 May 2005; accepted 19 May 2005
Available online 15 June 2005
This paper is dedicated to the memory of Dr. Jean Witz, initiator of the project, who died in 2003
Abstract
Time-resolved small-angle X-ray and neutron scattering (SAXS and SANS) in solution were used to study the swelling reaction of TBSV
upon chelation of its constituent calcium at mildly basic pH. SAXS intensities comprise contribution from the protein capsid and the RNA
moiety, while neutron scattering, recorded in 72% D2O, is essentially due to the protein capsid. Cryo-electron micrographs of compact and
swollen virus were used to produce 3D reconstructions of the initial and final conformations of the virus at a resolution of 13 A and 19 A,
respectively. While compact particles appear to be very homogeneous in size, solutions of swollen particles exhibit some size heterogeneity.
A procedure has been developed to compute the SAXS pattern from the 3D reconstruction for comparison with experimental data. Cryo-
electron microscopy thereby provides an invaluable starting (and ending) point for the analysis of the time-resolved swelling process using
the scattering data.
D 2005 Elsevier B.V. All rights reserved.
Keywords: Icosahedral plant virus; Calcium ion; Structural transition; Time-resolved small-angle X-ray and neutron scattering; Cryo-electron microscopy; 3D
reconstruction
1. Introduction transitions of very complex supramolecular assemblies are
At various stages of their life cycle, icosahedral viruses
undergo large conformational changes, from assembly and
maturation to cell entry and decapsidation. These structural
0304-4165/$ - see front matter D 2005 Elsevier B.V. All rights reserved.
doi:10.1016/j.bbagen.2005.05.020
Abbreviations: TBSV, Tomato Bushy Stunt Virus; cryo-EM, cryo-
electron microscopy; TEM, transmission electron microscopy; EDTA,
ethylene diamine tetracetic acid; SAXS, small-angle X-ray scattering; TR-
SAXS, time-resolved small-angle X-ray scattering; SANS, small-angle
neutron scattering; TR-SANS, time-resolved small-angle neutron scatter-
ing; FSC, Fourier shell correlation; CTF, contrast transfer function
* Corresponding author.
E-mail address: [email protected] (N. Boisset).
the focus of many biochemical and biophysical studies,
since a better understanding of their molecular basis can
offer, beyond the knowledge of crucial processes, a means
of blocking the replication cycle of the virus. Since 1978
and the first virus structure solved by X-ray crystallography,
several tens of structures have been determined of even very
large objects. However, the structure determination entirely
relies on the icosahedral symmetry, and all parts of the
virion which do not obey the symmetry are lost. This spatial
disorder often affects the RNA moiety and internal parts of
the viral capsid interacting with RNA. Furthermore, large
conformational changes are rarely amenable to crystallo-
graphic investigation.
ta 1724 (2005) 345 – 354

R. Aramayo et al. / Biochimica et Biophysica Acta 1724 (2005) 345–354346
Recently, remarkable progresses were made in the
understanding of a few processes of viral maturation, using
a variety of approaches [1]. We present here progresses
made in the study of an apparently very simple process, but
deceptively so, the divalent ion-dependent swelling of a
small plant virus, Tomato Bushy Stunt Virus (TBSV). We
use a combination of cryo-electron microscopy and scatter-
ing methods together with the results of landmark crystallo-
graphic studies performed in the early 1980s to study the
transition both structurally and kinetically.
Small isometric viruses possess an icosahedrally sym-
metric capsid comprising one or a few distinct protein
subunits encapsulating a molecule of nucleic acid [2]. For
recent reviews, see [3,4]. The crystal structure of many of
these viruses shows at the interface between subunits the
presence of divalent cations, mostly Ca2+ [5,6] but also
Mg2+ [7], which appear to play a critical role in virion
stability. Actually, conformational changes of these viruses
have been observed upon changes of pH and chelation of
divalent ions, resulting in a swollen form of the virion, long
before the first virus crystallographic structure was known
[8,9]. They were later observed by crystallography and
electron microscopy [6,10]. These conformational transi-
tions probably correspond to early stages of the virion
uncoating for RNA release in the infected cell.
The swelling of TBSV has been extensively investigated
by analytical centrifugation, fluorescence spectroscopy,
small-angle neutron and X-ray scattering, and biochemical
techniques [10,11]. TBSV was the first virus whose three-
dimensional structure was crystallographically determined
at a resolution of 2.9 A [12]. Following the determination of
the native conformation, the structure of swollen TBSV was
obtained at a resolution of 8 A [10]. The TBSV particle
consists of a single stranded RNA of Mr 1.5�106 Da inside
an icosahedral T=3 capsid made of 180 subunits of Mr
40,500 Da arranged in three different packing environments
(A, B, and C: A-type subunits pack around the fivefold axes,
whereas B- and C-type subunits alternate around the
threefold axes). Each subunit comprises two domains
connected via a hinge. The S-domains (170 residues) build
the spherical shell, while the P-domains (115 residues)
associate into 90 dimers (30 C–C and 60 A–B dimers),
radially projecting at the outer surface of the capsid. In the
expansion process, the domains appear to undergo rigid
body movements, preserving many subunit interactions but
leading to the formation of an opening at quasi-threefold
axes [10]. The N-terminal parts of the coat protein referred
to as the R-domain, amounting to ca. 25% of the chain,
which interacts through many basic residues with RNA as
well as the entire RNA, are invisible in electron density
maps of either compact or swollen virions, because they are
not icosahedrally ordered [13]. Low resolution neutron
diffraction studies of single crystals of compact virion
showed that most of the missing protein fraction is found in
an inner shell, while RNA lies between those two shells,
preferentially located below the 30 C–C dimers [14].
Finally, the overall radial distributions of RNA and protein
are conserved, with all radii increasing by ca. 22 A [11].
However, no information was available regarding the ki-
netics of the transition and its molecular mechanism.
A preliminary time-resolved small-angle X-ray scattering
(TR-SAXS) study has been performed using the X-ray beam
of a bending magnet at LURE [15]. Data analysis showed
that a final EDTA concentration of about 40 mM was
required to saturate the system (i.e. to yield kinetics
independent from EDTA concentration) and that, following
an initial lag-phase, an intermediate conformation at least
was involved in the swelling transition. Model-dependent
characterization of the intermediate suggested that the
transition most likely involved a class of intermediate
conformations, which was, on average, more swollen with
time. However, the available flux severely limited the
quality of the data, with a useful resolution of about 80 A
and a time resolution of 2 s. Furthermore, the paucity of
structural information regarding the RNA distribution
hampered the structural interpretation of the scattering data.
Therefore, we have undertaken a coupled approach of the
problem, combining scattering methods and 3D cryo-EM.
TR-SAXS experiments, using the very high flux of un-
dulator SAXS beamline ID02 at ESRF (Grenoble, France),
provided high quality data at a nominal resolution of about
25 A. Time-resolved small-angle neutron scattering (TR-
SANS) experiments were also performed on the SANS
instrument D22 at ILL (Grenoble, France) in a 72% D2O
buffer so as to mask RNA contribution and monitor more
specifically the protein capsid swelling. Finally, cryo-
electron microscopy was used to characterize the compact
and swollen forms of the virus at a resolution of about 15 A.
The present report focuses on the tools developed to
implement this combination of approaches as applied to the
native, compact structure of the virus, a prerequisite for a
meaningful interpretation of time-resolved studies in struc-
tural terms. A procedure was established to calculate the
small-angle scattering pattern of the 3D reconstructions,
thereby providing the missing link between EM derived
reconstructions and SAXS data.
2. Materials and methods
2.1. Virus preparation
TBSV was propagated in Datura stramonium. Plant
proteins were removed from the sap by precipitation at pH
4.8, and the virus was purified by two cycles of high and
low speed centrifugations. Stock viral solutions were
conserved at 30 to 60 mg/ml, in 20 mM sodium acetate
buffer containing 0.01% sodium azide. Solutions were
filtered through 0.22 Am Millex filters and were dialyzed
for 24 h against at least three changes of appropriate buffer
before use. All chemicals used were of analytical grade:
EDTA (tetrasodium salt) was from Sigma Chemical Co (St

R. Aramayo et al. / Biochimica et Biophysica Acta 1724 (2005) 345–354 347
Louis, USA), all others from Merck (Darmstadt, Germany).
Virus concentrations were measured by UV absorption
spectroscopy, using an extinction coefficient of A(260
nm)=5.2 cm2/mg [16].
2.2. Time-resolved X-ray scattering experiments
TR-SAXS patterns were recorded on instrument ID02
using the emission from an undulator at ESRF (Grenoble)
[17]. The sample to detector distance was 2.3 m, the
wavelength of the X-rays was k =0.995 A and data were
recorded over the angular range 0.02 A�1<Q <0.29 A�1
where Q =4ksinh/k (2h is the scattering angle). Mixing was
performed using a Biologic SFM3 stopped-flow mixer
described at http://www.biologic.info/rapid-kinetics/mixers.
html#mivers_7. Temperature was kept constant at 20 -C. A30 mg/ml solution of compact TBSV in 100 mM Tris–HCl,
5 mM CaCl2 buffer, pH 7.55 (Buffer A), was mixed with an
equal volume of Tris/EDTA buffer (100 mM Tris–HCl, 120
mM EDTA, pH 7.55). 110 frames of 0.1 s each were
collected at intervals following a geometrical series of
reason a =1.038 over a total time of 1518 s. Static patterns
of the compact and swollen viruses were recorded using 20
frames of 0.1 s each. The corresponding buffers were also
recorded and subtracted from the virus solution patterns
after proper scaling to the transmitted intensity. Scattering
curves were recorded using a CCD detector with X-ray
image intensifier [18].
2.3. Neutron scattering experiments
Neutron scattering patterns were recorded on the SANS
instrument D22 at the high flux reactor of ILL (Grenoble).
The sample–detector distance was 3.5 m, with a collimation
length of 8 m. The wavelength was 6 A with a 10%
bandwidth. All measurements were performed at 20 -C. A54 mg/ml TBSV solution was dialyzed for 3 days against
four changes of the appropriate 72% D2O buffer 100 mM
Tris–HCl, 5 mM CaCl2, pH 7.88 (pD 8.2). Mixing was
performed using a Biologic SF3 stopped-flow mixer in
which the measuring cell is a modified 1-mm path-length
Hellma quartz cell. Neutron scattering experiments were
performed in 72% D2O. The scattering pattern of the
compact virus used here was recorded after mixing the
above-mentioned solution with an equal volume (300 Aleach) of the dialysis buffer, together with buffer scattering,
using 8 frames of 100 s.
Data were processed using Grasp, a program written
by C. Dewhurst available at http://www.ill.fr/lss/grasp/
grasp_main.html, before averaging.
2.4. Modelling the missing N-terminal part of the capsid
protein
A contrast variation study of TBSV had been interpreted
in terms of a 3-layer model surrounding a central lumen
filled with solvent [16]. The agreement of the model with
our data recorded in 72% D2O was checked and found
satisfactory. We therefore used this model as a guide to
position the missing N-terminal residues. The position of
each residue was simply defined by that of its Ca atom, all
other atoms being located at the same point. This pseudo-
atomic model approximation was shown to leave the pattern
unchanged out to Q =0.13 A�1 (data not shown). The
position of each Ca was determined randomly under the
following constraints. First, two successive Ca atoms were
separated by 3.8 A. Second, the distribution of residues
among the three layers was translated in geometrical
constraints imposed to the reconstructed chains. The thick-
ness of the ‘‘RNA’’ layer is such that at least 9 residues are
required to cross it entirely. Since 9 residues yield a volume
fraction occupied by the protein already larger than that
predicted by the three-layer model of Chauvin et al. [16], we
kept the residue number fixed at this minimal value. This 9-
residue-long stretch was then systematically moved along
the crystallographically invisible part of the sequence. For
each position, we first estimated the scattering length
density associated with the protein moiety in each layer
by taking into account the actual contribution from each
residue.
Once all three chains were modelled, the whole capsid
was generated using icosahedral symmetry operators before
computing the scattering pattern using CRYSON software
[19,20]. We established that the precise position of each
residue had less impact on the scattering pattern than the
location of the 9-residue-long stretch along the sequence.
The configuration in which residues 1–24 are located in the
inner (third) layer (50 A–80 A radii), residues 25–33 within
the ‘‘RNA-rich’’ (second) layer and residues 34–387 in the
outermost layer was found to yield the best agreement with
the experimental data. In a subsequent step, various
configurations of the residues within their ascribed layer
were explored but no real optimisation procedure has been
implemented as yet. Finally, the models yielding the best
agreement were checked for the presence of major steric
conflicts with symmetry-related chains, in which case the
model was eliminated.
2.5. Cryo-electron microscopy
Compact TBSV was diluted in sodium acetate 20 mM
buffer, pH 5.9, MgCl2 50 mM, CaCl2 10 mM, while swollen
TBSV form was obtained after an overnight dialysis in
Tris–HCl 100 mM buffer, pH 7.5, EDTA 20 mM. For cryo-
electron microscopy, virus solutions were diluted to a
concentration of 1 mg/ml and deposited on 400 mesh holey
carbon-coated grids. After blotting with filter paper, the
grids were frozen by rapid plunging in liquid ethane and
were mounted and inserted in the microscope using a
nitrogen cooled side entry Gatan 626 cryoholder. Observa-
tions were carried out at a temperature of �180 -C in a
JEOL 2010F electron microscope equipped with a CRP

Fig. 1. TR-SAXS patterns of TBSV during swelling. The virus solution was
mixed with an equal volume of an EDTA-containing buffer. The final
EDTA concentration was 60 mM. Colors change gradually from the
compact virus pattern (blue) to the swollen virus pattern (red).
R. Aramayo et al. / Biochimica et Biophysica Acta 1724 (2005) 345–354348
objective lens (Cs: 2.0 mm, Cc: 2.1 mm, focal length: 2.8
mm), using an accelerating voltage of 200 kV, with the
following illumination conditions: alpha 2, spot 2, 120 Amcondenser aperture and 70 Am objective aperture. Images
were recorded, using the MDS minimum electron dose
system (10 electrons per A2), with a magnification of
�50,000 on Kodak films So163. For each field, two images
were recorded using two different defocus values, one close
to focus for high resolution data recording and one further
from focus for a good visualization of particles.
2.6. Image processing and three-dimensional
reconstructions
Electron micrographs were digitised with a Nikon
Coolscan 8000ED at 10 Am/pixel, corresponding to a
nominal pixel size of 2 A. Data were processed as described
in [21]. Briefly, images were corrected for contrast transfer
effects, and focal pairs of images were combined using the
SUMPS and CTFMIX programs [21]. Particle origins and
orientations were determined and refined using the model-
based orientation determination method [22]. The TBSV
reconstruction was determined using as starting model the
structure of TBSV [12] computed at 40 A resolution. In the
case of swollen TBSV particles, the starting model was our
three-dimensional reconstruction of TBSV computed at 40
A resolution, rescaled to match with the main population of
particles having the bigger diameter (ca. 36 nm), and
scooped out in order to only include the outermost layer.
Density maps were calculated by Fourier–Bessel formalism
originally described by Crowther [23] and implemented in
the EM3DR program of Baker and Cheng [22]. Resolution
was estimated using Fourier Shell Correlation (FSC)
criterion with a cutting level of 0.5 (FSC0.5) [24,25]. We
determined 3D reconstructions of the compact and swollen
TBSV at 13 A and 19 A, respectively. For docking atomic
coordinates 2tbv from Protein Data Bank on EM volumes,
the Situs software [26] was used to fit 15 copies of trimers
ABC (one quarter of the total capsid) on the total compact
3D cryoEM volume. Then, the best fit found by Situs was
kept, and the whole capsid architecture was generated by
applying icosahedral symmetries on additional copies of the
aligned substructure. For surface representations of aligned
architectures, the aligned PDB volume was converted into
SPIDER format and was low-pass filtered to 13 A
resolution. A threshold density corresponding to the half
dynamic range was then applied to compute surface
representations of this filtered volume. Similarly, threshold
densities of EM volumes were chosen to give the best fit
with this reference volume.
2.7. Calculation of scattering patterns from EM
reconstructions
The simulation procedure to calculate scattering patterns
from cryo-EM 3D reconstructions was implemented using
SFALL, FFT, MAPROT, MAPMASK programs from the
CCP4 suite [27] and MAPMAN program [28]. It was
applied to the compact and swollen forms of TBSV virus
cryo-EM density maps.
3. Results and discussion
3.1. SAXS measurements
Fig. 1 shows X-ray scattering patterns recorded at
different times after mixing the virus solution in buffer A
with an equal volume of a 120 mM EDTA buffer. The very
high flux available on undulator beamline ID02 allowed
data collection over 0.1 s after a single shot (mixing) with
excellent statistics out to 0.22 A�1. The expected inward
shift of scattering patterns associated with swelling is
observed together with the two crossing points at
Q =0.0374 A�1 and Q =0.0575 A�1 reported by Perez
[15], but seen here with the greatest accuracy. Such high
quality data are both a boon and an impediment for
subsequent interpretation since no simplistic model will
account for the observed scattering pattern within exper-
imental uncertainty.
The system is complex since, beyond intrinsic complex-
ity of any structural transition, the virus comprises protein
and RNA moieties, both contributing to scattering patterns.
Qualitative information regarding the RNA location is
available from contrast variation in low-resolution neutron
crystallography [14], but there is no structure or even
reliable density distribution. Modelling RNA structure and
location in the capsid is therefore very difficult. Further-
more, even protein distribution is only partially known,
since the crystal structure left undetermined the location of
the 66 (C-chain) or 100 (A- and B-chain) N-terminal
residues [12]. To overcome these limitations, we used a

Fig. 3. Model of the completed trimer of coat protein in the compact virus.
Chain A: blue; chain B: violet; chain C: green. The crystal structure is
shown in ribbon representation while balls are used to display the modelled
N-terminal ends.
R. Aramayo et al. / Biochimica et Biophysica Acta 1724 (2005) 345–354 349
multi-technique approach. Cryo-EM study of native com-
pact virus provided precious information on RNA distribu-
tion within the capsid, while SANS simplified somewhat the
system. Indeed, taking advantage of the very different
scattering length of H2O and D2O, it is possible, by using
appropriate mixtures of normal and heavy water, to mask
protein or RNA moiety [29].
3.2. SANS measurements
Recording SANS data of TBSV in 72% D2O essentially
provided scattering from the protein fraction. Using
CRYSON software, we calculated the scattering pattern of
the part of the protein capsid solved by crystallography
(PDB entry 2tbv). The comparison between the experimen-
tal (black curve) and the calculated (blue curve) scattering
patterns is shown in Fig. 2. The minima and maxima are at
similar positions but the overall dynamic of the calculated
curve is larger, with intensities being much weaker at large
angles. This discrepancy is likely due to the contribution of
the missing part of the protein, thought to interact with RNA
through more than 10 positively charged residues in the N-
terminal part while also forming a second, smaller layer
below the RNA-containing layer at radii between 80 and 50
A. We therefore undertook to model this missing part in the
three chains of the asymmetric unit A, B and C so as to fit
the scattering pattern while satisfying several constraints as
exposed in the Material and methods section. The scattering
pattern of one of the best models is shown in Fig. 2 (red
curve) with the model displayed in Fig. 3. The agreement is
significantly better though not perfect, leaving room for
further improvement.
3.3. Cryo-electron microscopy and 3D reconstruction
For cryo-electron microscopy, two samples were pre-
pared with a TBSV concentration of 1 mg/ml. First,
Fig. 2. Comparison of the experimental SANS pattern of compact TBSV in
72% D2O with calculated curves from models. The blue curve is obtained
using the crystal structure (PDB file 2tbv). The red curve corresponds to the
coat protein trimer in which the missing N-terminal parts have been
modelled as shown in Fig. 3.
compact TBSV was diluted in a sodium acetate 20 mM,
pH 5.9 buffer, with MgCl2 50 mM and CaCl2 10 mM. These
salts were added to the buffer to prevent the natural
tendency of the virus to form bidimensional patches, and
to get large amounts of isolated particles in all possible
orientations within the ice layer. Second, swollen TBSV was
obtained from a stock TBSV solution in a sodium acetate 20
mM, pH 5.9, buffer after one night of dialysis against Tris–
HCl 100 mM, pH 7.5, buffer with EDTA 20 mM. For both
samples, selected fields were exposed twice to the electron
beam under low dose conditions, using defocus values
ranging from 1500 to 2000 nm for the first exposure, and
from 2500 to 3500 nm for the second exposure. In its
compact conformation, the TBSV appears as black particles
of homogeneous size (Fig. 4a), and 2500 particles were
extracted from five digitised micrographs. Conversely, the
swollen form of the virus exhibits a central hollow white
area and particles display some size heterogeneity (Fig. 4b).
Hence, twenty micrographs were necessary to collect a
significant amount of particles. After the digitisation of
micrographs, contrast transfer function (CTF) parameters
were estimated on their averaged power spectra, using
CTFZeros [21] and WEB softwares [30]. During particle
picking, two homologous image sets were extracted from
focal pairs and recombined after phase flipping using
CTFMIX [21]. The determination of Eulerian angles and
3D reconstructions were carried out in several refinement

Fig. 4. Cryo-electron microscopy of Tomato Bushy Stunt Virus in its compact (a) and swollen (b) conformations. (c) Surface representation of the 3D
reconstruction volume of the compact TBSV at 13 A resolution obtained from 2500 particles and using EM3DR. The volume is observed from outside and
from inside after removing the front half. (d) Fitting of the atomic coordinates from Protein Data Bank (2tbv) in cryo-EM 3D using Situs and Chimera
softwares. (e) Surface representation of the 3D reconstruction volume of the swollen TBSVat 19 A resolution obtained from 2500 particles and using EM3DR.
The volume is observed from outside and from inside after removing the front half. (f) Semi-transparent surface rendering of the swollen virus superposed with
the surface representation of the compact reconstruction volume (dark grey). The swelling from 32 nm to 36 nm is clearly visible between the two
conformations.
R. Aramayo et al. / Biochimica et Biophysica Acta 1724 (2005) 345–354350
cycles using EMPFT and EM3DR softwares [22]. More
elaborate schemes are now available for CTF correction and
iterative computation of refined 3D reconstruction volumes.
However, we did not seek here subnanometric resolution of
the viral capsid, as TBSV is mostly composed of h-sheets,requiring a 4.5 A resolution to be correctly visualized [31].
The compact TBSV 3D reconstruction volume reached a
resolution of FSC0.5=1/13 A�1 within 6 cycles of centring
and angular assignment. The overall diameter of the particle
is equal to 32 nm (Fig. 4c left), and protruding domains of
capsid protein are well defined on the surface representa-
tions and seem in good agreement with atomic coordinates
from PDB (Fig. 4d). In a cutaway surface representation of
the back half virion, strong densities appear within the
reconstruction volume (Fig. 4c, right), that most likely
corresponds to the RNA molecule. The fact that this RNA
appears in the 3D reconstruction volume despite its lack of
icosahedric structure indicates that its location is constrained
within a given range of radii. This observation is in good
agreement with a model of radial distribution of RNAwithin
the central part of the viral capsid [16]. However, as we will
see in the next section, a spherical distribution of RNA is
not accurate enough to simulate SAXS data from cryo-EM.
The swollen TBSV 3D reconstruction volume reached a
resolution of only FSC0.5=1/19 A�1 within 8 cycles of
centring and angular assignment. The lower resolution of
this second 3D reconstruction volume is clearly visible in
the less defined structure of protruding domain on surface
representation of the capsid (Fig. 4e, left). This phenomenon
is most likely due to structural variations within the set of
swollen particles. This was confirmed using the approach of
White et al. describing the sorting of two sets of Hsp27
complexes, using multivariate statistical analysis (MSA)
[32]. Indeed, when subjecting the centered images of
swollen TBSV to MSA, the size heterogeneity was revealed
in one of the three first eigenvectors. Unfortunately, we did
not observe two or more defined classes of images, but a
continuous size variation among the image sets. Therefore,

R. Aramayo et al. / Biochimica et Biophysica Acta 1724 (2005) 345–354 351
the compact TBSV reference volume was interpolated to
produce the best fit with the largest image class of swollen
TBSV. All cryoEM images were then aligned on this
reference volume, but a selection of the largest ones was
carried out using their cross-correlation coefficient values
with this enlarged reference. The threshold cross-correlation
(CC) value used for this selection corresponds to (average
CC)� (2�r). A new reference volume was then computed
from this image subset and was used for further angular
refinements of the whole image population, and complete
cycles of alignment, sorting, and 3D reconstruction were
carried out iteratively. Three main differences are visible
when comparing this volume with the compact structure.
First, the overall diameter of the particle expanded from 32
nm for the compact to 36 nm for the swollen TBSV (Fig.
4f). Second, despite their less defined shape, a rotation of
the protruding capsid domains is visible around the 3-fold
axes (Fig. 4e, left), as already demonstrated by X-ray
crystallography [10]. Third, when considering inner parts of
the structure, RNA seems to have moved away from its
central position (Fig. 4e, right). This is even more visible on
radial density profiles computed from both volumes (Fig.
5a, asterisk and black dot).
Fig. 5. Radial plots of densities for the compact (dashed lines) and swollen
(continuous lines) structures of TBSV. (a) Curves obtained from exper-
imental cryo-EM 3D reconstruction volumes. (b) Curves obtained with the
scaling procedure using SAXS data. The swelling process is characterized
by the displacement (black arrows) of two peaks of radial densities to larger
radii. The inner presence (asterisk) or absence (black dot) of material,
presumably RNA, is also observed in these curves.
3.4. Simulated SAXS data from cryo-EM reconstruction
The scattering intensity I(Q) from a diluted monodis-
perse solution of macromolecules is an isotropic function of
the scattering vector Q proportional to the spherical average
of squared structure factors F(Q) of the scattering particle.
F(Q) can be expressed as the Fourier transform of excess
scattering density of the particle relative to the solvent.
The following procedure was established to calculate the
small-angle scattering profile of a particle from its 3D cryo-
EM reconstruction map and to optimise the fit with
experimental SAXS data. Few methods were developed
for computing small-angle scattering spectra from atomic
models. They are founded on the classical Debye’s equation
or the more practicable and efficient multipole expansion
method [19,20]. In the case of electron-density maps, a
method based on Fourier transform of the density map [33]
is an appropriate and efficient approach to obtaining I(Q),
and we applied it here. In contrast to cryo-electron micro-
scopy, solution X-ray scattering provides absolute and
accurate measurements of structure factor amplitudes of
particles in their natural room temperature aqueous environ-
ment. Testing the compatibility and accuracy of cryo-EM
models with SAXS data is a prerequisite to the combination
of these methods for the analysis of TBSV time-resolved
swelling process.
Cryo-EM density 3D maps were sampled at 3 A intervals
on a cubic grid in the CCP4 map format [27]. After various
corrections described below, the maps were subjected to a
Fast Fourier Transform algorithm as implemented in SFALL
program [27]. The structure factors values generated in the
range up to 1/20 A�1 were averaged within thin spherical
shells. A sufficient number of Fourier coefficients are
needed within each shell to ensure appropriate averaging.
Consequently, the pseudo cubic unit cell containing the
virus particle had large parameters, typically 1200 A. This is
also necessary to ensure that no interparticle vector will
contribute to the calculated scattering intensity. The
simulated scattering curve was then compared to exper-
imental SAXS data recorded on the compact and swollen
forms of TBSV.
The scattering pattern calculated using the original
density map from cryo-EM (circles) is shown in Fig. 6,
together with the experimental curve (dashed line).
Although both curves exhibit similar features, with marked
minima and maxima, their positions are not identical and
their overall dynamical ranges are significantly different.
Given a 3D cryo-EM density map, the procedure optimises
the fit of the corresponding simulated scattering curve to the
SAXS data using various scaling factors applied to the three
shells of the density map and an optimal electron density
contrast between the particle and the bulk solvent. First, a
threshold parameter derived from the radial density profile
(Fig. 5a) was estimated to isolate the particle envelope from
the solvent region, so that the selected voxels delineate the
expected volume of the viral particle. During cryo-EM
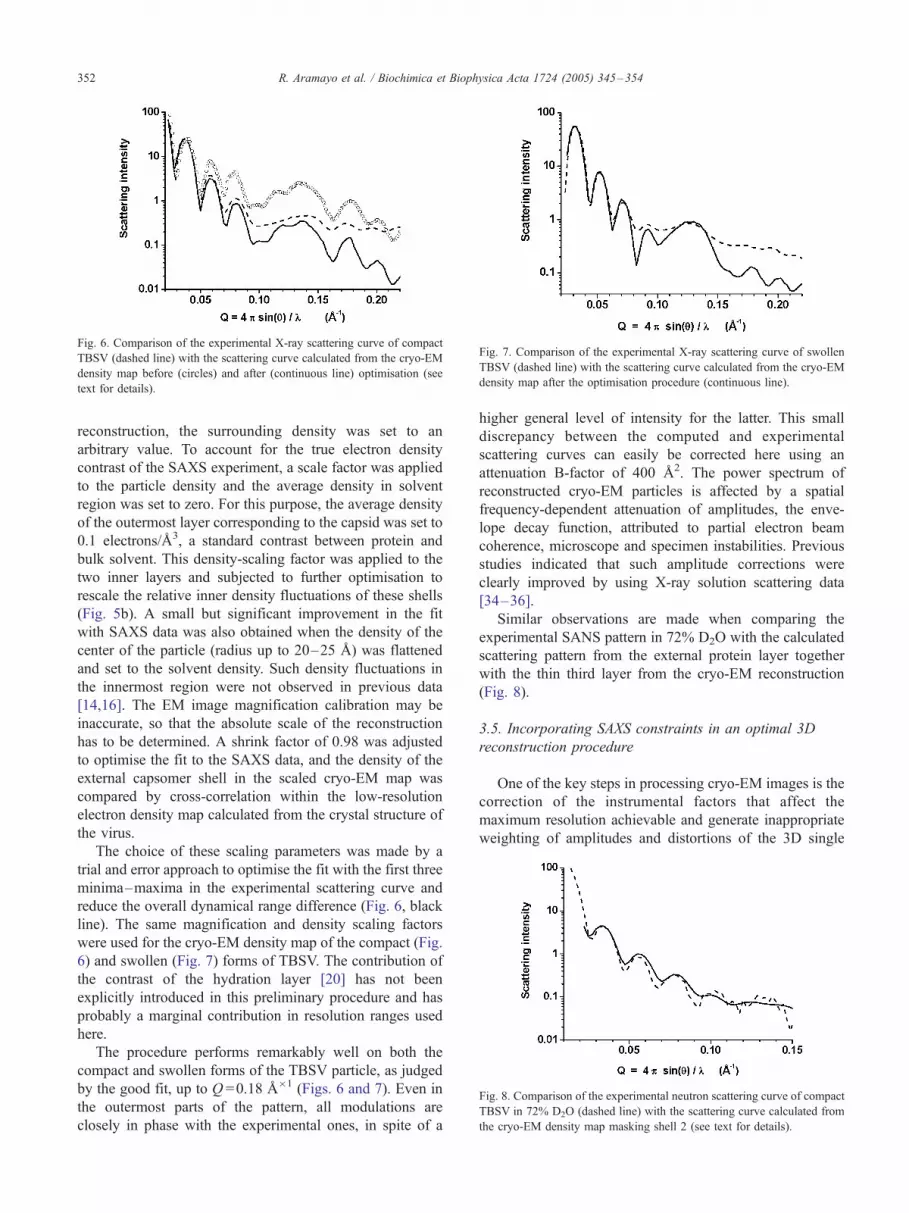
Fig. 7. Comparison of the experimental X-ray scattering curve of swollen
TBSV (dashed line) with the scattering curve calculated from the cryo-EM
density map after the optimisation procedure (continuous line).
Fig. 8. Comparison of the experimental neutron scattering curve of compact
TBSV in 72% D2O (dashed line) with the scattering curve calculated from
the cryo-EM density map masking shell 2 (see text for details).
Fig. 6. Comparison of the experimental X-ray scattering curve of compact
TBSV (dashed line) with the scattering curve calculated from the cryo-EM
density map before (circles) and after (continuous line) optimisation (see
text for details).
R. Aramayo et al. / Biochimica et Biophysica Acta 1724 (2005) 345–354352
reconstruction, the surrounding density was set to an
arbitrary value. To account for the true electron density
contrast of the SAXS experiment, a scale factor was applied
to the particle density and the average density in solvent
region was set to zero. For this purpose, the average density
of the outermost layer corresponding to the capsid was set to
0.1 electrons/A3, a standard contrast between protein and
bulk solvent. This density-scaling factor was applied to the
two inner layers and subjected to further optimisation to
rescale the relative inner density fluctuations of these shells
(Fig. 5b). A small but significant improvement in the fit
with SAXS data was also obtained when the density of the
center of the particle (radius up to 20–25 A) was flattened
and set to the solvent density. Such density fluctuations in
the innermost region were not observed in previous data
[14,16]. The EM image magnification calibration may be
inaccurate, so that the absolute scale of the reconstruction
has to be determined. A shrink factor of 0.98 was adjusted
to optimise the fit to the SAXS data, and the density of the
external capsomer shell in the scaled cryo-EM map was
compared by cross-correlation within the low-resolution
electron density map calculated from the crystal structure of
the virus.
The choice of these scaling parameters was made by a
trial and error approach to optimise the fit with the first three
minima–maxima in the experimental scattering curve and
reduce the overall dynamical range difference (Fig. 6, black
line). The same magnification and density scaling factors
were used for the cryo-EM density map of the compact (Fig.
6) and swollen (Fig. 7) forms of TBSV. The contribution of
the contrast of the hydration layer [20] has not been
explicitly introduced in this preliminary procedure and has
probably a marginal contribution in resolution ranges used
here.
The procedure performs remarkably well on both the
compact and swollen forms of the TBSV particle, as judged
by the good fit, up to Q =0.18 A�1 (Figs. 6 and 7). Even in
the outermost parts of the pattern, all modulations are
closely in phase with the experimental ones, in spite of a
higher general level of intensity for the latter. This small
discrepancy between the computed and experimental
scattering curves can easily be corrected here using an
attenuation B-factor of 400 A2. The power spectrum of
reconstructed cryo-EM particles is affected by a spatial
frequency-dependent attenuation of amplitudes, the enve-
lope decay function, attributed to partial electron beam
coherence, microscope and specimen instabilities. Previous
studies indicated that such amplitude corrections were
clearly improved by using X-ray solution scattering data
[34–36].
Similar observations are made when comparing the
experimental SANS pattern in 72% D2O with the calculated
scattering pattern from the external protein layer together
with the thin third layer from the cryo-EM reconstruction
(Fig. 8).
3.5. Incorporating SAXS constraints in an optimal 3D
reconstruction procedure
One of the key steps in processing cryo-EM images is the
correction of the instrumental factors that affect the
maximum resolution achievable and generate inappropriate
weighting of amplitudes and distortions of the 3D single

R. Aramayo et al. / Biochimica et Biophysica Acta 1724 (2005) 345–354 353
reconstruction. As previously underlined [36,37], SAXS is a
unique tool to estimate the CTF and envelope decay
functions. An analogous strategy was used by other groups
to correct the amplitude scale factors and improve the
interpretability of cryo-EM 3D reconstruction maps [34,35].
Our results on TBSV demonstrate that a typical cryo-EM
reconstruction and solution X-ray scattering data yield
comparable structure factor profiles. We show that an
appropriate weighting of density fluctuations inside the
particle and an optimal scaling easily derived from this
procedure lead to a significant improvement of the fit
between these data. In macromolecular crystallography,
idealization in direct space is routinely used to improve the
phases of structure factors and relies on properties of the
electron density map: positivity, compact support, point-
group or axial symmetry, histogram matching depending on
the nature of the component (RNA, protein), and proper
solvent–particle contrast. The simultaneous application of
real and reciprocal space constraints using SAXS data
emerges as a tool to attenuate structural distortion problems
and improve the quality and compatibility of cryo-EM
density maps with X-ray data [26].
4. Conclusion
We have reported here our current progresses in the study
of an apparently simple divalent ion-dependent swelling
process of TBSV. Even at the present stage of the work, the
potential of mutual improvement of various approaches
clearly appears. While cryo-electron microscopy provides
very useful 3D reconstruction of particles, the inner
fluctuations of density are not as reliable as the volume
information and can be improved when taking into account
information from scattering methods directly obtained in
solution. Less prone to experimental artefacts, SAXS and
SANS suffer from limitations in the structural interpretation
and greatly benefit from external information from cryo-
EM, 3D models of course, but also information on particle
homogeneity in size (as in the case of the swollen form of
the virus). Coupling those two low-to-medium resolution
methods with the high-resolution results of crystallographic
studies further enhances the quality of the structural
interpretation of both cryo-EM reconstructions and scatter-
ing data. This multi-pronged approach advocated in a recent
review [38] is an obligate path to try and elucidate the nature
and mechanism of the conformational transitions that
viruses, these complex supramolecular assemblies, undergo
at key stages of their life cycle such as decapsidation or
maturation.
Acknowledgements
This work was partly supported by European Commis-
sion (NoE ‘‘3D-EM’’ contract No. LSHG-CT-2004-
502828). We acknowledge the European Synchrotron
Radiation Facility for the provision of synchrotron radiation
facilities and we would like to thank S. Finet and T.
Narayanan (ESRF) for assistance in using beamline ID02.
Similarly, we acknowledge the Laue-Langevin Institute for
the provision of neutron scattering facilities. And we are
grateful to I. Grillo, P. Timmins (ILL) and D. Durand
(IBBMC) for their help with the TR-SANS measurements
on D22. We are grateful to Region Ile-de-France for
convention SESAME 1999 E 1298 for the support to
cryoelectron microscope JEOL 2010F installed at the
Pasteur Institute.
References
[1] J.E. Johnson, W. Chiu, Structures of virus and virus-like particles,
Curr. Opin. Struct. Biol. 10 (2000) 229–235.
[2] D.L.D. Caspar, A. Klug, Physical principles in the construction of
regular viruses, Cold Spring Harbor Symp. Quant. Biol. 27 (1962)
1–24.
[3] T.S. Baker, J.E. Johnson, in: W. Chiu, R.M. Burnett, R.L. Garcia
(Eds.), Structural Biology of Viruses, Oxford Univ. Press, New York,
1997, pp. 38–79.
[4] S. Casjens, in: W. Chiu, R.M. Burnett, R.L. Garcia (Eds.), Structural
Biology of Viruses, Oxford Univ. Press, New York, 1997, pp. 3–37.
[5] P. Hopper, S.C. Harrison, R.T. Sauer, Structure of Tomato Bushy Stunt
Virus: V. Coat protein sequence determination and its structural
implications, J. Mol. Biol. 177 (1984) 701.
[6] S.A. Speir, S. Munshi, J. Wang, T.S. Baker, J.E. Johnson, Structures of
the native and swollen forms of cowpea chlorotic mottle virus
determined by X-ray crystallography and cryo-electron microscopy,
Structure 3 (1995) 63–78.
[7] R.W. Lucas, S.B. Larson, A. McPherson, The crystallographic
structure of brome mosaic virus, J. Mol. Biol. 317 (2002) 95–108.
[8] C.H. Hsu, O.P. Seghal, E.E. Pickett, Stabilizing effect of divalent
metal ions on virions of southern bean mosaic virus, Virology 69
(1976) 587–595.
[9] N.L. Incardona, P. Kaesberg, A pH-induced structural change in
bromegrass mosaic virus, Biophys. J. 4 (1964) 11–21.
[10] I.K. Robinson, S.C. Harrison, Structure of the expanded state of
Tomato Bushy Stunt Virus, Nature 297 (1982) 563–568.
[11] J. Kruse, M. Kruse, J. Witz, C. Chauvin, B. Jacrot, A. Tardieu, The
divalent ion-dependent reversible swelling of Tomato Bushy Stunt
Virus and organisation of the expanded virion, J. Mol. Biol. 162
(1982) 393–417.
[12] S.C. Harrison, A. Olson, C.E. Schutt, F.K. Winkler, G. Bricogne,
Tomato Bushy Stunt Virus at 2.9 A resolution, Nature 276 (1978)
368–373.
[13] S.C. Harrison, Virus structure: high resolution perspectives, Adv.
Virus Res. 28 (1983) 175–240.
[14] P. Timmins, D. Wild, J. Witz, The three-dimensional distribution of
RNA and protein in the interior of Tomato Bushy Stunt Virus: a
neutron low-resolution single-crystal diffraction study, Structure 2
(1994) 1191–1201.
[15] J. Perez, S. Defrenne, J. Witz, P. Vachette, Detection and character-
ization of an intermediate conformation during the divalent ion-
dependent swelling of Tomato Bushy Stunt Virus, Cell. Mol. Biol.
(Noisy-le-grand) 46 (2000) 937–948.
[16] C. Chauvin, J. Witz, B. Jacrot, Structure of Tomato Bushy Stunt
Virus: a model for protein–RNA interaction, J. Mol. Biol. 124
(1978) 641–651.
[17] T. Narayanan, O. Diat, P. Boesecke, SAXS and USAXS on the high
brilliance beamline at the ESRF, Nucl. Instrum. Methods Phys. Res.,

R. Aramayo et al. / Biochimica et Biophysica Acta 1724 (2005) 345–354354
Sect. A, Accel. Spectrom. Detect. Assoc. Equip. 467–468 (2001)
1005–1009.
[18] D. Pontoni, T. Narayanan, A.R. Rennie, High-dynamic range SAXS
data acquisition with an X-ray image intensifier, J. Appl. Crystallogr.
35 (2002) 207–211.
[19] D.I. Svergun, C. Barberato, M.H.J. Koch, CRYSOL—A program to
evaluate X-ray solution scattering of biological macromolecules from
atomic coordinates, J. Appl. Crystallogr. 28 (1995) 768–773.
[20] D.I. Svergun, S. Richard, M.H. Koch, Z. Sayers, S. Kuprin, G.
Zaccai, Protein hydration in solution: experimental observation by
X-ray and neutron scattering, Proc. Natl. Acad. Sci. U. S. A. 95
(1998) 2267–2272.
[21] J.F. Conway, A.C. Steven, Methods for reconstructing density maps of
‘‘single’’ particles from cryoelectron micrographs to subnanometer
resolution, J. Struct. Biol. 128 (1999) 106–118.
[22] T.S. Baker, R.H. Cheng, A model-based approach for determining
orientations of biological macromolecules imaged by cryoelectron
microscopy, J. Struct. Biol. 116 (1996) 120–130.
[23] R.A. Crowther, Procedures for three-dimensional reconstructions of
spherical viruses by Fourier synthesis from electron micrographs,
Philos. Trans. R. Soc. Lond. 261 (1971) 221–230.
[24] W.O. Saxton, W. Baumeister, The correlation averaging of a regularly
arranged bacterial cell envelope protein, J. Microsc. 127 (Pt. 2) (1982)
127–138.
[25] M. Van Heel, Angular reconstitution: a posteriori assignment of
projection directions for 3D reconstruction, Ultramicroscopy 21
(1987) 111–123.
[26] W. Wriggers, S. Birmanns, Using situs for flexible and rigid-body
fitting of multiresolution single-molecule data, J. Struct. Biol. 133
(2001) 193–202.
[27] Collaborative, Computational, project, number and 4, the CCP4 suite:
programs for protein crystallography, Acta Crystallogr., D Biol.
Crystallogr. 50 (1994) 760–763.
[28] G.J. Kleywegt, T.A. Jones, xdlMAPMAN and xdlDATAMAN—
Programs for reformatting, analysis and manipulation of biomacro-
molecular electron-density maps and reflection data sets, Acta
Crystallogr., D Biol. Crystallogr. 52 (1996) 826–828.
[29] G. Zaccai, B. Jacrot, Small angle neutron scattering, Annu. Rev.
Biophys. Bioeng. 12 (1983) 139–157.
[30] J. Frank, M. Radermacher, P. Penczek, J. Zhu, Y. Li, M. Ladjadj, A.
Leith, SPIDER and WEB: processing and visualization of images in
3D electron microscopy and related fields, J. Struct. Biol. 116 (1996)
190–199.
[31] M. van Heel, B. Gowen, R. Matadeen, E.V. Orlova, R. Finn, T. Pape,
D. Cohen, H. Stark, R. Schmidt, M. Schatz, A. Patwardhan, Single-
particle electron cryo-microscopy: towards atomic resolution, Q. Rev.
Biophys. 33 (2000) 307–369.
[32] H.E. White, H.R. Saibil, A. Ignatiou, E.V. Orlova, Recognition and
separation of single particles with size variation by statistical analysis
of their images, J. Mol. Biol. 336 (2004) 453–460.
[33] C.A. Pickover, D.M. Engelman, On the interpretation and prediction
of X-ray scattering profiles of biomolecules in solution, Biopolymers
21 (1982) 817–831.
[34] I.S. Gabashvili, R.K. Agrawal, C.M. Spahn, R.A. Grassucci, D.I.
Svergun, J. Frank, P. Penczek, Solution structure of the E. coli 70S
ribosome at 11.5 A resolution, Cell 100 (2000) 537–549.
[35] M.F. Schmid, M.B. Sherman, P. Matsudaira, H. Tsuruta, W.
Chiu, Scaling structure factor amplitudes in electron cryomicro-
scopy using X-ray solution scattering, J. Struct. Biol. 128 (1999)
51–57.
[36] P.A. Thuman-Commike, H. Tsuruta, B. Greene, P.E. Prevelige Jr., J.
King, W. Chiu, Solution X-ray scattering-based estimation of electron
cryomicroscopy imaging parameters for reconstruction of virus
particles, Biophys. J. 76 (1999) 2249–2261.
[37] S.J. Ludtke, J. Jakana, J.L. Song, D.T. Chuang, W. Chiu, A 11.5 A
single particle reconstruction of GroEL using EMAN, J. Mol. Biol.
314 (2001) 253–262.
[38] K.K. Lee, J.E. Johnson, Complementary approaches to structure
determination of icosahedral viruses, Curr. Opin. Struct. Biol. 13
(2003) 558–569.
Recommended


