Western Washington University Western Washington University
Western CEDAR Western CEDAR
WWU Graduate School Collection WWU Graduate and Undergraduate Scholarship
2014
Effectiveness of time-lapse videos as a method to teach rates of Effectiveness of time-lapse videos as a method to teach rates of
surface geological processes surface geological processes
Zachary P. Schierl Western Washington University
Follow this and additional works at: https://cedar.wwu.edu/wwuet
Part of the Geology Commons
Recommended Citation Recommended Citation Schierl, Zachary P., "Effectiveness of time-lapse videos as a method to teach rates of surface geological processes" (2014). WWU Graduate School Collection. 381. https://cedar.wwu.edu/wwuet/381
This Masters Thesis is brought to you for free and open access by the WWU Graduate and Undergraduate Scholarship at Western CEDAR. It has been accepted for inclusion in WWU Graduate School Collection by an authorized administrator of Western CEDAR. For more information, please contact [email protected].
EFFECTIVENESS OF TIME-LAPSE VIDEOS AS A METHOD TO TEACH RATES OF SURFACE
GEOLOGICAL PROCESSES
By
Zachary P. Schierl
Accepted in Partial Completion Of the Requirements for the Degree
Master of Science
Kathleen L. Kitto, Dean of the Graduate School
ADVISORY COMMITTEE
Chair, Dr. Scott Linneman
Dr. Daniel Hanley
Dr. Bernard Housen
MASTER’S THESIS In presenting this thesis in partial fulfillment of the requirements for a master’s degree at Western Washington University, I grant to Western Washington University the non-exclusive royalty-free right to archive, reproduce, distribute, and display the thesis in any and all forms, including electronic format, via any digital library mechanisms maintained by WWU. I represent and warrant this is my original work, and does not infringe or violate any rights of others. I warrant that I have obtained written permissions from the owner of any third party copyrighted material included in these files. I acknowledge that I retain ownership rights to the copyright of this work, including but not limited to the right to use all or part of this work in future works, such as articles or books. Library users are granted permission for individual, research and non-commercial reproduction of this work for educational purposes only. Any further digital posting of this document requires specific permission from the author. Any copying or publication of this thesis for commercial purposes, or for financial gain, is not allowed without my written permission.
Zachary Schierl November 13, 2014
EFFECTIVENESS OF TIME-LAPSE VIDEOS AS A METHOD TO TEACH RATES OF SURFACE
GEOLOGICAL PROCESSES
A Thesis Presented to
The Faculty of Western Washington University
In Partial Fulfillment Of the Requirements for the Degree
Master of Science
by Zachary Schierl November 2014
iv
ABSTRACT
Understanding the wide range of rates at which geological processes operate can be
challenging for introductory geology students, and yet is crucial to understanding how the
Earth’s landscapes evolve over time. Research has shown that student misconceptions in this
area are common. Time-lapse videos can capture processes that cannot be observed by
students in the field and offer promise as a way to improves student understanding of rates of
landscape evolution on certain timescales. This thesis explores the effectiveness of using
time-lapse videos to teach intro geology students about the rates of surficial geological
processes compared to before/after photo pairs depicting the same processes. The effect of
interactivity on the effectiveness of time-lapse is also explored.
One hundred and thirty students enrolled in introductory geology classes at Western
Washington University during Winter and Spring quarter 2014 participated in the study.
Subjects took a pre-test where they made qualitative and quantitative predictions about how
various landscapes would change over time before completing a series of computer based
activities containing before/after photos or time-lapse videos and then a post-test allowing
them to revisit their predictions. The performance of three treatment groups, one using
before/after photo pairs, one using pre-made time-lapse videos, and one where students made
their own custom time-lapse videos using an interactive online program, was compared.
All three groups exhibited large and statistically significant gains in understanding of
geologic rates as measured by score gain from pre-test to post-test although differences in
gains between groups were small and not significant. A number of steps were taken during
study design and data analysis to ensure construct and internal validity. Lack of significant
differences in the performance of the three treatment groups on the assessments suggests that
there may be cognitive barriers to processing the complex and rapid landscape changes
presented in a time-lapse video. This may limit how much students, in particular novice
geology students, can learn from time-lapse videos, even though they inherently present more
information and a more complete picture of a given geological process as compared to
before/after photo pairs.
The results of the study suggest various ways to improve the implementation and
effectiveness of time-lapse videos in the geology classroom, including decreasing frame

v
rates, more guidance on what to focus on when viewing time-lapse videos, inclusion of
annotation and/or narration in the videos themselves, more time to look at the videos, and
better integration of the videos and assessment questions. Extra care is also needed to ensure
that videos explicitly address pre-existing misconceptions held by viewers in order for them
to be effective with a wide range of students.
vi
ACKNOWLEDGMENTS
This thesis would not have been possible without the assistance and support of many
people. Several individuals were instrumental in helping me get the time-lapse data I needed
to make this project possible. Andy Ritchie with the USGS/NPS in Port Angeles provided me
with several years of Elwah River time-lapse images. Ethan Welty provided essential
metadata and other information regarding the Columbia Glacier images and Liz Westby at
the Cascade Volcano Observatory provided the Crater Glacier images.
Thanks to Patrick Griffin who, with his knowledge of the inner workings of the Swift
Creek Landslide Observatory site, was able to modify the interactive time-lapse generator to
meet the needs of this project. Thanks also to my fellow geology graduate students who
assisted me in in testing out assessment items and to all who have taught GEOL 101 and 211
in the past two years for letting me impinge upon your class time to recruit students for my
research.
Thanks to Bernie Housen for agreeing to join my thesis committee at the last minute
and providing helpful feedback. Another member of my thesis committee, Dan Hanley,
provided invaluable mentoring throughout my thesis project, especially with regards to
designing a valid research methodology and helping me understand the statistical techniques
I needed to make sense of my data. And finally, extra special thanks goes to my thesis
advisor Scott Linneman for all of his support and thoughtful comments and feedback on my
project over the past several years.
vii
TABLE OF CONTENTS
Abstract ............................................................................................................................... iv
Acknowledgments ............................................................................................................... vi
List of Tables ...................................................................................................................... ix
List of Figures .......................................................................................................................x
Introduction ...........................................................................................................................1
Time-Lapse Photography ...............................................................................................2
Understanding Rates of Geological Processes ................................................................3
Why Do We Care? .........................................................................................................6
Documented Misconceptions about Rates of Geological Processes ................................7
How Time-Lapse May Help Students .......................................................................... 11
Research on Computer and Multimedia-Aided Learning .............................................. 13
Effects of Interactivity ................................................................................................. 14
Potential Drawbacks of Time-lapse .............................................................................. 15
Methods .............................................................................................................................. 19
Study Population ......................................................................................................... 19
Overview of Study Protocol ......................................................................................... 21
Description of Treatment Activities ............................................................................. 25
Selection of Time-lapse Data Sets: ............................................................................... 26
Preparation of Time-Lapse Data Sets ........................................................................... 30
Image Processing ......................................................................................................... 32
Rendering Videos ........................................................................................................ 35
Creation of Before and After Photo Pairs ..................................................................... 36
Design of Website ....................................................................................................... 36
Assessment Development and Instrument Design ........................................................ 38
Think-Aloud Interviews and Revision .......................................................................... 41
Assessment Length ...................................................................................................... 43
Development of Answers and Rubrics ......................................................................... 44
Anticipated Threats to Validity .................................................................................... 46
Results ................................................................................................................................ 53
Demographics of Study Population .............................................................................. 54
Duration of Treatment Activities ................................................................................. 56
Multiple Choice/Quantitative Questions ...................................................................... 58
viii
Correlations with Predictor Variables .......................................................................... 59
Analysis of Individual Items ........................................................................................ 60
Likert-Scale Questions ................................................................................................. 63
Qualitative Questions................................................................................................... 66
Post-Test Questionnaire ............................................................................................... 70
Interpretation and discussion of results ................................................................................ 73
Summary of Results and Evaluation of Validity ........................................................... 73
Remaining Threats to Validity ..................................................................................... 76
Two Possible Interpretations ........................................................................................ 81
Possible Limitations of Time-lapse: Cognitive Considerations ..................................... 83
Possible Limitations of Time-lapse: Student Enjoyment of Time-Lapse vs. Before & After Photos ................................................................................................................ 86
Possible Limitations of Time-lapse: Misconceptions Arising from Treatment .............. 88
Improvements to Time-Lapse Implementation ............................................................. 93
Suggestions for Instructors........................................................................................... 93
Suggestions for Time-Lapse Creation .......................................................................... 96
Limitations of Study Design ........................................................................................ 98
External Validity: ...................................................................................................... 102
Conclusions ....................................................................................................................... 104
References Cited ............................................................................................................... 107
Tables ............................................................................................................................... 115
Figures .............................................................................................................................. 142
Appendices........................................................................................................................ 169
Appendix A: Selected Results from Preliminary Knowledge Survey of Geology 101 Students (Spring 2013) .............................................................................................. 169
Appendix B: Human Subjects Research Exemption Approval Letters ........................ 174
Appendix C : Informed Consent Documentation ........................................................ 176
Appendix D: Treatment Website Screenshots ............................................................ 178
Appendix E: Directions and Conceptual Questions Provided to Students During Treatment .................................................................................................................. 182
Appendix F: Demographic Questionnaire .................................................................. 183
Appendix G: Pre- and Post-Assessments .................................................................... 187
Appendix H: Post-Test Questionnaire ........................................................................ 201
ix
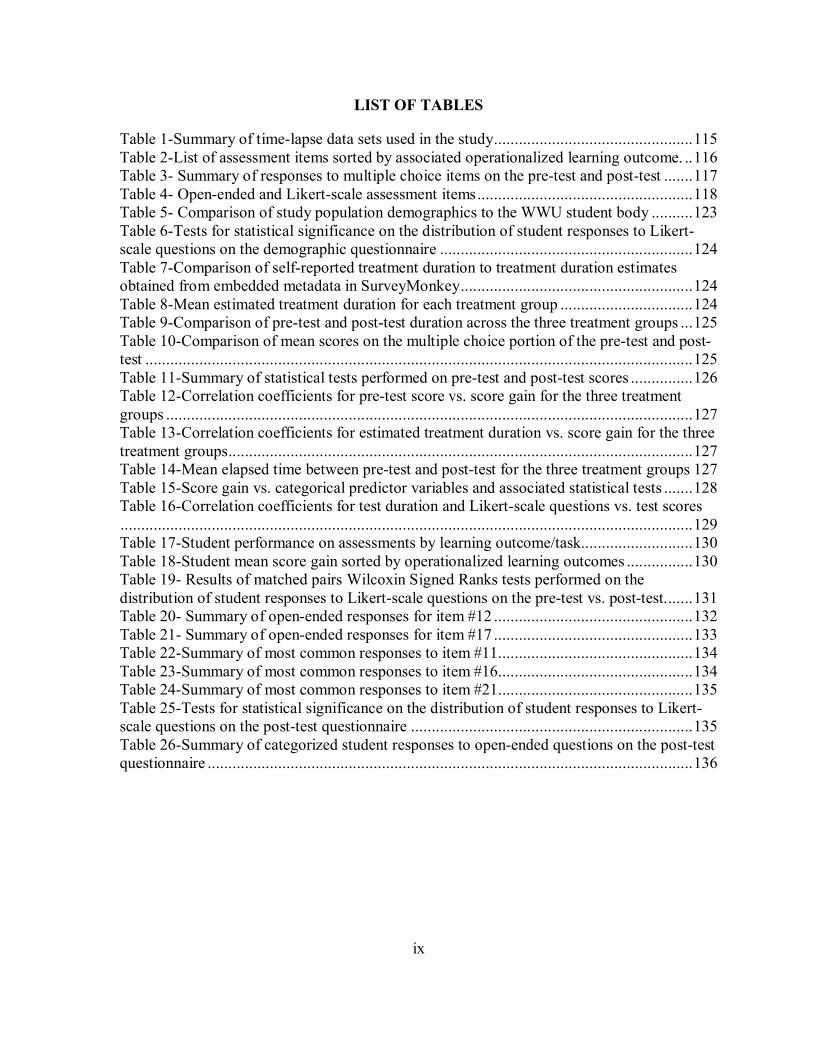
LIST OF TABLES
Table 1-Summary of time-lapse data sets used in the study ................................................ 115
Table 2-List of assessment items sorted by associated operationalized learning outcome. .. 116 Table 3- Summary of responses to multiple choice items on the pre-test and post-test ....... 117
Table 4- Open-ended and Likert-scale assessment items .................................................... 118 Table 5- Comparison of study population demographics to the WWU student body .......... 123
Table 6-Tests for statistical significance on the distribution of student responses to Likert-scale questions on the demographic questionnaire ............................................................. 124
Table 7-Comparison of self-reported treatment duration to treatment duration estimates obtained from embedded metadata in SurveyMonkey ........................................................ 124
Table 8-Mean estimated treatment duration for each treatment group ................................ 124 Table 9-Comparison of pre-test and post-test duration across the three treatment groups ... 125
Table 10-Comparison of mean scores on the multiple choice portion of the pre-test and post-test .................................................................................................................................... 125
Table 11-Summary of statistical tests performed on pre-test and post-test scores ............... 126 Table 12-Correlation coefficients for pre-test score vs. score gain for the three treatment groups ............................................................................................................................... 127 Table 13-Correlation coefficients for estimated treatment duration vs. score gain for the three treatment groups ................................................................................................................ 127 Table 14-Mean elapsed time between pre-test and post-test for the three treatment groups 127
Table 15-Score gain vs. categorical predictor variables and associated statistical tests ....... 128 Table 16-Correlation coefficients for test duration and Likert-scale questions vs. test scores .......................................................................................................................................... 129 Table 17-Student performance on assessments by learning outcome/task........................... 130
Table 18-Student mean score gain sorted by operationalized learning outcomes ................ 130 Table 19- Results of matched pairs Wilcoxin Signed Ranks tests performed on the distribution of student responses to Likert-scale questions on the pre-test vs. post-test. ...... 131 Table 20- Summary of open-ended responses for item #12 ................................................ 132
Table 21- Summary of open-ended responses for item #17 ................................................ 133 Table 22-Summary of most common responses to item #11............................................... 134
Table 23-Summary of most common responses to item #16............................................... 134 Table 24-Summary of most common responses to item #21............................................... 135
Table 25-Tests for statistical significance on the distribution of student responses to Likert-scale questions on the post-test questionnaire .................................................................... 135
Table 26-Summary of categorized student responses to open-ended questions on the post-test questionnaire ..................................................................................................................... 136
x
LIST OF FIGURES
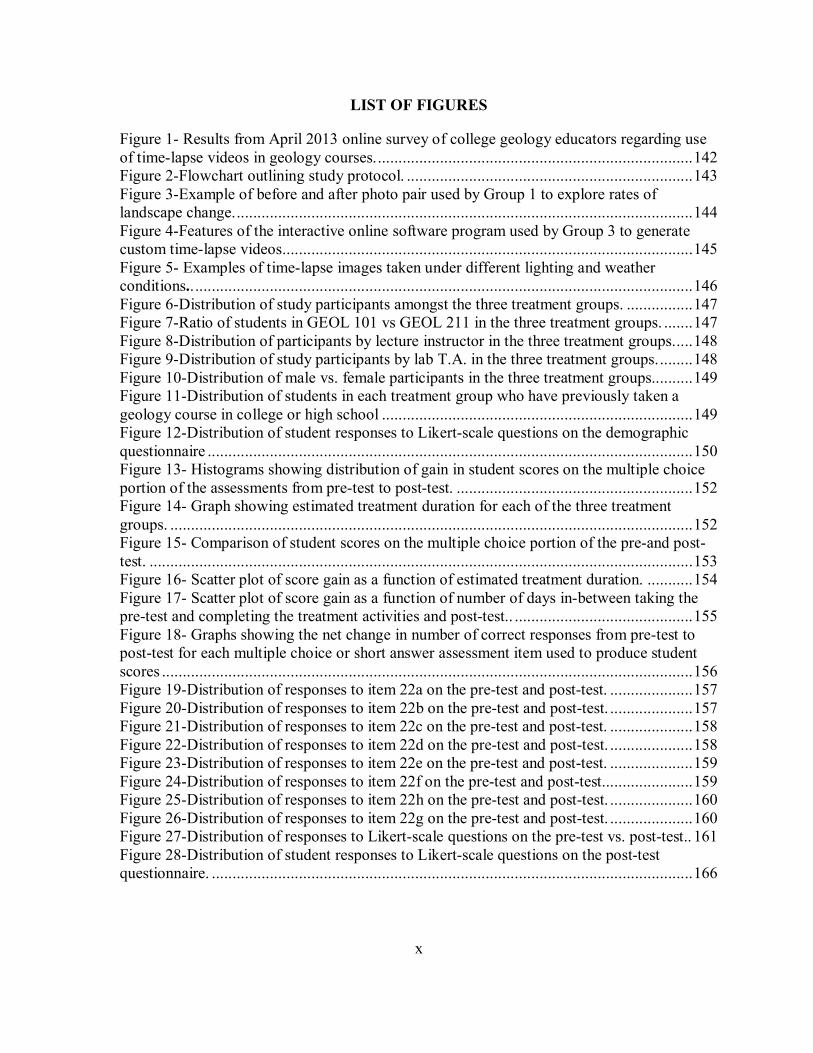
Figure 1- Results from April 2013 online survey of college geology educators regarding use of time-lapse videos in geology courses. ............................................................................ 142 Figure 2-Flowchart outlining study protocol. ..................................................................... 143
Figure 3-Example of before and after photo pair used by Group 1 to explore rates of landscape change. .............................................................................................................. 144
Figure 4-Features of the interactive online software program used by Group 3 to generate custom time-lapse videos ................................................................................................... 145
Figure 5- Examples of time-lapse images taken under different lighting and weather conditions.. ........................................................................................................................ 146
Figure 6-Distribution of study participants amongst the three treatment groups. ................ 147 Figure 7-Ratio of students in GEOL 101 vs GEOL 211 in the three treatment groups. ....... 147
Figure 8-Distribution of participants by lecture instructor in the three treatment groups. .... 148 Figure 9-Distribution of study participants by lab T.A. in the three treatment groups. ........ 148
Figure 10-Distribution of male vs. female participants in the three treatment groups.......... 149 Figure 11-Distribution of students in each treatment group who have previously taken a geology course in college or high school ........................................................................... 149 Figure 12-Distribution of student responses to Likert-scale questions on the demographic questionnaire ..................................................................................................................... 150 Figure 13- Histograms showing distribution of gain in student scores on the multiple choice portion of the assessments from pre-test to post-test. ......................................................... 152 Figure 14- Graph showing estimated treatment duration for each of the three treatment groups. .............................................................................................................................. 152 Figure 15- Comparison of student scores on the multiple choice portion of the pre-and post-test. ................................................................................................................................... 153 Figure 16- Scatter plot of score gain as a function of estimated treatment duration. ........... 154
Figure 17- Scatter plot of score gain as a function of number of days in-between taking the pre-test and completing the treatment activities and post-test.. ........................................... 155
Figure 18- Graphs showing the net change in number of correct responses from pre-test to post-test for each multiple choice or short answer assessment item used to produce student scores ................................................................................................................................ 156 Figure 19-Distribution of responses to item 22a on the pre-test and post-test. .................... 157
Figure 20-Distribution of responses to item 22b on the pre-test and post-test. .................... 157 Figure 21-Distribution of responses to item 22c on the pre-test and post-test. .................... 158
Figure 22-Distribution of responses to item 22d on the pre-test and post-test. .................... 158 Figure 23-Distribution of responses to item 22e on the pre-test and post-test. .................... 159
Figure 24-Distribution of responses to item 22f on the pre-test and post-test. ..................... 159 Figure 25-Distribution of responses to item 22h on the pre-test and post-test. .................... 160
Figure 26-Distribution of responses to item 22g on the pre-test and post-test. .................... 160 Figure 27-Distribution of responses to Likert-scale questions on the pre-test vs. post-test.. 161
Figure 28-Distribution of student responses to Likert-scale questions on the post-test questionnaire. .................................................................................................................... 166
INTRODUCTION
Perhaps more so than any other science, Earth systems science involves timescales
that are often outside the realm of human experience. Only in astronomy and cosmology are
such immense timescales as regularly encountered. The rate at which processes shape our
planet varies considerably (Manduca and Kastens, 2012) and an understanding of the
spectrum of rates over which geologic processes occur is crucial to any student’s
understanding of geology and the evolution of planet Earth. However, the complexity of this
concept, and the fact that it is inherently related to an understanding of “deep time”, itself a
concept deeply engrained in earth science, makes it one of the more difficult concepts for
earth science educators to teach, and for novice earth science students to understand.
The goal of this thesis is to explore the effect of using time-lapse videos on student
understanding of rates of geological processes. Time-lapse videos are useful in that they
allow us to visualize geologic processes that occur too slowly to observe in the field. Time-
lapse videos are being increasingly utilized in the classroom to teach students about rates of
geological processes, yet their effectiveness compared to other more traditional methods that
convey similar information, such as viewing “before” and “after” photographs, has not been
quantitatively evaluated. This thesis project will therefore test whether viewing a series of
time-lapse videos increases student understanding of rates of geological processes compared
to viewing time-series photographs and whether actively involving students in the process of
generating time-lapse videos using an interactive web-page increases knowledge gains over
students who passively view pre-made time-lapse videos.
2
Time-Lapse Photography
For applications in the geosciences, time-lapse photography is an image capture method
in which a series of photos are taken of the same feature or landscape over a period of time,
ideally from the exact same location (Fahnestock, 1966). The photos obtained can be used as
individual frames to produce a time-lapse video, which is defined as a video in which the
individual frames are captured at a slower rate than they are viewed (Fahnestock, 1966). A
typical frame rate for conventional video or film playback is 30 frames per second (fps). In a
normal video, the frames would be captured at an equivalent rate, whereas in a time-lapse
video, the frames will be separated temporally. The result is a video that compresses a long
period of time (minutes, days, weeks, or years) into a short video clip. Time-lapse video is
the opposite of high-speed video, in which the playback rate is slower than the capture rate.
Many geological process occur on time-scales that do not allow them be directly
observed in the field and/or occur in locations that are difficult to physically access
(Manduca and Kastens, 2012). Time-lapse has long been used by geologist to study these
phenomena. Examples include glacial processes (Miller and Crandell, 1959), lava dome
growth (Schilling et al., 2007), landslide monitoring (Belknap and Gilmore, 1987), ripple
migration in sand dunes (Lorenz and Valdez, 2011), volcanic eruptions (Orr and Hoblitt,
2008), and many others. Recent advances in technology have also allowed time-lapse
cameras to be widely utilized among geologists in monitoring processes which occur in areas
that are unsafe for humans (Orr and Hoblitt, 2008).
As time-lapse photography becomes more common, time-lapse data-sets are increasingly
making their way into the geology classroom in order to communicate concepts related to
geologic time and rates of geologic processes. In order to estimate the number of geoscience
3
faculty currently using time-lapse videos in their courses, and gain insight into how they are
being used, I conducted an online survey of college-level geology educators (n=43) in April
2013. The survey was distributed to geoscience faculty nationwide via National Association
of Geoscience Teachers (NAGT) and American Geophysical Union (AGU) Education
Special Interest Group list serves. Among faculty that responded to the survey, 38% stated
that they used time-lapse videos in their classes at least once or twice per semester/quarter
while 71% had utilized them at some point in their teaching career (Figure 1).
While time-lapse videos have been used by geoscience educators for decades
(Fahnestock, 1966; Reams, 1981), their effectiveness as a teaching tool has not been
quantitatively evaluated. Because time-lapse videos allow students to witness slow geologic
processes in accelerated time, they may have promise as a method by which to improve
students’ conceptual understanding of the rate at which surficial geologic processes occur
and the role that these processes play in the long-term evolution of Earth’s landscapes. While
abundant anecdotal evidence suggests that students enjoy viewing time-lapse videos, it would
be naïve to assume that this enjoyment automatically translates to a deep or thorough
understanding of the processes they depict. Oftentimes, student excitement is simply the
result of the novelty factor associated with such technology. In addition, while much research
has focused on best practices for integrating videos and animations into educational
experiences (Mayer, 2001), the best methods for incorporating time-lapse videos into student
learning have not been investigated in detail.
Understanding Rates of Geological Processes
Comprehending the concept of “deep time” is central to any students understanding of
geology and geological processes (Dodick and Orion, 2003; McPhee, 1981), and yet the
4
short nature of human lifetimes make this inherently one of the most difficult concepts for
any student of geology to understand. Understanding deep time is undoubtedly important,
because it is the only way for us to properly frame rates and realize, for example, that erosion
rates or the rate of a glacier are extremely fast compared to the rate of say, renewing of fossil
fuel resources (Zen, 2001). A number of studies have attempted to quantify preconceptions
and misconceptions about geologic time held by elementary school students (Ault, 1982),
high school students (Dodick and Orion, 2003; Cheek, 2012), undergraduate introductory
geology students (DeLaughter et al., 1998; Libarkin et al., 2005; Libarkin, Kurdziel, et al.,
2007; Cheek, 2012), and teachers (Trend, 2001). Some of these studies even suggest that
deep time is so integral to students comprehension of geology as a science that it should be
the first topic covered in introductory geology courses (Libarkin et al. 2007).
While much of the literature on student learning on this topic has been focused on ways
to help students understand the magnitude of geologic time, a related concept has been more
neglected, namely student understanding of the range of rates on which geologic processes
shape the surface of the Earth. The concept of “landscape evolution”, the idea the surface of
the Earth is shaped by a variety of processes that occur on wildly varying timescales was first
laid out by James Hutton in the 18th century (Hutton, 1788). The Earth’s surface as we see it
today is the product of a multitude of complex and interacting processes, each occurring at
different rates in both time and space (Sharp, 1982; Manduca and Kastens, 2012). Rapid
events, such as the 1980 eruption of Mt. St. Helens, can drastically alter the landscape in
seconds, while slower events, such as regional-scale mountain building events, occur slowly
over millions of years and yet produce the topography of large swaths of our planet. To make
things even more confusing for the novice geology student, the rate of a single process, such
5
as a landslide, can vary widely (from 5x10⁻⁷ to 5x103 mm/sec) depending on factors such as
material properties, precipitation, and climate (Cruden and Varnes, 1996). Yet, geologists
frequently refer to all significant slope failure events, at least casually or when simplifying to
meet the needs of an introductory geology class, by the same name: “landslide”.
Geoscience educators have long recognized the importance of ensuring that students
understand the wide spectrum of geologic rates that are responsible for shaping Earth’s
surface (Bailey, 2000; Earth Science Literacy Initiative, 2010). The Earth Science Literacy
Initiative, a consortium of geologists and geoscience educators, has identified a set of crucial
concepts and ideas about earth science that “all citizens should know” called the Earth
Science Literacy Principles. Many of these principles are directly connected with the idea of
rates of geological processes (emphasis added):
“2.7-Over’s Earth’s vast history, both gradual and catastrophic processes
have produced enormous changes.”
“3.4-Earth’s systems interact over a wide range of temporal and spatial
scales. These scales range from microscopic to global in size and operate over
fractions of a second to billions of years. These interactions among Earth’s
systems have shaped Earth’s history and will shape Earth’s future.”
“3.6-Earth’s systems are dynamic; they continually react to changing
influences. Components of Earth’s systems may appear stable, change slowly
over long periods of time, or change abruptly with significant consequences
for living organisms.”
“4.1-Earth’s geosphere changes through geological, hydrological, physical,
chemical, and biological processes that are explained by universal laws. These
changes can be small or large, continuous or sporadic, and gradual or
catastrophic.”
“8.4-Hazardous events can be sudden or gradual. They range from sudden
events such as Earthquakes and explosive volcanic eruptions, to more
6
gradual phenomena such as droughts, which may last decades or longer.
Changes caused by continuous processes such as erosion and land subsidence
can also result in risks to human populations, as with the increased risk of
flooding in New Orleans”
“9.1-Human activities significantly change the rates of many of Earth’s
surface processes. Humankind has become a geological agent that must be
taken into account equally with natural processes in any attempt to understand
the workings of Earth’s systems. As human populations and per
capita consumption of natural resources increase, so do our impacts on Earth’s
systems”
The Next Generation Science Standards also incorporate ideas about geologic rate into
their performance expectations and associated “crosscutting concepts” (NGSS Lead States,
2013):
“ HS-ESS2-1: Develop a model to illustrate how Earth’s internal and surface processes operate at different spatial and temporal scales to form continental and ocean-floor features.”
“Much of science deals with constructing explanations of how things
change and how they remain stable. (HS-ESS1-6)”
“Change and rates of change can be quantified and modeled over very
short or very long periods of time. Some system changes are irreversible.
(HS-ESS2-1)”
Why Do We Care?
Ultimately, understanding geologic time and rates is a crucial skill for not just
geologists but for the general public as well, hence the focus of this study on introductory
geology students, most of whom will not go on to become geologists, rather than more
advanced geology students. The rate of geological processes in relation to human activities
has implications far beyond the geoscience community and therefore the ability to
communicate concepts related to the rate of geological processes to people of all ages and
7
social backgrounds is of the utmost importance (Cervato and Frodeman, 2012). A large
number of contemporary social and political issues involve an element of rates of geological
processes, such as global climate change, recurrence intervals of natural catastrophes such as
earthquakes, hurricanes, landslides, and floods, and the depletion of fossil fuel resources.
Fully comprehension of such issues can only be accomplished by viewing them through the
lens of geologic time and rates (Cervato and Frodeman, 2012).
Documented Misconceptions about Rates of Geological Processes
If understanding rates of geological processes is so important, then an important question
to ask is how well current instructional methods in geology classrooms, in particular
introductory geology classrooms, are addressing these concepts. How well do students
understand rates of geological processes, both prior to enrolling in an introductory geology
class, and after? Furthermore, what aspects of geologic rate are most misunderstood, and
what is it about commonly misunderstood topics that make them so difficult to understand?
All students new to a subject, and even many “experts”, hold preconceptions that may be
naïve or misguided (Reif, 2010), even if they have had previous exposure to the subject at a
lower level, such as high school or middle school Earth Science classes (Libarkin et al.,
2005). Effective teaching involves not only presenting new information, but doing so in a
way that addresses students pre-existing misconceptions so that these ideas do not persist and
inhibit a student’s ability to absorb new material (Halloun, 1985; National Research Council,
2000; Reif, 2010). A large body of literature exists in the geoscience education community
regarding these “misconceptions” (also referred to as “alternative conceptions” or
“preconceptions”) that are held by novice geology students. These misconceptions range
8
from completely inaccurate or unscientific beliefs to partially correct frameworks (Roth,
1990).
Many studies have established that novice geology students at a variety of levels struggle
with comprehending geologic time and rates of change (e.g. (Trend, 2001; Dodick and Orion,
2003, 2004; Libarkin et al., 2007). A study of undergraduate geology students at the
University of British Columbia discovered that both novice and advanced geology students
(geology majors) have difficulty identifying how long geological features take to form, even
if they can correctly identify what a feature is and how it formed (Jolley, 2010). Previous
work has also found that beginning geology students are most comfortable with rates that fall
at either extreme of the geologic spectrum (e.g., extremely fast or extremely slow), but are
less confident when it comes to processes that occur at more intermediate rates (Jolley,
2010). A comprehensive review of the existing geoscience misconception literature complied
by Francek (2013) includes dozens of misconceptions related to the rate of geological
processes that are held by significant percentages of high school and college age students.
Among them are:
Glacial ice moves backwards during glacial “retreats” (Kirkby, 2011)
Glacier ice is stationary during times when front is neither advancing or retreating
(Kirkby, 2011)
Uniformitarianism holds that the rates of processes have been constant (Shea, 1982)
Uniformitarianism holds that only gradual processes have acted and that catastrophes
have not occurred during Earth’s past (Shea, 1982)
Flooding occurs only in the spring, after the winter snow melts (Schoon, 1995)
Although rivers can cut down over time, they do not cut to the sides (Kirkby, 2011)
Idea that human activities cannot affect geological processes like river flow, flood
cycles, etc…(Kirkby, 2011)
9
Flood are rate, atypical, almost unnatural events rather than normal river behavior
(Kirkby, 2011)
Moving water can only change the surface of the earth over long time-periods.
Changes are not happening over short time periods (i.e. a day or a year) (AAAS.,
n.d.)
Erosion takes place only over millions of years (King 2008)
Wind and water only change the surface of the earth during rare events, such as huge
storms (AAAS., n.d.)
It only takes hundreds of years for wind and water to wear away the solid rock of a
mountain (bedrock) so that the mountain is almost flat (AAAS., n.d.)
Landforms look similar today as they did many millions of years ago. For example, a
river on earth has not changed over time (Dove, 1998; Trend, 2001)
Landforms can change in size, but not by the motions of wind and water (AAAS.,
n.d.)
Water can wear away only a small amount of a mountains height (feet or inches) over
millions of years (AAAS., n.d.)
Wind and water changed the surface of the Earth in the past but are no longer
changing the surface of the Earth (AAAS., n.d.)
It only takes a short time (tens of years) for wind and water to wear down the sold
rock of a mountain so that the mountain is almost flat (AAAS., n.d.)
The preponderance of misconceptions related to rates of geological processes has been
proposed to stem from a variety of factors. As mentioned previously, it has been shown that
novice geology students struggle with the large scale of geologic time (Libarkin et al., 2007)
which could simply inhibit student ability to understand rates. Others suggest that these
difficulties may stem from the common perception among those unfamiliar with the
geosciences that rocks and landforms are unchanging on human timescales (Dove, 1998).
Dove (1998) states that novice geology students’ “inability to visualize that rocks, soil and
10
landforms change over time” makes it difficult for these students to fully comprehend how
landscapes evolve over time and that videos and suggests that computer animations could
help address this difficulty.
To further probe student ideas about rates of geological processes, a preliminary survey
of introductory geology students (n=381) at Western Washington University was
administered Winter quarter 2013 during the first week of classes. Three versions of the
survey were distributed to three different sections of GEOL 101 on the first day of the
quarter. Students were asked to list the fastest and slowest geologic processes they could
think of, respond to statements about landscape evolution on a 5-point Likert-scale, and use
before and after pictures of a rapidly moving glacier to compare the relative rate of change of
a tidewater glacier and a mountain range (Appendix A). In order to express their knowledge
about geologic rate, students were asked to use a logarithmic number line representing the
future of the Earth to predict how long they thought it would take for the landscape shown to
them to change “significantly”. While the method of using timelines to have students express
their thoughts about geologic time has been used with success by previous researchers
(Libarkin, Kurdziel, et al., 2007; Clary et al., 2009), many students did not interpret the
instructions as intended and thus data from this question were extremely difficult to interpret.
While this survey was imperfect, the survey nevertheless revealed a number of common
and nearly ubiquitous misconceptions about the relative temporal scale of various geological
processes. For example, many students indicated that they thought the glacier would change
at a slower rate than the mountain range. Students who were shown before and after images
of a glacier taken three years apart were much more likely to think that the landscape would
change significantly in a short period of time than students who were shown a single image
11
of the same glacier. Many students also predicted that “significant changes” in the mountains
in as little as 10 years. Aside from illuminating misconceptions, this survey also served as an
exercise in designing valid assessment questions, which proved to be useful later on during
design of the assessment that would be used for this thesis project.
Various methods have been utilized by geoscience educators in an attempt to help
students gain a better appreciation of the range in rates at which geological processes operate.
Some of these methods include solving mathematical problems (Bailey, 2000), and library
research (Conrad, 2005). Other authors have lamented about the lack of teaching techniques
specifically designed to address inadequacies in how students are taught about geologic time
and rate (Cervato and Frodeman, 2012). While research on misconceptions about rate and
why students hold such conceptions is abundant, little to no quantitative research has been
done on the effectiveness of teaching methods designed to correct these misconceptions and
improve student understanding of the rates of surficial geologic processes.
How Time-Lapse May Help Students
Time-lapse photography is well-suited to capture a variety of surficial geologic process,
in particular, those processes which occur fast enough to result in noticeable landscape
changes during a human lifetime (and thus the ones most likely to have an impact on our
society), but occur too slowly for a student to be able to observe in person in the field.
Examples that were specifically listed by educators who participated in the April 2013 online
survey as processes they have demonstrated in their courses using time-lapse videos include
lava dome growth, lava flows, flooding, coastal erosion, glacier flow, slow-moving
landslides and other mass wasting processes, tidal processes, and stream-channel migration.
12
Using video-editing software, a series of time-lapse photographs can be assembled into a
video clip (a time-lapse video) which can depict several years of photographs in a matter of
seconds or minutes, allowing the viewer to easily view and perceive changes that occurred in
the landscape during this time. The visually arresting nature of time-lapse videos can and has
been used as a means by which to draw the general public’s attention to geological and
environmental issues, such as the time-lapses of rapidly melting glaciers shown in the 2012
documentary Chasing Ice (Orlowski, 2012).
The widespread use of time-lapse video is a relatively recent development and
traditionally, landscape changes that occur on time-scales that would be suitable for time-
lapse photography and video have been presented via the use of time-series photographs
(also known as “before/after photographs”). To illustrate the rate of glacial movement, many
introductory geology textbooks include side-by-side photographs of glaciers taken years or
decades apart (Tarbuck and Lutgens, 2005, p. 539). Interactive “before and after” images
with drag-able sliders are increasingly used in popular media to depict changes in landscapes,
often those associated with natural disasters such as Hurricane Sandy and the Oso landslide
(Esri, 2012; San Jose Mercury News, 2012; Seattle Times, 2014), but also for longer term
landscape changes such as glacial retreat (New Zealand Herald, 2012). NASA has developed
an iPad app and website titled “Images of Change” that uses animated repeat photography
(both satellite imagery and ground-based photography) and side-by-side images to showcase
landscape changes in hundreds of different locations around the globe (NASA, 2014). The
National Park Service has explored the use of animating repeat photography in order to
educate the public about the rate of glacial retreat in Alaskan national parks (Karpilo Jr. et
al., 2006).
13
In theory, an observant student should be able to ascertain the approximate rate of a given
geological process by viewing such before and after images. For example, if the terminus of
a glacier is observed to retreat 100 m in two images taken 10 years apart, then it is
straightforward to assume that the average rate of retreat is 10m/yr. However, a time-lapse
video of the same process offers the opportunity to see the entire process itself in action,
rather than simply a start and end point. The time-lapse video may reveal that the rate of
retreat is not constant over the 10-year timespan or not constant over the course of a year and
may reveal other important information about the process. One of the primary questions this
study seeks to answer then becomes, does a student who views a time-lapse video of a
process gain a better comprehension of the rate at which the process occurs than a student
who views before/after images of the same process?
Research on Computer and Multimedia-Aided Learning
While the effect of time-lapse videos on student understanding of rates of geological
processes has not been quantitatively studied, the use of time-lapse videos to communicate
concepts in other scientific disciplines has been explored with inconclusive results (Schultz,
2007).
A much larger body of literature exists with regard to determining the effectiveness of
computer-based animations and videos (although not specifically time-lapse videos) on
student learning in the sciences. Computers have the advantage of being able to display a
wide variety of information, and can help students visualize abstract processes that can be
difficult to see for themselves (Reif, 2010). Like other forms of computer-based
visualizations, research has shown that students who learn using multimedia devices,
generally defined as a combination of text along with visual aids such as pictures or
14
animation, retain knowledge better, and are more successful in applying their knowledge to
new problems and situations (Mayer, 2001). Other studies have demonstrated that computer
based visualizations and activities are more effective at communicating scientific concepts
than traditional text and static image based instruction (Malone, 2005; Thatcher, 2006;
Klenk, 2012).
With the research supporting the use of multimedia education in mind, it is important to
remember that time-lapse videos differ from other forms of computer visualizations in
several important ways. First of all, a time-lapse video is not a “cartoon”, but rather an actual
depiction of some geologic process, seen precisely as a human observer would view it. A
time-lapse video, while still a computer visualization in the strictest sense of the term, is
based in the real world in a way that few other types of computer animation can match.
Time-lapse is a depiction of the process at the same scale as it occurs in the real Earth, not a
video of a small-scale model of the process. Simulating landscape changes in a laboratory
setting or through theoretical modeling generally suffer from pitfalls related to the scale of
the experiment (Sharp, 1982). As a result, few geologists would dispute that the best way to
learn about a geologic process is to observe it in person (Sharp, 1982). By this reasoning, a
time-lapse video is the next best thing to actually being there in the field to observe the
process firsthand. In the cases of slower processes where this is not possible, a time-lapse
video may be even better than in person observations.
Effects of Interactivity
Computer-based instructional methods also offer the advantage of increased interactivity
compared to a textbook or static photographs. Research has shown that students who use
computer-based learning exercises with greater levels of interactivity perform better and are
15
more engaged when compared to students who use computer-based learning exercises with
less interactivity (Zhang, 2005).
The Swift Creek Landslide Observatory at Western Washington University operates a
website that combines interactivity with viewing time-lapse videos
(http://landslide.geol.wwu.edu/). This site allows anyone with an internet connection to
access several years of time-lapse photographs of the Swift Creek landslide, a slow moving
landslide in Whatcom County, Washington. The website interface allows users to generate
their own custom time-lapse videos of the landslide by allowing control over various
parameters of the video, such as start and end date, frame rate, and video duration. The
impetus behind development of this tool was the idea that students who are actively involved
in the creation of the time-lapse videos they view may have a better sense of the time-span
that the video represents and thus better be able to comprehend the rates of processes
depicted in the video. However, this added complexity could conceivably inhibit the learning
of some students. For example, a student who struggles with new or unfamiliar forms of
technology may find the process of generating their own videos daunting, which may limit
their enjoyment of the activity and limit the amount of useful information they are able to
extract from the videos.
Potential Drawbacks of Time-lapse
While time-lapse videos have promise as a way to increase student understanding of rates
of geological processes, the medium also has some potential drawbacks. One of the issues is
that of availability. The creation of long-duration time-lapse data sets (long enough to show
significant changes in the landscape) is inherently time-consuming and often resource-
intensive. Many of the time-lapse data sets being used for educational purposes in geology
16
courses were originally gathered as part of large-scale research projects; long duration time-
lapse data sets collected explicitly for use in the classroom are essentially non-existent and
obtaining use of others for educational purposes can be difficult, ultimately limiting the
availability of time-lapse videos for student use.
Taking time-lapse data sets and converting them into a form that can be easily utilized by
educators in the classroom also requires significant time and effort. Raw time-lapse data sets
require extensive processing in order to produce a video that clearly depicts the process being
monitored. The amount of time required to do this is likely much more than a typical geology
instructor will be able to manage. A repository of processed and ready-to-use time-lapse data
sets and videos could alleviate this, although none currently exists.
Time-lapse videos are also inherently limited in the types of geologic processes they can
depict. Without the development of camera systems that can survive intense pressures and
temperatures, time-lapse photography is unfortunately currently limited to surficial geologic
processes. Very fast processes whose duration is shorter than the capture interval of a time-
lapse camera are not appropriate for depiction using time-lapse. Furthermore, given that the
longest duration time-lapse sets currently in existence are on the order of decades, surface
processes that occur on the scale of millions of years are unlikely to be effectively illustrated
via this method any time in the foreseeable future. Such extremely long duration processes
are likely best communicated to students via the use of computer animations and models
(Malone, 2005; Thatcher, 2006). However it is still possible to achieve an understanding of
the relative rates of these slower processes with a time-lapse video.
For example, time-lapse videos of the Columbia Glacier in Alaska depict a fast-moving
tidewater glacier that undergoes significant change in the form of large calving events over as
17
little as a few days and large-scale changes in the position of the glacier terminus over
months to years. However, a several year-long time-lapse video of the glacier and
surrounding landscape reveals almost no change in the position of rocks in the foreground
outcrops or the height or shape of a mountain range from which the glacier originated. This
could help reinforce the idea weathering and erosion rates are far slower than the rate at
which the glacier moves, something that may seem obvious to an experience geoscientist for
a novice geology student may be more difficult.
Even if the time-scale of a geologic process is appropriate for capture with time-lapse,
there may still be some barriers to using it to increase student understanding of the process.
The flip-side of the purported advantage of time-lapse mentioned above, the fact that time-
lapse is “real”, is that a time-lapse video will necessarily be much more complex than a
simplified animation or cartoon of the process. The real-world complexity and possible
distractions in a time-lapse video may make it more difficult for students, especially novice
geology students, to focus in on only the most important and relevant information.
If not carefully made, time-lapse videos can also be potentially deceptive in the way that
they present data. For example, a time-lapse video in which a month or two of images is
missing (due to a technical glitch/missing data) can cause slow, gradual changes to appear
more rapid and sudden to the viewer of the video. Time-lapse videos, because they depict the
real world, can also be more complicated than a cartoon animation. As stated by the Earth
Science Literacy Initiative, “Earth’s systems interact over a wide range of temporal and
spatial scales” meaning that multiple processes may be occurring at any given time in any
given landscape. While a cartoon animation often focuses on a singular process for the sake
of simplicity (and at the expense of authenticity), time-lapse videos may depict several
18
processes simultaneously, thus making it more difficult for a novice geology student to
process.
Of the geology educators who participated in the April 2013 online survey who stated
that they rarely or never use time-lapse videos in their courses, the majority cited the lack of
lack of readily available data sets or an aversion to the amount of time that would be required
on their part to create them as the primary reasons for foregoing their use. One respondent
wrote: “the benefit to student learning would need to outweigh the time it takes for me to find
them and the time used in the classroom to show them.” This statement encapsulates the fact
that, while time-lapse video does show promise, the technological challenges and time
required to incorporate them into the classroom merit a thorough study of its effectiveness as
a teaching tool.
19
METHODS
After considering the advantages, disadvantages, and existing applications of time-lapse
in the geology classroom, the research questions this thesis seeks to answer are:
1. Do novice geology students who view time-lapse videos of landscape change develop
a better understanding of rates of landscape change, as measured by their ability to
qualitatively and quantitatively compare the relative rates of several surficial geologic
processes, than students who compare “before and after” photographs of the same
landscape changes?
2. Does actively involving students in the process of creating time-lapse videos further
increase their understanding of rates of landscape change, or does the added
complexity detract from their ability to extract information about rates from the time-
lapse videos?
3. Do novice geology students who use time-lapse videos to learn about rates of
landscape change exhibit more interest and/or motivation to learn about rates of
landscape change than students who use still photographs and other static methods to
explore the same concepts?
A further objective of the study, in part to address question #3, is to develop an online
software interface that can be utilized by students and faculty of all levels to generate custom
time-lapse videos, using any input time-series of photographs.
Study Population
In order to address these research questions, data were gathered from a controlled, quasi-
experimental study using a convenient sampling of students enrolled in undergraduate level
Introduction to Geology (GEOL 101) and Physical Geology (GEOL 211) classes at Western
20
Washington University (WWU) during the 2013/2014 academic year. These two courses are
targeted at students with little to no previous geology experience, with the primary difference
being that GEOL 101 is targeted towards the non-science major, while GEOL 211 is targeted
toward natural science majors and potential geology majors. These two courses also attract a
wide cross-section of the WWU student body; 57.1% of students who received degrees at
WWU during the 2013/2014 academic year took either GEOL 101 or GEOL 211 during their
time at WWU (WWU Office of Institutional Research, personal comm). Furthermore, the
majority of the students enrolled in these courses do not go on to take any additional
geoscience courses at WWU (76.8%), making this course their only formal exposure to
geology in college (WWU O. of I.R., personal comm).
Research has shown that many students in these types of courses have generally had little
to no previous exposure to geology or earth science since elementary school (DeLaughter et
al., 1998; Gilbert, 2012). While some have had exposure to earth science or geology in high
school, it remains that students generally have a poor understanding of geologic time and
rates of geological processes upon enrolling in an introductory geology class (DeLaughter et
al., 1998; Libarkin, Kurdziel, et al., 2007), making this population an appropriate one in
which to test the effectiveness of time-lapse video.
As mentioned previously, time-lapse videos frequently appear in popular media and are
used to communicate information about rates of geologic processes to the public. The
geoscience knowledge of a population of introductory geology students more closely
approximates the general public than would a population of geology majors or advanced
geology students. As noted above, the vast majority of such students will not take any future
geology courses. Consequently, introductory geology students represent a population for
21
whom it is crucial to instill the basic tenets of geologic thinking. Introductory geology classes
are an opportunity to educate a new generation of decision makers and policy makers about
the rates of geologic processes, so that these students have the necessary tools to approach
these issues in a critical and thoughtful manner, regardless of their future career choices.
Overview of Study Protocol
For the study, a pre-test/post-test design and random sampling within the population of
introductory geology students was used (Figure 2). All participants took a pre-test upon
beginning participation in the study in order to quantify their initial knowledge of the
concepts being assessed, and an identical post-test after completing an activity designed to
teach students about the rates of various geologic processes. The assessments (see below for
detailed description of assessment development) focused on student understanding of the
rates and magnitudes of landscape change in four different geologic environments: a
tidewater glacier, a slow-moving landslide, a volcanic lava dome and crater, and a fluvial
system. Time-lapse videos and photos documenting changes in these landscapes over 2-10
years formed the basis for the different treatment activities. Study participants were randomly
divided into three treatment groups in order to compare the relative effects of three different
interactive computer based activities on student comprehension of the rates of landscape
change. Group 1 compared “before and after” photographs of the four landscapes using a
“drag-able” slider. Two separate groups viewed time-lapse videos of the four landscapes,
with one viewing a series of pre-made videos (hereafter referred to as Group 2) and another
creating their own custom time-lapse videos (hereafter referred to as Group 3) using an
online software interface originally developed by the Swift Creek Landslide Observatory and
modified for use in this study.
22
Study design and preliminary testing of treatment activities and assessments took place
between Fall quarter 2012 and Winter quarter 2014. Student participants for the main study
were drawn from the two introductory geology classes during Winter and Spring quarters,
2014. GEOL 101 has an average total enrollment of 480 students each quarter (divided
across four sections with different instructors) while GEOL 211 has a quarterly enrollment of
about 90-100. Because human subjects were used in this research, a Human Subjects
Research Exemption form and research protocol was filed with the WWU Institutional
Review Board (IRB) in May 2013 and approved on May 31 2013 (Appendix B). A revised
version of the protocol was approved on January 14 2014. (Appendix B)
All students enrolled in the two courses were given the opportunity to participate in the
research project, although the fact that participation was completely voluntary was
emphasized to students. During the first week of classes, I gave a short, in-person,
introduction to the research project at the end of class and had interested students sign and
return informed consent forms (Appendix C) prior to leaving class. All students who signed
an informed consent form indicating intent to participate were enrolled in a Canvas (WWU’s
online learning management system) course created for the purpose of managing and
contacting study participants.
Three weeks into the quarter, participants were sent an email with a link to an online
“Predictions Quiz” (hereafter referred to as the “pre-test, but known as the “Predictions
Quiz” to study participants). The pre-test contained questions to collect demographic
information about the participants as well as questions designed to gauge students’ initial
level of understanding of rates of geological processes. Once enrolled in the Canvas course,
and prior to completing the pre-test, participants were randomly assigned into one of the
23
three aforementioned treatment groups. Treatment took place in university computer labs
which were reserved for the purposes of this study. Participants had a two-week window
(during the 5th and 6th weeks of the academic quarter) to sign up for a one-hour time slot
during which they would come to a computer lab to complete the treatment activity and post-
test under the supervision of the researcher. Participants were directed to complete the pre-
test prior to arriving in the computer lab; if they failed to do so, they were given the
opportunity to do so in the computer lab prior to beginning treatment.
All three groups completed the treatment phase by navigating to a website designed for
this study (Appendix D). Three versions of the website were created, one for each treatment
group. Participants were only given access to the webpage for the group they were assigned
to. The websites were secured using passwords that were provided to participants only upon
arrival in the computer labs. Passwords were changed daily throughout the study so that
students could not provide passwords to non-participating students or students in another
group.
Each website was divided into four sections (one for each of the landscapes) which
contained directions (Appendix D, Figure D.1), background information on each landscape
(Appendix D, Figure D.2), and then a series of before/after photos (Appendix D, Figure D.3),
or time-lapse videos (Appendix D, Figure D.4) depicting changes in the landscape over time.
Participants were given a sheet of conceptual questions (the same questions for each group)
to guide their interaction with the time-lapse videos and photos (Appendix E) but did not
have access to the test questions while looking at the photos/videos. This was done
deliberately in an attempt to quantify how the photos and videos affected student
24
understanding of rates of geological processes and how well they were able to retain this
information when taking a post-test a short while later.
Students were not given a prescribed amount of time to spend looking at the time-lapse
photos or videos although the time they spent on the treatment activities was tracked. After
students had finished viewing the time-lapse photos/videos, they were provided a link to the
post-test which contained identical questions to the pre-test as well as a short questionnaire
asking them to reflect on the treatment activities and their participation in the study.
All three groups received identical general instructions, guiding questions, and
background information on the landscapes covered by the activities. The only differences in
the instructions provided related to the type of treatment being administered. For example,
participants in Group 1 were given instructions on how to use the slider to compare the
before/after images, while students in Group 3 were given a short tutorial on how to use the
interactive time-lapse generator. The pre- and post-tests taken by the three groups were also
identical, apart from replacing the word “photo” with “video” for students in groups 2 and 3.
All three groups had the freedom to watch as many videos as they wished, and also to
replay/pause/rewind videos as often as they liked. No group was forced to watch any of the
videos or look at any of the photos.
As the primary researcher, I was present in the computer lab during the entirety of the
treatment and post-test in order to assist with technical difficulties and ensure that students
were following the directions provided and not utilizing outside resources (i.e., Google,
smartphones) to answer assessment questions. All participants were provided with their
choice of a $10 coffee gift card or free movie ticket upon leaving the computer lab as
compensation for their time.
25
Description of Treatment Activities
Group 1: Before/after photo group
Students assigned to this group did not receive any exposure to time-lapse videos within
the context of the study and in some ways served as a “control” group. However this group
still completed treatment activities so it is not a control group in the strict sense of the term
and will not be referred to as such. Students in this group used a series of “before-and-after”
image pairs from the same data sets that were used to create the time-lapse videos used by
Groups 2 and 3. Rather than presenting static side-by-side images, the images were overlaid
and a JavaScript slider was utilized in order to allow students to easily compare the two
images (Figure 3). The images used in these photo pairs were selected so as to match as
closely as possible the periods of time and the changes represented in the time-lapse videos
used by the other two groups. For each landscape, several pairs of photos representing
different intervals of time were presented, allowing students to gauge how much the
landscape had changed after differing periods of time. The capture date of both images in
each pair was clearly displayed, both in the image itself and in accompanying text.
Group 2: Passive time-lapse group
Students in Group 2 viewed a series of 14 pre-made time-lapse videos, ranging in length
from 14 seconds to 2.5 minutes, to explore changes in the four landscapes over time. All
videos were created by myself and contained an embedded date stamp that afforded the
viewer a sense of the length of time represented by the video. Students had the ability to
pause, stop, and re-play all videos. Students could also use the time-slider to manually play
the video or watch a specific part of the video.
26
Group 3: Interactive time-lapse group
Students in Group 3 used an online webpage to create their own time-lapse videos of the
four landscapes. Students in this group were able to manipulate a number of different
parameters that influenced the resulting video. Students were able to choose the starting and
ending dates for the video, the playback duration, frame rate, and whether or not to
selectively include photos from certain times of day (Figure 4). As with Group 2, students in
this group had the ability to pause, stop, and re-play all videos that they created. All students
in this group were given a short (~two minute) tutorial on how to use the time-lapse
generator before beginning treatment. Because the students in Group 3 generated their own
time-lapse videos, they videos they created and viewed are unlikely to have matched the pre-
made videos shown to Group 2 and the photo pairs shown to Group 1.
Selection of Time-lapse Data Sets:
Due to the inherently time-consuming and expensive nature of producing long duration
time-lapse data sets, a number of existing data sets were utilized for this project. Data sets
were chosen with several factors in mind. First of all, potential data sets needed to consist of
a continuous series of images taken across an extended period of time, preferably several
years, in order to produce time-lapse videos that showed substantial changes in the
landscape, and yet changes that would not be readily apparent to a human observer in the
same location. Data sets with large gaps would be inappropriate because they would cause
slow, steady changes to appear to occur rapidly and make it difficult for a novice geology
student to determine how long the change actually took to occur.
Secondly, ideal data sets depicted processes or landscapes that contain features that will
be recognizable to beginning geology students (Jolley, 2010). For example, most students,
27
regardless of their prior geological knowledge, would be able to identify a moving glacier or
volcano in a photograph or video, whereas a time-lapse video depicting lava flow inflation
might be of great use to a volcanologist, but less recognizable and relevant to a novice
geology student. Data sets that depicted locations in the Pacific Northwest were also desired.
Because more than 90% of the student body of WWU is from the state of Washington
(Western Washington University, 2013), data sets that depicted locations in the Pacific
Northwest were desired so students might view the activities as more relevant to their lives.
While a number of existing data sets met these criteria, obtaining access to and
permission to use the raw time-lapse images proved difficult. Ultimately, four time-lapse data
sets were chosen for the project (Table 1):
1. Columbia Glacier, Alaska. Several years of time-lapse data depicting changes in the
Columbia Glacier along the coast of Alaska were made available by the Earth
Observing Laboratory (EOL), a division of the National Center for Atmospheric
Research (NCAR). The Columbia Glacier is a large, fast-moving tidewater glacier
originating in the Chugach Mountains of southern Alaska which flows into Prince
William Sound. Several different surface processes are depicted in the Columbia
Glacier data set. The continuous forward movement of the glacier is perhaps the most
obvious, and seasonal variations in the slip rate of the glacier can be observed. From
the terminus camera, a number of large calving events are evident, although most are
not actually captured in progress due to the extremely quick nature of the events.
Because images were captured hourly, the rise and fall of the tide relative to the
glacier front is also visible. These images also include a rocky outcrop and hillslope
28
in the foreground which allows a comparison between the rate of movement of the
glacier and the much slower rate of erosion.
Time-lapse data is available from several different camera angles and spans
the years 2004-2011, although the highest quality and best temporal resolution was
from the years 2007-2011. Time-lapse images from cameras AK01 and AK02 were
used in this project. Permission to use this data for educational purposes is provided
by NCAR/EOL under sponsorship of the National Science Foundation
(http://data.eol.ucar.edu/).
2. Swift Creek landslide, Whatcom County, Washington. Time-lapse data captured
by the Swift Creek Landslide Observatory at Western Washington University
depicting the movement of the Swift Creek Landslide dates back to 2004. The Swift
Creek landslide is a deep-seated, slow-moving (~3-4 m/yr) landslide in highly
weathered serpentinite bedrock on the west side of Sumas Mountain in the foothills of
the Cascade range in Washington state (Bayer and Linneman, 2011). The time-lapse
camera used for this project is aimed at the toe of the landslide where shallower
movement can exceed 40m/yr (Bayer and Linneman, 2011). Movement of landslide
material is highly seasonal, and the time-lapse cameras readily capture the increase
rate of movement of the landslide in the winter months when precipitation is more
plentiful and the landslide slope is saturated (McKenzie-Johnson, 2004). The time-
lapse cameras also show that movement of the material is continuous, yet slower,
during the dry summer months. The time-lapse camera also shows the differential rate
of movement across the landslide, with finer grained material in the foreground
moving at a significantly faster rate than an area of boulders in the background.
29
3. Elwah River Restoration Project, Olympic Peninsula, Washington. Using a series
of webcams, the National Park Service and United States Geological Survey has
captured time-lapse data sets depicting the decommissioning of the Elwah and Glines
Canyon Dams on the Elwah River SW of Port Angeles, Washington. 10 webcams
have monitored the changes that have occurred from mid-2011 to the present along
various stretches of the river as Lake Aldwell and Lake Mills, the reservoirs formerly
impounded behind the dams, have been drained and the Elwah River re-establishes its
course. These data sets depict a rapidly changing fluvial system and the restoration of
a natural riparian ecosystem that began to be altered when the Elwah Dam was built
in 1910. While this data set is shorter than the others, it offers an opportunity for
students to see the effect of human activity on the rates of geological processes. Date
from the Lake Aldwell Delta and Lake Mills Delta cameras were used in this project.
The Elwah River cameras capture typical patterns of river channel migration,
albeit accelerated to some degree by the removal of the dams. Time-lapse videos
made from these cameras show the large variations in river discharge over the course
of a year, and how the rate of riverbank erosion and channel migration is correlated
with higher discharge. The greater rate of erosion along cut banks (outside bend of a
meander) is also clearly visible. Some small shrubs and trees in the foreground of the
images also provide context for the rate of changes along the river. Growth in the
vegetation can be observed over several months to years, and the vegetation grows
enough in several years that it begins to obtrude the field of view near the end of the
videos.
30
4. Mt. St. Helens, Washington. The United States Geological Survey maintained a
webcam from 2007-2011 which monitored lava dome growth and growth of the
Crater Glacier in the summit crater formed by the 1980 eruption of Mt. St. Helens.
These images were made available via CD-ROM by the Cascade Volcano
Observatory. USGS images are in the public domain, allowing them to be used in this
project.
Preparation of Time-Lapse Data Sets
All of the raw time-lapse data sets acquired for use in this project required extensive
editing and processing in order to obtain a product that was useful for educational purposes.
Because one of the goals of this project was to create several time-lapse data sets suitable for
use in the introductory geology classroom, what follows is a description of the process used
to process and edit the time-lapse data sets, as well as the procedure used to create the time-
lapse videos and the webpages used for treatment.
Acquiring images: Two of the four time-lapse data sets used in this project were no
longer capturing images at the time of the study (Columbia Glacier and Crater Glacier) and
thus the data sets were obtained in their entirety via FTP and a CD-ROM respectively.
Images from the Elwah River and Swift Creek landslide time-lapse cameras were still being
actively collected as of March 2014. Data from the Elwah River cameras were originally
obtained via hard drive in January 2013. Updated imagery was obtained via the internet using
a modified version of the Linux script “wget”. This script takes advantage of the fact that
each image in the Elwah River data set can be accessed via a unique URL. A text file
available online lists the unique path suffix for each image which can be appended en masse
to the base URL using Microsoft Excel. Once this is done, the full URL for all images can be
31
copied into a .txt file which can be referenced in the “wget” command line allowing the
script to automatically download the image found at each URL to a user-specified directory
on a local hard drive. Images were collected in this manner through January 14 2014 for use
in the study. Updated images of the Swift Creek landslide were obtained from a hard drive in
the WWU Geology Department.
Data reduction: With the exception of the Crater Glacier data-set, the image sets
obtained consisted of all of the raw images obtained by the time-lapse cameras. (Images in
the Columbia Glacier data set had been time-corrected and compressed). Raw images, which
varied considerably in original resolution, were downsized to a universal width of 800 pixels;
sufficiently large enough for web viewing and video creation and small enough to maintain
manageable file sizes, a necessity given the large quantity of images in each data set. All
images were renamed using “date created” metadata embedded in the images. A consistent
file naming scheme was created in the form of YYYY-MM-DD_HH_MM_SS.jpg. All
images were renamed using the free online utility “Bulk Rename Utility”.
Many of the raw images (as much as 20% in some data sets) were unusable due to
darkness or equipment error/failure. While time-lapse systems are generally designed to only
take photos during daylight hours, the sensors that accomplish this are not foolproof and
often the camera will take photos during periods of darkness, especially if moonlight is
present, leading to a number of useless images which must be removed before making a
video. Many images also contain fog, rain drops on the lens, or snow accumulations in front
of the lens, all of which can partly or wholly obscure the view of the target landscape (Figure
5). Time-lapse videos made with such images included can be very distracting to watch, so
for the sake of producing watchable videos, images in which the target landscape was not
32
visible due to any combination of the above reasons (and less commonly lens flare,
extremely high dynamic range, insets, or human hands/other appendages) were removed
from the data set.
Image Processing
The most significant challenge encountered during data processing was dealing with the
inherently large dynamic range (ratio between maximum and minimum light intensities in a
digital image) present in many of the images. Any time-lapse camera recording long-term
(months to years) changes in a landscape will be operating in a wide range of weather and
lighting conditions. Many of these lighting conditions are not ideal for capturing photographs
of a landscape. For example, overcast days generally produce the best photos, as shadows are
minimal and the landscape is fairly evenly illuminated. Potentially obscuring/distracting
shadows can be prevalent on sunny days and the shadows change in length and angle as the
Sun traverses the sky over the course of a day. Images taken at sunset and sunrise can exhibit
extremely high dynamic range; if the camera exposes for the sky, the foreground landscape is
likely to be underexposed by several stops, but if the camera exposes for the landscape, the
sky can become so overexposed that light can bleed into the foreground ruining the image.
Compositing images that exhibit a wide range in brightness’s into a time-lapse video
leads to a phenomenon known as “flicker”, where the rapid shift from lighter to darker
images over the duration of the video can make the animation difficult to watch. Steps to
prevent flicker can be taken when gathering short-duration time-lapse data sets (although a
small amount of flicker is nearly unavoidable), but is difficult to control for in extremely
long-duration time-lapses where the camera is operated remotely and must be set to
“AUTO”. Much of the image processing undertaken in this project focused on attempting to
33
minimize the dynamic range present in the raw time-lapse images; in other words,
brightening the shadows and dimming the highlights in order to produce an image that is
more evenly toned. Adobe Lightroom was utilized for its ability to apply the same
adjustments to thousands of images simultaneously. Lightroom’s “Auto White Balance” and
“Auto Tone” features were applied to nearly all of the raw images which eliminated the need
to go through every single image by hand. In cases where the Auto commands did a poor
job, thousands of individual images were edited by hand to achieve the desired result. While
obtaining a video completely free of flicker given the high dynamic range present in the data
sets is impossible, the steps taken above did result in noticeably easier to watch and more
aesthetically pleasing videos compared to videos made using the raw images. Editing each
individual image by hand would likely have produced even better results, however, given the
large size of many of the data sets (10’s of thousands of images) this was not feasible in this
project. For comparison, the time-lapse videos produced for this project are comparable in
terms of flicker to those produced by the Extreme Ice Survey using the same raw images of
the Columbia Glacier (Extreme Ice Survey, 2009)
Another technique for combating the dynamic range issue is to make time-lapse videos
using only images from a certain time of day. In order to compress long durations into short
videos at normal frame rates, it is often impossible to include all the images from a given
date range; some must be removed. By including only images from a certain time of day (say
11-1 for example, when the Sun is nearly overhead and shadows are at their smaller), the
dynamic range issues and distracting shadows associated with the change in position of the
Sun over the course of the day are minimized. While dynamic range issues due to changing
weather are still present, time-lapse videos made in this manner often look much “smoother”
34
than ones where images from all hours of the day are incorporated. The ability to selectively
choose images from a certain time-of-day is one of the feature that is present in the online
time-lapse generator used by Group 3, and thus was used to make several of the videos
shown to Group 2 as well.
Changes in camera angle during data collection also presented challenged during image
processing. In some cases, these changes were deliberate, to keep up with a rapidly retreating
glacier for example, and in other cases the result of wind or other factors moving the camera.
Regardless of the reasons, using images that are not all taken from exactly the same spot to
make a time-lapse video causes there to be abrupt jumps in the position of features in the
landscape. In some ways large changes are almost better than small ones, because a large
shift is clearly the result of the camera being moved, whereas small shifts can be interpreted
as an actual change in the landscape.
Extensive processing was done in Photoshop and Lightroom to match up the perspective
of the images as best as possible. This involved cropping, rotating, and scaling images but
not all shifts in camera position could be entirely mitigated. Some of the more complex shifts
involved both translational and rotational components of movement, in many cases also
accompanied by a change in scale, likely due to either a lens change or a change in the zoom
level of the camera lens. The parallax errors associated with the position of the foreground on
these more complex changes could often not be completely eradicated, an important factor to
consider given that a slight change in the positioning of the foreground or background could
be perceived by a novice geology student as an actual landscape change.
In all data sets except for Elwah River, the “Mogrify” plug-in for Lightroom was used to
overlay a datestamp in the upper right-hand corner of the image. The Mogrify plugin uses
35
imbedded metadata to embed the month, day, and year that each image was taken. Ideally all
four data sets would have contained an identical date stamp, however the Elwah River
images did not have metadata embedded in the images but did have an existing date stamp,
which although smaller and a different font, was sufficiently large enough to see in the time-
lapse videos.
Rendering Videos
Once editing of the raw images was complete, sequences of JPEG images were imported
into Adobe AfterEffects for video creation. It should be noted that AfterEffects contains a
variety of plug-ins that can perform many of the same dynamic range-reducing functions that
were performed in Lightroom, thereby reducing flicker in the videos. However these
functions could not be utilized because of the desire to have the videos used by Group 3
(using the time-lapse video generator) be as identical as possible to the videos viewed by
Group 2. The online time-lapse generator relies solely on input images to produce a video; it
cannot apply any effects to the images themselves as is possible via AfterEffects. For this
reason, all editing done with the intent of minimizing the high dynamic range present in the
raw images had to be done at the individual image level so that the edited images could be
loaded into the time-lapse generator, thus affording both Groups 2 and 3 the benefit of videos
made with equivalently improved images.
A frame rate of either 30 or 60 frames per second was used for all videos, depending on
the desired duration of the video and the number of raw images to include. All time-lapse
videos were exported as .mp4 files, a common compressed video file format that had the
advantage of relatively small file size, and wide compatibility with common internet
browsers such as Google Chrome and Mozilla Firefox.
36
Creation of Before and After Photo Pairs
Preparing the before and after images pairs for Group 1 took place after rendering of the
time-lapse videos. Pairs of photos were chosen so that the information presented was as
similar as possible to the time-lapse videos. While significantly less time-intensive than the
creation of the time-lapse videos, selecting and making the image pairs still involved some
challenges, most of which revolved precisely aligning the images so that viewers do not
interpret slight shifts in image alignment as actual landscape changes (Karpilo Jr. et al.,
2006). The slider utilized a free jQuery script that was obtained from
http://www.catchmyfame.com/catchmyfame-jquery-plugins/jquery-beforeafter-plugin/ which
I then modified in order to meet the needs of this project.
Design of Website
Because the entirety of the treatment would take place online, attention was paid to
research on designing effective online learning experiences during the development of the
website (Siragusa et al., 2006). The treatment webpages were written using HTML5 and CSS
and hosted on my university-provided network storage space. This method proved fast
enough for videos to load with little or no lag time even when multiple users accessed the
same video simultaneously.
Upon arriving at the website (from Canvas), participants were presented with a welcome
page which included instructions for the type of treatment they were about to undertake
(Appendix D, Figure D.1). Site navigation was kept simple; four buttons along the top of the
screen corresponded to each of the four landscapes. Students could easily click on these
buttons to move between landscapes. Each landscape page began with a brief description of
the landscape and any background information needed to interpret the changes occurring in
37
the landscape (Appendix D, Figure D.2). An annotated photo of each landscape was also
included, with labels identifying the different geological features in the landscape, and scale
where possible (Appendix D, Figure D.2). In some cases, the scale of the photograph varies
too widely (scale is different in the foreground than in the background) to include a graphical
scale, and a verbal scale was provided instead that gave the dimensions of a particular
reference feature in the landscape (i.e., the height of the glacier terminus is 50 meters).
Comparisons to recognizable objects were also included in order to help students internalize
a particular distance (i.e., 10 meters is approximately the length of a city bus). At the top of
the page was a “Home” button that allowed students to return to the directions/welcome page
if necessary and a button titled “Take Quiz” which students were instructed to click on after
they had finished looking at the time-lapse photos/videos which would then take them to the
post-test (Appendix D, Figure D.1).
Surveys of online learners have shown that the organization and structure in which
information is presented on an educational webpage is extremely important in facilitating
learning (Siragusa et al., 2006). Visual elements (photos and videos) are generally preferable
to large quantities of text on webpages devoted to learning. Care was taken to make
navigating through the pages as simple as possible. The site was beta tested for usability prior
to implementation by a number of geology students and faculty. The site was also tested for
compatibility on both Firefox and Chrome, the two browsers available on the computer that
would be used by participants to complete treatment. Another feature of the website was
hyperlinks to a glossary (hosted on Canvas) that explained any geologic terms that
participants might be unfamiliar with. The definitions in this glossary were taken from
introductory geology textbooks, and augmented as needed.
38
Assessment Development and Instrument Design
Because a validated and reliable assessment for probing student understanding of rates of
landscape changes does not currently exist, a primary outcome of this project was to develop
an assessment tied as closely as possible to the specific processes depicted by the chosen
time-lapse data sets.
The first, and arguably most important, step in designing an effective assessment
instrument is to identify desired learning outcomes. These learning outcomes outline broad
themes that study participants would ideally have a good understanding of after interacting
with the time-lapse photos and/or videos. A list of desired learning outcomes was developed
by reviewing the aforementioned Earth Science Literacy Principles, a variety of introductory
geology textbooks, and through conversations and revision with geology faculty at WWU:
Earth is continuously changing.
Earth changes according to physical laws. These changes may be small or large,
continuous or sporadic, and gradual or catastrophic.
Earth’s surface is shaped by geologic processes that occur at different rates.
The “rate” of a geologic process is defined as the amount of change we observe per
unit time.
Geologic processes can occur rapidly, with consequences for living organisms.
Many geologic processes occur too slowly for a human to observe in person, yet can
have consequences for humans and society.
Humans can change the rate at which geologic processes occur.
The rate of change for a given geologic process is not always constant. It may change
based on geographic location, climate, season, tectonic stress, and other factors.
Landscapes represent a balance between processes that form (such as mountain
building or volcanism) and processes that destroy (such as erosion and weathering).
In certain situations, geologists can use the rate of a process to predict what a
landscape might look like in the future.
39
While creating a list of learning goals is useful for guiding the initial phases of
assessment design, assessing “conceptual understanding” of broad statements such as the
ones above can be difficult unless the desired learning outcomes are transformed into clearly
stated and observable performance goals (Reif, 2010). In other words, the above concepts
must be operationalized; we must “specify what one would actually need to do to determine
how well the desired performance has been achieved” (Reif, 2010). Once development of the
time-lapse photos and videos was complete, a list of operationalized learning goals was
developed (Table 2). This list of tasks takes the learning outcomes above and categorizes
them into practicable skills that can more easily be measured via an assessment.
Using best practices for writing assessment items found in the literature (Frey et al.,
2005; Taylor and Smith, 2009; Libarkin and Ward, 2011), a 22-item (plus sub-items)
assessment was developed containing a variety of different question types including multiple
choice, matching, Likert-scale, and open-ended (Appendix G). The integration of both
quantitative and qualitative questions, a so called “mixed-methods” approach, was used
because it offers the greatest combination of statistical power and insight into student
understanding (Johnson and Onwuegbuzie, 2004; Kortz et al., 2011).
Each assessment item was tied to one or more of the learning outcomes presented in
Table 2. Most questions specifically referenced the landscapes presented in the time-lapse
videos and photos; however, general questions probing student ideas about rates of
geological processes were also included. Multiple choice items (Table 3) made up the
majority of the questions on the assessments due to ease with which they can be scored and
used to produce a numerical score for each participant which can then be statistically
40
analyzed. Furthermore, well-written multiple choice questions have been shown to be good
indicators of student understanding, especially when their development is informed by
knowledge of student preconceptions on the topic (Sadler, 1998; Bardar et al., 2006;
Libarkin, Anderson, et al., 2007; Libarkin and Ward, 2011). In order to most effectively
reveal changes in student understanding, assessments should incorporate preconceptions that
are held by a significant number of the study population. Knowledge of these preconceptions
can come from a variety of sources (Libarkin and Ward, 2011). In this study, personal
experience, previous literature on common misconceptions held by novice geology students
(Francek, 2013), answers from the preliminary survey of GEOL 101 students administered
during Spring 2013 quarter, and student comments during think-aloud interviews held during
assessment design (see next section) were relied upon extensively to guide assessment design
and generate multiple-choice distractors.
A number of qualitative or open-ended questions (Table 4) were also included because
they can offer additional insight into student thoughts than even a well-designed multiple-
choice item, although the process of coding and categorizing responses takes longer and can
be more subjective. In this case, the intended sample size was small enough (a target of 180
at the time of assessment development) that the amount of time required to code and classify
qualitative responses was outweighed by the additional insight that would be gained. Several
multiple-choice items included an add-on open-ended text box that asked students to explain
their rationale for choosing a particular multiple-choice option. Finally, a series of Likert-
scale questions (Table 4) were included to probe student agreement or disagreement with
various statements about rates of geological processes.
41
Note that several assessment items were designed simply to elicit student’s thoughts or
level of understanding about a particular topic and do not have a “correct” answer. Item
numbers which do not have a correct answer are indicated by bold text in Table 2.
A 13-question demographic questionnaire was added to the beginning of the pre-test
(Appendix F) to collect basic information about participants. A short questionnaire with
Likert-scale and open-ended questions was added to the end of the post-test (Appendix H) in
order to probe student attitudes towards the treatment activities, such as their level of comfort
using the software interface, how much they enjoyed the activity, and to what extent they
gave their best effort to answer the questions.
The pre- and post- versions of the assessments were identical apart from changing the
tense of some questions where appropriate. The versions of the assessments administered to
each of the three groups were also identical, apart from the substitution of the words “photos”
and “videos” depending on the type of treatment each group was to receive. SurveyMonkey
was used to distribute the assessments and tabulate responses. All assessments were
anonymous at the request of the IRB. Participant’s pre- and post-tests were matched with
each other by having the participant enter the last four digits of their student ID number at the
beginning of the test. Because I did not have access to students’ full ID numbers, this method
of tracking ensured anonymity while allowing student responses on the pre- and post-tests to
be matched with each other.
Think-Aloud Interviews and Revision
It is well established that students do not always interpret test questions, especially
multiple choice questions, as intended by the test-writer or researcher (e.g., Harlow and
Jones, 2004). Therefore, establishing the communication validity of items (i.e., does the test
42
taker interpret the question in the same way as intended by the test-developer?) is a crucial
step in designing a valid assessment (Clark and Libarkin, 2011). Once a draft version of the
assessment was created, a series of one-on-one interviews were conducted with 25 student
volunteers during Fall 2013 quarter in order to test the communication validity of assessment
questions so that revisions could be made (Beatty and Willis, 2007; Libarkin and Ward,
2011). Approximately 25 students from GEOL 101, GEOL 211, and an earth science
education course participated in 20-40 minute long cognitive “think-aloud interviews” as part
of this study. In these interviews, students were given a draft copy of the assessment and
asked to read aloud each item along with any multiple choice answers before proceeding to
answer the question. Students were encouraged to verbally describe their thought process
while answering each question.
These interviews served several purposes. First, they allowed the text of the questions to
be revised, in some cases significantly, in order to make questions clearer and less
ambiguous. A key tenet of designing effective assessment questions is ensuring that the
language used is appropriate for the study population (Clark and Libarkin, 2011) so any
terms that were not well understood by introductory geology students were removed.
Secondly, the interviews provided substantial insight into the item validity of the assessment
items. Careful attention was paid to student responses to ensure that students who identified
correct answers were able to do so because they truly understood the concept associated with
the item, rather than simply guessing. Finally, the interviews provided further insight into
existing preconceptions about rates of geological processes held by the study population.
Some of the preconceptions uncovered during the interviews were subsequently incorporated
into the assessments as multiple choice item distractors.
43
Revision of assessment items was ongoing throughout the two weeks during which
interviews took place. As a result, four different versions of the assessment were tested over
the course of the interviews. Items which, even after multiple revisions, continued to exhibit
concerns related to communication validity or item validity were removed from the final
version of the assessments.
Following the interviews, text boxes were added to several of the multiple-choice items
on the final version of the assessments. These test boxes asked participants to “Please briefly
explain why you chose the answer that you did”. Adding these text boxes served as a further
check on the validity of the items and allow additional qualitative insight into why students
chose a particular multiple choice answer (Reif, 2010).
Two forms of the assessment were piloted during the interviews: a paper version, and a
computer-based version using SurveyMonkey, in order to see which version students
expressed greater comfort using. While student comments were varied as to whether they
preferred taking electronic or paper assessments, ultimately most interview participants
expressed satisfaction with whichever method (paper or online) they had been randomly
selected to use during the interview. Several of the interview volunteers were also asked to
complete a beta version of the treatment exercises which involved viewing a series of time-
lapse videos or photos and then briefly revisiting their answers to the corresponding
assessment items. Several geology graduate students and non-geologists also took beta
version of the assessments and offered important comments and perspectives.
Assessment Length
Yet another function of the think-aloud interviews was to gauge the amount of time that
would be required for students to complete the assessments. Managing the total cognitive
44
load on study participants was a major concern during the assessment and study design
process. Test fatigue has been a documented issue in similar studies where students subjected
to treatments and tests lasting more than an hour have expressed that they did not give their
full effort because they became fatigued or sick of taking the test (Malone, 2005). As a result,
the desire was that the pre-test would be able to be completed by a typical student in less than
30 minutes, in order to avoid test fatigue and decrease the overall cognitive load required by
participants (Malone, 2005; Reif, 2010). Treatment activities were also designed to be
completed in a relatively short amount of time (20-45 minutes) so that the total time
commitment required by participants would be between 60-90 minutes, split into two
different sessions. While less data will be produced with a shorter assessment, the data will
be of a higher quality if participants are remain happy and engaged through the entire study.
Development of Answers and Rubrics
Correct/acceptable answers to assessment items were determined by reviewing the
corresponding time-lapse videos, as well as by consulting current geologic literature on the
rates of the different processes depicted in the videos. Correct/acceptable answers are
highlighted in bold in Table 3.
It is important to note that the rate of many of the processes which students viewed in the
time-lapse videos can vary widely depending on various factors. Landslides are a good
example. Depending on the geologic setting, landslides can occur quickly or slowly. Because
assessment questions referred specifically to the processes observed in the videos/photos, and
because the goal of this project was to test how much information students could extract from
the videos/photos, acceptable answers were considered to be those that reflected the rate of
the process as shown in the videos/photos. For example, while landslides can occur in
45
seconds or minutes, such an answer would be considered incorrect on the questions that ask
about the rate of the Swift Creek landslide, which moves at a much slower rate. Below is a
list of the range of acceptable answers for each process depicted in the time-lapse videos
(item #22a-h) along with any external references that were used to establish the acceptable
range. Because students had limited time to view the time-lapse videos, a range of acceptable
answers is allowed for each.
The tide going in and out once: Hours (Tarbuck and Lutgens, 2005)
The formation of a volcanic lava dome: Months, Years (Smith et al., 2011)
(Holland et al., 2011)
Complete wearing down of a mountain range by weathering and erosion:
Millions of years, billions of years (Egholm et al., 2013). Note: because this process
occurs on time-scales not easily capture with time-lapse, the goal here was not to test
what students knew about long-term erosion rates, but rather to test whether students
noticed that large-scale weathering and erosion of the mountain range was NOT
visible in the time-lapse, and thus were able to deduce that the rate is much slower,
relatively speaking, than any of the other processes covered on the assessment. While
the ideal outcome would be for students to understand the upper limits of the process,
since weathering and erosion of the mountain range is not depicted in the time-lapse,
there is no way for students to differentiate between millions and billions of years in
this exercise. For this reason, any student that answered millions or billions of years
was considered to have answered the question correctly, even though the exact rate of
weathering and erosion of a mountain range can vary widely.
46
Uplift of a large mountain range from a flat plain: Millions of years, billions of
years (Burns and Surveys, 1991) (Jolley, 2010). See previous note for explanation.
Soil, boulders, and trees moving downhill in a landslide (Swift Creek landslide):
Weeks, Months, Years (Bayer and Linneman, 2011)
A river channel changing its course: Days, Weeks, Months, Years (Draut et al.,
2008) (Draut et al., 2011).
A large piece of ice breaks off a tidewater glacier forming an iceberg: Seconds,
Minutes (Orlowski, 2012).
A tidewater glacier moves 10 meters: Hours, Days (Walters and Dunlap, 1987)
(Ahn and Box, 2010).
Anticipated Threats to Validity
In any experimental study, a major concern is the “validity” of the study design, which,
broadly speaking, refers to refers to the appropriateness of the inferences that are made using
obtained data (Shadish et al., 2001; Gay and Airasian, 2003). It is important to consider
possible threats to validity prior to implementation of the study in order to reduce the number
that may have an effect on the final results (Shadish et al., 2001). While no experiment can
avoid all possible threats to validity, a careful analysis of those that are most likely to be
important in the context of this study was a crucial element of the study design process.
Shadish et al. (2001) identifies four main types of validity: internal validity, statistical
conclusion validity, construct validity, and external validity:
Internal Validity: Internal validity (sometimes referred to as “conclusion validity” in the
literature) refers to whether a causal link between a dependent and independent variable can
be reasonably inferred and is potentially the most important type of validity to consider in
47
this type of study (Shadish et al., 2001). To claim internal validity, it needs to be shown that
there is no other plausible explanation for any observed relationship between the independent
and dependent variables. In this study, the independent variable is the type of instruction
utilized by the different treatment groups (before and after photos vs. passive time-lapse vs.
interactive time-lapse) while the dependent variable is student understanding of rates of
geological processes as measured by the assessments described in the previous section.
Suppose the observation is made that students in the time-lapse groups (2 and 3) perform
better on the assessments than the students in Group 1; is this actually a result of differences
in the treatment that was applied to these groups or could the difference be caused by some
other factor that was not properly controlled for in the study design?
One of the most common threats to internal validity is selection bias (Shadish et al.,
2001). If the members of one group differ in their initial abilities compared to another group,
this can compromise the ability to make inferences about between-group differences in
performance on the assessments. In most cases, random assignment of participants to
treatment groups eliminates this concern, especially with larger sample sizes because any
differences in the initial state of randomly formed groups are due to chance only (Shadish et
al., 2001; Gay et al., 2008). Using a pre-test/post-test design allows helps address this
concern as it allows the difference in student scores to be analyzed rather than a single score.
The decision to collect demographic information from study participants was motivated
primarily by the concern of internal validity. Demographic data were collected to ensure that
variables other than treatment type that could possibly affect the performance of study
participants could be quantified. Factors that were identified during study design as being
most likely to affect student performance on the assessments were previous exposure to
48
geological concepts, overall GPA, and confidence using new or unfamiliar forms of
technology.
Previous exposure to geological concepts will affect how much a participant already
knows about the concepts being assessed (and thus control their performance on the pre-test)
while GPA will be an indicator of the overall academic prowess of the student. Because the
treatment activities involve using technology in ways which many students may not be
familiar (especially in the case of the interactive time-lapse group), participant confidence in
using and applying new forms of technology may control how much students are able to
learn from the treatment activities. Asking about these factors in advance allows us to see if
each of the three treatment groups are equal or close to equal prior to treatment, and if they
are not, allows us to quantify the differences so that scores can be interpreted accordingly.
Other demographic data which will be collected includes gender, major or academic interest,
confidence in science classes, as well as lecture instructor and lab T.A.
Another internal validity concern is that of “history effects”, or other events occurring
concurrently with the treatment that could contribute to any observed effect or outcome.
History effects are best controlled for by “isolating respondents from outside events OR by
choosing dependent variables that could rarely be affected by the world outside” (Shadish et
al., 2001). Complete isolation is rarely possible in the real-world, nor is it necessarily desired,
especially in educational studies. In this study, the primary history concern is that some
students may obtain additional information about rates of geological processes, either via
their own personal research or from their instructor, in between the administration of the pre-
and post-tests which could cause their score to increase. These effects can be mitigated,
although not completely eliminated, by minimizing the amount of time in-between the
49
administration of the pre- and post-tests, and attempting to minimize the amount of relevant
information the subjects are exposed to in lecture during the time in-between the pre-test and
post-test. This threat is also minimized because students were randomly assigned to treatment
groups and therefore any history effects would be expected to affect all three groups
equivalently. Maturation effects, defined as naturally occurring changes in the study
population over time that can confused with a treatment effect (Shadish et al., 2001) are not a
major concern in a study lasting only a few weeks.
Another validity concern is that participants will be taking an identical test twice in a
short period of time. “Testing effects”, in which taking a test for a second time can influence
scores on the second administration, has been documented in the literature (Shadish et al.,
2001). Unfortunately there is not really a good way to address this validity concern because
any pre-test/post-test design requires that students take the identical test twice. It is hoped
that the qualitative questions will be important in establishing that students have truly
achieved the learning outcomes associated with each item. As with history effects, testing
effects would be expected to affect all three groups equivalently, and therefore would not
affect any differences observed between the groups.
Other possible threats to internal validity include test fatigue, lack of student motivation
to participate in the study, and simply the amount of time spent by each student on the
treatment (time-on-task). Time on task is expected to differ between the groups. It is natural
to expect that the interactive time-lapse group will require more time to view the same
number of videos due to the increased amount of time required to make the videos
themselves. SurveyMonkey will allow tracking of this variable which will be crucial in
establishing internal validity.
50
Statistical conclusion validity: Statistical conclusion validity concerns the
appropriateness of statistical techniques used to analyze data and look for correlations
between variables. In order to satisfy these criteria, all data will be analyzed using the proper
statistical techniques for the given level of measurement (categorical, ordinal, or scale) of a
variable (McCrum-Gardner, 2008). It also important to quantify the magnitude of any effect
observed rather than just report the statistical significance (Shadish et al., 2001). For this
reason, effect sizes will be calculated and reported where possible rather than simply
reporting a p-value indicating presence or lack of statistical significance (Fan, 2001). Another
statistical concern is low statistical power. Statistical power is defined as the probability that
a test will reject a false null hypothesis (Shadish et al., 2001). Statistical power is dependent
on the sample size and the size of the observed effect. A test involving a small sample size
and a small effect may not be able to reject a false null hypothesis. It is important to
remember that failure to reject the null hypothesis does not necessarily mean that there is “no
effect”, another reason why reporting effect sizes is of such great importance.
Construct validity: The goal of the study is to measure “student understanding of rates
of geological processes”. The difficulty is that “understanding” is a trait that is not directly
observable without developing a construct that underlies the variable measured (Gay et al.,
2008). Construct validity thus refers to how well our testing instrument measures our desired
construct, in this case, student understanding. In other words, construct validity is the “degree
to which a test measures an intended hypothetical construct” (Gay et al., 2008). Establishing
construct validity thus involves asking, is the testing instrument used actually reflecting how
much students know about rates of geological processes or is it measuring something else
instead/as well? Establishing construct validity in education domains is particularly
51
challenging because there is not a universally accepted definition of how to measure how
much a student “knows” or “understands”.
Contributing to construct validity are the ideas of “content validity” and “communication
validity” which both concern the validity of individual items on the assessments used in the
study. Content validity is the extent to which items reflect the content or teaching area being
measured. This is normally established by reviewing items with “experts” familiar with the
concepts in question, an approach known as “face validity” or by using more advanced
statistical techniques such as factor analysis after the assessment has been administered.
Content validity can also be established by conducting think-aloud interviews with potential
participants to test whether the items are accurately assessing the intended concept.
Communication validity concerns whether or not the items are interpreted in the manner
desired by the researcher (Libarkin and Ward, 2011) and is also established by conducting
think-aloud interviews as described above.
External validity: External validity refers to whether any causal relationship observed in
the study population can be extrapolated or generalized to individuals outside the study
population (Shadish et al., 2001). For example, if it is determined that time-lapse videos are
more effective at teaching introductory geology students about rates of geological processes,
can this conclusion be extended to say that time-lapse videos would also be more effective at
teaching geology majors about rates of geological processes, or the general public about rates
of geological processes?
In general, there is a balance that must be struck between external validity and internal
validity. Experiments that rigidly control the conditions experienced by study participants are
more likely to have strong internal validity, but the tradeoff is that such experiments are less
52
realistic and generalizable, and thus have weaker external validity (Gay et al., 2008).
However, Gay et al (2008) suggests that, while the classroom is a more realistic setting, the
challenges of conducting a study that is internally valid in that environment may outweigh
the benefits of realism. For this reason, the generalizability of this study will likely be limited
to the study population, namely predominately white, suburban, introductory geology
students.
53
RESULTS
A total of 328 students signed an informed consent form indicating intent to participate in
the study (160 during Winter quarter 2014, 168 during Spring quarter 2014 quarter). Of
these, 130 students (67 during Winter quarter 2014, 63 during Spring quarter 2014)
successfully completed the pre-test, treatment, and the post-test and thus are included in the
final results. An additional 30-40 students completed the pre-test, but did not come to a
computer lab to undergo treatment or take the post-test. Responses provided by these
students are not included in the pre-test results described here. Two students completed the
treatment and post-test but were later found to have either not completed the pre-test or
submitted incomplete answers; the responses of these students are also omitted.
The obtained sample size of 130 students is a sufficient number to perform statistical
analysis on the results of the multiple choice portion of the assessment results. A sample size
of 5-10 times the number of items on an assessment is desired to obtain viable data for
statistical analysis (Bardar et al., 2006; Nunnally, 1967). Using this value, the desired sample
size for this assessment would be 110-220 students. A combination of null hypothesis
significance testing (where the null hypothesis is that no between-group differences exist)
and reporting of effect sizes are used to explore possible correlations between treatment
group and performance on assessments (Fan, 2001; Shadish et al., 2001). A significance level
of α=0.05 was used in all statistical tests and parametric tests were used only when the data
were interval or ratio level and distributed normally. Microsoft Excel was used to tabulate
student responses; all statistical tests were performed using the IBM SPSS Statistics 22
package. Effect sizes were calculated using the G*Power stats package (Faul et al., 2007).
54
The number of participants was distributed nearly evenly across the three treatment
groups (Figure 6). Groups 1 and 2 had 44 participants, while Group 3 had 42 participants.
The vast majority of participants were from GEOL 101 classes due to the much higher
quarterly enrollment of this class compared to GEOL 211 (Figure 7). Group 1 had a higher
proportion of GEOL 211 students (Figure 7) compared to Groups 2 and 3. Participants were
distributed across all lecture instructors and lab T.A.’s; however lecture instructors C and F
who taught sections of GEOL 101 and/or 211 during both quarters that the study was carried
out, thus explaining the greater number of participants drawn from their classes (Figures 8,
9).
Demographics of Study Population
A summary of demographic statistics, compared to the overall WWU student body, is
presented in Table 5. For most demographic variables, the study population represents a
reasonably good sample of the overall WWU student body. This is to be expected given the
large enrollment of the courses participants were drawn from.
Females made up nearly 70% of the study population, significantly higher than the
percentage of females in the overall WWU student body (55.6%) (WWU 2014). However,
the female to male ratio was consistent across the three groups (Figure 10, Table 5). The
median age of study participants was also slightly lower than the median age of all WWU
students (Table 5). Self-reported geology majors comprise nearly 10% of Groups 1 and 2,
however no students in Group 3 reported being a declared geology major. One-way ANOVA
tests on the mean age (p=0.689) and number of college credits completed (p=0.407) taken
show no significant difference between the three groups. A chi-square test on the distribution
of reported GPA ranges also shows no significant differences between the three groups
55
(p=0.366) and the mean GPA of each group is comparable to the mean GPA of all graduating
students, suggesting that the overall ability of study participants is comparable to the average
WWU student. Most participants were from the state of Washington (85.4%), with
California, Colorado, and Oregon being the only other states represented by more than one
participant (four each).
The vast majority of study participants had no previous formal education in geology or
earth sciences in either college (93.1%) or high school (82.3%) (Figure 11), echoing previous
research showing that students in introductory geology classes have generally had little
recent exposure to the subject (DeLaughter et al., 1998; Gilbert, 2012). Most of the
participants who reported taking a previous earth science or geology course in college had
only taken a geography or environmental science course, although a few participants from
GEOL 211 had previously taken GEOL 101 at WWU. The distribution of students with prior
earth science/geology is fairly even between the three groups (Figure 11).
A series of Likert-scale questions were included on the demographic questionnaire to
gauge participant’s initial familiarity with geologic concepts, confidence in science classes,
and confidence using new forms of technology (Figures 12a-f). Even though most
participants were not science majors, the majority in each group still reported being
“Somewhat Confident” or “Very Confident” in their ability in science classes (Figure 12e).
Kruskal-Wallis H tests on the distribution of responses between groups showed no significant
differences on five of the six Likert-scale questions (Table 6). Group 2 reported higher levels
of confidence using new and unfamiliar forms of technology (p=0.003).
56
Duration of Treatment Activities
Because time spent on treatment activities was identified as a possible predictor of
student performance on the assessments, the amount of time spent by participants on
treatment activities was estimated using two separate methods, which were then compared
and combined in order to produce a final estimate of treatment duration for each participant.
Students self-reported the amount of time they spent looking at the time-lapse photos or
videos (in 10 minute bins from 0-60+ minutes) on the post-test. In addition, SurveyMonkey
records the start time for each survey. Because all treatment appointments began at the top of
the hour and participants did not begin the post-test until after they had finished viewing the
photos/videos, the embedded start time in SurveyMonkey for each post-test provides an
approximation of the amount of time a student spent on treatment. For example, if a student
arrived in the computer lab at 10:00, and began taking their post-test at 10:35, then their
treatment duration was approximately 35 minutes.
The estimates of treatment duration obtained via this method likely overestimate
somewhat the actual treatment duration because most students spent several minutes logging
in to the workstation and Canvas. This method also fails to account for the fact that some
participants arrived early or late, although the majority showed up within five minutes of
their scheduled time.
Because neither method of estimating treatment duration is especially robust, the times
obtained from the two different methods were compared against each other to judge their
accuracy. Overall, self-reported treatment durations and the estimates obtained from
SurveyMonkey are generally consistent with each other. The mean SurveyMonkey treatment
duration of students responding to each self-reported time interval is shown in Table 7. For
57
the most commonly selected time intervals, 10-20 minutes and 20-30 minutes, the
SurveyMonkey mean falls within the self-reported interval, indicating that for the majority of
participants, the two methods of estimating treatment duration are internally reliable. For
individual cases where the SurveyMonkey time was significantly different from the self-
reported time (i.e, outside the self-reported interval), the mid-point of the self-reported
treatment duration interval was used due to the aforementioned issues with obtaining
treatment duration from SurveyMonkey. After an estimate of treatment duration was obtained
for all participants, extreme outliers were removed from each group before the times were
averaged.
While participants were not given a prescribed amount of time to complete the treatment
(other than that they would not need to spend more than one hour of their time in the
computer lab), nearly all participants completed the assigned tasks in less than one hour
(Figure 13). Mean treatment duration for Group 3 was higher (ANOVA p=0.000, LSD vs.
Group 1=0.000, vs. Group 2=0.003) than for Groups 1 and 2 although Group 3 had a
significantly higher standard deviation than the other two groups (Figure 13, Table 8). The
total running time of the 14 videos available to Group 2 was 16 minutes while the mean
estimated treatment duration for Group 2 was just under twenty minutes, suggesting that the
majority of students spent very little time, if any replaying the videos or looking at them
more closely.
Time spent taking the pre- and post-tests was calculated using embedded times in
SurveyMonkey (submission time minus start time). After removing extreme outliers (time of
several hours, likely due to participants not finishing the test in one sitting), there were no
significant differences between the three groups with regard to the amount of time
58
participants spent taking either the pre- and post-test (Table 9). All three groups completed
the post-test in a shorter amount of time, presumably because they were already familiar with
the directions and content.
Multiple Choice/Quantitative Questions
The assessments contained 23 multiple choice or short-answer items and sub-items that
had one or more correct or acceptable answers. Student scores on these questions were
tabulated using Microsoft Excel and a total score (# of correct answers) was obtained for
each participant for both the pre-test and post-test. A summary of response patterns for each
of these items is shown in Table 3. Mean scores on the pre- and post-test for each group are
shown in Table 10.
Multiple choice assessment items spanned a wide range of difficulty as indicated by the
percentage of participants who identified the correct answer on the pre-test (Table 3). P-
values (the fraction of students who correctly answered an item on the pre-test) ranged from
0.07 to 0.78 with an average of 0.4.
Participant scores on the pre-test, post-test, and score gain (post-test score – pre-test
score) all approximate a normal distribution (Figure 14) which is necessary in order to
perform parametric statistical tests on the results. Pre-test mean scores ranged from 8.62
points (out of a possible 23) for Group 3 to 9.91 points for Group 1. A one-way ANOVA on
the pre-test mean scores returns a p-value of 0.052. Because the p-value is >0.05, the
hypothesis that there is no statistically significant difference in the mean pre-test scores
between the three groups can be accepted, but only barely.
Because of this “almost significant” difference in pre-test scores, score gain, calculated
by subtracting a participant’s pre-test score from their post-test score, rather than absolute
59
post-test score is used as a more representative metric by which to measure changes in
performance from pre-test to post-test. All three groups exhibited statistically significant
score gains (p=0.000) from pre-test to post-test on the multiple choice portion of the
assessment (Table 11, Figure 15). Effect sizes for Group 2 (d=1.677) and Group 3 (d=1.398)
were very large, according to the guidelines for interpreting effect size given in Cohen
(1988). The effect size for Group 1 (d=1.045) was large according to the same guidelines.
Group 2 exhibited the greatest mean score gain, 4.68 points, out of the three groups but the
differences in score gain between groups is not significant (p=0.144) and the effect size was
small (f=0.172). No participants in Group 2 exhibited a negative score gain while several
negative score gains were observed in both Group 1 and Group 3 (Figure 14). Normalized
gains, defined as a student’s score gain divided by the maximum gain that could be achieved
given their pre-test score (Prather et al., 2009), were also calculated and again no large or
significant differences exist between the three groups (Table 11).
Pre-test score was a reasonably good predictor of post-test score (R=0.433). A weak
negative correlation exists between pre-test score and score gain (R=-0.397, p=0.000) for all
three groups (Table 12). In other words, participants who scored highly on the pre-test were
less likely to increase their score by a large amount than participants who scored poorly on
the pre-test. No significant differences were found when comparing the mean pre-test, post-
test, and score gains across the two different quarters that the assessment was administered
(Table 11).
Correlations with Predictor Variables
Overall, no significant correlation was found (R=0.023, p=.796) between estimated
treatment duration and score gain (Table 13, Figure 16). However when broken down by
60
group, a significant positive correlation exists between treatment duration and score gain for
Group 1 (r=0.401, p=0.007), but not for Groups 2 and 3 (Table 13). A moderate but
significant negative correlation exists between score gain and the elapsed time between pre-
test and treatment/post-test (R=-0.323, p=0.000) (Figure 17). The greater density of
participants at shorter durations on this graph is due to treatment being spread out over only
one week instead of two when the experiment was run during Spring 2014 quarter. The mean
elapsed time between pre-test and post-test for the three treatment groups is nearly equivalent
(p=0.958) (Table 14).
While it was postulated that GEOL 211 students would be more advanced and score
better on the assessments, GEOL 211 and 101 students had almost exactly the same mean
score gain, although GEOL 211 students had a mean post-test score about 1.5 points higher
than students in GEOL 101. Statistical tests on participant mean score gains sorted by
reported GPA, lecture instructor, gender, and previous geology courses in either high school
or college failed to reveal any significant differences (Table 15). No significant correlation
exists between the amount of time participants spent taking either assessment or their or their
score or score gain (Table 16). None of the Likert-scale questions on the demographic
questionnaire were significantly correlated with score gain, although level of interest in
geology and the earth sciences and confidence in science classes both showed small to
moderate significant correlations with pre-test score and post-test score (Table 16).
Analysis of Individual Items
Table 3 presents a breakdown of participant responses to the 23 questions used to
produce the scores discussed in the previous section. The number of participants responding
to each answer choice is shown for both the pre-test and post-test. Correct answers, or
61
answers which most closely match what is observed in the time-lapse photos or videos used
by the participants, are highlighted in bold. Shaded numbers indicate either a decrease in
correct responses or an increase in incorrect responses for a particular multiple choice answer
choice. The column titled “p” indicates the fraction of participants that responded correctly to
an item on the pre-test, giving an indication of the relative difficulty of each individual item.
While there are only small differences in the aggregate scores and score gains between
the three groups, performance on individual assessment items between groups often varies
considerably (Figure 18). All bars in Figure 18 were normalized to a sample size of n=44 for
the purposes of comparing the change in number of correct answers for each group. Note that
while several items (i.e., 13, 15, 22f) show similar gains across the three groups, many other
items (i.e., 5, 14, 22b) show one or more groups performing better than the others. Group 1
showed an increase in number of correct responses on 17 out of 23 items, but exhibited the
lowest gains (relative to the other two groups) on 12 of the 23 items. Group 2 also increased
correct responses on 17 out of 23 items, but exhibited the highest (or tied for highest) gains
on 12 items. Group 3 increased correct responses on 15 of 23 items, and exhibited the lowest
(or tied for lowest) gains for 11 out of the 23 items.
Of note are the several items for which there was a net decrease in the number of correct
answers from pre-test to post-test. Two of the Columbia Glacier questions and one rate
question show negative gains for all three groups. In general, the highest gains were realized
on items relating to the Elwah River and the Swift Creek Landslide. No negative gains are
observed for any of the questions relating to these two landscapes. Gains on the Columbia
Glacier questions tend to be minimal or even negative indicating that the time-lapse photos
62
and videos were not as effective at increasing student understanding of this landscape and
even that misconceptions may have arisen from the treatment.
The final section of the assessment asked participants to quantify how long they thought
it would take for several processes depicted in the videos to occur. Gains on these questions
show a mix of positive and negative gains. Students were given 11 answer choices in a drop
down menu corresponding to different time intervals ranging from “Seconds” to “Billions of
years” (Figures 19-26). The range of acceptable answers for each item is indicated by the
black box, making it easier to compare whether more or fewer students selected an
acceptable answer following treatment. For most of the landscapes, the pattern of responses
shifted towards shorter durations, with the exception of the Swift Creek landslide (Figures
19-26).
Because each assessment item was tied to a specific operationalized learning outcome,
participants were assigned sub-scores indicating their performance on items relating to each
of the different outcomes. These scores were determined by totaling the number of correct
answers on all the questions that related to a particular outcome (i.e., all the questions that
asked participants to “characterize spatial variations in the rate of a geologic process). A one-
way ANOVA was performed on the score gain from pre-test to post-test for each of the seven
operationalized outcomes represented by the multiple choice questions (Table 17). As with
the aggregate scores, the differences in score gain across the three groups show low effect
sizes and are not statistically significant. Nevertheless, Group 2 did have the highest mean
score gain for six out of the seven content areas (Table 18).
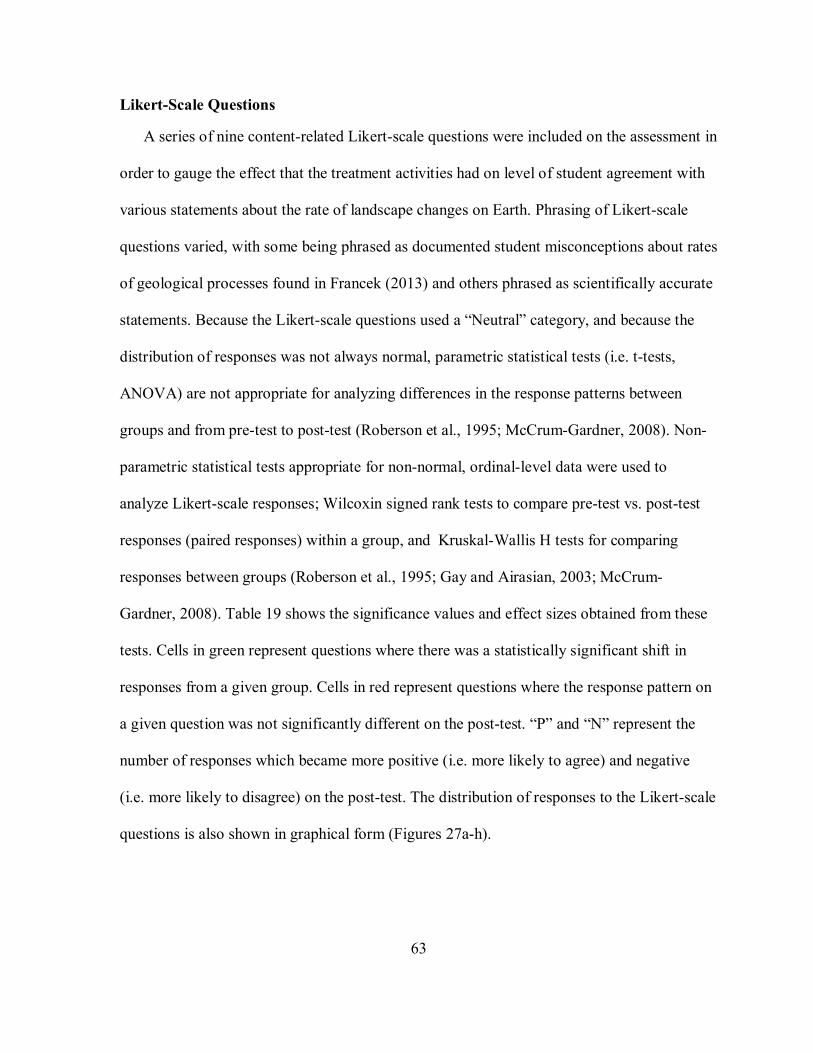
63
Likert-Scale Questions
A series of nine content-related Likert-scale questions were included on the assessment in
order to gauge the effect that the treatment activities had on level of student agreement with
various statements about the rate of landscape changes on Earth. Phrasing of Likert-scale
questions varied, with some being phrased as documented student misconceptions about rates
of geological processes found in Francek (2013) and others phrased as scientifically accurate
statements. Because the Likert-scale questions used a “Neutral” category, and because the
distribution of responses was not always normal, parametric statistical tests (i.e. t-tests,
ANOVA) are not appropriate for analyzing differences in the response patterns between
groups and from pre-test to post-test (Roberson et al., 1995; McCrum-Gardner, 2008). Non-
parametric statistical tests appropriate for non-normal, ordinal-level data were used to
analyze Likert-scale responses; Wilcoxin signed rank tests to compare pre-test vs. post-test
responses (paired responses) within a group, and Kruskal-Wallis H tests for comparing
responses between groups (Roberson et al., 1995; Gay and Airasian, 2003; McCrum-
Gardner, 2008). Table 19 shows the significance values and effect sizes obtained from these
tests. Cells in green represent questions where there was a statistically significant shift in
responses from a given group. Cells in red represent questions where the response pattern on
a given question was not significantly different on the post-test. “P” and “N” represent the
number of responses which became more positive (i.e. more likely to agree) and negative
(i.e. more likely to disagree) on the post-test. The distribution of responses to the Likert-scale
questions is also shown in graphical form (Figures 27a-h).
64
Group 1 exhibited a statistically significant shift in responses on seven out of the nine
Likert-scale questions, Group 2 on eight out of nine questions, and Group 3 on just five out
of nine. An overview of the changes in responses patterns is provided below:
“Geologic time is measured in millions of years because that is how long it takes
landscapes to change significantly”: participants in all three groups were less likely to
agree with this statement after treatment. The effect size for all three groups was moderate,
while Group 3 had the highest percentage of participants selecting “Disagree” or “Strongly
Disagree” on the post-test.
“The landscape around us is constantly changing”: Nearly all participants
responded either “Agree” or “Strongly Agree” on the pre-test, however the number of
participants selecting “Strongly Agree” was significantly higher on the post-test for Groups 1
and 2. Group 3 also saw an increase in the number of students selecting “Strongly Agree” but
the increase was not statistically significant. Effect size was small for Groups 2 and 3 and
moderate for Group 1.
“Landscapes change at a constant rate through time”: No statistically significant
changes in response pattern were observed on this question. A closer look at the data reveals
that most participants did change their answer to this question on the post-test, but that
roughly the same number of participants became more likely to agree as became less likely to
agree.
“Catastrophic events are more important in sculpting the Earth than slow,
gradual processes that occur every day”: The majority of participants disagreed or
strongly disagreed with this statement on the pre-test, but the percentage of students choosing
“strongly disagree” was significantly higher on the post-test for Groups 2 and 3. The
65
responses pattern for Group 1 was nearly identical on the post-test. Effect sizes for Groups 2
and 3 were moderate.
“Landscapes can change significantly over the course of an average human
lifetime”: All three groups were significantly more likely to agree with this statement on the
post-test. Effect sizes for Groups 1 and 3 were moderate while the effect size for Group 2
was large.
“Humans can alter the rate at which landscapes change”: Participants in Groups 1
and 2 were more likely to strongly agree with this statement on the post-test. Effect sizes for
Groups 1 and 2 were small, while the response pattern for Group 3 was not significantly
different on the post-test.
“Moving water (such as rivers or waves) can only change the surface of the
Earth over long periods of time (i.e. more than one year)”: All three groups were more
likely to disagree or strongly disagree with this statement on the post-test. Effect sizes for all
three groups were moderate.
“Water only changes the surface of the Earth during rare events, such as large
floods or tsunami”: Most participants disagreed or strongly disagreed with this statement on
the pre-test. Participants in Groups 1 and 2 were significantly more likely to choose strongly
disagree on the post-test. Effect sizes for all three groups were small, and the shift in
response pattern was not significant for Group 3.
“Apart from human activity, Earth’s landscape looks similar today as it did a
few million years ago”: Participants in all three groups were significantly more likely to
disagree or strongly disagree with this statement on the post-test. Effect sizes for Groups 1
and 3 were moderate while the effect size for Group 2 was small.
66
Qualitative Questions
Several multiple choice questions included open-ended text boxes asking students to
explain why they chose the answers that they did. After an initial review of the open-ended
responses provided, five categories were developed that encapsulate the range of responses.
Responses were categorized on the basis of whether the explanation provided was accurate,
and also based on the concept of observational responses vs. explanatory responses. In an
observational response, a student states that they chose a certain answer choice simply
because they saw evidence of that answer choice in the photos or videos. In an explanatory
response, reference is made to underlying factors that cause a certain answer choice to be
correct. Explanatory responses are higher-level statements that provide evidence that a
student truly understands their answer. To illustrate the distinction between these types of
responses more clearly, consider assessment item #12:
Which of the following statements do you think best describes the rate of erosion along rivers in the Pacific Northwest (including the Elwah River)?
A. The rate of erosion remains constant throughout the year. B. Erosion occurs all year, but occurs faster in the winter than in the summer C. Erosion occurs all year, but occurs faster in the summer than in the winter D. Erosion occurs only during the summer E. Erosion occurs only during the winter
The correct answer to this question is B: “Erosion occurs all year but occurs faster in
the winter than in the summer”. The difference in the rate of bank erosion and channel
migration between summer and winter months is clear in both the time-lapse videos and
photos provided to participants. Erosion and channel migration is greater during the winter
months than during the summer months, primarily due to higher river discharge associated
with precipitation events that are common during the winter, but rare during the summer
67
months. By summer, the discharge of the river is on average much lower and it follows that
the rate of erosion along the river channel will be lower.
In a correct explanatory response to this question, a student would state that they
observed more erosion during the winter months, due to the greater amount of water in the
river channel during this time. Observing the root cause of a correct answer (in this case, that
erosion rate seems to be correlated with river discharge) is a higher level observation
compared to a student who says something along the lines of “Because I saw more erosion in
the winter”. In a purely observational response, students have not really provided any
additional explanation for why they chose a particular answer beyond what was already
stated in the chosen multiple choice option. A purely observational response is not
necessarily bad; after all, the goal of the activities was to get students to make just such
observations, but identifying which of the treatment groups are more likely to make higher-
level explanatory responses may help shed light on which groups gained the most from the
videos and photos. Further examples of the distinction between the different types of
responses can be found in Tables 20 and 21 which summarize the responses to these
questions.
This rubric was applied to all questions for which an explanatory text box was present.
Analysis of student responses to these (and all other qualitative questions) was done blind,
i.e., the student’s group number was removed from the spreadsheet so as not to influence the
researcher’s perception of the responses. Only after all responses had been classified into the
five categories were the responses tabulated by group.
A summary of the student responses by category is shown in Tables 20 and 21. For the
Elwah River question, explanatory responses dominated, with most students seemingly
68
recognizing that the rate of erosion was tied to river discharge (even if students did not use
the term “discharge”). However, incorrect responses outnumbered correct responses; many
students erroneously stated that discharge was higher in the summer due to snowmelt, which
is clearly not the case in the photos and videos. Furthermore, the ratio of observational
responses to explanatory responses is breakdown of responses by category was roughly even
between the three groups, although incorrect responses outnumbered correct response in
Groups 2 and 3 but were roughly even in Group 1.
The opposite was true of the question asking participants to characterize the rate of
movement of the Swift Creek landslide. Explanatory responses were much less common than
observational responses, especially in Group 2, however this makes sense because while the
rate of the Swift Creek landslide does increase during wetter months (McKenzie-Johnson,
2004), the connection between moisture and rate of landslide movement is not as obvious in
the videos as is the connection between discharge and erosion in the Elwah River photos and
videos. Correct answers slightly outnumbered incorrect answers for Groups 1 and 2, however
incorrect answers outnumbered correct answers 20 to 9 in Group 3.
One question at the end of each landscape section asked students to list factors that they
thought might control the rate of the process in question. Students were directed to put the
factor they thought was most important in the first box, 2nd most important in the second box
and so on. In order to tabulate these responses, three points were assigned to factors listed as
most important, two points to factors listed as second most important, and one point for the
least important factor. A summary of the 10 most common responses for each group by
number of total points is presented in Tables 22, 23, and 24. Unfortunately a more detailed
69
analysis of the level of sophistication of the responses to these questions was not possible
because the vast majority of responses to were one or two word answers.
For the Columbia Glacier, temperature and global climate change were listed as the top
two factors controlling the rate of glacier movement by all three treatment groups. Other
common responses include climate, weather, amount of snowfall, and angle of the slope upon
which the glacier sits, all reasonable explanations. “Tides” was either the third or fourth most
common response for each group and it is unclear what role participants thought the tides
played in the movement of the glacier.
For the Elwah River, all three groups identified river discharge (even if they did not use
that specific term) as one of the most important factors controlling erosion. Group 3
identified it as the most important factor whereas it ranked third and second in Groups 1 and
2 respectively. All of the commonly listed factors are reasonable, with the possible exception
of temperature. Interestingly, “dam removal/human activity” did not appear on a large
number of responses, even though the information provided to students about the Elwah
River discusses the fact that the entire Elwah River landscape is undergoing accelerated
change as the dams are decommissioned.
For the Swift Creek landslide, all three groups identified amount of rainfall/saturation of
the ground as the most important factors that control the rate of landslide slippage. Responses
citing fundamental physical properties controlling slope stability (as opposed to
environmental factors such as rainfall or vegetation), such as gravity, cohesion of material,
and slope angle were also much more common that for the other landscapes. Human activity
was also a commonly cited factor by students in Groups 1 and 2, even though unlike the
Elwah River, no mention was made of human activity in the background information
70
provided to participants about the landslide. This suggests some level of initial knowledge
about the role of human activity (e.g. logging) in landslide activity.
Two additional open ended items (#1, #4) produced erratic results that failed to elicit any
coherent results or trends after analysis. Most responses to item #1 simply restated the
prompt given to students and both questions showed few changes from pre-test to post-test.
Better wording and more testing prior to implementation likely would have increased the
usefulness of these items.
Post-Test Questionnaire
At the conclusion of the post-test, students completed a short questionnaire (via
SurveyMonkey) with questions asking about their overall impression of the time-lapse
activities. Seven of these questions were Likert-scale questions. As with the Likert scale
questions on the assessment, non-parametric statistical tests such as the Kruskal-Wallis H test
were used to compare the response pattern on these questions across the three treatment
groups. While no statistically significant differences were found (Table 25), it is interesting
to note that Group 2 had the highest percentage of students select “Strongly Agree” on all of
the Likert scale questions (Figures 28a-g).
Participant’s impressions of the treatment activities were dominantly positive.
Participants almost universally reported that the directions provided were clear and concise,
with only one participant (out of 130) disagreeing with that statement. Only three participants
agreed with the statement “I found this activity confusing and/or frustrating” while only one
participant disagreed with the statement “I felt comfortable using the computer-based portion
of this activity. More than 90% of participants in all three groups thought that the time-lapse
photos/videos were a good way to learn about how quickly landscapes change.
71
Several open-ended questions on the questionnaire asked about what participants found
most useful about the activities, and ways in which the activity was confusing or could be
improved. Similar responses to the open-ended questions were grouped together and a
summary is found in Table 26 and discussed below:
“What did you find most useful about this activity?” (Table 26a): In each group,
the most common response referenced looking at the photos or watching the time-lapse
videos. In Groups 2 and 3, the second most frequent response referenced gaining increased
perspective on how quickly landscapes can change. This sentiment was present, but less
common, in responses from Group 1. A number of students in Groups 1 and 3 referenced
unique aspects of the treatment in their responses, the drag-gable image slider and the ability
to make custom time-lapse videos respectively.
“Did you learn anything during this activity that you found particularly
surprising or interesting?” (Table 26b): The most common theme in responses to this
question was surprise regarding how quickly various landscapes changes in the photos and
videos. Many students did not reference a specific landscape, but rather simply said that they
were surprised how quickly things changed. Others provided a specific example of a
landscape that they were surprised to see change so quickly, with the Columbia Glacier and
Elwah River channel being the most frequently cited examples. A number of students also
expressed surprise regarding the relatively slow movement of the Swift Creek landslide. This
was most prevalent in responses from Groups 1 and 3.
“Were there any parts of this activity that you found especially confusing or
unclear?” (Table 26c): The vast majority of participants either did not respond to this
question or wrote “no”. Few responses were mentioned by more than one participant. The
72
most frequent complaints of Group 1 pertained to difficulty in seeing changes in some of the
photo pairs of the Swift Creek landslide. Five students in Group 3 expressed frustration with
the slow generation of time-lapse videos and/or the instructions provided on how to use the
time-lapse generator.
“What could be added to or changed about this activity to make it better?”
(Table 26d): As with the previous question, the most frequent response in each group was
“no” or “not sure”. The most common suggestions for improvement were to have scale in the
images or videos rather than in explanatory text (all groups), faster generation of time-lapse
videos (Group 3), the ability to look at photos/videos while taking the test (all groups), and
more background information on the different landscapes (all groups). A number of
suggestions requested features and/or information that were already present in the activities
or instructions. These responses are indicated by italics in Table 26d.
“What was your primary motivation for agreeing to participate in this study?”
(Table 26e): Most students indicated that they participated in this project primarily to receive
the compensation that was awarded (gift card or movie ticket) or out of a desire to help out a
fellow student with their research. A smaller percentage of students in each group indicated
that they participated primarily because the subject was of interest to them or that they
thought participating would give them knowledge that would help their grade in GEOL 101
or 211.
73
INTERPRETATION AND DISCUSSION OF RESULTS
Summary of Results and Evaluation of Validity
As would be expected from random assignment of participants to treatment groups,
analysis of demographic data collected on the pre-test revealed no significant differences
between the students in each of the three treatment groups. One exception is that Group 1
contained larger number of students enrolled in GEOL 211 students and students who had
taken a previous college geology class, but neither of these factors was found to correlate
with performance on the assessments.
The mean scores for each group on the multiple choice portion of the pre-test ranged
from 37-43% of the total possible points. Given that most multiple choice questions had four
possible answer choices (each sub item on #22 had 11 possible choices, but several possible
acceptable answers), the pre-test scores show that students performed somewhat better on the
pre-test than would be expected from simply guessing. This suggests that at least some study
participants possessed some degree of initial knowledge of glacial, fluvial, and volcanic
landscapes, possibly due in part to the use of all Pacific Northwest landscape with which
students may have been at least marginally familiar prior to participation.
Only small differences are observed in the between-group score gain across the three
treatment groups and at first glance there is no data to support rejection of the null hypothesis
that all three groups performed equally on the assessments. While using α=0.05 makes the
likelihood of the Type I error (rejecting a true null hypothesis or inferring an effect when
none exists) very small, setting such a high threshold in combination with the relatively small
sample size in each group results in low statistical power, which is defined as the probability
of rejecting a false null hypothesis. Failure to reject a false null hypothesis is known as a
74
Type II error. The calculated statistical power of the ANOVA method for testing the
difference in mean score gain between the three treatment groups is 0.396. In other words,
given the size of the effect observed and the sample size, there is only a 40% chance that the
test will reject the null hypothesis if it is indeed false. As a result, more attention should be
given to the actual effect sizes, which are small, than the p-values. Because the effect sizes
are small and the results are not significant, simply based off of the multiple choice scores, it
is not possible to draw any conclusions about which treatment method is most effective at
increasing student understanding of geologic rate (Fan, 2001).
Assessment scores were correlated with the demographic variables and other metrics
obtained during data collection. Few of these factors correlate well with assessment scores.
Most notably, no significant correlations or differences were found between score gain and
GPA, confidence using new forms of technology, or previous classes in geology or earth
science, all of which were hypothesized to be important predictor variables prior to data
collection. Treatment duration is significantly correlated with score gain only for Group 1
(r=0.401), suggesting that the amount of time spent using the before/after photos is more
important than the amount of time spent watching the time-lapse videos. A significant
inverse correlation exists between score gain and number of days between pre-test and
treatment/post-test which suggests that students who took the pre-test shortly before looking
at the photos or videos may have had a better recollection of the questions and had a better
sense of what to look for in the photos and videos. However, the mean number of days
between pre-test and post-test is equivalent for the three groups so this correlation does not
likely affect the between-group gain scores.
75
Assessment scores were also broken down by the learning outcomes associated with each
item in order to test whether certain groups performed better in specific content areas. Of the
7 tasks/learning outcomes identified in the assessment, a comparison of scores across the
three groups showed small effect sizes on all seven and none of the mean differences were
statistically significant. This suggests that there were no major differences in group
performance on the different types of tasks present on the multiple choice portion of the
assessments.
Some of the most striking differences were observed in student responses to the Likert-
scale questions but for the most part these differences were observed across all three groups.
Groups 1 and 2 did show more significant changes than Group 3 on these questions, possibly
indicating that the photos and static time-lapse videos had more of an impact on student
perceptions about rates of landscape change than did the interactive time-lapse videos.
Responses to the post-test questionnaire were dominantly positive, and make it clear that
vast majority of participants were easily able to follow the directions provided and complete
the assessments and treatment without difficulty. This is important for establishing study
validity because if a large proportion of students had struggled to complete the activity or
expressed confusion, this would throw into serious question the quality of the data collected.
Many of the suggestions listed by participants on the post-test questionnaire related to ways
to better implement or present the time-lapse videos and photos; several of these were
wrestled with during study design and will be discussed below in the section of ways to
improve the integration of time-lapse videos into educational experiences.
Another finding of the post-test questionnaire is that a large number of students expressed
surprise at how quickly changes in the landscapes occurred (comparatively few expressed
76
surprise at how slowly changes occurred, with the exception of references to the Swift Creek
landslide). While this is largely a byproduct of the fact that processes suitable for capture
with time-lapse generally are on the faster side, this is still important given the desire to
impress upon students the entire range of rates at which geologic processes operate. The
misconception that the Earth’s surface only experiences significant change over long periods
of time has been established by previous research (see introduction) and by some results from
the pre-test (Figures 27a, 27e, 27f). The misconception that all geologic processes occur
slowly may tempt students into thinking that geologic hazards are not something that are of
concern in our short lives. The tendency of students to state on the post-questionnaire that
they were surprised how fast changes occurred, the results from the Likert-scale questions,
and the fact that the pattern of responses on many multiple choice-items shifted towards
shorter durations on the post-test demonstrates that both before/after photos and time-lapse
videos are effective at communicating to students that many geologic processes operate
relatively quickly and combating the misconception that geology only “happens” over
millions of years. The surprise exhibited by students in this study about the rapid nature of
many landscape changes supports the idea that many students were not fully conscious of the
rapidity with which some geologic changes can occur. This is significant because ultimately
it is the processes that occur on shorter timescales, such as landslides or fluvial erosion, that
are most likely to impact student’s lives in the future and society in general.
Remaining Threats to Validity
Before any major conclusions can be made from the data, the idea of validity must be
revisited in order to be confident that the assessments did a good job of measuring student
understanding of rates of geological processes, and that there are no other causal explanations
77
for the scores observed. As discussed in the “Methods” section, steps to minimize possible
threats to validity were incorporated into the study design. What follows is a discussion of
the successfulness of these precautions and a review of possible threats to validity that
remain:
Selection bias: Students who volunteered for this study were randomly assigned to
one of the three groups. Analysis of demographic data collected at the outset of the study
showed no major differences between the three treatment groups. The most concerning initial
difference between the three groups was the higher ratio of 211/101 students in Group 1 but
analysis of mean score gains sorted by enrollment in these two courses were nearly identical
(Table 15). Also of note is that despite their being few science majors among the participant
pool, the majority of students in all three treatment groups self-rated as either “somewhat
confident” or “very confident” regarding their ability in science classes. This suggests that
there may have a been a self-selection effect as far as which students from the GEOL 101
and 211 classes volunteered for the research project.
Attrition: While 328 students signed a consent form indicating intent to participate,
only 130 students fully completed participation in the study. However because random
assignment to groups was done using the initial group of 328, the number of students who
dropped out was roughly equal across the three groups. Demographic information is not
available for the vast majority of the students who did not complete participation (except for
a few dozen who completed the pre-test but not the post-test) so a demographic comparison
of those who dropped out vs. those who participate is not possible.
History: All participants in this study were enrolled in an introductory geology
course (either GEOL 101 or 211) during the entirety of their time spent participating in this
78
study. The content disseminated in the lecture portion of these two courses is very similar,
although the exact scope of information students are exposed to varied depending on their
instructor and T.A. The proportion of students from each of the different lecture sections was
comparable across the three groups so it is highly unlikely that history effects had any impact
on between-group comparisons of performance on the assessments. Is it possible though that
history effects may have contributed to the gains exhibited by each individual group? Could
the large increase in scores from pre-test to post-test simply be due to the fact that students
were enrolled in a geology class during the time between assessments?
In an effort to reduce possible history effects, all GEOL 101 and 211 instructors
agreed to refrain from showing any time-lapse videos in class during the course of the study.
The study was also deliberately scheduled for a period when the content being covered
during lecture and lab was not particularly relevant to the concepts being assessed in this
study. For example, most of the lectures that students were exposed to between the time they
took the two assessments revolved around the rock cycle, igneous, sedimentary, and
metamorphic rocks, rather than on topics directly relevant to the assessment questions such
as geologic time, landscape evolution, or glaciers.
It remains that participants, simply by nature of continued exposure to geologic
concepts, could have gained knowledge from lecture that contributed towards their better
performance on the post-test. However, the average elapsed time between pre- and post-tests
for all groups was just four days, enough time for only 1 or 2 lecture periods and not likely
enough time for history effects to become a major consideration, especially in light of the
above precautions. As noted above, there was a weak negative correlation between score gain
and number of days in between pre-test and post-test. If material learned in class was really
79
contributing strongly to student performance on the assessments, a large positive correlation
between these two variables would likely be observed as opposed to a negative one.
It is also possible that students could have studied after taking the pre-test, but the fact
that the vast majority of student who originally signed up to participate in the study did not
even bother to take the pre-test makes it seem improbably a large number of students would
have expended significant time and effort studying for the post-test. Furthermore, the types
of questions on the assessments are not the type that can be easily “googled” or obtained
from other sources.
Taking the above considerations into account, combined with positive student
attitudes towards the time-lapse photos and videos on the post-test questionnaire and the
large within-group effect sizes, confidence that the majority of the gains achieved between
pre-test and post-test for each group are the direct result of the treatment activities rather than
any external factors is merited.
Testing: Taking two identical tests in short succession can cause some subjects to
become more familiar with the content and thus answer questions more accurately (Shadish
et al., 2001). While the role of testing effects cannot be entirely discounted in a pre-test/post-
test design, several steps were taken to minimize them. The order of answer choices on
multiple choice questions were randomized where possible and the environment in which
participants took the two tests was different. Students were able to take the pre-test from any
location they chose, while the post-test was taken in a university computer lab under my
supervision. Including a true control group in the research design (i.e. a group to which no
treatment was administered) would have helped clarify the role of testing effects in the study
design.
80
Participant attitude and motivation: Participant performance on the pre- and post-
tests was not tied in any way to a participant’s grade in their respective classes. Students
were also compensated regardless of their performance or how long they spent on the
treatment activities. These were both requirements of the IRB. However, with so little at
stake for the study participants, one concern is that student performance on the assessments
may have been compromised simply by a desire to get through the activities and tests as
quickly as possible. Estimates of mean treatment duration for Group 2 are only slightly
longer than the cumulative running time of all videos available to that group, suggesting that
students did not spend very much time looking at the videos in-depth.
While students were directed to read all questions carefully and study the time-lapse
videos and photos in detail, undoubtedly, some students expended more effort than others.
Even though participants nearly unanimously self-reported that they gave their best effort on
the assignments, in reality it is possible that even higher score gains would have been
realized had actual grades been at stake. The fact that large and significant gains were
realized in all three groups even on such a short (time-wise) and low-stakes activity could be
interpreted as a testament to the power of time-lapse videos and before/after photos as
instructional tools.
Alternatively, it is possible that gains were skewed towards the positive simply
because of the inherent selection bias in a study that relies on volunteers. Those students that
volunteered for the study may overall be more confident and more motivated to learn about
rates of geologic processes than student who didn’t volunteer. If all students enrolled in
GEOL 101 and 211 had been required to participate, it is possible that the score gains would
have been diluted as a result regardless of the effect on a student’s grade.
81
Construct validity: All assessment items were extensively revised based on think-
aloud interviews with introductory geology students and conversations with geology faculty
before use in the study. Multiple choice answer options were written using best practices
guidelines for composing multiple choice answer options. In addition, responses to open-
ended questions generally indicate that students understood what the questions were asking.
Furthermore, participant interaction with the time-lapse videos and photos was guided by a
series of questions that pertained directly to the content covered by the assessments. This
leads to high confidence that the assessments were valid in that they were probing student
knowledge about rates of geological processes and that incorrect answers did not stem from
confusing or ambiguously worded questions.
Reliability: To address potential reliability concerns relating to the assessment (and
also to increase sample size), the study was run twice, once during Winter quarter 2014 and
once during Spring quarter 2014, using the same protocols. The relative schedule across
which the study was conducted was identical between the two administrations of the
assessments. As Table 11 shows, there are no statistically significant differences between the
mean assessment scores in Winter quarter vs. Spring quarter.
Two Possible Interpretations
While all three treatment groups improved from pre-test to post-test, in order to answer
our research questions, ultimately it is the difference in performance between the three
groups that is important. The results from the multiple choice portion of the assessments
show no large or significant differences in the gains between the before and after photo
group, the static time-lapse group, and the interactive time-lapse group. Qualitative and
Likert-scale questions do hint at some differences, although these differences are not large or
82
consistent. Assuming this result is valid, this lack of a major difference between the treatment
groups can be interpreted in two different ways:
1. Before and after photos and time-lapse videos are more or less equivalent in their
inherent ability to communicate information about rates of geological processes to
students. Adding an interactive component to the time-lapse videos does not result in any
significant increase in student learning over viewing pre-made time-lapse videos.
2. Either time-lapse videos or before and after photographs ARE better for teaching students
about geologic rate, but due to a flaw in the study design, small sample size, or
deficiencies in implementation of the time-lapse videos, the difference was not detectable
in this study.
Given the myriad of different ways in which the experiment could have been designed,
and all the considerations that went into preparing and presenting the time-lapse videos and
photos, explanation 2 seems to be the more conservative conclusion. Nevertheless, the
following discussion will cover the ramifications of both possible conclusions as well as the
lessons that each can offer future users of time-lapse videos and before/after photos in
geoscience education. The following discussion can be divided into two parts: a discussion of
the possible limitations of time-lapse (which would support conclusion #1) and a discussion
of the limitations of the study design and how the time-lapse videos were implemented
(which would support conclusion #2). There is some overlap between these two conclusions;
for example, many of the inherent limitations of time-lapse can be overcome, if not easily, by
making changes and alterations to the way in which they are implemented.
83
Possible Limitations of Time-lapse: Cognitive Considerations
The lack of any statistically significant differences in test scores or striking differences in
open-ended responses between the three groups is intriguing given the supposed advantages
of time-lapse video discussed in the Introduction. What potential limitations of time-lapse
video, or advantages of static photos, may have been overlooked?
Complicating the comparison of before/after photos and time-lapse videos is the fact that
the two methods are not “informationally equivalent” (Tversky et al., 2002). In other words,
students in the time-lapse groups are receiving significantly more information (i.e. a more
complete picture of the geologic process) than the students in the before/after photo group
which makes a direct comparison difficult. To illustrate, a 30 second time-lapse video (at a
standard frame rate of 30fps) contains 900 individual frames or images; in contrast a student
in the before and after photo group would see just two of those 900 images. Is it really
possible that just as much knowledge can be gleaned from a comparison of two frames as
from a video consisting of 900? Previous research on the cognitive science behind using
computer animations and visualizations, of which time-lapse is a form, as teaching tools may
offer some clues.
Tversky et al. (2002) cites a number of education-themed studies in which the use of
static graphics was found to increase student performance more than text alone, but in which
animated graphics used to depict complex systems were not found to increase student
performance above and beyond static graphics (Schnotz et al., 1999; Morrison and Tversky,
2001; Lowe and Schnotz, 2008). While rates of geological processes would, on the surface,
seem to be an ideal concept for applying the power of animation, Tversky et al. (2002) focus
84
on a variety of reasons why animations “may be distracting, or even harmful, to conveying
important ideas” in situations where they would seem to be most appropriate.
One of the factors most relevant to time-lapse videos is the idea that, in order to be
effective, animations must occur slowly enough that the viewer can effectively process
“movements, changes, and their timing” (Tversky et al., 2002). This is an area in which time-
lapse video inherently falls short. While the frame rate of a time-lapse video can be adjusted,
by their very nature, time-lapse videos present large quantities of information to the viewer in
a relatively short amount of time. Even at slower frame rates, changes in the landscape can
occur in the video very quickly and thus may be difficult for students, especially novice
geology students, to adequately process. However, Tversky et al. (2002) suggests that this
shortcoming of animation can be overcome by adding an element of interactivity to the
animation, specifically in the form of allowing learners to control the speed of the animation,
stop the animation, and re-play parts which were confusing, etc. Interestingly, such options
were afforded to students in both of the time-lapse treatment groups: Group 2 could easily
pause, play, rewind, and use a drag-able slider to move through the video at a custom rate
while Group 3 had the additional option to specify the frame rate (10, 20 or 30 fps) of all the
videos they generated. According to Tversky et al. (2002), such accommodations should help
these students be able to processes the videos better, however in practice they do not appear
to have made much of a difference as scores for the time-lapse groups were very similar to
the photo group. It is also possible that, despite being prompted in the directions, students in
Groups 2 and 3 did not utilize these functions, in particular the options to vary the frame rate,
as much as desired, as the program did not allow tracking of how frequently such functions
were used.
85
So while it is true that the time-lapse videos present the student with more information
than a corresponding before/after photo, it is conceivable that time-lapse presents too much
information too rapidly for students to have the chance to thoroughly process and internalize
it, even with the ability to re-play or slow down the video. Some evidence for this hypothesis
is seen in open-ended question responses. For example, many students correctly made the
observation that erosion occurs more rapidly along the Elwah River in the winter than in the
summer, yet a similar number of students reported observing the exact opposite. How can
two students view the exact same videos and come to such opposing conclusions, especially
when participants were specifically prompted to explore seasonal changes in the rate of
erosion? One explanation would be that the time-lapse videos are presenting information too
quickly for many students to adequately process and comprehend it.
Comparing a pair of static images is admittedly much less daunting than watching a fast-
moving time-lapse video which contains thousands of frames displayed in a matter of
seconds. The failure of the time-lapse groups to perform better on the assessments could be
the result of inherent limitations in our cognitive ability to process a quickly changing scene.
Earth’s landscapes change in complex ways, with multiple different processes interacting to
produce observed changes over time. Experienced geoscientists are especially adept at
working with and conceptualizing complex systems (Manduca and Kastens, 2012) and thus
such individuals might be more easily able to use a time-lapse video of a changing landscape
to their benefit than an introductory geology student. In other words, from the perspective of
geoscientists time-lapse is a great tool because we are already used to dealing with complex
systems; for a student who is not, the advantage of time-lapse video may not be as
significant. The logical extension of this cognitive model would be that time-lapse may hold
86
more promise as teaching tool when used with more advanced geology students, however
because this study doesn’t address that population, it is impossible to know for sure without
further research. In addition, this model would suggest that slowing down the time-lapse
videos even further (i.e. lowering the frame rate below 10 fps) could help overcome some of
these cognitive barriers and allow novice users to notice and process more subtle changes.
Another supposed advantage of time-lapse videos is that they are “real” rather than a
computer simulation. However, some of the student comments on the post-questionnaire
suggest that assumption is not necessarily merited and that not all students comprehend this
fact. Comments such as “Include time-lapses that span 100,000 or a million years” suggest
that some students may think that time-lapse videos are still computer animations that can be
manipulated at will to show how processes occur over many thousands or millions of years,
or that students still have a very poor fundamental grasp of time in general. The realism of
time-lapse videos may also contribute toward the comprehension issues mentioned above.
Real-world scenarios are inherently more complex than simplified representations and some
previous researchers have suggested that animations should avoid realism and err on the side
of schematic simplicity (Tversky et al. 2002).
Possible Limitations of Time-lapse: Student Enjoyment of Time-Lapse vs. Before &
After Photos
As mentioned in the introduction, one of the strongest motivations for using time-lapse
videos in the classroom is the anecdotal evidence that suggests that students enjoy viewing
time-lapse videos and are enthusiastic about using them to learn about geology. Some authors
have suggested that student enjoyment of animations is reason enough to use them even if
87
they do not result in significant advances in learning over an alternative method (Rieber,
1991). However, with regard to time-lapse, this view should be approached with skepticism.
Results from the post-test questionnaire did not conclusively show that students enjoyed
using time-lapse videos any more than they enjoyed using the slider to compare the before
and after images. Response patterns to the questions “I enjoyed completing this activity” or
“This activity increased my understanding of how quickly landscapes change” were nearly
identical across the three groups and student in all three expressed a high level of satisfaction
with the activities. Nearly all of the students in the before and after photo group expressed
how the photo pairs gave them new insights into the rates of geologic processes, a higher
proportion than for their counterparts in the time-lapse groups. Furthermore, several students
in the time-lapse groups suggested adding before/after photos as a way to improve the
activity.
Student enjoyment is an important factor to consider because, as described in the
“Methods” section, time-lapse videos are extremely time-consuming for the instructor or
animator to produce (and expensive to gather in the first place), considerably more so than
before and after photo pairs. In the absence of any significant quantitative evidence showing
that time-lapse videos result in greater understanding amongst novice geology, it becomes
more difficult to justify the large amount of time needed to produce high-quality time-lapse
videos, although such videos may still be of value to more advanced students who can
process them more efficiently.
While the results from the post-test cast some doubt on whether students really do prefer
time-lapse videos over comparing before and after photos, it is important to remember that
the opinions shared on the post-test are from students who used one or the other, not both. An
88
interesting extension of the study would have been to subject some students to both
before/after photos and time-lapse videos and see which one they preferred using.
Possible Limitations of Time-lapse: Misconceptions Arising from Treatment
While student performance on assessment items generally improved at least modestly
from pre-test to post-test, on all items there nevertheless remained a number of students who
chose incorrect distractors. Although on most items the number of incorrect answers
decreased, in several cases the number of participants choosing an incorrect distractor
actually increased on the post-test, suggesting that the treatment activities led some students
to come away with a new misconception about a particular concept.
The most extreme example of an item with a negative gain was item #5, which asked
students to characterize the rate of movement of the Columbia Glacier. Seventy one percent
of students answered this question correctly on the pre-test, while just 52% answered the
item correctly on the post-test. Group 1 showed the largest negative gain on this item, going
from 33 to 18 correct responses. The increase in incorrect responses was due mostly to
increased number of participants choosing the distractor “The glacier occasionally flows
backwards in response to global warming” in Group 1 and Group 3, and “The ice will
always flow toward the ocean at a constant rate” in Group 2, both of which careful
observation of the time-lapse videos and photos show to be incorrect.
The negative gain for Group 1 is somewhat easy to explain given that the before and after
photos make it obvious that the glacier terminus is retreating, but not immediately obvious
which direction the glacier is moving. Even in the time-lapse groups though, more students
stated that the ice within the glacier was moving backward on the post-test than on the pre-
test. Dove (1998) suggests that misconceptions such as this can often stem from a use of
89
everyday language in a scientific context. However based on feedback in the think-aloud
interviews, the text of this item was revised to make it clear that the question was referring to
the “ice within the glacier” rather that the glacier terminus so this is likely not the issue here.
More likely is that many participants do not fully understand that a glacier, by definition, is a
field of ice that is constantly moving downslope, adding an additional hurdle that needs to be
overcome in order to make sense of the time-lapse videos.
This example is ultimately a good illustration of the need to be very cautious in assuming
both prior knowledge and what students will and will not notice in a time-lapse video of a
changing landscape. In this case, it was incorrect to assume that students would notice that
the terminus of the glacier is retreating due to mass being lost via calving, rather than the
glacier itself moving backwards. This is an example of a situation in which multiple
processes are occurring simultaneously and contributing to landscape change; students may
have difficult compartmentalizing each one. Research has shown that younger students
frequently do not notice much of the information that a computer animation contains, so it is
conceivable that introductory geology students may simply not notice information or motions
than an “expert may see as obvious” (Rieber, 1990, 1991). As mentioned previously, the
accelerated (quickly changing) nature of time-lapse videos means that several important
things can be happening simultaneously, making it difficult for the student to know what to
focus on without additional guidance. In the absence of such guidance, such as narration or
annotation, to focus student attention on processes of interest, it is easy for students to come
away with information that is at best incomplete, and at worst completely wrong.
Unfortunately, many time-lapse videos available to students or the public online include
little to no expert commentary, context, or narration, drastically increasing the likelihood that
90
individuals will come away from viewing the videos with misconceptions. Even the official
video of Columbia Glacier retreat found on the EIS webpage does not make any mention of
the fact that the glacier is always flowing towards the ocean, and that retreat of the terminus
is caused by calving, not the glacier actually moving backwards. One respondent in the April
2013 online survey of geology educators, when asked how they incorporate time-lapse
videos into their class said “Usually I provide a commentary, point out important features,
then let them view it again. Often there will be questions to answer after viewing the video”.
This is precisely the sort of approach that is needed to help novice geology students’ process
time-lapse videos. While time-lapse can be powerful, its complexity requires additional effort
on the part of the instructor in order to unpack its contents for the students. Instructors need
to be acutely aware of what sorts of misconceptions are held by students about the process
being depicted, so that they can be addressed while the video is being viewed, especially is
the misconception is one that is strongly held. Additional care is needed when the time-lapse
video will be viewed independently of the instructor, in the context of an online course or
MOOC for example, in which case a virtual form of narration that can direct the student’s
viewing, address possible misconceptions, and possibly even instruct them to re-play a
portion of the video, should ideally be provided to prevent existing misconceptions from
persisting or new ones from forming.
One thing especially striking about the responses to open-ended questions was that many
explanations provided by participants directly contradict what is visible in the time-lapse
videos. Furthermore, many responses did not even reference the videos or photos, but seem
to be based entirely on pre-existing ideas or misconceptions about the process in question
(i.e. “Landslides do not move then stop”). Such responses suggest that student’s
91
misconceptions were not adequately addressed by the photos and videos, providing yet more
evidence that more guidance (e.g. narration) is needed when using time-lapse videos with
novice geology students.
Another misconception that became more prevalent on the post-test was that the rate of
the Swift Creek Landslide is constant over time. This misconception increased in frequency
in all three groups, but slightly more so in Group 3. A number of students also said that the
Columbia Glacier moves at a constant rate through time, yet both the Columbia Glacier and
Swift Creek landslide exhibit significant seasonal variations in their movement rates.
Somewhat surprisingly, the videos and photos did not seem to impress this upon many
students. Furthermore, responses to the Likert-scale question “Landscapes change at a
constant rate over time” were mixed, with many students more likely to agree on the post-
test, suggesting some confusion on this idea. Finally, as discussed in the “Results” section,
many students struggled to explain variations in the rate of erosion along the Elwah River in
the open-ended questions, with many students incorrectly stating that erosion occurred faster
in the summer. All of these lines of evidence point towards discerning variations in the rate
of a process over time as a consistent problem area that could possibly be improve by
providing more guidance to participants or possibly rewording questions to make them more
clear.
Most other incorrect answers were due to an inability to discern a precise quantitative rate
of a given process rather than a misconception per se. For example, a large percentage of
students responded incorrectly to item #6 (Approximately how long do you think it would
take ice within the Columbia Glacier to move ten meters (approximately the length of a city
bus)?) on the post-test but the most common incorrect answer on the post test was “1 month”
92
rather than “1-year” on the pre-test. This indicates that while many students were not able to
obtain the correct answer from the videos/photos, they were at the very least able to get
closer to the correct answer of “1 day” and/or realize that the glacier was moving fast enough
that their initial prediction was likely to be an overestimate of the actual time required.
While instances where the number of incorrect answers increased are limited, on several
other items, gains were minimal and many of the misconceptions present on the pre-test
persisted through treatment to the post-test. This persistence of misconceptions even after
instruction is a common phenomenon (Vosniadou, 2007; Reif, 2010). The very short duration
of the treatment activities was likely not long enough to allows all students to experience
conceptual change (Mikkilä-Erdmann, 2001), thus allowing many misconceptions to persist
even after treatment. While these factors likely account for at least some of the
misconceptions still present on the post-test, it also suggests a major shortcoming of the
treatment activities used in this study: the inability to customize the time-lapse videos and
photos to incorporate student’s preconceptions about rates of geological processes.
Persistence of misconceptions is often prevalent when there is a failure to incorporate
students pre-existing knowledge structure into the education process. Making students aware
of their own misconceptions is crucial to overturning them (Reif, 2010). It has been
demonstrated that conceptual change occurs most readily when a student’s misconception is
explicitly addressed during the learning process and an explanation provided showing why
the misconception is wrong (Kendeou and Van Den Broek, 2005; Rapp and Uttal, 2006). In
the case of the Columbia Glacier, this would have involved acknowledging the
misconception that glaciers can flow backward, and countering it by discussing that a glacier
is a field of moving ice which cannot flow uphill, perhaps followed by an animated or
93
narrated time-lapse video showing that the forward movement of the glacier continues
regardless of how fast calving occurs and the terminus retreats.
In the context of the activities used in this study, this was difficult to accomplish.
Participants varied so much in their initial knowledge state that it would have been difficult
to incorporate all initial misconceptions into the videos and photos. While with enough time
misconceptions could be incorporated into the type of exercises used in this study, this is
more of a concern when time-lapse videos are shown casually in class. Students in a large
lecture class will have all sorts of preconceptions and it is impossible to even be aware of
them all much less address them all.
Improvements to Time-Lapse Implementation
While there are cognitive limitations to using time-lapse videos with novice geology
students and while study participants generally expressed satisfaction with the treatment
activities as a method for learning about rates of landscape change, the occurrence of items
with negative gains, minimal gains, and erroneous answers to open-ended questions leaves
no doubt that there is plenty of room for improving how time-lapse videos and photos are
used to facilitate student learning. Most of these improvements center around ways to help
students comprehend and process the rapid changes that occur in many time-lapse videos, as
discussed earlier. These improvements can be broadly separated into suggestions that pertain
to the creation of the time-lapse videos themselves, and suggestions for instructors to
improve the implementation of time-lapse videos in their courses:
Suggestions for Instructors
On a most basic level, more time for students to explore the time-lapse photos and video
would likely increase the amount of learning that occurs. While no correlation was observed
94
between treatment duration and score gain for either of the time-lapse groups (a moderate
positive correlation between treatment duration and score gain was observed for Group 1,
suggesting that the amount of time spent using the image sliders is more important than the
amount of time spent watching the videos), the reality is that the mean treatment duration for
both time-lapse groups was under 30 minutes, a very short amount of time to expect much
learning to take place. Many students commented on the post-test questionnaire that more
time to look at the videos would have been welcome, although giving students more time
would likely have started to introduce issues of test fatigue. Ideally, the treatment would have
lasted longer, but been split up into several sessions to minimize the cognitive load required
of students at any one time.
Comparing mean treatment durations for Group 2 vs the total duration of the time-lapse
videos available to students suggest that most participants spent very little time, if any
replaying the videos or looking at them more closely. However, the lack of a significant
correlation between treatment duration and score for the time-lapse groups suggests that
simply watching the videos multiple times does not increase understanding. More likely,
structuring the use of time-lapse videos in such a way that encouraged students to engage in a
second or closer viewing of key portions of the videos could lead to greater increases in
understanding.
Many participants expressed the desire to be able to watch the videos while taking the
post-test. As discussed in the methods section, this was something that was wrestled with
during study design. While it is likely that students likely would have performed better on the
assessments had they been given simultaneous access to both the assessment and test and the
videos/photos, allowing students to look at the questions and photos/videos at the same time
95
would have turned the activity into something more akin to a scavenger hunt, and would not
have tested the extent to which students are able to retain (rather than simply recite)
information learned from the time-lapse videos and photos even a short time later.
Furthermore, time-lapse videos are frequently used in geology classes during lecture, rather
than as a stand-alone, independent activity and so allowing students to take the test while
looking at the videos and photos would not have as closely matched how time-lapse videos
are normally used by geoscience educators. Because the research goal was to test what sorts
of things students would notice from viewing a time-lapse video and how what they noticed
would affect their understanding of rates of geological processes, giving students a list of
conceptual questions that focused student interactions with the photos/videos in such a way
that it was still possible to correctly answer the questions was determined to be the best
compromise.
As the use of online videos becomes more common outside the classroom (in settings
such as flipped classrooms and MOOCs), a recent trend has been to embed opportunities for
testing and self-assessment into videos and multimedia. Research has shown that online
video lectures that incorporate these kinds of opportunities for periodic self-evaluation can
help maintain student focus over longer periods of time and promote learning (Szpunar et al.,
2013). It seems reasonable that this strategy could enhance what students are able to learn
from time-lapse videos as well. In hindsight it would have been interesting to find a way to
integrate the viewing of the time-lapse videos and photos with the assessments more
seamlessly in a way that would still test how students were able to retain information. Many
of the persisting misconceptions documented previously could have been the result of
students forgetting what they had seen by the time they finished looking at the videos/photos
96
and took the post-test. Integrating the assessments with the videos could also allow
scaffolding of questions that encourage students to view key portions of the videos more
closely as mentioned above in order to gain a deeper understanding.
Suggestions for Time-Lapse Creation
Based on suggestions provided on the post-test questionnaire, several minor changes to
the way in which time-lapse videos were presented to the students could increase student
comprehension of the rates of processes occurring in the videos. Having a scale-bar in the
images/videos themselves rather than in the introductory text and annotated photographs for
each landscape would have made it easier for students to make quantitative estimates of rate
without having to scroll away from the video itself. The process of adding such a scale bar to
the images would be straightforward, but is complicated by the fact that scale can vary
widely across an image. In many cases a single scale bar is not sufficient, and including
multiple scale bars could be confusing.
Another change that could facilitate student learning is to annotate the first and last
frames of the time-lapse videos. In the treatment activities, a still photograph with scale
information and annotations was provided at the top of the page containing the time-lapse
videos in order to provide necessary context and introduction. However, as with the scale bar
issue, incorporating such information directly into the video itself eliminates the need to
scroll back and forth between the video and the annotated photo in order for students to make
sense of their observations. Correct interpretation of the time-lapse videos and photos
required that students read the accompanying text and look at the accompanying annotated
photo. There was no way to ensure that students did this in all cases, so incorporating some
of the information that was presented alongside the videos into the videos themselves may
97
help students gain more from the videos. This suggestion for improvement aligns with two of
the multimedia design principles outlined by Mayer (2001): the spatial contiguity principle
and the temporal contiguity principle, which state that students learn more when related
photos and text are presented in the same place at the same time.
Some students also seemed to struggle using the date-stamp on the time-lapse videos to
interpret what they were seeing in the landscape. In open-ended responses to the item asking
about seasonal changes in erosion rate along the Elwah River, most students made the correct
observation that erosion occurs faster when river discharge is higher, but more than half of
students misidentified discharge as being greatest in the summer when it is actually much
greater in the winter and spring.
Some ideas for improving the date stamp would be to make it larger (the pre-embedded
date stamp on the Elwah River images was smaller than the date-stamp that was manually
added to the other three time-lapse data sets) or to slow down the frame rate of the videos to
make it easier for students to comprehend what time of year it is. An additional overlay
explicitly stating what season it is might also be helpful, especially considering that there is
some ambiguity in the popular usage of terms such as “summer” and “spring”.
In light of the cognitive obstacles to processing time-lapse videos discussed above,
making time-lapse videos with slower frame rates may also help student’s process
information more effectively. Using variable frame rates within a video could help
emphasize important changes in the landscape that might otherwise go unnoticed.
Time-lapse videos can also be improved by exerting extra care during the collection of
time-lapse data sets themselves. Robust mounting systems that ensure the position of the
camera does not change over time can minimize the amount of necessary post-processing and
98
distracting parallax shifts in the videos. Many newer digital cameras contain CCD chips with
better dynamic range capabilities and internal algorithms that can smooth out images with
large variations in brightness. Ensuring that a full suite of image metadata is collected can
make it easier to add features such as customizable date stamps, which was not possible with
the Elwah River data set becuase no metadata was included. Finally, including objects for
scale in the field of view of the time-lapse camera can also provide valuable context for
students who view the resulting videos.
Ultimately, with any of these additions or changes to the time-lapse videos themselves or
their implementation, it is necessary to consider whether any resulting increases in learning
are due to the time-lapse videos themselves, or due to the other “stuff” that is added on. For
example, adding opportunities for self-assessment into the videos may very well increase
learning and student scores. But in such a case, the increase would be due to the addition of
opportunities for self-assessment rather than any inherent advantages or disadvantages in the
medium (time-lapse vs. photos) itself. It seems likely that adding any of these types of
features to the before/after photos may result in equally large increases in student scores, and
if an addition or change results in increased learning in all three groups, then there is still no
strong evidence that one method is any better than another.
Limitations of Study Design
One of the factors that must be balanced in an experimental education study is the need to
effectively isolate the variable being measured, in this case the effectiveness of time-lapse
videos, while simultaneously maintaining a learning environment that is as natural,
comfortable, and realistic as possible for the student. Determining what type of learning
environment is most realistic is challenging because time-lapse videos can be used in many
99
different ways, from being shown in class to being assigned as part of a homework activity.
In the case of this study, the decision was made to conduct the experiment outside the context
of the classroom. By doing this, a multitude of threats to validity were minimized or
eliminated. However, the compromise is that the treatment activities completed by the
students were not directly related to, or integrated into material being covered in their
introductory geology classes. Completing an hour long activity in a computer lab under the
supervision of the researcher is not necessarily representative of how learning takes place in a
traditional classroom-based geology course, although it may more closely mimic how such
videos would be used in an online geology class or MOOC, both of which are becoming
increasingly popular. So while such a controlled, experimental setting works well for
controlling possible confounding variables, it does so at the expense of creating a perfectly
natural learning environment for the student. Nevertheless most participants stated that they
enjoyed the activities and that the time-lapse videos and photos were a good way to learn so
it does not appear as though the somewhat artificial environment was a major inhibition
towards learning from the videos and photos.
Ideally, a wider variety of time-lapse data sets that better captured the temporal
variability of a given geologic process would have been incorporated into the treatment
activities. For example, the behavior exhibited by a tidewater glacier (such as the Columbia
Glacier) is different from the behavior exhibited by a ground-based alpine glacier, most
notably in the fact that the advance and retreat of tidewater glaciers is not tied as closely to
climate change (Post et al., 2011). Numerous attempts were made to secure permission to use
a time-lapse data set of various terrestrial alpine glaciers with no success. Similarly, while the
Swift Creek landslide is an example of a slow-moving, creeping landslide, many landslides
100
occur much more rapidly, so rapidly in fact that they are not appropriate for capture with
time-lapse photography. While most students seemed to understand that not all landslides
and glaciers are the same, analysis of the qualitative data suggested that some did not fully
comprehend the fact that the rate of a given process can vary considerably depending on a
variety of external factors. That is to say, not all landslides move at the same rate, not all
glaciers move at the same rate, and not all river channels migrate with the same frequency.
This concept is difficult to communicate to students when only one example of a given
process is shown. While this leaves open the possibility of some misconceptions, exposing
students to all possible types of glaciers, rivers, or other features was unfortunately not
feasible in a study of this magnitude, both due to time constraints, cognitive load concerns,
and availability of data sets. Future research that focuses on one specific geologic process,
and where multiple examples of that process are presented via time-lapse video would be
warranted.
The types of questions that could be included on the assessments were also somewhat
limited due to the SurveyMonkey software. For example, it would have been preferable to
have a way for students to show their work on the item that involved mathematical
calculation (item #20). Showing work would have allowed more insight into incorrect
answers but no provisions for this type of question existed in SurveyMonkey.
Another consideration was the timing of the treatment and the post-test. Some authors
have suggested that assessments administered immediately after a period of instruction are
“unrealistic” because they do not address how well students retain the information and are
able to apply their knowledge to new situations and real-life problems (Reif, 2010).
Administration of a delayed post-test was considered however several factors prevented this
101
from occurring. A lower than expected participation rate and high subject attrition during
Winter quarter 2014 necessitated another administration of the study during Spring 2014
when the delayed post-test was originally scheduled to take place.
In addition, several major validity concerns were identified with a possible delayed post-
test. Any delayed post-test would have been completely voluntary as not enough funds were
left to compensate students for participating. Consequently, the participation rate on a
delayed post-test would likely have been extremely low (even lower than the main study) and
not enough to make any significant conclusions. Furthermore, any data gathered would have
likely suffered from a very large selection bias due to the voluntary nature of the delayed
post-test. Likely, students who performed well on the initial assessments, were very
interested in geology, or enjoyed the initial activity the most would have been the most likely
to participate which would have severely skewed the results. Retention was tested to a very
limited extent due to the fact that the post-test was administered after students had finished
viewing the photos or videos, rather than while students were viewing the photos and videos.
This prevented students from scouring a particular video to find the answer to a question but
rather tested their ability to notice and retain information from the videos.
One concern with the interactive time-lapse group was that they were not prescribed
time-lapse videos to watch, whereas the photos and videos shown to Group 1 and Group 2
were designed with the assessment items in mind. In other words, the performance of the
interactive time-lapse group depended heavily on their ability to determine what kinds of
videos they need to make in order to answer the questions. The nearly equivalent
performance of Group 3 versus the other groups suggests that students were able to
effectively accomplish this. Ideally, the interactive time-lapse software would have been able
102
to track both how many videos each student made and the parameters of each one in order to
see how the videos they created compared to what was seen by Groups 1 and 2.
External Validity:
The external validity of this controlled study is difficult to establish. While the study was
carried out using a population that seems to be a good sample of the overall student body at
WWU, many participants in the think-aloud interviews noted that they would have been
much less comfortable with the assessment questions had they not taken GEOL 101 or 211.
The assessments used in this study were designed assuming that participants possess a basic
understanding of geological terms which somewhat limits our ability to generalize the results
of the study beyond introductory geology students. It is likely that the fact that all
participants were concurrently enrolled in a geology class made the activities and
assessments easier to digest than for an individual who has no previous geology experience.
While the results show that both time-lapse videos and before/after photos allow viewers to
better gauge rates of geological processes, without being able to assume that viewers have
some geology background, the set of challenges involved in designing time-lapse videos and
photos that are effective at communicating information about rates of geological processes to
the general public would likely be somewhat different than what was discussed here.
Finally, as discussed previously, time-lapse videos can be incorporated into geology
courses in a multitude of different ways. This study tested the effectiveness of time-lapse
when used as a stand-alone, interactive, individual activity that focused on students using
time-lapse to evaluate their predictions about landscape change. Therefore, the results of this
study are not necessarily generalizable to the effectiveness of time-lapse when shown in

103
different contexts, although it is likely that many of the conclusions about how to make
effective time-lapse videos will apply regardless of the setting.
104
CONCLUSIONS
Because all three treatment groups (the before/after photo group, passive time-lapse
group, and interactive time-lapse group) showed large or very large and statistically
significant gains in understanding of rates of landscape change, as measured by scores on the
multiple choice portion of the assessments, the use of time-lapse videos or before/after
images to convey rates of geological processes is an effective teaching tool. Likert-scale
questions also indicated that the treatment activities were effective at changing qualitative
student perceptions of rates of geological processes for all three groups, slightly more so for
Groups 1 and 3. Students in all three groups were better aware of the range of rates of
geological processes after the treatment activities, in particular that many geologic processes
can occur on human timescales. Qualitative (or open-ended) questions did not reveal any
especially striking differences in understanding of rates of geological processes between the
three treatment groups, but did illuminate some of the difficulties students had in making
interpretations from the time-lapse videos, most notably in discerning temporal variations in
the rate of a given geologic process. Furthermore, both the quantitative and qualitative
assessment questions demonstrate that both before and after photos and time-lapse videos are
effective at combating the misperception or notion that geology happens” over millions of
years.
Based on the steps described above to establish internal validity of the conclusions,
there is a high degree of confidence that the majority of the gains experienced by students on
the multiple choice questions were the result of the treatment activities rather than external
factors. However between-group comparisons of performance on the assessments have small
effect sizes and are generally not statistically significant given the obtained sample size. As a
105
result, it is difficult to make any strong claims about the superiority of any of the different
treatment methods over another.
Instead, strategically designed before and after photos appear equally effective at
increasing student understanding of rates of landscape change as compared to passive and
interactive viewing of time-lapse videos, although the method used here (interactive before
and after image sliders) is likely more effective than using static side-by-side images because
it involves an element of interactivity that makes comparing the two images easier and causes
changes in the landscape to appear more striking. Students who used before and after photos
were just as likely to report that they enjoyed the activity as students who used time-lapse
videos.
These are significant findings because using before and after photo pairs to depict
landscape change is much less time-consuming, less expensive, and possible in a much wider
variety of geologic settings than long-duration time-lapse video. While in some ways
before/after photos do not represent a given process as completely or in as much detail as a
time-lapse video, the simplicity of a before/after photo-pair may in some ways be easier for a
novice geology student to interpret than a rapidly changing time-lapse video and
consequently just as effective at helping a student understand rates of landscape change. In
some cases (i.e. Columbia Glacier), a time-lapse video may convey crucial information that
the before/after photo pair cannot offer and thus help reduce misconceptions if presented
along with appropriate narration or text background information.
Adding additional levels of interactivity by allowing students in Group 3 to create
their own time-lapse videos and modify the parameters (such as frame rate) of the videos did
not result in any substantive increase in student scores over the passive time-lapse group,
106
although it was not possible to track the extent to which these features were utilized by study
participants.
Ultimately, all three methods tested here show promise for increasing student
understanding of rates of landscape change, which is encouraging given that understanding
of rates of geological processes is something that has ramifications far beyond the geology
classroom. Rates of geological processes are involved in many decisions facing our society
today. While in an ideal world, these decisions would be made, or at the very least informed
by experienced geologists, unfortunately that is not always the case. Therefore, it is
instrumental to work towards promoting a populace that understands the basic and most
important principles of earth science, of which the rates of geologic processes is one.
Introductory geology classes are a key venue for instilling an appreciation for, and
understanding of, the wide variety of rates of landscape change in a large cross section of the
population given that most students in such classes will never take another earth science
course. Both time-lapse videos and before/after photos are effective tools that can be used to
emphasize the importance of understanding rates of geologic processes in introductory
geology courses. It is hoped that the lessons learned from this thesis will help and encourage
geology educators at all levels to apply these technologies more effectively, both inside and
outside the classroom, in order to help their students gain a better understanding of rates of
geological processes.
107
REFERENCES CITED
Ahn, Y., and Box, J.E., 2010, Glacier velocities from time-lapse photos: technique development and first results from the Extreme Ice Survey (EIS) in Greenland: Journal of Glaciology, v. 56, p. 723–734, doi: 10.3189/002214310793146313.
American Association for the Advancement of Science., n.d., AAAS Project 2061: http://assessment.aaas.org/ (accessed August 6 2014)
Ault, C.R., 1982, Time in geological explanations as perceived by elementary-school students: Journal of Geological Education, v. 30, p. 304–309.
Bailey, C.M., 2000, Rates of geologic processes; problems for an introductory geology course: Mathematical Geology, v. 32, p. 151–158.
Bardar, E.M., Prather, E.E., Brecher, K., and Slater, T.F., 2006, Development and Validation of the Light and Spectroscopy Concept Inventory: Astronomy Education Review, v. 5, p. 103–113, doi: 10.3847/AER2006020.
Bayer, T.M., and Linneman, S., 2011, The nature and transport of the fine-grained component of Swift Creek Landslide, Northwest Washington: Earth Surface Processes and Landforms, v. 36, p. 624–640, doi: 10.1002/esp.2081.
Beatty, P.C., and Willis, G.B., 2007, Research Synthesis: The Practice of Cognitive Interviewing: Public Opinion Quarterly, v. 71, p. 287–311, doi: 10.1093/poq/nfm006.
Belknap, E.P., and Gilmore, J.B., 1987, Use of time-lapse movie photography in landslide monitoring: Transportation Research Record, v. 1119, p. 39–46.
Burns, L.E., and Surveys, A.D. of G. and G., 1991, Geology of the northern Chugach Mountains, south central Alaska: Division of Geological & Geophysical Surveys, 76 p.
Cervato, C., and Frodeman, R., 2012, The significance of geologic time; cultural, educational, and economic frameworks: Special Paper - Geological Society of America, v. 486, p. 19–27, doi: 10.1130/2012.2486(03).
Cheek, K.A., 2012, Students’ Understanding of Large Numbers as a Key Factor in Their Understanding of Geologic Time: International Journal of Science and Mathematics Education, v. 10, p. 1047–1069.
Clark, S.K., and Libarkin, J.C., 2011, Designing a mixed-methods research instrument and scoring rubric to investigate individuals’ conceptions of plate tectonics: Geological Society of America Special Papers, v. 474, p. 81–96, doi: 10.1130/2011.2474(07).
108
Clary, R.M., Brzuszek, R.F., and Wandersee, J.H., 2009, Students’ geocognition of deep time, conceptualized in an informal educational setting: Journal of Geoscience Education, v. 57, p. 275–285.
Cohen, J., 1988, Statistical Power Analysis for the Behavioral Sciences: Hillsdale, N.J, Routledge, 590 p.
Conrad, S.H., 2005, Rates of Geologic Processes as an Introduction to Geoscience: 2005 Annual Meeting of the Geological Society of America, Salt Lake City, UT
Cruden, D.M., and Varnes, D.J., 1996, Landslide types and processes, in Landslides: Investigation and Mitigation, Washington, Transportation Research Board Special Report 247.
DeLaughter, J.E., Stein, S., Stein, C.A., and Bain, K.R., 1998, Preconceptions abound among students in an introductory earth science course: Eos, Transactions, American Geophysical Union, v. 79, p. 429.
Dodick, J., and Orion, N., 2004, Cognitive factors affecting student understanding of geological processes in time: International Geological Congress, Abstracts = Congres Geologique International, Resumes, v. 32, Part 2, p. 1303–1303.
Dodick, J., and Orion, N., 2003, Measuring student understanding of geological time: Science Education, v. 87, p. 708–731, doi: 10.1002/sce.1057.
Dove, J.E., 1998, Students’ alternative conceptions in Earth science: a review of research and implications for teaching and learning: Research Papers in Education, v. 13, p. 183–201, doi: 10.1080/0267152980130205.
Draut, A.E., Logan, J.B., and Mastin, M.C., 2011, Channel evolution on the dammed Elwha River, Washington, USA: Geomorphology, v. 127, p. 71–87, doi: 10.1016/j.geomorph.2010.12.008.
Draut, A.E., Logan, J.B., McCoy, R.E., McHenry, M., and Warrick, J.A., 2008, Channel evolution on the lower Elwha River, Washington, 1939-2006: U. S. Geological Survey : Reston, VA, United States.
Earth Science Literacy Initiative, 2010, Earth Science Literacy Principles: The Big Ideas and Supporting Concepts of Earth Science: http://www.earthscienceliteracy.org
Egholm, D.L., Knudsen, M.F., and Sandiford, M., 2013, Lifespan of mountain ranges scaled by feedbacks between landsliding and erosion by rivers: Nature, v. 498, p. 475–478, doi: 10.1038/nature12218.
Esri, 2012, Hurricane Sandy: The AfterMap: http://tmappsevents.esri.com/website/swipe-sandy-custom/ (accessed June 5 2014)
109
Extreme Ice Survey, 2009, Columbia Glacier, Alaska, Kadin Camera AK-01 (Narrated): http://vimeo.com/5414354 (accessed August 4 2014)
Fahnestock, R.K., 1966, Time-lapse photography for geologic teaching and research: Journal of Geological Education, v. 14, p. 127–130.
Fan, X., 2001, Statistical Significance and Effect Size in Education Research: Two Sides of a Coin: The Journal of Educational Research, v. 94, p. 275–282.
Faul, F., Erdfelder, E., Lang, A.-G., and Buchner, A., 2007, G*Power 3: A flexible statistical power analysis program for the social, behavioral, and biomedical sciences: Behavior Research Methods, v. 39, p. 175–191, doi: 10.3758/BF03193146.
Francek, M., 2013, A Compilation and Review of over 500 Geoscience Misconceptions: International Journal of Science Education, v. 35, p. 31–64, doi: 10.1080/09500693.2012.736644.
Frey, B.B., Petersen, S., Edwards, L.M., Pedrotti, J.T., and Peyton, V., 2005, Item-writing rules: Collective wisdom: Teaching and Teacher Education, v. 21, doi: 10.1016/j.tate.2005.01.008.
Gay, L.R., and Airasian, P., 2003, Educational Research Competencies for Analysis and Applications (7th edition): Upper Saddle River, New Jersey, Merrill/Prentice Hall, 605 p.
Gay, L.R., Mills, G.E., and Airasian, P.W., 2008, Educational research competencies for analysis and applications (9th Edition): Upper Saddle River, New Jersey, Prentice Hall, 648 p.
Gilbert, L.A.S., 2012, Not Just “Rocks for Jocks”: Who Are Introductory Geology Students and Why Are They Here? Journal of Geoscience Education, v. 60, p. 360–371, doi: 10.5408/12-287.1.
Halloun, I.A., 1985, The initial knowledge state of college physics students: American Journal of Physics, v. 53, p. 1043, doi: 10.1119/1.14030.
Harlow, A., and Jones, A., 2004, Why Students Answer TIMSS Science Test Items the Way They Do: Research in Science Education, v. 34, p. 221–238, doi: 10.1023/B:RISE.0000033761.79449.56.
Holland, A.S.P., Watson, I.M., Phillips, J.C., Caricchi, L., and Dalton, M.P., 2011, Degassing processes during lava dome growth: Insights from Santiaguito lava dome, Guatemala: Journal of Volcanology and Geothermal Research, v. 202, p. 153–166, doi: 10.1016/j.jvolgeores.2011.02.004.
Hutton, J., 1788, Theory of the Earth; or an investigation of the laws observable in the composition, dissolution, and restoration of land upon the Globe:.
110
Johnson, R.B., and Onwuegbuzie, A.J., 2004, Mixed Methods Research: A Research Paradigm Whose Time Has Come: Educational Researcher, v. 33, p. 14–26, doi: 10.3102/0013189X033007014.
Jolley, A.R., 2010, Identifying Landscapes and their Formation Timescales: Comparing Knowledge and Confidence of Beginner and Advanced Geoscience Undergraduate Students [B.S. Honors Thesis]: University of British Columbia.
Karpilo Jr., R., Molnia, B.F., and Pranger, H.S., 2006, Animating Repeat Glacier Photography--A Tool for Science and Education: Proceedings of the Fourth Glacier Bay Science Symposium, U.S. Geological Survey Scientific Investigations Report 2007-5047, p. 66–67.
Kendeou, P., and Van Den Broek, P., 2005, The Effects of Readers’ Misconceptions on Comprehension of Scientific Text: Journal of Educational Psychology, v. 97, p.235-245.
Kirkby, K., 2011, “Easier to Address” Earth Science Misconceptions: http://serc.carleton.edu/NAGTWorkshops/intro/misconception_list.html (accessed June 3 2014)
Klenk, K.E., 2012, Computer animation in teaching science: Effectiveness in teaching retrograde motion to 9th graders [PhD thesis]: University of Rhode Island.
Kortz, K.M., Clark, S.K., Gray, K., Smay, J.J., Viveiros, B., and Steer, D., 2011, Counting tectonic plates: A mixed-methods study of college students’ conceptions of plates and boundaries: Geological Society of America Special Papers, v. 474, p. 171–188, doi: 10.1130/2011.2474(12).
Libarkin, J.C., Anderson, S.W., Dahl, J., Beilfuss, M., and Boone, W., 2005, Qualitative analysis of college students’ ideas about the Earth; interviews and open-ended questionnaires: Journal of Geoscience Education, v. 53, p. 17–26.
Libarkin, J.C., Anderson, S.W., Deeds, D., and Callen, B., 2007, Development of the geoscience concept inventory, in Proceedings of the National STEM Assessment Conference, Washington DC, p. 148–158.
Libarkin, J.C., Kurdziel, J.P., and Anderson, S.W., 2007, College student conceptions of geological time and the disconnect between ordering and scale: Journal of Geoscience Education, v. 55, p. 413–422.
Libarkin, J.C., and Ward, E.M.G., 2011, The qualitative underpinnings of quantitative concept inventory questions: Geological Society of America Special Papers, v. 474, p. 37–48, doi: 10.1130/2011.2474(04).
111
Lorenz, R.D., and Valdez, A., 2011, Variable wind ripple migration at Great Sand Dunes National Park and Preserve, observed by time-lapse imaging: Geomorphology, v. 133, p. 1–10, doi: 10.1016/j.geomorph.2011.06.003.
Lowe, R., and Schnotz, W., 2008, Learning with Animation: Research Implications for Design: New York, Cambridge University Press, 403 p.
Malone, M., 2005, The effect of interactive computer animations on introductory geology students’ conceptual understanding of mountain building processes [M.S. thesis]: Western Washington University.
Manduca, C.A., and Kastens, K.A., 2012, Geoscience and geoscientists; uniquely equipped to study Earth: Special Paper - Geological Society of America, v. 486, p. 1–12, doi: 10.1130/2012.2486(01).
Mayer, R.E., 2001, Multimedia learning: New York, Cambridge University Press, 222 p.
McCrum-Gardner, E., 2008, Which is the correct statistical test to use? The British journal of oral & maxillofacial surgery, v. 46, p. 38–41, doi: 10.1016/j.bjoms.2007.09.002.
McKenzie-Johnson, A., 2004, Kinematics of the Swift Creek landslide, northwest Washington [M.S. Thesis]: Western Washington University, 73 p.
McPhee, J., 1981, Basin and Range: New York, Macmillan, 242 p.
Mikkilä-Erdmann, M., 2001, Improving conceptual change concerning photosynthesis through text design: Learning and Instruction, v. 11, p. 241–257, doi: 10.1016/S0959-4752(00)00041-4.
Miller, R.D., and Crandell, D.R., 1959, Time-lapse motion picture technique applied to the study of geological processes: Science, v. 130, p. 795–796.
Morrison, J.B., and Tversky, B., 2001, The (in)Effectiveness of Animation in Instruction, in CHI ’01 Extended Abstracts on Human Factors in Computing Systems, CHI EA ’01, New York, NY, USA, ACM, p. 377–378.
NASA, 2014, Images of Change: http://climate.nasa.gov/state_of_flux (accessed June 5 2014)
National Research Council (U.S.), 2000, How people learn: brain, mind, experience, and school: Washington, D.C, National Academy Press, 374 p.
New Zealand Herald, 2012, Franz Josef Glacier’s “rapid” retreat (+photos): New Zealand Herald: http://www.nzherald.co.nz/nz/news/article.cfm?c_id=1&objectid=10818264 (accessed June 5 2014)
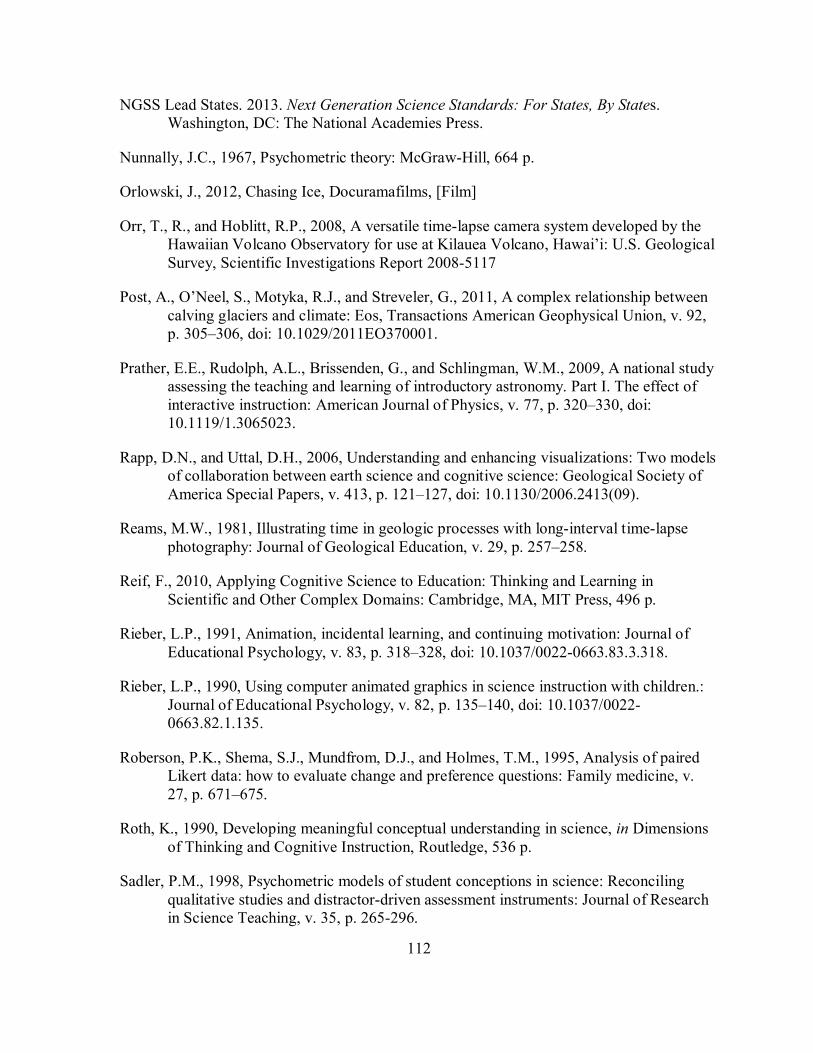
112
NGSS Lead States. 2013. Next Generation Science Standards: For States, By States. Washington, DC: The National Academies Press.
Nunnally, J.C., 1967, Psychometric theory: McGraw-Hill, 664 p.
Orlowski, J., 2012, Chasing Ice, Docuramafilms, [Film]
Orr, T., R., and Hoblitt, R.P., 2008, A versatile time-lapse camera system developed by the Hawaiian Volcano Observatory for use at Kilauea Volcano, Hawai’i: U.S. Geological Survey, Scientific Investigations Report 2008-5117
Post, A., O’Neel, S., Motyka, R.J., and Streveler, G., 2011, A complex relationship between calving glaciers and climate: Eos, Transactions American Geophysical Union, v. 92, p. 305–306, doi: 10.1029/2011EO370001.
Prather, E.E., Rudolph, A.L., Brissenden, G., and Schlingman, W.M., 2009, A national study assessing the teaching and learning of introductory astronomy. Part I. The effect of interactive instruction: American Journal of Physics, v. 77, p. 320–330, doi: 10.1119/1.3065023.
Rapp, D.N., and Uttal, D.H., 2006, Understanding and enhancing visualizations: Two models of collaboration between earth science and cognitive science: Geological Society of America Special Papers, v. 413, p. 121–127, doi: 10.1130/2006.2413(09).
Reams, M.W., 1981, Illustrating time in geologic processes with long-interval time-lapse photography: Journal of Geological Education, v. 29, p. 257–258.
Reif, F., 2010, Applying Cognitive Science to Education: Thinking and Learning in Scientific and Other Complex Domains: Cambridge, MA, MIT Press, 496 p.
Rieber, L.P., 1991, Animation, incidental learning, and continuing motivation: Journal of Educational Psychology, v. 83, p. 318–328, doi: 10.1037/0022-0663.83.3.318.
Rieber, L.P., 1990, Using computer animated graphics in science instruction with children.: Journal of Educational Psychology, v. 82, p. 135–140, doi: 10.1037/0022-0663.82.1.135.
Roberson, P.K., Shema, S.J., Mundfrom, D.J., and Holmes, T.M., 1995, Analysis of paired Likert data: how to evaluate change and preference questions: Family medicine, v. 27, p. 671–675.
Roth, K., 1990, Developing meaningful conceptual understanding in science, in Dimensions of Thinking and Cognitive Instruction, Routledge, 536 p.
Sadler, P.M., 1998, Psychometric models of student conceptions in science: Reconciling qualitative studies and distractor-driven assessment instruments: Journal of Research in Science Teaching, v. 35, p. 265-296.
113
San Jose Mercury News, 2012, Hurricane Sandy before and after images (interactive): MercuryNews.com: http://www.mercurynews.com/storm-center/ci_21915774/hurricane-sandy-before-and-after-images-interactive (accessed June 5 2014)
Schilling, S.P., Dzurisin, D., Major, J.J., Moran, S.C., Gooding, D.J., and Poland, M.P., 2007, Time-lapse images of dacite dome growth at Mount St. Helens, Washington, 2004-2007, Eos Trans. American Geophysical Union, v.88(52), Fall Meet. Suppl., Abstract V51D-0774
Schnotz, W., Böckheler, J., and Grzondziel, H., 1999, Individual and co-operative learning with interactive animated pictures: European Journal of Psychology of Education, v. 14, p. 245–265, doi: 10.1007/BF03172968.
Schoon, K.J., 1995, The origin and extent of alternative conceptions in the earth and space sciences: A survey of pre-service elementary teachers: Journal of Elementary Science Education, v. 7, p. 27–46, doi: 10.1007/BF03173734.
Schultz, L.J.S., 2007, Using time-lapse and stroboscopic photography to enhance student understanding of plant growth, structure, and pollination: An inquiry-based study [PhD thesis]: Louisiana State University.
Seattle Times, 2014, Latest aerial imagery of the Oso mudslide: http://seattletimes.com/html/specialreportspages/2023275502_map-before-after-oso-mudslide.html (accessed June 5 2014)
Shadish, W.R., Cook, T.D., and Campbell, D.T., 2001, Experimental and quasi-experimental designs for generalized causal inference: Boston, Houghton Mifflin, 656 p.
Sharp, R.P., 1982, Landscape evolution; a review: Proceedings of the National Academy of Sciences of the United States of America, v. 79, p. 4477–4486.
Shea, J.H., 1982, Twelve fallacies of uniformitarianism: Geology, v. 10, p. 455–460, doi: 10.1130/0091-7613(1982)10<455:TFOU>2.0.CO;2.
Siragusa, L., Dixon, K.C., Siragusa, L., and Dixon, K.C., 2006, A Research Methodology: The Development of Survey Instruments for Research into Online Learning in Higher Education: Issues in Educational Research, v. 16, p. 206–225.
Smith, R., Sammonds, P.R., Tuffen, H., and Meredith, P.G., 2011, Evolution of the mechanics of the 2004–2008 Mt. St. Helens lava dome with time and temperature: Earth and Planetary Science Letters, v. 307, p. 191–200, doi: 10.1016/j.epsl.2011.04.044.
Szpunar, K.K., Khan, N.Y., and Schacter, D.L., 2013, Interpolated memory tests reduce mind wandering and improve learning of online lectures: Proceedings of the National Academy of Sciences, v. 110, p. 6313–6317, doi: 10.1073/pnas.1221764110.
114
Tarbuck, E.J., and Lutgens, F.K., 2005, Earth: an introduction to physical geology: Upper Saddle River, N.J, Pearson/Prentice Hall, 711 p.
Taylor, M., and Smith, S., 2009, How Do You Know if They’re Getting It? Writing Assessment Items that Reveal Student Understanding: Science Scope, v. 32, p. 60–64.
Thatcher, J.D., 2006, Computer animation and improved student comprehension of basic science concepts: The Journal Of The American Osteopathic Association, v. 106, p. 9–14.
Trend, R.D., 2001, Deep time framework: a preliminary study of U.K. primary teachers’ conceptions of geological time and perceptions of geoscience: Journal of Research in Science Teaching, v. 38, p. 191–221, doi: 10.1002/1098-2736(200102)38:2<191::AID-TEA1003>3.3.CO;2-3.
Tversky, B., Morrison, J.B., and Betrancourt, M., 2002, Animation: can it facilitate?: International Journal of Human-Computer Studies, v. 57, p. 247–262, doi: 10.1006/ijhc.2002.1017.
Vosniadou, S., 2007, Conceptual Change and Education: Human Development, v. 50, p. 47–54, doi: 10.1159/000097684.
Walters, R.A., and Dunlap, W.W., 1987, Analysis of time series of glacier speed: Columbia Glacier, Alaska: Journal of Geophysical Research: Solid Earth, v. 92, p. 8969–8975, doi: 10.1029/JB092iB09p08969.
Western Washington University, O. of I.R., 2013, Student Profile Report: Enrollment Demographics:.
Zen, E. -a., 2001, What is deep time and why should anyone care? Journal of Geoscience Education, v. 49.
Zhang, D., 2005, Interactive Multimedia-Based E-Learning: A Study of Effectiveness: American Journal of Distance Education, v. 19, p. 149–162, doi: 10.1207/s15389286ajde1903_3.
115
TABLES
Table 1-Summary of time-lapse data sets used in the study
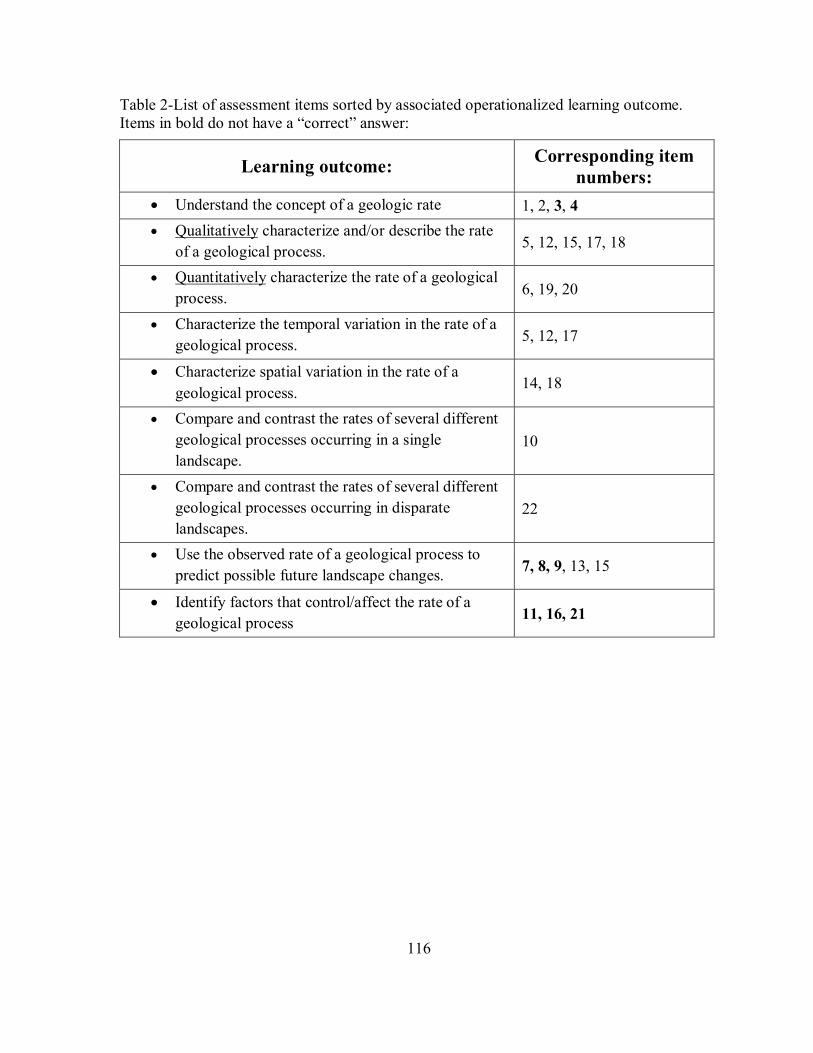
116
Table 2-List of assessment items sorted by associated operationalized learning outcome. Items in bold do not have a “correct” answer:
Learning outcome: Corresponding item
numbers:
Understand the concept of a geologic rate 1, 2, 3, 4
Qualitatively characterize and/or describe the rate
of a geological process. 5, 12, 15, 17, 18
Quantitatively characterize the rate of a geological
process. 6, 19, 20
Characterize the temporal variation in the rate of a
geological process. 5, 12, 17
Characterize spatial variation in the rate of a
geological process. 14, 18
Compare and contrast the rates of several different
geological processes occurring in a single
landscape. 10
Compare and contrast the rates of several different
geological processes occurring in disparate
landscapes. 22
Use the observed rate of a geological process to
predict possible future landscape changes. 7, 8, 9, 13, 15
Identify factors that control/affect the rate of a
geological process 11, 16, 21
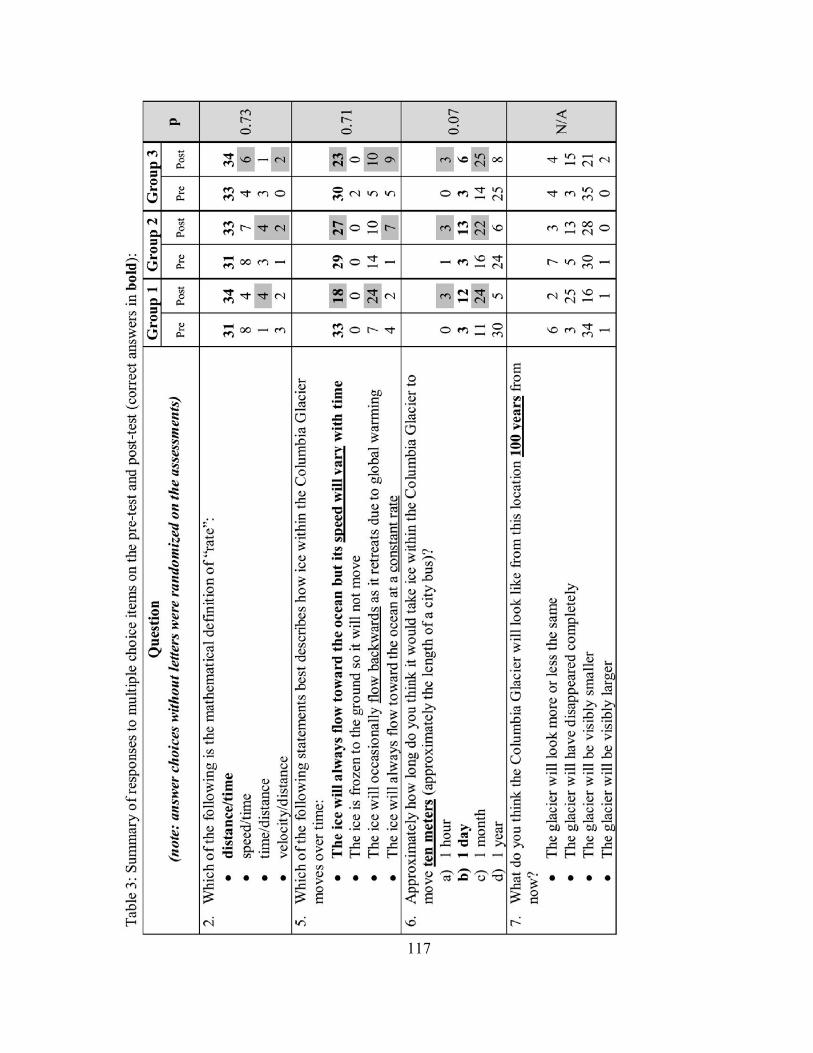
117
Table 3-Summary of responses to multiple choice items on the pre-test and post-test
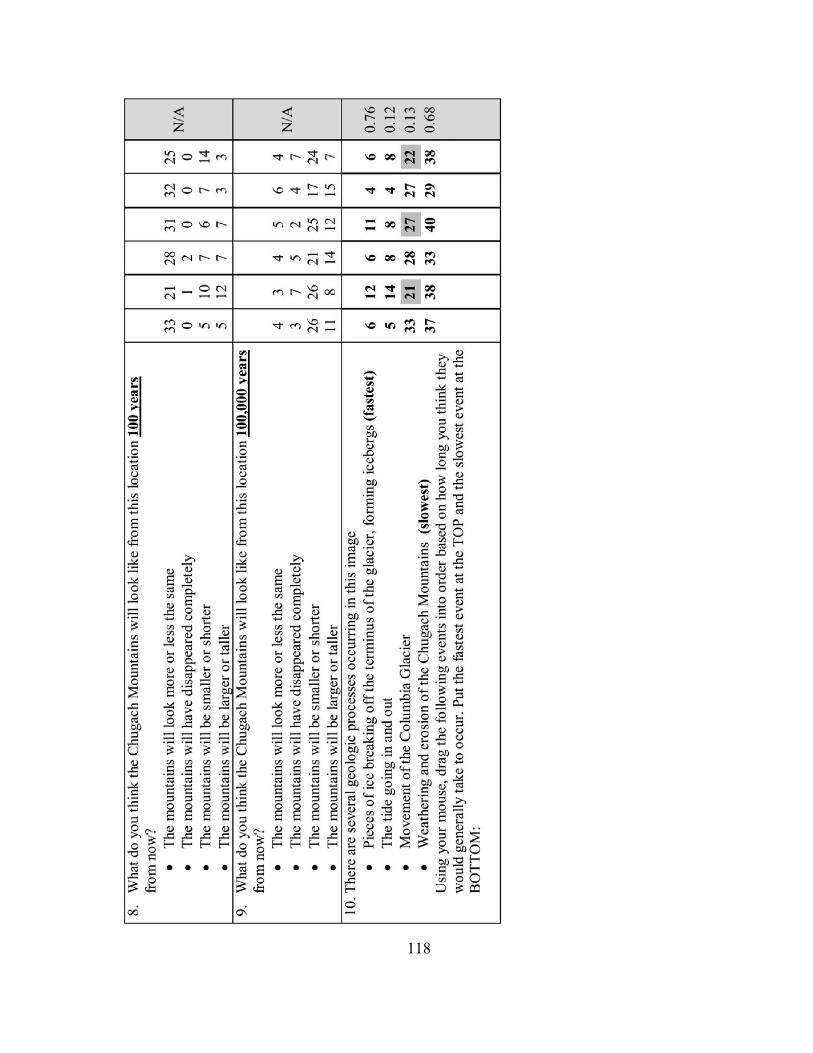
118
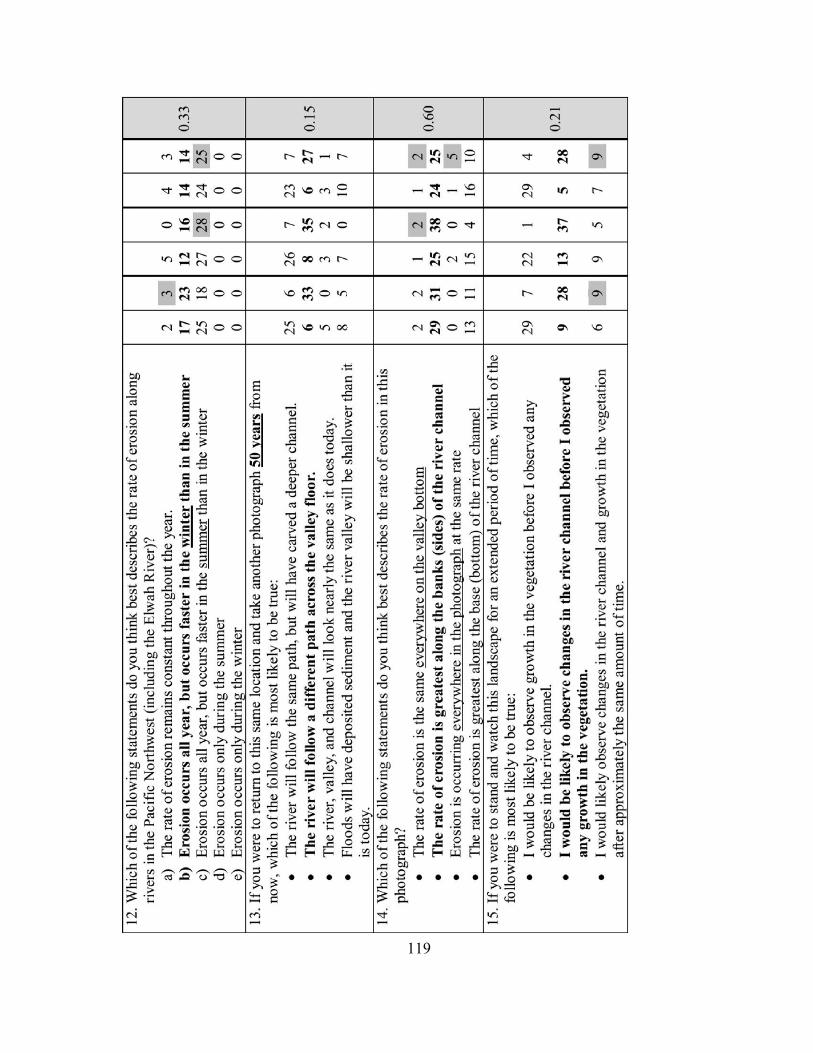
119
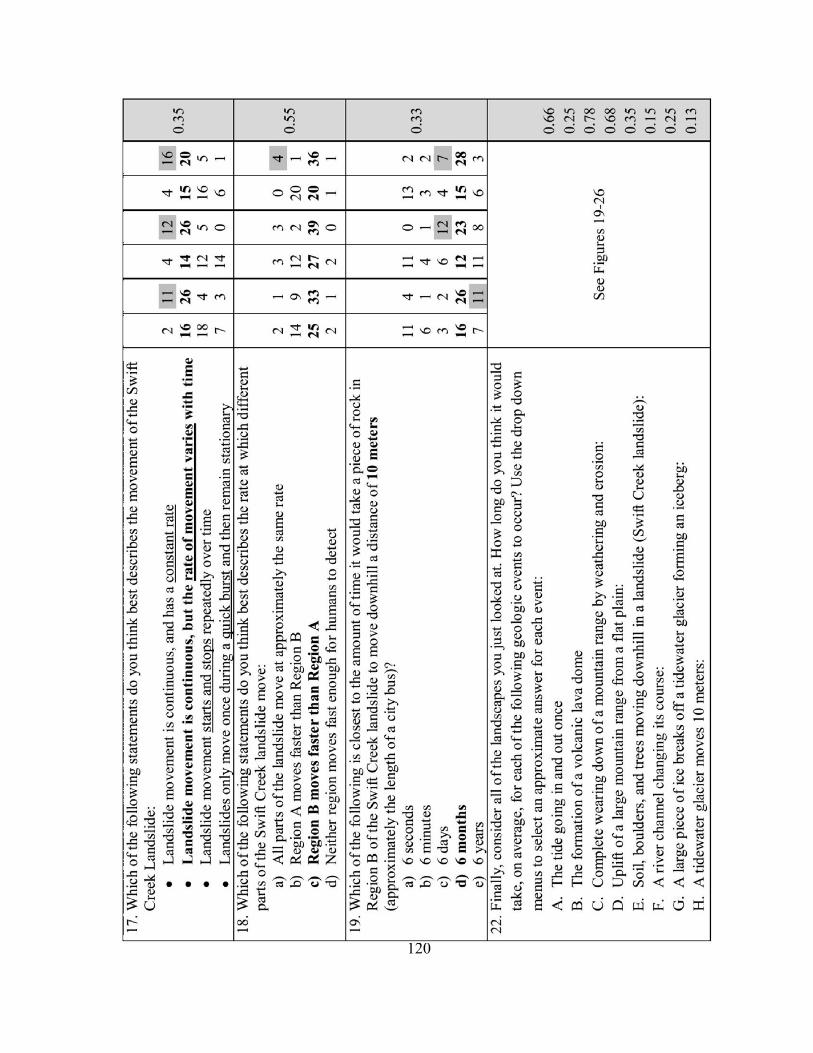
120
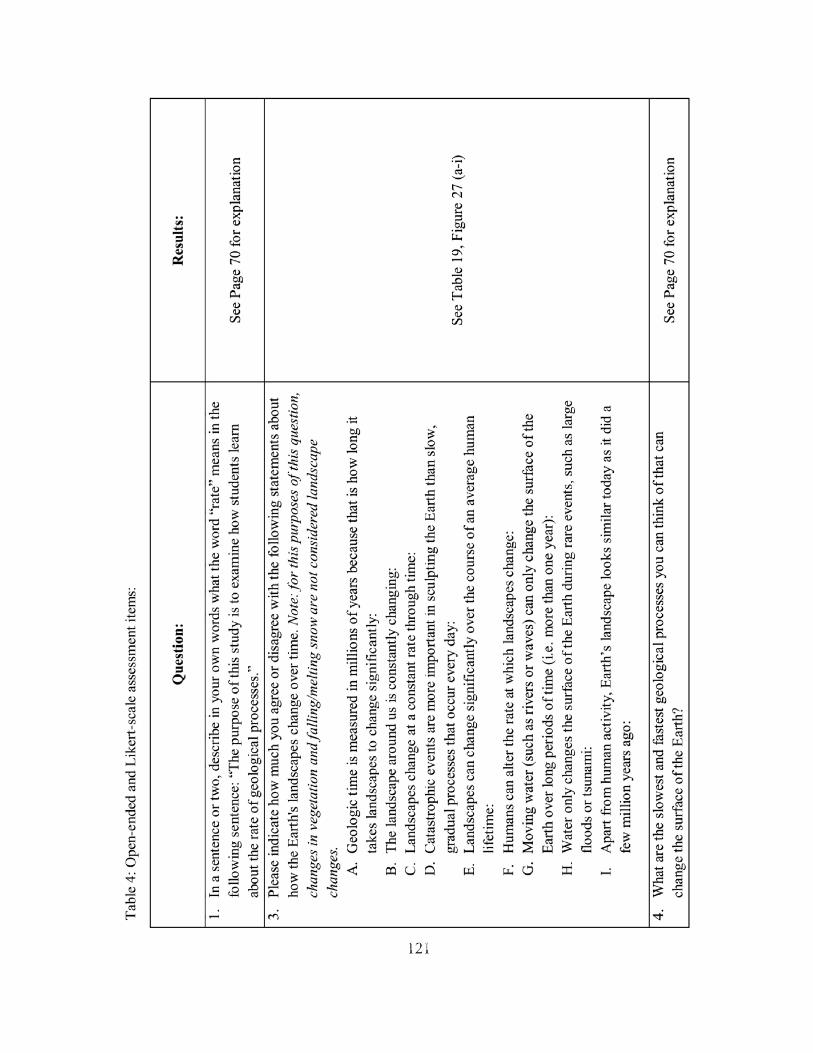
121 Table 4-Open-ended and Likert-scale assessment items:
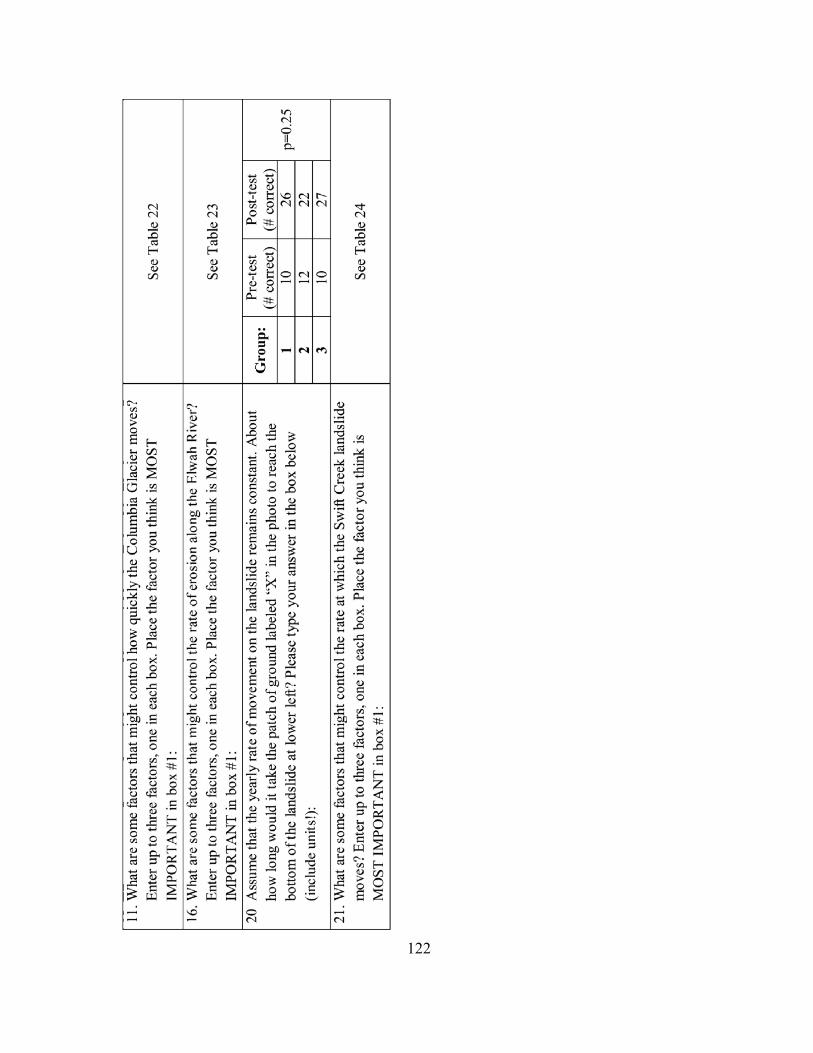
122
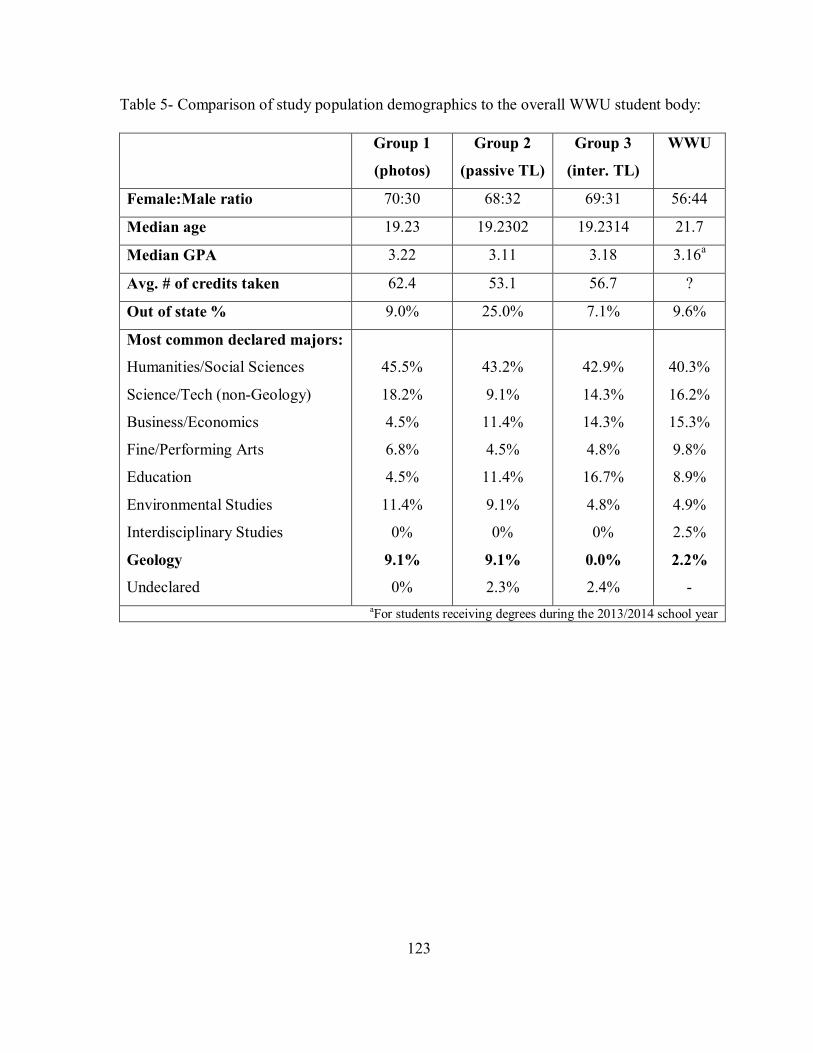
123
Table 5- Comparison of study population demographics to the overall WWU student body:
Group 1
(photos)
Group 2
(passive TL)
Group 3
(inter. TL)
WWU
Female:Male ratio 70:30 68:32 69:31 56:44
Median age 19.23 19.2302 19.2314 21.7
Median GPA 3.22 3.11 3.18 3.16a
Avg. # of credits taken 62.4 53.1 56.7 ?
Out of state % 9.0% 25.0% 7.1% 9.6%
Most common declared majors:
Humanities/Social Sciences
Science/Tech (non-Geology)
Business/Economics
Fine/Performing Arts
Education
Environmental Studies
Interdisciplinary Studies
Geology
Undeclared
45.5%
18.2%
4.5%
6.8%
4.5%
11.4%
0%
9.1%
0%
43.2%
9.1%
11.4%
4.5%
11.4%
9.1%
0%
9.1%
2.3%
42.9%
14.3%
14.3%
4.8%
16.7%
4.8%
0%
0.0%
2.4%
40.3%
16.2%
15.3%
9.8%
8.9%
4.9%
2.5%
2.2%
- aFor students receiving degrees during the 2013/2014 school year
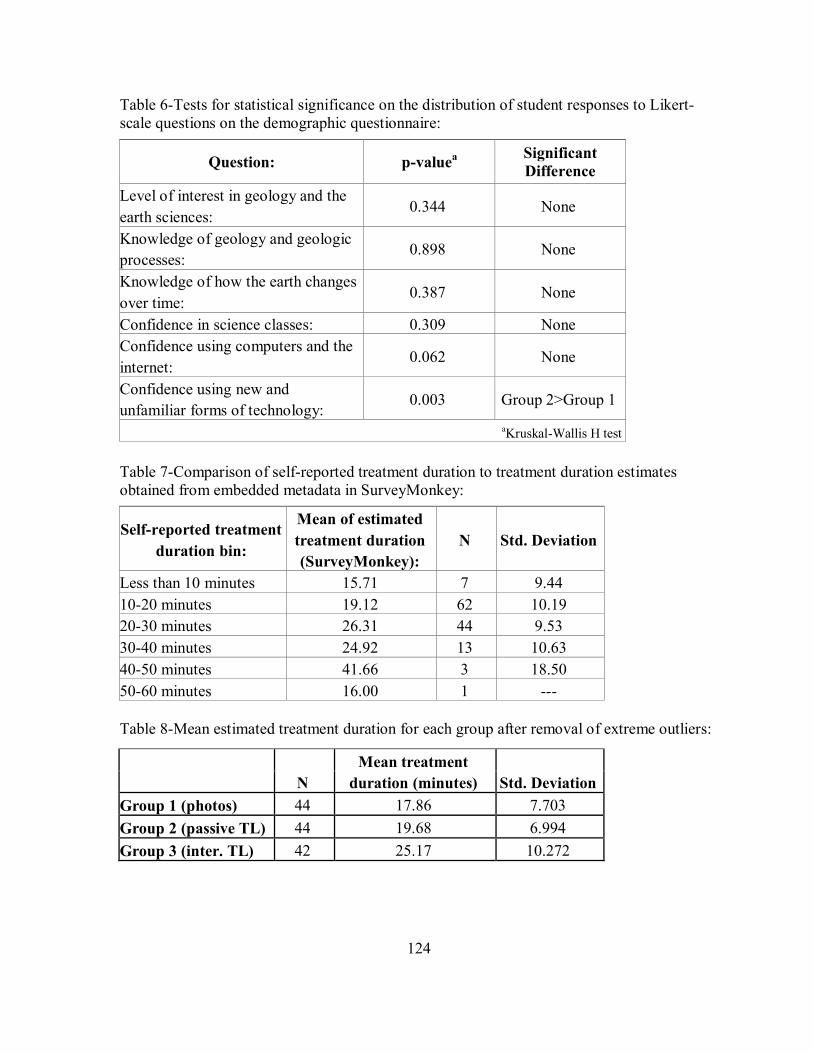
124
Table 6-Tests for statistical significance on the distribution of student responses to Likert-scale questions on the demographic questionnaire:
Table 7-Comparison of self-reported treatment duration to treatment duration estimates obtained from embedded metadata in SurveyMonkey:
Table 8-Mean estimated treatment duration for each group after removal of extreme outliers:
Question: p-valuea Significant Difference
Level of interest in geology and the
earth sciences: 0.344 None
Knowledge of geology and geologic
processes: 0.898 None
Knowledge of how the earth changes
over time: 0.387 None
Confidence in science classes: 0.309 None
Confidence using computers and the
internet: 0.062 None
Confidence using new and
unfamiliar forms of technology: 0.003 Group 2>Group 1
aKruskal-Wallis H test
Self-reported treatment
duration bin:
Mean of estimated
treatment duration
(SurveyMonkey):
N Std. Deviation
Less than 10 minutes 15.71 7 9.44
10-20 minutes 19.12 62 10.19
20-30 minutes 26.31 44 9.53
30-40 minutes 24.92 13 10.63
40-50 minutes 41.66 3 18.50
50-60 minutes 16.00 1 ---
N
Mean treatment
duration (minutes) Std. Deviation
Group 1 (photos) 44 17.86 7.703
Group 2 (passive TL) 44 19.68 6.994
Group 3 (inter. TL) 42 25.17 10.272
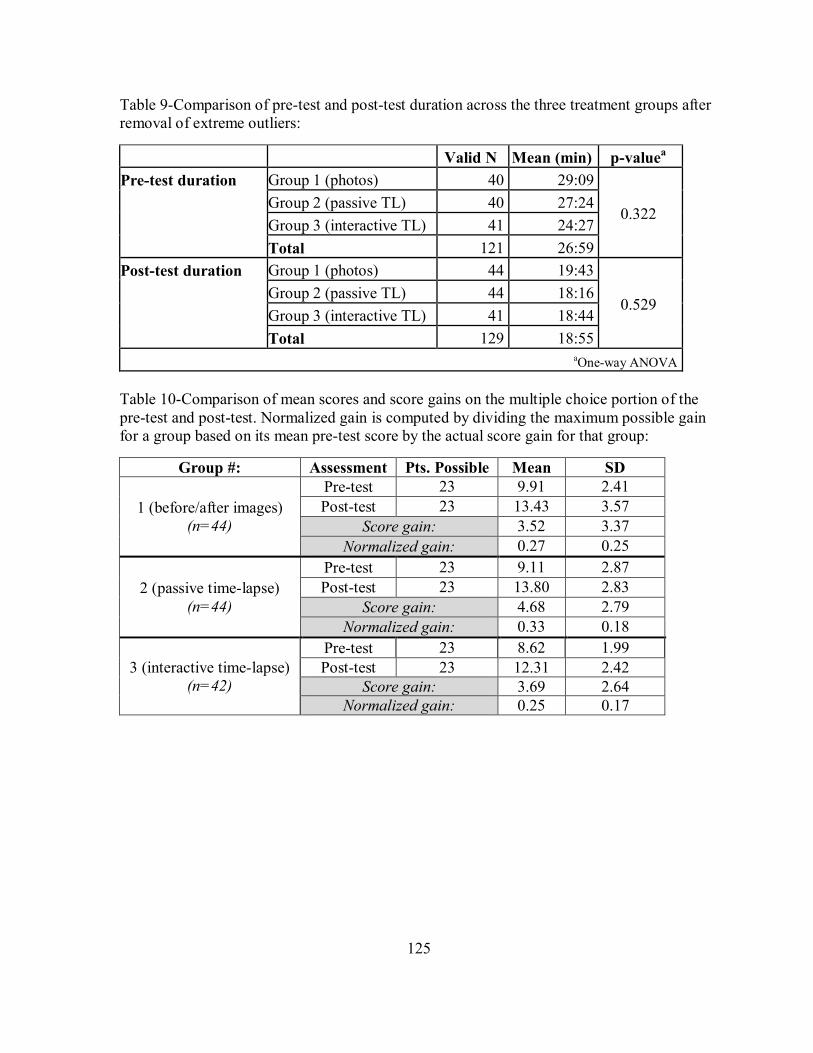
125
Table 9-Comparison of pre-test and post-test duration across the three treatment groups after removal of extreme outliers:
Table 10-Comparison of mean scores and score gains on the multiple choice portion of the pre-test and post-test. Normalized gain is computed by dividing the maximum possible gain for a group based on its mean pre-test score by the actual score gain for that group:
Valid N Mean (min) p-valuea
Pre-test duration Group 1 (photos) 40 29:09
0.322 Group 2 (passive TL) 40 27:24
Group 3 (interactive TL) 41 24:27
Total 121 26:59
Post-test duration Group 1 (photos) 44 19:43
0.529 Group 2 (passive TL) 44 18:16
Group 3 (interactive TL) 41 18:44
Total 129 18:55 aOne-way ANOVA
Group #: Assessment Pts. Possible Mean SD
1 (before/after images) (n=44)
Pre-test 23 9.91 2.41
Post-test 23 13.43 3.57
Score gain: 3.52 3.37
Normalized gain: 0.27 0.25
2 (passive time-lapse) (n=44)
Pre-test 23 9.11 2.87
Post-test 23 13.80 2.83
Score gain: 4.68 2.79
Normalized gain: 0.33 0.18
3 (interactive time-lapse) (n=42)
Pre-test 23 8.62 1.99 Post-test 23 12.31 2.42
Score gain: 3.69 2.64 Normalized gain: 0.25 0.17
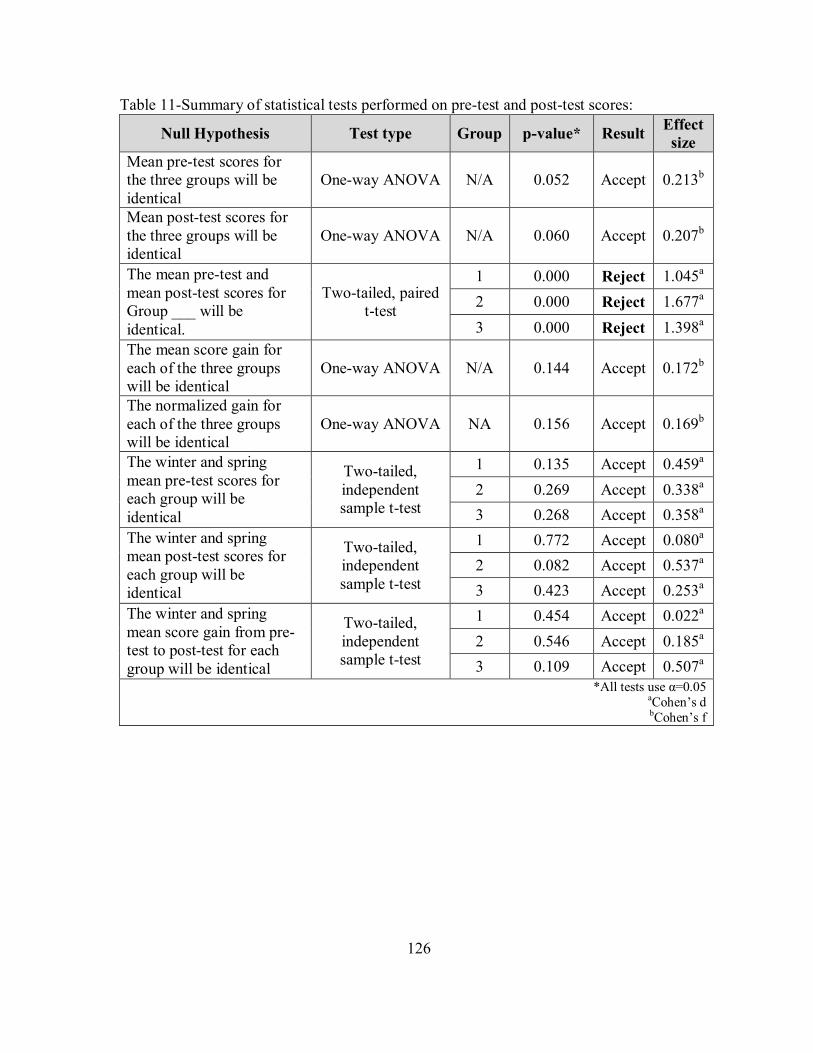
126
Table 11-Summary of statistical tests performed on pre-test and post-test scores:
Null Hypothesis Test type Group p-value* Result Effect size
Mean pre-test scores for the three groups will be identical
One-way ANOVA N/A 0.052 Accept 0.213b
Mean post-test scores for the three groups will be identical
One-way ANOVA N/A 0.060 Accept 0.207b
The mean pre-test and mean post-test scores for Group ___ will be identical.
Two-tailed, paired t-test
1 0.000 Reject 1.045a
2 0.000 Reject 1.677a
3 0.000 Reject 1.398a
The mean score gain for each of the three groups will be identical
One-way ANOVA N/A 0.144 Accept 0.172b
The normalized gain for each of the three groups will be identical
One-way ANOVA NA 0.156 Accept 0.169b
The winter and spring mean pre-test scores for each group will be identical
Two-tailed, independent sample t-test
1 0.135 Accept 0.459a
2 0.269 Accept 0.338a
3 0.268 Accept 0.358a
The winter and spring mean post-test scores for each group will be identical
Two-tailed, independent sample t-test
1 0.772 Accept 0.080a
2 0.082 Accept 0.537a
3 0.423 Accept 0.253a
The winter and spring mean score gain from pre-test to post-test for each group will be identical
Two-tailed, independent sample t-test
1 0.454 Accept 0.022a
2 0.546 Accept 0.185a
3 0.109 Accept 0.507a *All tests use α=0.05
aCohen’s d bCohen’s f
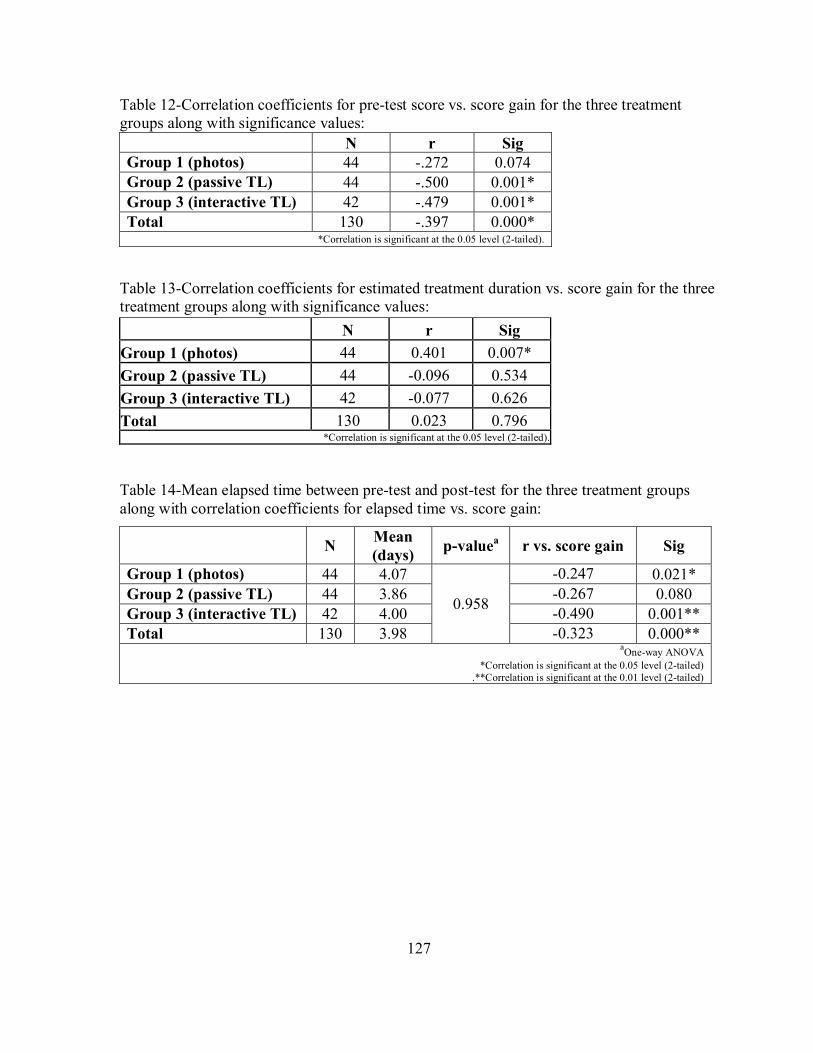
127
Table 12-Correlation coefficients for pre-test score vs. score gain for the three treatment groups along with significance values:
Table 13-Correlation coefficients for estimated treatment duration vs. score gain for the three treatment groups along with significance values:
Table 14-Mean elapsed time between pre-test and post-test for the three treatment groups along with correlation coefficients for elapsed time vs. score gain:
N r Sig Group 1 (photos) 44 -.272 0.074 Group 2 (passive TL) 44 -.500 0.001* Group 3 (interactive TL) 42 -.479 0.001* Total 130 -.397 0.000*
*Correlation is significant at the 0.05 level (2-tailed).
N r Sig
Group 1 (photos) 44 0.401 0.007*
Group 2 (passive TL) 44 -0.096 0.534
Group 3 (interactive TL) 42 -0.077 0.626
Total 130 0.023 0.796 *Correlation is significant at the 0.05 level (2-tailed).
N Mean (days)
p-valuea r vs. score gain Sig
Group 1 (photos) 44 4.07
0.958
-0.247 0.021* Group 2 (passive TL) 44 3.86 -0.267 0.080 Group 3 (interactive TL) 42 4.00 -0.490 0.001** Total 130 3.98 -0.323 0.000**
aOne-way ANOVA
*Correlation is significant at the 0.05 level (2-tailed) .**Correlation is significant at the 0.01 level (2-tailed)
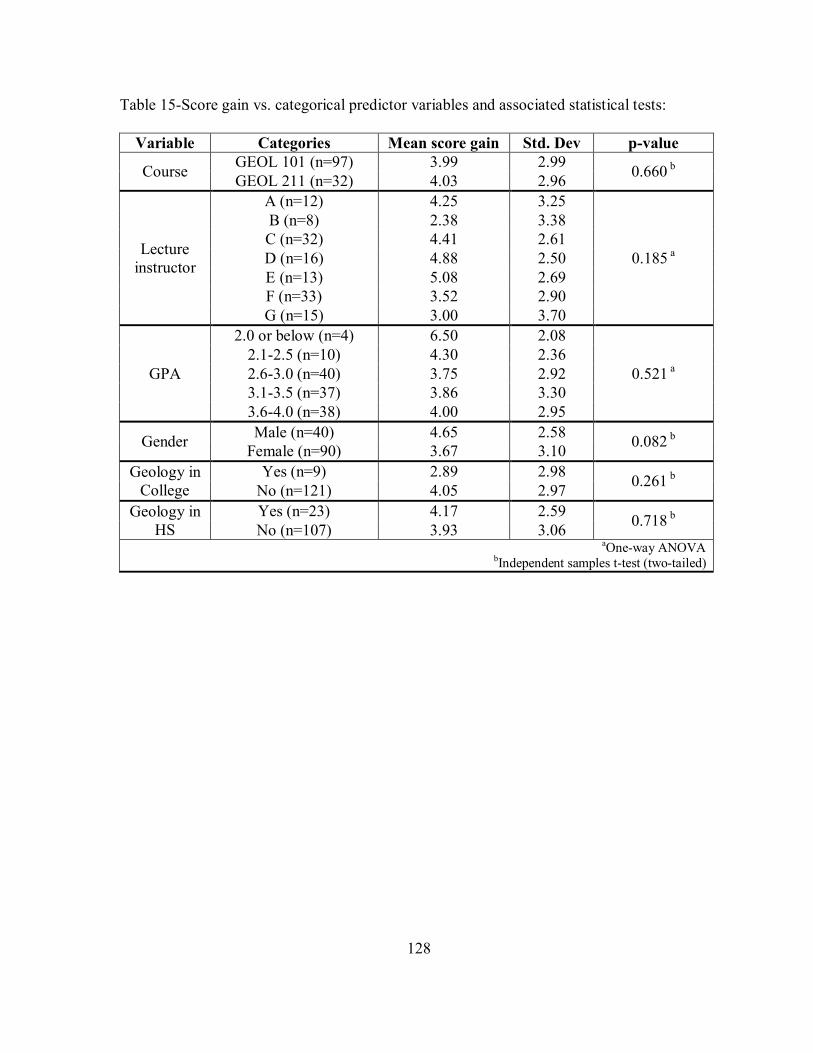
128
Table 15-Score gain vs. categorical predictor variables and associated statistical tests:
Variable Categories Mean score gain Std. Dev p-value
Course GEOL 101 (n=97) 3.99 2.99
0.660 b GEOL 211 (n=32) 4.03 2.96
Lecture instructor
A (n=12) 4.25 3.25
0.185 a
B (n=8) 2.38 3.38 C (n=32) 4.41 2.61 D (n=16) 4.88 2.50 E (n=13) 5.08 2.69 F (n=33) 3.52 2.90 G (n=15) 3.00 3.70
GPA
2.0 or below (n=4) 6.50 2.08
0.521 a 2.1-2.5 (n=10) 4.30 2.36 2.6-3.0 (n=40) 3.75 2.92 3.1-3.5 (n=37) 3.86 3.30 3.6-4.0 (n=38) 4.00 2.95
Gender Male (n=40) 4.65 2.58
0.082 b Female (n=90) 3.67 3.10
Geology in College
Yes (n=9) 2.89 2.98 0.261 b
No (n=121) 4.05 2.97
Geology in HS
Yes (n=23) 4.17 2.59 0.718 b
No (n=107) 3.93 3.06 aOne-way ANOVA
bIndependent samples t-test (two-tailed)
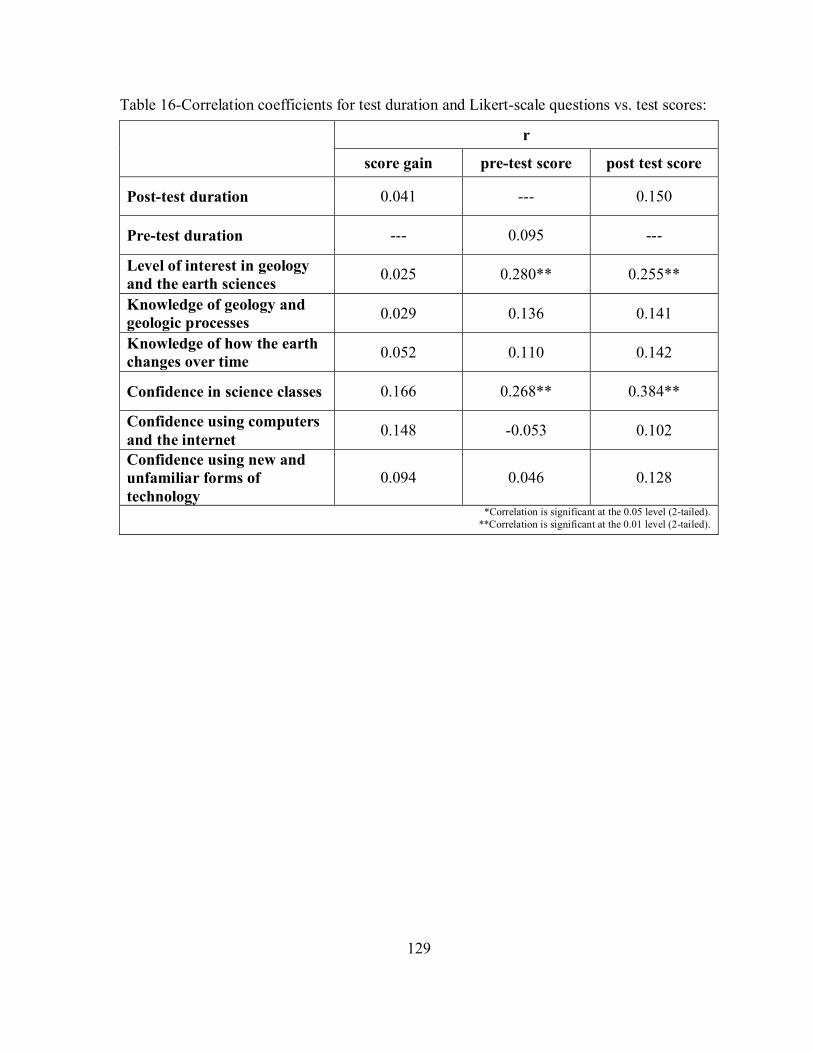
129
Table 16-Correlation coefficients for test duration and Likert-scale questions vs. test scores:
r
score gain pre-test score post test score
Post-test duration 0.041 --- 0.150
Pre-test duration --- 0.095 ---
Level of interest in geology and the earth sciences
0.025 0.280** 0.255**
Knowledge of geology and geologic processes
0.029 0.136 0.141
Knowledge of how the earth changes over time
0.052 0.110 0.142
Confidence in science classes 0.166 0.268** 0.384**
Confidence using computers and the internet
0.148 -0.053 0.102
Confidence using new and unfamiliar forms of technology
0.094 0.046 0.128
*Correlation is significant at the 0.05 level (2-tailed). **Correlation is significant at the 0.01 level (2-tailed).
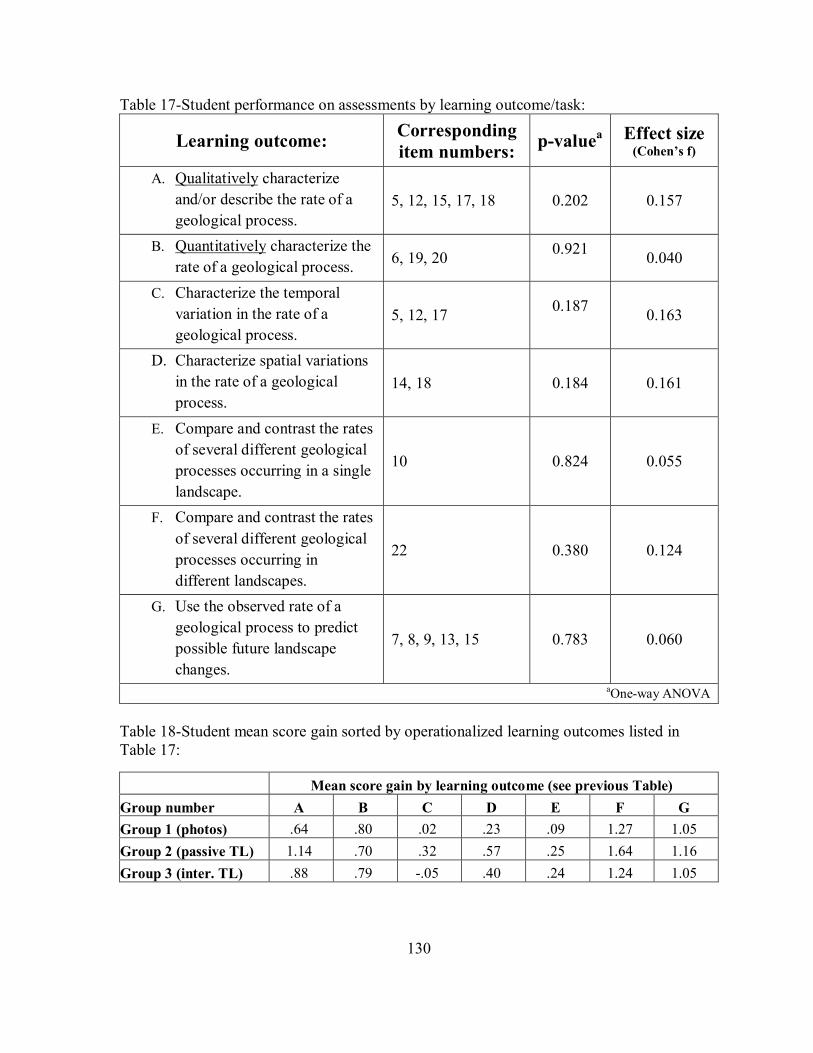
130
Table 17-Student performance on assessments by learning outcome/task:
Learning outcome: Corresponding item numbers:
p-valuea Effect size (Cohen’s f)
A. Qualitatively characterize
and/or describe the rate of a
geological process. 5, 12, 15, 17, 18 0.202 0.157
B. Quantitatively characterize the
rate of a geological process. 6, 19, 20
0.921
0.040
C. Characterize the temporal
variation in the rate of a
geological process. 5, 12, 17
0.187
0.163
D. Characterize spatial variations
in the rate of a geological
process. 14, 18 0.184 0.161
E. Compare and contrast the rates
of several different geological
processes occurring in a single
landscape.
10 0.824 0.055
F. Compare and contrast the rates
of several different geological
processes occurring in
different landscapes.
22 0.380 0.124
G. Use the observed rate of a
geological process to predict
possible future landscape
changes.
7, 8, 9, 13, 15 0.783 0.060
aOne-way ANOVA
Table 18-Student mean score gain sorted by operationalized learning outcomes listed in Table 17:
Mean score gain by learning outcome (see previous Table)
Group number A B C D E F G
Group 1 (photos) .64 .80 .02 .23 .09 1.27 1.05
Group 2 (passive TL) 1.14 .70 .32 .57 .25 1.64 1.16
Group 3 (inter. TL) .88 .79 -.05 .40 .24 1.24 1.05
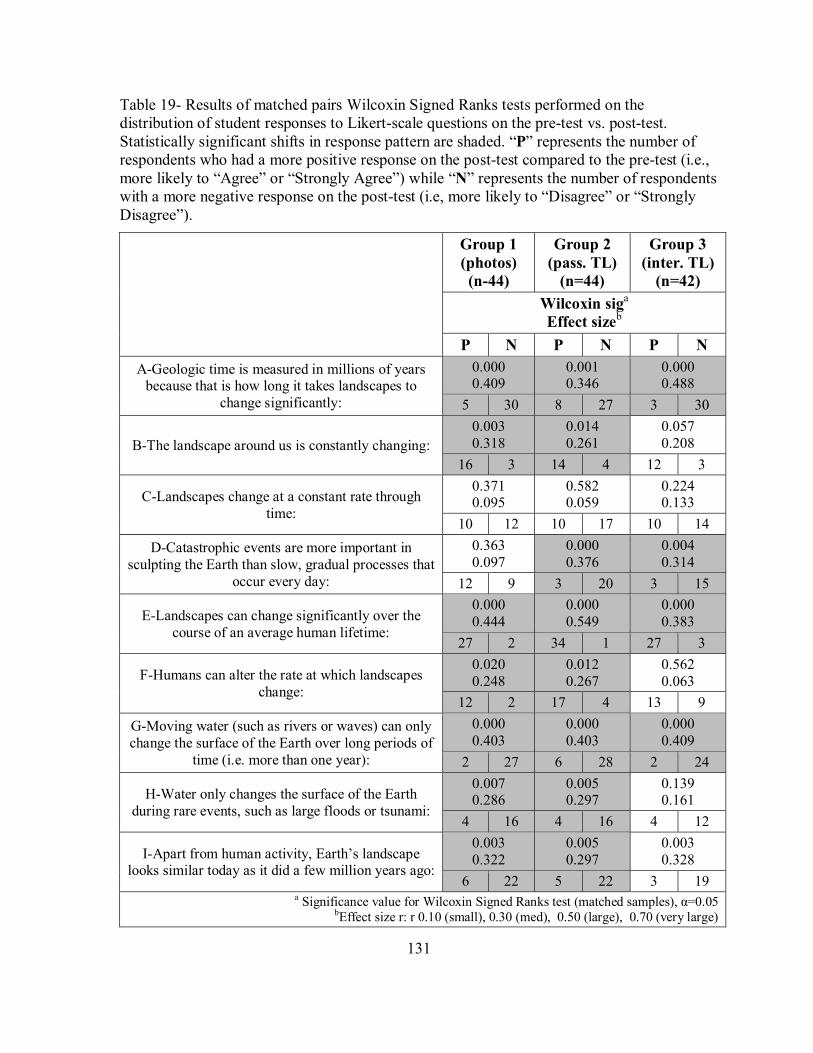
131
Table 19- Results of matched pairs Wilcoxin Signed Ranks tests performed on the distribution of student responses to Likert-scale questions on the pre-test vs. post-test. Statistically significant shifts in response pattern are shaded. “P” represents the number of respondents who had a more positive response on the post-test compared to the pre-test (i.e., more likely to “Agree” or “Strongly Agree”) while “N” represents the number of respondents with a more negative response on the post-test (i.e, more likely to “Disagree” or “Strongly Disagree”).
Group 1 (photos) (n-44)
Group 2 (pass. TL)
(n=44)
Group 3 (inter. TL)
(n=42)
Wilcoxin siga Effect sizeb
P N P N P N
A-Geologic time is measured in millions of years because that is how long it takes landscapes to
change significantly:
0.000 0.409
0.001 0.346
0.000 0.488
5 30 8 27 3 30
B-The landscape around us is constantly changing:
0.003 0.318
0.014 0.261
0.057 0.208
16 3 14 4 12 3
C-Landscapes change at a constant rate through time:
0.371 0.095
0.582 0.059
0.224 0.133
10 12 10 17 10 14
D-Catastrophic events are more important in sculpting the Earth than slow, gradual processes that
occur every day:
0.363 0.097
0.000 0.376
0.004 0.314
12 9 3 20 3 15
E-Landscapes can change significantly over the course of an average human lifetime:
0.000 0.444
0.000 0.549
0.000 0.383
27 2 34 1 27 3
F-Humans can alter the rate at which landscapes change:
0.020 0.248
0.012 0.267
0.562 0.063
12 2 17 4 13 9
G-Moving water (such as rivers or waves) can only change the surface of the Earth over long periods of
time (i.e. more than one year):
0.000 0.403
0.000 0.403
0.000 0.409
2 27 6 28 2 24
H-Water only changes the surface of the Earth during rare events, such as large floods or tsunami:
0.007 0.286
0.005 0.297
0.139 0.161
4 16 4 16 4 12
I-Apart from human activity, Earth’s landscape looks similar today as it did a few million years ago:
0.003 0.322
0.005 0.297
0.003 0.328
6 22 5 22 3 19 a Significance value for Wilcoxin Signed Ranks test (matched samples), α=0.05
bEffect size r: r 0.10 (small), 0.30 (med), 0.50 (large), 0.70 (very large)
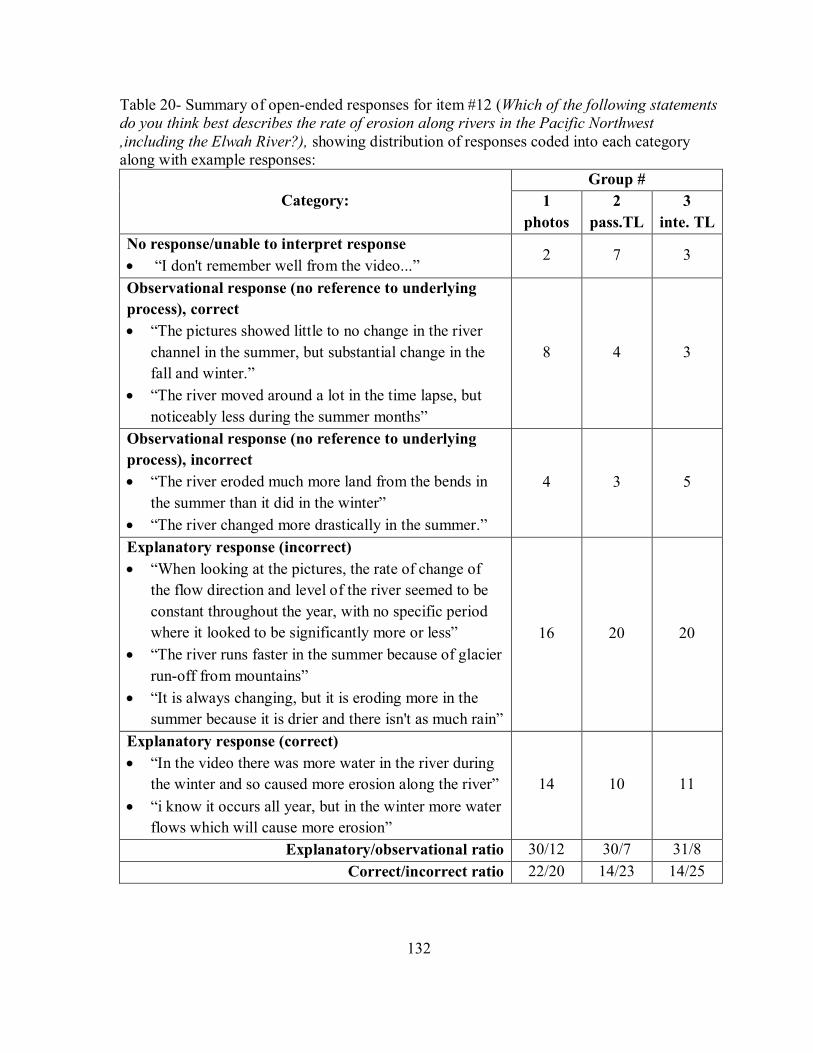
132
Table 20- Summary of open-ended responses for item #12 (Which of the following statements do you think best describes the rate of erosion along rivers in the Pacific Northwest ,including the Elwah River?), showing distribution of responses coded into each category along with example responses:
Category:
Group #
1
photos
2
pass.TL
3
inte. TL
No response/unable to interpret response
“I don't remember well from the video...” 2 7 3
Observational response (no reference to underlying
process), correct
“The pictures showed little to no change in the river
channel in the summer, but substantial change in the
fall and winter.”
“The river moved around a lot in the time lapse, but
noticeably less during the summer months”
8 4 3
Observational response (no reference to underlying
process), incorrect
“The river eroded much more land from the bends in
the summer than it did in the winter”
“The river changed more drastically in the summer.”
4 3 5
Explanatory response (incorrect)
“When looking at the pictures, the rate of change of
the flow direction and level of the river seemed to be
constant throughout the year, with no specific period
where it looked to be significantly more or less”
“The river runs faster in the summer because of glacier
run-off from mountains”
“It is always changing, but it is eroding more in the
summer because it is drier and there isn't as much rain”
16 20 20
Explanatory response (correct)
“In the video there was more water in the river during
the winter and so caused more erosion along the river”
“i know it occurs all year, but in the winter more water
flows which will cause more erosion”
14 10 11
Explanatory/observational ratio 30/12 30/7 31/8
Correct/incorrect ratio 22/20 14/23 14/25
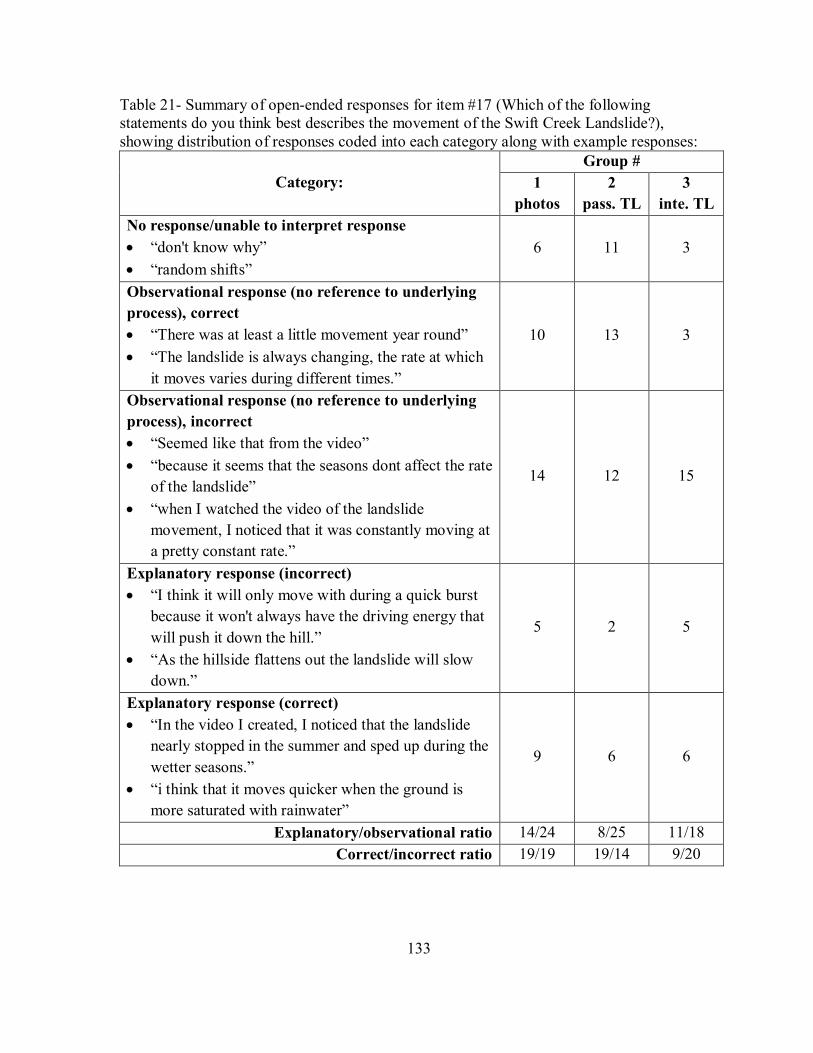
133
Table 21- Summary of open-ended responses for item #17 (Which of the following statements do you think best describes the movement of the Swift Creek Landslide?), showing distribution of responses coded into each category along with example responses:
Category:
Group #
1
photos
2
pass. TL
3
inte. TL
No response/unable to interpret response
“don't know why”
“random shifts”
6 11 3
Observational response (no reference to underlying
process), correct
“There was at least a little movement year round”
“The landslide is always changing, the rate at which
it moves varies during different times.”
10 13 3
Observational response (no reference to underlying
process), incorrect
“Seemed like that from the video”
“because it seems that the seasons dont affect the rate
of the landslide”
“when I watched the video of the landslide
movement, I noticed that it was constantly moving at
a pretty constant rate.”
14 12 15
Explanatory response (incorrect)
“I think it will only move with during a quick burst
because it won't always have the driving energy that
will push it down the hill.”
“As the hillside flattens out the landslide will slow
down.”
5 2 5
Explanatory response (correct)
“In the video I created, I noticed that the landslide
nearly stopped in the summer and sped up during the
wetter seasons.”
“i think that it moves quicker when the ground is
more saturated with rainwater”
9 6 6
Explanatory/observational ratio 14/24 8/25 11/18
Correct/incorrect ratio 19/19 19/14 9/20
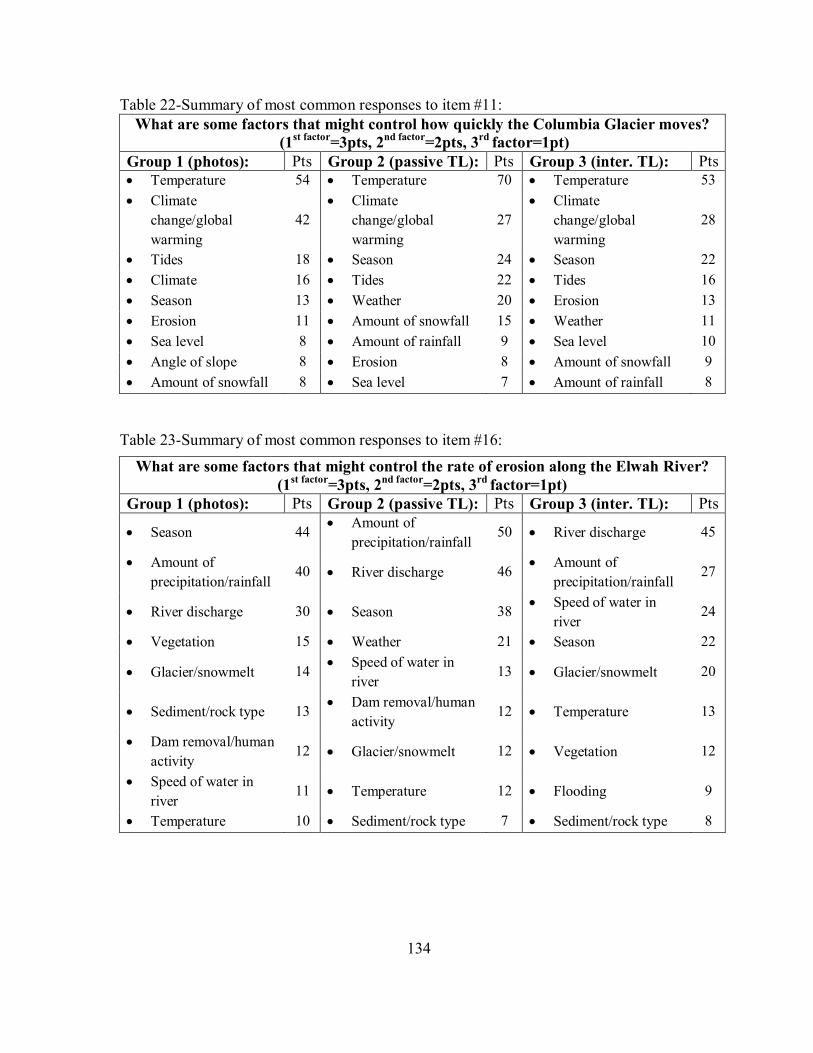
134
Table 22-Summary of most common responses to item #11:
Table 23-Summary of most common responses to item #16:
What are some factors that might control how quickly the Columbia Glacier moves? (1st factor=3pts, 2nd factor=2pts, 3rd factor=1pt)
Group 1 (photos): Pts Group 2 (passive TL): Pts Group 3 (inter. TL): Pts Temperature 54 Temperature 70 Temperature 53
Climate
change/global
warming
42
Climate
change/global
warming
27
Climate
change/global
warming
28
Tides 18 Season 24 Season 22
Climate 16 Tides 22 Tides 16
Season 13 Weather 20 Erosion 13
Erosion 11 Amount of snowfall 15 Weather 11
Sea level 8 Amount of rainfall 9 Sea level 10
Angle of slope 8 Erosion 8 Amount of snowfall 9
Amount of snowfall 8 Sea level 7 Amount of rainfall 8
What are some factors that might control the rate of erosion along the Elwah River? (1st factor=3pts, 2nd factor=2pts, 3rd factor=1pt)
Group 1 (photos): Pts Group 2 (passive TL): Pts Group 3 (inter. TL): Pts
Season 44 Amount of
precipitation/rainfall 50 River discharge 45
Amount of
precipitation/rainfall 40 River discharge 46
Amount of
precipitation/rainfall 27
River discharge 30 Season 38 Speed of water in
river 24
Vegetation 15 Weather 21 Season 22
Glacier/snowmelt 14 Speed of water in
river 13 Glacier/snowmelt 20
Sediment/rock type 13 Dam removal/human
activity 12 Temperature 13
Dam removal/human
activity 12 Glacier/snowmelt 12 Vegetation 12
Speed of water in
river 11 Temperature 12 Flooding 9
Temperature 10 Sediment/rock type 7 Sediment/rock type 8
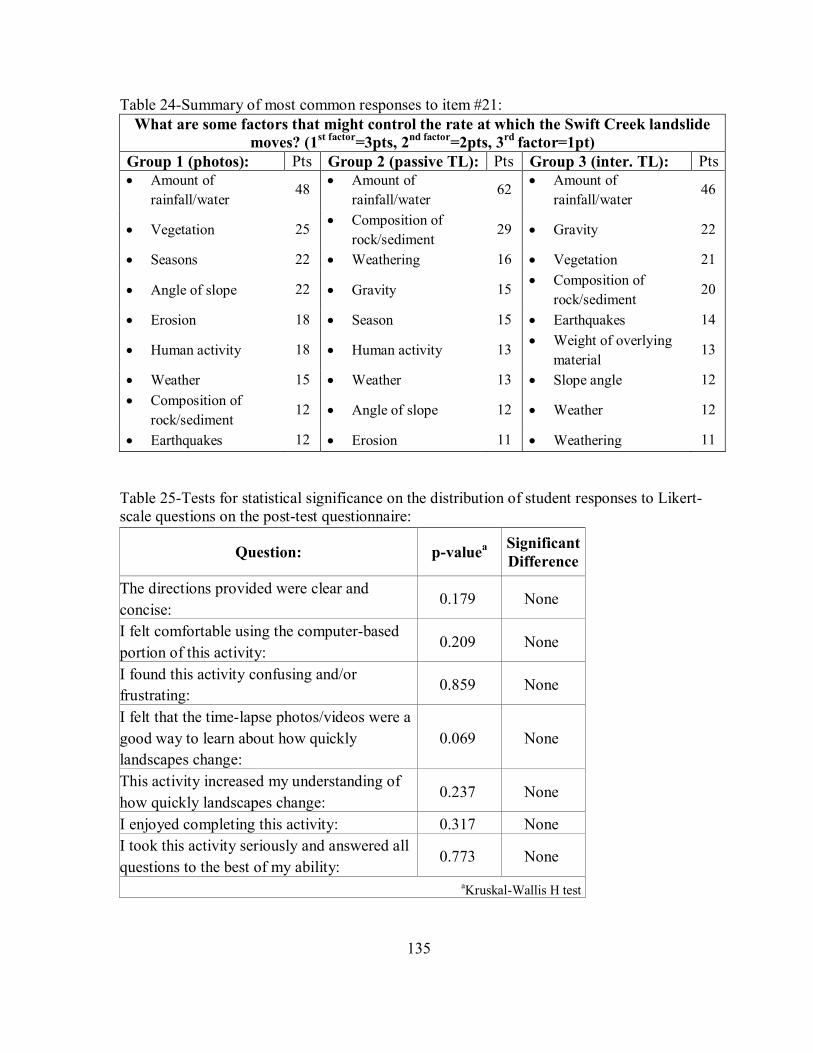
135
Table 24-Summary of most common responses to item #21:
Table 25-Tests for statistical significance on the distribution of student responses to Likert-scale questions on the post-test questionnaire:
What are some factors that might control the rate at which the Swift Creek landslide moves? (1st factor=3pts, 2nd factor=2pts, 3rd factor=1pt)
Group 1 (photos): Pts Group 2 (passive TL): Pts Group 3 (inter. TL): Pts Amount of
rainfall/water 48
Amount of
rainfall/water 62
Amount of
rainfall/water 46
Vegetation 25 Composition of
rock/sediment 29 Gravity 22
Seasons 22 Weathering 16 Vegetation 21
Angle of slope 22 Gravity 15 Composition of
rock/sediment 20
Erosion 18 Season 15 Earthquakes 14
Human activity 18 Human activity 13 Weight of overlying
material 13
Weather 15 Weather 13 Slope angle 12
Composition of
rock/sediment 12 Angle of slope 12 Weather 12
Earthquakes 12 Erosion 11 Weathering 11
Question: p-valuea Significant Difference
The directions provided were clear and
concise: 0.179 None
I felt comfortable using the computer-based
portion of this activity: 0.209 None
I found this activity confusing and/or
frustrating: 0.859 None
I felt that the time-lapse photos/videos were a
good way to learn about how quickly
landscapes change:
0.069 None
This activity increased my understanding of
how quickly landscapes change: 0.237 None
I enjoyed completing this activity: 0.317 None
I took this activity seriously and answered all
questions to the best of my ability: 0.773 None
aKruskal-Wallis H test
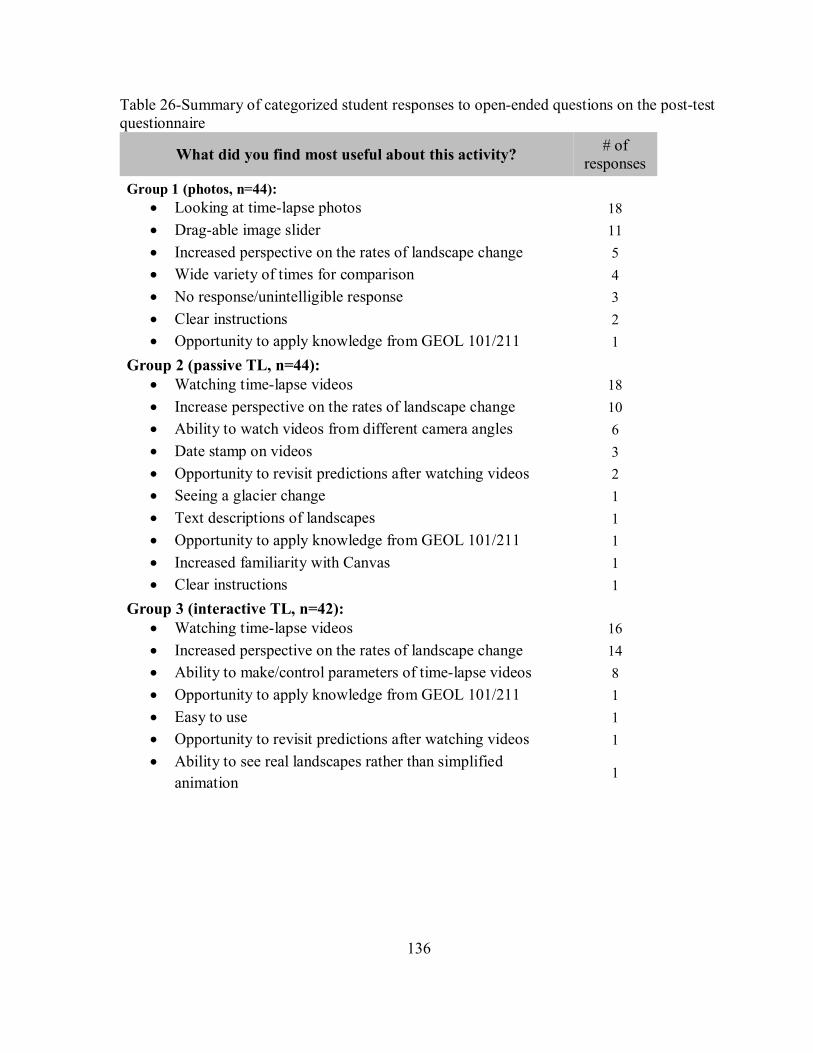
136
Table 26-Summary of categorized student responses to open-ended questions on the post-test questionnaire
What did you find most useful about this activity? # of
responses
Group 1 (photos, n=44): Looking at time-lapse photos 18
Drag-able image slider 11
Increased perspective on the rates of landscape change 5
Wide variety of times for comparison 4
No response/unintelligible response 3
Clear instructions 2
Opportunity to apply knowledge from GEOL 101/211 1
Group 2 (passive TL, n=44):
Watching time-lapse videos 18
Increase perspective on the rates of landscape change 10
Ability to watch videos from different camera angles 6
Date stamp on videos 3
Opportunity to revisit predictions after watching videos 2
Seeing a glacier change 1
Text descriptions of landscapes 1
Opportunity to apply knowledge from GEOL 101/211 1
Increased familiarity with Canvas 1
Clear instructions 1
Group 3 (interactive TL, n=42):
Watching time-lapse videos 16
Increased perspective on the rates of landscape change 14
Ability to make/control parameters of time-lapse videos 8
Opportunity to apply knowledge from GEOL 101/211 1
Easy to use 1
Opportunity to revisit predictions after watching videos 1
Ability to see real landscapes rather than simplified
animation 1
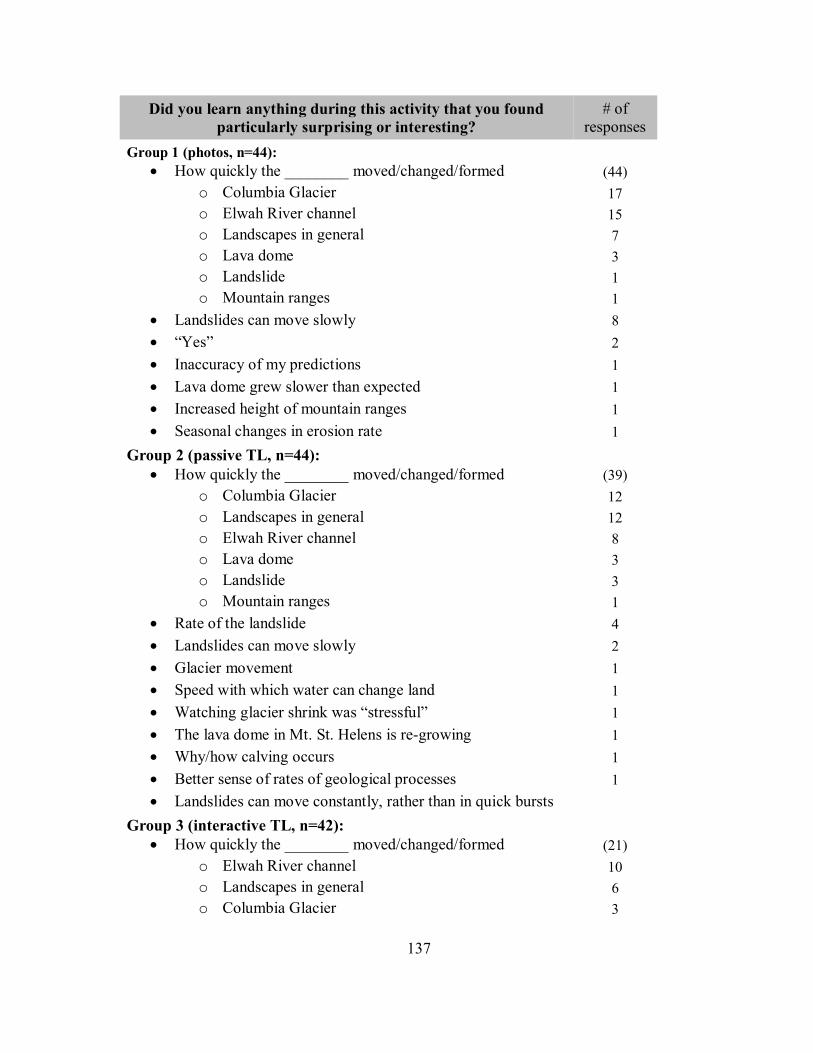
137
Did you learn anything during this activity that you found particularly surprising or interesting?
# of responses
Group 1 (photos, n=44): How quickly the ________ moved/changed/formed (44)
o Columbia Glacier 17
o Elwah River channel 15
o Landscapes in general 7
o Lava dome 3
o Landslide 1
o Mountain ranges 1
Landslides can move slowly 8
“Yes” 2
Inaccuracy of my predictions 1
Lava dome grew slower than expected 1
Increased height of mountain ranges 1
Seasonal changes in erosion rate 1
Group 2 (passive TL, n=44):
How quickly the ________ moved/changed/formed (39)
o Columbia Glacier 12
o Landscapes in general 12
o Elwah River channel 8
o Lava dome 3
o Landslide 3
o Mountain ranges 1
Rate of the landslide 4
Landslides can move slowly 2
Glacier movement 1
Speed with which water can change land 1
Watching glacier shrink was “stressful” 1
The lava dome in Mt. St. Helens is re-growing 1
Why/how calving occurs 1
Better sense of rates of geological processes 1
Landslides can move constantly, rather than in quick bursts
Group 3 (interactive TL, n=42):
How quickly the ________ moved/changed/formed (21)
o Elwah River channel 10
o Landscapes in general 6
o Columbia Glacier 3
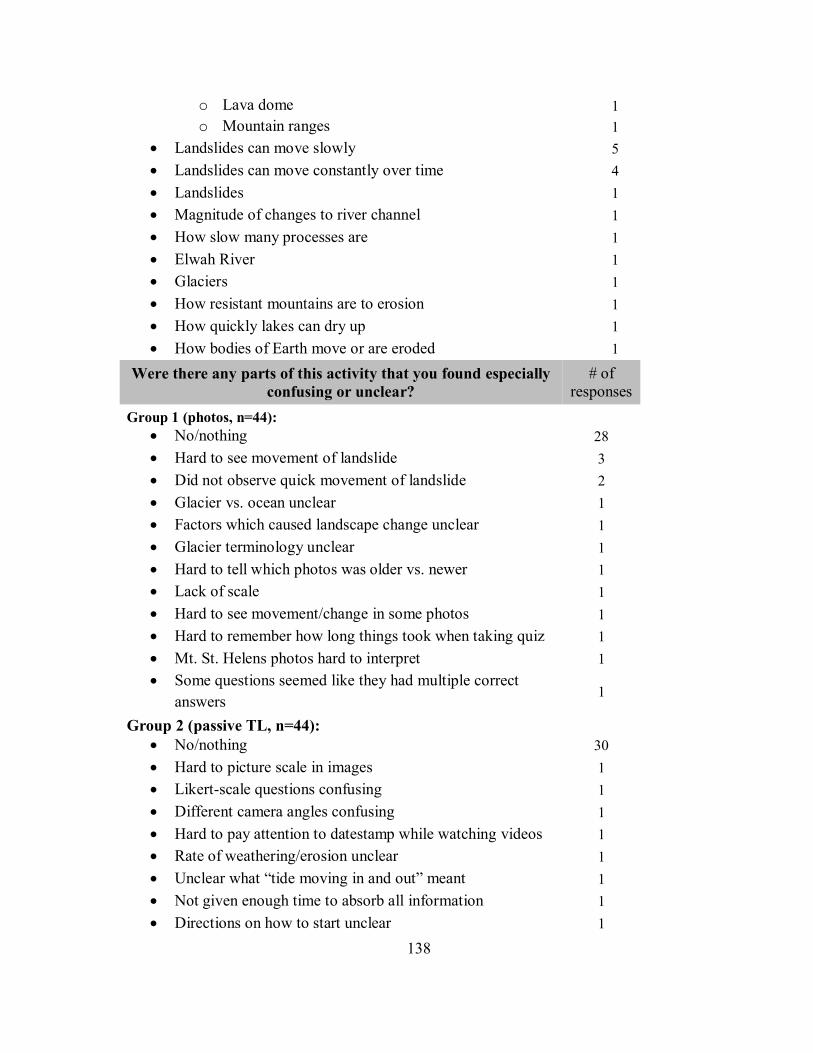
138
Were there any parts of this activity that you found especially confusing or unclear?
# of responses
Group 1 (photos, n=44): No/nothing 28
Hard to see movement of landslide 3
Did not observe quick movement of landslide 2
Glacier vs. ocean unclear 1
Factors which caused landscape change unclear 1
Glacier terminology unclear 1
Hard to tell which photos was older vs. newer 1
Lack of scale 1
Hard to see movement/change in some photos 1
Hard to remember how long things took when taking quiz 1
Mt. St. Helens photos hard to interpret 1
Some questions seemed like they had multiple correct
answers 1
Group 2 (passive TL, n=44):
No/nothing 30
Hard to picture scale in images 1
Likert-scale questions confusing 1
Different camera angles confusing 1
Hard to pay attention to datestamp while watching videos 1
Rate of weathering/erosion unclear 1
Unclear what “tide moving in and out” meant 1
Not given enough time to absorb all information 1
Directions on how to start unclear 1
o Lava dome 1
o Mountain ranges 1
Landslides can move slowly 5
Landslides can move constantly over time 4
Landslides 1
Magnitude of changes to river channel 1
How slow many processes are 1
Elwah River 1
Glaciers 1
How resistant mountains are to erosion 1
How quickly lakes can dry up 1
How bodies of Earth move or are eroded 1
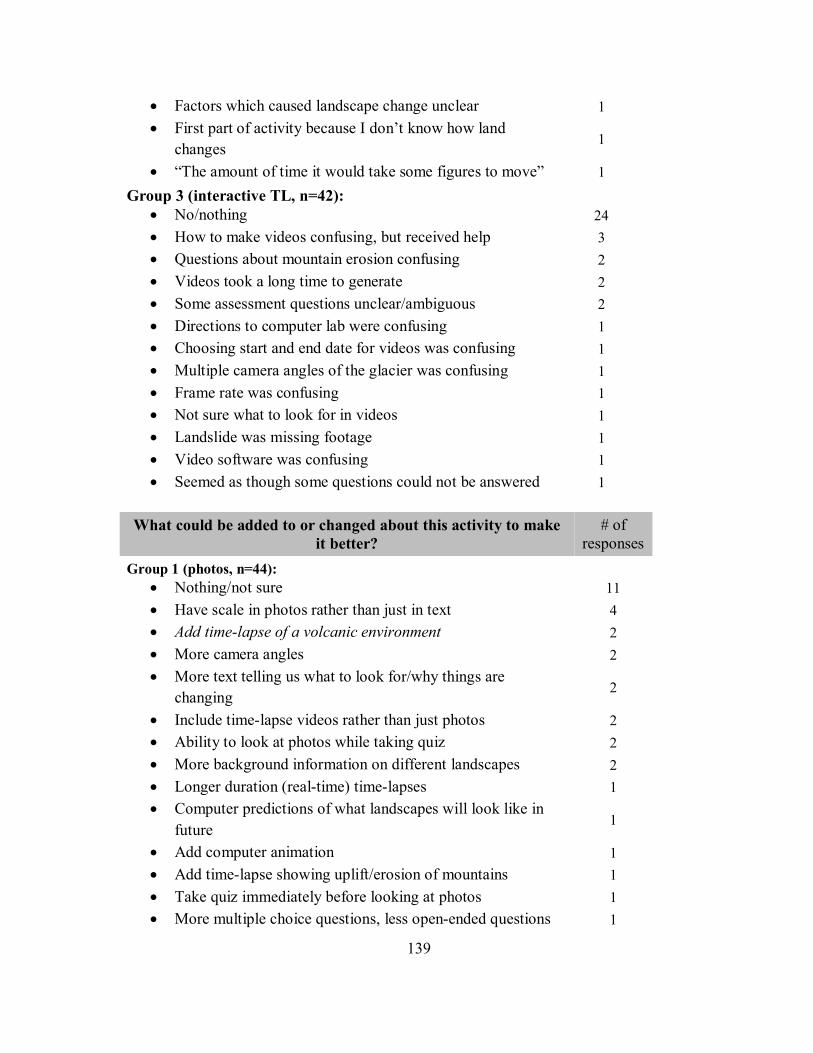
139
Factors which caused landscape change unclear 1
First part of activity because I don’t know how land
changes 1
“The amount of time it would take some figures to move” 1
Group 3 (interactive TL, n=42):
No/nothing 24
How to make videos confusing, but received help 3
Questions about mountain erosion confusing 2
Videos took a long time to generate 2
Some assessment questions unclear/ambiguous 2
Directions to computer lab were confusing 1
Choosing start and end date for videos was confusing 1
Multiple camera angles of the glacier was confusing 1
Frame rate was confusing 1
Not sure what to look for in videos 1
Landslide was missing footage 1
Video software was confusing 1
Seemed as though some questions could not be answered 1
What could be added to or changed about this activity to make it better?
# of responses
Group 1 (photos, n=44): Nothing/not sure 11
Have scale in photos rather than just in text 4
Add time-lapse of a volcanic environment 2
More camera angles 2
More text telling us what to look for/why things are
changing 2
Include time-lapse videos rather than just photos 2
Ability to look at photos while taking quiz 2
More background information on different landscapes 2
Longer duration (real-time) time-lapses 1
Computer predictions of what landscapes will look like in
future 1
Add computer animation 1
Add time-lapse showing uplift/erosion of mountains 1
Take quiz immediately before looking at photos 1
More multiple choice questions, less open-ended questions 1
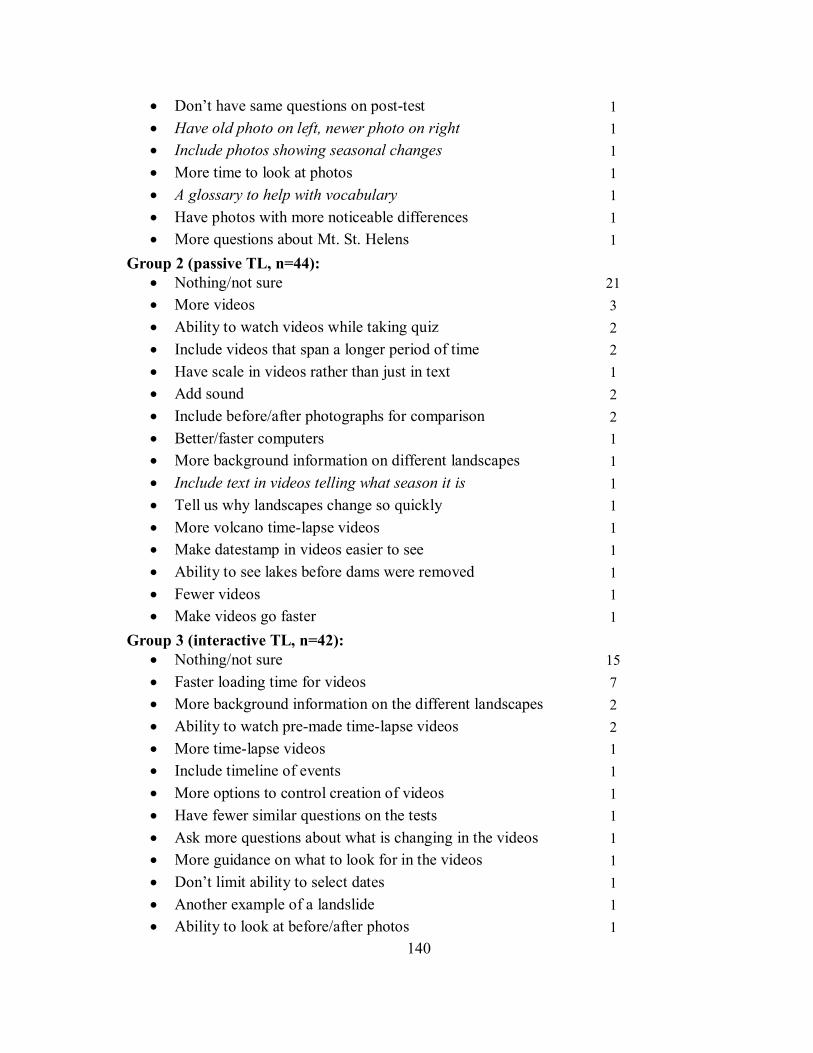
140
Don’t have same questions on post-test 1
Have old photo on left, newer photo on right 1
Include photos showing seasonal changes 1
More time to look at photos 1
A glossary to help with vocabulary 1
Have photos with more noticeable differences 1
More questions about Mt. St. Helens 1
Group 2 (passive TL, n=44):
Nothing/not sure 21
More videos 3
Ability to watch videos while taking quiz 2
Include videos that span a longer period of time 2
Have scale in videos rather than just in text 1
Add sound 2
Include before/after photographs for comparison 2
Better/faster computers 1
More background information on different landscapes 1
Include text in videos telling what season it is 1
Tell us why landscapes change so quickly 1
More volcano time-lapse videos 1
Make datestamp in videos easier to see 1
Ability to see lakes before dams were removed 1
Fewer videos 1
Make videos go faster 1
Group 3 (interactive TL, n=42):
Nothing/not sure 15
Faster loading time for videos 7
More background information on the different landscapes 2
Ability to watch pre-made time-lapse videos 2
More time-lapse videos 1
Include timeline of events 1
More options to control creation of videos 1
Have fewer similar questions on the tests 1
Ask more questions about what is changing in the videos 1
More guidance on what to look for in the videos 1
Don’t limit ability to select dates 1
Another example of a landslide 1
Ability to look at before/after photos 1
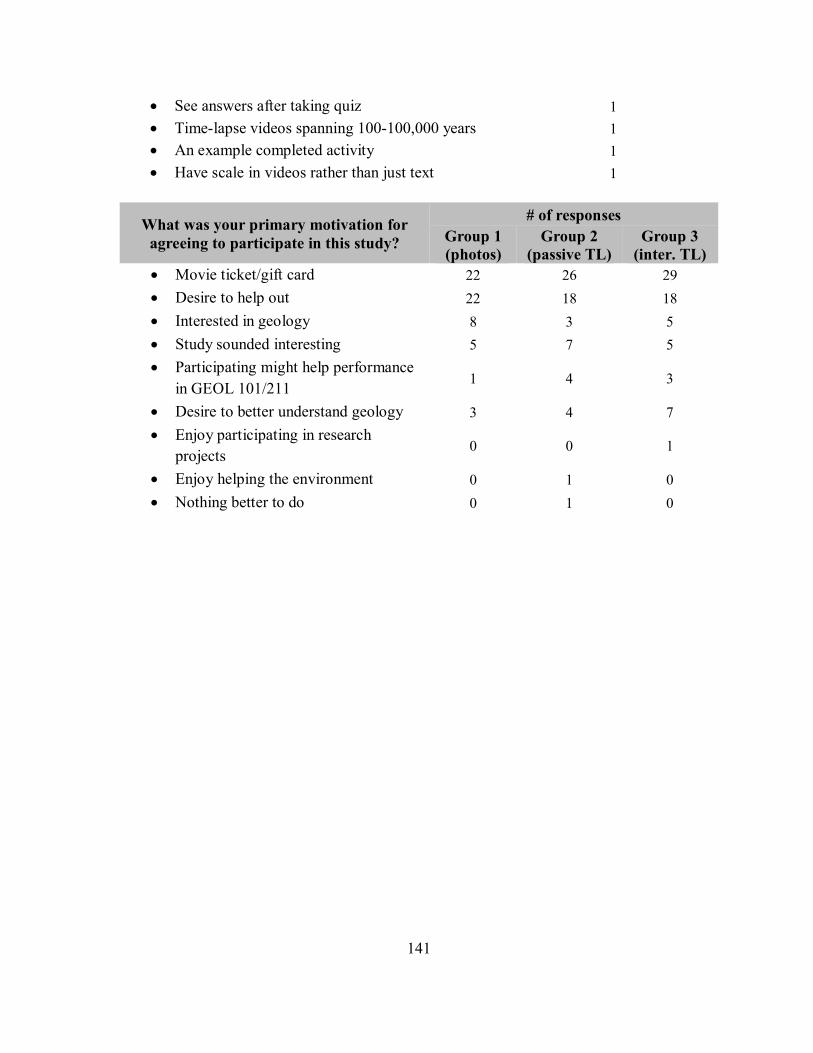
141
See answers after taking quiz 1
Time-lapse videos spanning 100-100,000 years 1
An example completed activity 1
Have scale in videos rather than just text 1
What was your primary motivation for agreeing to participate in this study?
# of responses
Group 1 (photos)
Group 2 (passive TL)
Group 3 (inter. TL)
Movie ticket/gift card 22 26 29
Desire to help out 22 18 18
Interested in geology 8 3 5
Study sounded interesting 5 7 5
Participating might help performance
in GEOL 101/211 1 4 3
Desire to better understand geology 3 4 7
Enjoy participating in research
projects 0 0 1
Enjoy helping the environment 0 1 0
Nothing better to do 0 1 0
142
FIGURES
Figure 1- Results from an April 2013 online survey of college geology educators (n=43) regarding their use of time-lapse videos in geology courses.
143
Figure 2-Flowchart outlining study protocol.
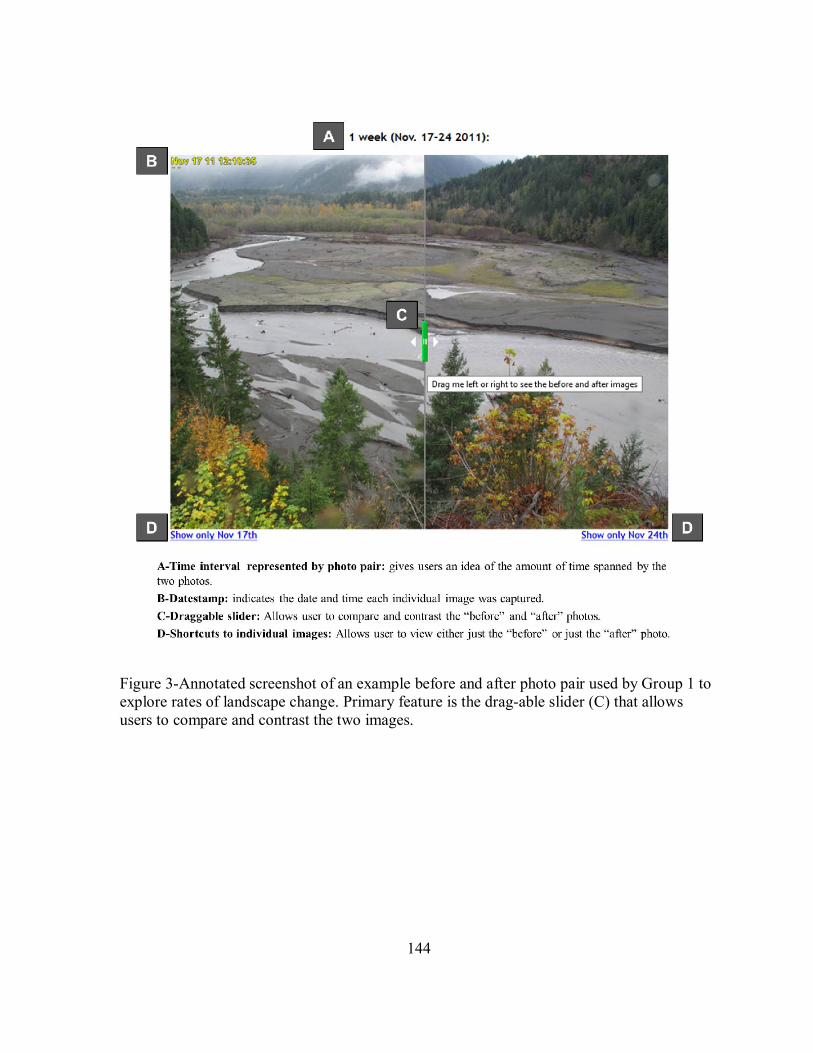
144
Figure 3-Annotated screenshot of an example before and after photo pair used by Group 1 to explore rates of landscape change. Primary feature is the drag-able slider (C) that allows users to compare and contrast the two images.
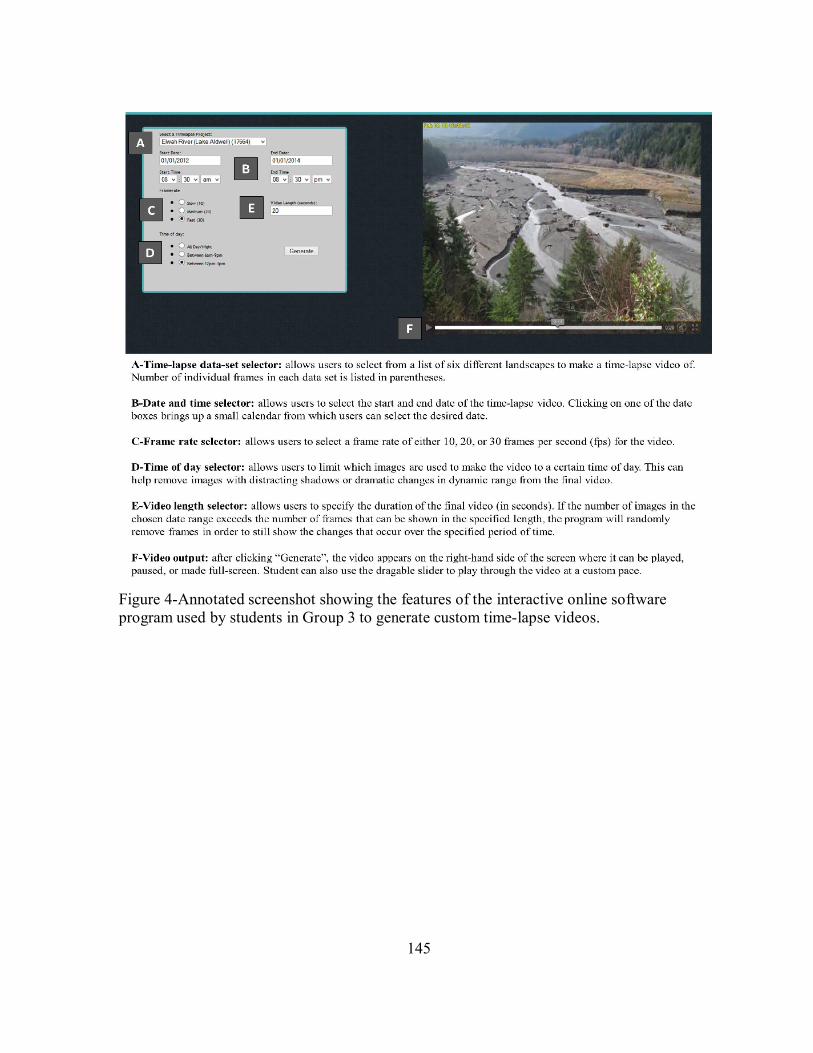
145
Figure 4-Annotated screenshot showing the features of the interactive online software program used by students in Group 3 to generate custom time-lapse videos.
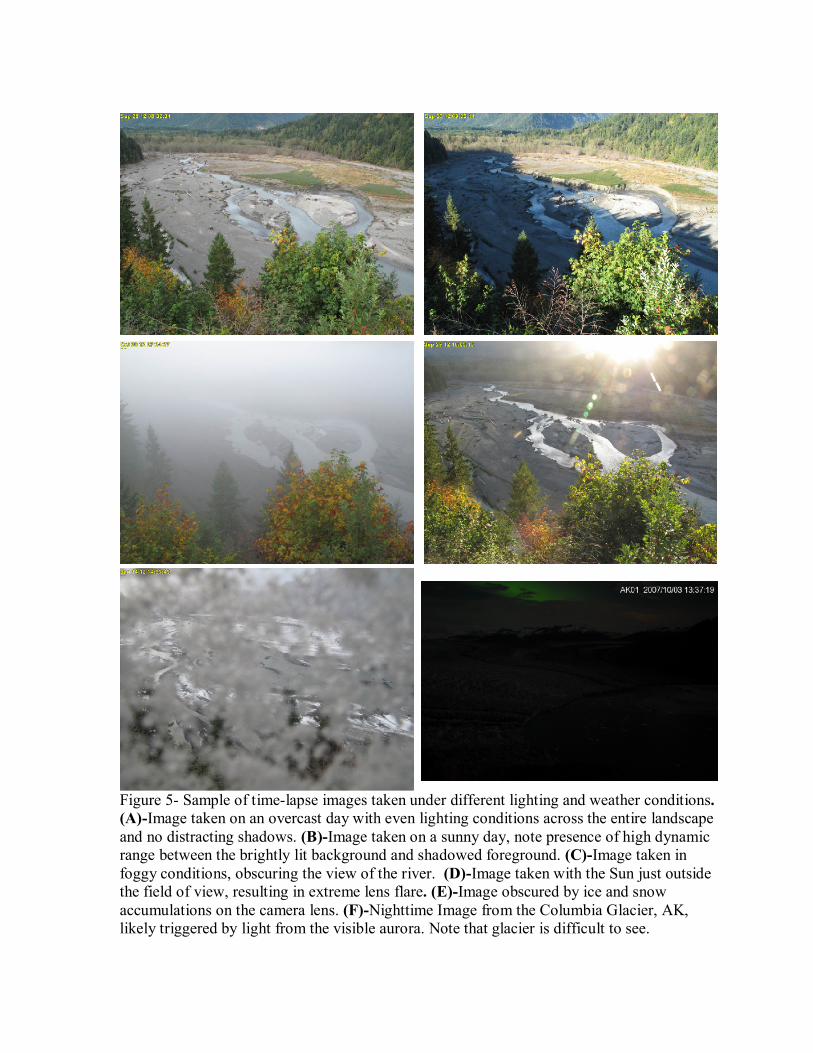
146
Figure 5- Sample of time-lapse images taken under different lighting and weather conditions. (A)-Image taken on an overcast day with even lighting conditions across the entire landscape and no distracting shadows. (B)-Image taken on a sunny day, note presence of high dynamic range between the brightly lit background and shadowed foreground. (C)-Image taken in foggy conditions, obscuring the view of the river. (D)-Image taken with the Sun just outside the field of view, resulting in extreme lens flare. (E)-Image obscured by ice and snow accumulations on the camera lens. (F)-Nighttime Image from the Columbia Glacier, AK, likely triggered by light from the visible aurora. Note that glacier is difficult to see.
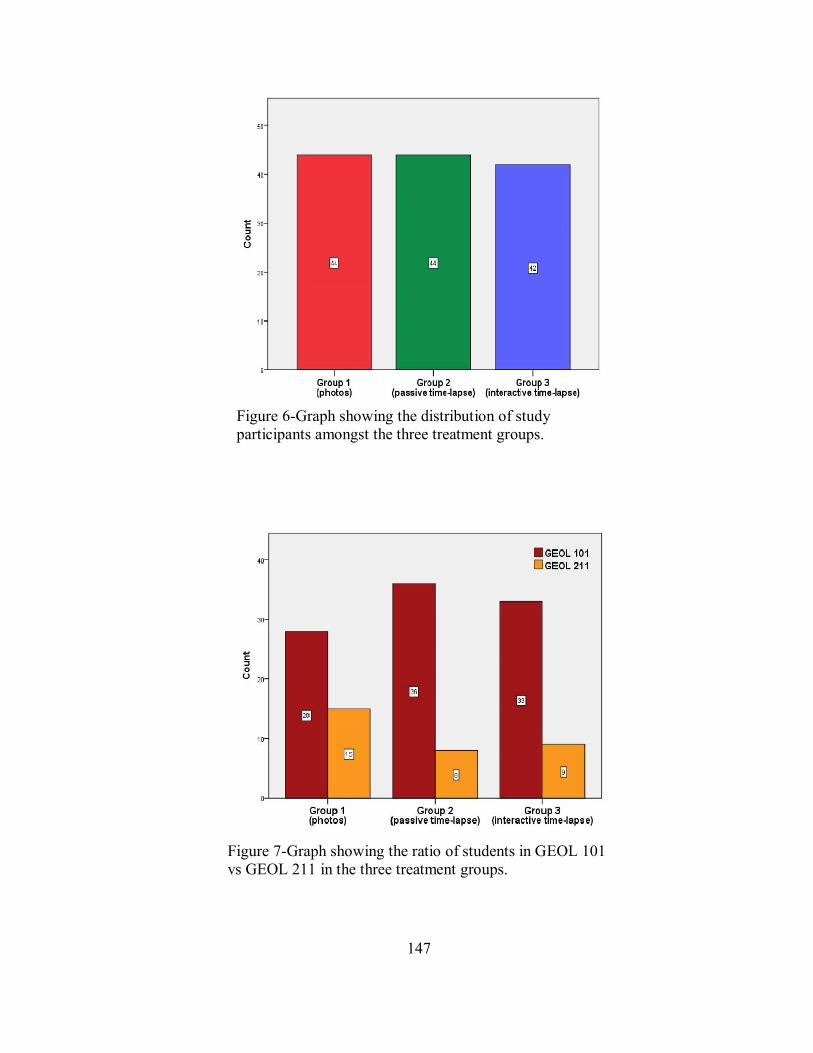
147
Figure 6-Graph showing the distribution of study participants amongst the three treatment groups.
Figure 7-Graph showing the ratio of students in GEOL 101 vs GEOL 211 in the three treatment groups.
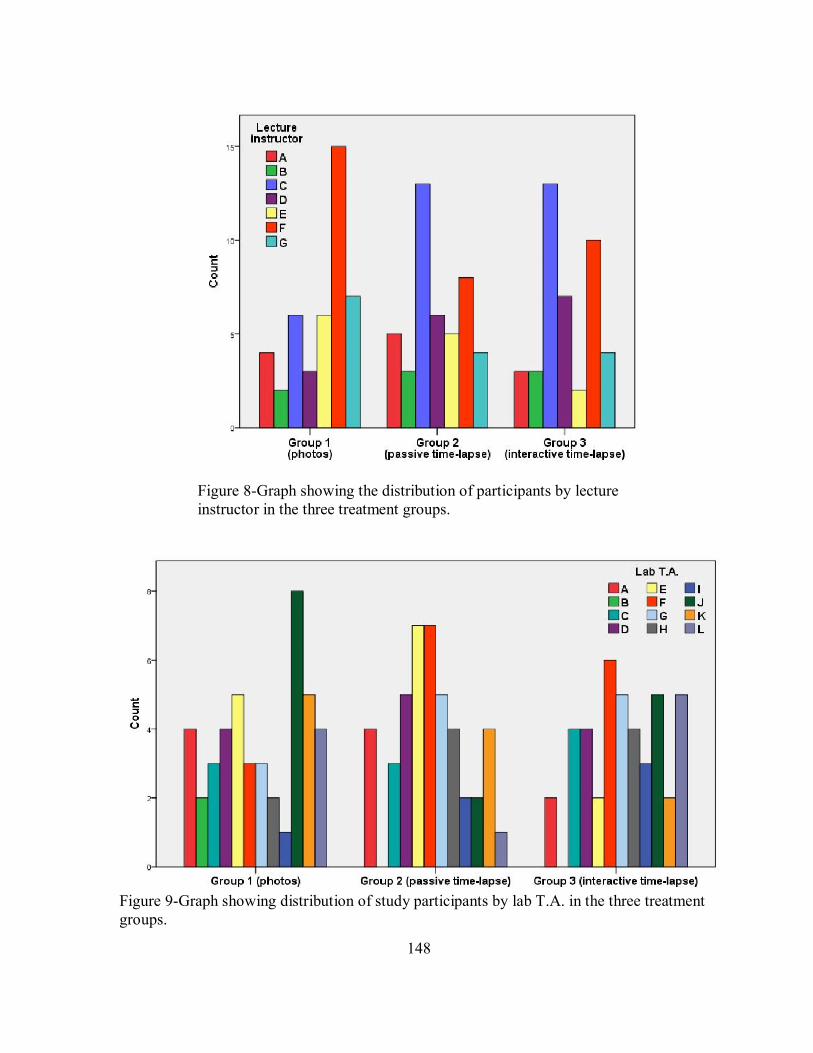
148
Figure 8-Graph showing the distribution of participants by lecture instructor in the three treatment groups.
Figure 9-Graph showing distribution of study participants by lab T.A. in the three treatment groups.
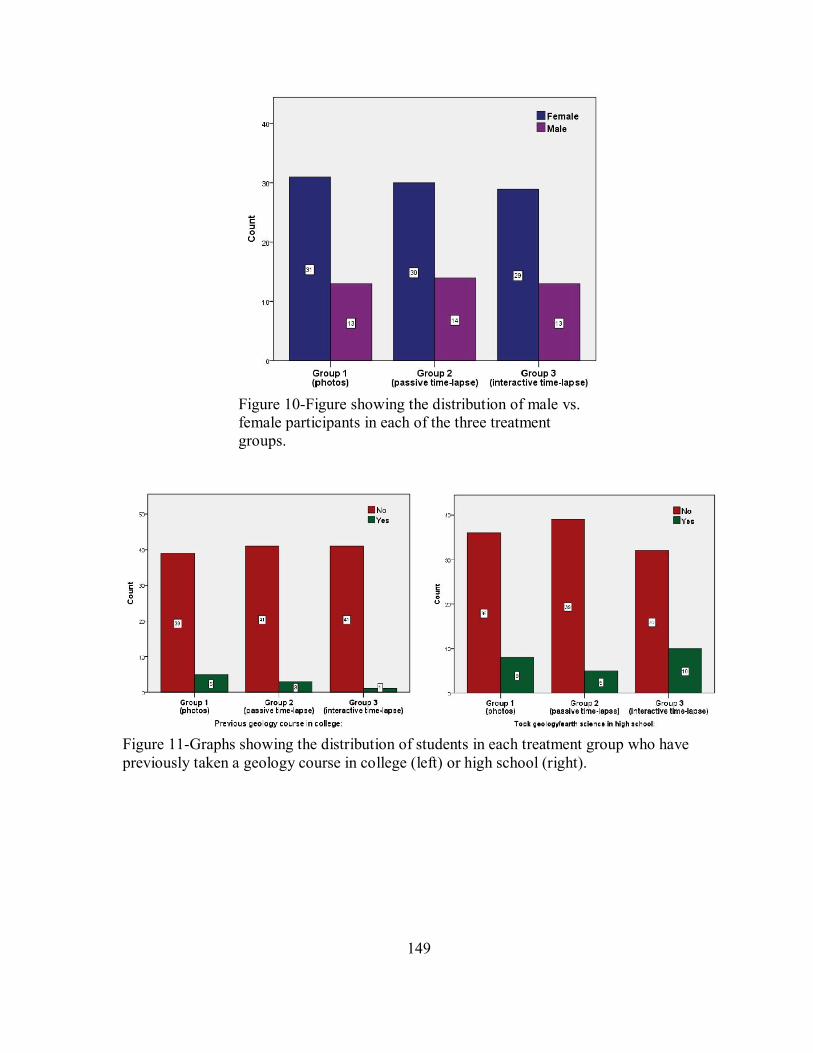
149
Figure 10-Figure showing the distribution of male vs. female participants in each of the three treatment groups.
Figure 11-Graphs showing the distribution of students in each treatment group who have previously taken a geology course in college (left) or high school (right).
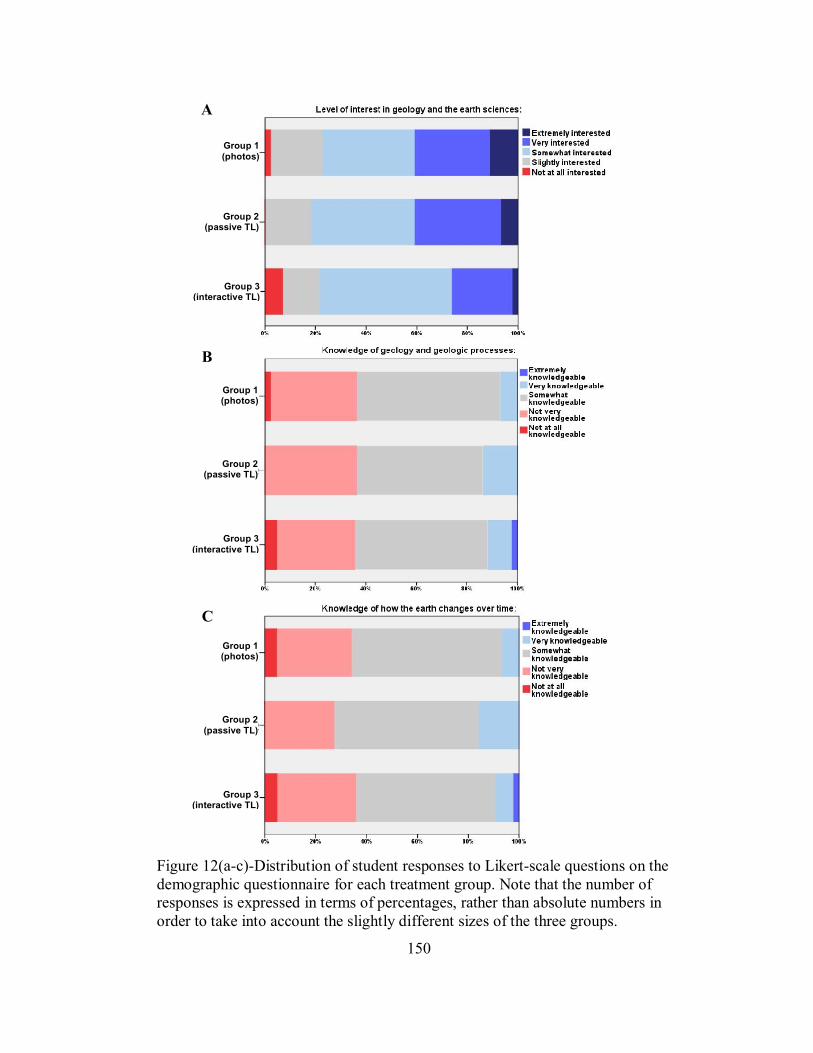
150
C
B
A
Group 1(photos)
Group 2(passive TL)
Group 3 (interactive TL)
Group 1(photos)
Group 2(passive TL)
Group 3 (interactive TL)
Group 1(photos)
Group 2(passive TL)
Group 3 (interactive TL)
Figure 12(a-c)-Distribution of student responses to Likert-scale questions on the demographic questionnaire for each treatment group. Note that the number of responses is expressed in terms of percentages, rather than absolute numbers in order to take into account the slightly different sizes of the three groups.
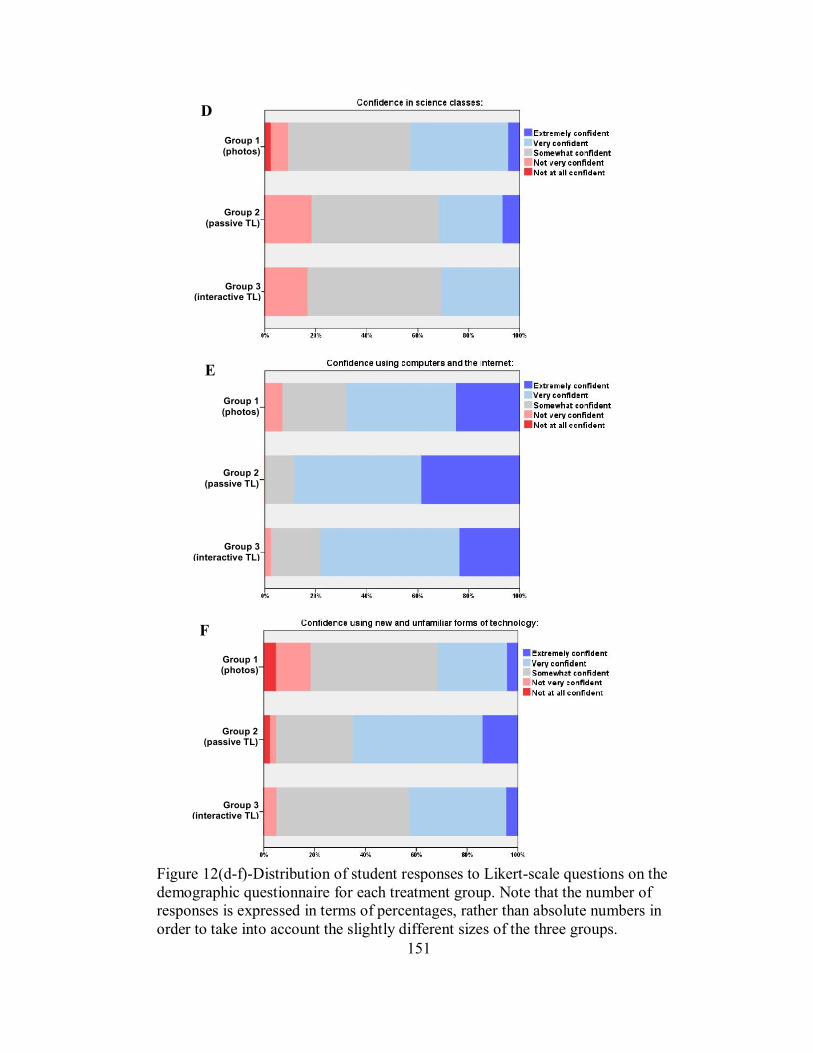
151
D
E
F
Group 1(photos)
Group 2(passive TL)
Group 3 (interactive TL)
Group 1(photos)
Group 2(passive TL)
Group 3 (interactive TL)
Group 1(photos)
Group 2(passive TL)
Group 3 (interactive TL)
Figure 12(d-f)-Distribution of student responses to Likert-scale questions on the demographic questionnaire for each treatment group. Note that the number of responses is expressed in terms of percentages, rather than absolute numbers in order to take into account the slightly different sizes of the three groups.
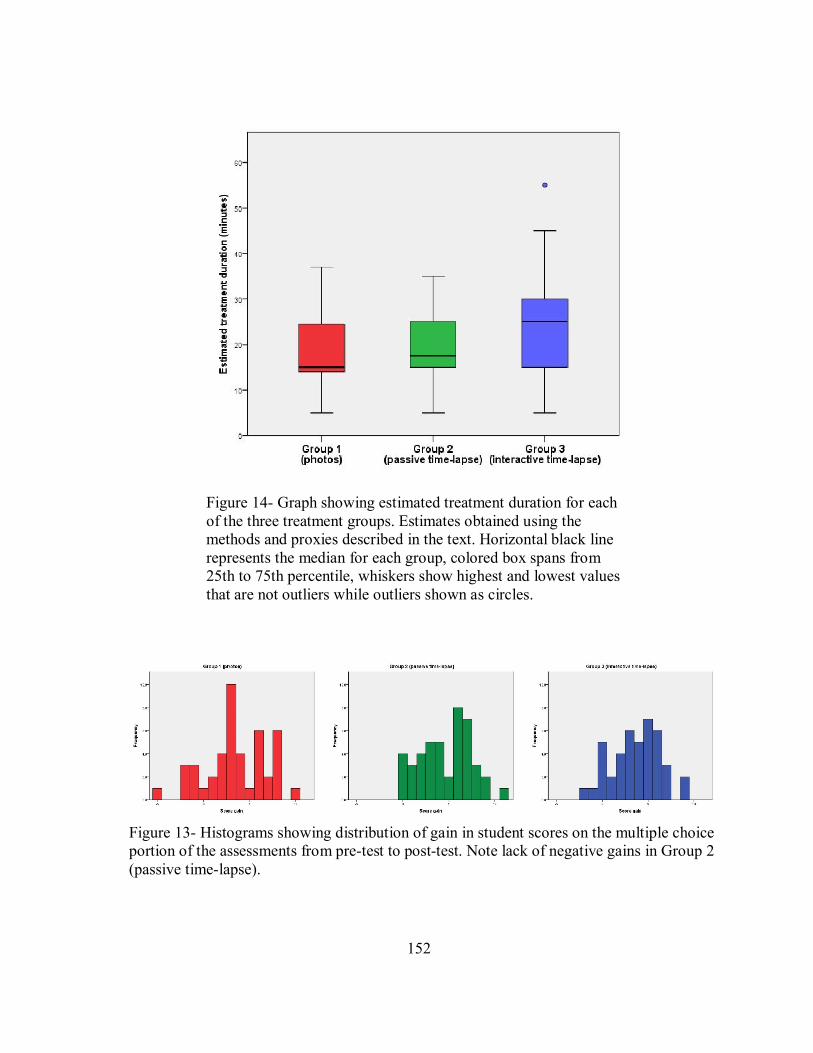
152
Figure 14- Graph showing estimated treatment duration for each of the three treatment groups. Estimates obtained using the methods and proxies described in the text. Horizontal black line represents the median for each group, colored box spans from 25th to 75th percentile, whiskers show highest and lowest values that are not outliers while outliers shown as circles.
Figure 13- Histograms showing distribution of gain in student scores on the multiple choice portion of the assessments from pre-test to post-test. Note lack of negative gains in Group 2 (passive time-lapse).
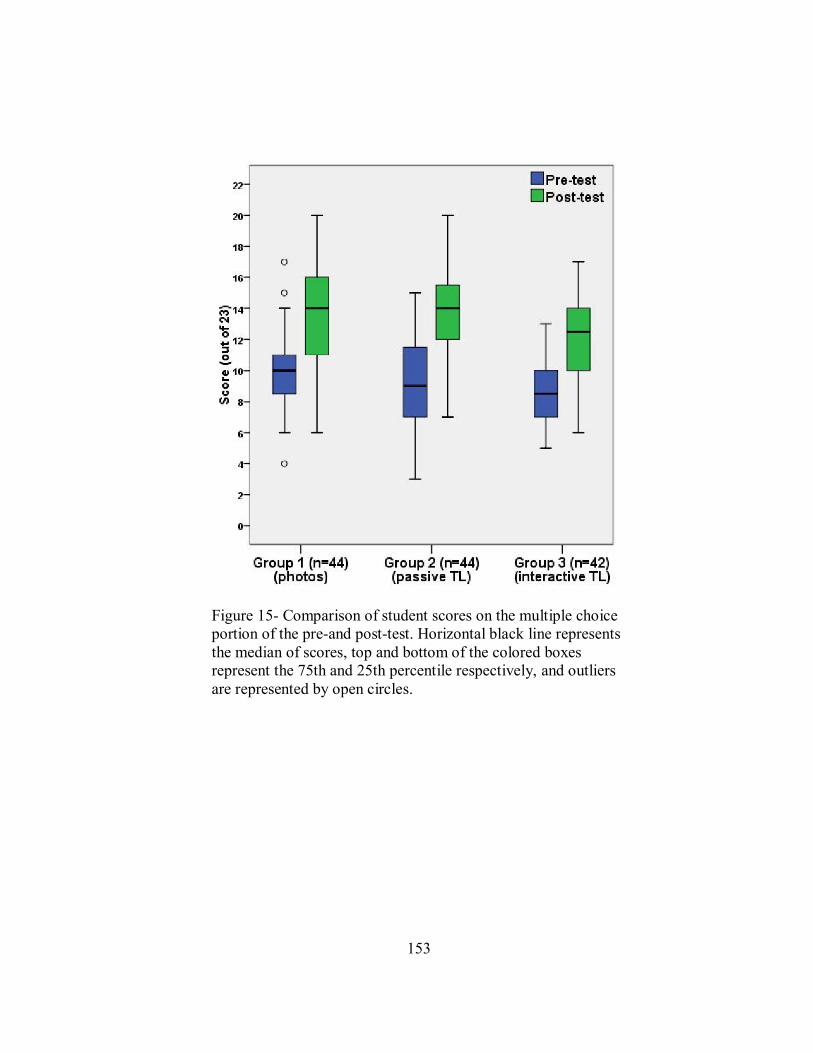
153
Figure 15- Comparison of student scores on the multiple choice portion of the pre-and post-test. Horizontal black line represents the median of scores, top and bottom of the colored boxes represent the 75th and 25th percentile respectively, and outliers are represented by open circles.
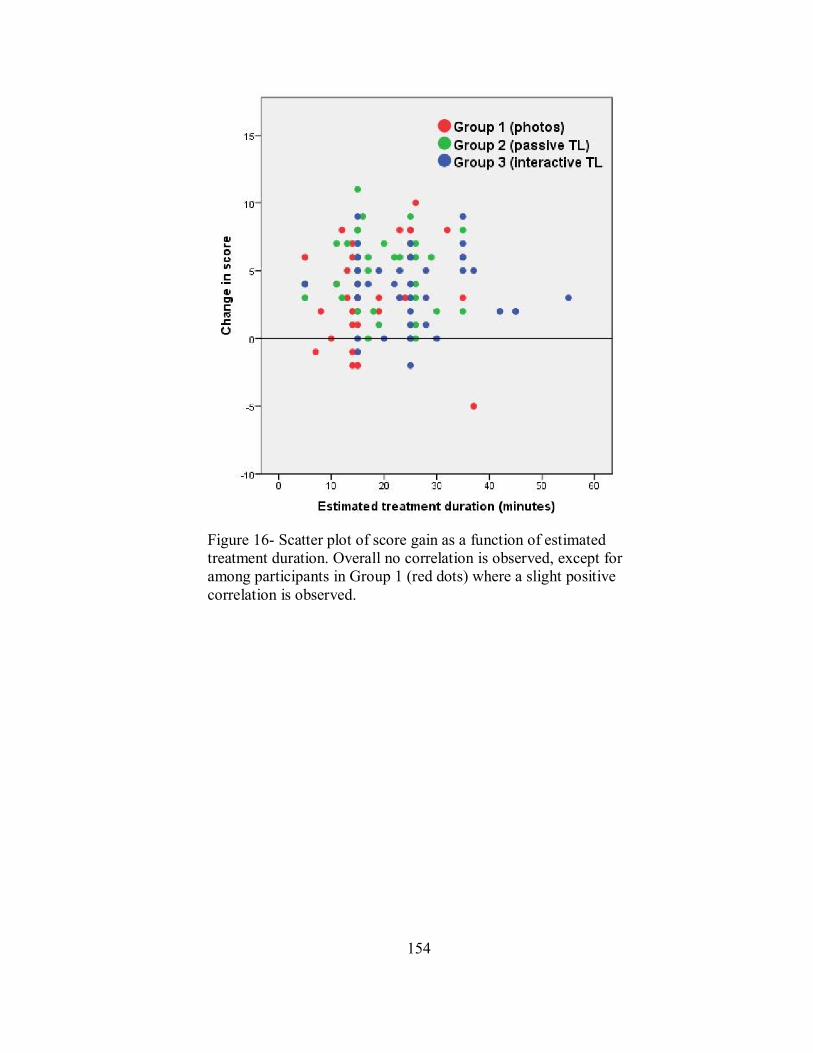
154
Figure 16- Scatter plot of score gain as a function of estimated treatment duration. Overall no correlation is observed, except for among participants in Group 1 (red dots) where a slight positive correlation is observed.
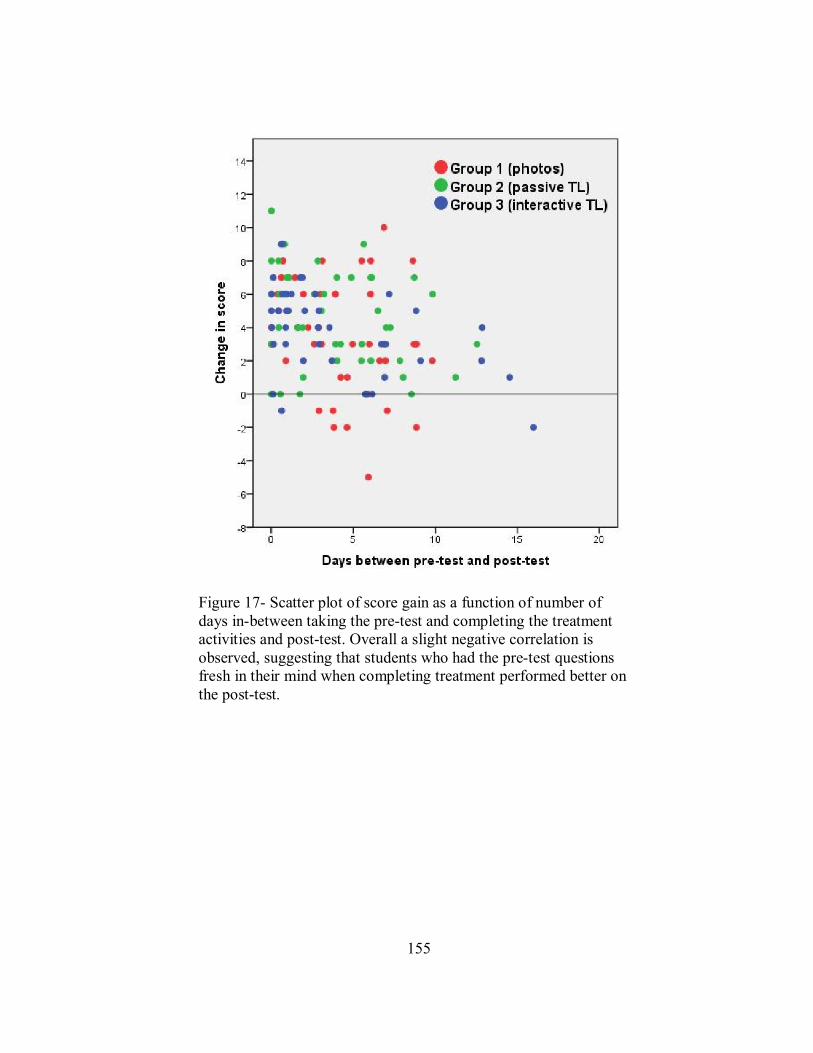
155
Figure 17- Scatter plot of score gain as a function of number of days in-between taking the pre-test and completing the treatment activities and post-test. Overall a slight negative correlation is observed, suggesting that students who had the pre-test questions fresh in their mind when completing treatment performed better on the post-test.
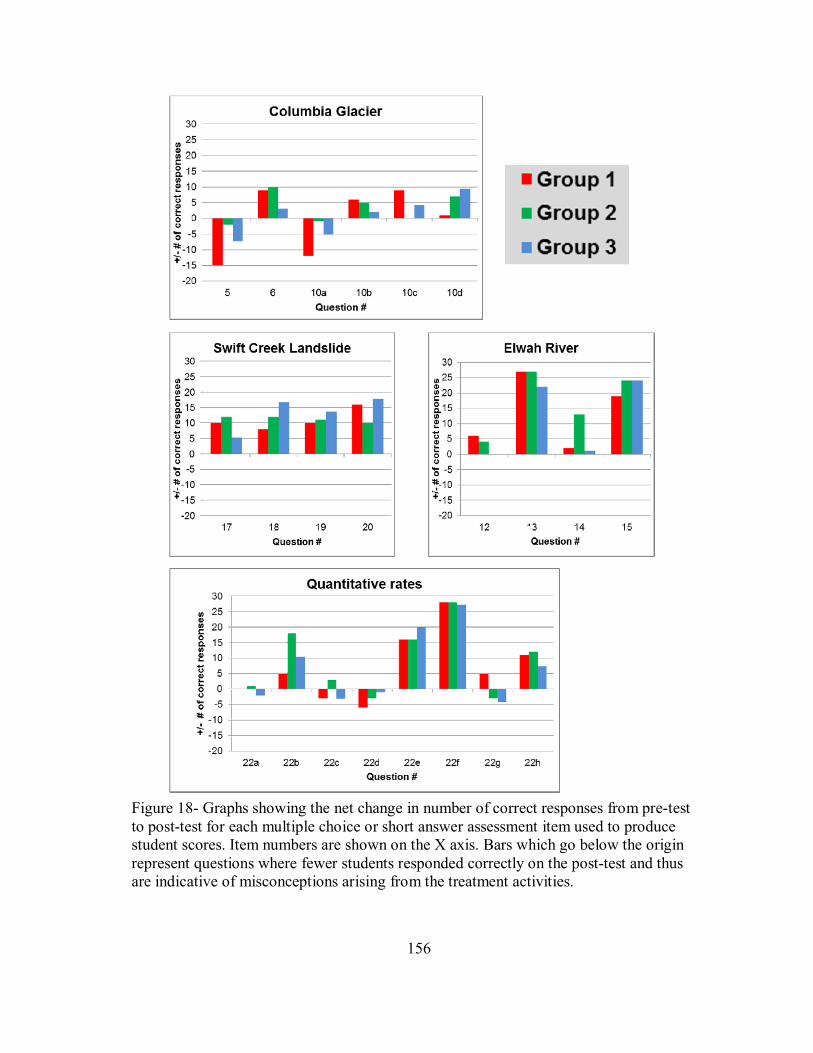
156
Figure 18- Graphs showing the net change in number of correct responses from pre-test to post-test for each multiple choice or short answer assessment item used to produce student scores. Item numbers are shown on the X axis. Bars which go below the origin represent questions where fewer students responded correctly on the post-test and thus are indicative of misconceptions arising from the treatment activities.
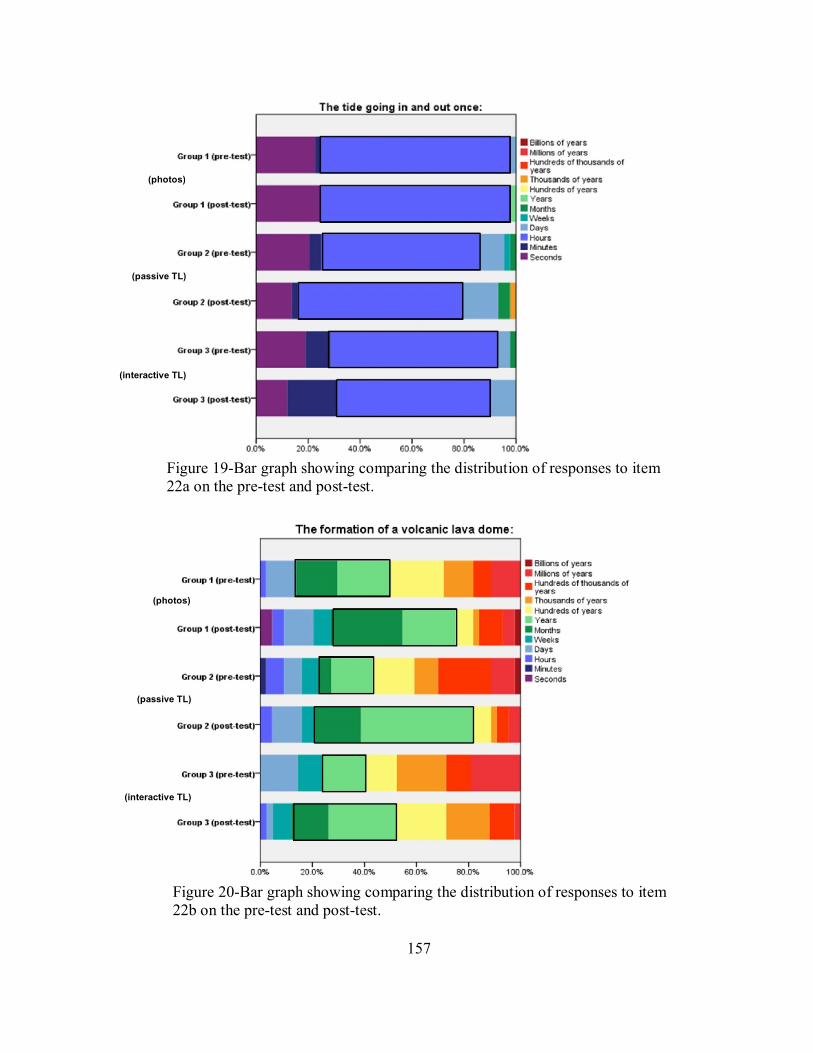
157
Figure 20-Bar graph showing comparing the distribution of responses to item 22b on the pre-test and post-test.
Figure 19-Bar graph showing comparing the distribution of responses to item 22a on the pre-test and post-test.
(photos)
(passive TL)
(interactive TL)
(photos)
(passive TL)
(interactive TL)
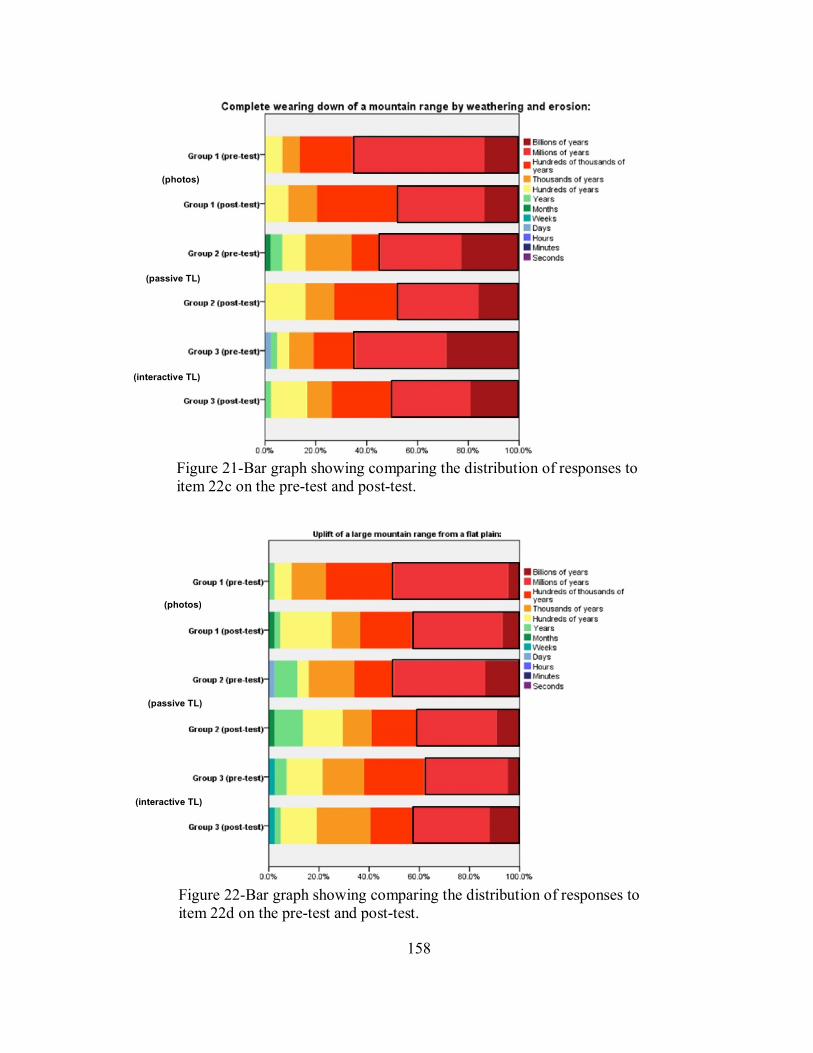
158
Figure 22-Bar graph showing comparing the distribution of responses to item 22d on the pre-test and post-test.
Figure 21-Bar graph showing comparing the distribution of responses to item 22c on the pre-test and post-test.
(photos)
(passive TL)
(interactive TL)
(photos)
(passive TL)
(interactive TL)
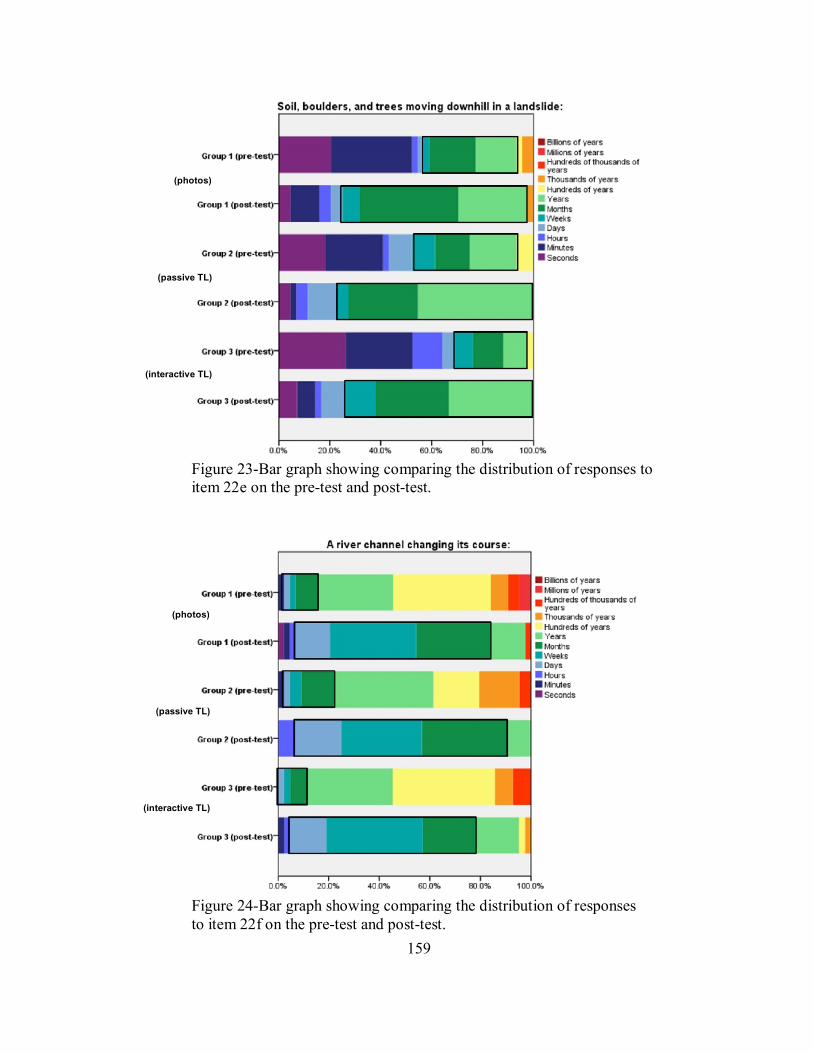
159
Figure 24-Bar graph showing comparing the distribution of responses to item 22f on the pre-test and post-test.
Figure 23-Bar graph showing comparing the distribution of responses to item 22e on the pre-test and post-test.
(photos)
(passive TL)
(interactive TL)
(photos)
(passive TL)
(interactive TL)
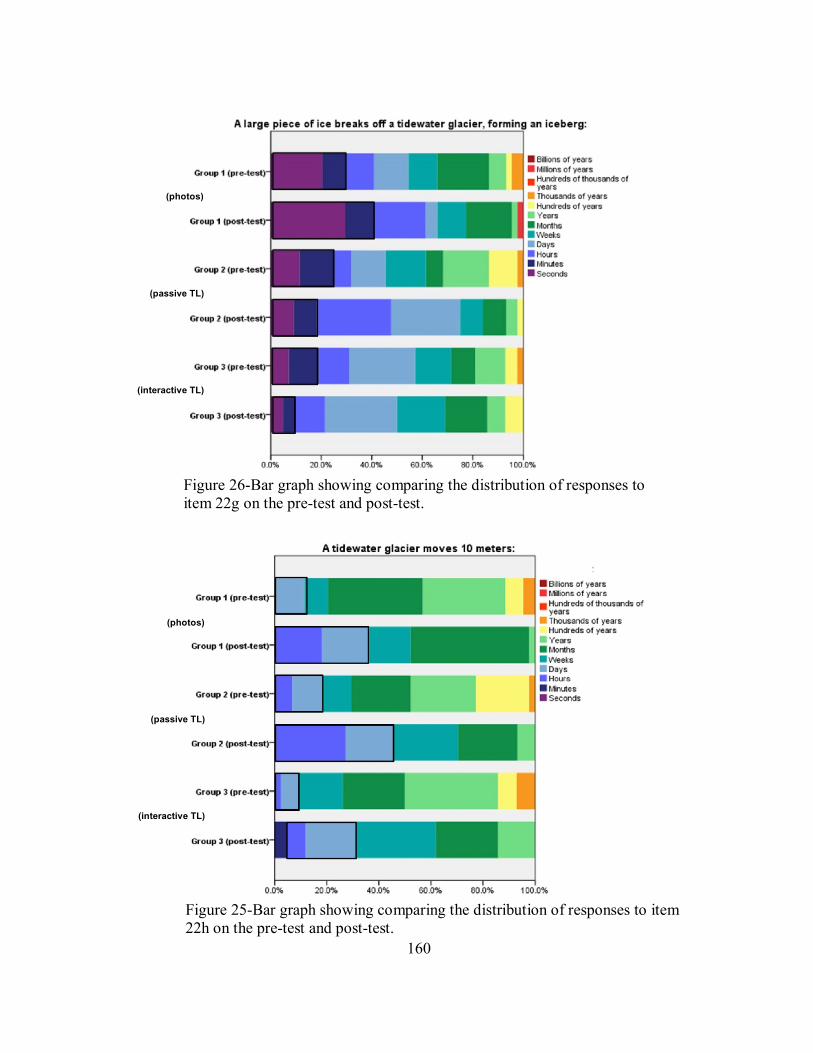
160
Figure 25-Bar graph showing comparing the distribution of responses to item 22h on the pre-test and post-test.
Figure 26-Bar graph showing comparing the distribution of responses to item 22g on the pre-test and post-test.
(photos)
(passive TL)
(interactive TL)
(photos)
(passive TL)
(interactive TL)
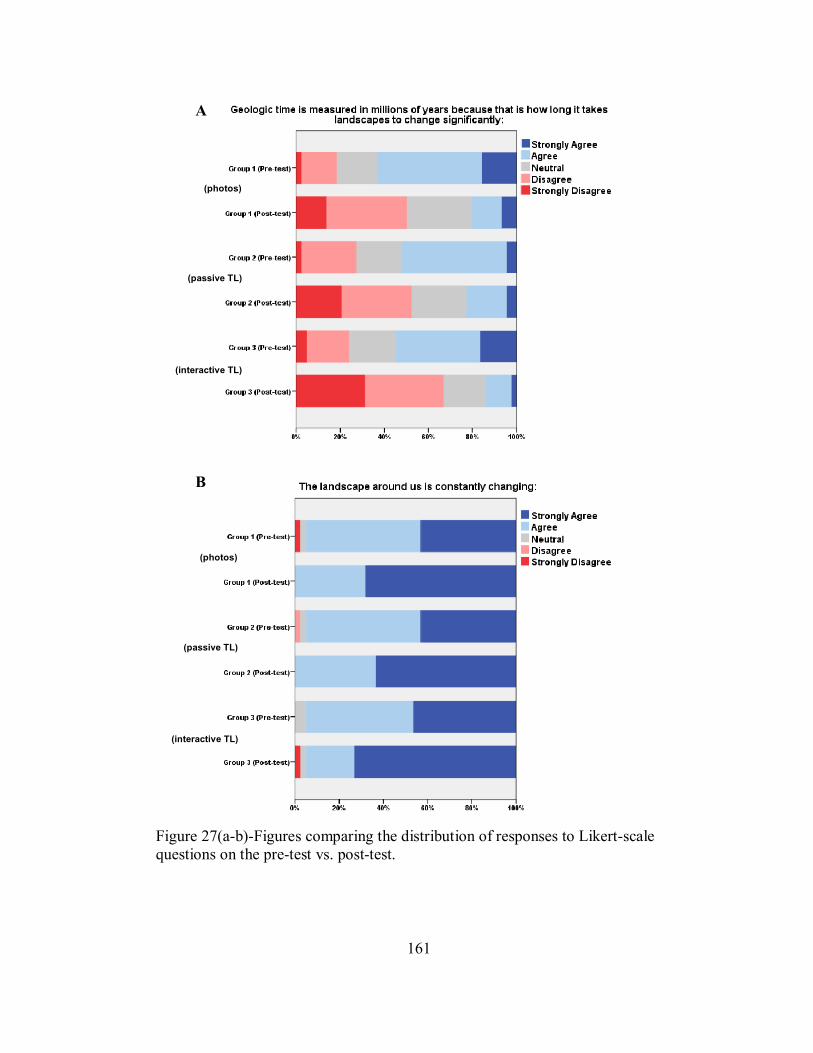
161
A
B
(photos)
(passive TL)
(interactive TL)
(photos)
(passive TL)
(interactive TL)
Figure 27(a-b)-Figures comparing the distribution of responses to Likert-scale questions on the pre-test vs. post-test.
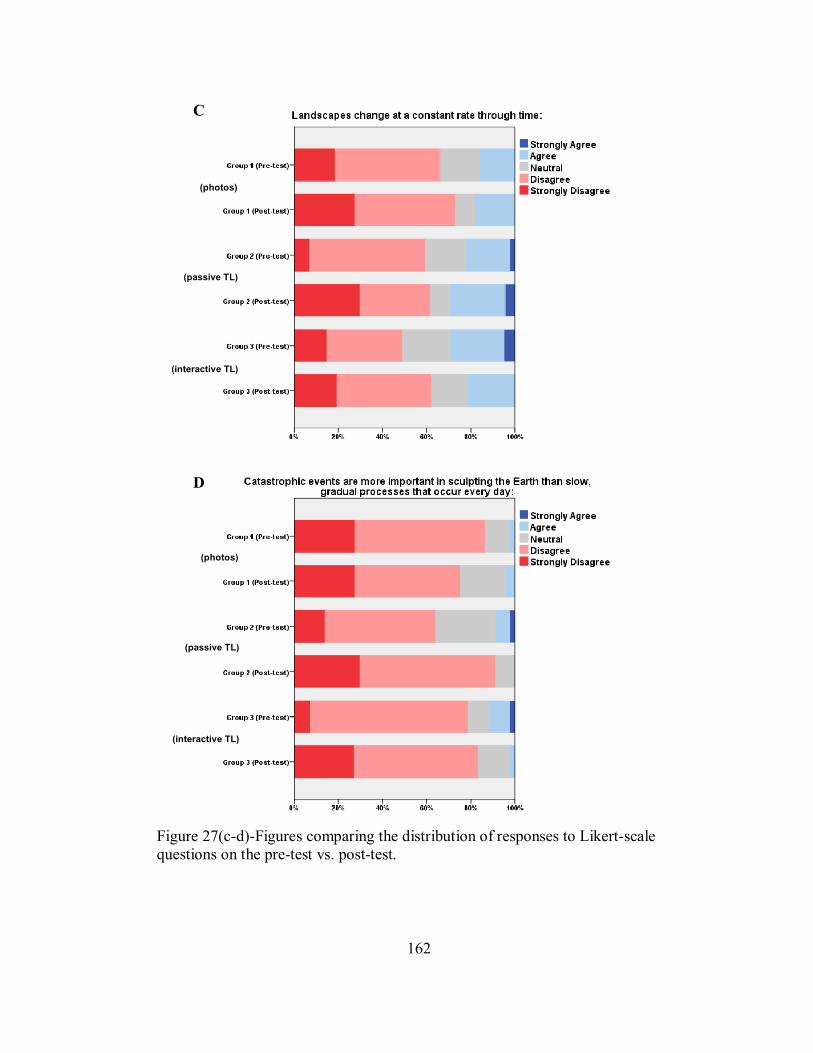
162
C
D
(photos)
(passive TL)
(interactive TL)
(photos)
(passive TL)
(interactive TL)
Figure 27(c-d)-Figures comparing the distribution of responses to Likert-scale questions on the pre-test vs. post-test.
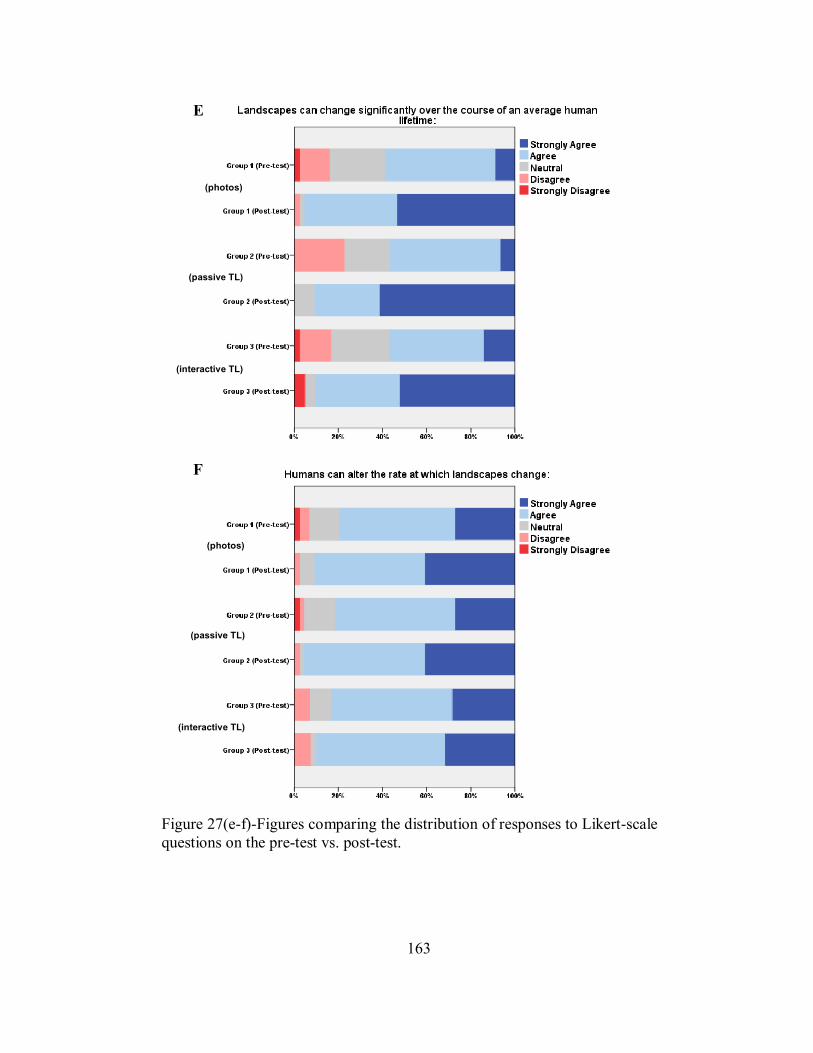
163
E
F
(photos)
(passive TL)
(interactive TL)
(photos)
(passive TL)
(interactive TL)
Figure 27(e-f)-Figures comparing the distribution of responses to Likert-scale questions on the pre-test vs. post-test.
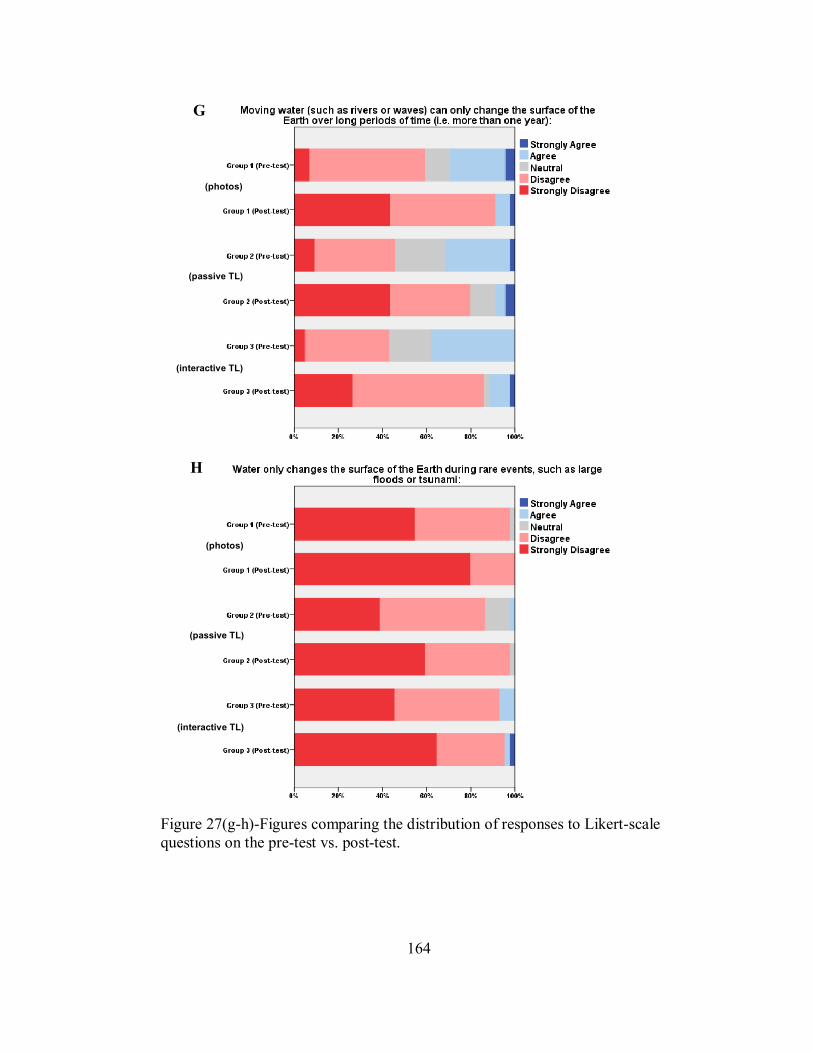
164
G
H
(photos)
(passive TL)
(interactive TL)
(photos)
(passive TL)
(interactive TL)
Figure 27(g-h)-Figures comparing the distribution of responses to Likert-scale questions on the pre-test vs. post-test.
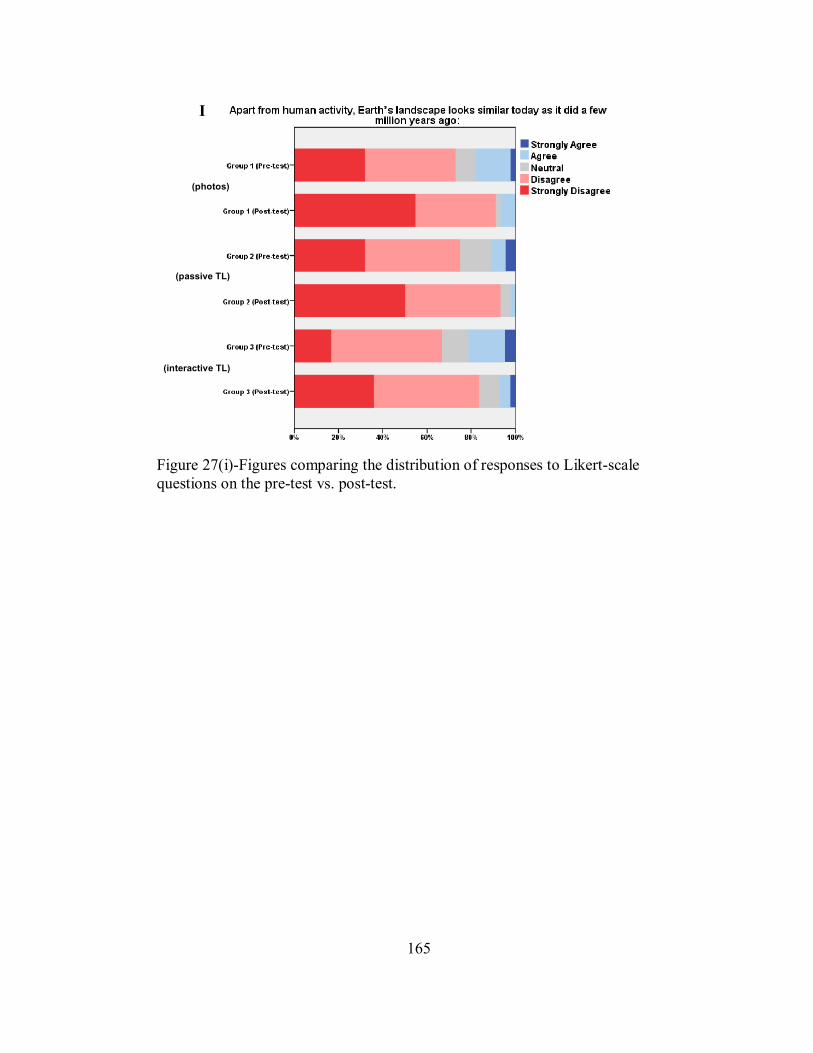
165
I
(photos)
(passive TL)
(interactive TL)
Figure 27(i)-Figures comparing the distribution of responses to Likert-scale questions on the pre-test vs. post-test.
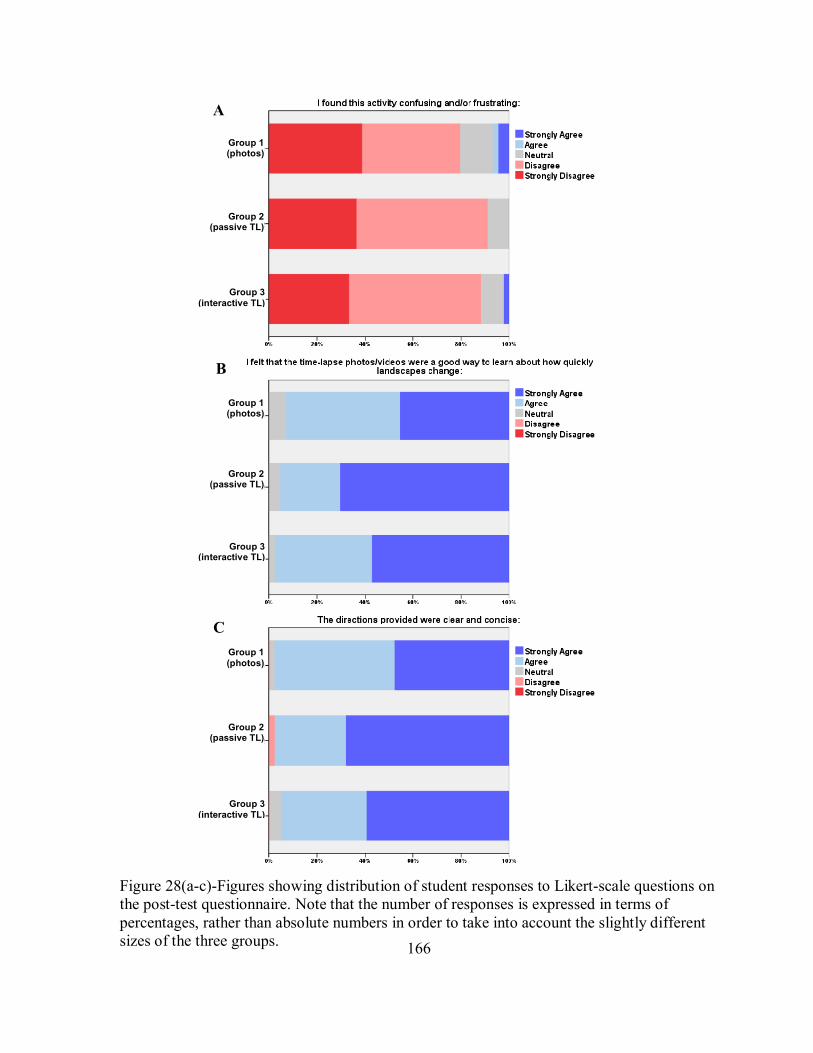
166
C
B
A
Group 1(photos)
Group 2(passive TL)
Group 3 (interactive TL)
Group 1(photos)
Group 2(passive TL)
Group 3 (interactive TL)
Group 1(photos)
Group 2(passive TL)
Group 3 (interactive TL)
Figure 28(a-c)-Figures showing distribution of student responses to Likert-scale questions on the post-test questionnaire. Note that the number of responses is expressed in terms of percentages, rather than absolute numbers in order to take into account the slightly different sizes of the three groups.
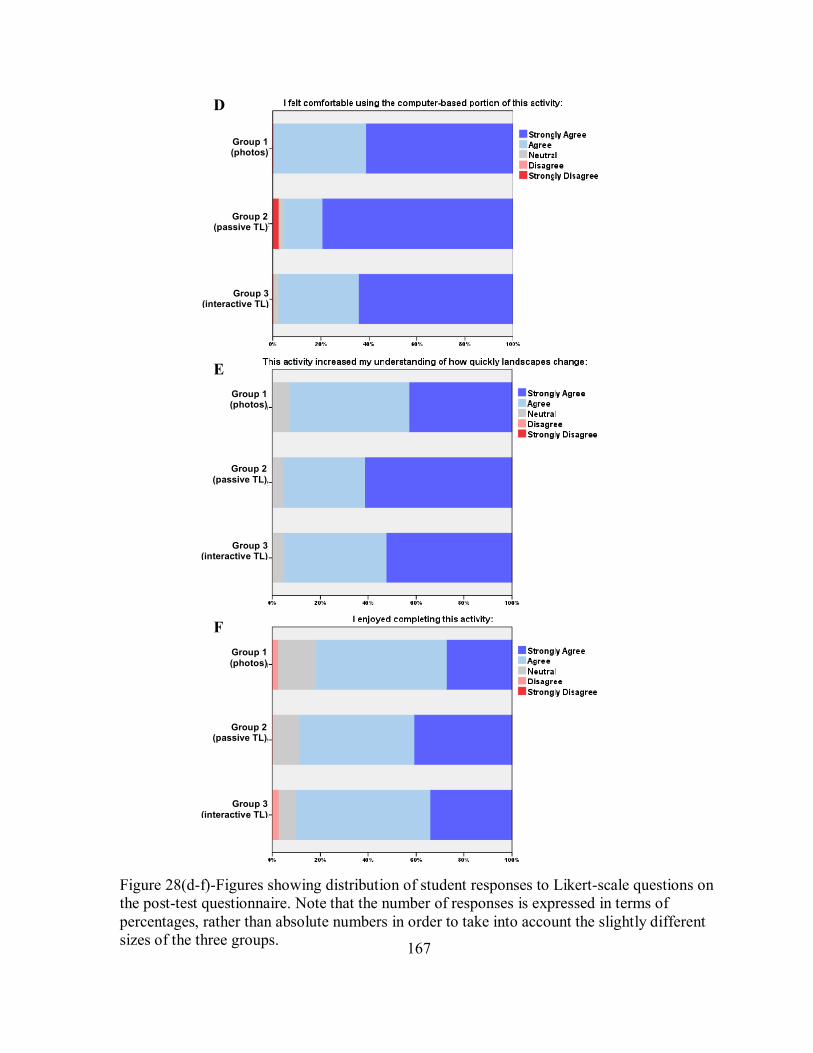
167
D
E
F
Group 1(photos)
Group 2(passive TL)
Group 3 (interactive TL)
Group 1(photos)
Group 2(passive TL)
Group 3 (interactive TL)
Group 1(photos)
Group 2(passive TL)
Group 3 (interactive TL)
Figure 28(d-f)-Figures showing distribution of student responses to Likert-scale questions on the post-test questionnaire. Note that the number of responses is expressed in terms of percentages, rather than absolute numbers in order to take into account the slightly different sizes of the three groups.
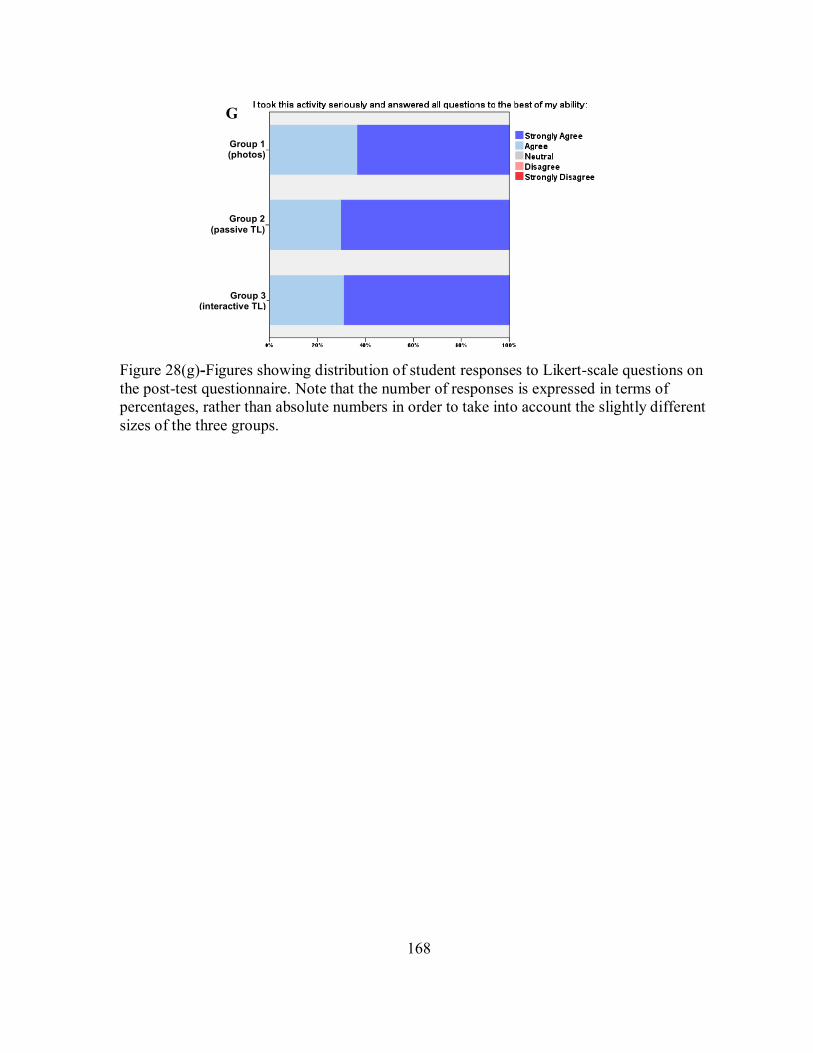
168
G
Group 1(photos)
Group 2(passive TL)
Group 3 (interactive TL)
Figure 28(g)-Figures showing distribution of student responses to Likert-scale questions on the post-test questionnaire. Note that the number of responses is expressed in terms of percentages, rather than absolute numbers in order to take into account the slightly different sizes of the three groups.
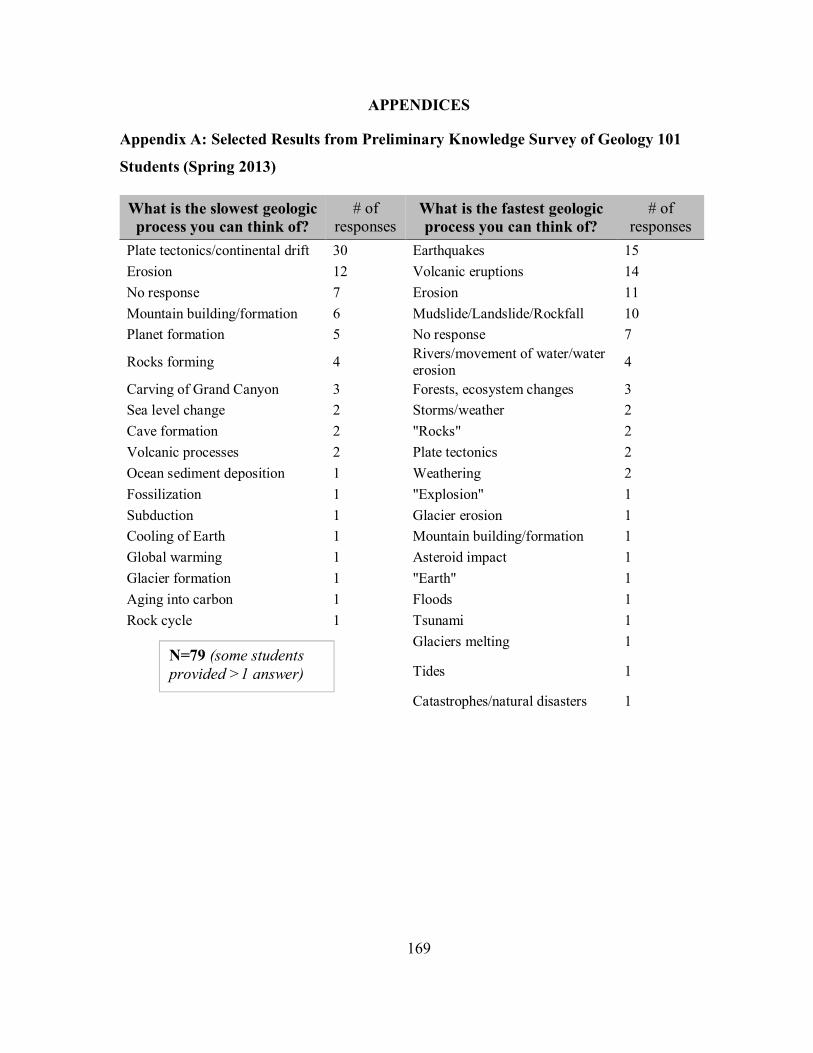
169
APPENDICES
Appendix A: Selected Results from Preliminary Knowledge Survey of Geology 101
Students (Spring 2013)
What is the slowest geologic process you can think of?
# of responses
What is the fastest geologic process you can think of?
# of responses
Plate tectonics/continental drift 30 Earthquakes 15
Erosion 12 Volcanic eruptions 14
No response 7 Erosion 11
Mountain building/formation 6 Mudslide/Landslide/Rockfall 10
Planet formation 5 No response 7
Rocks forming 4 Rivers/movement of water/water erosion
4
Carving of Grand Canyon 3 Forests, ecosystem changes 3
Sea level change 2 Storms/weather 2
Cave formation 2 "Rocks" 2
Volcanic processes 2 Plate tectonics 2
Ocean sediment deposition 1 Weathering 2
Fossilization 1 "Explosion" 1
Subduction 1 Glacier erosion 1
Cooling of Earth 1 Mountain building/formation 1
Global warming 1 Asteroid impact 1
Glacier formation 1 "Earth" 1
Aging into carbon 1 Floods 1
Rock cycle 1 Tsunami 1
Glaciers melting 1
Tides 1
Catastrophes/natural disasters 1
N=79 (some students provided >1 answer)
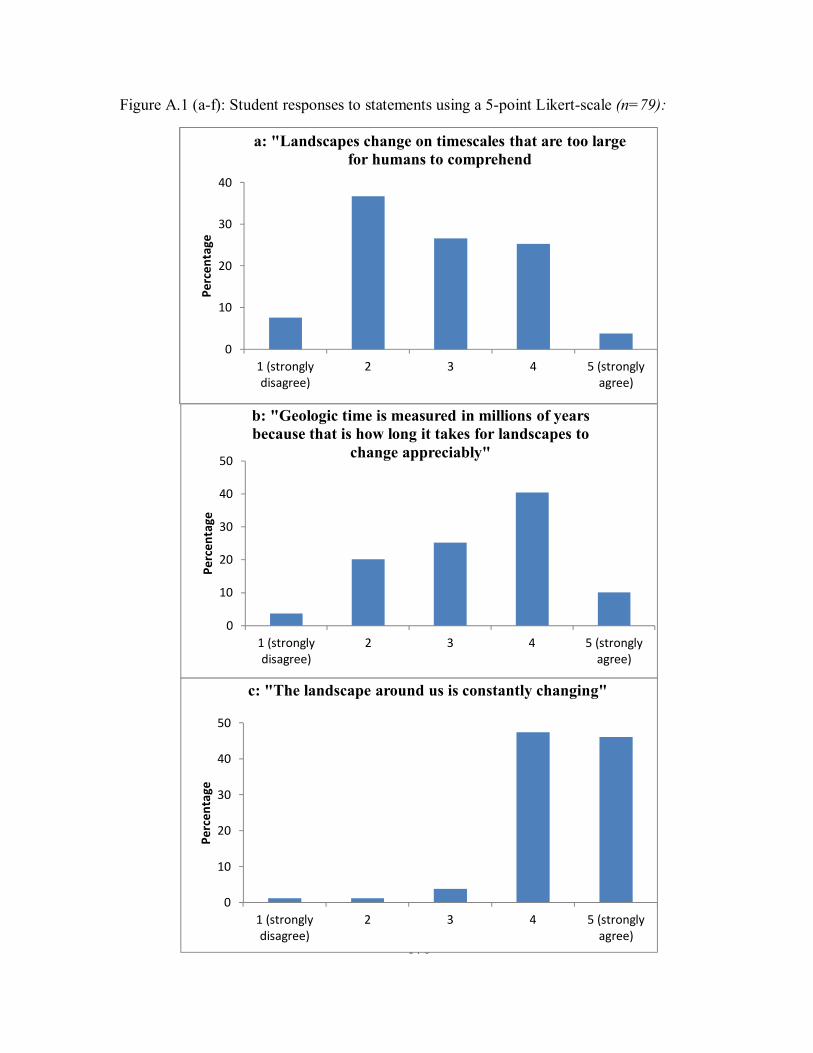
170
Figure A.1 (a-f): Student responses to statements using a 5-point Likert-scale (n=79):
0
10
20
30
40
1 (stronglydisagree)
2 3 4 5 (stronglyagree)
Pe
rce
nta
ge
a: "Landscapes change on timescales that are too large for humans to comprehend
0
10
20
30
40
50
1 (stronglydisagree)
2 3 4 5 (stronglyagree)
Pe
rce
nta
ge
b: "Geologic time is measured in millions of years because that is how long it takes for landscapes to
change appreciably"
0
10
20
30
40
50
1 (stronglydisagree)
2 3 4 5 (stronglyagree)
Pe
rce
nta
ge
c: "The landscape around us is constantly changing"
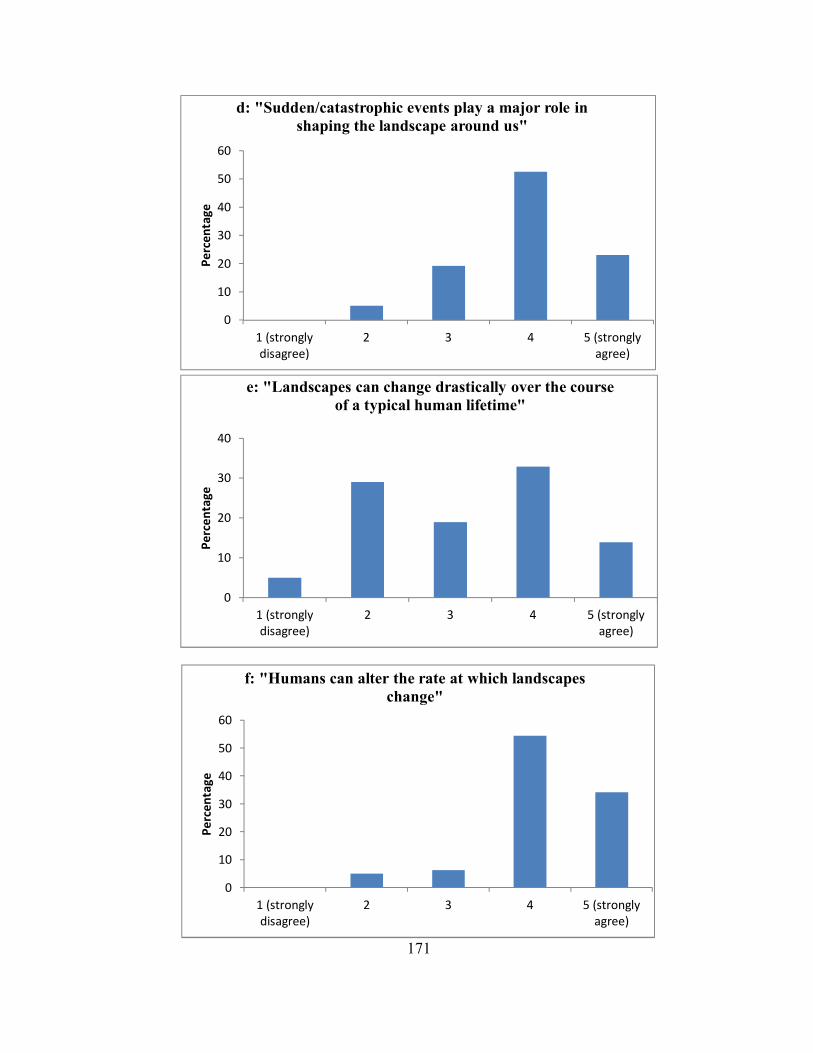
171
0
10
20
30
40
50
60
1 (stronglydisagree)
2 3 4 5 (stronglyagree)
Pe
rce
nta
ge
d: "Sudden/catastrophic events play a major role in shaping the landscape around us"
0
10
20
30
40
1 (stronglydisagree)
2 3 4 5 (stronglyagree)
Pe
rce
nta
ge
e: "Landscapes can change drastically over the course of a typical human lifetime"
0
10
20
30
40
50
60
1 (stronglydisagree)
2 3 4 5 (stronglyagree)
Pe
rce
nta
ge
f: "Humans can alter the rate at which landscapes change"
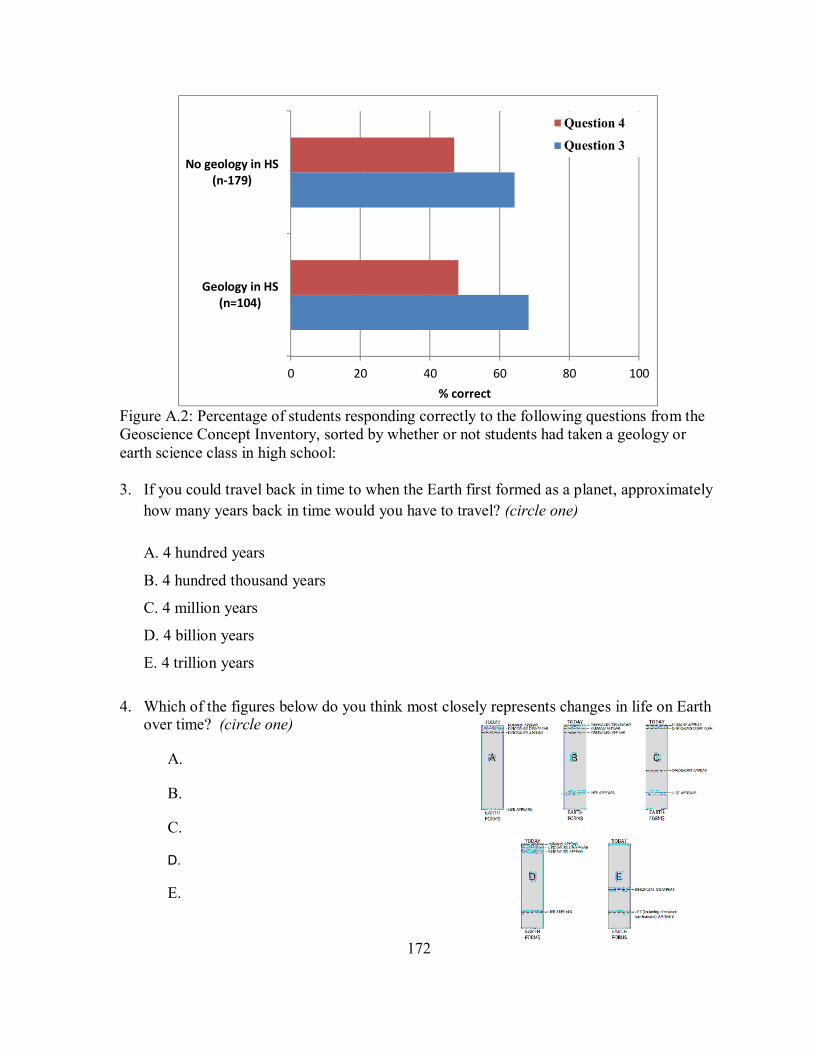
172
Figure A.2: Percentage of students responding correctly to the following questions from the Geoscience Concept Inventory, sorted by whether or not students had taken a geology or earth science class in high school: 3. If you could travel back in time to when the Earth first formed as a planet, approximately
how many years back in time would you have to travel? (circle one)
A. 4 hundred years
B. 4 hundred thousand years
C. 4 million years
D. 4 billion years
E. 4 trillion years
4. Which of the figures below do you think most closely represents changes in life on Earth over time? (circle one)
A.
B.
C.
D.
E.
0 20 40 60 80 100
Geology in HS(n=104)
No geology in HS(n-179)
% correct
Question 4
Question 3
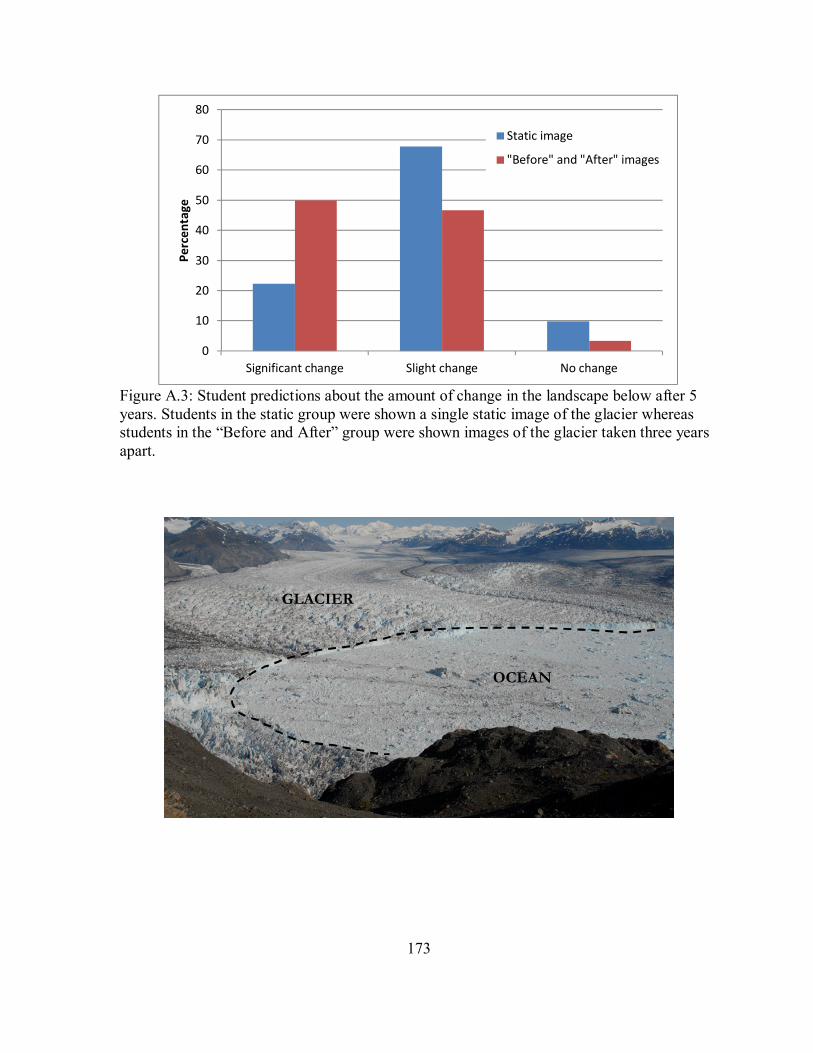
173
Figure A.3: Student predictions about the amount of change in the landscape below after 5 years. Students in the static group were shown a single static image of the glacier whereas students in the “Before and After” group were shown images of the glacier taken three years apart.
0
10
20
30
40
50
60
70
80
Significant change Slight change No change
Pe
rce
nta
ge
Static image
"Before" and "After" images
GLACIER
OCEANcean
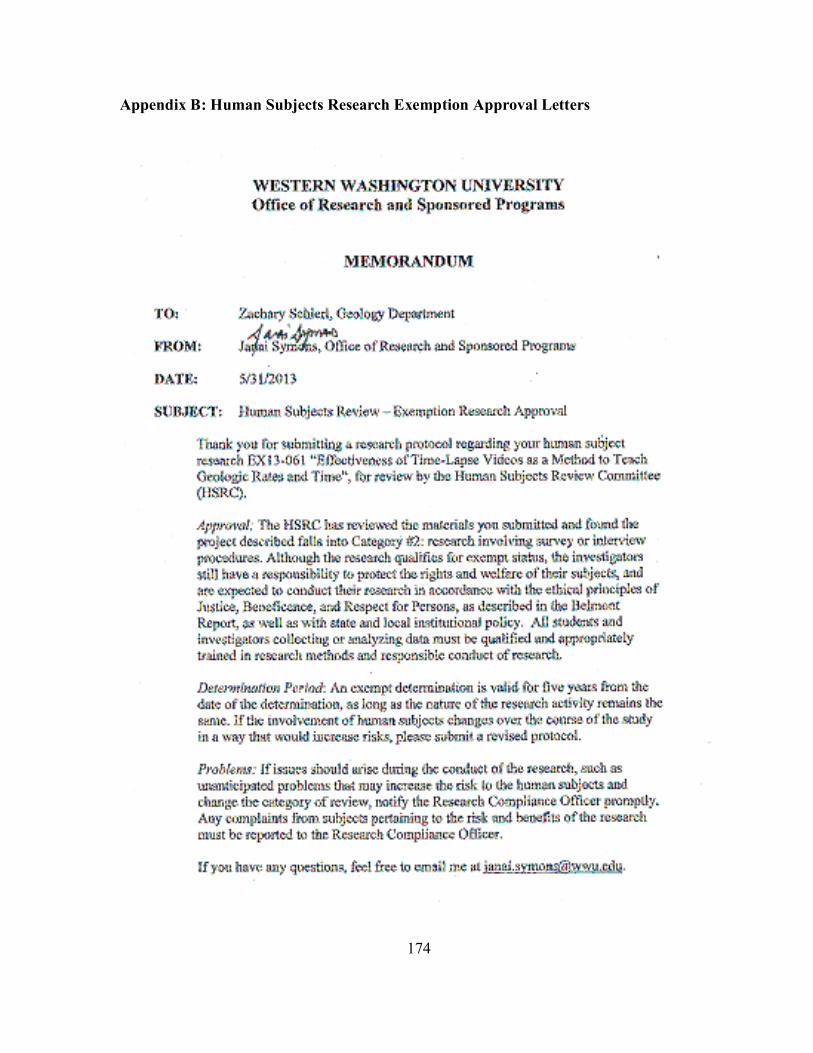
174
Appendix B: Human Subjects Research Exemption Approval Letters
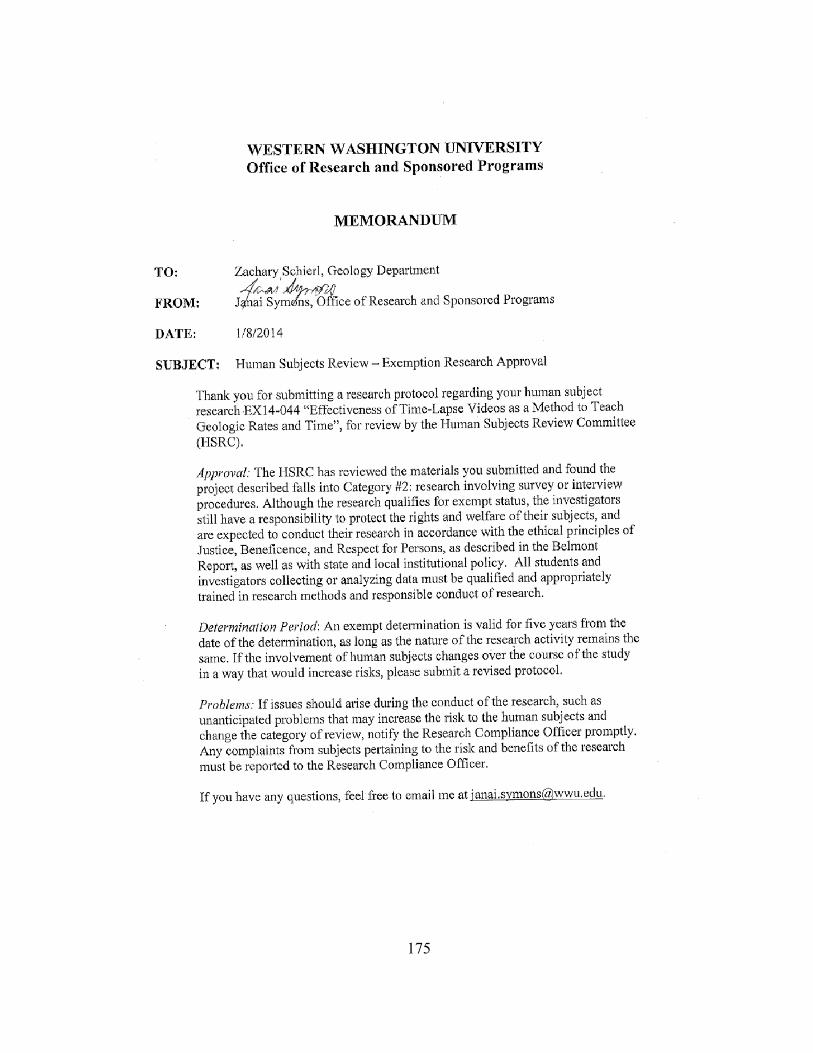
175
176
Appendix C : Informed Consent Documentation
Learning about Geology with Time-Lapse
INFORMED CONSENT FORM
Purpose of research: The goal of this study is to explore the effect of different activities designed to teach
geology students about geologic time and the rate at which our planet changes. Results from the study will be
published in a Masters Thesis in the Department of Geology.
Benefits and risks: There are no known physical or psychological risks associated with participation in this
study nor are there any financial costs associated with participation. By participating, you will be contributing
valuable information to our knowledge of the effectiveness of new technology on student learning. The results
from this study may be used to improve the content of introductory geology courses here at WWU and at other
universities. Upon completion of all assigned tasks, participants will receive a free movie ticket or Woods
Coffee gift card as compensation for your participation.
Procedure: By signing this form, you agree to be entered into a pool of possible participants. Depending on the
number of volunteers, you may or may not be selected to participate. Should you be selected, you will be sent
an email invitation to join a Canvas course created for this project. Upon joining, you will be asked to complete
a short questionnaire and quiz via Canvas. Following this, you will be contacted by the researcher to set up a
time for you to come to a WWU computer lab to complete participation in the study. While in the computer lab,
assigned tasks may include answering assessment questions, viewing time-lapse videos or photos, problem
solving, and reading text. Completing the Canvas and computer lab portions of the study should take between 1
and 1 ½ hours of your time.
Confidentiality: All information collected in this study will remain confidential. Data for this project will be
gathered both electronically (via Canvas and SurveyMonkey) and on paper. The only document on which your
name will appear is this form. All other documents you submit will be anonymous and will be matched to each
other using only the last 4 digits of your Western ID number. All documents, whether electronic or hard copy,
that contain your name or information will be stored securely and will only be accessible by the researcher and
a faculty advisor. Your signed informed consent form will be stored separately from your responses. No names
or any information that could be used to identify you will appear in any final research documents.
Contact Information: This research is being conducted by Zachary Schierl, through the Department of
Geology at Western Washington University and is being supervised by Dr. Scott Linneman. If you have any
questions about the study, please contact Zachary Schierl by phone at (360) 650-4127 or by email at
[email protected]. Scott Linneman may be contacted at (360) 650-7207 or by email at
[email protected]. You may also contact Janai Symons, Research Compliance Officer at WWU at
[email protected] with any questions.
Consent to participate: If you agree to participate in this study, please read all instructions carefully and give
your thoughtful and honest responses to all questions. Your effort and thoughtful participation is vital in
obtaining reliable and useable data. Your participation in this study is entirely voluntary, and you are free to
withdraw at any time without penalty to your course grade.
Please sign below if you are 18 years of age or older, have read the above information, and agree to
participate in this study. (If you are not yet 18, please do not sign before as participating in this study would
require parental permission.)

177
Signature Date
Printed Name WWU email address
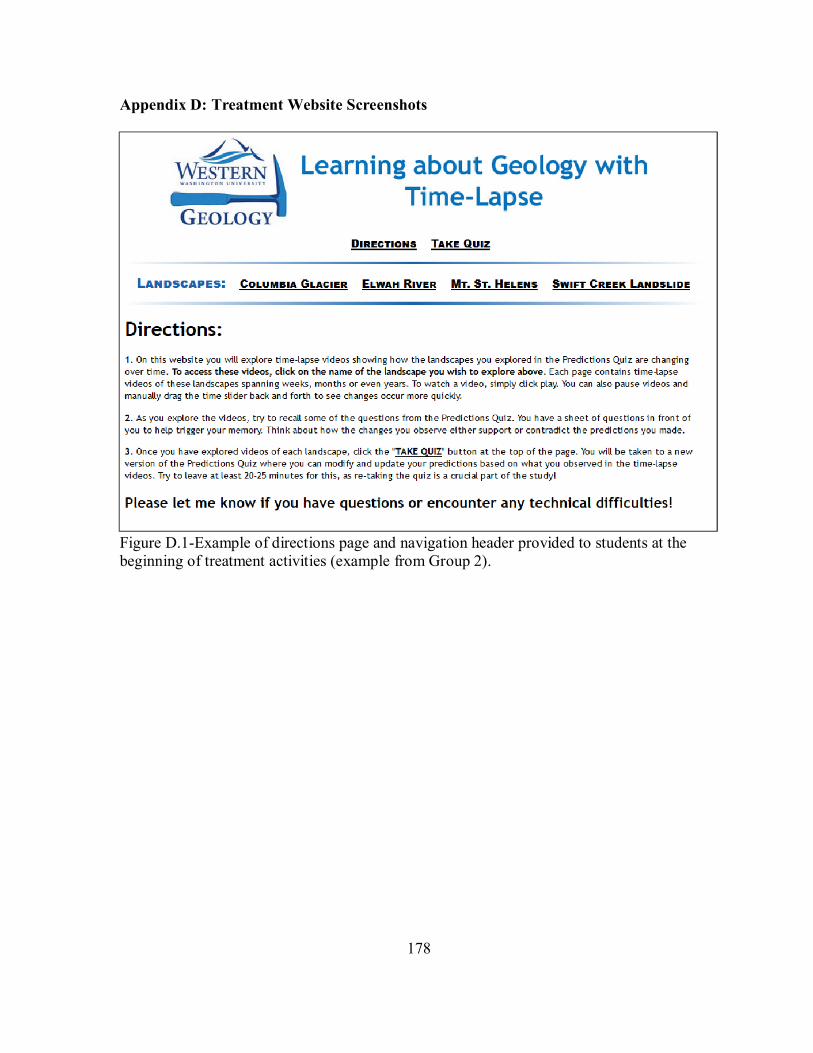
178
Appendix D: Treatment Website Screenshots
Figure D.1-Example of directions page and navigation header provided to students at the beginning of treatment activities (example from Group 2).
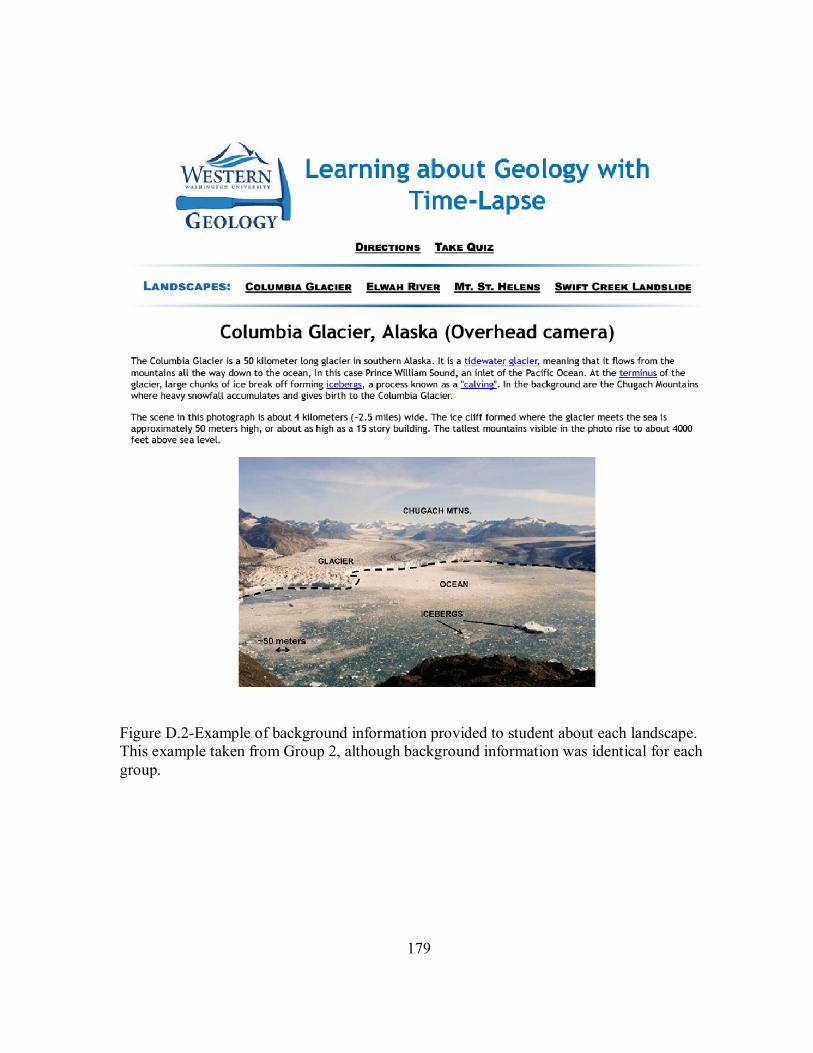
179
Figure D.2-Example of background information provided to student about each landscape. This example taken from Group 2, although background information was identical for each group.
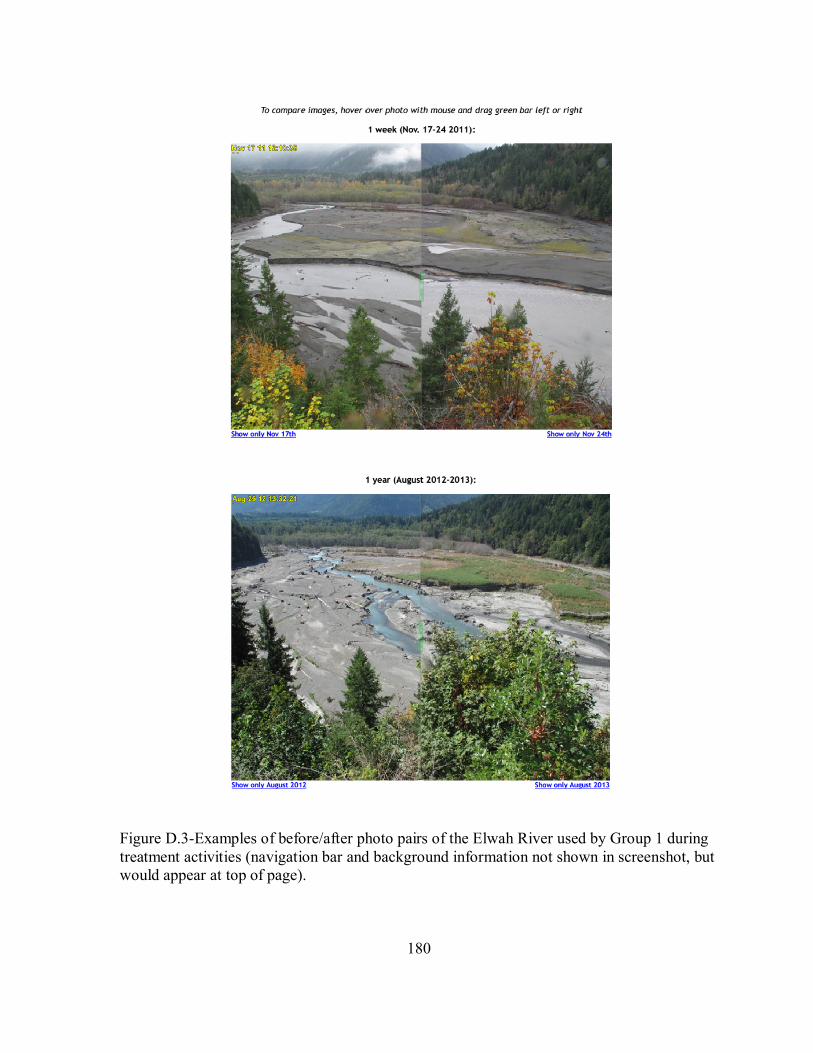
180
Figure D.3-Examples of before/after photo pairs of the Elwah River used by Group 1 during treatment activities (navigation bar and background information not shown in screenshot, but would appear at top of page).
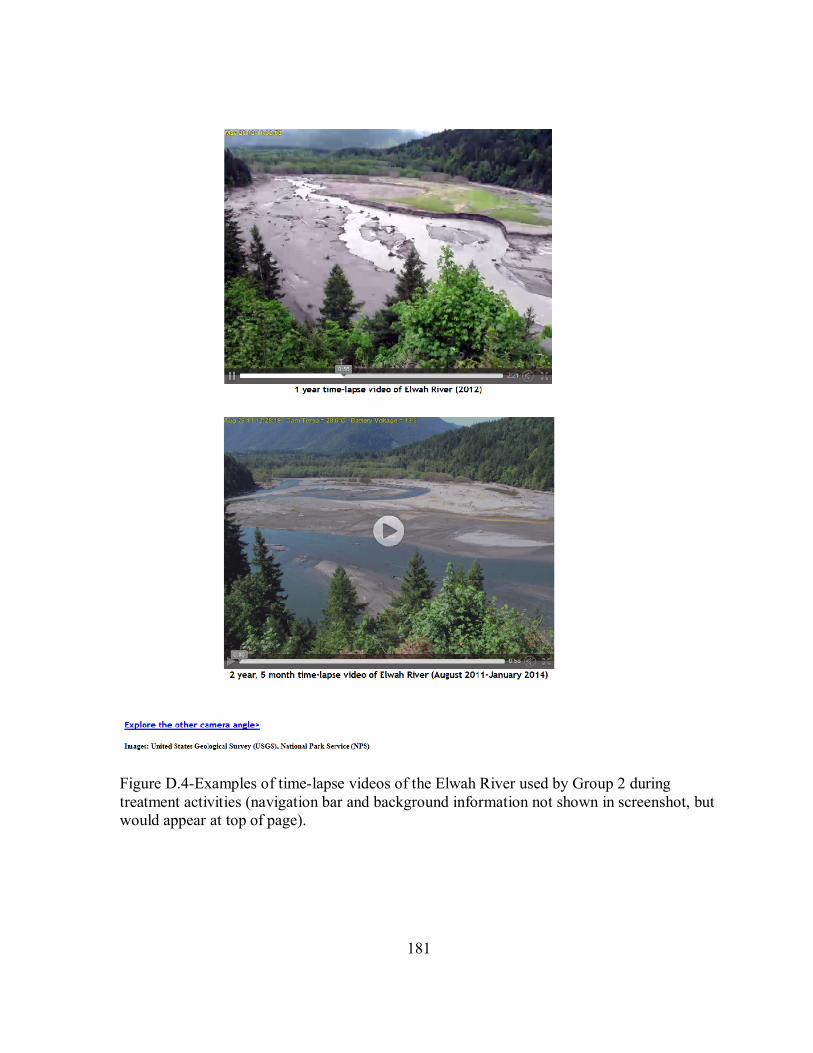
181
Figure D.4-Examples of time-lapse videos of the Elwah River used by Group 2 during treatment activities (navigation bar and background information not shown in screenshot, but would appear at top of page).
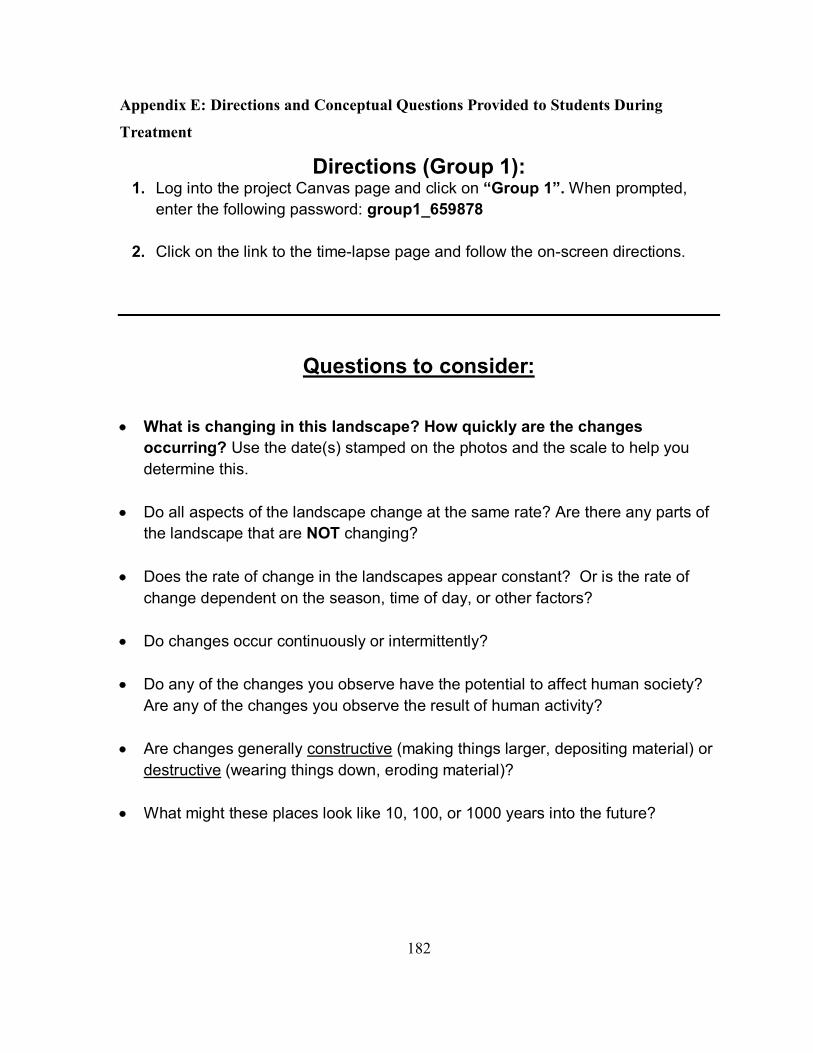
182
Appendix E: Directions and Conceptual Questions Provided to Students During
Treatment
Directions (Group 1): 1. Log into the project Canvas page and click on “Group 1”. When prompted,
enter the following password: group1_659878
2. Click on the link to the time-lapse page and follow the on-screen directions.
Questions to consider:
What is changing in this landscape? How quickly are the changes
occurring? Use the date(s) stamped on the photos and the scale to help you
determine this.
Do all aspects of the landscape change at the same rate? Are there any parts of
the landscape that are NOT changing?
Does the rate of change in the landscapes appear constant? Or is the rate of
change dependent on the season, time of day, or other factors?
Do changes occur continuously or intermittently?
Do any of the changes you observe have the potential to affect human society?
Are any of the changes you observe the result of human activity?
Are changes generally constructive (making things larger, depositing material) or
destructive (wearing things down, eroding material)?
What might these places look like 10, 100, or 1000 years into the future?
183
Appendix F: Demographic Questionnaire
184
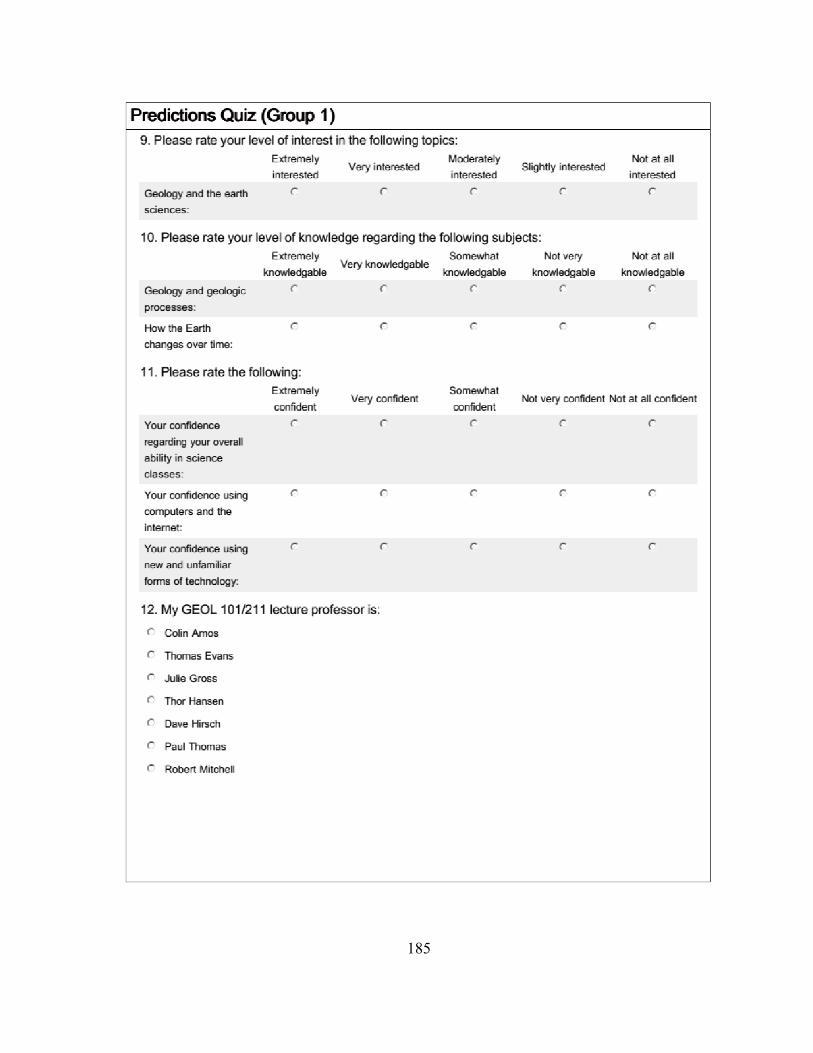
185
186
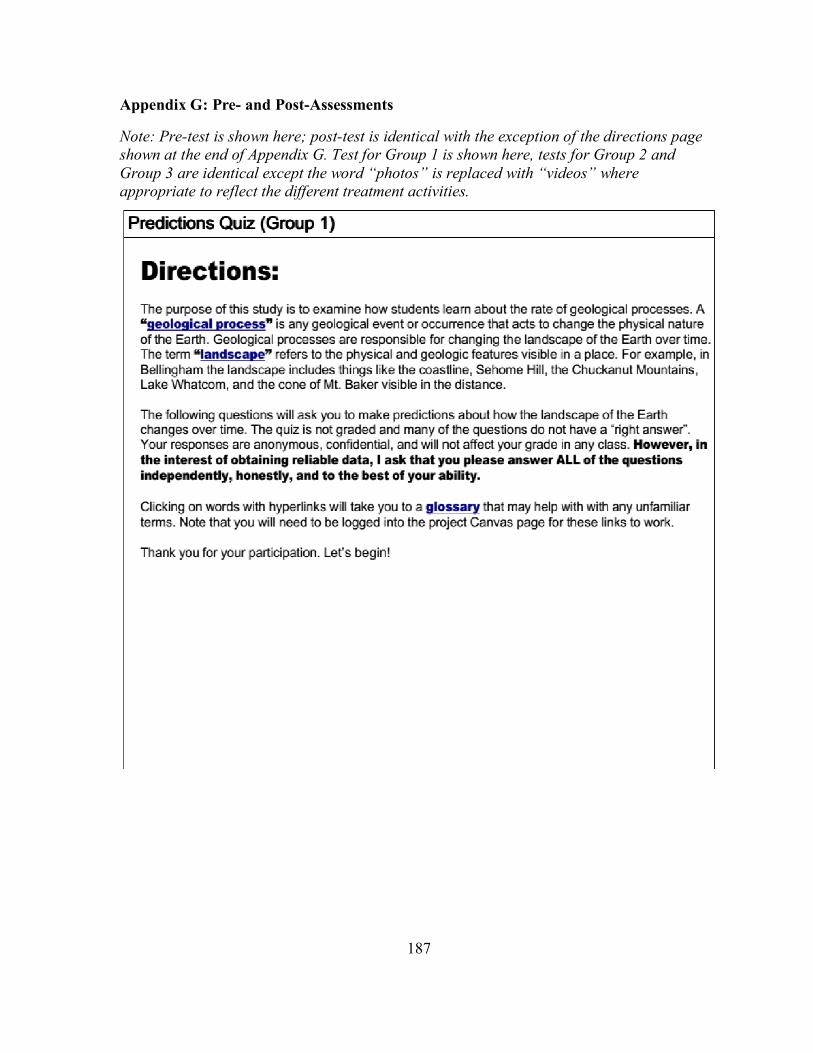
187
Appendix G: Pre- and Post-Assessments
Note: Pre-test is shown here; post-test is identical with the exception of the directions page shown at the end of Appendix G. Test for Group 1 is shown here, tests for Group 2 and Group 3 are identical except the word “photos” is replaced with “videos” where appropriate to reflect the different treatment activities.
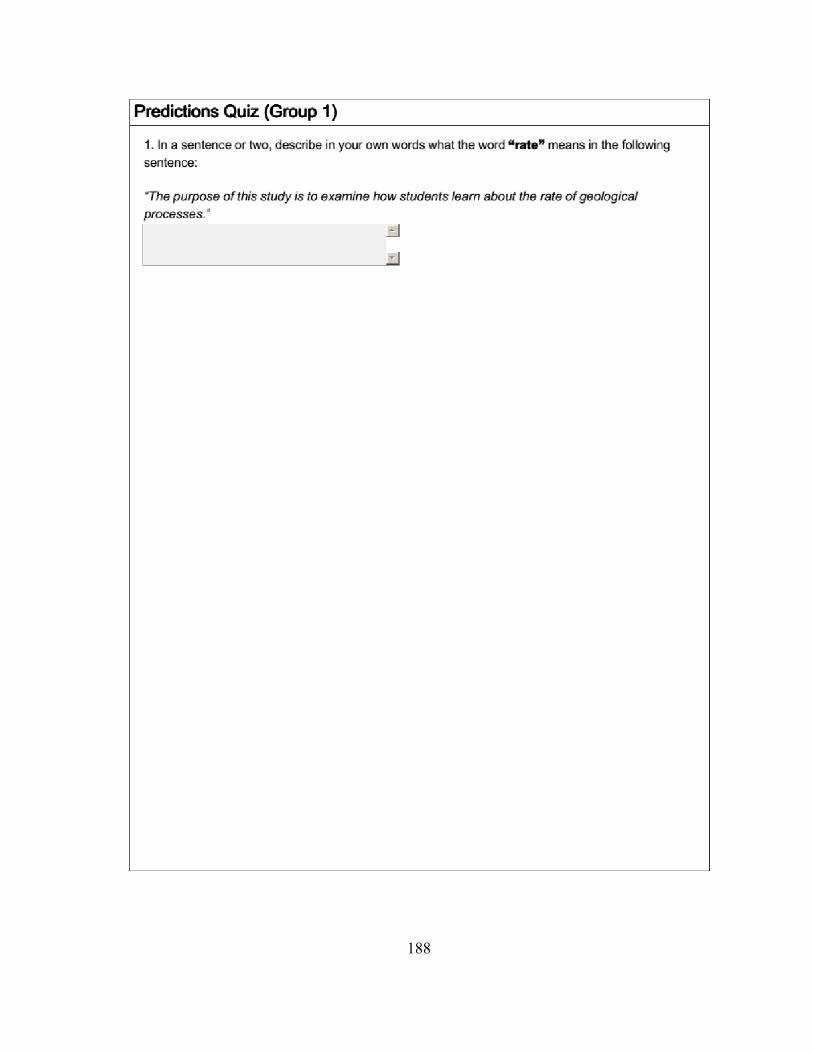
188
189
190
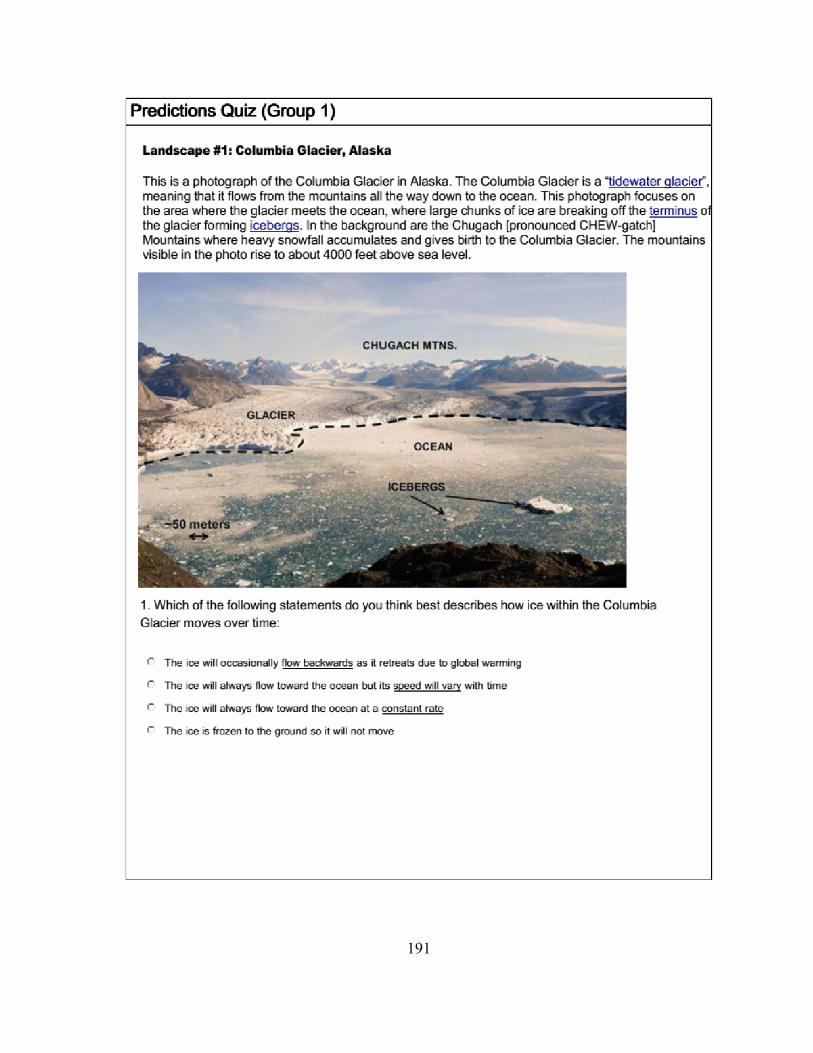
191
192
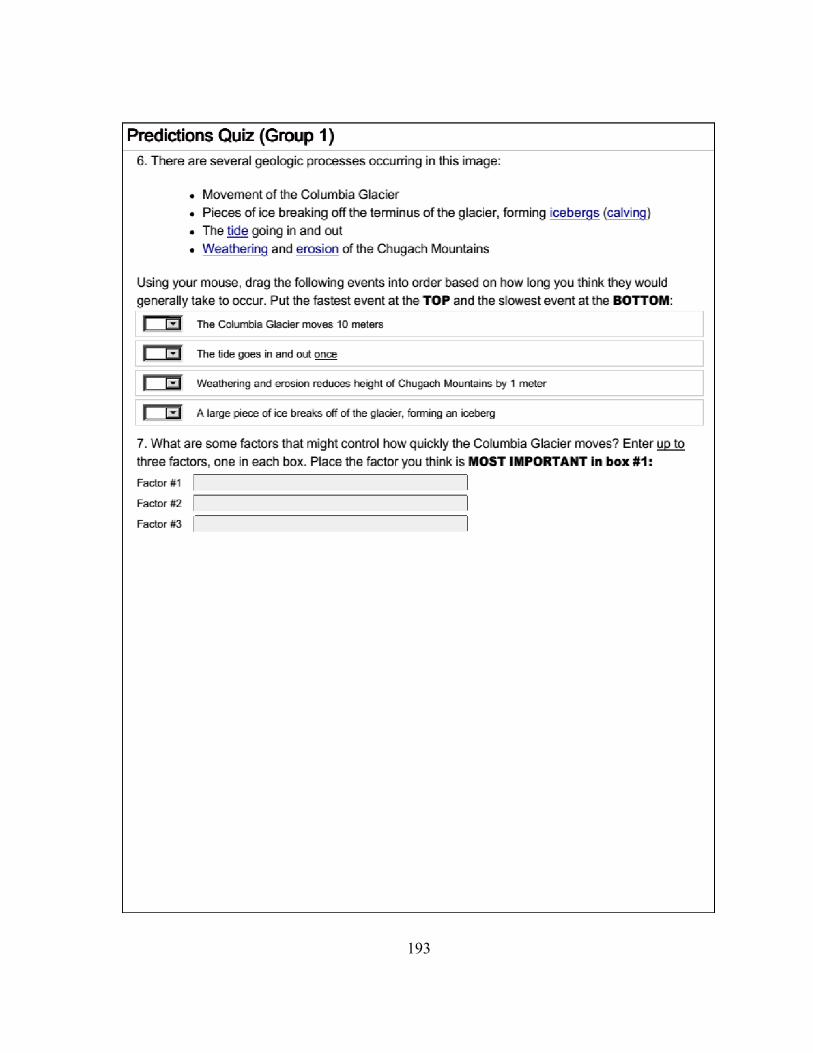
193
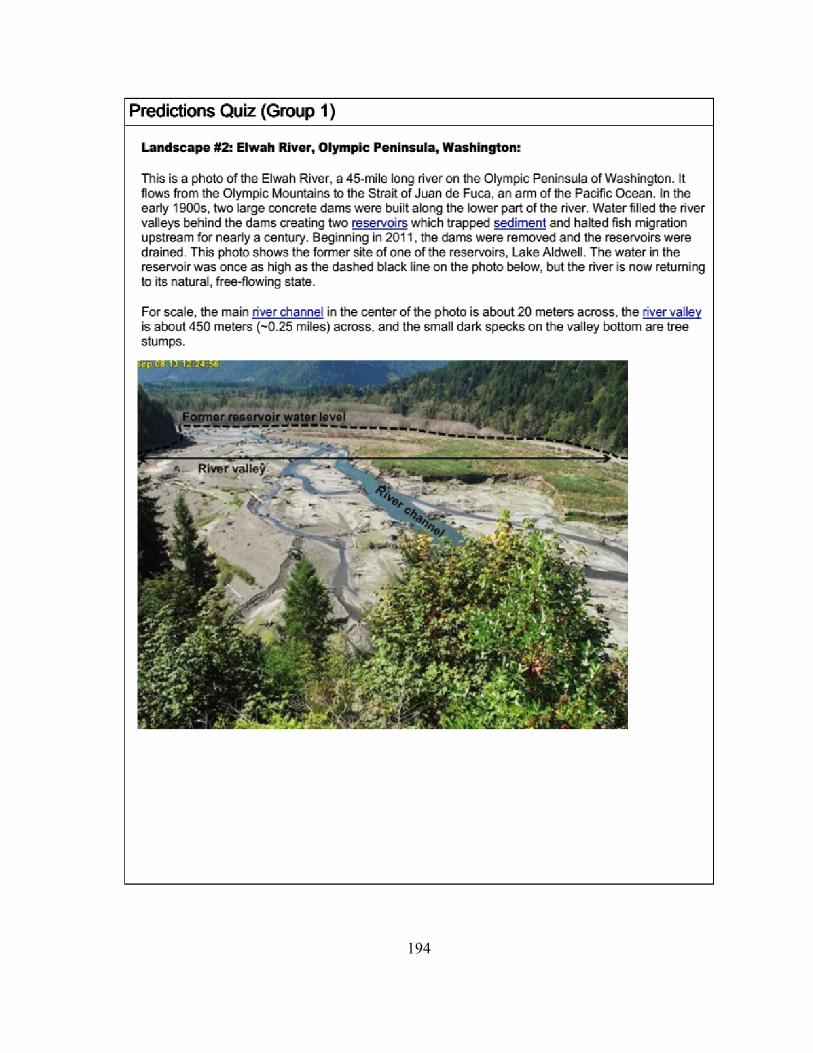
194
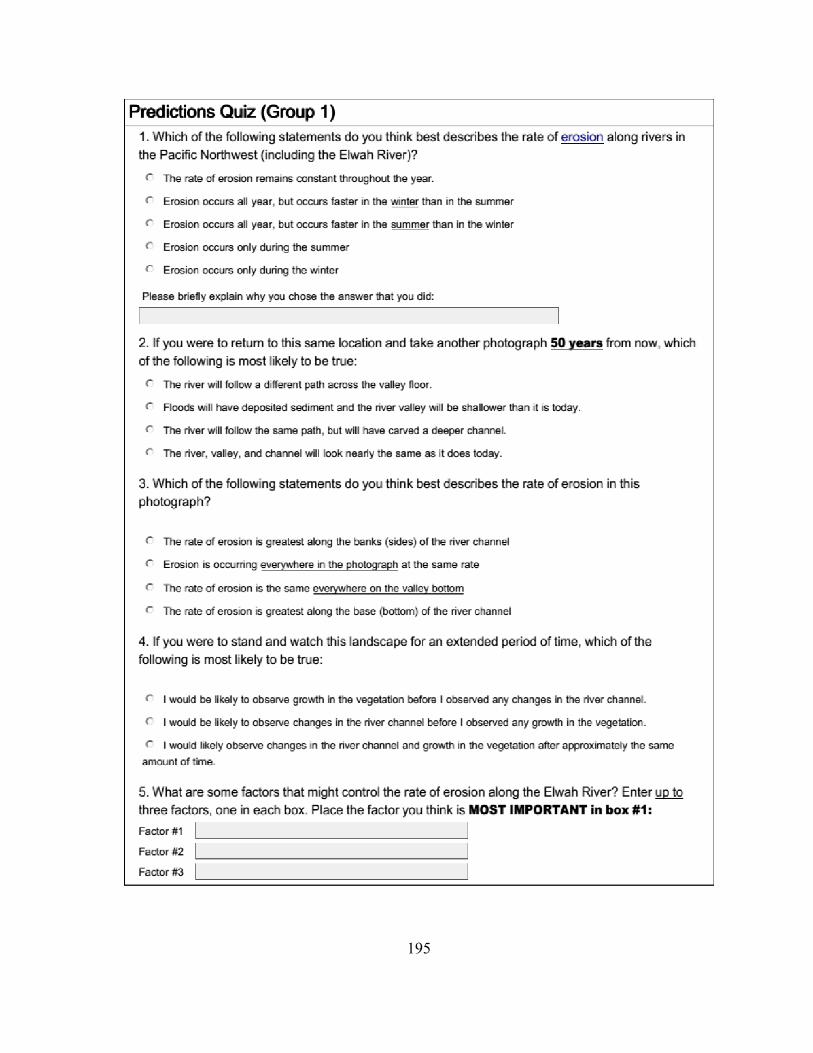
195
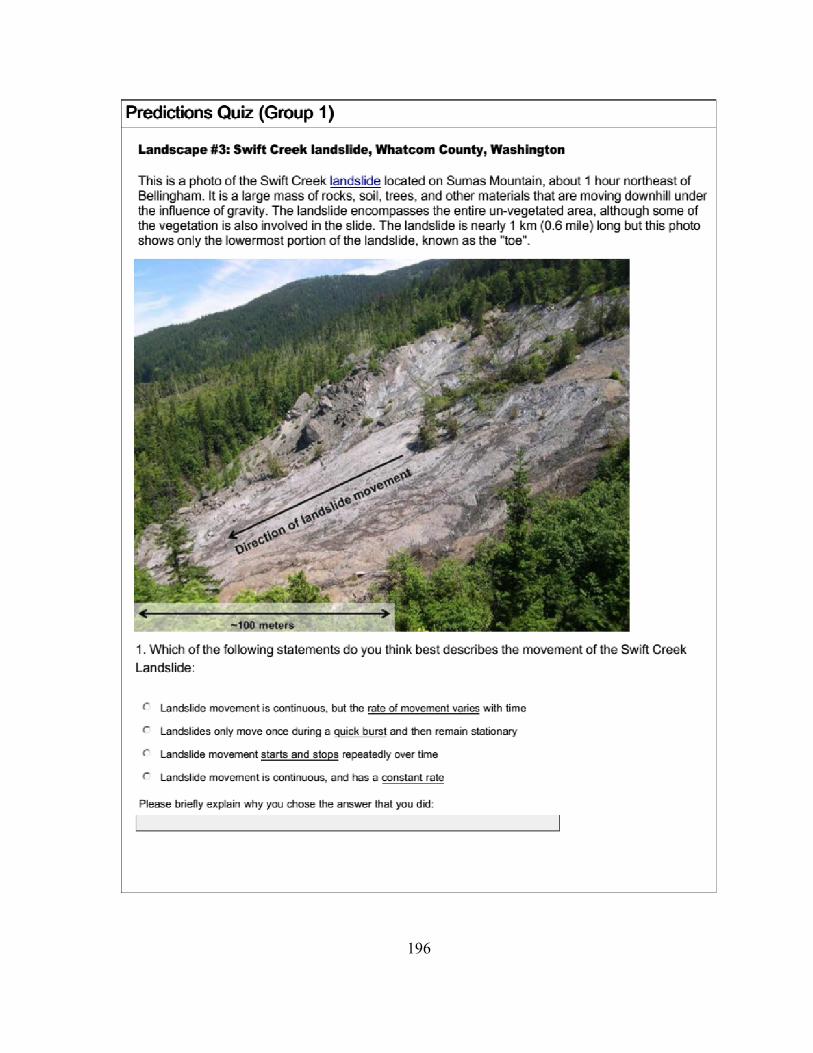
196
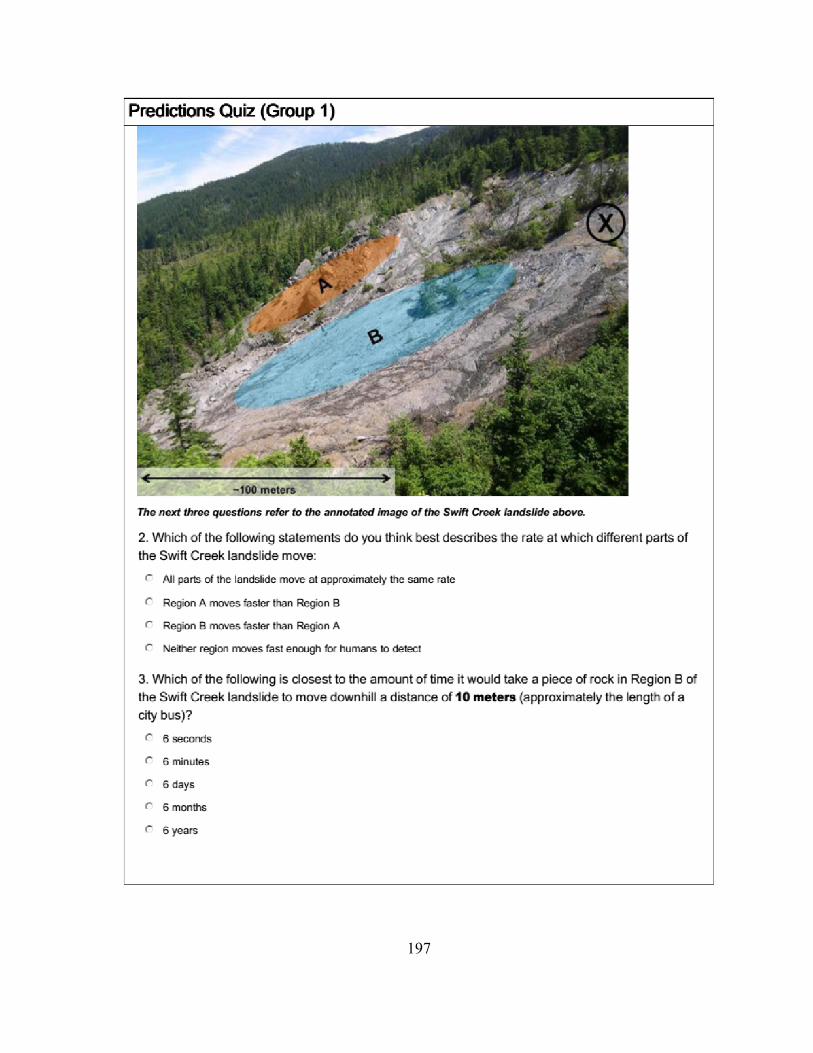
197
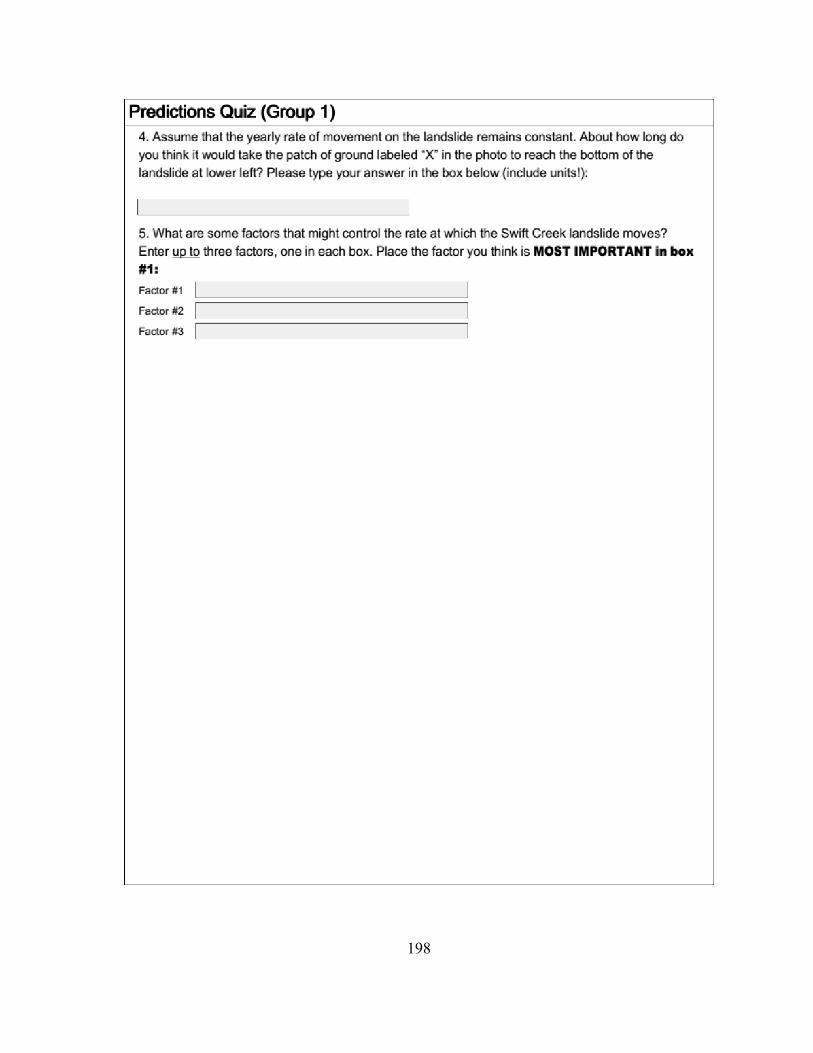
198
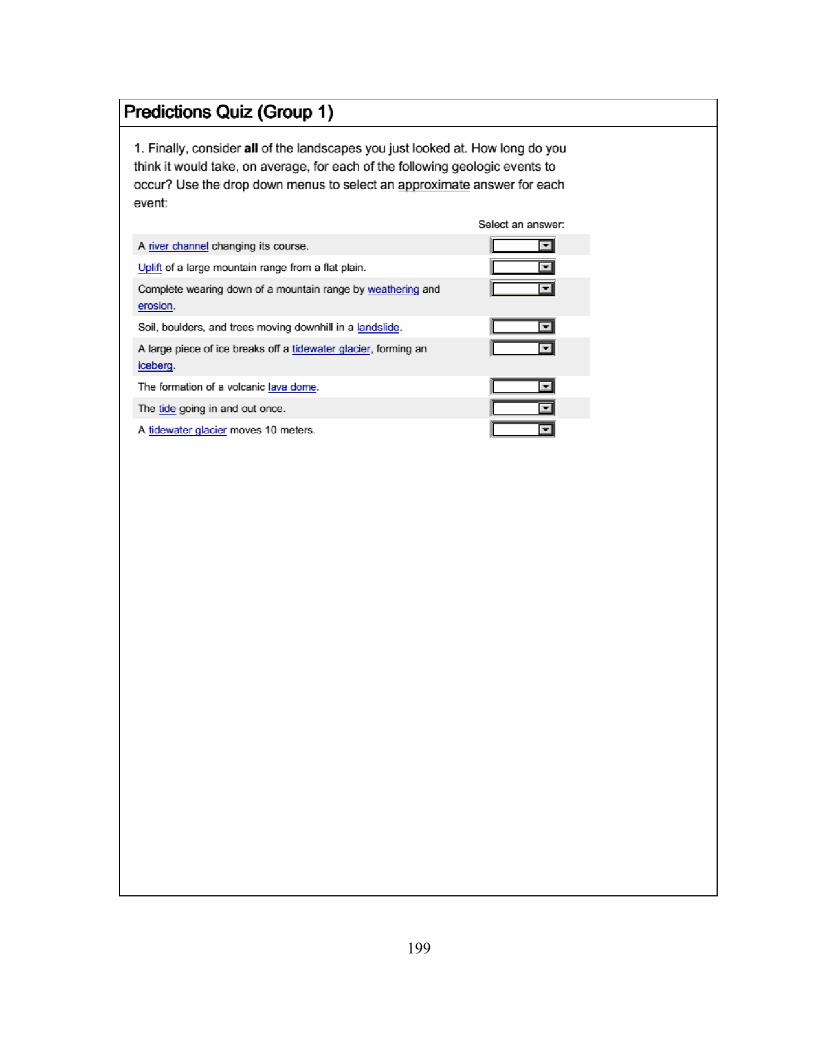
199
200
Differences in Post-Test:
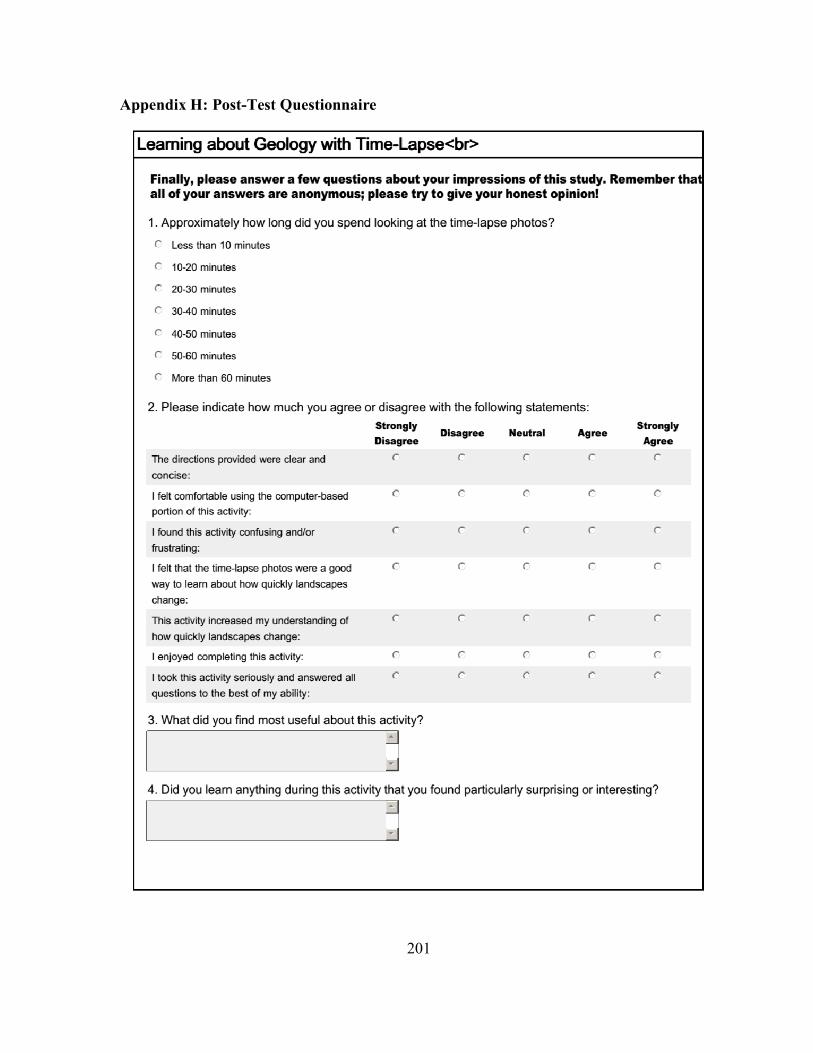
201
Appendix H: Post-Test Questionnaire
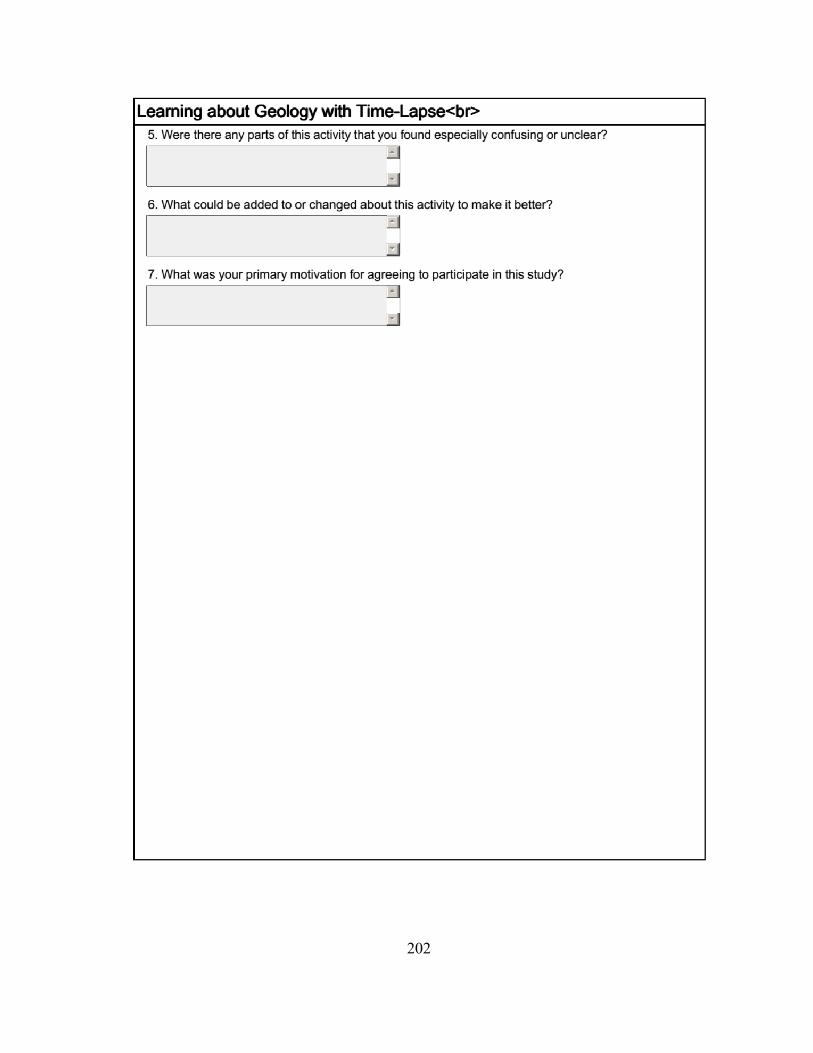
202
Recommended


