
Neuron, Vol. 48, 577–589, November 23, 2005, Copyright ª2005 by Elsevier Inc. DOI 10.1016/j.neuron.2005.10.026
Ephrin-As Guide the Formationof Functional Maps in the Visual Cortex
Jianhua Cang,1,3 Megumi Kaneko,1,3 Jena Yamada,2
Georgia Woods,2 Michael P. Stryker,1,*
and David A. Feldheim2,*1W. M. Keck Foundation Center for Integrative
NeuroscienceDepartment of PhysiologyUniversity of California, San FranciscoSan Francisco, California 941432Department of Molecular, Cell, and Developmental
BiologyUniversity of California, Santa CruzSanta Cruz, California 95064
Summary
Ephrin-As and their receptors, EphAs, are expressed
in the developing cortex where they may act to orga-nize thalamic inputs. Here, we map the visual cortex
(V1) in mice deficient for ephrin-A2, -A3, and -A5 func-tionally, using intrinsic signal optical imaging and
microelectrode recording, and structurally, by ana-tomical tracing of thalamocortical projections. V1 is
shifted medially, rotated, and compressed and its in-ternal organization is degraded. Expressing ephrin-
A5 ectopically by in utero electroporation in the lateralcortex shifts the map of V1 medially, and expression
within V1 disrupts its internal organization. Thesefindings indicate that interactions between gradients
of EphA/ephrin-A in the cortex guide map formation,but that factors other than redundant ephrin-As are re-
sponsible for the remnant map. Together with earlier
work on the retinogeniculate map, the current findingsshow that the same molecular interactions may oper-
ate at successive stages of the visual pathway to orga-nize maps.
Introduction
Themammalian cerebralcortex is organized intomodality-specific areas that are innervated by their correspondingthalamic nuclei. Within each cortical area, the thalamo-cortical (TC) axons are organized into topographic maps,which are thought to ensure that sensory information isprocessed correctly. Recent findings suggest that theinitial broad patterning of the cortex into different areasoccurs embryonically and is regulated by signaling mol-ecules and transcription factors expressed in the devel-oping cortex (Grove and Fukuchi-Shimogori, 2003;Rakic, 1988). Topographic mapping within a given areaoccurs perinatally (in rodents) and depends, at least inpart, on the activity patterns and molecular cues carriedby TC axons (Dufour et al., 2003; Lopez-Bendito and Mol-nar, 2003; O’Leary, 1989; Sur and Leamey, 2001). Theidentities and the mechanism of action of the molecules
*Correspondence: [email protected] (D.A.F.); stryker@
phy.ucsf.edu (M.P.S.)3 These authors contributed equally to this work.
that guide TC axons to the proper cortical areas and me-diate the establishment of functional topographic mapsof TC axons within each cortical area are largely un-known.
The Eph family of receptor tyrosine kinases andtheir cell-surface bound ligands, ephrins, are likely can-didates for patterning TC axons. Eph receptors andephrins play important roles in many processes of neuraldevelopment. Most notably, they act as positional labelsin the establishment of topographic maps by triggeringcontact-mediated repulsion or attraction (Bolz et al.,2004; Flanagan and Vanderhaeghen, 1998; Hansen et al.,2004; McLaughlin et al., 2003; Wilkinson, 2001). A rolefor EphA/ephrin-A interactions in patterning TC axonshas been inferred from their normal graded expressionpatterns in the developing thalamus and cortex (Do-noghue and Rakic, 1999a; Donoghue and Rakic, 1999b;Gao et al., 1998; Mackarehtschian et al., 1999; Sestanet al., 2001; Vanderhaeghen et al., 2000) and from defectsin ephrin-A knockout mice (Dufour et al., 2003; Uzielet al., 2002; Vanderhaeghen et al., 2000). For example,in EphA4/ephrin-A5 double mutant mice, the topo-graphic mapping of TC axons to the somatosensory cor-tex is perturbed, and the somatosensory cortex also re-ceives aberrant projections from the motor thalamicnucleus (Dufour et al., 2003). These results suggest thatEphs and ephrins are involved in the routing of TC axonsthrough the ventral forebrain, to determine their rostro-caudal targeting, and are used in the cortex for topo-graphic mapping (Garel and Rubenstein, 2004; Vander-haeghen and Polleux, 2004). However, the phenotypesin most loss-of-function studies are often subtle andonly partially penetrant, leaving the possibility that eitherother EphA receptors or ephrin-A ligands act redun-dantly (with those knocked out), or that non-EphA/ephrin-A mechanisms exist to compensate in theseprojections. In addition, these experiments have largelydepended on anatomical methods (except for Prakashet al., 2000), and therefore the extent to which corticalfunction is altered in ephrin mutants remains unknown.
With the development of intrinsic signal imaging, it isnow possible to carry out functional analyses of corticalorganization in the mouse visual system (Kalatsky andStryker, 2003). This method allows for rapid determina-tion of detailed retinotopic maps of several areas in theadult mouse visual cortex. Therefore, in the first set ofexperiments in the present study, we combined thisnew imaging method of functional analysis with classi-cal anatomical tracing to examine the patterning of vi-sual TC axons in mice deficient for ephrin-A2, ephrin-A3, and ephrin-A5, the three ephrin-As that account foralmost all ephrin-A ligand expression in the developingvisual thalamus and cortex (Pfeiffenberger et al., 2005and present study). In ephrin-A2/A3/A5 triple knockout(ephrin-A TKO) mice, we find that the TC projectionfrom the dorsal lateral geniculate nucleus (dLGN) tothe visual cortex shows abnormal topographic map-ping. Functional imaging in ephrin-A TKOs reveals thatthe primary visual area (V1) is rotated and shifted medi-ally and that the internal organization of the visuotopic

Neuron578
Figure 1. Expression of EphA Receptors and
Ephrin-A Ligands in the Developing Visual
Cortex
(A–F) Coronal sections from P4 mouse poste-
rior cortex were treated with hybridization
probes for Cadherin-8 (Cad8) (A), EphA7 (B),
EphA4 (C), ephrin-A5 (D), ephrin-A3 (E), and
ephrin-A2 (F). * indicates inflection point in
expression. (G–I) Coronal sections were
stained with ephrin-A5-AP (G) in wild-type
(WT) or EphA3-AP (H and I) in WT and
ephrin-A TKO mice. Lines indicate approxi-
mate boundaries of the visual cortex as as-
sayed by Cad8 expression. Arrows indicate
dLGN. Dorsal is at the top, medial is at the
right of each panel. (J–M) Whole-mount views
comparing Cad8 RNA expression with EphA
and ephrin-A protein expression in P4 cortex.
(J) Whole-mount RNA in situ hybridization de-
tecting Cad8 RNA expression. (K) Ephrin-A5-
AP (detects EphA protein) staining shows
EphA protein overlapping with Cad8 in poste-
rior cortex. (L and M) EphA3-AP (detects eph-
rin-A protein) shows a complementary bind-
ing pattern to that of ephrin-A5-AP that is
highest surrounding Cad8. M1, primary mo-
tor cortex; S1, primary somatosensory cor-
tex; A1, primary auditory cortex; V1, primary
visual cortex. Location of the cortical areas
is approximate at P4 and is based on (Hama-
saki et al., 2004).
map is disrupted. To confirm the cortical origin of thesedefects, we misexpress ephrin-A ligands in the embry-onic cortex and allow animals to develop. The ectopicexpression of ephrin-A5 in regions lateral to the visualcortex causes V1 to shift medially. Furthermore, whenephrin-A5 or ephrin-A2 is ectopically expressed withinthe visual cortex, its functional topography is locally dis-rupted.
Taken together, these experiments demonstrate thatthe ephrin-A ligands are required for two processes ofvisual TC axon patterning along the medial-lateral axis:(1) positioning—determining the location of a corticalarea on the cortical plate, and (2) internal organiza-tion—guiding the orderly layout of a map within a corticalarea. They indicate that EphA/ephrin-A interactions maybe used at multiple stages in the visual system to guidethe formation of topographic maps.
Results
EphA Receptor and Ephrin-A Ligand Expression in
the Developing Thalamocortical Visual ProjectionThe retina projects to multiple subcortical areas includ-ing the superior colliculus (SC) in the midbrain and thedorsal lateral geniculate nucleus (dLGN) in the thalamus.Visual information destined to be processed for percep-tion is transferred from the dLGN to the primary visual
cortex (V1), located near the caudal pole of the hemi-spheres. V1 in turn projects to higher-order visual areas,most notably the secondary visual cortex (V2). Each vi-sual area contains a topographic representation of thevisual field that is maintained through connections be-tween visual areas. In the mouse visual system, thenasal-temporal axis of the visual field (azimuth) mapsalong the ventral-lateral to dorsal-medial axis of thedLGN, which, in turn, maps roughly along the medial-lateral axis of V1 and V2. Gradients of ephrin-A ligandsand EphA receptors are expressed in the retina and inretinal targets, where they are required for establishingnormal retinotopic maps (Feldheim et al., 2000, 2004,1998; Frisen et al., 1998; Rashid et al., 2005).
In the dLGN, ephrin-A2 and ephrin-A5 are expressedin a ventral-lateral-anterior (high) to dorsal-medial-posterior (low) gradient, whereas EphA7, and probablyother EphA receptors, are expressed in the oppositegradient (Feldheim et al., 1998; Pfeiffenberger et al.,2005 and Figure 1). Ephrin-A3 is expressed at low levelsin the dLGN and dorsal thalamus (Feldheim et al., 1998;Pfeiffenberger et al., 2005). EphA/ephrin-A expression inthe dLGN suggests a model whereby EphA/ephrin-Agradients are used to target dLGN neurons to V1 in amechanism similar to that used to target retinal axonsto the dLGN. Therefore, we examined the expressionpatterns of ephrin-A and EphA family members along

Ephrin-As Guide Visual Cortical Map Formation579
the medial-lateral axis of the posterior cortex and com-pared this to the expression of cadherin-8 (Cad8). Cad8is a homophilic cell adhesion protein expressed in pat-terns that mark primary and secondary visual cortex inearly postnatal mice (Hamasaki et al., 2004; Suzukiet al., 1997). Consistent with previous observations byothers in mouse, rat, and monkey (Flanagan et al., 2000;Sestan et al., 2001; Yun et al., 2003), we found comple-mentary expression of EphA receptors and ephrin-A li-gands in the posterior cortex that falls within the Cad8expression area (Figure 1 and Figure S1). At postnatalday 4 (P4), Cad8 is expressed in layers 2/3 and 4 of theposterior cortex. Cad8 expression is continuous in layer4, but is in a distinct part of the dorsomedial posteriorcortex in layers 2/3, potentially encompassing presump-tive V1 and V2 (Figure 1A) (Suzuki et al., 1997). Whole-mount RNA in situ hybridization of wild-type (WT) P4brains for Cad8 expression showed that Cad8 is ex-pressed in a wedge-shaped area in the posterior cortex(Figure 1J). The Cad8 expression pattern has a similar tiltand orientation, with respect to the midline, to those ofvisual areas measured functionally in adult mice, sug-gesting that Cad8 is a marker of visual cortex. Two EphAreceptors, EphA7 and EphA4, have expression patternssimilar to those of Cad8 in the posterior cortex, but havea slight peak of expression within the Cad8-expressingarea (Figures 1B and 1C). This peak may represent theboundary between V1 and V2, but this cannot be verifiedwithout a V1- or V2-specific marker.
Ephrin-A5 exhibited an expression pattern comple-mentary to that of EphA4 and EphA7, being highest inthe region where receptor expression is lowest andvice-versa (Figure 1D and Figure S1). Ephrin-A5 was ex-pressed at highest levels lateral and medial to the Cad8expression areas and at low levels within it. Ephrin-A2and ephrin-A3 were expressed in the cortex at low levelsin a high medial to low lateral pattern (Figures 1E and 1F).Whole-mount treatment of WT P4 cortex with an EphA3-alkaline phosphatase (AP) fusion protein or an ephrin-A5-AP fusion protein that detects ephrin-As and EphAs,respectively (Flanagan et al., 2000) showed complemen-tary staining patterns throughout the cortex (Figures 1Kand 1L). Notably, ephrin-A expression was high in areassurrounding Cad8-expressing areas (Figures 1L and1M). These expression patterns are consistent with theidea that gradients of EphA/ephrin-A are used to map vi-sual TC projections in a manner similar to their use in themapping of the retinocollicular and retinogeniculate pro-jections (Brown et al., 2000; Hansen et al., 2004; Rashidet al., 2005). Ephrin-A2, -A3, and -A5 account for almostall of the ephrin-A expression in the cortex, as deter-mined by the lack of binding to EphA3-AP in corticalsections derived from mice deficient in ephrin-A2, -A3,and -A5 (ephrin-A TKO mice, Figure 1I).
Defective Maps of Cortical Retinotopy in Ephrin-A
TKO MiceTo determine the requirement for ephrin-As in corticalpatterning and topographic mapping, we comparedthe functional and anatomical innervation patterns ofV1 in WT mice with those in the ephrin-A TKOs. Using in-trinsic signal imaging (Kalatsky and Stryker, 2003), wedelineated detailed retinotopic maps of V1 in the adultmouse visual cortex. In this method, anesthetized mice
were stimulated by thin bars drifting continuously andperiodically across a video monitor 25 cm away. The op-tical signal of each pixel of the imaged cortical area wasextracted by Fourier analysis at the stimulus frequencyto obtain the values of response amplitude and phaserelative to the position of the drifting bar on the monitor.The phase value of each pixel was converted to degreesof visual angle and displayed according to a color scalecorresponding to the functional retinotopic map (Fig-ure 2). The bars drifted either vertically or horizontallyto obtain elevation and azimuth maps, respectively.
Examples of cortical retinotopic maps from WT andephrin-A TKOs are shown in Figure 2 and Figure S2. Al-though the gross polarity of the retinotopic map in V1was largely normal in the ephrin-A TKOs, the progres-sion of the receptive field (RF) position along the retino-topic maps was more scattered, and this defect was es-pecially severe for the azimuth map. To compare themaps quantitatively, we computed the ‘‘map scatter’’by calculating the differences between the phase valuesof the individual pixels within the visual area to those oftheir near neighbors (Figure 2E). For maps with highquality and strong visual response, these phase differ-ences should be quite small due to the smooth progres-sion. Indeed, for the WT elevation maps, the standarddeviation of the difference was only 1.1 6 0.1º (n = 12),while in ephrin-A TKOs the elevation maps had morethan twice the scatter (2.4 6 0.5º, n = 13), significantlydifferent from WT (p < 0.05). We analyzed the azimuthmaps similarly and found that they were more severelydefective in the ephrin-A TKOs (scatter of 16.3 6 1.9º[n = 13] compared to WT: 5.5 6 1.7º [n = 12]; p <0.001). The relatively large scatter in WT azimuth mapswas mainly due to the fact that the pixels included forthe analyses were chosen on the basis of their responsemagnitude in the elevation map (see Experimental Pro-cedures). We next calculated the cortical magnificationfactors, defined as degrees of visual space representedby unit length in the visual cortex (Figure 2F). The mag-nification factors of the ephrin-A TKOs were significantlygreater for both elevation (WT: 36.2 6 1.1º/mm [n = 12]versus TKO: 44.0 6 1.9º/mm [n = 13]; p < 0.01) and azi-muth (WT: 73.8 6 6.6º/mm [n = 12] versus TKO: 122.0 69.2º/mm [n = 13]; p < 0.001). Finally, we found that theorientation of the map of V1 was rotated in the ephrin-ATKOs (Figure 2G). In WT mice, the 0º isoelevation line(a line connecting the pixels that have the same phasevalue in elevation) had an angle of 32.4 6 3.4 deg(n = 12) in relation to the lambda suture, while that ofthe ephrin-A TKOs was 17.8 6 5.2 deg (n = 12; p < 0.05).
To confirm that the defect of cortical retinotopy in theephrin-A TKOs revealed by optical imaging resultedfrom poor RF organization of cortical cells, we carriedout multiunit recording using microelectrodes (Figure 3).We determined the response patterns of visual corticalneurons to horizontal or vertical bars sweeping acrossthe stimulus monitor. A typical response from record-ings of wild-type mice is shown in Figure 3A, wherethe sweeping bar evoked spiking responses when mov-ing in the RF. Although the majority of response patternsin ephrin-A TKOs were similar to those in WT, about 20%(n = 29/166 for azimuth) of recording sites, across alllayers of the cortex, displayed multiple, discontinuouspeaks of spike activity in response to the continuously

Neuron580
Figure 2. Abnormal Retinotopic Maps in the
Cortex of Ephrin-A TKOs
(A and B) Cortical elevation maps of a WT (A)
and an ephrin-A TKO mouse (B). The color
code used to represent positions of different
elevation lines on the stimulus monitor is
shown to the left of (A). (C and D) Azimuth
maps of the same WT (C) and ephrin-A TKO
mouse (D). The color code is shown to the
left. (E) Map scatters of cortical retinotopy.
Both elevation and azimuth maps of ephrin
TKOs were more scattered than the control
maps (*p < 0.05; ***p < 0.001). (F) Ephrin-A
TKOs have bigger cortical magnification fac-
tors for both elevation (**p < 0.01) and azi-
muth (***p < 0.001). (G) The orientation of V1
in relation to the lambda suture is altered in
the ephrin-A TKO (*p < 0.05). Error bars repre-
sent the mean 6 SEM.
moving bar (Figure 3A). To quantify the difference, wecalculated the extent of the visual space that elicited re-sponses for individual recording sites (Figures 2B and2C). For vertical bars moving horizontally (azimuth), asa result of the multiple peaks, the RF extent was signif-icantly greater in the ephrin-A TKOs (41.2 6 1.4º [n =166] compared to wild-type: 39.1 6 1.0º [n = 148]; p =0.02, Kolmogorov-Smirnov [K-S] test, Figure 3B). For
the elevation, although response patterns with multiplepeaks were also seen in the ephrin-A TKOs (data notshown), their RF extent was similar to that in WT mice(WT: 38.5 6 1.0º [n = 169]; TKO: 38.5 6 1.1º [n = 173];p = 0.29, Kolmogorov-Smirnov test, Figure 3C). To-gether with the findings of the optical imaging studies,these results demonstrate that the functional corticalretinotopy is defective in ephrin-A TKO mice and that the
Figure 3. Abnormal Cortical Response Pat-
terns in Ephrin-A TKOs
(A) Examples of cortical spiking responses to
a moving bar. The peristimulus time histo-
gram (PSTH) of a typical WT response is
shown in the upper panel. About 20% of re-
cording sites in ephrin-A TKOs displayed
multiple peaks in response to the moving
bar, and a representative example is shown
in the bottom panel.
(B and C) Cumulative probability plots of the
extent of the visual space that elicited re-
sponses for individual recording sites. For
azimuth (B), the receptive field (RF) extent
was significantly greater in the ephrin-A
TKO (p = 0.02, K-S test). For elevation (C),
the RF extent was similar between WT and
ephrin-A TKOs (p = 0.29, K-S test).

Ephrin-As Guide Visual Cortical Map Formation581
Figure 4. Abnormal Geniculocortical Projection Patterns in Ephrin-A TKOs
(A and B) Azimuth map (A) of an ephrin-A TKO and the vascular pattern (B) in the region of cortex imaged. The two dots on each panel indicate the
positions where the retrograde labeling marker CTBs were injected. In (B), the green and red dots mark the injection positions of the correspond-
ing color of CTB.
(C–E) Retrogradely labeled dLGN neurons in this ephrin-A TKO ([C] and [D] show two different coronal sections) and a WT control (E). Neurons
labeled by CTB-Alexa488 (green, left column), CTB-Alexa568 (red, middle column), and the overlay of the two (right column) are shown. In all of
the panels, dotted lines mark the border of the dLGN.
(F) Quantification of label dispersion in the dLGN. The distance within which 80% of the labeled pixels were found is plotted against the area
occupied by labeled pixels. Red dots, ephrin-A TKO, black dots, wild-type.
defect is especially severe along the axis of azimuth,consistent with the axis of graded Eph/ephrin expression.
Abnormal Visual Thalamocortical Projection
Patterns in Ephrin-A TKOBecause retinotopic mapping of the primary retinal pro-jections is abnormal in mice deficient for ephrin-As (Feld-heim et al., 2000, 1998; Frisen et al., 1998; Pfeiffenbergeret al., 2005), the defective retinotopic maps in the primaryvisual cortex of ephrin-A TKOs revealed by our functionalstudies could simply reflect a defective retinogeniculatemap. To determine directly whether the geniculocorticalprojections are disrupted in the ephrin-A TKOs, we ex-amined the geniculocortical map anatomically by inject-ing tracers into V1 to retrogradely label dLGN neurons.Following functional imaging (Figures 4A and 4B), theneuronal tracer cholera toxin subunit B (CTB) was in-jected at defined topographic locations within V1. For agiven cortex, two colors of CTBs were injected approxi-mately 500 mm apart. In WT mice, retrogradely labeleddLGN neurons of the same color were nicely clusteredand located in a topographic manner (Figure 4E). In con-trast, the ephrin-A TKOs displayed dramatically differentpatterns of labeling (Figures 4C and 4D). For many injec-tions, the labeled cells were dispersed over large areasof the dLGN (green labels in Figure 4), and for others,the labeled cells were more dispersed than those in thecontrols despite some level of clustering (red labels inFigure 4).
To quantify the differences between WT and ephrin-ATKOs, we measured the dispersion as the distance fromthe center of the labeling area within which 80% oflabeled pixels were found. As expected, in WT, a largerlabeled area correlated with greater dispersion (Figure4F). The dispersion of the ephrin-A TKOs (131.5 6 10.8mm, n = 10) was significantly greater than that of the WT(93.2 6 5.6 mm, n = 9; p < 0.01) and was not due to a largerlabeled area (Figure 4F). In conclusion, the orderly pat-tern of TC projections from the dLGN to the visual cortexis severely disrupted in mice deficient for ephrin -A2, -A3,and -A5.
Position Shift of the Visual Cortex in Ephrin-A TKOMice
As shown in Figure 2, the V1 map of ephrin-A TKOs wasrotated and compressed along the azimuthal axis. Usingthe same imaging method, we also found that the posi-tion of the visual cortex in the ephrin-A TKOs was shiftedmedially. We used the location of the 0º elevation line(corresponding to the midline of the stimulus monitor)at the V1/V2 border as the reference point to mark theposition of the primary visual area and measured its dis-tance to the midline and lambda suture. V1 was clearlyshifted medially in ephrin-A TKOs (Figures 5A–5C; frommidline suture, 2.8 6 0.08 mm [n = 9]; WT: 3.3 6 0.04mm [n = 5]; p < 0.01). This medial shift was not due toa reduction of brain size in the mutants because theWT and TKOs had similarly sized brains at the age of

Neuron582
Figure 5. Ephrin-A TKOs Have Medial-Lateral
Positioning Defects in Primary Visual Cortex
(A) Surface vasculature pattern of the imaged
cortical area of a WT mouse. The midline and
lambda sutures are indicated by the vertical
and horizontal white dotted lines, respec-
tively. (B) Elevation map of V1 from a WT
mouse, shown as a polar map in which color
encodes visual field position according to
the scale in Figure 2, and brightness repre-
sents the magnitude of the response. ‘‘+’’
marks the position of 0º elevation at the V1/
V2 border.
(C) Elevation map of an ephrin-A TKO. (D) The
distances from V1/V2 border to the midline
are plotted for the five genotypes: WT, TKO
(A235), and the three types of double KOs,
ephrin-A2/A5 (A25), ephrin-A3/5 (A35), and
ephrin-A2/A3 (A23). Only the triple KO is sig-
nificantly different from the WT (p < 0.01). (E)
The visual cortex position of the five geno-
types is similar along the anterior-posterior
axis of the cortex, measured as the distance
to the back of the brain (p > 0.05 for all com-
parisons). Error bars represent the mean 6
SEM.
imaging (Figure S3). Furthermore, the V1 positional shiftwas only observed in the ephrin-A2/A3/A5 TKOs and notin any of the ephrin-A double mutants (Figure 5D; ephrin-A2/A5 double mutant: 3.2 6 0.07 mm [n = 6]; ephrin-A2/A3: 3.2 6 0.13 mm [n = 2]; ephrin-A3/A5: 3.3 6 0.1 mm[n = 2]; p > 0.05 for all comparisons with WT), suggestinga great redundancy of the three ephrin-As in controllingcortical patterning. Finally, the positional shift was seenin the medial-lateral axis, but not along the anterior-posterior axis of the cortex (measured as the distanceto the lambda suture, p > 0.05 for all comparisons withWT) (Figure 5E). This medial shift defect is consistentwith the idea that the high ephrin-A expression lateraland medial to V1 acts to guide its location within theposterior cortex.
Effect of Ephrin-A5 Misexpression in the Developing
Visual CortexThe expression patterns in the dLGN and visual cortexsuggest that gradients of ephrin-As expressed in thecaudal cortex play a role in targeting visual TC projec-tions that express complementary gradients of EphAs.We therefore reasoned that disturbing the normalephrin-A expression pattern could lead to aberrant TCprojections and, hence, abnormal visual cortical organi-zation. To disturb ephrin-A patterns in the developingcortex, we ectopically expressed ephrin-A in limitedareas of one cerebral hemisphere by electroporatingcDNA in utero. A mixture of ephrin-A5 and GFP expres-sion plasmids was injected into the lateral ventricle ofthe left hemisphere at E13.5–E14.5, when neurons thatare destined to reside in layer 2/3 and 4 of the neocortexare born (Hashimoto and Mikoshiba, 2004). In pilot ex-periments, we compared the expression patterns ofGFP and ephrin-A5 in whole-mount brains at P1–P5 bydetecting the binding activity of the ephrin-A indicatorEphA3-AP. In general, the GFP-positive area overlappedwith patches of ectopic EphA3-AP binding sites, whilethe GFP-negative area showed no ectopic labelingwith EphA3-AP (data not shown). Although the GFP sig-
nal declined during development, its expression per-sisted in adult cortices (present observation; Tabataand Nakajima, 2001). Therefore, we used the GFP ex-pression pattern in adults as an indicator of the locationof ectopically expressed ephrin-A5 earlier in develop-ment. In mice that had had ephrin-A5 ectopically ex-pressed in the left hemisphere in utero, functional visualcortical maps were examined using intrinsic signal im-aging at P60–P90 followed by post hoc determinationof electroporation regions. Control animals in whichelectroporation was carried out with GFP alone were en-tirely normal regardless of where the GFP was ex-pressed (Figure 7B). Of 36 animals (eight litters) ana-lyzed following electroporation of ephrin-A5/GFP, 13showed strong GFP signals in the left caudal cortex(misexpression-positive, ME+, Figure 6D), whereasGFP expression was either undetectable or very weakin 23 animals (misexpression-negative, ME2). In 10 ofthe 13 ME+ animals, the GFP signal was present in thearea just lateral to the visual cortex, but was absentwithin the visual cortex itself. In these ten animals, V1of the electroporated left hemisphere was positionedmore medially than it was in the control V1 of the righthemisphere (Figures 6A–6C). The distance betweenthe V1/V2 border and midline was significantly shorterin the left (2.72 6 0.16 mm) than in the right (3.24 60.10 mm) hemisphere (p < 0.01, one-way ANOVA fol-lowed by Newman-Keuls test). No difference was de-tected in visual area position between hemispheres inME2 animals (left: 3.19 6 0.10 mm and right: 3.21 60.14 mm, p > 0.05). The size of ME+ hemispheres didnot significantly differ from that of ME2 hemispheres, in-dicating that the medial shift was not caused by a reduc-tion in size of the electroporated hemispheres. In con-trast to the altered V1 position, map quality in the ME+animals did not differ from that in ME2 animals; meanscatter indexes were 0.73 6 0.18º for elevation mapsand 1.33 6 0.30º for azimuth maps in ME2 animals(n = 10) and 0.60 6 0.27º for elevation maps and 1.18 60.31º for azimuth maps in ME+ animals (n = 7). Cortical

Ephrin-As Guide Visual Cortical Map Formation583
magnification factors in ME+ animals (29.3 6 5.2º/mmfor elevation and 75.8 6 5.7º/mm for azimuth [n = 10])were also comparable to those in ME2 animals (32.1 62.8º/mm for elevation and 68.7 6 6.2º/mm for azimuth[n = 7]).
In the remainder of these ME+ animals (n = 3), ephrin-A5/GFP expression was detected within V1 in additionto the lateral area (Figure 7A). In these animals, we foundthat the functional retinotopy was dramatically dis-rupted. Although the gross polarity of the retinotopicmap was preserved, progression of the visual space po-sition was abnormal, with more severe irregularity alongthe nasotemporal axis than in the dorsoventral axis. Todemonstrate abnormal retinotopy in detail, azimuthmaps in control and in experimental animals are shownin a color code that represents the azimuth lines onthe stimulus monitor with two cycles of colors (Figures7E–7J). Disruption of retinotopic structure was moreprominent in the area that showed higher levels of mis-expression: the rostral part of V1 in Figure 7G and therostral-lateral part of V1 in Figures 7H and 7I. In contrast,such disruption of retinotopy was never observed incontrol animals in which only GFP plasmid was electro-
Figure 6. Lateral Misexpression of Ephrin-A5 Shifts V1 Medially
(A–D) Misexpression of ephrin-A5 in caudal cortex just lateral to V1
caused V1 to shift medially. Medium-resolution retinotopic maps
in a ME2 animal (A) and a ME+ animal (B). Visually evoked responses
in both hemispheres were simultaneously imaged, and the position
of V1 was analyzed using the same method as that described in Fig-
ure 5. White crosses indicate the position of the V1/V2 border at 0º el-
evation. RIGHT, right hemisphere; LEFT, left hemisphere; MIDLINE,
the line corresponding to the sagittal suture. (C) Differences in the
V1/V2 border-midline distance between left and right hemispheres
of ME2 (n = 23) and ME+ animals (n = 10), *p < 0.001. (D) A coronal
section of the left hemisphere from the animal shown in (B), showing
an intense GFP signal in the dorsolateral cerebral wall. The section is
at approximately mid-V1 level in its rostrocaudal extent. The arrow-
head indicates the position of the DiI mark at the lateral margin of V1.
All scale bars, 1.0 mm. Error bars represent the mean 6 SEM.
porated (Figures 7B and 7E) or in which expression wasundetectable after ephrin-A5+GFP electroporation (Fig-ure 7F). We also observed disruption of V1 retinotopy inan animal in which ephrin-A2 was misexpressed withinV1 (Figure 7J). Although the exact mechanisms and sitesof action of misexpressed ephrin-A are yet to be investi-gated, these results demonstrate that the endogenouspattern of ephrin-A5 in the caudal cortex is critical forthe normal patterning of V1. In addition, they provide ev-idence of a cortical locus for the site of the two maindefects seen in the ephrin-A TKOs: defects in both theposition of V1 and in the order of the retinotopic mapwithin V1.
Discussion
During development, two levels of specificity areachieved for thalamocortical (TC) targeting. First, theTC axons have to reach the correct location of a corticalarea on the cortical plate. Second, within each corticalarea, TC axons must organize into an orderly map. Inthe present study, we have demonstrated that EphA/ephrin-A signaling in the cortex is required in both pro-cesses of visual TC targeting by disrupting one, theother, or both in different experiments. In mice deficientfor ephrin-A2, -A3, and -A5 (ephrin-A TKOs), the func-tional visual cortical maps are shifted medially, rotated,and compressed along the medial-lateral axis of the cor-tex. The orderly internal organization of these maps isalso severely disrupted, as shown by a combination ofintrinsic optical imaging, multiunit recording, and ana-tomical tracing methods. Positioning defects and differ-ent changes in internal topography are also seen in micein which ephrin-As have been ectopically expressed inthe developing cortex, indicating a causal role of corticalEphA/ephrin-A signaling in patterning TC axons. Withectopic expression in lateral cortex, positioning is al-tered, but internal topography is normal. With ectopicexpression within V1, position is normal, but internal to-pography is disrupted.
Control of the Visual Cortex Positionby Ephrin-A2, -A3, and -A5
Recent studies have revealed that cortical arealization isregulated by intrinsic factors including locally secretedsignaling molecules such as FGF8 (Fukuchi-Shimogoriand Grove, 2001, 2003; Garel et al., 2003) and severaltranscription factors such as Emx2, Pax6, and COUP-TF1 that show restricted or graded expression acrossthe cortex (Bishop et al., 2000, 2002; Hamasaki et al.,2004; Zhou et al., 2001). It is hypothesized that the activ-ities of these factors pattern the cortex and induce ex-pression of guidance molecules used for area-specificTC axon targeting. However, the molecular mechanismsand identities of molecules downstream of these intrinsicfactors are largely unknown (Grove and Fukuchi-Shimo-gori, 2003). Here, we show that ephrin-As expressed inthe cortex participate in the positioning of the visual cor-tex, providing compelling evidence that ephrin-As areone class of the effector molecules downstream fromthe transcription factors controlling arealization. Thisidea is consistent with the observations that alteringthe expression patterns of FGF8, Emx2, or Pax6 shift theexpression domain of ephrin-A5 in the cortex (Bishop

Neuron584
Figure 7. Misexpression of Ephrin-A5 within
V1 Disrupts Functional Retinotopy
(A and B) Coronal sections of the left caudal
cortex from animals that received electropo-
ration of ephrin-A5 and GFP (A) and GFP
only (B). The arrowhead in (A) and the dia-
mond in (B) indicate the position of the DiI
marker corresponding to their positions in
(C), (D), and (G) and in (E), respectively. GFP
expression extends medially to the DiI marker
indicating that the expression is present
within as well as lateral to V1. (C and D) Func-
tional elevation (C) and azimuth (D) maps in
the left cortex from the animal shown in (A).
The color codes representing positions on
the stimulus monitor are the same as those
in Figure 2. (E–J) Azimuth maps in control
(E and F) and experimental animals (G–J). In
(E)–(J), the visual field is represented by two
cycles of colors (bottom of [J]) instead of
a single cycle as shown in (B), to reveal the
retinotopic structure at higher resolution.
The control animal in (E) received electropo-
ration of GFP plasmid alone, the expression
of which is shown in (B). The diamond indi-
cates the DiI injection site. The other control
animal (F) had received GFP and ephrin-A5
plasmids by electroporation, but did not
show clear expression. (G) The same map
as in (D), except using the double color scale.
(H and I) Additional examples of disrupted
azimuth maps in animals that showed ephrin-
A5 misexpression within V1. Note that in both
of these maps, the lateral red isoazimuth con-
tour bifurcates rostrally (arrows) in the area
where ectopic ephrin-A5 expression was de-
tected. (J) An example of a disrupted azimuth
map in an animal in which ephrin-A2 was mis-
expressed within V1. All scale bars, 1.0 mm.
et al., 2002; Fukuchi-Shimogori and Grove, 2001; Shimo-gori and Grove, 2005).
The temporal and spatial expression patterns ofephrin-A2, -A3, and -A5 are consistent with their rolesin area-specific targeting of visual TC axons during de-velopment. TC axons in the rat arrive at the lower layersof the occipital cortex between E16 and E20 (Molnaret al., 1998). Visual TC axons are believed to invade up-ward to arrive at layer 4 perinatally, similar to somato-sensory TC axons (Agmon et al., 1995, 1993). Ephrin-Aligands are expressed both embryonically and perina-tally in multiple areas of the brain that are implicated inthe mapping of visual TC axons. These areas include thedLGN (Feldheim et al., 1998; Pfeiffenberger et al., 2005),the ventral telencephalon (Dufour et al., 2003), and theposterior cortex (Donoghue and Rakic, 1999a, 1999b;Mackarehtschian et al., 1999; Sestan et al., 2001; Yunet al., 2003). Thus, altered TC axon targeting that we ob-served in ephrin-A TKOs could result from the lack ofephrin-As at the cortical or subcortical level. To addressthis question, we examined the effects of misexpressingephrin-A5 only in the cortex. We found that expressionof ephrin-A5 in the posterior-lateral cortex shifted V1medially, indicating that the cortex is a site of EphA/ephrin-A function in visual area positioning along themedial-lateral axis.
Recent results by Vanderhaeghen and colleagues in-dicate that ephrin-As expressed in a gradient within
the ventral telencephalon act as an intermediate targetfor TC axons to guide TC axons to their proper anterior-posterior position in the cortex based on their EphAreceptor expression (Dufour et al., 2003). For example,in the EphA4/ephrin-A5 double knockout mice, the so-matosensory cortex receives aberrant projections fromthe motor thalamic nucleus (Dufour et al., 2003). Inter-estingly, although these mice have defects in patterningmotor and somatosensory cortex, there is no defect inthe patterning of V1 (P. Vanderhaeghen, personal com-munication), suggesting an important difference in themechanism of regionalization of anterior (somatosen-sory/motor) and posterior (visual) cortex.
How might one explain the V1 position shift in ephrin-ATKOs? In wild-type cortex, ephrin-As are expressed inhigh levels laterally and medially to Cad8, a homophilicadhesion molecule used as a marker for visual cortex(Figure 1 and Figure S1). We propose that high levels ofephrin-A-repellent activity adjacent to VC acts as an‘‘electric fence’’ for dLGN axons and thus is partly re-sponsible for the characteristic shape and location ofthe VC. This is similar to the role proposed for the highephrin-A5 levels in the inferior colliculus—preventingRGC axons from leaving the SC (Frisen et al., 1998, andFigure 8A). One model that could explain the medial shiftof V1 in ephrin-A TKOs uses a combination of attractiveforces provided by Cad8 homophilic adhesion, creatinga permissive zone for geniculate input, with the repulsive
Ephrin-As Guide Visual Cortical Map Formation585
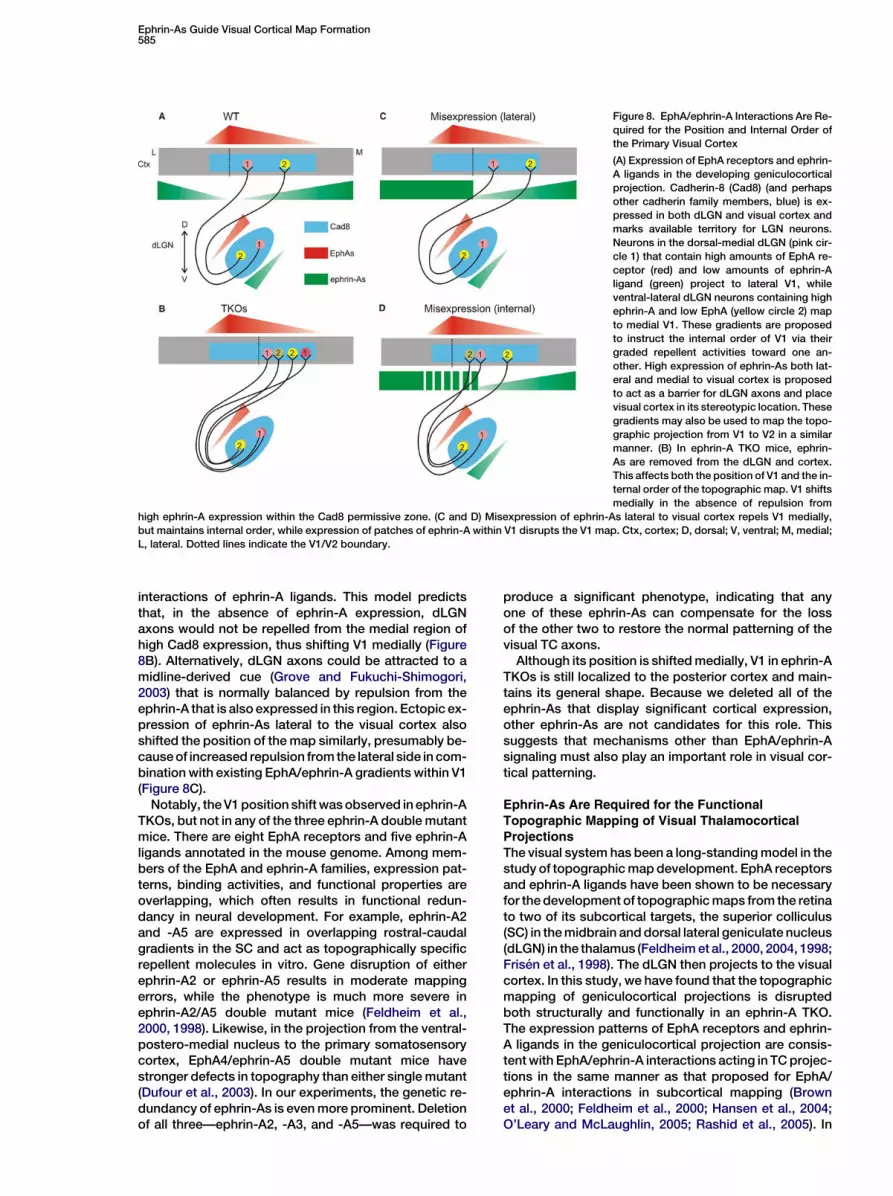
Figure 8. EphA/ephrin-A Interactions Are Re-
quired for the Position and Internal Order of
the Primary Visual Cortex
(A) Expression of EphA receptors and ephrin-
A ligands in the developing geniculocortical
projection. Cadherin-8 (Cad8) (and perhaps
other cadherin family members, blue) is ex-
pressed in both dLGN and visual cortex and
marks available territory for LGN neurons.
Neurons in the dorsal-medial dLGN (pink cir-
cle 1) that contain high amounts of EphA re-
ceptor (red) and low amounts of ephrin-A
ligand (green) project to lateral V1, while
ventral-lateral dLGN neurons containing high
ephrin-A and low EphA (yellow circle 2) map
to medial V1. These gradients are proposed
to instruct the internal order of V1 via their
graded repellent activities toward one an-
other. High expression of ephrin-As both lat-
eral and medial to visual cortex is proposed
to act as a barrier for dLGN axons and place
visual cortex in its stereotypic location. These
gradients may also be used to map the topo-
graphic projection from V1 to V2 in a similar
manner. (B) In ephrin-A TKO mice, ephrin-
As are removed from the dLGN and cortex.
This affects both the position of V1 and the in-
ternal order of the topographic map. V1 shifts
medially in the absence of repulsion from
high ephrin-A expression within the Cad8 permissive zone. (C and D) Misexpression of ephrin-As lateral to visual cortex repels V1 medially,
but maintains internal order, while expression of patches of ephrin-A within V1 disrupts the V1 map. Ctx, cortex; D, dorsal; V, ventral; M, medial;
L, lateral. Dotted lines indicate the V1/V2 boundary.
interactions of ephrin-A ligands. This model predictsthat, in the absence of ephrin-A expression, dLGNaxons would not be repelled from the medial region ofhigh Cad8 expression, thus shifting V1 medially (Figure8B). Alternatively, dLGN axons could be attracted to amidline-derived cue (Grove and Fukuchi-Shimogori,2003) that is normally balanced by repulsion from theephrin-A that is also expressed in this region. Ectopic ex-pression of ephrin-As lateral to the visual cortex alsoshifted the position of the map similarly, presumably be-cause of increased repulsion from the lateral side in com-bination with existing EphA/ephrin-A gradients within V1(Figure 8C).
Notably, the V1 position shift was observed in ephrin-ATKOs, but not in any of the three ephrin-A double mutantmice. There are eight EphA receptors and five ephrin-Aligands annotated in the mouse genome. Among mem-bers of the EphA and ephrin-A families, expression pat-terns, binding activities, and functional properties areoverlapping, which often results in functional redun-dancy in neural development. For example, ephrin-A2and -A5 are expressed in overlapping rostral-caudalgradients in the SC and act as topographically specificrepellent molecules in vitro. Gene disruption of eitherephrin-A2 or ephrin-A5 results in moderate mappingerrors, while the phenotype is much more severe inephrin-A2/A5 double mutant mice (Feldheim et al.,2000, 1998). Likewise, in the projection from the ventral-postero-medial nucleus to the primary somatosensorycortex, EphA4/ephrin-A5 double mutant mice havestronger defects in topography than either single mutant(Dufour et al., 2003). In our experiments, the genetic re-dundancy of ephrin-As is even more prominent. Deletionof all three—ephrin-A2, -A3, and -A5—was required to
produce a significant phenotype, indicating that anyone of these ephrin-As can compensate for the lossof the other two to restore the normal patterning of thevisual TC axons.
Although its position is shifted medially, V1 in ephrin-ATKOs is still localized to the posterior cortex and main-tains its general shape. Because we deleted all of theephrin-As that display significant cortical expression,other ephrin-As are not candidates for this role. Thissuggests that mechanisms other than EphA/ephrin-Asignaling must also play an important role in visual cor-tical patterning.
Ephrin-As Are Required for the Functional
Topographic Mapping of Visual ThalamocorticalProjections
The visual system has been a long-standing model in thestudy of topographic map development. EphA receptorsand ephrin-A ligands have been shown to be necessaryfor the development of topographic maps from the retinato two of its subcortical targets, the superior colliculus(SC) in the midbrain and dorsal lateral geniculate nucleus(dLGN) in the thalamus (Feldheim et al., 2000, 2004, 1998;Frisen et al., 1998). The dLGN then projects to the visualcortex. In this study, we have found that the topographicmapping of geniculocortical projections is disruptedboth structurally and functionally in an ephrin-A TKO.The expression patterns of EphA receptors and ephrin-A ligands in the geniculocortical projection are consis-tent with EphA/ephrin-A interactions acting in TC projec-tions in the same manner as that proposed for EphA/ephrin-A interactions in subcortical mapping (Brownet al., 2000; Feldheim et al., 2000; Hansen et al., 2004;O’Leary and McLaughlin, 2005; Rashid et al., 2005). In

Neuron586
the cases in which we successfully misexpressedephrin-A ligand within the developing visual cortex, thefunctional topographic maps were defective, consistentwith ephrin-A ligands acting as molecular labels in thecortex (Figure 8D). Together, these experiments suggestthat the same mapping mechanisms are used at subcor-tical and cortical stages, acting in each projection andtarget area to maintain the topographic order of visual in-formation as it is transferred to the next stage.
In our analysis of visual maps of ephrin-A TKOs, wewere surprised to see that the topographic map ob-tained by functional imaging appeared more nearly nor-mal than one would expect based on the topographyseen from anatomical tracing. One interpretation ofthis result is that our method of functional imaging isnot sensitive enough to detect functional defects of ret-inotopic maps. We employed Fourier analysis to calcu-late the phase of cortical optical signals in relation tothe visual stimulus (Kalatsky and Stryker, 2003), whichessentially looks at the timing of the maximum responseof the population of V1 neurons at each point on the cor-tex. Consequently, the optical map may still appear nor-mal even if the TC projections from the dLGN are aber-rantly widespread so long as they are on average inthe normal position. We addressed this concern by per-forming multiunit recordings from V1 neurons in ephrin-ATKOs. While 20% of the recording sites had multiple fociof response to different positions in the visual field, asexpected from anatomical tracing studies, we foundthat 80% of sites had relatively normal visual field re-sponses. It is thus possible that dLGN axons from topo-graphically incorrect regions (or synapses in topograph-ically incorrect places) are not as efficient at drivingpostsynaptic neurons to fire action potentials. In otherwords, these aberrant axons may not retain strong func-tional synapses with cortical neurons. This could resultfrom a Hebbian process of synapse strengthening orweakening as proposed in activity-dependent mappingmodels. Such a refinement process could be driven bypatterned retinal activity, either evoked or spontaneous(Wong, 1999).
Functional Imaging in the Study of Cortical
Development
In the present study, we used a combination of functionaland anatomical techniques to analyze the position andtopography of the primary visual cortex in both knock-out and manipulated mice. The power of our imagingmethod for studying cortical patterning is clearly demon-strated in these experiments. This method of intrinsicsignal imaging using Fourier analysis (Kalatsky andStryker, 2003) allows for rapid, noninvasive delineationof detailed retinotopic maps of visual areas in the visualcortex from mice older than three weeks of age. Com-bined with mouse genetics, this imaging method is auseful technique to study the factors responsible forcontrolling cortical development. In the present study,the defect of visual cortex positioning and changes ofinternal topography were readily detected in ephrin-ATKOs. Intrinsic signal imaging is also easily combinedwith conventional methods of anatomical tracing andphysiological recordings to permit targeted and repro-ducible labeling and recording, as evident in the experi-ments of the present study.
ConclusionsThese experiments demonstrate that EphA/ephrin-A in-teractions in the developing cortex affect both the posi-tion and internal organization of V1, a cortical visual area.These results demonstrate that, in addition to their rolesin rostral-caudal patterning, EphA/ephrin-A interactionsparticipate in thalamocortical targeting along the medial-lateral axis of the cortical plate. As the same mappingmechanisms are used in both subcortical and thalamo-cortical mapping in the visual system, it would be intrigu-ing to test the roles of EphA/ephrin-A in mapping projec-tions from the primary visual area to higher visual areas.
Experimental Procedures
Animals
Ephrin-A2/A3/A5 triply mutant mice (Pfeiffenberger et al., 2005) were
generated from crossing of each single mutant (Cutforth et al., 2003;
Feldheim et al., 2000; Frisen et al., 1998). Triple mutants can be via-
ble and fertile, although a significant percentage (20%–30%) dies as
embryos. The animals were maintained in the animal facilities at the
University of California Santa Cruz (UCSC) or the University of Cali-
fornia San Francisco (UCSF) and used in accordance with protocols
approved by the UCSC and UCSF Institutional Animal Care and Use
Committee.
In Situ RNA Hybridization
Complementary DNAs for ephrin-A5 (containing nucleotides 102–
682 of the open reading frame (ORF), ephrin-A2 (containing nucleo-
tides 112–636 of the ORF), ephrin-A3 (containing nucleotides 100–
687 of the ORF), EphA7 (containing nucleotides 721–1193 of the
ORF), EphA4 containing nucleotides 402–786 of the ORF), and
Cad8 (containing nucleotides 241–1481 of the ORF) were used to
make antisense and sense digoxigenin-labeled RNA probes. Frozen
section and whole-mount in situ hybridization was done as previ-
ously described (Feldheim et al., 1998); proteinase K treatments
were 1 mg/ml for 1 min for the sections and 10 mg/ml for 1 hr for
the P4 whole mounts. Stained sections and whole brains were pho-
tographed using a Coolpix digital camera (Nikon) mounted onto
a dissecting microscope.
Affinity Probe In Situ
EphA3-AP and ephrin-A5-AP in situ was done as described (Feld-
heim et al., 1998). For EphA3-AP, brains were dissected from neona-
tal pups and rapidly embedded in 5% agarose in PBS. 250 mm coro-
nal sections were cut using a vibratome, and those containing visual
cortex were treated with EphA3-AP as floating sections. For ephrin-
A5-AP staining, brains were dissected from neonatal pups, mounted
in freezing medium, and cut as 25 mm frozen sections onto superfrost
slides. Sections were fixed in 30% methanol for 30 s and treated with
probe as above. Stained sections were photographed using a Cool-
pix digital camera (Nikon) mounted onto a dissecting microscope.
Functional Imaging and Analysis of Retinotopic Maps
To image maps of retinotopy in the mouse visual cortex, we followed
the method developed by Kalatsky and Stryker (2003). The detailed
description of surgical and imaging procedures can be found in the
Supplemental Experimental Procedures. In brief, adult mice were
anesthetized with urethane (1.0 g/kg in 10% saline solution). Optical
images of cortical intrinsic signal were obtained at the wavelength of
610 nm, using a Dalsa 1M30 CCD camera (Dalsa, Waterloo, Canada)
controlled by custom software. A high refresh rate monitor (Nokia
Multigraph 4453, 1024 3 768 pixels at 120 Hz) was placed 25 cm
away from the animal. Drifting thin bars (2º width and full-screen
length) were generated by a Matrox G450 board (Matrox Graphics,
Inc., Quebec, Canada) and displayed on the monitor. Animals were
presented with thin bars drifting in the axis of dorsal-ventral or
nasal-temporal in order to stimulate the constant lines of elevation
or azimuth, respectively. By extracting the optical signal at the stim-
ulus frequency, we computed the response magnitudes and timing
in reference to the stimulus cycle, which can then be converted to
the location of visual field. The absolute phase maps were then

Ephrin-As Guide Visual Cortical Map Formation587
calculated by the method of ‘‘phase reversal’’ (Kalatsky and Stryker,
2003). A 0º phase indicates the midline of the monitor, both horizon-
tally and vertically.
To assess map quality, we analyzed the phase scatter of the reti-
notopic maps. Specifically, we used the elevation map to select the
response area, because the azimuth maps of the mutant mice were
weak and more defective. The 20,000 pixels (1.60 mm2 of cortical
space) that had the greatest response magnitude in the elevation
maps were selected. For each of these pixels, we calculated the dif-
ference between its phase value and the mean phase value of its sur-
rounding 25 pixels. For maps of high quality, the phase differences
are quite small due to smooth phase progression. The standard de-
viation of the phase difference was then used as an index of map
quality.
To determine the magnification factor of elevation maps, we drew
a straight line across the map in the middle of V1. Special care was
taken to have the line approximately follow the steepest phase pro-
gression along the map. We then calculated the cortical distance be-
tween the two points along the line that have an elevation phase of
220º and 20º, respectively. The magnification factor, in deg/mm, is
then the ratio of phase difference (40º in this case) and cortical dis-
tance. The magnification factor of the azimuth map is similarly calcu-
lated with the following modifications. First, the line was 0º isoele-
vation contour from the elevation map in the same animal in order
to reduce subjectivity. Second, the ratio was calculated between
the points of 230º and 30º, because the stimulus monitor’s width
is greater than its height.
To measure the position of the left visual cortex, we first calculated
the 0º isoelevation line from the elevation maps and then determined
the V1/V2 border along the contour line by finding the point at which
the phase from the corresponding azimuth is minimal—used as the
reference point marking the position of primary visual area—and we
then measured its distance from the midline suture and the lambda
suture. Finally, the orientation of V1 was determined by calculating
the angle between 0º isoelevation line and the lambda suture.
Multiunit Recording of Cortical Neurons and Analysis of
Receptive Fields
Guided by the optical maps, we recorded multiunit spikes from V1
with tungsten microelectrodes (10 MU; Frederick Haer Company,
Bowdoinham, ME). For each animal, three to six penetrations were
made perpendicular to the pial surface across V1, and three to seven
sites (>50 mm apart) were recorded in each penetration. The spikes
were acquired using a System 3 workstation (Tucker Davis Technol-
ogies, FL) and analyzed using Matlab (The Mathworks, MA). Single
drifting bars 5º wide and 80º long at the speed of 25º/sec were
used to drive cortical cells. In each trial, the drifting bar was pre-
sented in four directions—rightward, leftward, upward, and down-
ward—in a random sequence. Twenty to thirty of such trials were re-
peated to construct a peristimulus time histogram (PSTH) for each
stimulus direction, using 5 ms bins. The PSTH was subsequently
smoothed using a 10 ms window. The mean rate (Rb) and standard
deviation (Stdb) of the background firing activity were calculated
from the period of PSTH when no stimulus was presented. A thresh-
old was calculated as Rb + 3 * Stdb, and the interval between the first
and last bins in the PSTH above the threshold was converted to the
extent of the visual space that elicited responses for individual re-
cording sites.
Retrograde Labeling of Thalamocortical Projections and Image
Analysis
Cholera toxin subunit B (CTB) conjugated to Alexa Fluor (Molecular
Probes, OR), CTB-488 (green), and CTB-594 (red) was injected into
the cortex guided by the retinotopic maps in order to retrogradely
label dLGN neurons. A small amount of 2 mg/ml solution of each
CTB in PBS was injected by Nanoject (Drummond Scientific Com-
pany, PA) using a glass pipette with a 20–30 mm tip opening. The
Nanoject was set to inject 32.2 nl of the dye, but small variations
of injection volume were unavoidable. Mice were sacrificed and in-
tracardially perfused with 4% paraformaldehyde in PBS 48 hr later.
The brains were fixed overnight before they were sectioned at 100
mm coronally using a vibratome (Lancer, MO). Images of the dLGN
and injection sites in the cortex were captured with a confocal mi-
croscope (Biorad MRC 1024, CA).
To analyze the patterns of retrogradely labeled cells in the dLGN,
we first calculated the background signal as the mean signal of an
area within the dLGN where no labeled cells were seen. The image
was then thresholded separately for each color at the level of 1.5
times the background. (A wide range of threshold from 1.2 to 1.8
was tested and similar results were obtained.) We then calculated
the position of the center of mass for all of the labeled pixels within
the dLGN. The percentage of labeled pixels within the dLGN as
a function of the distance from the center was then computed. The
above procedure was repeated for all of the sections of the dLGN ex-
cluding those sections at the rostral and caudal ends (six to seven
100 mm sections per animal), and the resulting curves were aver-
aged. To quantify the differences between WT and TKOs, we used
the distance within which 80% of the labeled pixels were found to
represent the degree of the dispersion. Finally, we calculated the
mean area occupied by labeled pixels in all sections of each animal.
Ectopic Expression by In Utero Electroporation
Complementary DNA encoding mouse ephrin-A5 (Feldheim et al.,
1998) and EGFP (BD Biosciences-Clontech, Mountain View, CA)
were inserted into the expression vector pEF1/Myc-His C (Invitrogen)
that allows expression driven from the human elongation factor 1a
promoter enhancer. In utero electroporation was performed as pre-
viously described (Saito and Nakatsuji, 2001) with modifications.
Timed pregnant WT C57/BL6 mice at E13.5–E14.5 were anesthetized
with intraperitoneal injection of ketamine (80 mg/kg) and xylazine
(5 mg/kg) supplemented with inhalation of isoflurane 1%–1.5% in ox-
ygen. After laparotomy, embryos were visualized through the uterus
with a fiber optic light source. A mixture of ephrin-A5 plasmid (1.0 mg/
ml), EGFP plasmid (0.5 mg/ml), and 0.1% Fast Green was injected
into the left lateral ventricle of each embryo through a glass capillary
(Drummond Scientific, Broomall, PA). The head of the embryo was
placed between a pair of rectangular (3 3 5 mm) paddle-style elec-
trodes, and a series of five square-wave current pulses (40–50 V,
50 ms duration, at an interval of 950 ms) was delivered by a pulse gen-
erator (ECM830; BTX, San Diego, CA). The electrodes were posi-
tioned to aim for gene transfection in the dorsolateral wall of the
left hemisphere. The surgical incision in the mother was closed, and
embryos were allowed to develop in utero followed by natural (vagi-
nal) delivery, after which pups were allowed to grow into adulthood.
At P60–P90, functional maps in the visual cortex were obtained,
using intrinsic signal imaging as described above. The V1 position
was determined on images acquired simultaneously from both
hemispheres. Retinotopic maps of the left visual cortex were exam-
ined further in detail by acquiring high-resolution maps. After func-
tional mapping, the visual cortex was marked with DiI at several
points using a tungsten microelectrode, and the animal was imme-
diately perfused with 4% formaldehyde in 0.1 M phosphate buffer.
The brain was dissected out, postfixed in 4% paraformaldehyde
overnight at 4ºC, and cut coronally using a vibratome. EGFP expres-
sion and DiI markings were examined using a confocal microscope
(MRC1024; Bio-Rad, CA).
Data Analysis
The statistical test used was the Student’s t test, and results were
expressed as the mean 6 SEM, unless otherwise indicated.
Supplemental Data
Supplemental Data include three figures and Supplemental Experi-
mental Procedures and are available with this article online at
http://www.neuron.org/cgi/content/full/48/4/577/DC1/.
Acknowledgments
The work was supported by U.S. National Institutes of Health (N.I.H.)
grants EY014689 (D.A.F.) and EY02874 (M.P.S.). J.C. is an Aventis
Pharmaceuticals Fellow of the Life Sciences Research Foundation.
We thank Ann Schreiber, for help with brain sectioning; Hema Vai-
dyanathan, Cory Pfeiffenberger, Ben Stafford, and Pierre Vander-
haeghen, for critical reading of the manuscript; and Andrew Huber-
man and members of the Feldheim and Stryker labs, for thoughtful
discussion.

Neuron588
Received: August 18, 2005
Revised: October 15, 2005
Accepted: October 28, 2005
Published: November 22, 2005
References
Agmon, A., Yang, L.T., O’Dowd, D.K., and Jones, E.G. (1993). Orga-
nized growth of thalamocortical axons from the deep tier of termina-
tions into layer IV of developing mouse barrel cortex. J. Neurosci. 13,
5365–5382.
Agmon, A., Yang, L.T., Jones, E.G., and O’Dowd, D.K. (1995). Topo-
logical precision in the thalamic projection to neonatal mouse barrel
cortex. J. Neurosci. 15, 549–561.
Bishop, K.M., Goudreau, G., and O’Leary, D.D. (2000). Regulation of
area identity in the mammalian neocortex by Emx2 and Pax6. Sci-
ence 288, 344–349.
Bishop, K.M., Rubenstein, J.L., and O’Leary, D.D. (2002). Distinct ac-
tions of Emx1, Emx2, and Pax6 in regulating the specification of
areas in the developing neocortex. J. Neurosci. 22, 7627–7638.
Bolz, J., Uziel, D., Muhlfriedel, S., Gullmar, A., Peuckert, C., Zarbalis,
K., Wurst, W., Torii, M., and Levitt, P. (2004). Multiple roles of ephrins
during the formation of thalamocortical projections: maps and more.
J. Neurobiol. 59, 82–94.
Brown, A., Yates, P.A., Burrola, P., Ortuno, D., Vaidya, A., Jessell,
T.M., Pfaff, S.L., O’Leary, D.D.M., and Lemke, G. (2000). Topo-
graphic mapping from the retina to the midbrain is controlled by
relative but not absolute levels of EphA receptor signaling. Cell
102, 77–88.
Cutforth, T., Moring, L., Mendelsohn, M., Nemes, A., Shah, N.M.,
Kim, M.M., Frisen, J., and Axel, R. (2003). Axonal ephrin-As and
odorant receptors: coordinate determination of the olfactory sen-
sory map. Cell 114, 311–322.
Donoghue, M.J., and Rakic, P. (1999a). Molecular evidence for the
early specification of presumptive functional domains in the embry-
onic primate cerebral cortex. J. Neurosci. 19, 5967–5979.
Donoghue, M.J., and Rakic, P. (1999b). Molecular gradients and
compartments in the embryonic primate cerebral cortex. Cereb.
Cortex 9, 586–600.
Dufour, A., Seibt, J., Passante, L., Depaepe, V., Ciossek, T., Frisen,
J., Kullander, K., Flanagan, J.G., Polleux, F., and Vanderhaeghen,
P. (2003). Area specificity and topography of thalamocortical projec-
tions are controlled by ephrin/Eph genes. Neuron 39, 453–465.
Feldheim, D.A., Vanderhaeghen, P., Hansen, M.J., Frisen, J., Lu, Q.,
Barbacid, M., and Flanagan, J.G. (1998). Topographic guidance la-
bels in a sensory projection to the forebrain. Neuron 21, 1303–1313.
Feldheim, D.A., Kim, Y.I., Bergemann, A.D., Frisen, J., Barbacid, M.,
and Flanagan, J.G. (2000). Genetic analysis of ephrin-A2 and ephrin-
A5 shows their requirement in multiple aspects of retinocollicular
mapping. Neuron 25, 563–574.
Feldheim, D.A., Nakamoto, M., Osterfield, M., Gale, N.W., DeChiara,
T.M., Rohatgi, R., Yancopoulos, G.D., and Flanagan, J.G. (2004).
Loss-of-function analysis of EphA receptors in retinotectal mapping.
J. Neurosci. 24, 2542–2550.
Flanagan, J.G., and Vanderhaeghen, P. (1998). The ephrins and Eph
receptors in neural development. Annu. Rev. Neurosci. 21, 309–345.
Flanagan, J.G., Cheng, H.J., Feldheim, D.A., Lu, Q., Hattori, M., and
Vanderhaeghen, P. (2000). Alkaline phosphatase fusions of ligands
or receptors as in situ probes for staining of cells, tissues, and
embryos. Methods Enzymol. 327, 19–35.
Frisen, J., Yates, P.A., McLaughlin, T., Friedman, G.C., O’Leary,
D.D.M., and Barbacid, M. (1998). Ephrin-A5 (AL-1/RAGS) is essential
for proper retinal axon guidance and topographic mapping in the
mammalian visual system. Neuron 20, 235–243.
Fukuchi-Shimogori, T., and Grove, E.A. (2001). Neocortex patterning
by the secreted signaling molecule FGF8. Science 294, 1071–1074.
Fukuchi-Shimogori, T., and Grove, E.A. (2003). Emx2 patterns the
neocortex by regulating FGF positional signaling. Nat. Neurosci. 6,
825–831.
Gao, P.P., Yue, Y., Zhang, J.H., Cerretti, D.P., Levitt, P., and Zhou, R.
(1998). Regulation of thalamic neurite outgrowth by the Eph ligand
ephrin-A5: implications in the development of thalamocortical pro-
jections. Proc. Natl. Acad. Sci. USA 95, 5329–5334.
Garel, S., and Rubenstein, J.L. (2004). Intermediate targets in forma-
tion of topographic projections: inputs from the thalamocortical sys-
tem. Trends Neurosci. 27, 533–539.
Garel, S., Huffman, K.J., and Rubenstein, J.L. (2003). Molecular
regionalization of the neocortex is disrupted in Fgf8 hypomorphic
mutants. Development 130, 1903–1914.
Grove, E.A., and Fukuchi-Shimogori, T. (2003). Generating the cere-
bral cortical area map. Annu. Rev. Neurosci. 26, 355–380.
Hamasaki, T., Leingartner, A., Ringstedt, T., and O’Leary, D.D.
(2004). EMX2 regulates sizes and positioning of the primary sensory
and motor areas in neocortex by direct specification of cortical pro-
genitors. Neuron 43, 359–372.
Hansen, M.J., Dallal, G.E., and Flanagan, J.G. (2004). Retinal axon
response to ephrin-as shows a graded, concentration-dependent
transition from growth promotion to inhibition. Neuron 42, 717–730.
Hashimoto, M., and Mikoshiba, K. (2004). Neuronal birthdate-
specific gene transfer with adenoviral vectors. J. Neurosci. 24,
286–296.
Kalatsky, V.A., and Stryker, M.P. (2003). New paradigm for optical
imaging: temporally encoded maps of intrinsic signal. Neuron 38,
529–545.
Lopez-Bendito, G., and Molnar, Z. (2003). Thalamocortical develop-
ment: how are we going to get there? Nat. Rev. Neurosci. 4, 276–289.
Mackarehtschian, K., Lau, C.K., Caras, I., and McConnell, S.K.
(1999). Regional differences in the developing cerebral cortex re-
vealed by ephrin-A5 expression. Cereb. Cortex 9, 601–610.
McLaughlin, T., Hindges, R., and O’Leary, D.D. (2003). Regulation of
axial patterning of the retina and its topographic mapping in the
brain. Curr. Opin. Neurobiol. 13, 57–69.
Molnar, Z., Adams, R., and Blakemore, C. (1998). Mechanisms un-
derlying the early establishment of thalamocortical connections in
the rat. J. Neurosci. 18, 5723–5745.
O’Leary, D.D. (1989). Do cortical areas emerge from a protocortex?
Trends Neurosci. 12, 400–406.
O’Leary, D.D., and McLaughlin, T. (2005). Mechanisms of retinotopic
map development: Ephs, ephrins, and spontaneous correlated reti-
nal activity. Prog. Brain Res. 147, 43–65.
Pfeiffenberger, C., Cutforth, T., Woods, G., Yamada, J., Renteria,
R.C., Copenhagen, D.R., Flanagan, J.G., and Feldheim, D.A.
(2005). Ephrin-As and neural activity are required for eye-specific
patterning during retinogeniculate mapping. Nat. Neurosci. 8,
1022–1027.
Prakash, N., Vanderhaeghen, P., Cohen-Cory, S., Frisen, J., Flana-
gan, J.G., and Frostig, R.D. (2000). Malformation of the functional
organization of somatosensory cortex in adult ephrin-A5 knock-
out mice revealed by in vivo functional imaging. J. Neurosci. 20,
5841–5847.
Rakic, P. (1988). Specification of cerebral cortical areas. Science
241, 170–176.
Rashid, T., Upton, A.L., Blentic, A., Ciossek, T., Knoll, B., Thompson,
I.D., and Drescher, U. (2005). Opposing gradients of Ephrin-As and
EphA7 in the superior colliculus are essential for topographic map-
ping in the mammalian visual system. Neuron 47, 57–69.
Saito, T., and Nakatsuji, N. (2001). Efficient gene transfer into the
embryonic mouse brain using in vivo electroporation. Dev. Biol.
240, 237–246.
Sestan, N., Rakic, P., and Donoghue, M.J. (2001). Independent par-
cellation of the embryonic visual cortex and thalamus revealed by
combinatorial Eph/ephrin gene expression. Curr. Biol. 11, 39–43.
Shimogori, T., and Grove, E.A. (2005). Fibroblast growth factor 8 reg-
ulates neocortical guidance of area-specific thalamic innervation.
J. Neurosci. 25, 6550–6560.
Sur, M., and Leamey, C.A. (2001). Development and plasticity of cor-
tical areas and networks. Nat. Rev. Neurosci. 2, 251–262.

Ephrin-As Guide Visual Cortical Map Formation589
Suzuki, S.C., Inoue, T., Kimura, Y., Tanaka, T., and Takeichi, M.
(1997). Neuronal circuits are subdivided by differential expression
of type-II classic cadherins in postnatal mouse brains. Mol. Cell.
Neurosci. 9, 433–447.
Tabata, H., and Nakajima, K. (2001). Efficient in utero gene transfer
system to the developing mouse brain using electroporation: visual-
ization of neuronal migration in the developing cortex. Neuroscience
103, 865–872.
Uziel, D., Muhlfriedel, S., Zarbalis, K., Wurst, W., Levitt, P., and Bolz,
J. (2002). Miswiring of limbic thalamocortical projections in the ab-
sence of ephrin-A5. J. Neurosci. 22, 9352–9357.
Vanderhaeghen, P., and Polleux, F. (2004). Developmental mecha-
nisms patterning thalamocortical projections: intrinsic, extrinsic
and in between. Trends Neurosci. 27, 384–391.
Vanderhaeghen, P., Lu, Q., Prakash, N., Frisen, J., Walsh, C.A., Fros-
tig, R.D., and Flanagan, J.G. (2000). A mapping label required for
normal scale of body representation in the cortex. Nat. Neurosci.
3, 358–365.
Wilkinson, D.G. (2001). Multiple roles of EPH receptors and ephrins
in neural development. Nat. Rev. Neurosci. 2, 155–164.
Wong, R.O. (1999). Retinal waves and visual system development.
Annu. Rev. Neurosci. 22, 29–47.
Yun, M.E., Johnson, R.R., Antic, A., and Donoghue, M.J. (2003).
EphA family gene expression in the developing mouse neocortex:
regional patterns reveal intrinsic programs and extrinsic influence.
J. Comp. Neurol. 456, 203–216.
Zhou, C., Tsai, S.Y., and Tsai, M.J. (2001). COUP-TFI: an intrinsic fac-
tor for early regionalization of the neocortex. Genes Dev. 15, 2054–
2059.
Recommended


