
FRACTURE MECANICS OF METALS, COMPOSITES, WELDS,
AND BOLTED JOINTS
BOB FARAHMAND Ph.D. (BOEING TECHNICAL FELLOW) PUBLISHER KLUWER ACADEMIC PUBLISHERS YR 2000 With Author's Permission.
CHAPTER 8 Chapter 8 Author: Frank Abdi, Ph.D.
DURABILITY AND DAMAGE TOLERANCE OF COMPOSITES
Overview of Composites
In certain structural applications the use of fiber composites is advantageous over metallicstructures (lighter weight, and higher stiffness). Polymer matrix composite (PMC) materials withcontinuous high modulus graphite fibers are very effective under high-cycle fatigue loading due to the ability of fibers to transmit and disperse the high-frequency vibration loads. A well-configured PMC structure can achieve practically infinite fatigue life, carrying relatively high loads. PMC structures subjected to high cycle fatigue usually experience damage initiation by transverse tensile failures(perpendicular to applied loading direction) in the matrix. As a result, a large number of microscopic cracks appear in the matrix, parallel to the fibers. The structural response properties and resistance todamage propagation usually remain intact at the presence of a large number of microscopic transversetensile crack [1]. At the end of fatigue life, fiber fractures occur at stress concentration sites, such asinterlaminar boundaries. The resulting local delaminations indicate onset of the damage propagationand failure stages. Composite failure is not predictable with a higher reliability compared to metallic structures due to the large number of material parameters and structural elements that contribute to the composite load redistribution and load carrying capability. The cumulative uncertainty from the large number of structural parameters that are present in PMC materials is less affected by the uncertaintyassociated with any one material variable. As a result, PMC structures can be designed with a higherdegree of reliability. Composites are also well suited for damage tolerant design by the properselection of fiber reinforcement patterns at damage critical regions. Composite structures are better able to redistribute stresses and redirect load paths around both discrete and distributed damagezones. PMC materials are particularly effective for damage tolerance due to flexibility of the polymermatrix that allows for small local adjustments of fiber alignment to help reduce stress concentration [2]. Fiber reinforcement configurations can be designed for the purpose of containing accidental damage. Hybrid composites that use both high-modulus and intermediate modulus fibers are effective inreducing stress concentrations as well as increasing damage energy absorption capability of PMCmaterials. High modulus fibers are typically made from layered anisotropic graphite, whereas intermediate modulus fibers are usually made from homogeneous materials such as fiberglass orKevlar.
Page 1 of 31FRACTURE MECANICS OF METALS, COMPOSITES, WELDS,
5/7/2002http://www.alphastarcorp-genoa.com/Durability.htm

Polymer matrix composite (PMC) materials in the form of braided, woven or stitched laminates areincreasingly being used in critical aircraft structural parts that must be damage tolerant for reasons ofsafety, reliability, maintainability and supportability. This means that PMC structures must be durableand reliable under service conditions that can expose aircraft structure to many types of damagemechanisms. Basic to the evaluation of durability and reliability is the analysis of fracture initiation and progression under static or fluctuating thermo-mechanical loading and fast rate of loading in variable environments (e.g., humidity, engine exhaust, or sea air).
Fracture initiation is associated with defects such as voids, machining irregularities, stress concentrating design features, damage from impacts with tools or other objects resulting in discretesource damage (DSD), and non-uniform material properties stemming, for example, from improper heattreatment. After a crack initiates it can grow and progressively lower the residual strength of a structureto the point where it can no longer support design loads making global failure imminent. The processes of fracture initiation and subsequent progressive growth have large probabilistic elements stemming from the complexities introduced in PMC materials by the presence of multiple components and theirinteractions. Add to this the multiplicity of design options arising from the availability of numerouschoices of fibers, fiber coatings, fiber orientation patterns, fiber preform variations, matrix materials, andconstituent material combinations and there results a large array of design parameters to be consideredmaking numerical analysis difficult. As a consequence, costly and time-consuming experimental testing has been primarily relied upon to evaluate design iterations of PMC structures.
Engineering applications of composites require diverse material properties and fiber reinforcementconfigurations. Engineered composites are classified into categories based on (a) fiber/matrixconstituent materials and (b) fiber reinforcement configurations. Fiber/matrix constituent based differences in composites generally address use temperature of the structure. At relatively low temperatures, ranging from subzero to 150oC, polymer matrix composite (PMC) materials are usuallyselected. Metal Matrix Composite (MMC) materials are indicated for higher temperature applications,ranging up to 1,000oC. Ceramic Matrix Composite (CMC) materials are considered for temperaturesabove 1000oC such as in engine combustion chambers. Fiber configuration based classificationsdistinguish between short fiber and continuous fiber composites. The continuous fiber composites are usually subdivided into straight fiber laminates that have only in-plane fiber orientations and braided or woven textile composites that have both in-plane and out-of-plane fiber orientations. Straight fiber laminates are used extensively in aircraft structures. However, the potential for delamination is a major problem because the interlaminar strength is matrix dominated. Textile composites that do not have distinct laminae are not susceptible to delamination, but their strength and stiffness are sacrificed dueto fiber curvatures.
The automation process of composite manufacturing emphasizes quality and cost of the endproduct. The type of process (i.e. braiding textile, pultrusion) is selected to provide a cost effectivemeans of manufacturing two and three dimensional fiber reinforcement configurations used in thedesign of PMC structural components.
The selection of the manufacturing process is based on the cost comparison of different processes,shown in Figure 1.
The bar graph in Figure 1, that was originated by Krolewski and Gutkowski (1986), indicates thatpultrusion is the lowest cost manufacturing process. Nevertheless, the shape of some parts, such as a wind turbine blade does not lend itself to pultrusion, and therefore, the process of choice for windturbine blades is filament winding or braiding.
Page 2 of 31FRACTURE MECANICS OF METALS, COMPOSITES, WELDS,
5/7/2002http://www.alphastarcorp-genoa.com/Durability.htm

Figure 1 Cost Comparison of seven different manufacturing processes
Overview of Textiles
Textile composites for engineering structures draw on many traditional textile forms and processes.Therefore the processes and architecture that can yield composites with the high performance requiredfor aerospace structures will be summarized. These textiles are generally those that most effectivelytranslate stiff, strong yarns into stiff, strong composites.
A textile composite has internal structure on several scales. At the molecular scale, both the polymer matrix and the fibers exhibit structural details that profoundly affect strength and stiffness. Matrix properties are determined by polymer chain morphology and cross-linking, among other things. Carbon fibers, which are often the preferred choice in aerospace materials, owe their axial stiffness andstrength to the arrangement of carbon atoms in oriented graphitic sheets. On a coarser scale, typically 1 mm., lots of ~ 103 -104 fibers are bundled into yarns or tows. Within the finished composite, each tow behaves as a highly anisotropic solid entity, with far greater stiffness and strength along its axisthan in transverse directions. Because tows are rarely packed in straight, parallel arrays, stresses andstrains often possess strong variations from tow to tow. Thus composite mechanical properties such as elasticity can only be considered approximately uniform on scales that are even larger still, say ~10 mmor higher, where the effects of the heterogeneous structure at the tow level are averaged out. Finally, the textile forms part of an engineering structure, perhaps the stiffened skin of a wing or fuselage. Since the engineering structure itself usually has some dimensions as small as ~10 mm, the fabricationof the composite material and the fabrication of the engineered structure may no longer be considereddistinct operations. To fabricate the textile composite is to fabricate the structure.
Figure 2 illustrates scales in one textile process. The shown part is an integrally formed skin/stiffener assembly. The first processing step is the formation of yarns from fibers. In the second step, the yarns are woven into plain weave cloth. The cloths are then laid up in the shape of the skinand stiffener and stitched together to create an integral preform. Finally, the composite part is consolidated by the infiltration of resin and curing in a mold.
Page 3 of 31FRACTURE MECANICS OF METALS, COMPOSITES, WELDS,
5/7/2002http://www.alphastarcorp-genoa.com/Durability.htm

Figure 2. Steps in the production of a textile composite structure The fabrication method of Figure 2 also illustrates fairly high utilization of the axial stiffness andstrength of the fibers. The fibers in the skin are arranged approximately in-plane, straight, and with reasonably high volume fraction. High in-plane composite stiffness and strength can therefore beexpected. Certain other traditional textiles do not achieve this. For example, many knitted fabrics loop yarns in highly curved paths, rather than aligning them; and, because of the openness of the fabric, canachieve only moderate fiber volume fractions. Composite stiffness and strength are consequentlyinadequate for airframes. For similar reasons, fiber mats and discontinuous reinforcements are usually unattractive to airframe designers. These materials will be excluded from further consideration in thisbook.
Figure 2 also exemplifies reinforcement that is heterogeneous on the scale of the structure. The length of the stitches varies with the thickness of the flange of the rib, and their spacing is not far belowthe thickness of either the rib itself or the flanges. Just as the material and the structure are fabricatedsimultaneously, so in this case they must be analyzed simultaneously. Dealing adequately with the fiber architecture in determining stress distributions requires analyzing the external geometry of the partitself.
Categorizations
Figure 3 introduces the most important groups of textile forms that are candidates for airframes.Many of these were investigated in NASA’s ACT [3] Program. The left column categorizes textilesaccording to the machines and processes used in creating them. High-performance composite structures have been created using all the processes listed with conventional textile machinery havingbeen modified in many cases to handle the high modulus fibers needed in airframes and to reducecosts through automation. In modeling their macroscopic properties, all 2D and many 3D textilecomposites can be considered to function as laminates, with relatively minor allowance for their textilenature, even though the routes to their manufacture are very different from conventional tape lay-up. Most textile composites for skin or sheet applications are designed for high in-plane stiffness and strength. This requires the majority of fibers lie in plane, relatively few can be dedicated to through-thickness reinforcement without unacceptable loss of in-plane properties. In the case of most sheet applications, damage tolerance and delamination resistance requires that a modest volume fraction ofthrough-thickness fibers be introduced to provide load-bearing capacity along all three axes. However, the volume fraction of through-thickness fiber reinforcement needed to suppress delaminationincreases with increasing curvature because the resultant through-thickness stretch tension increases.
The similarity of braided textile geometry to that of woven textiles allows some perception of braided
fiber reinforced material performance to be obtained based on experimental characterizations of wovenfiber reinforced PMC materials. Thus, 3D-braided PMC composites would be expected to show similar results to those obtained on extensive testing of various angle and orthogonal interlock 3D wovencomposites. These tests [3] showed 3D woven composites to possess an extraordinary combination ofstrength, damage tolerance, and notch insensitivity in compression, tension, and in monotonic andcyclic loading. Also, the performance of 3D woven
Page 4 of 31FRACTURE MECANICS OF METALS, COMPOSITES, WELDS,
5/7/2002http://www.alphastarcorp-genoa.com/Durability.htm

Figure 3 Categories of Textile Composites for Airframe Applications
(Courtesy of Handbook of Analytical Methods of Textile Composite Version 1.0 January, 1996)
Composites were found to far outstrip that of conventional 2D laminates or stitched laminates in manyimportant regards. Thus, 3D braided fiber reinforced PMCs can be expected to exhibit similar, superiorperformance to 2D braided PMC materials. Further, tow size, strength and distributions in space ofgeometrical flaws are found to be key design and manufacturing parameters for controllingperformance characteristics of 3D woven PMCs, and can also be expected to be important parametersfor 3D braided PMCs.
Classification into 2D and 3D composites depends on whether the fibers preformed alone (in theabsence of matrix) can transport loads continuously in three or only two linearly independentdirections. Thus a 2D composite has distinct layers, which may be separated without breaking fibers. Of course, yarns in textile composites that are defined to be 2D may still follow path segments withcomponents in the through-thickness direction, as in a laminated plain weave; but surfaces may bedefined through which no tows pass and which separate the composite into layers. This cannot be done for a 3D composite.
In modeling their macroscopic properties, all 2D and many 3D textile composites can be considered
to function as laminates, with relatively minor allowance for their textile nature, even though the routesto their manufacture are very different from conventional tape lay-up. Most textile composites designed for skin or sheet applications fall into this category. When high in-plane stiffness and strength are demanded, the majority of fibers must lie in-plane; relatively few can be dedicated to through-thickness reinforcement without unacceptable loss of in-plane properties. And indeed for most sheet applications, damage tolerance and delamination resistance requires modest volume fractions of thethrough-thickness fibers. Textile composites that behave in most ways like laminates are called “quasi-laminar.”
In structures where substantial triaxial stresses exist, the optimal reinforcement will no longer be alaminate with moderate through-thickness reinforcement. Instead, fibers will be arranged with roughly equal load bearing capacity along all three axes of a Cartesian system. Such textile composites are called “nonlaminar”.
Nonlaminar textiles are often manufactured to respond to complex part geometry and triaxial loads,for example the union of a skin and stiffening element of a short beam with approximately equiaxedcross-section. But even a curved plate designed as a laminate with through-thickness reinforcement must be considered nonlaminar if its curvature is sufficiently high. As the curvature increases, greater
NAS396-022
Page 5 of 31FRACTURE MECANICS OF METALS, COMPOSITES, WELDS,
5/7/2002http://www.alphastarcorp-genoa.com/Durability.htm

through-thickness tension is generated by applied bending moments, and so much through-thickness reinforcement is needed to suppress delamination that the part loses its laminar character. Figure 3 shows how the main classes of textiles may be categorized as quasi laminar or nonlaminar. Occasionally, experience with damage modes obliges a 3D categorization of a textile as nonlaminar indescribing its passage to ultimate failure, even though in the elastic regime it is clearly quasi-laminar.
Whether a textile is quasi-laminar or nonlaminar is a crucial question in choosing an appropriate
approach to modeling its properties. Quasi-laminar composites can generally be modeled accuratelyby some modification of standard laminate theory. Nonlaminar textiles require a model that computesthe distribution of stresses in all tows, which is a much more difficult problem.
Progressive Fracture Methodology
Extensive efforts to identify the various modes of damage in composite materials have beenundertaken in recent years. The primary finding of most of these investigations was that macroscopicfracture was usually preceded by an accumulation of the different types of microscopic damage andoccurred by the coalescence of this small-scale damage into macroscopic cracks. Additionally, it was generally found that analyses based on classical fracture mechanics did not adequately model thedamage effects and did not provide a satisfactory degree of predictive capability [4,5].
Damage stability is influenced by both local factors, such as constituent material properties at the
location of damage, and global factors, such as structural geometry and boundary conditions. Theinteraction of these factors, further complicated by the numerous possibilities of material combinations,composite geometry, fiber orientations, and loading conditions, renders the assessment of compositedamage progression very complex. This complexity makes it difficult to identify and isolate all significantparameters affecting damage stability without a model based computer code capable of incorporatingall factors pertinent to determining structural fracture progression, fundamental to evaluating thedurability and life of composite structures [6-14].
Predicting crack propagation in PMC structure is further complicated by the existence of a
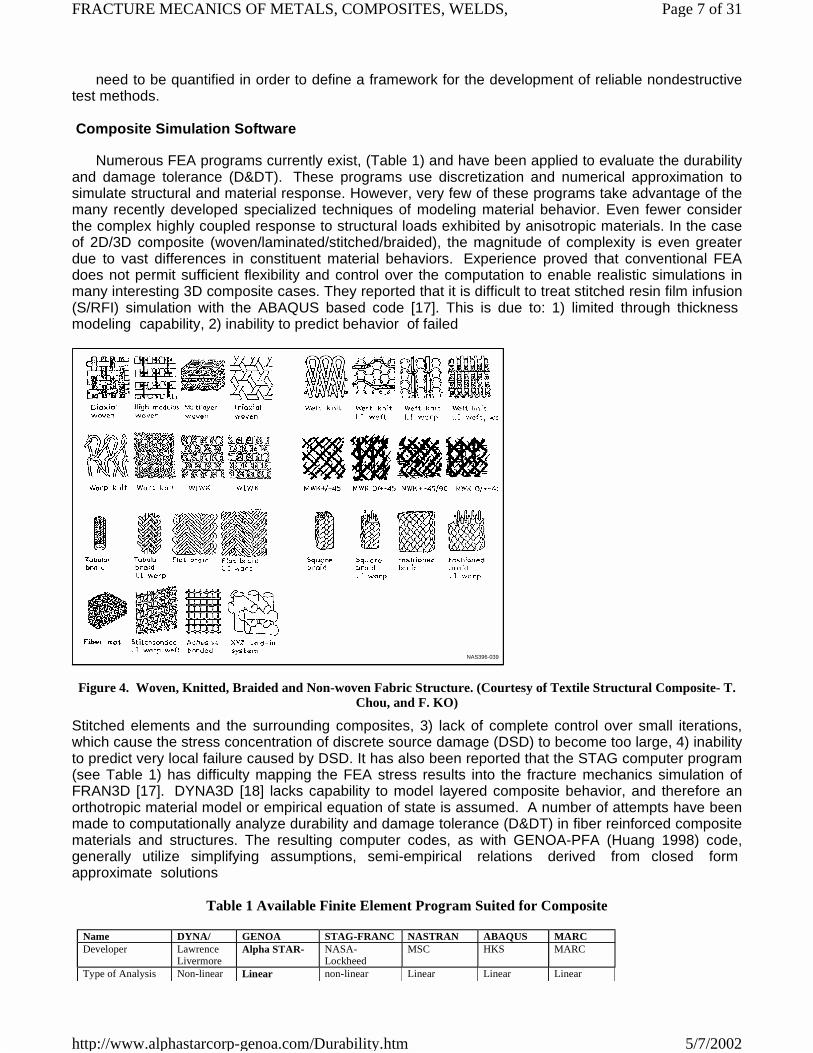
multiplicity of design options arising from the availability of numerous choices of fibers, fiber coatings,fiber orientation patterns (Figure 4), matrix materials, constituent material combinations, andhybridizations [15]. The resulting large array of design parameters presents a logistical problem thatcomplicates and prolongs design optimization and certification processes and adds significantly to thecost of composite parts.
Characterization of Composite Degradation
Damage progression in a fiber composite structure will usually be initiated by matrix cracking due totensile stress transverse to the fiber orientation. Braid separation or debonding will occur due to inter-braid and, intra-braid stretch tension, shear stresses, and excess relative rotation of contiguous braids. Damage growth may involve matrix crushing due to transverse compression or fiber compressivefailures due to longitudinal compression of a braid. Fiber compressive failures may be assisted by theloss of matrix stiffness. Longitudinal compressive failure of a braid will usually propagate immediately into structural fracture. Fiber tensile failures may also occur but most composite structures are able towithstand some amount of fiber tensile failures prior to structural fracture [16].
Generally, composite structures are much more damage tolerant compared to homogeneousstructures due to the inherent fail safe characteristics (layered material). A local material failure in a PMC component will not usually mean immediate structural failure as is expected in metals with lowfracture toughens. It is, therefore, important to have the capability to quantify the level of structuralsafety after damage initiation and as damage growth takes place. The relationship between certain damage characteristics and remaining reliable life need to be established for in-service structural health monitoring of structural components. Thermal, hygral, and environmental effects on structural response
Page 6 of 31FRACTURE MECANICS OF METALS, COMPOSITES, WELDS,
5/7/2002http://www.alphastarcorp-genoa.com/Durability.htm
need to be quantified in order to define a framework for the development of reliable nondestructivetest methods.
Composite Simulation Software
Numerous FEA programs currently exist, (Table 1) and have been applied to evaluate the durabilityand damage tolerance (D&DT). These programs use discretization and numerical approximation tosimulate structural and material response. However, very few of these programs take advantage of themany recently developed specialized techniques of modeling material behavior. Even fewer considerthe complex highly coupled response to structural loads exhibited by anisotropic materials. In the caseof 2D/3D composite (woven/laminated/stitched/braided), the magnitude of complexity is even greaterdue to vast differences in constituent material behaviors. Experience proved that conventional FEA does not permit sufficient flexibility and control over the computation to enable realistic simulations inmany interesting 3D composite cases. They reported that it is difficult to treat stitched resin film infusion(S/RFI) simulation with the ABAQUS based code [17]. This is due to: 1) limited through thickness modeling capability, 2) inability to predict behavior of failed
Figure 4. Woven, Knitted, Braided and Non-woven Fabric Structure. (Courtesy of Textile Structural Composite- T. Chou, and F. KO)
Stitched elements and the surrounding composites, 3) lack of complete control over small iterations,which cause the stress concentration of discrete source damage (DSD) to become too large, 4) inabilityto predict very local failure caused by DSD. It has also been reported that the STAG computer program(see Table 1) has difficulty mapping the FEA stress results into the fracture mechanics simulation ofFRAN3D [17]. DYNA3D [18] lacks capability to model layered composite behavior, and therefore anorthotropic material model or empirical equation of state is assumed. A number of attempts have been made to computationally analyze durability and damage tolerance (D&DT) in fiber reinforced compositematerials and structures. The resulting computer codes, as with GENOA-PFA (Huang 1998) code,generally utilize simplifying assumptions, semi-empirical relations derived from closed form approximate solutions
Table 1 Available Finite Element Program Suited for Composite
NAS396-039
Name DYNA/ GENOA STAG-FRANC NASTRAN ABAQUS MARC Developer Lawrence
Livermore Alpha STAR- NASA-
LockheedMSC HKS MARC
Type of Analysis Non-linear Linear non-linear Linear Linear Linear
Page 7 of 31FRACTURE MECANICS OF METALS, COMPOSITES, WELDS,
5/7/2002http://www.alphastarcorp-genoa.com/Durability.htm

correlated with test data. These codes are typically fast, cost effective, and easy to use but lack the capabilities of GENOA-PFA software to: simulate: 1) dynamic loading responses, 2) 3D fibergeometries, 3) woven/braided fiber configurations, 4) through the thickness fiber stitching, 5)degradation of fiber and matrix mechanical/physical properties, 6) damage tracking, 7) creep, and 8)fatigue. Also, these codes do not have GENOA-PFA’s adaptive mesh capability for automatically refining an FEM mesh at stress concentration locations to assure simulation accuracy, and thecapability to incrementally integrate FEM with macro and micro mechanical basics. The use of GENOA-PFA capabilities are presented in Table 2. A comparison of GENOA-PFA’s simulation capabilities with other available D&DT simulation software codes is presented in Table 1. Table 3a presents the advantages and disadvantages of D&DT prediction methods.
Table 2. GENOA-PFA Vs. Other Durability and Damage Tolerance (D&DT) Solutions [19]
Progressive Fracture Analysis (PFA)
The modeling of PMC in PFA considers the physics and mechanics of PMC materials and structureby integration of a hierarchical multilevel macro-scale (lamina, laminate, structure) and micro scale(fiber, matrix, and interface) simulation analyses (Figure 5). The modeling involves: 1) ply layeringmethodology utilizing FEM models with through-the-thickness representation, 2) simulation of effects ofmaterial defects and conditions (e.g., voids, fiber waviness, and residual stress) on global static, cyclicfatigue, and creep, 3) including material nonlinearities (by updating properties periodically) andgeometrical nonlinearities (by Lagrangian updating), 4) simulating crack initiation, and growth to failure
non-linear non-linear non-linear Progressive Fracture
Yes/Metal Yes Yes Limited Limited Limited Local/global Analysis
No Yes No No No No
Adaptive Mesh No Yes No No No NoMaterial Degradation
No Yes No No No No
Local Crippling/Micro Buckling
No Yes No No No No
layered Analysis
No Anisotropic No No No No
Stitched No Yes NO No No NoComposite Element
No Thickness Integration point
No No No No
Buckling Yes Yes Yes Yes Yes Yes Probabilistic No Yes No No No NoVerified DSD D&DT
No Composite/ Metal
Metal Only Limited No No
Accuracy Fair High Fair Fair- Fair Fair
Integrated GENOA D&DT Solution Other D&DT SolutionsDamage initiation/growth and residual strength predictions. Modeling of fiber orientation, matrix, and Stitching. Manufacturing defects: voids, fiber waviness, and fiber misalignment and cure residual stress). Degradation of material properties (stiffness, and strength) under service condition. Detailed stress analysis, photo-elastic fringe pattern. Automated adaptive FEM meshing, and crack growth monitoring. Sensitivity analysis of design parameters to failure criteria. Static, Fatigue, impact and creep predictions.
Provide for design (preliminary, and detailed) parametric studies and preliminary structural analysis of resulting designs, detailed designs. Can be used for empirical prediction of damage growth and residual strength (semi-empirical). Accuracy guarantee is at best limited to range of test variables).
Page 8 of 31FRACTURE MECANICS OF METALS, COMPOSITES, WELDS,
5/7/2002http://www.alphastarcorp-genoa.com/Durability.htm

under static, low/high cyclic fatigue, random fatigue (power spectrum density), creep, and impactloads, 5) progressive fracture analysis to determine durability and damage tolerance, 6) identifying thepercent contribution of various possible composite failure modes involved in critical damage events,and 7) determining sensitivities of failure modes to design parameters (e.g., fiber volume fraction, plythickness, fiber orientation, and adhesive-bond thickness) [20]. The concept of the PFA is shown inTable 3b. PFA progressive failure analysis software is now ready for use to investigate the effects on structural responses to PMC material degradation from damage induced by static, cyclic (fatigue),creep,
Table 3a. Advantages and Disadvantages of D&DT Prediction Methods
Table 3b. Concept and functionality of GENOA-PFA
and impact loading in 2D/3D PMC structures subjected to hygrothermal environments. Its use willsignificantly facilitate targeting
Method Advantages DisadvantageGenoa Progressive Fracture - A New Approach
A) Reduce Experimental Testing B) Reduce Design Time C) Reduce Design Cost D) Computer Code Available E) Verified Accuracy F) Most Powerful Of Methods
Requires Significant Computer Resources
Simplified Equations [21]
A) Rapid Analysis B) Promotes Design Optimization
Accuracy Is Limited
R-Curve, (See Chapter 2)
Well Established Method A) Little Predictive Capability For Fracture Propagation In PMC B) Requires Extensive Testing C) R-Curves Are Part Specific
Linear Elastic Fracture Mechanics (LEFM, See Chapter 2)
A) Accurate Prediction Of Tensile Strength If Matrix Cracking And Delamination Are Minimal B) Good For Long Damage Cuts
a) Not Good If Matrix Cracking And/Or Delamination Are Significant
b) Needs Case Specific Fracture Toughness Parameters
Damage Energy Release Rate (DERR)
A) Computational Simulation Method B) Indicates Structural Resistance To Damage Propagation.
Non-Linear Response [22]
Analytical Study Suggests Accurate Prediction Of Stiffened Shell Response To Damage
A) Insufficient Experimental Verification B) Limited Effort In This Area
Methodology FunctionalityUpdated/Total Lagrangian Geometrical Non-Linearity Material Property Degradation At Fiber/Matrix Levelfiber/Matrix/Interface, 2) Lamina
Material Non-Linearity
Adaptive Meshing Singularity Conditioning
Mixed Iterative Fem Minimize Residual Error Conditioning,
Fourteen Failure Mechanism Flexibility For Crack Growth (3d) Space
Percent Contribution Of Failure Modes To Fracture
Identify Fracture For Each Mode
Strain Energy Rate - Local And Global Damage And Fracture MonitoringMonitoring
Page 9 of 31FRACTURE MECANICS OF METALS, COMPOSITES, WELDS,
5/7/2002http://www.alphastarcorp-genoa.com/Durability.htm

Figure 5. GENOA, a Software For Structural Analysis of Polymer Matrix Composites, Utilizes a Hierarchical Multi-Level Approach on Macro and Micro Scales
design parameter changes that will be most effective in reducing the probability of a given failure modeoccurring.
Development of 2D/3D PMC progressive failure analysis took into account requirements and
verification criteria defined by key industry sources to help designers meet manufacturing and FAArequirements. Key PFA simulation applications are shown in Table 4. The developed codedemonstrated achievement of the overall goal of providing a validated PFA tool that an analyst ordesigner can use to accurately and rapidly evaluate durability and damage tolerance by progressivefailure analysis in design of PMC structure and thereby reduce design cost and time to market. Specificefforts have been directed to modify an existing PFA precursor code to: 1) Model a variety of 2D/3Dwoven/braided/stitched laminate fiber architectures; 2) Improve flexibility and portability bymodularization and standardization; 3) Refine FEM meshing as necessary at any iteration; 4) Simulateprogressive fracture under static, cyclic fatigue, and impact loading; 5) Simulate reshaping of braidedfiber preforms to assist manufacturing; 6) Perform probabilistic failure analyses; 7) Generate equivalentwoven/braided/stitched composite material properties (Figure 6); 8) Perform virtual testing; 9) Provideinterface capability to commercially used software (i.e. NASTRAN, and PATRAN); 10) Improvegraphics for visualization of simulated results; 11) Provide the capability to show results in animatedgraphics (movie) form; 12) Update User’s and Theoretical manuals; 13) Allow Porting of PFA softwareto Unix (HP, SGI, IBM), and NT operating systems. 3.1 Computational Simulation Strategy
The GENOA-PFA code, used for computational simulation, is an integrated, open-ended (Figure 6), stand alone computer code utilizing 1) micro and macro composite mechanics analysis (Figure 7), 2)finite element method (FEM) analysis, and 3) damage evaluation methods. Calculated material stiffnessvalues are input to the finite element analysis module that models composite materials with anisotropicbrick and thin shell elements. As shown in Figure 8, GENOA-PFA utilizes an iterative analysis approach to simulate damage accumulation in a structure. The overall evaluation of composite
M AT RIX
F IBER
INT ERPHASE
P
T
s
Load S trength
J o in t P robab i l i ty Dens i ty
M P P L
g = C
g = 0U 1
U 2
C O M P O S I T EC O N S T I T U E N T
L A M I N A T ET H E O R Y
D U R A B I L I T YM I C R O - M E C H A N I C S
P R O B A B I L I S T I C R I S KA S S E S S M E N T
G L O B A LS T R U C T U R A LA N A L Y S I
D O M A I ND E C O M P O S I T I O N
S T R U C T U R A LR E L I A B I L T
M a t e r ia lD a t a B a s e
tt
ts
TeL o a d s & B o u n d a r y
L
W1
G e o m e t r y
U S E R I N T E R F A C E &
Ite rat ive P roce dure
Page 10 of 31FRACTURE MECANICS OF METALS, COMPOSITES, WELDS,
5/7/2002http://www.alphastarcorp-genoa.com/Durability.htm

structural durability is carried out in the damage-tracking module that incrementally evaluates composite material degradation in a structure
Table 4. PMC Progressive Failure Simulation Key Multi-Disciplinary Features Under Load Spectrum (Static, Low
Cycle Fatigue, High Cycle Fatigue, Random Fatigue (PSD) Creep, Impact) Conditions
subjected to a specified load spectrum. The composite damage-tracking module evaluates damage initiation/progression in a structure based on the FEM analysis results and failure criteria that guide thesynthesis of structural stress redistribution due to material degradation. The damage-tracking module also relies on a composite mechanics module (GEN-PMC) for material property data needed to characterize lamina and laminate micromechanical behavior.
The FEM module used in GENOA-PFA was originally derived from the MARC analysis FEM code developed over 20 years ago. This software development lineage results in GENOA-PFA being a nodal based finite element code. The nodal approach enables the analyst to use nodal interpolation forcoordinates, displacements, strains, and stresses. The FEM module library contains 4-node plate and 8-node brick elements suitable for use in structural analyses. The 4-node plate element is most suited for extended analysis since the use of Reissner-Mindlin theory in its formulation allows accounting fortransverse shear deformations in a structure.
Features Functionality Durability
And Damage
Tolerance-
• Damage initiation and location (fiber, matrix ) within a lamina • Percent of contributing failure mechanisms • Failure location , and fracture path within lamina, and structure • Residual strength after damage • Prediction of life cycle • Prediction of S-N curves, da/dn, and fracture toughness • Stress intensity factor • Prediction of material property degradation cycle • Animated graphics of PFA process
Virtual Testing
• Contour of global strain/stress at initiation, propagation, and failure• Plot of far-field applied load vs. Deflection (deflectometer) • Plot of applied load vs. Strain (strain gage) • Photo-elastic fringe simulation (isochromatic, and isoclinic) • Local and global energy release rates vs. Applied loads representing
acoustic emissions • Plot of crack length vs. Applied load to show the fracture toughness • Plots of stress vs. Strain at selected locations • Predictions of static failure from discrete source damage • Prediction fatigue damage initiation at multiple sites • Prediction of required tests based on sensitivity of failure criteria • Movie play of virtual testing process
Probabilistic Failure Analysis
• Uncertainty evaluation of material strength to material parameters • Sensitivities of design requirements to design parameters. • Predicting degree to which design parameters contributed to failure • Cumulative distribution functions for failure strength evaluation • Probability of time to failure • Margin of safety predictions
Manufacturing of Preform Composite
Net Part Shape
• Fiber orientation and volume fraction changes• Attainable best fit to a shape, • Minimize occurrences of failure (buckling, fiber wrinkling) • Multiple preforms of sizes interleaved with woven sheet strips • Transferring fiber orientation directly to design process software • Animated graphics of manufacturing process
Equivalent Laminate
Properties of 2D/3D
woven/braided/Stitched
• Equivalent laminate moduli, moisture property, thermal property, and heat conductivity
• Degradation of material properties due environments (moisture, thermal), or manufacturing (voids, defects, residual strains)
• Plot of ply strength vs. Ply stress
Page 11 of 31FRACTURE MECANICS OF METALS, COMPOSITES, WELDS,
5/7/2002http://www.alphastarcorp-genoa.com/Durability.htm

Damage Tracking Process
Damage tracking is carried out in the damage progression module that keeps track of composite
degradation for the entire structure. The
Figure 6. Architecture of GENOA Durability &Reliability Software System
ASC-073A
GENOAExecutiveController
PROMISS2D/3D PMC 2D MMC 2D/3D CMC FEM
PolymerCompositeAnalyzer
Metal MatrixCompositeAnalyzer
Ceramic MatrixCompositeAnalyzer
Progressive Failure Analyzer
Durability And Reliability Analysis
TFUTesting Facility
Usage
PVMParallel Message
Passing
CascadingDistribution
Table
MAESTRODynamics Load
Balance
RIP/PEELStatic Load
BalanceParallel/Processor Modules
Post-ProcessorModuleGraphics
User Interface
DataSorting
Report
User
FEMTranslator
ProbabilisticMaterial Strength
Simulator
Figure 7: GENOA-PFA Calculation of Ply Microstresses Through Composite
Stress Progressive Decomposition
Page 12 of 31FRACTURE MECANICS OF METALS, COMPOSITES, WELDS,
5/7/2002http://www.alphastarcorp-genoa.com/Durability.htm

Figure 8. A Schematic Diagram of the Principal Elements of the GENOA Progressive Failure Analysis (GENOA-
PFA) S/W Package
damage progression module relies on the composite mechanics module for micromechanic andmacromechanic analysis and uses the FEM analysis module to obtain generalized stresses anddisplacements in a composite structure.
Figure 9 shows an example of GENOA-PFAs damage tracking sequence as the load on a structure isincreased. A damage equilibrium state is defined to exist when an incremental load increase does noteither initiate or exacerbate damage. As the load is increased a point is reached (Point 1 in Figure 9)where there is an assessment of initial composite material damage based on the 14 failure criteria.According to the operative failure criteria, material properties are then degraded for use in FEMiterations to reevaluate the new damaged structure at the damage initiation load. The applied load at agiven damage event is maintained and FEM iterations continued as damage accumulates (Points 2, 3,and 4 in Figure 9) until an equilibrium damage state is again reached or until global structural failureoccurs (Point 5 in Figure 9).
GEN-PMC is called before and after each FEM analysis to update composite properties based on thefiber and matrix constituent characteristics and the state of damage in the composite lay-up. Through-the-thickness laminate properties computed by GEN-PMC consider the elastic moduli of membrane terms, bending terms, membrane-bending coupling terms, bending gradient terms, and shear terms. The finite element analysis module accepts the GEN-PMC generated properties for each node of a structural model under evaluation and then performs a structural analysis to determine the effect of agiven load increment on the generalized nodal force resultants and deformations. The new values so determined are supplied back to the GEN-PMC module that evaluates the nature and amount of localdamage, if any, in the plies of the composite laminate. Failure Evaluation Approach
GENOA’s approach to failure evaluation involves comparison of computed constituent properties with criteria of stress limits, distortion energies, degree of relative ply rotation, global scalar-damage, and global damage energy release rate (DERR), that is analogous to the Griffith energy release ratedescribed in chapters 2, and 4. Of the 14 local failure criteria in Table 5 used by GEN-PMC to evaluate damage, the first 12 are stress limits computed by the micromechanical equations in GEN-PMC based on a material’s constituent stiffness and strength values [24]. In addition to the 12 failure criteria based on stress limits, interply delamination due to relative rotation of plies and a modified distortion energy(MDE) failure criterion that takes into account combined stresses are considered. If ply damage is
Adjustment ofMaterial
Properties
FEMAnalysisIteration
DamageProgressionAssessment
IncrementLoad
End of ??????
No Change in Damage
Damage Initiation/Growth
Part Failure
Composites Mechanic Module
FEMAnalysis
DamageTracking
1. Composite mechanics module– Calculates composite anistropic material properties at laminate and lamina levels
2. Finite element analysis module– Anisotropic thick and thin shell elements to model composites
3. Damage tracking module– Initiation/progression
4. Computations made by micromechanics equation in the composite mechanics module utilize constituent stiffness and strength parameters obtained from a material data bank
(a)
(b)
End
Page 13 of 31FRACTURE MECANICS OF METALS, COMPOSITES, WELDS,
5/7/2002http://www.alphastarcorp-genoa.com/Durability.htm

predicted due to longitudinal tensile or compressive failure, ply stiffness is reduced to zero at thedamaged node. On the other hand, if ply damage is predicted due to transverse tensile, compressive,or shear failures, only the matrix stiffness is degraded and the longitudinal tensile stiffness of fibers isretained. Progressive damage and fracture evaluations are carried out by imposing failure criterialocally within unit sub-volumes with reference to the local coordinates of the composite materials. Ateach individual load step, stresses in stitching and in-plane sub-volumes obtained through the composite microstress analysis are assessed according to distinct failure criteria (Table 5).
Figure 9. Damage Tracking Expressed in Terms of Load vs. Displacement
Damage Evolution Metrics
In addition to the 14 failure conditions, five functions are calculated as follows: 1) Percent DamageVolume versus Load – representing margin of safety (Figure 10(a)), 2) Damage Energy Release Rate(DERR) - representing acoustic emission, and inspection, and non destructive evaluation (Figure 10(b)), 3) Total Damage Energy Release Rate (TDERR) - representing global failure (Figure 10(c)), 4) Strain Energy Damage Rate (SEDR), 5) Equivalent Fracture Toughness (Figure 10(d)).
Total Damage Energy Release Rate (TDERR)
The measure of global fracture toughness is defined in terms of the TDERR, a scalar damage variablethat is equal to the amount of damage energy expended for the creation of unit damage volume in thecomposite structure. The magnitude of TDERR varies during progressive degradation of the compositestructure under loading, reflecting the changes in the fracture resistance of the composite. The TDERRfunction is useful for assessing the overall degradation of a given structure under a prescribed loadingcondition, and the rate of its increase provides a measure of structural propensity for fracture.
Assessment of failure with TDERR is reflected by maximum and
Failure Index Process/Description
2 3 4
5
1
Load IncrementLoad
Displacement
1. Ply failure indicates initial damage • Properties are degraded • Reconstitute a new FEM reanalysis is
conducted under the same load 2. Damage accumulation • More degradation, possible composite ply
failure 3. Damage stabilization • No additional damage, with structure in
equilibrium 4. Damage propagation 5. Analysis stops at nodal fracture, crack
opening, adaptive meshing reconstructs a new mesh , material properties re-calculated, and equilibrium achieved
a) Percent damage Volume Vs. Load
Spectrum Spectrum
Margin ofSaftey
b) DERR Vs. Load Spectrum
Non DestructiveEvaluation
Page 14 of 31FRACTURE MECANICS OF METALS, COMPOSITES, WELDS,
5/7/2002http://www.alphastarcorp-genoa.com/Durability.htm

Figure 10. Damage Evolution Metrics as derivatives of Energy Release Rate minimum values. A local maxima (stick point) represents a build up of energy and initiation of damagein a composite structure. Typically, at the stage of damage initiation, there is a high rate of energyrelease that dissipates a significant portion of the strain energy stored in the composite structure. A local minimum (slip point) represents the end of fracture stability in a damaged composite under theapplied loading (Figure 10 (c)). Computation of the TDERR during progressive fracture allowsevaluation of the composite fracture toughness and the degree of imminent failure. The TDERR is computed as the ratio of damage energy to the corresponding damage volume that is generated:
TDERR= Total Damage Energy/Total Damage Volume Table 5. Fourteen Damage Modes Considered In GENOA [25, 26]
Assuming locally linear elastic properties prior to damage, the damage energy can be computed asfollows:
c) TDERR Vs. Load Spectrum
Global Failure
d) Stress Intensity Factor Vs. Load Spectrum
Stress Intensity Factorand Fracture Toughness
Mode of Failure DescriptionLongitudinal Tensile Fiber tensile strength and the fiber volume ratio.Longitudinal Compressive 1. Rule of mixtures based on fiber compressive
strength and fiber volume ratio 2. Fiber microbuckling based on matrix shear modulus
and fiber volume ratio, and 3. Compressive shear failure or kink band formation
that is mainly based on ply intralaminar shear strength and matrix tensile strength.
Transverse Tensile Matrix modulus, matrix tensile strength, and fiber volume ratio.
Transverse Compressive Matrix compressive strength, matrix modulus, and fiber volume ratio.
Normal Tensile Plies are separating due to normal tension Normal Compressive Due to very high surface pressure i.e. crushing of laminateIn Plane Shear (+) Failure due to Positive in plane shear with reference to
laminate coordinates In Plane Shear (-) Failure due to negative in plane shear with reference to
laminate coordinates Transverse Normal Shear (+) Shear Failure due shear stress acting on transverse cross
section that is taken on a transverse cross section oriented in a normal direction of the ply
Transverse Normal Shear (-) Shear Failure due shear stress acting on transverse cross section that is taken on a negative transverse cross section oriented in a normal direction of the ply
Longitudinal Normal Shear (+) Shear Failure due shear stress acting on longitudinal cross section that is taken on a positive longitudinal cross section oriented in a normal direction of the ply
Longitudinal Normal Shear (-) Shear Failure due shear stress acting on longitudinal cross section that is taken on a negative longitudinal cross section oriented in a normal direction of the ply
Modified Distortion Energy Criterion
Modified from Distortion Energy combined stress failure criteria used for isotropic materials
Relative Rotation Criterion Considers failure if the adjacent plies rotate excessively with respect to one another
Page 15 of 31FRACTURE MECANICS OF METALS, COMPOSITES, WELDS,
5/7/2002http://www.alphastarcorp-genoa.com/Durability.htm

1
Where Sj is the local composite strength associated with the damage mode, Ej is the elastic modulus corresponding to Sj, and Vi is the volume of damage. Typically, at the stage of damage initiation, thereis a high rate of energy release that dissipates a significant portion of the strain energy stored in thecomposite structure. After the first burst of energy release, the TDERR usually drops, indicating asignificant reduction in fracture stability of the damaged composite under the applied loading.
Damage Energy Release Rate (DERR)
The DERR (Figure 10(b)) is defined as the rate of work done by external forces during structuraldegradation with respect to the damage produced in the structure and is equal to the incrementalamount of damage energy expended for the creation of unit damage volume in the composite structure.The DERR can be used to evaluate structural resistance to damage propagation at different stages ofloading. The magnitude of DERR varies during progressive degradation of the composite structureunder loading, reflecting the changes in the fracture resistance of the composite. The traverse of a localminimum value of the DERR during the progression of fracture typically precedes a very high rate ofdamage propagation and generally predicts the imminence of total failure. After an energy release the DERR usually drops, indicating a significant reduction in fracture stability of the damaged compositeunder the applied loading.
The damage energy release rate (DERR), is defined as the ratio of incremental damage energy tothe corresponding incremental damage volume that is generated,
Damage Energy = ΣΣ (0.5 * S2Fj / EFj)*VFi
+ ΣΣ (0.5 * S2Mj / EMj)* VMi 2
+ ΣΣ (0.5 * S2lj / Elj)*Vli
The above sums are over i (1,2,3) and j (1,2,3), respectively. Where S’s, E’s, and V’s are defined as:
SFj is the fiber strength, j can be 11, 22, 33, 12, 23, 13.
EFj is the fiber modulus, j can be 11, 22, 33, 12, 23, 13. VFi is the volume corresponding to the failed fiber. SMi is the fiber strength, j can be 11, 22, 33, 12, 23, 13. EMi is the fiber modulus, j can be 11, 22, 33, 12, 23, 13. VMi is the volume corresponding to the failed matrix. Slj is the fiber strength, j can be 11, 22, 33, 12, 23, 13. Elj is the fiber modulus, j can be 11, 22, 33, 12, 23, 13. Vli is the volume corresponding to the failed interface.
Therefore, damage energy release rate is defined as:
DERR = Incremental Damage Energy / Incremental Damage Volume Strain Energy Damage Rate (SEDR)
In formal fracture mechanics methods the change in the strain energy with damage is an importantparameter. Computation of the damage energy expended, UD, is based on summation of the local strengths of the exhausted failure modes. The incremental strain energy can be computed by
( )DamageEnergy S E Vj j iji
= ∑∑ 0 5 2. /
Page 16 of 31FRACTURE MECANICS OF METALS, COMPOSITES, WELDS,
5/7/2002http://www.alphastarcorp-genoa.com/Durability.htm

subtracting the expended incremental damage energy from the incremental work done by externalforces, or dU=dW-dUD. The SEDR would be defined as dU/dvD.
Equivalent far field stress σe
In linear elastic fracture mechanics (LEFM), the fracture toughness is related to the crack openinglength, a, and the magnitude of far field stress through critical crack length, a, (see chapter 2) as:
Kcr = f(a/w)σ √ π a. 3
The far field stress is the component of normal stress perpendicular to the crack and the quantity of f(a/w) is the correction factor. For homogeneous materials, crack extension is perpendicular to thedirection of maximum normal stress (except when the direction of crack growth is modified by boundaryconditions). However, for fiber composites, the direction of crack propagation depends on thecomposite lay-up as well as the direction of stress. Also the orientation of far field stress may be different than the orientation of stress at the fractured node. Under the circumstances, the average in-plane normal stress in the composite laminate may be an acceptable substitute for the equivalent farfield stress σe. the quantity σe is therefore computed as the average of σx and σy in plane normal stresses of all nodes of the composite structure.
The length of crack opening (a) The LEFM fracture toughness is related to the crack length, a, and the magnitude of far field stress,
σe, or Kcr=σe √πa. Therefore, to directly evaluate an equivalent fracture toughness parameter Ke, GENOA computes the crack extension length, a. When computing the fracture volume, coordinates ofnodes adjacent to a fractured node are determined. The crack extension length, a, is computed as the sum of the distances from the fractured node to the adjacent nodes. Equivalent fracture toughness from DERR or SEDR
This approach presents an alternative method to compute a measure of fracture toughness insteadof Kcr. From LEFM, the relation between the fracture toughness Kcr and the strain energy damage rate
(SEDR) that may be taken equivalent to Ge, is Kcr2=Ge*E, where E is the elastic modulus. The
equivalent SEDR computed by GENOA, Ge, may be assumed as Ge = DERR or Ge = SEDR. This allows evaluation of an equivalent fracture toughness parameter Ke as Ke= √(DERR*Ee) or Ke=√(SEDR*Ee), where Ee is an equivalent elastic modulus obtained by transforming the nodal composite modulus to the direction perpendicular to the crack path. However, since in GENOA cracks open simultaneously in two directions from the fractured node, therefore, Ee may be taken as Eaverage for the fractured node. Evaluation of Elastic Constants
Elastic constants are essential for stress analysis of composites. The stiffness averaging methodthat was developed by [27] is widely used to predict the deformation characteristics of a composite withthree-dimensional reinforcement from the known mechanical properties of its components. However, utility of the stiffness averaging method is limited to the prediction of overall stiffness properties of astructure for elastic analysis. Stiffness averaging does not retain the information on the spatialconfigurations of fiber reinforcements. Therefore, the effects of damage and degradation cannot bedirectly taken into account for a specific ply and the results of structural analysis cannot bedecomposed to the micromechanics level for detailed analysis of damage progression. In the presentprogram the stiffness averaging method and classical laminate theory were combined to predict theproperties for S/RFI composites. For these composite laminates, each ply consists of both in-plane fibers and through-the-thickness stitching or braid fibers. Accordingly, each ply is divided into two sub-
Page 17 of 31FRACTURE MECANICS OF METALS, COMPOSITES, WELDS,
5/7/2002http://www.alphastarcorp-genoa.com/Durability.htm

volumes, one consisting of only in-plane fibers and the other consisting of only stitching fibers. Theproperties of each sub-volume in its local coordinate system are computed from the properties of fiberand matrix, based on composite micromechanics theory, and then transformed to structural directions.The ply properties are obtained by adding the contributions of each sub-volume using the following stiffness averaging equation:
4
where: EC is the composite ply stiffness Vi is the calculated volume of the i-th subvolume N is the number of subvolumes EI is the stiffness for the i-th subvolume Ri is the coordinate transformation matrix for the i-th subvolume After computation of the ply properties from the properties of subvolumes, the properties of the entirestitched laminate are obtained by applying laminate theory as for unstitched composites.
Stitched Simulation Capability GENOA’s verified algorithm for simulating stitched PMC materials was used in the composite
mechanics module (3D PMC) by Alpha STAR to simulate S/RFI materials. The S/RFI composite is divided into a series of unit cells (Figure 11) with both the fiber and stitch segments idealized as linearin the unit cells. The modified PMC3 module computes S/RFI [28] stress limits by adding the orientedcontribution of each stitch to each strength (longitudinal or transverse tension, compression or shear)component by tensor transformations in the absolute value.
Figure 11. Idealized Fiber Stitch Segment in Unit Cell of 3D Braided Composites [29]
Woven Patterns
Xu et al. (1994) [30] provided complete statements of the rather complex sequencing of through-the-thickness yarns. Figure 12 shows the three typical types of weave in woven composites, namely,(a) layer to layer, (b) through the thickness angle interlock, (c) orthogonal interlock weaves.
In woven composites [31], the stuffers and fillers alternate in layers through thickness. The stuffersand fillers form a coarse 0°/90° array shown in Figure 12 for most woven composites. Nevertheless,
[ ] [ ] [ ] [ ]ii
N
i
TiiC RERV
VE ∑
=
=1
1
Z
YX
θ
Fiber yarn segment
Page 18 of 31FRACTURE MECANICS OF METALS, COMPOSITES, WELDS,
5/7/2002http://www.alphastarcorp-genoa.com/Durability.htm

the method allows for arbitrary orientation of stuffers and fillers in the X-Y plane. The through thethickness reinforcement, or warp weavers, may be oriented in any direction with reference to the 3Dcomposite coordinate axes. Stitched composites may be modeled by stitch fibers that are orientedperpendicular to the X-Y plane and parallel to the Z-axis of the composite.
Fiber Arrangement Complete understanding of arrangement of fibers, including stuffer,
Figure 12. Schematics of (A) Layer-to-layer Angle Interlock, (B) Through-the- Thickness Angle Interlock,
and (C) Orthogonal Interlock Weaves.
filler, and warp weaver fibers, is essential to predict the engineering properties accurately. Wovencomposites are typically composed of ns layers of stuffers and ns+1 layers of fillers through the thickness as shown in Figure 13.
In order to estimate the elastic properties of 3-D woven composites, an approach based on modified laminate theory and orientation averaging is used. First of all, composites are divided into pliesso that every ply contains either stuffer or filler fibers as shown in Figure 14. Since the weaver fibers gothrough the entire thickness, each ply must contain some weaver fibers for woven composites.
For orientation averaging, a three-dimensional fiber arrangement can be considered as composed of two types of structures. The baseline structure formed by fibers in X-Y plane direction, such as stuffer fibers and filler fibers, and the interwoven or braided structure composed of warp weaver fibersthat penetrate the thickness of composites. Therefore each ply contains two types of domains, theprimary domains which consist of baseline fibers, and the weaver domains which consist of weaverfibers, the occupying volume fractions of these domains are denoted by and respectively. Each domain is characterized by an orientation along which the fibers within it are presumed to lie. All of the
Surface warp weaverBody warp weaver
Filler(Weft)StufferWarp weaver
(a)
(b)
(c)
Figure 13. Representative Layer Sequence of Fillers and Stuffers Through the Thickness, With the Layer Thickness Tf, and Ts For the Case Shown, ps =2
x
filler
filler
filler
stuffer
stuffer
z
t
ts
tf
z1
z2
z3
Figure 14. Schematic of Ply Division in 3D Woven Composite
filler
Stuffer
filler
x
z
y
Plies
Fi 3 11 S h ti f Pl Di i i i 3D W
f p fw
Page 19 of 31FRACTURE MECANICS OF METALS, COMPOSITES, WELDS,
5/7/2002http://www.alphastarcorp-genoa.com/Durability.htm

fibers in the primary domains are assumed to be parallel to X-Y plane and each ply can consist of the primary fibers in the same direction. Warp weaver fibers are assumed to be piecewise straight andtheir orientations are defined by the directional angles to the X,Y, and Z axes.
Let denote the stiffness matrix for domain . Based on orientation averaging method, the composite stiffness matrix of 3-D woven composite can be predicted by the following equation:
5
where denotes transformed from domain α material coordinate system into the composite coordinate system and fα denotes volume fraction of domain α.
Finite Element Analysis in PFA After the micromechanics analysis module generates the elastic properties for a composite (Figure
7), the finite element analysis module is called to analyze the structural response. In general, the type of finite element model used depends on the complexity of the structure and the availability of computerresources. There are two possible choices for the analysis of composite structures. One is using anisotropic three-dimensional solid elements such as hexahedral or brick elements that accept thecomputed three dimensional composite properties directly. However, the modeling of a practical composite structure with three-dimensional brick elements is usually impractical because it requireshuge computer resources. The second option is to use anisotropic shell elements that use thecomposite plate/shell element properties. The use of anisotropic plate or shell elements to representthrough-the-thickness properties of the woven/braided/stitched composite is more efficientcomputationally than using three-dimensional elements. Therefore, implementation was focussed onthe use of plate/shell elements for finite element modeling. The finite element module accepts the force-deformation relations computed by the composite mechanics module, and carries out a stressanalysis to generate the generalized membrane, bending and out-of-plane shear stresses, namely Nx, Ny, Nxy, Mx, My, Mxy, Qxz, Qyz for each node. The generalized stresses are supplied back to thecomposite mechanics module for the computation of local ply/stitch stresses and failure analysis.
Simulation of Damage Progression After each finite element stress analysis, failure criteria are used to evaluate possible failure within
each sub-volume of each ply at each node of the composite structure. Once the damage modes at each node are determined, a damage index is created to record the damage information for eachnode. The damage index contains the node number, the ply number, and the list of damage criteriathat have become activated. When a new failure occurs at a sub-volume, the damage index is updated accordingly. The properties of each node-domain are degraded according to the nodal damage index.
If there is no damage after a load increment, the structure is considered to be in equilibrium and anadditional load increment is applied. If damage occurs or escalates, the composite properties affected by the damage are degraded, the computational model is reconstituted with an updated finite elementmesh and material properties, and the structure is reanalyzed under the same load increment. Afterreanalyzing, if there is any additional damage, the properties are degraded further and the structure isreanalyzed. This cycle continues until no further damage occurs.
The damage progression module keeps a detailed account of composite degradation for the entirestructure. It also acts as the master executive module that directs the composite mechanics module toperform micromechanics and macromechanics analysis and synthesis functions, and calls the finite element module with thick shell analysis capability to model woven/braided/stitched laminatedcomposites for global structural response.
Realization of PFA required verification of the software system with experimental test results of fiber
[ ]( )E α α[ ]EC
[ ] [ ]E f EC =∑ αα
α
~( )
[ ~ ]( )E a [ ]( )E α
Page 20 of 31FRACTURE MECANICS OF METALS, COMPOSITES, WELDS,
5/7/2002http://www.alphastarcorp-genoa.com/Durability.htm
reinforced composite primary structures. This was recently accomplished by Alpha STAR with keyindustry partners in the major aerospace composite programs.
Methodology of Mesh Refinement in Progressive Failure Analysis
Mesh refinement for PFA software was conducted to improve simulation accuracy. In order to avoidunduly increasing FEM computation time, a simulation was begun with a computation time savingcoarse FEM mesh that was subsequently refined in only those regions delineated by elementsconnected to damaged nodes. Thus, when nodes suffer damage according to the damage criteria,those elements connected to the damaged nodes are refined generating smaller elements to representthe damage regions. When all modes of composite resistance fail at a node, that node is deleted andnew detached nodes are created at the same point. The number of new nodes created in place of deleted node is equal to the number of elements that connected to the deleted node. This approachallows tracking growth without loss of accuracy due to improper meshing.
Two approaches to mesh refinement were used in modification of PFA. In one approach each element connected to a damaged node is divided into five elements in place of the original element. In the second approach each element connected to a damaged node is divided into three elements inplace of the original element. In either approach if any node connected to newly generated elements isdamaged, those elements are further refined. This process is continued until final fracture occurs. Simulation of Reshaping Braided Fiber Preforms to Assist Manufacturing
Simulation of novel, emerging manufacturing method of reshaping braided tubular preform, wasdeveloped as extension to PFA to provide a link between the computer generated knowledge base,analysis software and automated machine tools. The method is based on a braided preform of commingled thermoplastic yarns in the form of a tublar preform that is made to conform to a net shapedmandrel. This very promising, economical process of generating shaped fiber preforms for compositesinvolves three steps: 1) braiding a simple, commingled fiber tubular preform, 2) reshaping the preformover a mandrel of a desired shape, and 3) processing (heating) the reshaped preform to flow the resinmatrix material around the high strength fibers. For a rational design, it is necessary to predict 1) fiberorientations and volume fraction changes, 2) the necessary forces/strain to best fit onto a shapedmandrel, and 3) occurrences of failure (buckling, fiber wrinkling) in the preform after shaping. Adurability and damage tolerance analysis was conducted to demonstrate the importance of the fiberangle change tracking [32]. Since the reshaping operation can significantly change fiber orientations, itbecomes critical to evaluate the extent of this change, its effect on composite performance, and theextent to which the changes can be negated by adjusting the braid angles of the tubular textilepreform. The software allows attainment of the best preform net fit to a desired shape without incurringbuckling and fiber wrinkling/crimping. The method of approach is by: 1) iterative FEM analysis utilizingcomposite micromechanics; 2) prediction of the effects of changes of braid/weave angle on compositemicromechanical properties; and 3) use of an iterative contact algorithm for analysis of preformconformance to a shaped tool.
The simulation of a simple automation process to get a bent mandrel starts with a strait mandrel isprogressively bent using small enough steps to keep stability so that no user intervention is required(apart from fixing the step-sizes). Figure 15 shows an example of such a process for a bent cone. Theboundary conditions between two steps are equivalent, whether normal loads or normal displacementsare used. This process has been evaluated using experimental test results provided by GE The preform reshaping simulation tool was developed by Alpha STAR in support of the NASA funded ASTGE project and verified against experimental GE results of reshaping preforms for conical bent andelliptical components.
Page 21 of 31FRACTURE MECANICS OF METALS, COMPOSITES, WELDS,
5/7/2002http://www.alphastarcorp-genoa.com/Durability.htm

Figure 15. Automatic Fitting Of the Bent Cone Fitting Preform
The GENOA code has provided the needed capabilities for the fiber preform reshaping process forlarge, complex, PMC components. This effort has been verified to simulate reshaping of tubular fibertextile preforms (e.g, GE90 Turbine blade, bent cone, cylinder, bent cylinder) in a cooperativeexploratory effort with General Electric Aircraft Engine. The Sandia National Laboratory 26 ft long and 4 ft wide Windmill best fit simulation has been verified against actual hardware developed byGoldsworthy Associates to be within four percent of the actual measured data by simulating use ofmultiple reshaped preforms of different sizes with commingled fibers.
Probabilistic Failure Analysis Alpha STAR has developed GENPAM, a computer software for probabilistic composite structural
analysis that integrates probabilistic methods, finite element methods, and composite mechanics. The software has been integrated as part of the GENOA suite of codes [33]. Available probabilistic methods include: 1) Monte Carlo Simulation (MCS), 2) advanced reliability algorithms and 3)importance sampling methods. MCS, traditionally used for reliability assessment, is deemedcomputationally too expensive for large structures or structures with complex behaviors. Extensive effort has been devoted to development of new, more computationally economic probabilisticalgorithms for advanced reliability and importance sampling methods in the GENPAM program are adirect result of ten years of probabilistic structural analysis research funded by NASA.
The GENPAM code is constructed such that any real value in the input file of the progressivefailure deterministic analysis can be selected as a random variable (Table 6). An interface module was developed that can interface with any deterministic code as long as the uncertainties are one of the realvalues shown on the original deterministic input file. Integration with many commercial or in-house computer codes becomes transparent. Thus, integration effort is minimized and simplified. Variousresponses can be selected to be analyzed probabilistically, CDF/PDF functions and sensitivities todesign random variables. The types of responses that can be specified are: 1) Type 1: Displacementresponses specified by setting node numbers and the degree-of-freedom direction numbers, and 2) Type 2: Material responses specified by setting node number, layer number, and the 20 materialproperties and their combinations. The 20 material properties/responses that can be extracted for each ply node are the following [34, 35]:
Table 6. Geometrical and Material Uncertainties Considered In GENOA
Probabilistic Evaluation of Composite Damage Propagation
a) Fitting on Straight Mandrel
0 5 10 15 20 25 30 35 40 45V1
0
5
10
15
20
25
30
35
40
45
V2
(b) Intermediate Steps
0 5 10 15 20 25 30 35 40 45V1
0
5
10
15
20
25
30
35
40
45
V2
(c) Final Shape
0 5 10 15 20 25 30 35 40 45V1
0
5
10
15
20
25
30
35
40
45
V2
1. Longitudinal strain 11. Transverse strain2. In plane shear strain 12. Longitudinal stress3. Transverse stress 13. In plane shear stress4. Longitudinal tensile strength 14. Longitudinal compressive strength5. Transverse tensile strength 15. Transverse compressive strength6. In plane shear strength 16. MDE failure criterion7. Hoffman’s failure criterion 17. Interply delamination failure criterion8. Fiber crushing criterion (compressive
strength) 18. Delamination criterion (compressive
strength)9. Fiber microbuckling criterion
(compressive strength) 19. Longitudinal normal shear stress
10. Transverse normal shear stress 20. Transverse normal shear strength
Page 22 of 31FRACTURE MECANICS OF METALS, COMPOSITES, WELDS,
5/7/2002http://www.alphastarcorp-genoa.com/Durability.htm

The objective is probabilistically assessing the effect of design variable uncertainties on structuralresponse and residual strength after damage and fracture. The methods and corresponding computer codes are applicable to the uncertainty in the material properties, fabrication parameters, geometry,boundary conditions, and loads acting on composite structures. For a probabilistic evaluation of damage and fracture progression, an integrated probabilistic analysis code is used in conjunction withprogressive damage simulation. The probabilistic analysis code considers the uncertainties in materialproperties as well as in the composite fabrication process and global structural parameters. The effects on the fracture of the structure of uncertainties in all the relevant design variables are quantified. Thecomposite mechanics, finite element structural simulation, and Fast Probability Integrator (FPI) havebeen integrated into the probabilistic analysis code. FPI, contrary to the traditional Monte Carlo Simulation, makes it possible to achieve orders-of-magnitude computational efficiencies that make probabilistic analysis acceptable for practical applications. Therefore, a probabilistic composite assessment becomes feasible which cannot be done traditionally, especially for composite materialsand structures that have a large number of uncertain variables. A probabilistic analysis cycle starts with defining uncertainties in material properties at the most fundamental composite scale, i.e., fiber/matrixconstituents. The uncertainties are progressively propagated to those at higher composite scalessubply, ply, laminate, and structural. The uncertainties in fabrication variables are carried through thesame hierarchy. The damaged/ fractured structure and ranges of uncertainties in design variables,such as material behavior, structure geometry, supports, and loading are input to the probabilisticanalysis module. Consequently, probability density functions (PDF) and cumulative distributionfunctions (CDF) can be obtained at the various composite scales for the structure response. Sensitivities of various design variables to structure response are also obtained. Input data for probabilistic analysis is generated from the degraded composite model available as progressivedamage and fracture stages are monitored. Additionally, the design variables with probabilistically defined uncertainties and the response parameters that are to be analyzed probabilistically are userselectable. Composite Structural Analysis and Input and Output
The fundamental categories of composite structural analysis available in computational simulationare: 1) static loading, 2) low-cycle fatigue loading, 3) high-cycle fatigue loading, 4) random power spectral density fatigue loading, 5) impact loading, 6) creep loading, and 7) probabilistic evaluation ofcomposite damage propagation. Requirements of input data have both common and distinct featuresfor each category of structural analysis. The common features of input data are associated with thedefinition of composite laminate structure, the finite element model, and the boundary conditions. The laminate structure is defined in the input data by entering the ply schedule, use and cure temperatures,moisture content, fiber angles, ply thickness, fiber and matrix constituent code words identifyingdatabank properties, fiber volume ratio, void volume ratio, out-of-plane fiber tow ratios and material types, if any.
The finite element model is defined by entering nodal coordinates and laminate type identifier foreach node, and the element connectivities. The local nodal coordinate systems are defined by thefinite element code such that the local z axis is in the normal direction of the laminate. The local y axis is defined from the cross-product of the local z and global x axes. The local x axis is defined from the cross-product of the local y and local z axes. The boundary conditions are defined by entering thenode number and the degree of freedom direction number corresponding to a displacement boundaryrestraint. Uniform displacement requirements are implemented by duplicate node constraints thatcombine the degrees of freedom of two or more nodes. The distinct input requirements and corresponding output results from each type of analysis are as follows: Composite Analysis under Static Loading
The input data for static analysis must define the loading. Concentrated forces are defined at nodes and corresponding to the degree-of-freedom directions in which they act. Pressures may be applied on the upper and lower surfaces of Mindlin type thick shell finite elements. Applied pressures
Page 23 of 31FRACTURE MECANICS OF METALS, COMPOSITES, WELDS,
5/7/2002http://www.alphastarcorp-genoa.com/Durability.htm

are defined as positive if they act on the upper surface of the laminate (upper surface of thelaminate is that penetrated by the positive local z axis). Pressures applied on the lower surface are input as negative. Forces and pressures are gradually increased by the progressive fracture analysiscode as local damage modes are evaluated and tracked. If the initially applied forces and pressures are greater than those corresponding to damage initiation, they are reduced to a lower level to enablegradual damage tracking. Computational simulation is carried out using an incremental loadingiterative approach. The load incrementation rate is controlled by two user supplied parameters thatspecify the maximum number of nodes allowed to sustain damage and the maximum number of nodesallowed to experience through-the-thickness fracture during a single iteration. The output from static analysis includes laminate through-the-thickness stress resultants, laminate surface strains, ply level stresses, constituent level microstresses, and the progression of damagecharacterized by the damage index, as a function of loading, at each ply of each node. The output data can be processed by a graphical user interface (GUI). Stress and damage parameters can be plotted on the finite element model for quick and effective visualization of structural damage locations. Composite Analysis under Low-Cycle Fatigue Loading
Low-cycle fatigue loading is defined as a cyclic loading with a maximum load that is below the staticultimate structural failure load. Cyclic loads are usually applied slowly such that inertial effects are notimportant. An example of low-cycle fatigue loading is represented by pressurization-depressurization cycles of an aircraft fuselage. Each cycle of a low-cycle fatigue loading is applied as a static loading. A cyclic degradation coefficient β is required as an input parameter to characterize the degradation of theanalyzed composite parts. Computational simulation under low-cycle fatigue repeats the same load amplitude, but increases the number of load cycles until damage initiation, progression, and ultimatefailure stages are simulated. Cyclic loading degradation is evaluated by the composite mechanicsmodule. Cyclic loads are superimposed over static, thermal, and hygral loads. Static ply strengths in the longitudinal tensile/compressive, transverse tensile/compressive, and shear components aredegraded due to changes in temperature, moisture, and also with the number of cycles, according tothe cyclic degradation coefficient. The cyclic ply strength degradation factor is computed as F=1-β log N. Cyclic load ratios are defined at each node as the ratio of actual local load magnitude to that whichwould cause a ply stress to reach its limit. For each ply of each node cyclic load ratios are computedfor Nxx, Nyy, Nxy, Mxx, Myy, and Mxy loads with regard to the upper and lower limits of σ11, σ22, and σ12stresses. For each stress limit, the static load ratio and the six cyclic load ratios are added to obtain thesum of load ratios. If the sum of load ratios is greater than 1.0 in absolute value, failure is predicted. The failure mode is determined according to the ply stress limit that is exceeded by the load ratio sumthat is greater than one.
Cyclic load amplitudes are defined at nodes and corresponding to the degree-of-freedom directions in which they are acting. Nonzero average stresses are modeled by superimposing a static load over acyclic load. Cyclic pressure loads may also be applied on the upper and lower surfaces of finiteelements. Under cyclic fatigue simulation, force and pressure amplitudes are kept constant but thenumber of cycles is increased by the progressive fracture analysis code as local damage modes areevaluated and tracked. Computational simulation is carried out by incrementing the number of loadingcycles. The output from cyclic analysis includes laminate through-the-thickness stress resultants, laminate surface strains, ply level stresses, constituent level microstresses, and the progression ofdamage characterized by the damage index, as a function of the number of cycles, at each ply of eachnode. The output data can be processed by a graphical user interface (GUI). Stress and damage parameters can be plotted on the finite element model for quick and effective visualization of structuraldamage locations. Composite Analysis under High-Cycle Fatigue Loading
High-cycle fatigue loading is defined as a cyclic loading with a maximum load that is much belowthe static ultimate structural failure load. Cyclic loads are usually applied dynamically such that inertialeffects are important. An example of high-cycle fatigue loading is the dynamic loading cycles applied
Page 24 of 31FRACTURE MECANICS OF METALS, COMPOSITES, WELDS,
5/7/2002http://www.alphastarcorp-genoa.com/Durability.htm

on a composite airfoil due to base accelerations or harmonic pressures produced by an acousticenvironment. A cyclic degradation coefficient β is required as an input parameter to characterize thedegradation of the analyzed composite material. Computational simulation under high-cycle fatigue requires the input definition of harmonic loads. The computational simulation cycle begins with thedefinition of constituent properties from a materials databank. The composite mechanics module is called before and after each finite element time-history analysis. Prior to each finite element analysis, the composite mechanics module computes the composite properties from the fiber and matrixconstituent characteristics and the composite layup. The finite element analysis module accepts the composite properties that are computed by the composite mechanics code at each node and performsa time-history dynamic structural analysis for a time increment. After a finite element analysis, the computed generalized nodal force and moment time histories are supplied to the composite analysismodule that evaluates the nature and amount of local damage, if any, in the plies of the compositelaminate. The evaluation of local damage due to cyclic loading is based on simplified mathematicalmodels embedded in the composite mechanics module. The step of the simulation process is shown in Figure 16.
The fundamental assumptions in the development of these models are the following: (1) Fatigue
degrades all ply strengths at approximately the same rate. (2) All types of fatigue degrade laminate strength linearly on a semilog plot including: (a) mechanical (tension, compression, shear, andbending); (b) thermal (elevated to cryogenic temperature); hygral (moisture); and combinations(mechanical, thermal, hygral, and reverse-tension compression). (3) Laminated composites generallyexhibit linear behavior to initial damage under uniaxial and combined loading. (4) All ply stresses (mechanical, thermal, and hygral) are predictable by using linear laminate theory.
Individual ply failure modes are assessed by using margins of safety computed by the compositemechanics module via superposition of the six cyclic load ratios. The cyclic loads that are considered are the Nxx, Nyy, Nxy, in-plane loads and Mxx, Myy, and Mxy flexural moments. The lower and upper limits of the cyclic loads, the number of cycles, and the cyclic degradation coefficient β are supplied to the composite mechanics module at each node for the computation of a complete failure analysisbased on the maximum stress criteria. The cyclic degradation coefficient β has been determined to be in the range of 0.01 to 0.02 for graphite/epoxy composites. Time-history dynamic analysis of composite structures subjected to cyclic excitation are conducted using the modal basis. Computed nodal stress resultant time-histories are used to assess the maximum and minimum values of the local load cyclesand frequencies at each node. The composite mechanics module with cyclic load analysis capabilityevaluates the local composite response at each node subjected to fluctuating stress resultants. The number of cycles and the time required to induce local structural damage are evaluated at each node. After damage initiation, composite properties are reevaluated based on degraded ply properties and theoverall structural response parameters are recomputed. Iterative application of this computational procedure results in the tracking of progressive damage in the composite structure subjected to cyclicload increments. Computational simulation cycles are continued until the composite structure fractures. The number of cycles for damage initiation and the number of cycles for structural fractureare identified in each simulation. After damage initiation, when the number of load cycles reaches acritical level, damage begins to propagate rapidly in the composite structure. After the critical damage propagation stage is reached, the composite structure experiences excessive damage or fracture thatrenders it unsafe for continued use.
Figure 16. Low/high Cycle Fatigue Process
Figure 17. Random Fatigue Process
FINITE ELEMENTMODULE
COMPOSITEMODULE
PSD BLOCK
MEAN SQUARE STRESS
UPPER, LOWER STRESSES, PERIOD
Page 25 of 31FRACTURE MECANICS OF METALS, COMPOSITES, WELDS,
5/7/2002http://www.alphastarcorp-genoa.com/Durability.htm

The generalized stress-strain relationships are revised locally according to the composite damage
evaluated after each finite element time-history analysis. The model is automatically updated with a new finite element mesh having reconstituted properties, and the structure is reanalyzed for furtherdeformation and damage. If there is no damage after a cyclic load increment, the structure isconsidered to be in equilibrium and an additional number of cycles are applied leading to possibledamage growth, accumulation, or propagation. Simulation under cyclic loading is continued untilstructural fracture.
In general, overall structural damage may include individual ply damage and also through-the-thickness fracture of the composite laminate. The computational simulation procedure uses anaccuracy criterion based on the allowable maximum number of damaged and fractured nodes within asimulation cycle. If too many nodes are damaged or fractured in the simulation cycle, the number ofcycles are reduced and analysis is restarted from the previous equilibrium state. Otherwise, if there is an acceptable amount of incremental damage, the number of cycles is kept constant but theconstitutive properties are updated to account for the damage from the last simulation cycle. After a valid simulation cycle in which composite structural degradation is simulated with or withoutdamage or fracture, the structure is reanalyzed for further damage and deformation. When there is no indication of further damage under a load, the structure is considered to have endured the previously applied cyclic loading. Subsequently, additional sets of cyclic loads are applied leading to possibledamage growth, accumulation, or propagation. Analysis is stopped when global structural fracture ispredicted.
The type of damage growth and the sequence of damage progression depend on the compositestructure, loading, material properties, and hygrothermal conditions. A scalar damage variable, derived from the total volume of the structure affected by various damage mechanisms is also computed as anindicator of the level of overall damage induced by loading. This damage variable is useful for assessing the overall degradation of a given structure under a prescribed loading condition. The rate of overall damage growth during damage progression may be used to evaluate the propensity of structuralfracture with increasing loading.
Under high-cycle fatigue dynamic force and pressure amplitudes are kept constant but the duration of loading is increased by the progressive fracture analysis code as local damage modes are evaluatedand tracked. The output from cyclic analysis includes laminate through-the-thickness stress resultants, laminate surface strains, ply level stresses, constituent level stresses, and the progression of damagecharacterized by the damage index, at each ply of each node. The output data can be processed by a graphical user interface (GUI). Stress and damage parameters can be plotted on the finite elementmodel for visualization of stress concentrations and structural damage locations. Random Power Spectral Density Fatigue Loading
Fatigue under power spectral density (PSD) loading is defined as a random cyclic loading withvarying frequency content. PSD fatigue loads are defined as forces, pressures, or accelerations. The input data file defines the load/acceleration levels corresponding to the considered frequency ranges. The loads are applied dynamically such that inertial effects are taken into account. Structural analysis is carried out in the frequency domain by the finite element code via superposition of the componentharmonic analyses. Results are numerically integrated in the frequency domain. The finite element results consist of the mean-square stress resultants at nodal points. The PSD module determines the dominant frequencies in the mean-square response and interprets the results as equivalent nodal cyclicloads for durability analysis. An example of PSD random fatigue loading is the dynamic shaking of acomposite airfoil due to base accelerations. Computational damage tracking under PSD fatigue loadingfollows closely the methods used under high-cycle fatigue evaluations. The step of the simulationprocess is shown in Figure 17.
Composite Analysis under Impact Loading
Page 26 of 31FRACTURE MECANICS OF METALS, COMPOSITES, WELDS,
5/7/2002http://www.alphastarcorp-genoa.com/Durability.htm

GENOA progressive failure analysis software is able to simulate composite structures under impact
and compression after impact (CAI) loading. Simulation extends to the prediction/verification under theimpact loading of impact load versus time, damage, and fracture pattern of a composite sandwich foamstructure and prediction/verification of damage pattern, residual strength under CAI loading. An example is composite foam sandwich specimen under impact and CAI. A composite foam core sandwich panel (Skin: G30-500/R3676, adhesive; FM-300, foam core: Rohacel 200WF), was simulated [36]. GENOA progressive failure analysis was used to predict the impact process, the impact damage(Figure 18), and subsequent damage propagation in the panel under pure compressive load. Theimpact test showed that the foam core in the middle of the panel was damaged over a 5x5-inch area by the impact. No impact damage occurred in the skin surface. Simulation results were compared with experimental impact and subsequent test in compression. The post impact evaluation showed the presence of minimal damage on the skin, and core. The post CAI evaluation showed crippling effect and the separation of skin from the core on the lower skin for both test and simulation.
Input data for simulation under impact loading requires the definition of the initial velocity and massof the impacting object, finite element model of the impacting object, as well as that of the impactedcomposite structure. Analysis options include (1) dynamic analysis including inertial effects both in theimpacted composite structure and the impacting object and (2) pseudo-static analysis where only the
Figure 18. Comparison of the Fracture Pattern between test and simulation
inertial forces of the impacting object are considered. Simulation is based on an energy balance approach where the reduction of kinetic energy of the impacting object is balanced by the work done bythe impacting force. Impact energy is imparted to the composite structure as strain energy, kinetic energy, and damage energy. Results include local damage in the composite structure, stresses, displacements, and velocities with time from the initiation of impact. Composite Analysis under Creep Loading
Creep rupture effects are important for ceramic matrix composites (CMC) at elevated temperaturesunder tensile stresses. Creep effects are evaluated by considering the effects of time exposure tostresses. Semi-empirical multi-factor interaction strength degradation with time model is used to quantify the creep rupture response of composite structures. A refined composite mechanics module based on fiber substructuring is used for the simulation of CMC structures. Figure 19 shows the unitcell and also it’s slice by slice representation.. The CMC module is based on software developed tospecifically simulate aspects unique to ceramic matrix composites. It incorporates a fiber substructuringtechnique that provides: 1) accurate micromechanical representation of interfacial conditions, botharound the fiber and through-the-thickness properties, and 2) greater detail of stress distribution withina ply. This module generates the properties (A, B, D
Experimental Pattern (5 by 5)
Simulated Fracture Pattern (5 by 5)
Page 27 of 31FRACTURE MECANICS OF METALS, COMPOSITES, WELDS,
5/7/2002http://www.alphastarcorp-genoa.com/Durability.htm

Figure 19. Ceramic Matix Composite Unit Cell Representation matrix) of ceramic matrix composites from properties of the constituents (fiber, matrix, and fiber-matrix interface). The generated structural properties are used in the FEM module. CMC module can also beused to determine constituent level stresses, such as fiber, matrix and interface stresses. The FEM module performs finite element analysis to determine the generalized stresses over the entire ceramiccomposite structure. These generalized stresses are referred back to the CMC module for iterativedeterminations of composite microstresses.
The PFA module keeps a detailed account of composite degradation over the entire structure andalso acts as an executive control module to direct the CMC module to perform micromechanics,macromechanics, and structural property synthesis functions. The damage progression module alsocalls FEM module with anisotropic thick shell analysis capability to model laminated composites forglobal structural response. After each finite element analysis, the CMC module is called to computeconstituent stresses. These stresses are compared to failure criteria for evaluation of possible fiber,matrix, and interface failure in each ply at each node of the ceramic composite structure. Once the stateof damage at each node is assessed, a damage index is created to record the damage information ateach damaged node. The damage index contains the node number, the ply number, and the list ofdamage criteria that have become activated. Fibers, matrices, and interfaces are each assigned theirown damage index to record the corresponding damage information. When a new failure occurs in afiber, matrix, and interface, its damage index is updated. The properties of fibers, matrices andinterfaces are degraded according to their damage index. For example, if a fiber is damaged due tolongitudinal tensile failure criteria, its corresponding modulus (E11) is degraded to almost zero. Conclusions
From the general perspective of the integrated computational evaluation method, the followingconclusions are drawn: 1) The assessment and design of fiber composite structures may be improvedby an evaluation of the composite damage initiation and damage propagation mechanisms. 2) Ingeneral, composite structures demand a detailed understanding of the stress states and materialdegradation characteristics for effective design. 3) Computational simulation, with the use ofestablished composite mechanics and finite element methods, can be used to simulate the variousstages of degradation in a composite structure, such as damage initiation, damage growth, damageaccumulation, damage propagation, and structural fracture. 4) Computational simulation is based onconstituent level material properties. However, even if the fiber and matrix properties are not explicitlydefined, they can be determined from the given composite ply properties using a system identificationprocedure. 5) Significant design parameters such as composite constituent stiffness, strength, andeffective ply configurations may be identified with the help of a composite mechanics module andcomputational simulation. 6) The progressive damage tracking procedure is flexible and applicable toall types of constituent materials, structural geometry, and loading. Hybrid composites andhomogeneous materials, as well as binary composites can be simulated. 7) The present computationalsimulation procedure provides a new general methodology to investigate damage propagation andprogressive fracture for any structure.
Page 28 of 31FRACTURE MECANICS OF METALS, COMPOSITES, WELDS,
5/7/2002http://www.alphastarcorp-genoa.com/Durability.htm

References 1) Chamis, C.C. (1969), Minnetyan, L., “Progressive Fracture of Polymer Matrix Composite Structure
a New Approach’’ 14th Annual Energy-Source Technology Conference and Exhibition, HoustonTexas, January 1992.
2) Darwin Moon, Frank Abdi, Alpha Bill Davis,. Discrete Source Damage Tolerance evaluation of
s/RFI stiffened panels, {Sampe 99}, Long Beach, Ca, May 1999 3) Cox, B. N, Flanegan, G., “Handbook of Analytical Methods for Textile Composites Binary Model
Of Textile Composites,” Rockwell Science Center, Version 1, January, 1996. 4) Damage-Tolerance and Fatigue Evaluation of Structure, Advisory Circular 25.571-1A, Federal
Aviation Administration, Washington, DC, 1986. 5) Composite Aircraft Structure, Advisory Circular 20-107A, Federal Aviation Administration,
Washington, DC, 1984. 6) Minnetyan, L., Murthy, P.L.N., and Chamis, C.C., “Composite Structure Global Fracture
Toughness via Computational Simulation,” Computers & Structures, Vol. 37, No. 2, pp.175-180, November 1990.
7) Irvine T. B. and Ginty C.A., “Progressive Fracture of Fiber Composites,” Journal of Composite
Materials, Vol. 20, March 1986, pp. 166-184. 8) Minnetyan L., Chamis C.C., and Murthy P.L.N., “Structural Behavior of Composites with
Progressive Fracture,” Journal of Reinforced Plastics and Composites, Vol. 11, No. 4, April 1992, pp. 413-442.
9) Minnetyan L., Murthy P.L.N., and Chamis C.C., “Progressive Fracture in Composites Subjected to
Hygrothermal Environment,” International Journal of Damage Mechanics, Vol. 1, No. 1, January1992, pp. 60-79.
10) Minnetyan, L., Chamis, C. C., and Murthy, P. L. N., “Structural Durability of a Composite Pressure
Vessel,” Journal of Reinforced Plastics and Composites, Vol. 11, No. 11, November 1992, pp.1251-1269.
11) Minnetyan, L., and Chamis, C.C., “Pressure Vessel Fracture Simulation,” Presented at the ASTM
25th National Symposium on Fracture Mechanics, Lehigh University, Bethlehem, Pennsylvania,June 28-July 1, 1993, Published in ASTM STP 1220, Fracture Mechanics: 25th Volume, August1995, pp. 671-684.
12) Minnetyan, L., Rivers, J. M., Chamis, C. C., and Murthy, P. L. N., “Discontinuously Stiffened
Composite Panel under Compressive Loading,” Journal of Reinforced Plastics and Composites, Vol. 14, No. 1, January 1995, pp. 85-98.
13) Minnetyan, L., and Chamis, C. C. 1997. “Progressive fracture of composite cylindrical shells
subjected to external pressure.” ASTM J. Compos. Technol. and Res., 1 9(2), 65-71. 14) Chamis, C.C. (1969) “Failure Criteria for Filamentary Composites,’’ Composite Materials Testing
and Design: ASTM STP 460, American Society for Testing and Materials, Philadelphia, pp 336-351.
Page 29 of 31FRACTURE MECANICS OF METALS, COMPOSITES, WELDS,
5/7/2002http://www.alphastarcorp-genoa.com/Durability.htm

15) Chou, T, W, Ko, F. K, “Textile Structural Composites,” Elsevier, 1989, pp. 16. 16) Minnetyan, L., Murthy, P.L.N. and Chamis, C. C. 1992. “Progressive Fracture in Composites
Subjected to Hygrothermal Environment,” International Journal of Damage Mechanics, Vol. 1, No.1, pp69-70.
17) Cox, B. N, Carter, W. C, and Fleck, N. A., “A Binary Model Of Textile Composites Formulation,”
Acta Metall. Mater, Vol, 42, No. 10 pp. 3463-3479, 1994. 18) Hallquist, J. O, Whirley, R. G., “DYNA3D User’s Manual,” November, 1982. 19) F. Abdi, R. Lorenz., Hadian, J., “Progressive Fracture of Braided Composite Turbomachinery
Structures,” NASA SBIR Phase I Report No. NAS3-27334, 1996. 20) F. Abdi, Minnetyan, L., “Progressive Fracture of Braided Composite Turbomachinery Structures,”
NASA SBIR Phase II Report No. NAS3-97041, 1999. 21) Murthy, P. L. N., and Chamis, C. C. (1986). “Integrated composite analyzer (ICAN): Users and
programmers manual.” NASA Tech. Paper 2515, Nat. Aeronautics and Space Admin.,Washington, D. C.
22) Starnes, J. H, and Britt, V. O, Rankin, C. C. “Nonlinear Response of Damaged Stiffened Shells
subjected to Combined Internal Pressure and Mechanical Loads” AIAA 951462-CP. 23) Nakazawa, S. “The MHOST Finite Element Program, 3-D Inelastic Analysis Methods for Hot
Section Components,” Volume I – Theoretical Manual, NASA Contract Report CR-182205, August, 1991.
24) Murthy, P.L.N., Chamis, C.C. 1986. “Integrated Composite Analyzer (ICAN): Users and
Programmer's Manual,” NASA Technical Paper 2515, 1986. 25) B. N. Cox, “Failure Models For Textile Composites,” NASA Contractor Report 4686, Contract No.
NAS1-19243, August, 1995. 26) Chamis, C. C., Murthy, P. L. N., and Minnetyan, L. (1996). “Progressive fracture of polymer matrix
composite structures.” Theoretical and Applied Fracture Mech., 25(1), 1-15. 27) Kregers, A. F. and Melbardis Y. G. 1978. "Determination of the Deformability of Three-
Dimensional Reinforced Composites by the Stiffness Averaging Method," Polymer Mechanics, No.1 pp3-8.
28) Abdi, F., Davis, B., and Kedward, K., “Analytical and Experimental Verification of DSD in S/RFI
Commercial Aircraft” Contract No, NAS1-20546-6XY016021, June 7, 1999. 29) Huang, D. (1998). “GENOA Progressive Failure Analysis Program: Computational Simulation of
Three-Dimensional Fiber Reinforced Composites, Volume I-Theoretical Manual” AlphaSTAR Corporation, Long Beach, California, September 1998.
30) Xu, J., Cox, B.N., McClockton, M.A., and Carter, W.C. 1992, “A Binary Model of Textile
Composites: II The Elastic Regime,” Acta Metallurgica Materialia, Vol.43, No. 9, pp3511-3524. 31) Huang, D. “Computational Simulation of Damage Propagation in Three-Dimensional Woven
Composites, A Doctoral Thesis, Clarkson University 1997. 32) Abdi, F. Goldsworthy and Associates “Blade Manufacturing Process Technology Development of
Preform Composite Net Shapes,” December 1998.
Page 30 of 31FRACTURE MECANICS OF METALS, COMPOSITES, WELDS,
5/7/2002http://www.alphastarcorp-genoa.com/Durability.htm

33) Shah, A. R. Shiao, M. C. Nagpal, V. K., and Chamis. C. “Probabilistic Evaluation of Uncertainties
and Risks in Aerospace Components. Chapter 10, AIAA 1992. 34) Liu, W. K. and Belytschko, T. “Stochastic Computational Mechanics for Aerospace Structures,
Chapter 7, AIAA 1992. 35) F. Abdi, R. Lorenz., "Concurrent Probabilistic Simulation of High Temperature Composite
Structural Response", NASA Lewis SBIR Phase II Final REPORT, 1995. 36) Huang, D.), Abdi, F., Khatiblou, M. ” Progressive Failure Analysis (PFA) and Verification of
Composite Test Panel Under Impact and Tension After Impact (TAI) Loading Using GENOA” Contract No. FW809FAH, December 1999.
Page 31 of 31FRACTURE MECANICS OF METALS, COMPOSITES, WELDS,
5/7/2002http://www.alphastarcorp-genoa.com/Durability.htm
Recommended


