ARTICLE
Received 15 Aug 2016 | Accepted 15 Feb 2017 | Published 12 Apr 2017
Genome assembly with in vitro proximityligation data and whole-genome triplicationin lettuceSebastian Reyes-Chin-Wo1,*, Zhiwen Wang2,*,w, Xinhua Yang2,*, Alexander Kozik1, Siwaret Arikit3,w, Chi Song2,
Liangfeng Xia2, Lutz Froenicke1, Dean O. Lavelle1, Marıa-Jose Truco1, Rui Xia4, Shilin Zhu2, Chunyan Xu2,
Huaqin Xu1, Xun Xu2, Kyle Cox1, Ian Korf1,5, Blake C. Meyers3,4 & Richard W. Michelmore1,5,6,7
Lettuce (Lactuca sativa) is a major crop and a member of the large, highly successful
Compositae family of flowering plants. Here we present a reference assembly for the species
and family. This was generated using whole-genome shotgun Illumina reads plus in vitro
proximity ligation data to create large superscaffolds; it was validated genetically and
superscaffolds were oriented in genetic bins ordered along nine chromosomal pseudomole-
cules. We identify several genomic features that may have contributed to the success of the
family, including genes encoding Cycloidea-like transcription factors, kinases, enzymes
involved in rubber biosynthesis and disease resistance proteins that are expanded in the
genome. We characterize 21 novel microRNAs, one of which may trigger phasiRNAs from
numerous kinase transcripts. We provide evidence for a whole-genome triplication event
specific but basal to the Compositae. We detect 26% of the genome in triplicated regions
containing 30% of all genes that are enriched for regulatory sequences and depleted for
genes involved in defence.
DOI: 10.1038/ncomms14953 OPEN
1 UC Davis Genome Center, Davis, California 95616, USA. 2 BGI Shenzhen, Shenzhen 518083, China. 3 Delaware Biotechnology Institute, University ofDelaware, Newark, Delaware 19711, USA. 4 Donald Danforth Plant Science Center, 975 North Warson Road, St Louis, Missouri 63132, USA. 5 Department ofMolecular & Cellular Biology, UC Davis, California 95616, USA. 6 Department of Plant Sciences, UC Davis, California 95616, USA. 7 Department of MedicalMicrobiology & Immunology, UC Davis, California 95616, USA. * These authors contributed equally to this work. w Present addresses: PubBio-Tech, Wuhan430070, China (Z.W.); Rice Science Center, and Department of Agronomy, Faculty of Agriculture, Kasetsart University, Kamphaeng Saen, Nakhon Pathom73140, Thailand (S.A.). Correspondence and requests for materials should be addressed to R.W.M. (email: [email protected]).
NATURE COMMUNICATIONS | 8:14953 | DOI: 10.1038/ncomms14953 | www.nature.com/naturecommunications 1
The Compositae (also known as Asteraceae) is the mostsuccessful family of flowering plants on earth in terms ofnumber of species and diversity of habitats colonized1. The
family is thought to have originated in the mid-Eocene (45–49 Myr) and expanded greatly during the Oligocene (28–36 Myr)2,3. It encompasses 1,620 recognized genera and at least23,600 species, constituting approximately 10% of allangiosperms1. They are easily recognizable by theircharacteristic compound inflorescences that comprise manytrue flowers. This cosmopolitan family is present in diversehabitats; Compositae species are successful colonizers ofdisturbed habitats and thrive in a range of extremeenvironments including deserts, tundra and salt flats1,4.Although it does not contain any of the top six food crops, thefamily includes many important edible, medicinal, noxious andinvasive species5,6. Over 200 species have been domesticated for awide variety of uses. In aggregate, over 27 million hectares areplanted worldwide to Compositae crops7, of which the two mostimportant are lettuce and sunflower. Medicinal species includeArtemesia spp. and Echinacea. Many ornamental species withtheir showy flowers belong to the Compositae. In addition,numerous troublesome weeds such as star thistle are alsoComposites. Only two draft sequences of Compositae species
have been published so far. One is of the small 335 Mb genome ofhorseweed (Conyza canadensis)8; the second is of the 1 Gbgenome of globe artichoke (Cynara cardunculus)9.
Lettuce (Lactuca sativa L.) is an important vegetable crop speciesand ranks as one of the top 10 most valuable crops in the USA withan annual value of over $2.4 billion10. L. sativa is diploid with2n¼ 2x¼ 18 chromosomes and an estimated genome size of2.5 Gb (refs 11,12). Generation of a comprehensive referencegenome was challenging due to its size and high repeat content. Wesequenced and assembled the genome of L. sativa using a variety ofapproaches that included a wide range of mate-pair librariesand in vitro proximity ligation to generate large superscaffoldsbased on long-range contact frequencies detected betweenscaffolds13. In vitro proximity ligation is an application of thechromosome conformation capture technologies to aid genomeassembly14; this approach has been reported for animal but not forplant genomes15,16. The assembly was validated genetically andsuperscaffolds were arranged in genetic bins ordered along the ninechromosomal linkage groups. The resulting assembly is one of themore complete for any plant species reported so far, particularly fora genome larger than 2 Gb with a high repeat content, and providesthe first high-quality, comprehensive reference genome for analysisof the Compositae family.
100.0%
HiRise 2lanes
HiRise 1lane
Soapdenovo
90.0%
80.0%
70.0%
60.0%
50.0%
40.0%
30.0%
20.0%
10.0%
0.0%
Bulk RILs
Scaffold rank
L. sativa
L. serriola
Cum
ulat
ive
perc
enta
ge o
f ass
embl
y
1
1001
2001
3001
4001
5001
6001
7001
8001
9001
1000
1
1100
1
1200
1
1300
1
1400
1
1500
1
1600
1
1700
118
001
1900
1
2000
1
2100
1
a c
b
SOAPdenovo
Scaffolds
Geneticbins
Geneticbins
Geneticbins
HiRise1 lane
HiRise2 lane
Superscaffolds
Superscaffolds
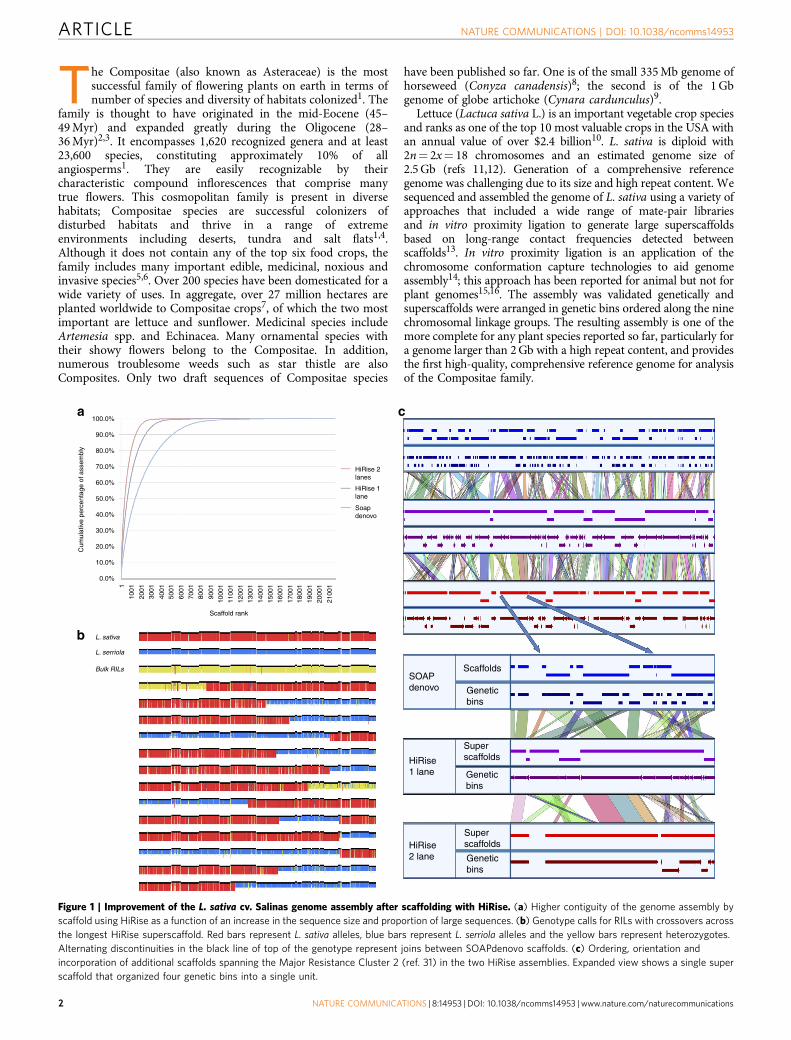
Figure 1 | Improvement of the L. sativa cv. Salinas genome assembly after scaffolding with HiRise. (a) Higher contiguity of the genome assembly by
scaffold using HiRise as a function of an increase in the sequence size and proportion of large sequences. (b) Genotype calls for RILs with crossovers across
the longest HiRise superscaffold. Red bars represent L. sativa alleles, blue bars represent L. serriola alleles and the yellow bars represent heterozygotes.
Alternating discontinuities in the black line of top of the genotype represent joins between SOAPdenovo scaffolds. (c) Ordering, orientation and
incorporation of additional scaffolds spanning the Major Resistance Cluster 2 (ref. 31) in the two HiRise assemblies. Expanded view shows a single super
scaffold that organized four genetic bins into a single unit.
ARTICLE NATURE COMMUNICATIONS | DOI: 10.1038/ncomms14953
2 NATURE COMMUNICATIONS | 8:14953 | DOI: 10.1038/ncomms14953 | www.nature.com/naturecommunications
ResultsGenome sequencing and assembly. A whole-genome shotgunstrategy was used to sequence and assemble the genome ofL. sativa cultivar Salinas from Illumina short reads. A total of198.5 Gb Illumina paired-end and mate-pair reads were generatedfrom seven libraries of different fragment sizes (170 bp to40 kb; Supplementary Table 1). After filtering, this provided72.5-fold coverage of the 2.7 Gb genome as estimated by K-meranalysis, making this one of the larger plant genomes assembledso far17. An additional 47 Gb of paired-end reads from gene spacelibraries18 were used when filling gaps. This initial SOAPdenovoassembly consisted of 153,952 contigs and 21,686 scaffolds greaterthan 1 kb with the largest scaffold being 3.1 Mb. The N50s ofcontigs and scaffolds were 12 and 476 kb, respectively. The meansize of gaps in the scaffolds was 1.3 kb (Supplementary Table 2).The Chicago library data (in vitro proximity ligation) scaffoldedwith the HiRise software pipeline (Dovetail Genomics LLC, SantaCruz, CA, USA) increased the contiguity of scaffolds considerably(Supplementary Table 3 and Fig. 1a). The final HiRise assemblydecreased the 21,686 scaffolds to 11,474 superscaffolds andincreased the N50 from 476 to 1,769 kb; 50 and 90% of thegenome is represented in only 385 and 1,520 superscaffolds,respectively (Table 1 and Supplementary Table 2). The largestsuperscaffold is 12.2 Mb and contains 27 SOAPdenovo scaffolds(Fig. 1b). The total length of the assembly is 2.38 Gb, coveringB88% of the estimated genome size of L. sativa. This assemblyrepresents the gene space well; CEGMA19 analysis found 97.6%matches to the set of 248 Conserved Eukaryotic Genes (CEGs19)(Supplementary Table 4) and all 357 Ultra-Conserved Orthologs
from Arabidopsis thaliana were found using TBLASTN(Supplementary Table 4). In addition, 96.6% of the 80,727L. sativa expressed sequence tags (ESTs) in NCBI could bealigned to the genome assembly at 480% identity and 450%coverage (Supplementary Table 4).
Validation and anchoring of the assembly to linkage groups.To validate the assembly and generate chromosomal pseudo-molecules for L. sativa, we sequenced the gene space of 99 F7
recombinant inbred lines (RILs) from an interspecific crossof L. sativa cv. Salinas � L. serriola acc. US96UC23 (ref. 20).Haplotypes could be assigned to 12,023 of the larger scaffolds.The SOAPdenovo assembly was validated using both genetic andHiRise information. Only 171 (0.78%) of the scaffolds wereidentified as chimeric based on the presence of indicativepopulation-wide switches in genotype calls occurring at thepoint of misjoin (Supplementary Fig. 1). Another 74 (0.34%) wereidentified as chimeric based in discrepancies in the contact fre-quency along the scaffold. In total, only 245 (1.13%) scaffoldswere chimeric and had to be split reflecting the high quality of theinitial SOAPdenovo assembly.
A total of 9,140 scaffolds of the L. sativa assembly could beclustered into nine chromosomal linkage groups and thenmapped into genetic bins ordered along each chromosomallinkage group (Supplementary Fig. 2 and Supplementary Data 2).The groups were named and oriented consistent with thepreviously reported, ultra-dense map20 using genic sequencescommon to both maps. As expected, there was almost perfectcolinearity between the map generated from segregation dataresulting from hybridizations to the Affymetrix GeneChip andthe map generated from the sequence data. Out of a total of 9,140mapped scaffolds, less than 1% had inconsistent positions in thetwo maps; these inconsistencies may have been due to mapping ofparalogs (Supplementary Fig. 3).
The combined genetic and HiRise13 data providedfurther validation of the assembly, captured an additional3,638 previously unmapped scaffolds that encompassed 49.5 Mband refined the order and orientation of scaffolds in eachgenetic bin (Fig. 1c). Genetic data identified only 24(0.21%) misassembled superscaffolds. After splitting chimericscaffolds, nine chromosomal pseudomolecules were generatedand displayed using GBrowse (Supplementary Fig. 4)(http://lgr.genomecenter.ucdavis.edu) with 3,138 superscaffoldsencompassing 2.30 Gb (Supplementary Data 3) (96.6% of theassembly). The HiRise data reduced the number of sequencesfrom an average of 6.26 scaffolds per bin to 2.25 superscaffoldsper bin and resulted in reorganization and reorientation ofscaffolds within genetic bins (Fig. 2, Track a and SupplementaryData 4). Of 3,112 superscaffolds that contained mappedfragments, 2,325 (74.7%) were located within a single geneticbin or had only a single mapped marker and so could not beoriented. The remaining 787 superscaffolds spanned on average1.7 cM. Orientation could be determined for 859 superscaffoldsbased on crossovers within them (Fig. 1b); this accurately placed1.5 Gb (63%) of the assembly in the precise location andorientation. Such improvements are exemplified by the MajorResistance Cluster 2 region where the number of sequences wasdecreased by a third for this complex region that contains largenumbers of paralogs encoding candidate-resistance proteins(Fig. 1c). This improvement was also evident in the analysis ofsynteny on the genomic scale. We were able to detect twice thenumber of syntelogs in the final chromosomal pseudomoleculesbased on HiRise superscaffolds (9,325 syntenic hits) compared tothe chromosomal pseudomolecules build with the SOAPDenovoscaffolds (4,038 syntenic hits) due to a significant improvement in
Table 1 | Assembly statistics for the genome of L. sativa cv.Salinas.
Genome assembly metricsSOAPDenovo HiRise (2 lanes)
ContigsN50 (size/number) 36 kb/21,116 —Largest 253 kb —Total size 2.21 Gb —Total number 153,952 —
ScaffoldsN50 (size/number) 476 kb/1,445 1.8 MbN90 (size/number) 118 kb/5,237 360 kb/1,520Largest 3.1 Mb 12.2 MbTotal size 2.38 Gb 2.38 GbTotal number 21,686 11,474
Genome annotation*Family Total Length
Transposable elements Retroelements 1.5 Gb (61.5%)DNA elements 29.5 Mb (1.2%)
MITEs 103.7 Mb (4.4%)Others 115.3 kb (o1%)
Unknown 152.9 Mb (6.3%)Total 1.8 Gb (74.2%)
Type CopiesNon-coding RNA rRNAs 2,587
tRNAs 1,347Predicted miRNAs 483Detected miRNAs 86
snRNAs 1,514
Protein coding genes Total number 38,919Annotated transcripts 31,348Average CDS length 1.05 kb
MITE, Miniature Inverted-Repeat Transposable Elements.*Annotation provided for HiRise assembly.
NATURE COMMUNICATIONS | DOI: 10.1038/ncomms14953 ARTICLE
NATURE COMMUNICATIONS | 8:14953 | DOI: 10.1038/ncomms14953 | www.nature.com/naturecommunications 3
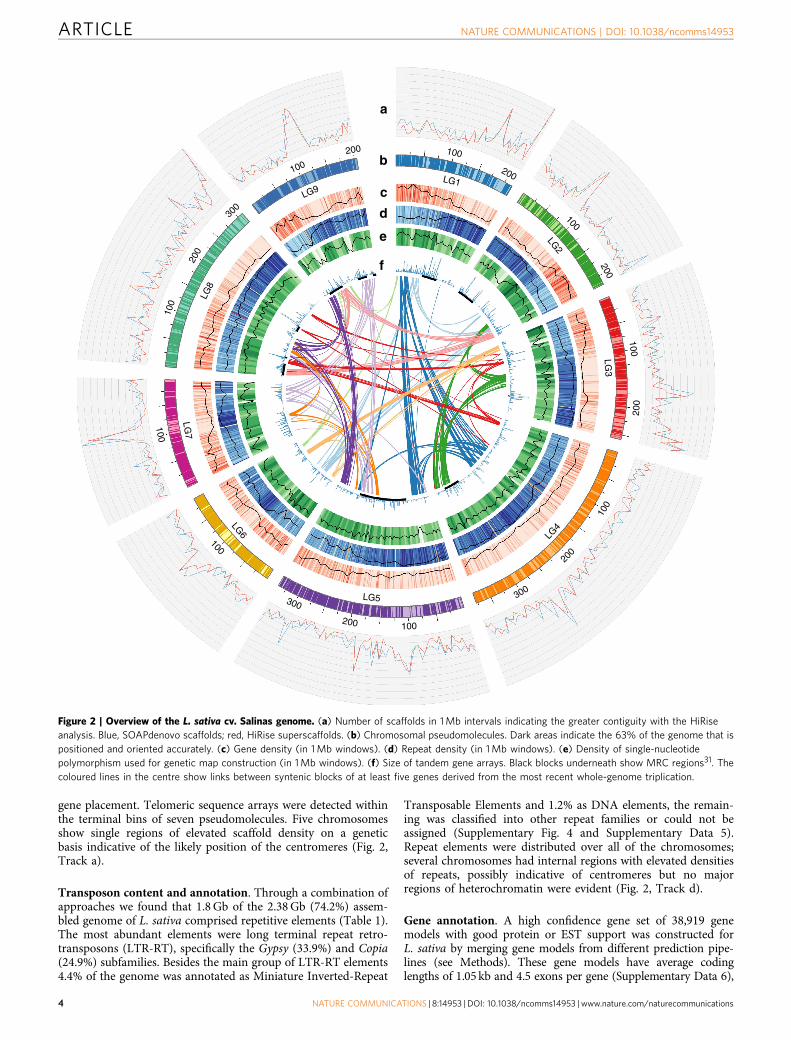
gene placement. Telomeric sequence arrays were detected withinthe terminal bins of seven pseudomolecules. Five chromosomesshow single regions of elevated scaffold density on a geneticbasis indicative of the likely position of the centromeres (Fig. 2,Track a).
Transposon content and annotation. Through a combination ofapproaches we found that 1.8 Gb of the 2.38 Gb (74.2%) assem-bled genome of L. sativa comprised repetitive elements (Table 1).The most abundant elements were long terminal repeat retro-transposons (LTR-RT), specifically the Gypsy (33.9%) and Copia(24.9%) subfamilies. Besides the main group of LTR-RT elements4.4% of the genome was annotated as Miniature Inverted-Repeat
Transposable Elements and 1.2% as DNA elements, the remain-ing was classified into other repeat families or could not beassigned (Supplementary Fig. 4 and Supplementary Data 5).Repeat elements were distributed over all of the chromosomes;several chromosomes had internal regions with elevated densitiesof repeats, possibly indicative of centromeres but no majorregions of heterochromatin were evident (Fig. 2, Track d).
Gene annotation. A high confidence gene set of 38,919 genemodels with good protein or EST support was constructed forL. sativa by merging gene models from different prediction pipe-lines (see Methods). These gene models have average codinglengths of 1.05 kb and 4.5 exons per gene (Supplementary Data 6),
100
300
200
100
100
100
300
200 100
300
200
100
200
100
200
100
200
100200
LG9LG1
LG2
LG3
LG4
LG5
LG6
LG7
LG8
a
b
c
d
e
f
Figure 2 | Overview of the L. sativa cv. Salinas genome. (a) Number of scaffolds in 1 Mb intervals indicating the greater contiguity with the HiRise
analysis. Blue, SOAPdenovo scaffolds; red, HiRise superscaffolds. (b) Chromosomal pseudomolecules. Dark areas indicate the 63% of the genome that is
positioned and oriented accurately. (c) Gene density (in 1 Mb windows). (d) Repeat density (in 1 Mb windows). (e) Density of single-nucleotide
polymorphism used for genetic map construction (in 1 Mb windows). (f) Size of tandem gene arrays. Black blocks underneath show MRC regions31. The
coloured lines in the centre show links between syntenic blocks of at least five genes derived from the most recent whole-genome triplication.
ARTICLE NATURE COMMUNICATIONS | DOI: 10.1038/ncomms14953
4 NATURE COMMUNICATIONS | 8:14953 | DOI: 10.1038/ncomms14953 | www.nature.com/naturecommunications
similar to those in other sequenced plant genomes(Supplementary Fig. 5). The average intergenic distance of 39.5 kbplaces L. sativa between Nicotiana tomentosis and Capsicumannum consistent with a direct correlation between intergenicdistance and genome size (Supplementary Fig. 6). Out of the totalnumber of predicted genes, 29,681 (76.27%) genes had similarityto Arabidopsis TAIR10 annotations (Supplementary Data 6) and28,951 (74.3%) were annotated using InterProScan521
(Supplementary Data 7 and 8). Annotation using KEGG22
database yielded information for 7,553 L. sativa gene predictions(Supplementary Data 9). The combined data sets providedfunctional annotation for 31,348 (80.5%) gene models.
Small RNAs in lettuce and their target transcripts. To identifymicroRNAs, loci generating phased, secondary siRNAs and othersmall RNAs, we sequenced 10 libraries each of small RNAs anduncapped or cleaved mRNAs (‘PARE’ libraries23). Most of thesmall RNAs identified were 24-nt heterochromatic siRNAs asexpected. In addition, there were a total of 86 miRNAs from51 distinct miRNA families (Supplementary Data 10). Amongthese 51 miRNA families, we identified 21 novel miRNAs; 8 ofthese were 22 nucleotides in length and thus candidate triggers ofsecondary siRNAs, known as phased siRNAs or ‘phasiRNAs’24
(produced from PHAS loci). Four of the 22-nt novel miRNAs, lsa-m1604, lsa-m5672, lsa-m1606 and lsa-m1057, were highlyexpressed. Combining the predicted miRNAs with the PAREdata validated the cleavage of 288 miRNA target genes(Supplementary Data 11). A total of 565 PHAS loci wereidentified by scanning the small RNAs against the lettucegenome, the majority (430) of which were annotated asprotein-coding genes (Supplementary Fig. 7 and SupplementaryData 12). NB-LRR (NLR) resistance protein-encoding genes werethe largest class of PHAS loci (246 genes), as in many othereudicots such as Glycine max and Medicago truncatula25,26. Thesecond largest class of PHAS loci (116 genes) was kinases, thehighest number for kinases detected in all angiosperms analysedso far. The single miRNA trigger of these kinase phasiRNAs waspredicted to be the novel miRNA, lsa-m5672. The lettuce-specificmiRNA and high number of targets suggests a lineage-specificspecialization of this post-transcriptional control of kinase genes.
Protein clustering and gene family analysis. Clustering of thepredicted proteome of lettuce using OrthoMCL27 with proteinsfrom nine other published plant genomes clustered 251,776 out ofthe 325,448 proteins predicted for all 10 species into 28,720groups, which contained 29,511 (76%) of the lettuce proteins(Supplementary Table 5). Across the panel of 10 genomes, 1,475ortholog groups had a member from each species (SupplementaryData 13). Calculations on this set of genes using Vitis vinifera asthe reference revealed that Brassicaceae species have the highestrate of synonymous substitutions28 (ds¼B4.53), followed byMimulus guttatus (ds¼ 3.78) and L. sativa (ds¼ 3.12), while thetree species have the lowest ds values (B1.65) (SupplementaryData 14). Most of the groups represented gene families that wereshared between species (13,611 groups were present in more thanone species and contained more than one gene per species).
Forty of 107 tested groups exhibited significant expansion orcontractions in gene copy number across the panel of 10 species(see Methods) (Supplementary Data 15). Many (14 out of 40) hadkinase-related activity. Of these 14 kinase-related groups, 8 hadthe receptor-like kinase (RLK) domain structure29. From the total696 RLKs annotated in lettuce, 655 were grouped into 204 groups;leucine-rich repeat-RLKs30 are over-represented while the lectin-RLKs30 are under-represented in lettuce compared to the othernine species (Supplementary Data 13). A total of 372 nucleotide-
binding leucine-rich repeat receptor like (NLR) proteins in 31groups were annotated in lettuce. Two groups that were presentin all 10 genomes were significantly expanded in L. sativa, Citrussinensis, Populus tricocharpa and Theobroma cacao. These includethe Resistance Gene Candidate 1 (RGC1) and RGC21 subfamiliesin L. sativa31. Another 30 NLR groups varied in copy numberand presence/absence across species. Two of these groups weresignificantly expanded in lettuce compared to the other genomes;one encompassed the RGC16 subfamily, which is the biggest NLRfamily present in lettuce31. In contrast, 10 NLR groups showedexpansions in other plant genomes but were single or low copy inlettuce. There were four NLR groups that are specific to L. sativaat the stringencies used (see Methods) and together contain 141NLR proteins, with the two biggest containing mostly RGC12 andRGC4 members. Considering all 28,720 clusters, 1,617 clusterscontaining 7,035 genes (18% of annotated genes) were detectedas specific to L. sativa at the threshold used (SupplementaryData 13). These L. sativa-specific clusters showed a significantenrichment of GO terms related to ‘Signaling’ (GO:0023052) and‘Response to stimulus’ (GO:0050896) with ‘Defense response’(GO:0006952) (Fisher exact test and FDR corrected P-value 1.5e� 75) showing the greatest enrichment (Supplementary Data 16).Expansions of NLR genes have been the result of localduplications since 83% of sequences predicted to encode NLRsare within tandem arrays. These data are consistent with higherevolutionary selection pressure for diversification in L. sativa ofsome families of resistance genes compared to other species. Incontrast, genes encoding disease response-related proteins such asthe Lipoxygenase (LOX) gene family show greater conservationwith no expansion at the family level and the structure of thefamily is conserved across all genomes analysed (SupplementaryFig. 8).
Analysis of Pfam protein domains revealed expansion anddiversification of two families related to latex and rubberproduction. Seventy-eight genes belonging to the Bet_v_1/MajorLatex Protein (PF00407/IPR000916) family32 were found inL. sativa; this is significantly more than the average of 34 presentin the other nine genomes studied (Supplementary Data 17).Precise function(s) of these proteins is not known but theyare present in latex and involved in responses biotic stresses33.The Rubber Elongation Factor (REF) (PF05755) family is alsoexpanded in L. sativa with 11 members compared to an average3.6 of paralogs per genome in the non-rubber producing species(Supplementary Data 17). This family is involved in biosynthesisof rubber in Hevea brasiliensis32 and its copy number is related tothe overall capability to produce rubber34. H. brasiliensis has 18REF/SRPP’s, the majority of which are in a single cluster34.Similarly, in L. sativa that also produces high-quality rubber35 themajor portion of this family is located as a tandem array of eightmembers located in LG9 (Supplementary Fig. 9). Therefore, thisfamily is expanded in both of these taxonomically distinct,rubber-producing species.
Genome triplication. Comparisons of genome structure of thepublished plant genomes and L. sativa against V. vinifera as areference showed that chromosome conservation correlated withgrowth habit and generation time based on the size of thesyntenic blocks as expected (Supplementary Data 18). Specieswith long generation times or vegetatively propagated (T. cacao,Solanum tuberosum, P. trichocarpa, C. sinensis) were more syn-tenic than those with faster life cycles (A. thaliana, Brassica rapa).The extent of detectable synteny also correlates with the ploidylevel. T. cacao (2n) exhibits more synteny with V. vinifera (2n)than A. thaliana (8n) and B. rapa (12n). Consistent withthis, L. sativa (6n) showed an intermediate level of synteny to
NATURE COMMUNICATIONS | DOI: 10.1038/ncomms14953 ARTICLE
NATURE COMMUNICATIONS | 8:14953 | DOI: 10.1038/ncomms14953 | www.nature.com/naturecommunications 5
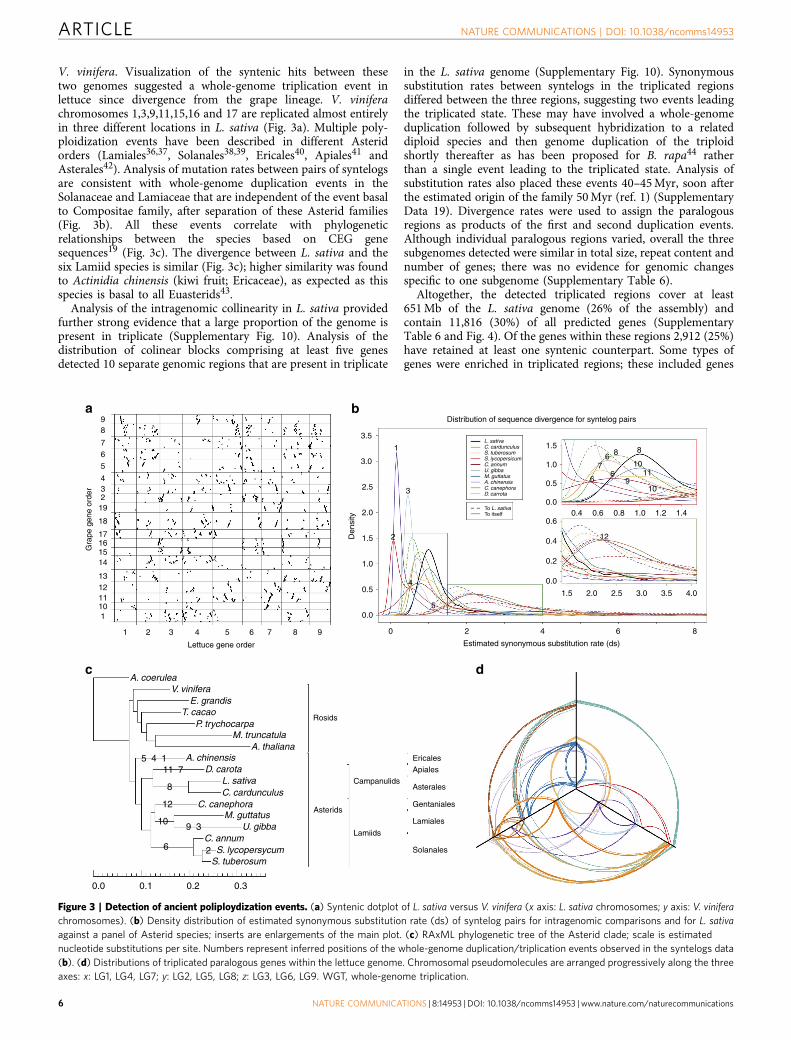
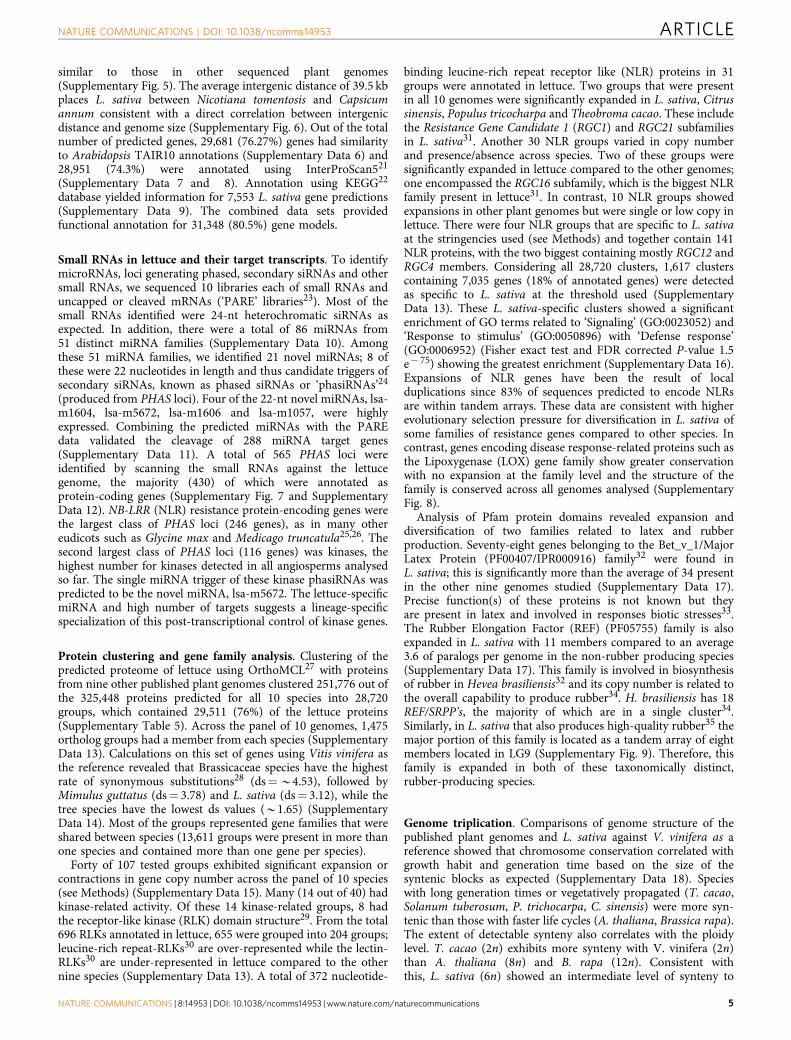
V. vinifera. Visualization of the syntenic hits between thesetwo genomes suggested a whole-genome triplication event inlettuce since divergence from the grape lineage. V. viniferachromosomes 1,3,9,11,15,16 and 17 are replicated almost entirelyin three different locations in L. sativa (Fig. 3a). Multiple poly-ploidization events have been described in different Asteridorders (Lamiales36,37, Solanales38,39, Ericales40, Apiales41 andAsterales42). Analysis of mutation rates between pairs of syntelogsare consistent with whole-genome duplication events in theSolanaceae and Lamiaceae that are independent of the event basalto Compositae family, after separation of these Asterid families(Fig. 3b). All these events correlate with phylogeneticrelationships between the species based on CEG genesequences19 (Fig. 3c). The divergence between L. sativa and thesix Lamiid species is similar (Fig. 3c); higher similarity was foundto Actinidia chinensis (kiwi fruit; Ericaceae), as expected as thisspecies is basal to all Euasterids43.
Analysis of the intragenomic collinearity in L. sativa providedfurther strong evidence that a large proportion of the genome ispresent in triplicate (Supplementary Fig. 10). Analysis of thedistribution of colinear blocks comprising at least five genesdetected 10 separate genomic regions that are present in triplicate
in the L. sativa genome (Supplementary Fig. 10). Synonymoussubstitution rates between syntelogs in the triplicated regionsdiffered between the three regions, suggesting two events leadingthe triplicated state. These may have involved a whole-genomeduplication followed by subsequent hybridization to a relateddiploid species and then genome duplication of the triploidshortly thereafter as has been proposed for B. rapa44 ratherthan a single event leading to the triplicated state. Analysis ofsubstitution rates also placed these events 40–45 Myr, soon afterthe estimated origin of the family 50 Myr (ref. 1) (SupplementaryData 19). Divergence rates were used to assign the paralogousregions as products of the first and second duplication events.Although individual paralogous regions varied, overall the threesubgenomes detected were similar in total size, repeat content andnumber of genes; there was no evidence for genomic changesspecific to one subgenome (Supplementary Table 6).
Altogether, the detected triplicated regions cover at least651 Mb of the L. sativa genome (26% of the assembly) andcontain 11,816 (30%) of all predicted genes (SupplementaryTable 6 and Fig. 4). Of the genes within these regions 2,912 (25%)have retained at least one syntenic counterpart. Some types ofgenes were enriched in triplicated regions; these included genes
98
7
6
5
43
192
18
Gra
pe g
ene
orde
r
1617
1415
13
11
1
1 2 3 4 5 6 7 8 9
10
12
3.5 1.5
1.0
0.5
0.00.4 0.6 0.8 1.0 1.2 1.4
0.6
0.4
0.2
0.0
1.5 2.0 2.5 3.0 3.5 4.0
3.0
2.5
2.0
Den
sity
1.5
1.0
0.5
0.0
0
EricalesApiales
Asterales
Gentaniales
Lamiales
Solanales
2 4 6 8
Estimated synonymous substitution rate (ds)
A. coeruleaV. vinifera
E. grandisT. cacao
P. trychocarpaM. truncatula
A. thalianaA. chinensis
D. carotaL. sativaC. cardunculus
C. canephoraM. guttatus
U. gibbaC. annum
S. lycopersycumS. tuberosum
0.30.20.10.0
Lettuce gene order
Rosids
Lamiids
Campanulids
Asterids
a b
dc
11 7
8
12
109 3
26
5 4 1
1
Distribution of sequence divergence for syntelog pairs
L. sativaC. cardunculusS. tuberosumS. lycopersicumC. annumU. gibbaM. guttatusA. chinensisC. canephoraD. carrota
To L. sativaTo itself
2
3
4
5
6
66
7
8 8
9
1011
10
12
Figure 3 | Detection of ancient poliploydization events. (a) Syntenic dotplot of L. sativa versus V. vinifera (x axis: L. sativa chromosomes; y axis: V. vinifera
chromosomes). (b) Density distribution of estimated synonymous substitution rate (ds) of syntelog pairs for intragenomic comparisons and for L. sativa
against a panel of Asterid species; inserts are enlargements of the main plot. (c) RAxML phylogenetic tree of the Asterid clade; scale is estimated
nucleotide substitutions per site. Numbers represent inferred positions of the whole-genome duplication/triplication events observed in the syntelogs data
(b). (d) Distributions of triplicated paralogous genes within the lettuce genome. Chromosomal pseudomolecules are arranged progressively along the three
axes: x: LG1, LG4, LG7; y: LG2, LG5, LG8; z: LG3, LG6, LG9. WGT, whole-genome triplication.
ARTICLE NATURE COMMUNICATIONS | DOI: 10.1038/ncomms14953
6 NATURE COMMUNICATIONS | 8:14953 | DOI: 10.1038/ncomms14953 | www.nature.com/naturecommunications
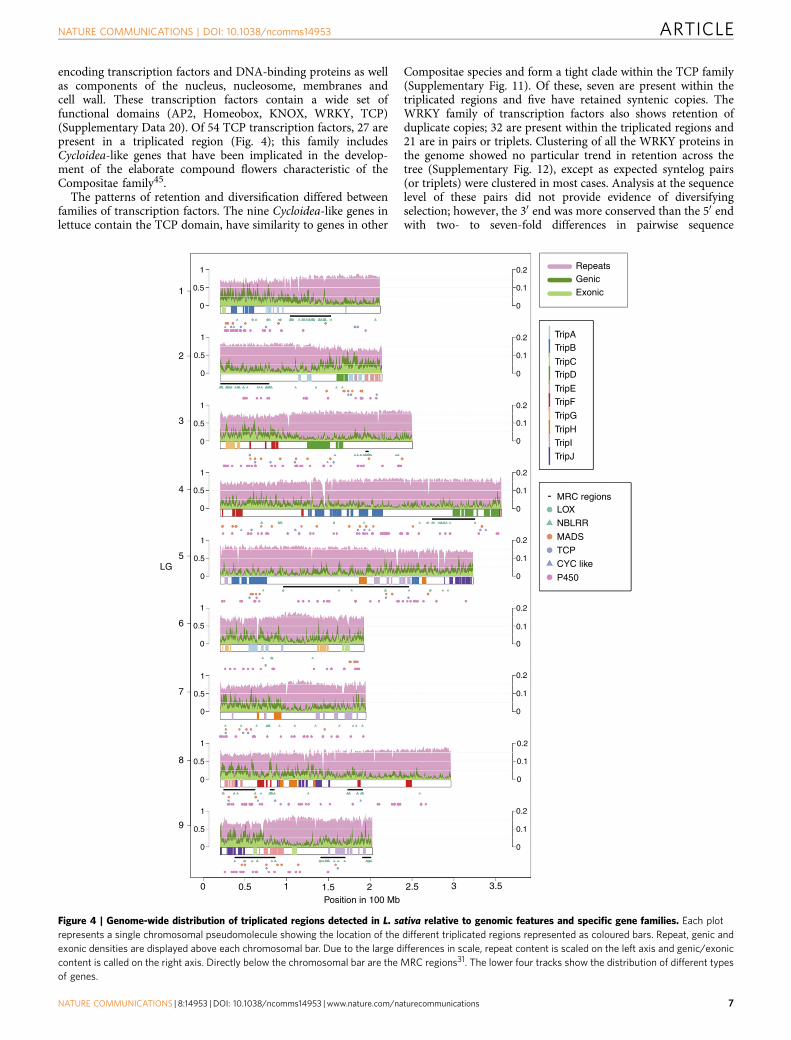
encoding transcription factors and DNA-binding proteins as wellas components of the nucleus, nucleosome, membranes andcell wall. These transcription factors contain a wide set offunctional domains (AP2, Homeobox, KNOX, WRKY, TCP)(Supplementary Data 20). Of 54 TCP transcription factors, 27 arepresent in a triplicated region (Fig. 4); this family includesCycloidea-like genes that have been implicated in the develop-ment of the elaborate compound flowers characteristic of theCompositae family45.
The patterns of retention and diversification differed betweenfamilies of transcription factors. The nine Cycloidea-like genes inlettuce contain the TCP domain, have similarity to genes in other
Compositae species and form a tight clade within the TCP family(Supplementary Fig. 11). Of these, seven are present within thetriplicated regions and five have retained syntenic copies. TheWRKY family of transcription factors also shows retention ofduplicate copies; 32 are present within the triplicated regions and21 are in pairs or triplets. Clustering of all the WRKY proteins inthe genome showed no particular trend in retention across thetree (Supplementary Fig. 12), except as expected syntelog pairs(or triplets) were clustered in most cases. Analysis at the sequencelevel of these pairs did not provide evidence of diversifyingselection; however, the 30 end was more conserved than the 50 endwith two- to seven-fold differences in pairwise sequence
1
1
1
0.5
0.5
0
0
1
0.5
0
1
0.5
0
1
0.5
0
1
0.5
0
1
0.5
0
1
0.5
0
1
1 1.5Position in 100 Mb
2 2.5 3 3.5
0
0.1
0.2
0
0.1
0.2
0
0.1
0.2
0
0.1
0.2
0
0.1
0.2
0
0.1
0.2
0
0.1
0.2
0
0.1
0.2
0
0.1
0.2 RepeatsGenicExonic
TripATripB
TripCTripD
TripETripF
TripG
TripH
TripI
TripJ
MRC regionsLOX
NBLRR
MADS
TCP
CYC like
P450
0.5
0.5
0
0
2
3
4
5LG
6
7
8
9
Figure 4 | Genome-wide distribution of triplicated regions detected in L. sativa relative to genomic features and specific gene families. Each plot
represents a single chromosomal pseudomolecule showing the location of the different triplicated regions represented as coloured bars. Repeat, genic and
exonic densities are displayed above each chromosomal bar. Due to the large differences in scale, repeat content is scaled on the left axis and genic/exonic
content is called on the right axis. Directly below the chromosomal bar are the MRC regions31. The lower four tracks show the distribution of different types
of genes.
NATURE COMMUNICATIONS | DOI: 10.1038/ncomms14953 ARTICLE
NATURE COMMUNICATIONS | 8:14953 | DOI: 10.1038/ncomms14953 | www.nature.com/naturecommunications 7
divergence (Supplementary Data 21). This is consistent withselection for conservation of the WRKY domain present in the 30
end while allowing divergence of the 50 end potentially leadingto gain of functions. Similar analysis of the AP2 family oftranscription factors did not detect such differences between the30 and 50 ends (Supplementary Data 21). Expression analysisrevealed differences in expression of syntelogs; only 3 out of the12 WRKY and only 3 out of 23 AP2 syntelog pairs were co-expressed based in a Weighted Gene Correlation-ExpressionNetwork Analysis (Supplementary Data 22). Syntelogs were notdetected for some genes encoding transcription factor families.The proportion of genes encoding MADS proteins within thetriplicated regions (30%) (Fig. 4) is similar to those encoding AP2(40%) and WRKY (33%) proteins; however, only 6% are detectedas syntenic pairs. Since these genes are still present within asyntenic block significant divergence at the sequence levelbetween the paralogs is the likely cause for the lack of detectedsynteny.
Some genes are under-represented in the detected triplicatedregions. Genes encoding proteins related to defence response,signal transduction, protein kinase activity and protein phos-phorylation activity are less prevalent in the triplicated regions;only 29 out of 437 NB-LRR candidate genes and 3 out of 21 LOXgenes were detected within the triplicated regions. The distribu-tion of these types of genes may reflect the genomic landscapewhere they are located rather than gene loss itself. MRCs aregenerally in gene-poor, more dynamic areas with higher repeatcontent compared to the rest of the genome31 (Fig. 4). Rapidevolution, higher repeat content and genome rearrangementswould cause loss of detectable synteny.
DiscussionThis genome assembly of lettuce is one of the more complete forany plant species reported so far, particularly for genomes largerthan 2 Gb with a high repeat content. The genome size of L. sativais typical of many Compositae species46, despite the family havingrapid-cycling weedy species. It provides the first high-quality,genetically validated, reference genome for analysis of the highlysuccessful Compositae family.
The Dovetail technology greatly increased the contiguity of theassembly, assimilated additional scaffolds into chromosomalpseudomolecules, identified chimeric scaffolds that had beenmissed by genetic analysis, and oriented and ordered scaffoldsthrough complex regions. The Dovetail approach was able toaccommodate the high repeat content of the lettuce genome.However, more than half of the remaining scaffolds (6,026) areunder 2 kb and predominantly contain repeated sequences;because the HiRise algorithm requires unique alignments of bothread pairs such scaffolds are not captured by HiRise. Only asmall amount of sequencing was specifically required. Theonly major requirement is the ability to extract sufficiently largeDNA. Therefore, it is readily applicable to numerous species forwhich there are no or only partial genome assemblies. Conse-quently, it is likely to result in the rapid increase in the availabilityof high-quality genome assemblies for numerous non-modelspecies.
The whole-genome triplication event detected in lettuce is basalto the Asterales and distinct from the triplication event recentlyreported for Daucus carrota (carrot) in the Apiales41, which isalso in the Euasterid II clade. Interestingly, these events seem tohave occurred simultaneously in common with many lineages ator shortly after the Cretaceous–Paleocene transition (66 Myr), atwhich time B75% of all species became extinct47. This isconsistent with polyploidy resulting in evolutionary innovationsand phenotypic plasticity that conferred selective advantages for
successful colonization of disturbed habitats48. As in whole-genome duplications of other plants49 and animals50, genesencoding some but not all transcription factors were enriched intriplicated regions of the lettuce genome. Patterns of sequencedivergence indicated subfunctionalization at the 50 end of WRKYgenes, and possible neo-functionalization of the AP2 and MADSgenes. These changes in regulatory machinery could have led tonew phenotypes that would have enabled members of the familyto adapt to new environments.
Other genomic features that may have contributed to thesuccess of the family include diversification of Cycloidea-likegenes that may be involved in formation of the complexcapitulum (a composite of many flowers); such an elaboratereproductive organ may be more attractive to pollinators. TheCompositae are renowned for their diversity of secondarymetabolites51,52. Genes involved in the production of latex thatgives lettuce its characteristic milky sap were expanded and maybe involved in defence against biotic stresses. It is also interestingthat there are over 20 novel miRNA, one of which targets kinasetranscripts; this may be indicative of another level of regulatoryinnovation; it will be informative to analyse the miRNArepertoires of other Compositae species.
This high-quality reference genome provides the foundationfor syntenic inferences across the Compositae. It will also greatlyfacilitate map-based cloning of agricultural important genes fromlettuce that is required for crop improvement using genomeediting, particularly those involved in resistance to abiotic andbiotic stresses.
MethodsLibrary preparation and sequencing. Further details of all methods are presentedin Supplementary Note 1. DNA was extracted using a modified CTAB method53
from seedlings of L. sativa cv. Salinas grown in the dark. Seven genomic librarieswere constructed with insert sizes from 170 bp to 40 kb and sequenced on theIllumina HiSeq 2000 to generate 298 Gb of raw sequence. Filtering to remove low-quality reads, adapter contamination, ambiguous bases and error correctionprovided 198.5 Gb of clean data for assembly.
The 99 recombinant lines (RILs) derived from L. sativa cv. Salinas� L. serriolaacc. US96UC23 were a subset of the 213 RILs used to generate AffymetrixGeneChip map20. Genomic DNA was isolated from leaves of the RILs using amodified CTAB extraction method54. Genomic paired-end libraries were thenprepared using standard procedures. Libraries were sequenced to approximately 1xon an Illumina Hiseq 2000.
Two Chicago libraries were prepared by Dovetail genomics as describedpreviously13. Libraries were sequenced in two lanes on an Illumina HiSeq 2500 inrapid run mode to generate 313.5 and 357.2 M 100 bp read pairs. This provided atotal of 72� physical coverage.
Genome assemblies. SOAPdenovo2 was used for initial assembly of the genomiclibraries with a round of gap-filling after the scaffolds had been constructed. Thisassembly was used as input to the HiRise program along with data from theChicago libraries for scaffolding using contact frequency information. After scaf-folding, another round of gap-filling was done to close the gaps. Two iterations ofHiRise scaffolding were done; the first used a single lane of sequencing from oneChicago library and the second used data from sequencing one lane of each twoChicago libraries made from larger DNA fragments. Completeness of the gene-space was evaluated using CEGMA, a set of 357 Ultra Conserved OrtologousSequences and EST sequences from NCBI for Lactuca spp.
Assembly validation and genetic analysis. Reads for each of the 99 F7 RILs weremapped to the genomic sequence of L. sativa using CLC Genomics Server 6.5(Qiagen, Redwood City, CA, USA) and haplotypes assigned to each scaffold in eachRIL based on the consensus all single-nucleotide polymorphisms detected perscaffold. Scaffolds that exhibited haplotypes with many discontinuities at the sameposition were considered to be chimeric (Supplementary Fig. 1); these putativechimeras were manually split and the subsections mapped independently.All scaffolds over 1 kb were clustered into nine chromosomal linkage groups usingMadMapper55. Scaffolds within each chromosomal linkage group were thenassigned to genetic bins based on their segregation using MSTmap56.For comparison of the new genetic map with the previous Affymetrix GeneChipmap20 unigenes used in the chip-based map57 were mapped to the SoapDenovoassembly.
ARTICLE NATURE COMMUNICATIONS | DOI: 10.1038/ncomms14953
8 NATURE COMMUNICATIONS | 8:14953 | DOI: 10.1038/ncomms14953 | www.nature.com/naturecommunications
Genetic information from the map based on the SOAPdenovo scaffolds wasused for validation of the HiRise superscaffolds by correlating their physical andgenetic positions. After validation and clean-up of the HiRise assembly,superscaffolds were mapped into the nine LGs. An initial order was assigned basedon the genetic position of the first and last scaffolds within the superscaffold;validated superscaffolds were oriented based on their terminal locations. This orderwas revised based in the terminal haplotypes to minimize the double recombinantsand genetic inconsistencies; the refined order of the superscaffolds was used toconstruct chromosomal pseudomolecules joining superscaffolds with 10 kb of N’sas spacers. Telomeric sequence arrays were found by string searches of knowntelomere sequences.
Prediction and analysis of repeat sequences. Transposable elements wereidentified in the genome using a combination of homology-based and de novoapproaches58. The genome was mined for repeat elements using ProteinMask andRepeatMasker59 using Repbase60 and a set of custom repeat libraries as reference.Additionally, TRF61 was used to find tandem repeats.
Prediction of non-coding RNA genes. Prediction of ncRNA was done by type,and first tRNAscan-SE62 was used to predict tRNAs. Similarly snoscan63 andRNAmmer64 were used to predict snoRNA and rRNA, respectively. Infernal65 wasused for prediction of more ncRNA using the rFam database66 as input for miRNA,rRNA, rybozimes, snRNA and tRNA.
Small RNA and target gene analysis. Total RNA was isolated from leaves ofL. sativa cvs. Salinas, Cobham Green and Diana, infected or not infected by Bremialactucae (10 samples total). Small RNA libraries were constructed using theTruSeq Small RNA Sample Preparation Kit (Illumina, Hayward, CA, USA). Parallelanalysis of RNA end (PARE) libraries were constructed as previously described23.The libraries were sequenced on an Illumina HiSeq 2000 at the DelawareBiotechnology Institute (Newark, DE, USA).
The raw reads of sRNA sequencing data were trimmed to remove adaptorsequences and then mapped to the lettuce genome using Bowtie67. Reads thatmatched tRNAs, rRNAs, snRNA and snoRNAs were excluded. Only reads thatperfectly matched the lettuce genome were used for further study; miRNAprediction was performed using the previously reported pipeline25. PHAS analyseswere conducted as described previously25,68. Genome-wide miRNA targetprediction was performed using the sPARTA package69 with the built-in target-prediction module miRFerno, followed by PARE-based validation of predictedtargets.
Gene annotation. Protein-coding genes were predicted using multiple geneannotation pipelines. Two sets of GLEAN predictions and one set of MAKERannotations were combined into a single pool. These data were reduced to non-redundant predictions and further filtered based on an Overlap Weighted EvidenceGene-model (OWEG) score for reliability of the predictions (S.R.-C.-W., unpub-lished observations). The predicted proteome and genic region were evaluated withCEGMA19 and against the UCOS70 to evaluate their completeness. Tandem genearrays were identified using the CoGe platform as one of the SynMap71 outputs.
A phylogenetic tree was constructed using sequences of predicted CEG genesusing CEGMA19 on a diverse sample of Eudicot species. Sequences were aligned onClustal Omega. These alignments were inspected visually, concatenated and used asinput into Mega72 to determine the best substitution model. Concatenatedalignment was then used to construct a maximum likelihood tree in RAxML73.
Protein clustering and functional annotation. Functional annotation of all thetranscripts was done using InterProScan521 and KEGG Automated AnnotationService (KAAS)74. Predicted proteins were BLASTed against A. thaliana TAIR10proteins with BLASTp 1� e� 10 to find homologous sequences. Analysis of a set ofprotein families domains from Pfam database v27.0 (ref. 75) was done on thepredicted L. sativa annotations and a panel of published plant genomes. Number ofprotein domains detected per species was analysed for abundance of particulargene families in L. sativa.
The predicted proteome of L. sativa was clustered in OrthoMCL27 with proteinsfrom published plant genomes. Genes present in clusters that were single copy andpresent in all genomes were used to calculate divergence with V. vinifera as thereference. X2 test was performed in a subset of clusters. Using annotations fromL. sativa clusters were classified as Receptor Like Kinases (RLKs), Nucleotidebinding Leucine rich repeat Receptors (NLRs), lipooxinagenase-like (LOX-like)and subjected to further analysis. Genes present in clusters specific to L. sativa wereused for GO enrichment analysis using Blast2GO.
Analysis of synteny. Synteny was analysed using the CoGe platform (https://genomevolution.org/). V. vinifera and L. sativa were used as references against 16publicly available plant genomes including C. cardunculus9. Besides synteny to thetwo reference genomes intragenomic synteny was calculated for all Asteridgenomes. For comparisons against lettuce and for the intragenomic comparisons,sequence divergence estimates between syntelogs were calculated as part of CoGe.
Triplicated blocks in the L. sativa genome were identified by aligning syntenicblocks to the reference and extracting regions that had at least five syntenic genesacross two blocks. These blocks were visually inspected and organized intotriplicated regions. Divergence between the paralogous regions was calculated usingthe divergence between the syntelogs within each region. This information wasused to group the regions into three subgenomes. Analysis of gene contents of thesetriplicated regions was done first by GO enrichment analysis using Blast2GO.Additional analysis was done for four families of transcription factors (WRKY,AP2, TCP, MADS). All of the predicted genes in these families were aligned onClustal Omega and a tree constructed using Clustal Phylogeny. In parallel,mutation rates were calculated for pairs of syntelogs at the whole gene level andalso for both termini independently.
Expression data for the genes within the triplicated regions were mined frommultiple RNA-seq experiments. These reads were mapped to the genome and readcounts were generated for the predicted genes. Downstream analysis was doneusing R3.1.0 (ref. 76) to normalize the raw counts with the DESeq package andthen input to the Weighted Gene Correlation-Expression Network Analysispackage for network construction.
Data availability. Annotated version of the genome assembly is available fromNCBI Genebank under project PRJNA173551 and CoGe71 (Organism ID 36218,Genome ID 28333). All raw reads for L. sativa cv. Salinas have been deposited atthe NCBI Sequence Read Archive (SRA) under umbrella project PRJNA173551,accession SRP105354. Sequence for all 99 F7 RILs have been deposited underumbrella project PRJNA243095, accession SRP040749. Small RNA and PARE datahave been deposited at the NCBI Gene Expression Omnibus (GEO) underaccession GSE84280. Genome browsers and additional information of the assemblyand annotation are available at http://lgr.genomecenter.ucdavis.edu. Additionalinformation is available upon request from the corresponding author.
References1. Funk, V. A. et al. in Plant Diversity and Complexity Patterns: Local, Regional,
and Global Dimensions: Proc. Int. Symp. Royal Danish Academy of Sciences andLetters in Copenhagen, Denmark, 25–28 May 2003, Vol. 55, (eds Friis, I. &Balslev, H.) 343–374 (Kgl. Danske Videnskabernes Selskab, 2005).
2. Kim, K.-J., Choi, K.-S. & Jansen, R. K. Two chloroplast DNA inversionsoriginated simultaneously during the early evolution of the Sunflower family(Asteraceae). Mol. Biol. Evol. 22, 1783–1792 (2005).
3. Barreda, V. D. et al. Eocene Patagonia fossils of the Daisy family. Science 329,1621 (2010).
4. Judd, W. S., Campbell, C. S., Kellogg, E. A., Stevens, P. F. & Donoghue, M. J.Plant systematics: a phylogenetic approach. Ecol. Mediterr. 25, 215 (1999).
5. Kesseli, R. V. & Michelmore, R. W. Genome Mapping in Plants. 179–191(RG Landes Co., Georg, 1997).
6. Dempewolf, H., Rieseberg, L. & Cronk, Q. Crop domestication in theCompositae: a family-wide trait assessment. Genet. Resour. Crop Evol. 55,1141–1157 (2008).
7. FAO. FAOSTAT. FAOSTAT, http://faostat3.fao.org/home/E (2015).8. Peng, Y. et al. De novo genome assembly of the economically important weed
horseweed using integrated data from multiple sequencing platforms. PlantPhysiol. 166, 1241–1254 (2014).
9. Scaglione, D. et al. The genome sequence of the outbreeding globe artichokeconstructed de novo incorporating a phase-aware low-pass sequencing strategyof F1 progeny. Sci. Rep 6, 19427 (2016).
10. Anonymous. Crop Values: 2014 Summary. USDA, http://usda.mannlib.cornell.edu/MannUsda/homepage.do (2015).
11. Michaelson, M. J., Price, H. J., Ellison, J. R. & Johnston, J. S. Comparison ofplant DNA contents determined by Feulgen microspectrophotometry and laserflow cytometry. Am. J. Bot. 78, 183–188 (1991).
12. Koopman, W. J. M. & De Jong, J. H. A numerical analysis of karyotypes andDNA amounts in lettuce cultivars and species (Lactuca subsect. Lactuca,Compositae). Acta Bot. Neerl. 45, 211–222 (1996).
13. Putnam, N. H. et al. Chromosome-scale shotgun assembly using an in vitromethod for long-range linkage. Genome Res. 26, 342–350 (2016).
14. Flot, J.-F., Marie-Nelly, H. & Koszul, R. Contact genomics: scaffolding andphasing (meta)genomes using chromosome 3D physical signatures. FEBS Lett.589, 2966–2974 (2015).
15. Rice, E. S. et al. Improved genome assembly of American alligator genomereveals conserved architecture of estrogen signaling. Preprint at bioRxiv,http://biorxiv.org/content/early/2016/08/01/067165 (2016).
16. Session, A. M. et al. Genome evolution in the allotetraploid frog Xenopus laevis.Nature 538, 336–343 (2016).
17. Michael, T. P. & VanBuren, R. Progress, challenges and the future of cropgenomes. Curr. Opin. Plant Biol. 24, 71–81 (2015).
18. Matvienko, M. et al. Consequences of normalizing transcriptomic and genomiclibraries of plant genomes using a duplex-specific nuclease andtetramethylammonium chloride. PLoS ONE 8, e55913 (2013).
NATURE COMMUNICATIONS | DOI: 10.1038/ncomms14953 ARTICLE
NATURE COMMUNICATIONS | 8:14953 | DOI: 10.1038/ncomms14953 | www.nature.com/naturecommunications 9
19. Parra, G., Bradnam, K. & Korf, I. CEGMA: a pipeline to accuratelyannotate core genes in eukaryotic genomes. Bioinformatics 23, 1061–1067(2007).
20. Truco, M. J. et al. An ultra high-density, transcript-based, genetic map ofLettuce. G3 Genes Genomes Genetics 3, 617–631 (2013).
21. Jones, P. et al. InterProScan 5: genome-scale protein function classification.Bioinformatics 30, 1236–1240 (2014).
22. Kanehisa, M. & Goto, S. KEGG: kyoto encyclopedia of genes and genomes.Nucleic Acids Res. 28, 27–30 (2000).
23. Zhai, J. et al. MicroRNAs as master regulators of the plant NB-LRR defensegene family via the production of phased, trans-acting siRNAs. Genes Dev. 25,2540–2553 (2011).
24. Fei, Q., Xia, R. & Meyers, B. C. Phased, secondary, small interferingRNAs in posttranscriptional regulatory networks. Plant Cell 25, 2400–2415(2013).
25. Arikit, S. et al. An atlas of soybean small RNAs identifies phased siRNAs fromhundreds of coding genes. Plant Cell 26, 4584–4601 (2014).
26. Zhai, J., Arikit, S., Simon, S. A., Kingham, B. F. & Meyers, B. C. Rapidconstruction of Parallel Analysis of RNA End (PARE) libraries for Illuminasequencing. Methods 67, 84–90 (2014).
27. Fischer, S. et al. Using OrthoMCL to assign proteins to OrthoMCL-DB groupsor to cluster proteomes into new ortholog groups. Curr. Protoc. BioinformaChapter 6, Unit 6.12.1-19. (2002).
28. Yang, Z. PAML 4: phylogenetic analysis by maximum likelihood. Mol. Biol.Evol. 24, 1586–1591 (2007).
29. Walker, J. C. Structure and function of the receptor-like protein kinases ofhigher plants. Plant Mol. Biol. 26, 1599–1609 (1994).
30. Shiu, S.-H. & Bleecker, A. B. Plant receptor-like kinase gene family: diversity,function, and signaling. Sci. Signal. 2001, re22 (2001).
31. Christopoulou, M. et al. Genome-wide architecture of disease resistance genesin Lettuce. G3 Genes Genomes Genetics 5, 2655–2669 (2015).
32. Oh, S. K. et al. Isolation, characterization, and functional analysis of a novelcDNA clone encoding a small rubber particle protein from Hevea brasiliensis.J. Biol. Chem. 274, 17132–17138 (1999).
33. Van Loon, L. C., Rep, M. & Pieterse, C. M. J. Significance of inducibledefense-related proteins in infected plants. Annu. Rev. Phytopathol. 44,135–162 (2006).
34. Tang, C. et al. The rubber tree genome reveals new insights into rubberproduction and species adaptation. Nat. Plants 2, 16073 (2016).
35. Bushman, B. S. et al. Identification and comparison of natural rubber from twoLactuca species. Phytochemistry 67, 2590–2596 (2006).
36. Aagaard, J. E., Olmstead, R. G., Willis, J. H. & Phillips, P. C. Duplication offloral regulatory genes in the Lamiales. Am. J. Bot. 92, 1284–1293 (2005).
37. Ibarra-Laclette, E. et al. Architecture and evolution of a minute plant genome.Nature 498, 94–98 (2013).
38. The Tomato Genome Consortium. The tomato genome sequence providesinsights into fleshy fruit evolution. Nature 485, 635–641 (2012).
39. Qin, C. et al. Whole-genome sequencing of cultivated and wild peppersprovides insights into Capsicum domestication and specialization. Proc. NatlAcad. Sci 111, 5135–5140 (2014).
40. Huang, S. et al. Draft genome of the kiwifruit Actinidia chinensis. Nat.Commun. 4, 2640 (2013).
41. Iorizzo, M. et al. A high-quality carrot genome assembly provides new insightsinto carotenoid accumulation and asterid genome evolution. Nat. Genet. 48,657–666 (2016).
42. Barker, M. S. et al. Multiple paleopolyploidizations during the evolution of theCompositae reveal parallel patterns of duplicate gene retention after millions ofyears. Mol. Biol. Evol. 25, 2445–2455 (2008).
43. Bremer, B. et al. Phylogenetics of asterids based on 3 coding and 3 non-codingchloroplast DNA markers and the utility of non-coding DNA at highertaxonomic levels. Mol. Phylogenet. Evol. 24, 274–301 (2002).
44. Wang, X. et al. The genome of the mesopolyploid crop species Brassica rapa.Nat. Genet. 43, 1035–1039 (2011).
45. Chapman, M. A., Leebens-Mack, J. H. & Burke, J. M. Positive selection andexpression divergence following gene duplication in the sunflower Cycloideagene family. Mol. Biol. Evol. 25, 1260–1273 (2008).
46. Garcia, S. et al. Recent updates and developments to plant genome sizedatabases. Nucleic Acids Res. 42, D1159–D1166 (2013).
47. Vanneste, K., Baele, G., Maere, S. & Van de Peer, Y. Analysis of 41 plantgenomes supports a wave of successful genome duplications in association withthe Cretaceous-Paleogene boundary. Genome Res. 24, 1334–1347 (2014).
48. Fawcett, J. A., Maere, S. & Van de Peer, Y. Plants with double genomes mighthave had a better chance to survive the Cretaceous-Tertiary extinction event.Proc. Natl Acad. Sci. 106, 5737–5742 (2009).
49. Jiao, Y. et al. Ancestral polyploidy in seed plants and angiosperms. Nature 473,97–100 (2011).
50. Blomme, T. et al. The gain and loss of genes during 600 million years ofvertebrate evolution. Genome Biol. 7, R43 (2006).
51. Seaman, F. C. Sesquiterpene lactones as taxonomic characters in the Asteraceae.Bot. Rev. 48, 121–594 (1982).
52. Oh, M.-M., Trick, H. N. & Rajashekar, C. B. Secondary metabolism andantioxidants are involved in environmental adaptation and stress tolerance inLettuce. J. Plant Physiol. 166, 180–191 (2009).
53. Doyle, J. & Doyle, J. L. Genomic plant DNA preparation from fresh tissue-CTAB method. Phytochem. Bull 19, 11–15 (1987).
54. Rogers, S. O. & Bendich, A. J. in Plant Molecular Biology Manual. (eds Gelvin,S. B., Schilperoort, R. A. & Verma, D. P. S.) 73–83 (Springer Netherlands,1988).
55. Kozik, A. Suite of python MadMapper scripts for quality control ofgenetic markers, group analysis and inference of linear order of markers onlinkage groups (2006). Available at: http://cgpdb.ucdavis.edu/XLinkage/MadMapper/.
56. Wu, Y., Bhat, P. R., Close, T. J. & Lonardi, S. Efficient and accurate constructionof genetic linkage maps from the minimum spanning tree of a graph. PLoSGenet 4, e1000212 (2008).
57. Stoffel, K. et al. Development and application of a 6.5 million featureAffymetrix Genechip for massively parallel discovery of single positionpolymorphisms in lettuce (Lactuca spp.). BMC Genomics 13, 185 (2012).
58. Li, R. et al. De novo assembly of human genomes with massively parallel shortread sequencing. Genome Res. 20, 265–272 (2010).
59. Smit, A., Hubley, R. & Green, P. RepeatMasker Open-3.0. http://www.repeatmasker.org (2017).
60. Jurka, J. et al. Repbase Update, a database of eukaryotic repetitive elements.Cytogenet. Genome Res. 110, 462–467 (2005).
61. Benson, G. Tandem repeats finder: a program to analyze DNA sequences.Nucleic Acids Res. 27, 573–580 (1999).
62. Lowe, T. M. & Eddy, S. R. tRNAscan-SE: a program for improved detection oftransfer RNA genes in genomic sequence. Nucleic Acids Res. 25, 955–964(1997).
63. Lowe, T. M. & Eddy, S. R. A computational screen for methylation guidesnoRNAs in yeast. Science 283, 1168–1171 (1999).
64. Lagesen, K. et al. RNAmmer: consistent and rapid annotation of ribosomalRNA genes. Nucleic Acids Res. 35, 3100–3108 (2007).
65. Nawrocki, E. P. & Eddy, S. R. Infernal 1.1: 100-fold faster RNA homologysearches. Bioinforma. 29, 2933–2935 (2013).
66. Nawrocki, E. P. et al. Rfam 12.0: Updates to the RNA families database. NucleicAcids Res. 43, D130–D137 (2015).
67. Langmead, B., Trapnell, C., Pop, M. & Salzberg, S. L. Ultrafast and memory-efficient alignment of short DNA sequences to the human genome. GenomeBiol. 10, R25 (2009).
68. Xia, R. et al. MicroRNA superfamilies descended from miR390 and theirroles in secondary small interfering RNA biogenesis in Eudicots. Plant Cell 25,1555–1572 (2013).
69. Kakrana, A., Hammond, R., Patel, P., Nakano, M. & Meyers, B. C. sPARTA:a parallelized pipeline for integrated analysis of plant miRNA and cleavedmRNA data sets, including new miRNA target-identification software. NucleicAcids Res. 42, e139 (2014).
70. Kozik, A. et al. in Plant and Animal Genomes Conference XVI, P6 (2008).71. Lyons, E., Pedersen, B., Kane, J. & Freeling, M. The value of nonmodel genomes
and an example using SynMap within CoGe to dissect the hexaploidy thatpredates the Rosids. Trop. Plant Biol. 1, 181–190 (2008).
72. Kumar, S., Tamura, K., Jakobsen, I. B. & Nei, M. MEGA2: molecularevolutionary genetics analysis software. Bioinforma. 17, 1244–1245 (2001).
73. Stamatakis, A., Ludwig, T. & Meier, H. RAxML-III: a fast program formaximum likelihood-based inference of large phylogenetic trees. Bioinforma.21, 456–463 (2005).
74. Moriya, Y., Itoh, M., Okuda, S., Yoshizawa, A. C. & Kanehisa, M. KAAS: anautomatic genome annotation and pathway reconstruction server. Nucleic AcidsRes. 35, W182–W185 (2007).
75. Finn, R. D. et al. Pfam: the protein families database. Nucleic Acids Res. 42,D222–D230 (2014).
76. R Core Team. R: A Language and Environment for Statistical Computing.Available at https://www.r-project.org.
AcknowledgementsWe thank Bicheng Yang (BGI) for the project management that generated the initialassembly. We also thank the Dovetail Genomics team, particularly Margot Hartley,Michelle Vierra, Marco Blanchette, Brandon Rice and Nik Putnam, for generating andanalysing the in vitro proximity ligation data as well as Kariena Dill for comments on adraft of this paper. The work was supported by the Lettuce Genomics SequencingConsortium that comprised of Agrisemen, BGI, Enza Zaden, Gautier Semences, ISISementi, Monsanto, Rijk Zwaan, Syngenta, Takii, Tozers, Vilmorin and The UC DavisGenome Center, plus the NSF Plant Genome Program award # DBI0820451 and theNational Research Initiative (NRI) Specialty Crops Research Initiative (SCRI) of theUSDA Cooperative State Research, Education and Extension Service (CSREES) awards
ARTICLE NATURE COMMUNICATIONS | DOI: 10.1038/ncomms14953
10 NATURE COMMUNICATIONS | 8:14953 | DOI: 10.1038/ncomms14953 | www.nature.com/naturecommunications
# 2010-51181-21631 and 2015-51181-24283 to R.W.M. Analysis of small RNAs andphasiRNAs was supported by NSF IOS award #1257869 to B.C.M.
Author contributionsThe BGI team (Z.W., X.Y., C.S., L.X., S.Z., C.X., X.X.) was responsible for the libraryconstruction, genome sequencing, and initial assembly and analyses. The UC Davis team(S.R.-C.-W., D.O.L., A.K., L.F., M.-J.T., H.X., K.C., I.K., R.W.M.) was responsible formaterial preparation, sequencing of the gene space, cDNAs and RILs, genetic validation,and secondary analyses. Small RNAs were analysed by S.A. and R.X. with input byB.C.M. The paper was written by S.R.-C.-W. and R.W.M. with significant contributionsfrom many of the authors.
Additional informationSupplementary Information accompanies this paper at http://www.nature.com/naturecommunications
Competing interests: The authors declare no competing financial interests.
Reprints and permission information is available online at http://npg.nature.com/reprintsandpermissions/
How to cite this article: Reyes-Chin-Wo, S. et al. Genome assembly with in vitroproximity ligation data and whole-genome triplication in lettuce. Nat. Commun. 8, 14953doi: 10.1038/ncomms14953 (2017).
Publisher’s note: Springer Nature remains neutral with regard to jurisdictional claims inpublished maps and institutional affiliations.
This work is licensed under a Creative Commons Attribution 4.0International License. The images or other third party material in this
article are included in the article’s Creative Commons license, unless indicated otherwisein the credit line; if the material is not included under the Creative Commons license,users will need to obtain permission from the license holder to reproduce the material.To view a copy of this license, visit http://creativecommons.org/licenses/by/4.0/
r The Author(s) 2017
NATURE COMMUNICATIONS | DOI: 10.1038/ncomms14953 ARTICLE
NATURE COMMUNICATIONS | 8:14953 | DOI: 10.1038/ncomms14953 | www.nature.com/naturecommunications 11
Recommended