
Geothermal Heating and its Influence on theMeridional Overturning Circulation
Jeffery R. Scott
Program in Atmospheres, Oceans, and Climate
Massachusetts Institute of Technology, Cambridge, MA 02139
Jochem Marotzke
School of Ocean & Earth Science
Southampton Oceanography Center, Southampton, SO14 3ZH, United Kingdom
Alistair Adcroft
Program in Atmospheres, Oceans, and Climate
Massachusetts Institute of Technology, Cambridge, MA 02139
JGR-Oceans, in press
June, 2001
Corresponding Author address: Jeffery R. Scott,
MIT Room 54-1711, Cambridge, MA 02139
[email protected], (617) 258-5745

Page 2
ABSTRACT
The effect of geothermal heating on the meridional overturning circulation is examined using an
idealized, coarse-resolution ocean general circulation model. This heating is parameterized as a
spatially uniform heat flux of 50 mW m-2 through the (flat) ocean floor, in contrast with previous
studies that have considered an isolated hotspot or a series of plumes along the mid-Atlantic
ridge. The equilibrated response is largely advective: a deep perturbation of the meridional
overturning cell on the order of several Sv is produced, connecting with an upper-level
circulation at high latitudes, allowing the additional heat to be released to the atmosphere. Rising
motion in the perturbation deep cell is concentrated near the equator. The upward penetration of
this cell is limited by the thermocline, analogous to the role of the stratosphere in limiting the
upward penetration of convective plumes in the atmosphere. The magnitude of the advective
response is inversely proportional to the deep stratification; with a weaker background
meridional overturning circulation and a less stratified abyss, the overturning maximum of the
perturbation deep cell is increased. This advective response also cools the low-latitude
thermocline. The qualitative behavior is similar in both a single hemisphere and double
hemisphere configuration.
The anomalous circulation driven by geothermal fluxes is more substantial than previously
thought. We are able to understand the structure and strength of the response in the idealized
geometry and further extend these ideas to explain the results of Adcroft et al. [2001], where the
impact of geothermal heating was examined using a global configuration.

Page 3
1. INTRODUCTION
As the radioactive elements in our earth’s interior decay over geologic time, heat is lost through
the lithosphere. Approximately 70% of this heat flux is absorbed into the abyssal oceans and
marginal basins [Sclater et al., 1980]. Prior work has argued that both local hotspots (forming
rising plumes) along the mid-ocean ridge axes (e.g. Stommel, 1982) and the more pervasive
diffusive heating away from the ridge systems (e.g. Thompson and Johnson, 1996) play
important roles in the abyssal circulation. Nonetheless, to the best of our knowledge the weaker
widespread geothermal heating at the ocean bottom has been omitted from all previously
published ocean general circulation model results (the only exception is our own companion
paper using a global ocean model, Adcroft et al., 2001). In this study, we examine the impact of
geothermal heating in the context of an idealized ocean geometry to better understand the
structure and scaling of the circulation response.
To begin, let us compare the estimated 32 TW (1 TW = 1012 watts) of geothermal heating
through the ocean floor [Stein et al., 1995] with other important energy fluxes in the climate
system. The meridional oceanic heat flux is approximately 2000 TW [Macdonald and Wunsch,
1996] and the solar flux of energy at the ocean surface is greater still by an order of magnitude.
Presumably, the contrast between these numbers underpins modelers’ justification for the
omission of the geothermal flux. However, as first noted by Sandström [1908], the net heating of
the oceans occurs in the tropics, at high geopotential, and is therefore unable to directly drive a
strong large-scale overturning circulation. More recently, Huang [1999] used a simple tube
model of the ocean circulation to suggest that surface heating can produce a weak circulation that
is rate-limited by diffusive mixing, as first suggested by Jeffreys [1925], whereas deep heating
can only produce a very strong circulation, rate-limited by friction. Thus, it is not clear a priori
that even a weak geothermal energy flux is necessarily negligible.
Until recently, nearly all attention has focused on the dynamics of plumes at mid-ocean ridges.
Hydrothermal venting at high temperatures (roughly 350 °C) can produce steady-state plumes or
transient thermals, also known as “megaplumes” or event plumes. A typical black smoker can
release 60 megawatts, whereas event plumes are thought to produce a heat flux several orders of
magnitude greater [Lupton, 1995]. These local sources entrain surrounding waters as they rise to
a level of neutral buoyancy, or spreading level. The amount of entrained water is not negligible,
owing to the disparity between the ambient and venting water temperatures; Kadko [1995]
estimated that the total vertical transport may be as large as 12 Sv, i.e., the same order of
magnitude as the meridional overturning circulation. The influence of rotation causes entraining

Page 4
fluid to circulate cyclonically, whereas the flow is anti-cyclonic in the spreading phase (see
Helfrich and Speer, 1995, for a review of hydrothermal convective plume growth). In the
absence of background flow, the β effect would propagate tracers and temperature perturbations
westward [Stommel, 1982]. Evidence of this westward propagation has been observed at depth
[Lupton and Craig, 1981]. Joyce and Speer [1987] showed that if a background Stommel and
Arons [1960] abyssal flow is included (directed north and eastward), characteristics originating
from a plume may tend westward or eastward, depending on the ratio of the background flow
velocity to the long baroclinic Rossby wave phase speed (see also Speer, 1989).
Although less remarkable for their local dynamical effect, low temperature venting occurs at
both mid-ocean ridge axes and along ridge flanks. Ocean crust that is older than about 50-70
million years does not produce significant hydrothermal circulations [Stein et al., 1995], yet
continued cooling and radiogenic decay maintain a background heat flux of 38 to 46 mW m-2
[Sclater et al., 1980]. What is perhaps most notable from a thermodynamic perspective is the
division of heat flux into the ocean. Stein et al. [1995] estimated 34 ± 12% is released through
hydrothermal heat flux, and of this only 29% occurs directly along the ridge axes. Joyce et al.
[1986] employed a scaling argument to show that the weak background heat flux has a negligible
effect on the local potential vorticity balance. However, in this study we will consider the non-
local effect of the background heating through the ocean floor, which we will show has a
measurable effect on the abyssal circulation.
In keeping with the exploratory nature of this paper, our general circulation model is highly
idealized, as described in Section 2. This paper extends the Adcroft et al. [2001] study, where a
similar geothermal forcing was employed in a realistic global configuration, by examining the
transient response and by performing several sensitivity runs. Our simpler configuration
facilitates an improved dynamical understanding of the geothermal response. In Section 3, we
begin with a perturbation analysis of the flow and temperature structure that results from
geothermal heating in a single hemisphere ocean. A dynamical interpretation of these results is
provided. In Section 4, the sensitivity of these results to different model forcings is examined.
Several experiments in a double-hemisphere ocean basin are presented in Section 5, with a more
explicit comparison to the results in Adcroft et al. [2001]. We conclude with some discussion of
what these results suggest about the dynamics of the model ocean and some thoughts on how
these results might apply in the real ocean.

Page 5
2. MODEL DESCRIPTION
We employ the z-coordinate, primitive equation model MOM2 (beta version 2.0), as described in
Pacanowski [1996]. The ocean configuration and forcings for our single hemisphere runs are
those in Marotzke [1997] and Scott and Marotzke [2001; hereafter SM], with the addition of
geothermal heating as represented by a uniform heat flux of 50 mW m-2 through the ocean floor.
The domain is a 60° wide sector, ranging from the equator to 64°, with a constant depth of 4500
meters. Surface temperature and salinity are relaxed toward an identical, zonally uniform cosine
profile, with peak-to-peak amplitudes of 27°C and 1.5 psu, respectively, using a 30-day
relaxation time constant. For simplicity, no wind stress is imposed. Horizontal resolution is
1.875° zonally by 2° meridionally, using 30 vertical levels ranging from 50 meters at the surface
to 250 meters at the lowest level. At this resolution, it is not possible to resolve dynamically
active convective plumes, so the effect of local geothermal hot spots is ignored.
In our model runs, we will assume that diapycnal mixing rates are determined through a
prescribed diffusivity, investigating the role of deep heating rather than the likelihood that
geothermal heating leads to measurable deep mixing (the latter being a more difficult problem, in
our opinion). As in SM, diapycnal mixing is imposed in the columns adjacent to the north, south,
east and west sidewalls, and is set to zero elsewhere; this is thought to mimic the effect of
enhanced mixing due to a sloping lateral boundary. Diapycnal mixing at the equator is a
surrogate for the global integral of mixing throughout the rest of the world’s oceans. Unless
specified otherwise, boundary diapycnal diffusivity is set to 10 ×10−4 m2s−1 , which produces an
area-averaged diffusivity of 1.15 ×10⁻⁴ m2s−1 . For comparative purposes, we also ran our single
hemisphere geothermal configuration with the more traditional approach of uniform diffusivity
(using this area-averaged value), which showed only small quantitative differences (see SM for
further discussion of boundary versus uniform mixing).
In section 5, a second hemisphere is added to the model so that the northern and southern basins
are identical. In this configuration, we impose our boundary mixing scheme as above, but do not
parameterize diapycnal mixing along the equator (as there is no longer a boundary located there).
For computational efficiency, some of the experiments were run at half resolution, i.e., 3.75° x
4°, 16 vertical levels. In these runs, the diapycnal mixing coefficient along the boundaries was
decreased 50% for comparative purposes with the standard runs, and the horizontal viscosity was
changed to resolve the Munk boundary layer at the new zonal grid spacing. There was no

Page 6
qualitative difference in the geothermal response between similarly configured runs at different
resolution.
All model runs were integrated to equilibrium, as defined by a basin-averaged surface heat flux
within 5 mW m-2 of the area-integrated geothermal heat flux and/or when overturning is
discernibly within 0.1 Sv of its final value. All experiments with geothermal heating were spun
up from a similarly configured steady-state run without applied geothermal heating. Unless
specified otherwise, geothermal heating was implemented via a uniform heat flux through the
bottom boundary. We did not parameterize any hydrothermally generated salinity flux through
the bottom boundary.
3. SINGLE HEMISPHERE GEOTHERMAL HEATING
3.1. Preliminaries
Before proceeding to the model results, consider a scaling analysis of a simple uniform diffusive
response to the geothermal heating. In steady-state balance, the extra heat input through the
bottom boundary must eventually be released to the atmosphere through the surface heat flux.
Given our surface restoring timescale of 30 days and a mixed layer depth of 50 meters, a sea
surface temperature increase of only 0.006 °C is required to “radiate” away an additional 50 mW
m-2. The vertical temperature structure in this diffusive model can be deduced by balancing the
additional deep heat input with the diffusion of an anomalous temperature gradient [see also
Adcroft et al., 2001]:
cpρoκ v∂z ′T ≈ cpρoκ v ∆ ′T H = 50 mW m−2 (1)
We find that for an ocean depth H of 4500 meters, the top to bottom anomalous temperature
difference is 0.5 °C (assuming κ v = × − −1 15 10 4. m s2 1 , our area-averaged vertical diffusivity).
Our calculation of ′T at the surface implies that virtually all of this temperature difference
occurs in the abyss. In other words, the presence of geothermal heating leads to a lowest order
change in the oceans’ deep water properties! In light of this simple calculation, it is somewhat
surprising that the effect of geothermal heating has not received more attention. An important
caveat, however, is that this analysis presumes that a purely diffusive response is dynamically
possible; on a rapidly rotating planet, even small changes in the temperature structure produce an
advective response through geostrophic balance.

Page 7
3.2. Initial transient response
In response to uniform geothermal heating of 50 mW m-2, convective mixing in the lowest
model layers is triggered in the tropics, except near the deep western boundary current (Fig. 1).
Convection occurs here because the flow is sluggish and near the terminus of the abyssal flow
pathway, and has therefore been exposed to warming from the bottom boundary longer than
more newly injected deep water. Since the abyssal waters are very weakly stratified, even weak
heating from below is sufficient to initiate convective adjustment. Continued geothermal heating
leads to increased convective penetration, effectively distributing the boundary heat flux over an
expanding column of water. Analogous to a convective plume in the tropical atmosphere,
however, penetration is ultimately limited by an area of sharply increased stratification. In the
atmosphere, this increase in stratification is delineated by the tropopause, whereas the analog in
the ocean is the base of the thermocline. Present-day geothermal heat fluxes are too small to
allow for any significant penetration of convective mixing into an existing thermocline.
On the timescale of a few hundred years, a perturbation circulation develops in response to
changes in the deep temperature structure. At steady state, flow through the abyss is increased,
and tropical deep convective mixing is no longer triggered from below. We will not attempt to
further diagnose the spin-up of this circulation, but will instead focus on the steady-state
response.
This transient behavior provides a qualitative link between the local hydrothermal plume models
and our steady-state geothermal response, as the lack of maintained convection from below in
the latter might otherwise obscure this connection.
3.3. Perturbation analysis
In Fig. 2a, we show the steady-state meridional overturning circulation and zonally averaged
thermal structure of our standard run. Compared to an identically configured run without
geothermal heating (see SM’s Fig. 2a), the main meridional overturning circulation is similar,
and its maximum near 50°N at 1 km depth is increased by only 0.4 Sv. However, the response at
low latitudes is much stronger (Fig. 2b): A deep meridional overturning cell is produced, with an
overturning maximum of 3.8 Sv. All rising motion in the zonal mean occurs alongside the
equator; net sinking occurs at all other latitudes, but is concentrated primarily in the tropics and
at high latitudes. Only 0.1 Sv flows through the thermocline.
Page 8
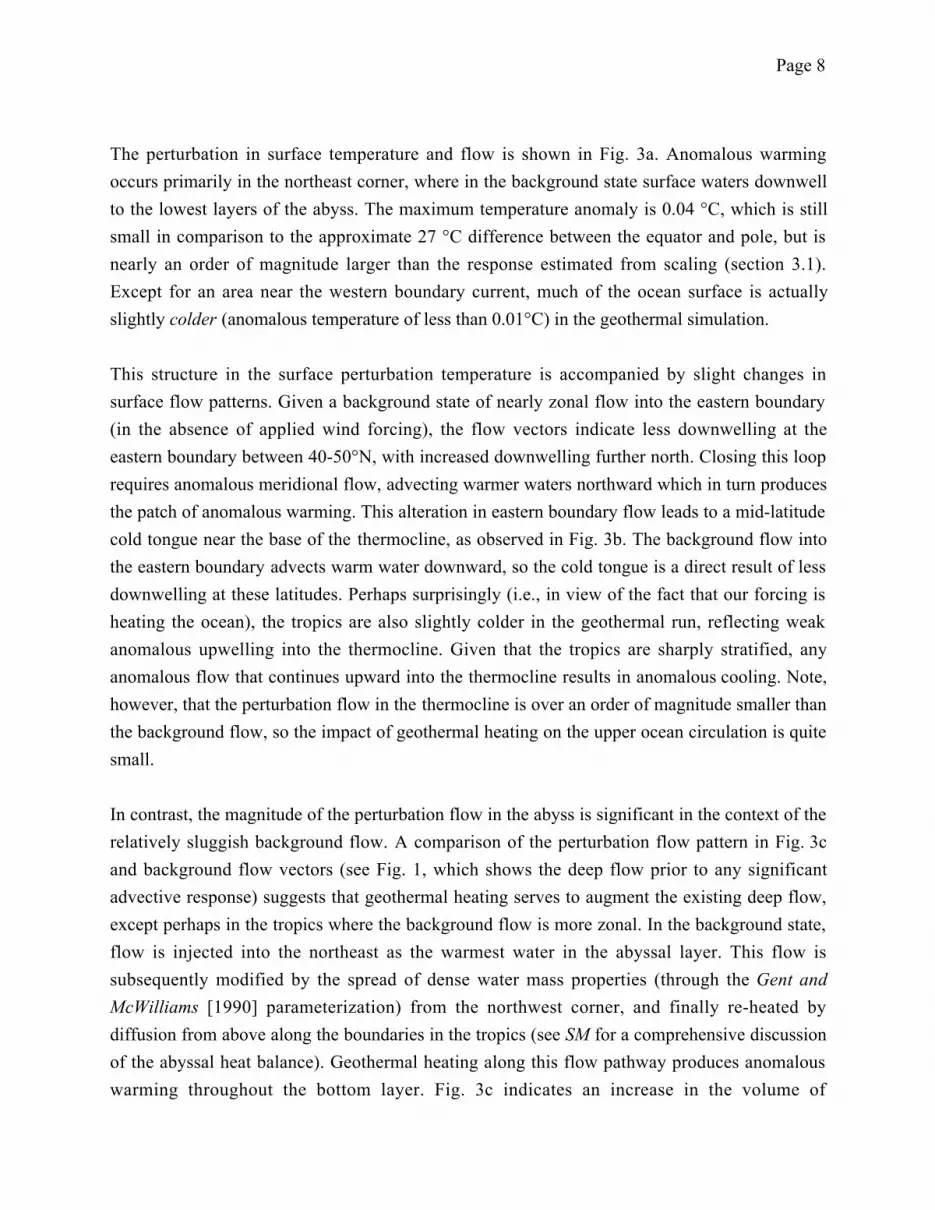
The perturbation in surface temperature and flow is shown in Fig. 3a. Anomalous warming
occurs primarily in the northeast corner, where in the background state surface waters downwell
to the lowest layers of the abyss. The maximum temperature anomaly is 0.04 °C, which is still
small in comparison to the approximate 27 °C difference between the equator and pole, but is
nearly an order of magnitude larger than the response estimated from scaling (section 3.1).
Except for an area near the western boundary current, much of the ocean surface is actually
slightly colder (anomalous temperature of less than 0.01°C) in the geothermal simulation.
This structure in the surface perturbation temperature is accompanied by slight changes in
surface flow patterns. Given a background state of nearly zonal flow into the eastern boundary
(in the absence of applied wind forcing), the flow vectors indicate less downwelling at the
eastern boundary between 40-50°N, with increased downwelling further north. Closing this loop
requires anomalous meridional flow, advecting warmer waters northward which in turn produces
the patch of anomalous warming. This alteration in eastern boundary flow leads to a mid-latitude
cold tongue near the base of the thermocline, as observed in Fig. 3b. The background flow into
the eastern boundary advects warm water downward, so the cold tongue is a direct result of less
downwelling at these latitudes. Perhaps surprisingly (i.e., in view of the fact that our forcing is
heating the ocean), the tropics are also slightly colder in the geothermal run, reflecting weak
anomalous upwelling into the thermocline. Given that the tropics are sharply stratified, any
anomalous flow that continues upward into the thermocline results in anomalous cooling. Note,
however, that the perturbation flow in the thermocline is over an order of magnitude smaller than
the background flow, so the impact of geothermal heating on the upper ocean circulation is quite
small.
In contrast, the magnitude of the perturbation flow in the abyss is significant in the context of the
relatively sluggish background flow. A comparison of the perturbation flow pattern in Fig. 3c
and background flow vectors (see Fig. 1, which shows the deep flow prior to any significant
advective response) suggests that geothermal heating serves to augment the existing deep flow,
except perhaps in the tropics where the background flow is more zonal. In the background state,
flow is injected into the northeast as the warmest water in the abyssal layer. This flow is
subsequently modified by the spread of dense water mass properties (through the Gent and
McWilliams [1990] parameterization) from the northwest corner, and finally re-heated by
diffusion from above along the boundaries in the tropics (see SM for a comprehensive discussion
of the abyssal heat balance). Geothermal heating along this flow pathway produces anomalous
warming throughout the bottom layer. Fig. 3c indicates an increase in the volume of

Page 9
downwelling water into the northeast, where a maximum temperature anomaly of 0.12 °C
occurs. In the northwest corner, however, the anomalous warming is much weaker. Here, the
convective connection to the surface effectively transports any anomalous heat out of the abyss,
creating an anomalous zonal temperature gradient at high latitudes. In the tropics, water is
warmed as it flows eastward, completing the abyssal pathway of the large-scale overturning
circulation; this heating helps to maintain an anomalous zonal temperature gradient, albeit
weaker than at higher latitudes. We will subsequently show that this zonal gradient is not
localized in the bottom layer, and that the vertical structure of the east-west temperature
difference is an essential feature of the dynamical response. The vigorous anomalous flow into
the equator is consistent with the upwelling noted in our description of the overturning cell.
The steady-state dynamical response invites several questions. Why is the anomalous upwelling
narrow and the downwelling broadly distributed? Why does geothermal heating produce an
anomalous meridional circulation at all? In the remainder of this section, we will show that the
anomalous deep circulation is ultimately governed by the requirement that the geothermal heat
flux is exported out of the abyss to the surface, where it can be “radiated away” to the
atmosphere through our restoring boundary condition.
3.4. Thermodynamic interpretation of response
In steady-state, geothermal heat input into the ocean’s bottom layer must be balanced by a
compensating heat loss through other processes. The most direct route of heat loss is through
convective exchange to the surface. However, this mechanism is quite ineffective at removing
heat input not local to the site of deep convection: Because deep convection occurs at high
latitudes, it is near the beginning of the abyssal flow pathway, hence only brief exposure to
geothermal heating has occurred. Moreover, given that the coldest water in the bottom layer
occurs at the deep convection site [Marotzke and Scott, 1999], geostrophic dynamics diverts flow
around the deep convection site, not through it. Thus, any anomalous convective heat loss is
quite limited, even if it were possible to effect a large-scale change in the deep circulation, i.e.,
re-routing the abyssal flow pathway back to high latitudes after extended exposure to geothermal
heating. Penetrative convective mixing from below, as observed in the tropics during the
transient response, can effectively distribute the geothermal heat across the abyss, but cannot
penetrate the thermocline. Hence, any convective heat exchange to the surface is prohibited at
low latitudes.

Page 10
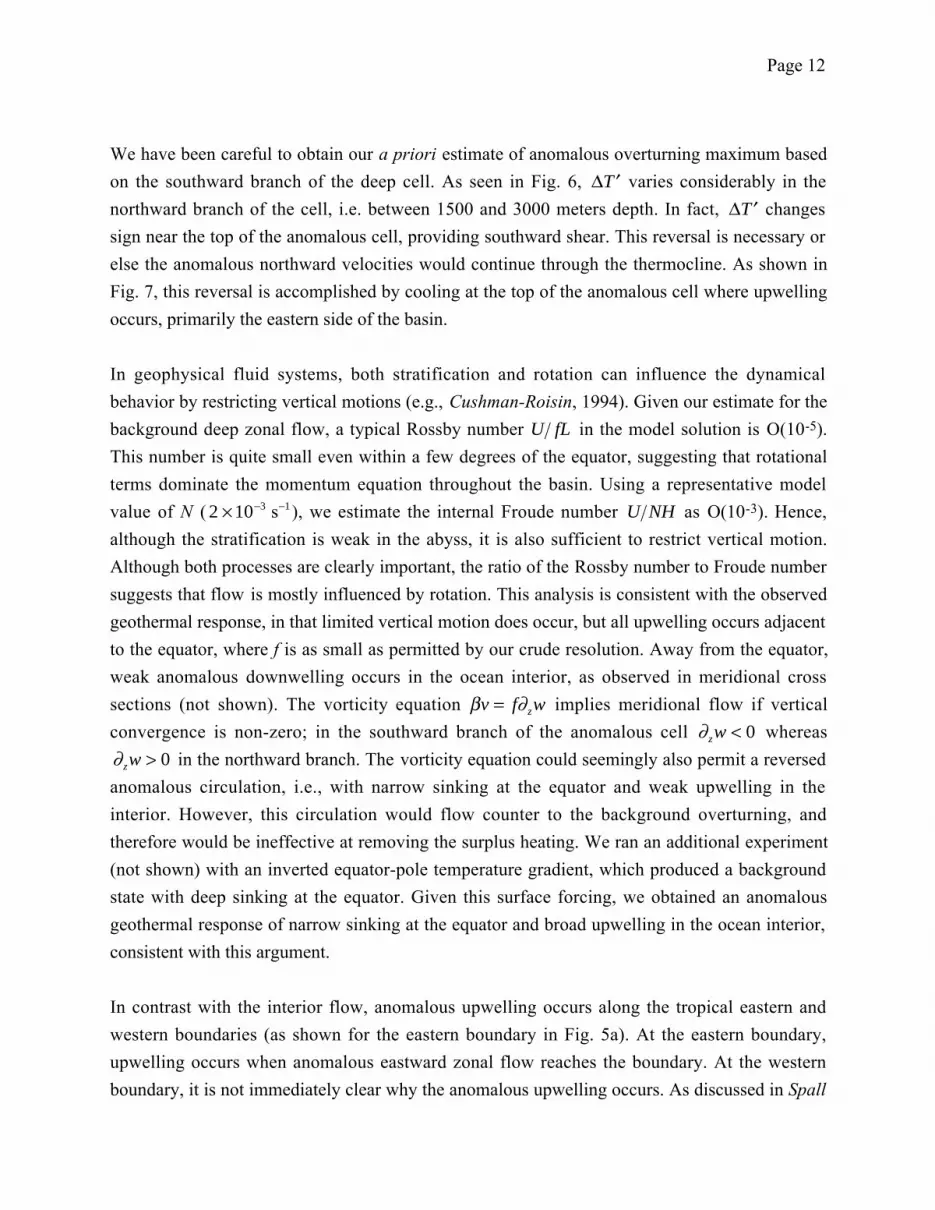
Weaker diffusive heat flow into the bottom layer constitutes a second conceivable means by
which heat balance can be achieved. The decrease in stratification on the eastern boundary
(Fig. 4; there is little change in the western boundary stratification due to the rapid flow) indeed
leads to smaller diffusive heat flux in the steady-state geothermal run. However, a rough estimate
of the heat flux from the term cpρoκ v∂zT suggests that even in the non-geothermal run, the area-
averaged deep diffusive flux is 5 mW m-2, about an order of magnitude smaller than the
geothermal flux. Hence, any decrease in downward diffusive fluxes through weakened
stratification is relatively modest.
A third process through which heat can be transported from the abyss is vertical advection. The
advective heat gain is proportional to the following expression:
wTdA w T w Tdownwelling upwelling
∫ ∫ ∫= +D D U U (2)
where A is the area of the bottom layer, and the U and D subscripts refer to upwelling and
downwelling, respectively (so that w is the magnitude of the vertical velocity). Prior to
geothermal heating, (2) is negative (i.e., downward) because relatively warm water is injected
into the bottom layer but upwelling occurs at colder temperatures [MS]. With geothermal
heating, the advective response in the upper ocean leads to greater downwelling in the northeast
corner, conveying water which is anomalously warm into the abyss (i.e., the wD ′TD and
′w TD D terms in the heat budget are both negative quantities, with the overbars and primes
indicating background and anomalous quantities, respectively). Since the anomalous temperature
is a greater at the downwelling site than in areas of upwelling, changes in (2) do not directly
account for heat loss required for balance. Rather, the advective change results in a larger
temperature difference between the properties of deep downwelling and deep convection (i.e.,
the zonal gradient at high latitudes), so the mesoscale eddy parameterization is more effective at
spreading cold water from the northwest corner, which also serves to transport enthalpy out of
the bottom layer.
The two arguments presented above— namely that water flows around the deep convection site
and that background diapycnal heat fluxes are weak—also apply to the lower abyss, implying
that an advective response across mid-depth must occur. Above mid-depth, the component of the
anomalous circulation through the high-latitudes is critical in communicating the geothermal
heating to the surface. Anomalous flow into the northeast is not limited to the surface layer, but
occurs throughout the top 2500 meters. Because deep mixed boundary layers occur along the
northern and eastern walls, as shown in Figs. 5a and 5b, respectively, anomalous heat fluxes into

Page 11
these convecting columns can be quickly communicated to the surface. Without the efficient
mixing process in these deep mixed layers, a more significant advective surface perturbation
would be required, as estimated in the beginning of this section.
3.5. Dynamics of anomalous meridional overturning circulation
In thermal wind balance, the strength of the meridional overturning circulation is a function of
the density difference between the eastern and western walls [Marotzke, 1997]. We will use this
balance to obtain an order of magnitude estimate of the perturbation deep cell, based on the
increase in temperature as a function of the zonal transit time across the tropics, which is in turn
a function of the background large-scale circulation. Given an approximate deep zonal velocity
of 0.1 cm s-1, it takes water roughly 200 years to cross the basin. Our applied geothermal heat
flux can heat a 3000 meter column of water by 0.03 °C during this “transit time” [Joyce et al.,
1986]. This value roughly agrees with the model’s anomalous temperature difference between
the east and west walls in the tropics, as shown in Fig. 6 (it is more difficult to predict the
boundary density difference at high latitudes a priori). The density difference is related to an
overturning rate through thermal wind:
∆ ′v
∆z 2= g
fρo
∆ ′ρ∆x
(3)
where ∆ ′ρ is the anomalous east-west density difference and ∆z is the depth of the abyss (i.e.,
so that ∆z 2 is approximately the depth of the southward branch of the anomalous cell). If we
assume that the meridional velocity increases linearly from maximum southward flow at the
ocean bottom and vanishes at the center of the anomalous cell (i.e., so that the average southward
velocity is ∆ ′v 2 ), the estimate of overturning strength is:
′Ψ ≈ ∆ ′v
2∆x
∆z
2= αg
8 f∆ ′T ∆z2 (4)
where α = 1.8 ×10⁻⁴ K−1 , the thermal expansion coefficient. If we take f ~ 10−5 s−1, the value of
the Coriolis parameter at 4°N (corresponding with the peak in anomalous overturning, as
observed in Fig. 2), our estimate for the anomalous overturning is 6 Sv. This estimate is
somewhat too large, but is the correct order of magnitude. The estimate is more accurate at
higher latitudes. For example, at 45°N ∆ ′T ~ 0.07 °C and f ~ 10−4 s−1, hence the estimated
overturning strength is slightly over 1 Sv, in general agreement with Fig. 2b. At the equator, use
of (4) is problematic, as the geostrophic relation breaks down and the f −1 dependence implies an
infinite response.
Page 12
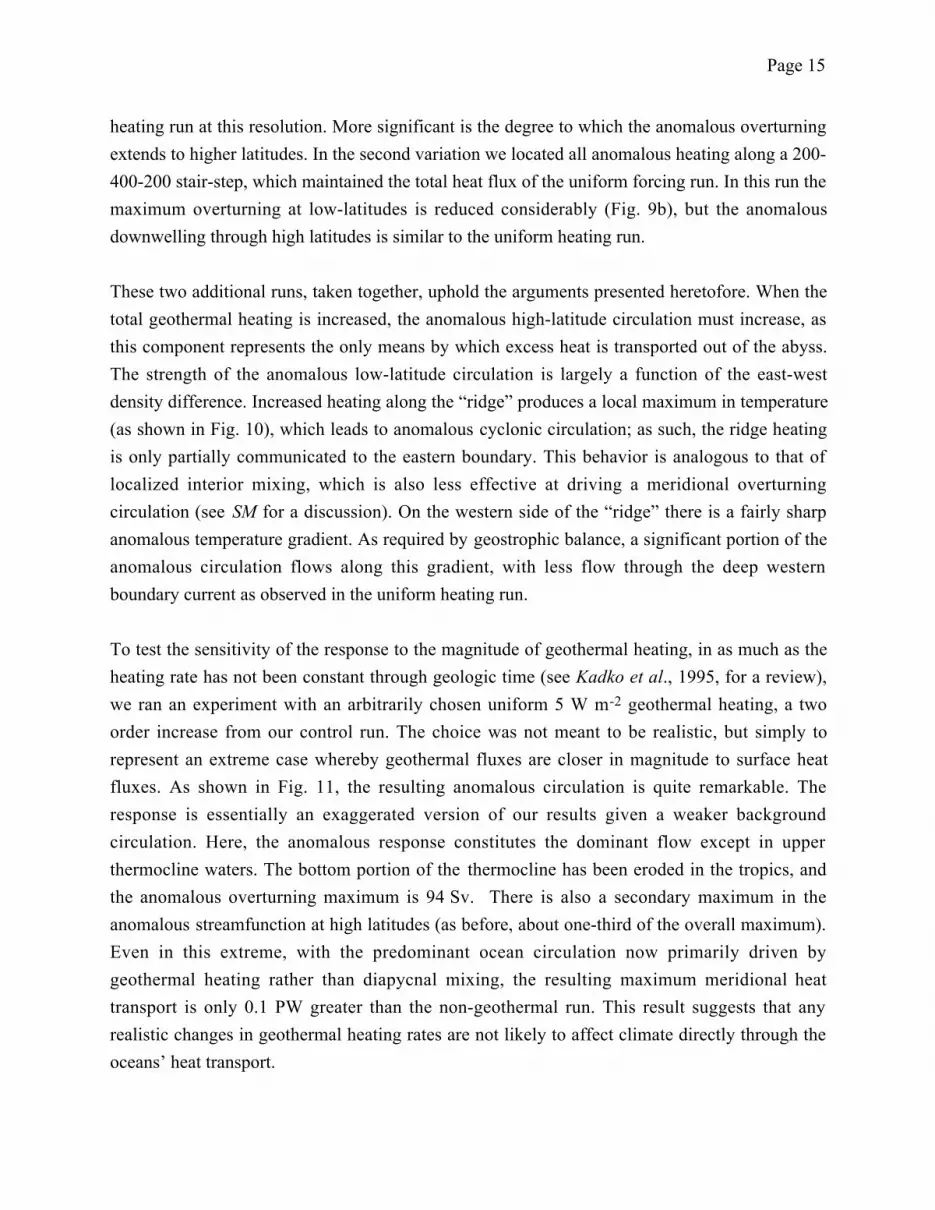
We have been careful to obtain our a priori estimate of anomalous overturning maximum based
on the southward branch of the deep cell. As seen in Fig. 6, ∆ ′T varies considerably in the
northward branch of the cell, i.e. between 1500 and 3000 meters depth. In fact, ∆ ′T changes
sign near the top of the anomalous cell, providing southward shear. This reversal is necessary or
else the anomalous northward velocities would continue through the thermocline. As shown in
Fig. 7, this reversal is accomplished by cooling at the top of the anomalous cell where upwelling
occurs, primarily the eastern side of the basin.
In geophysical fluid systems, both stratification and rotation can influence the dynamical
behavior by restricting vertical motions (e.g., Cushman-Roisin, 1994). Given our estimate for the
background deep zonal flow, a typical Rossby number U fL in the model solution is O(10-5).
This number is quite small even within a few degrees of the equator, suggesting that rotational
terms dominate the momentum equation throughout the basin. Using a representative model
value of N ( 2 ×10⁻³ s−1), we estimate the internal Froude number U NH as O(10-3). Hence,
although the stratification is weak in the abyss, it is also sufficient to restrict vertical motion.
Although both processes are clearly important, the ratio of the Rossby number to Froude number
suggests that flow is mostly influenced by rotation. This analysis is consistent with the observed
geothermal response, in that limited vertical motion does occur, but all upwelling occurs adjacent
to the equator, where f is as small as permitted by our crude resolution. Away from the equator,
weak anomalous downwelling occurs in the ocean interior, as observed in meridional cross
sections (not shown). The vorticity equation βv = f∂zw implies meridional flow if vertical
convergence is non-zero; in the southward branch of the anomalous cell ∂zw < 0 whereas
∂zw > 0 in the northward branch. The vorticity equation could seemingly also permit a reversed
anomalous circulation, i.e., with narrow sinking at the equator and weak upwelling in the
interior. However, this circulation would flow counter to the background overturning, and
therefore would be ineffective at removing the surplus heating. We ran an additional experiment
(not shown) with an inverted equator-pole temperature gradient, which produced a background
state with deep sinking at the equator. Given this surface forcing, we obtained an anomalous
geothermal response of narrow sinking at the equator and broad upwelling in the ocean interior,
consistent with this argument.
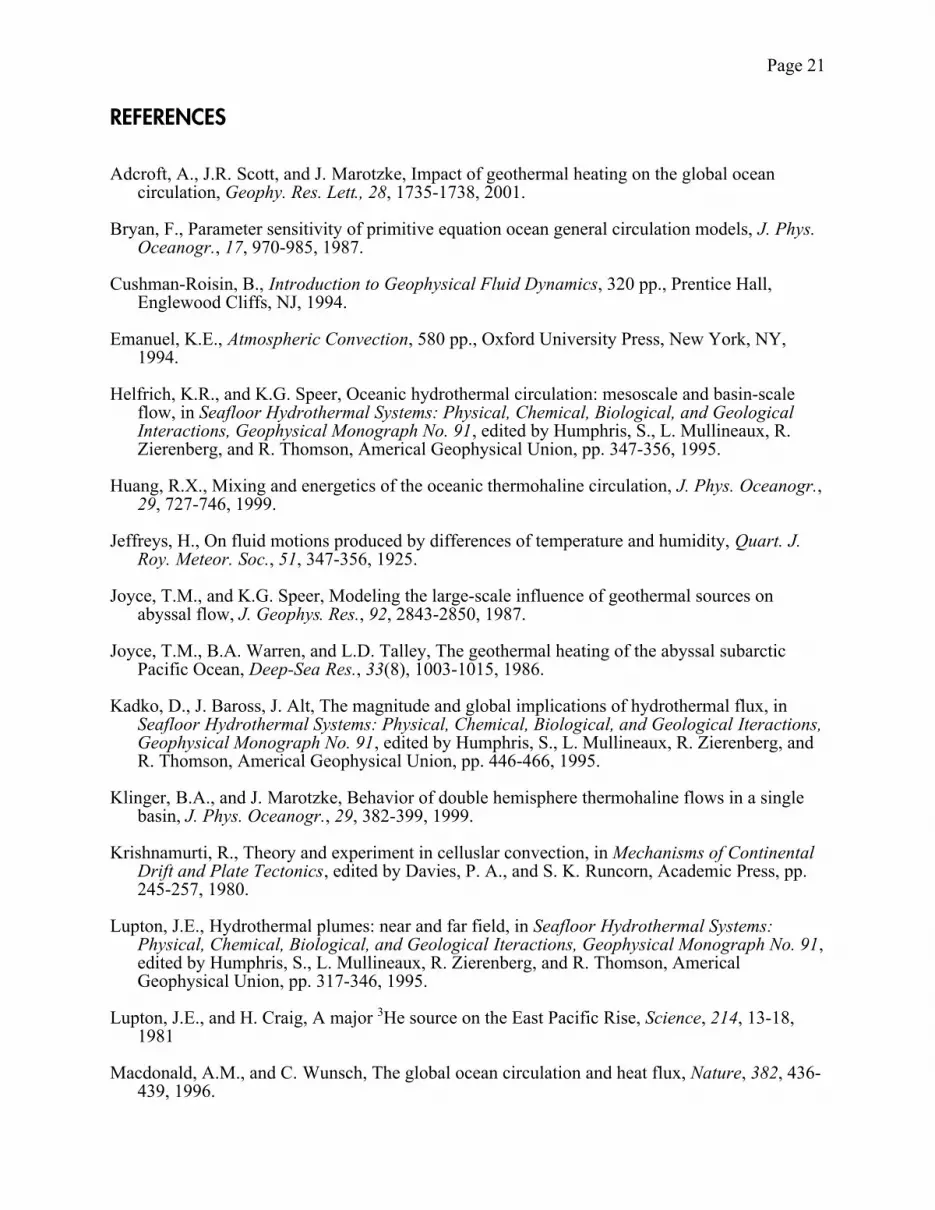
In contrast with the interior flow, anomalous upwelling occurs along the tropical eastern and
western boundaries (as shown for the eastern boundary in Fig. 5a). At the eastern boundary,
upwelling occurs when anomalous eastward zonal flow reaches the boundary. At the western
boundary, it is not immediately clear why the anomalous upwelling occurs. As discussed in Spall

Page 13
[2000], viscous terms are important in the potential vorticity budget at the boundaries.
Anomalous eastern and western boundary upwelling occurs regardless of whether diapycnal
mixing is concentrated at the boundaries, as there was no change using our model run with
uniform diffusivity.
Interestingly, the perturbation in the meridional overturning circulation is similar as forced by
either geothermal heating or enhanced deep diapycnal mixing (see SM’s Fig. 12b for the
overturning streamfunction with enhanced deep mixing, using an otherwise similarly configured
model). Not coincidentally, both geothermal heating and increased deep diffusion lead to greater
heat fluxes into the model’s bottom layer. There is a fundamental difference in the dynamics of
the response, however. With enhanced deep mixing, the rising motion of the deep cell occurs
where forced by mixing as required by advective-diffusive balance (in SM’s experiments, this
resulted in more ‘boundary’ upwelling, including along the equator). In contrast, the geothermal
heating response can be interpreted as a free response constrained by rotational dynamics.
To test whether the anomalous overturning maximum in our solution is dependent upon the
equatorial grid spacing, given the localization of anomalous upwelling in these grid cells, we re-
ran the geothermal heating simulation with resolution decreased by 50%. We found only a slight
decrease in the magnitude of the anomalous overturning cell (not shown).
4. ALTERNATE FORCING SCENARIOS
4.1. Alternate background states
Our analyses in the previous section suggest that the magnitude of the geothermal response is a
function of the background state flow and density structure. To test this hypothesis, we re-ran our
geothermal simulation with both stronger and weaker background meridional overturning
circulations.
A stronger background overturning can be achieved through increased diapycnal mixing [Bryan,
1987; Marotzke, 1997]. Here, we increased the boundary mixing strength four-fold, which
produced a maximum overturning of 31 Sv at steady-state (as compared to 12.7 Sv for the
standard run). The anomalous geothermal response in overturning is shown in Fig. 8a. There are
several reasons why this response is considerably weaker than our standard geothermal response.
First, increased mixing thickens the thermocline, thus decreasing the depth of the abyss while

Page 14
increasing its stratification. Consequently, the build-up of meridional shear resulting from east-
west boundary temperature differences occurs across a reduced depth, producing a weaker
anomalous overturning cell. Second, the background flow’s transit time through the abyss
(primarily a function of overturning strength) is decreased, resulting in weaker anomalous zonal
temperature gradients, again reducing the build-up of meridional shear. And finally, the
increased effectiveness of diffusive processes implies that a weakening in stratification can lead
to a more significant reduction in deep diffusive heat fluxes. In other words, the system is better
able to offset the geothermal heating through a diffusive response, making the advective
response less critical as a means to re-establish a steady-state heat balance.
The anomalous geothermal response with boundary diapycnal mixing strength reduced by 80%
is nearly double that of the standard experiment (Fig. 8b). Here, the background state overturning
maximum is 4.6 Sv, the same order of magnitude as the geothermal response, indicating that
non-linear interactions are likely to be significant. The opposite of the arguments employed in
the stronger mixing case apply; namely, the abyss is deeper and less stratified, the transit time
through the abyss is longer, and diffusive fluxes are extremely weak (although we suggest the
latter is of little consequence given that these fluxes are already quite small in the standard run).
Note that the increased response occurs primarily at low latitudes, as compared to Fig. 2b. The
anomalous circulation through high latitudes—whereby heat is effectively communicated to the
atmosphere through advection into deep mixed layers—is little changed, as the applied
geothermal heating is unchanged from our standard run. Given the sluggish deep circulation,
here convection along the bottom boundary is maintained even as the system has reached a
steady-state response to geothermal heating. Accordingly, the warmest waters in the bottom layer
are now found in the tropical eastern boundary rather than the northeastern corner (not shown).
Anomalous cooling in the thermocline peaks at 0.3 °C, double that of the control experiment.
4.2. Variations in distribution and magnitude of geothermal heating
As discussed in the introduction, the flux of geothermal heat is enhanced in the vicinity of the
mid-ocean ridges. To examine how localization affects the anomalous response, we ran two
variations of our geothermal heating experiment. In the first, we specified stair-step fluxes of
100-200-100 mW m2 across a 12° longitude span through the center of the ocean basin,
maintaining the background 50 mW m2 at other locales. This new forcing represented a 30%
increase in total geothermal heating. Note that this is only a partial representation of the possible
effects from ridge heating, as we maintain a flat bottom in all runs. The low-latitude response
(Fig. 9a) shows only a modest increase in maximum overturning as compared to the uniform
Page 15
heating run at this resolution. More significant is the degree to which the anomalous overturning
extends to higher latitudes. In the second variation we located all anomalous heating along a 200-
400-200 stair-step, which maintained the total heat flux of the uniform forcing run. In this run the
maximum overturning at low-latitudes is reduced considerably (Fig. 9b), but the anomalous
downwelling through high latitudes is similar to the uniform heating run.
These two additional runs, taken together, uphold the arguments presented heretofore. When the
total geothermal heating is increased, the anomalous high-latitude circulation must increase, as
this component represents the only means by which excess heat is transported out of the abyss.
The strength of the anomalous low-latitude circulation is largely a function of the east-west
density difference. Increased heating along the “ridge” produces a local maximum in temperature
(as shown in Fig. 10), which leads to anomalous cyclonic circulation; as such, the ridge heating
is only partially communicated to the eastern boundary. This behavior is analogous to that of
localized interior mixing, which is also less effective at driving a meridional overturning
circulation (see SM for a discussion). On the western side of the “ridge” there is a fairly sharp
anomalous temperature gradient. As required by geostrophic balance, a significant portion of the
anomalous circulation flows along this gradient, with less flow through the deep western
boundary current as observed in the uniform heating run.
To test the sensitivity of the response to the magnitude of geothermal heating, in as much as the
heating rate has not been constant through geologic time (see Kadko et al., 1995, for a review),
we ran an experiment with an arbitrarily chosen uniform 5 W m-2 geothermal heating, a two
order increase from our control run. The choice was not meant to be realistic, but simply to
represent an extreme case whereby geothermal fluxes are closer in magnitude to surface heat
fluxes. As shown in Fig. 11, the resulting anomalous circulation is quite remarkable. The
response is essentially an exaggerated version of our results given a weaker background
circulation. Here, the anomalous response constitutes the dominant flow except in upper
thermocline waters. The bottom portion of the thermocline has been eroded in the tropics, and
the anomalous overturning maximum is 94 Sv. There is also a secondary maximum in the
anomalous streamfunction at high latitudes (as before, about one-third of the overall maximum).
Even in this extreme, with the predominant ocean circulation now primarily driven by
geothermal heating rather than diapycnal mixing, the resulting maximum meridional heat
transport is only 0.1 PW greater than the non-geothermal run. This result suggests that any
realistic changes in geothermal heating rates are not likely to affect climate directly through the
oceans’ heat transport.

Page 16
5. GEOTHERMAL HEATING IN A DOUBLE HEMISPHERE MODEL
We wish to test whether the equatorial upwelling observed in the single hemisphere runs is a
robust feature or due to the limited geographical extent of the model. In addition, introducing a
second hemisphere adds two notable complexities to the system: a second competing source for
deepwater, and the possibility of cross-hemisphere flow. These experiments also serve as a
conceptual link between the geothermal heating results in a realistic global configuration, as
described in Adcroft et al. [2001], and our single hemisphere results. In this section we extend
our results by adding a second hemisphere to our ocean basin, setting up an asymmetric
background flow pattern through a 1°C pole-to-pole difference in surface restoring temperature
profiles. The dynamics of the two-hemisphere flow is discussed in detail in Marotzke and
Klinger [2000], but a salient feature is that northern-originated water fills much of the abyss,
with downwelling water in the southern hemisphere only able to penetrate to mid-depth.
Fig. 12 shows the anomalous meridional overturning in the double hemisphere system.
Anomalous upwelling occurs all along the equator, although there is no longer any ‘boundary’
mixing here, as was parameterized in the single hemisphere model. Total equatorial upwelling is
about the same as in the single hemisphere run, although some of the tropical downwelling
occurs in the southern hemisphere, as evidenced by the counter-clockwise cell abutting the
equator to the south. As before, the geothermal heat flux is lost to the atmosphere locally in the
northeast corner (not shown). Since the area-integrated geothermal heat flux is now twice as
large, the anomalous surface warming is greater in magnitude and covers a larger area than in the
single hemisphere run. The anomalous overturning through the northern hemisphere high
latitudes is only slightly enhanced from the single hemisphere results (viz. Fig. 2b vs. Fig. 12).
As we have argued that this component of the circulation is critical in communicating the
geothermal heat fluxes to the surface, the lack of a bigger response is surprising, and suggests
that the anomalous circulation is a more efficient heat conveyor in the double hemisphere
system. In contrast with the single hemisphere results, the enhanced downwelling in the
northeast is to large extent supported by anomalous upwelling in the southern hemisphere (as
implied by Fig. 12). As such, the cold tongue that results from anomalous upwelling into the
upper layers (as observed in Fig. 3a) is now present in the southern hemisphere. The northern
hemisphere thermocline is less anomalously cold in the double hemisphere run, so advection into
the northern hemisphere’s deep mixed boundary layers conveys a greater heat content. Thus, by
diverting anomalous flow through the southern hemisphere, the double hemisphere system is
able to effectively transport geothermal heat fluxes to the surface through a weaker advective

Page 17
response. This “global” anomalous meridional overturning cell is similar to what is observed in
Adcroft et al.’s [2001] simulation, where realistic topography presumably limits the magnitude of
the anomalous response at the equator.
As compared with the single-hemisphere system, there is little change in the flow pattern through
the northern hemisphere. In the southern hemisphere, the anomalous warming is greater, but is
nearly zonally uniform (not shown). The lack of zonal asymmetry means that a strong anomalous
meridional overturning circulation cannot be supported by thermal wind balance south of the
tropics. There is anomalous flow in the southern hemisphere which circulates zonally, however,
rising in the eastern boundary and sinking in the western boundary. Along both boundaries,
anomalous flow augments the background flow (sinking along the western boundary is necessary
for thermal wind balance of the cross-hemisphere meridional overturning circulation, as noted in
Marotzke and Klinger [2000]).
We ran two additional double hemisphere geothermal heating runs: In the first, we applied the
geothermal heating only in the northern hemisphere, and in the second we applied the flux only
in the southern hemisphere. To lowest order, the response to heating across the full basin can be
viewed as the superposition of these separate runs. In the northern-only run (Fig. 13a), the
counter-clockwise cell in the southern hemisphere is more pronounced; here, the deep heating in
the northern hemisphere results in a weak anomalous warming in the southern hemisphere abyss,
albeit with more zonal structure than when heated directly. Also note that the extension of the
anomalous overturning into the southern hemisphere high latitudes is less pronounced than in
Fig. 12. Therefore, it is not surprising that stronger anomalous flow into northern high latitudes is
observed as compared to the southern-only run (Fig. 13b), which exhibits stronger
intrahemispheric flow (the anomalous circulation through the northern high latitudes is weaker
than the full-basin heating run in both cases, as the area-integrated heat flux is decreased by
half). The southern-only run is also notable in that all anomalous downwelling occurs in the
northern hemisphere, producing a single overturning cell.
6. SUMMARY AND DISCUSSION
Our experiments illustrate the effect of geothermal heating on the large-scale circulation in an
idealized ocean basin. Prior work has focused on the dynamical response to high temperature
venting, which can penetrate to greater heights than either low-temperature venting or warming
through a weak conductive flux. Hence, only the high temperature forcing is generally thought to

Page 18
be dynamically significant, even though the integrated heat flux through the low temperature
sources is much greater than that of local hotspots [Stein et al., 1995]. Both effects are ignored in
ocean general circulation models. However, our results suggest that the omission of the low
temperature fluxes may be problematic: We find that the integrated effect of uniform weak
heating through the ocean bottom produces a significant change in the model’s deep circulation,
on the order of several Sv. Although the meridional heat transport of the anomalous circulation is
insignificant as compared to that of the background surface-forced circulation, the deep
circulation may have an important indirect effect on climate through the transport of carbon and
other nutrients, which have their concentration maxima at depth.
We find that the large-scale response to geothermal heating is largely advective, as suggested by
the change in the meridional overturning circulation. A simple diffusive response is not realized,
which would require a significant perturbation in deep-water properties. In the presence of a
background flow field, heating of the abyss does not occur uniformly; in a rotating system, these
anomalous temperature gradients are then balanced geostrophically through anomalous flow.
The change in deep circulation is governed by the requirement that the flow communicate the
geothermal heating to the surface in order that steady-state is achieved. Anomalous advection
into convecting boundary layers can effectively pipe anomalous heat to the surface, precluding
the need for strong anomalous flow at the surface. To lowest order, the geothermal response
serves to augment the pre-existing background circulation. A more stratified abyss and/or a
stronger background overturning reduce the magnitude of the geothermal response. When
geothermal heating is applied to a double hemisphere ocean model, our findings are largely
consistent with those in a single hemisphere.
In low latitudes, a maximum in the anomalous overturning circulation results from a zonal
temperature gradient that is established as deep eastward flow is warmed. All anomalous
upwelling (in the zonal mean) occurs along the equator, although some of this anomalous flow
simply recirculates in the tropics. The thermal wind relation can be used to estimate the
magnitude of this local maximum, presuming that the background flow and stratification are
known. And as might be expected in a rotating system, the thermal wind relation also can be
used to relate the anomalous overturning strength to zonal temperature gradients at mid- and high
latitudes.
From a thermodynamic standpoint, weak geothermal heating at depth is able to drive a
substantial anomalous overturning circulation because the heating occurs at low geopotential,
thus increasing potential energy. Although geothermal fluxes are much smaller in magnitude

Page 19
than surface heat fluxes, the latter occur at high geopotential and thus require diapycnal mixing
in order to drive a meridional overturning circulation.
Without the context of a background circulation, however, uniform geothermal heating is unable
to generate a coherent large-scale response. Consider the model’s response to geothermal heating
in a temperature-only “box” ocean governed by uniform surface forcing. Without an imposed
meridional temperature gradient or applied wind stress, the resulting ocean is isothermal and no
background circulation is established. If geothermal heating were to be applied uniformly along
the ocean floor, it would generate unstable columns of water everywhere. Convective adjustment
redistributes this heat throughout the full depth of the water columns, so that at the surface the
additional heat is released to the atmosphere. With steady heating from below and restoring at
the surface (cooling), every water column is in a constant state of convective adjustment. This
configuration closely resembles the classical Rayleigh-Bénard convection problem with rotation
[see Emanuel 1994, chapter 3]; presumably, with a sufficiently high-resolution model, the
steady-state solution would consist of an array of Rayleigh-Bénard convective overturning cells
(the scale of these cells would likely be on the order of the ocean depth, although the realized
form of Rayleigh-Bénard convection in our configuration is not entirely clear; Krishnamurti
[1980] found that in certain laboratory configurations with very high Rayleigh number, domain-
filling circulations were possible due to up-gradient momentum transport by convection). Given
our limited resolution, however, the convective adjustment parameterization is the only active
process in the model, conveying the deep heating directly to the surface. At no time would any
large-scale motion occur. Even though geothermal heating embodies the necessary characteristic
of heating at low geopotential, in the absence of a forced circulation or maintained stratification
it is insufficient to produce a large-scale circulation.
The connection between diffusive heating and geothermal heating as “driving” mechanisms can
be extended further. Both produce heating at depth, which can be conveyed back to the surface
through convective mixing. Thus, convection acts as a means by which the ocean can remove
heating necessary to sustain motion, whether the heating is diffusive or geothermal.
Our model is highly idealized and is therefore at best only a crude representation of the real
ocean, but has proven helpful in understanding the geothermal response in a more realistic global
configuration [Adcroft et al., 2001]; it is tempting to further speculate that geothermal heating
might similarly affect our oceans’ circulation. Although we have not made a direct comparison
between our single hemisphere model and the North Atlantic, it is implicit that our model
represents a simplified depiction of North Atlantic Deep Water circulation. However, we would

Page 20
be remiss in not pointing out several limitations that obscure how these results might apply to the
real ocean. First, our model has no topography; as such, all geothermal heating occurs at a single
depth, in contrast with the real ocean where the heating is effectively spread across a wide range
of depths. Second, our model has a single source of deep water (even in our double hemisphere
configuration), whereas the real ocean is characterized by deep water formation in both the
Northern Hemisphere and Southern Hemisphere. Given that much of the deep ocean floor is in
contact with the more dense Antarctic Bottom Water rather than North Atlantic Deep Water, we
suggest that our model is actually a better analog of how geothermal heating affects the
circulation in the South Pacific, where Antarctic Bottom Water is formed. Accordingly, the
global model results presented in Adcroft et al. [2001] show a stonger, more coherent response in
the Pacific Ocean.
ACKNOWLEDGEMENTS
We thank Bill Young, at whose suggestion these experiments were initially run. We would like
to also thank Carl Wunsch, Peter Stone, Kerry Emanual and Jason Goodman for discussions and
comments. This work was supported in part by the U.S. Department of Energy’s Office of
Biological and Environmental Research through grant DE-FG02-93ER61677 (Scott), the MIT
Joint Program on the Science and Policy of Global Change (Scott), NSF grant 9801800
(Marotzke), and by Ford, General Motors, and Daimler-Chrysler Corporations through the MIT
Climate Modeling Initiative (Adcroft).
Page 21
REFERENCES
Adcroft, A., J.R. Scott, and J. Marotzke, Impact of geothermal heating on the global oceancirculation, Geophy. Res. Lett., 28, 1735-1738, 2001.
Bryan, F., Parameter sensitivity of primitive equation ocean general circulation models, J. Phys.Oceanogr., 17, 970-985, 1987.
Cushman-Roisin, B., Introduction to Geophysical Fluid Dynamics, 320 pp., Prentice Hall,Englewood Cliffs, NJ, 1994.
Emanuel, K.E., Atmospheric Convection, 580 pp., Oxford University Press, New York, NY,1994.
Helfrich, K.R., and K.G. Speer, Oceanic hydrothermal circulation: mesoscale and basin-scaleflow, in Seafloor Hydrothermal Systems: Physical, Chemical, Biological, and GeologicalInteractions, Geophysical Monograph No. 91, edited by Humphris, S., L. Mullineaux, R.Zierenberg, and R. Thomson, Americal Geophysical Union, pp. 347-356, 1995.
Huang, R.X., Mixing and energetics of the oceanic thermohaline circulation, J. Phys. Oceanogr.,29, 727-746, 1999.
Jeffreys, H., On fluid motions produced by differences of temperature and humidity, Quart. J.Roy. Meteor. Soc., 51, 347-356, 1925.
Joyce, T.M., and K.G. Speer, Modeling the large-scale influence of geothermal sources onabyssal flow, J. Geophys. Res., 92, 2843-2850, 1987.
Joyce, T.M., B.A. Warren, and L.D. Talley, The geothermal heating of the abyssal subarcticPacific Ocean, Deep-Sea Res., 33(8), 1003-1015, 1986.
Kadko, D., J. Baross, J. Alt, The magnitude and global implications of hydrothermal flux, inSeafloor Hydrothermal Systems: Physical, Chemical, Biological, and Geological Iteractions,Geophysical Monograph No. 91, edited by Humphris, S., L. Mullineaux, R. Zierenberg, andR. Thomson, Americal Geophysical Union, pp. 446-466, 1995.
Klinger, B.A., and J. Marotzke, Behavior of double hemisphere thermohaline flows in a singlebasin, J. Phys. Oceanogr., 29, 382-399, 1999.
Krishnamurti, R., Theory and experiment in celluslar convection, in Mechanisms of ContinentalDrift and Plate Tectonics, edited by Davies, P. A., and S. K. Runcorn, Academic Press, pp.245-257, 1980.
Lupton, J.E., Hydrothermal plumes: near and far field, in Seafloor Hydrothermal Systems:Physical, Chemical, Biological, and Geological Iteractions, Geophysical Monograph No. 91,edited by Humphris, S., L. Mullineaux, R. Zierenberg, and R. Thomson, AmericalGeophysical Union, pp. 317-346, 1995.
Lupton, J.E., and H. Craig, A major 3He source on the East Pacific Rise, Science, 214, 13-18,1981
Macdonald, A.M., and C. Wunsch, The global ocean circulation and heat flux, Nature, 382, 436-439, 1996.

Page 22
Marotzke, J., Boundary mixing and the dynamics of three-dimensional thermohaline circulations,J. Phys. Oceanogr., 27, 1713-1728, 1997.
Marotzke, J., and B.A. Klinger, The dynamics of equatorially asymmetric thermohalinecirculations, J. Phys. Oceanogr., 30, 955-970, 2000.
Marotzke, J., and J.R. Scott, Convective mixing and the thermohaline circulation, J. Phys.Oceanogr., 29, 2962-2970, 1999.
Pacanowski, R.C., MOM 2.0 documentation, user’s guide, and reference manual. GFDL OceanTech. Rep. 3.1, Geophysical Fluid Dynamics Laboratory/NOAA, Princeton, NJ., 1996.[Available from GFDL/NOAA, Princeton University, P.O. Box 308, Princeton, NJ 08542.]
Sandström, J.W., Dynamische Versuche mit Meerwasser, Annalen der Hydrographie undMaritimen Meteorologie, 36, 6-23, 1908.
Sclater, J.G., C. Jaupart, and D. Galson, The heat flow through oceanic and continental crust andthe heat loss of the earth, Rev. Geophys. and Space Phys., 18(1), 269-311, 1980.
Scott, J.R., and J. Marotzke, The location of diapycnal mixing and the meridional overturningcirculation, submitted to J. Phys. Oceanogr.
Spall, M.A., Buoyancy-forced circulations around islands and ridges, J. Mar. Res., 58, 957-982,2000.
Speer, K.G., The Stommel and Arons model and geothermal heating in the South Pacific, EarthPlanet. Sci. Lett., 95, 359-366, 1989.
Stein, C.A., S. Stein, and A.M. Pelayo, Heat flow and hydrothermal circulation, in SeafloorHydrothermal Systems: Physical, Chemical, Biological, and Geological Iteractions,Geophysical Monograph No. 91, edited by Humphris, S., L. Mullineaux, R. Zierenberg, andR. Thomson, Americal Geophysical Union, pp. 425-445, 1995.
Stommel, H., Is the South Pacific helium-3 plume dynamically active?, Earth Planet. Sci. Lett.,61, 63-67, 1982.
Stommel, H., and A.B. Arons, On the abyssal circulation of the world ocean - I. Stationaryplanetary flow patterns on a sphere, Deep-Sea Res., 6, 140-154, 1960.
Thompson, L., and G.C. Johnson, Abyssal currents generated by diffusion and geothermalheating over rises, Deep Sea Res., 43(2), 193-211, 1996.

0 20°E 40°E 60°E0°N
20°N
40°N
60°NLa
titud
e
Longitude
0.20.25
0.3 0.30.
4375 m Depth
0.2
0.25 0.3 0.35
0.2 cm/s
FIG. 1. Plan view of bottom model layer, 50 years after uniform geothermal heating isfirst applied. Flow is indicated by vectors and is representative of the backgroundstate flow, as the model’s advective response requires on the order of centuries todevelop. Shading indicates grid cells undergoing convective mixing (i.e., cooling theselocations). As compared to the background state prior to geothermal heating, thedeep convective region in the northwest is increased in area, and all convection in thetropics is new.

0° 20°N 40°N 60°N
-4
-3
-2
-1
0
5
1013
Latitude
Dep
th (
km)
2
0° 20°N 40°N 60°N
-4
-3
-2
-1
0
0.1
0.5
1
1.5
23
Latitude
Dep
th (
km)
(a)
(b)
Total Overturning
Anomalous Overturning
FIG. 2. Meridional overturning streamfunction (contours) and zonally averagedtemperature (shading). (a) Steady-state run with uniform geothermal heating; (b)same as (a), except showing anomalous overturning as compared to a similarlyconfigured run without geothermal heating. Contours are labeled in Sv, with solidcontours indicating clockwise flow; isotherms are 1.35°C, 2.7°C, 5.4°C, 10.8°C, and21.6°C (0.05, 0.1, 0.2, 0.4, and 0.8 of ∆T = 27°C).

0° 20°E 40°E 60°E0°
20°N
40°N
60°N
0
0
0.01
0.01
0.020.03
Latit
ude
Longitude
-0.10
-0.08-0.06
-0.04
-0.02
0
0
0.02
0.02
0.04
(a)
0.1 cm/s
25 m Depth
0°
20°N
40°N
60°N
Latit
ude
(b)
925 m Depth
0° 20°E 40°E 60°ELongitude 0.1 cm/s
0
0
0.01
0.01
0.020.03
-0.10-0.08
-0.08-0.06
-0.04
-0.02
0
0
0.02
0.02
0.04
FIG. 3. Plan view of the anomalous circulation and anomalous temperature (contoursand color shading) obtained by subtracting the geothermal run results from thebackground state. Blue vectors indicate anomalous upwelling and red arrows indicateanomalous downwelling. (a) Surface model layer (contour interval 0.01 °C); (b) layernear the base of the thermocline, 925 m depth (contour interval 0.02°C); (c) lowestmodel layer (contour interval 0.02°C).

0.040.10
0.1 cm/s
0° 20°E 40°E 60°E0°
20°N
40°N
60°NLa
titud
e
Longitude
(c)
0.02 0.04
0.06
0.08
0.10
4375 m Depth

10-6 10-4 10-2
-4
-3
-2
-1
0
Dep
th (
km)
FIG. 4. Plot of vertical potential temperature structure ∂T ∂z (in °C m-1) versus depthalong the equator at 60°E. The geothermal run results are represented by the dottedcurve, and the solid curve shows the background state.

0° 20°E 40°E 60°E
-4
-3
-2
-1
0
Longitude
Dep
th (
km)
0.01
0.02
0.03
0.04
0.05
-0.10-0.05
00.05
0.10
2x10⁻⁴ cm/s 0.2 cm/s
2x10⁻⁴ cm/s 0.2 cm/s
0° 20°N 40°N 60°N
-4
-3
-2
-1
0
Latitude
Dep
th (
km)
Through 63°N
East Wall
FIG. 5. Plot of anomalous circulation and anomalous temperature (contours) in (a) thezonal plane against the model’s back wall; (b) the meridional plane adjacent to theeastern boundary. Shading represents grid cells with active convective mixing.

0.1
0.5
1
1.52
3
0.2
0.15
0.1
0.05
0
0.05
0.1
0.15
0.2
0°N 20°N 40°N 60°N
-4
-3
-2
-1
0
Latitude
Dep
th (
km)
FIG. 6. Contour plot of ∆ ′T , the anomalous temperature difference between the easternand western boundaries, overlaid by the anomalous meridional overturningcirculation. Circulation contours are labeled in Sv, with solid contours indicatingclockwise flow.

0° 40°E 60°E
-4
-3
-2
-1
0
-0.08
-0.04-0.02
Longitude
Dep
th (
km)
20°E
2x10⁻⁴ cm/s 0.2 cm/s
Through 1°N
-0.08-0.08
-0.06
-0.06
-0.04
-0.04
-0.0200.020.04
0.06
FIG. 7. Plot of anomalous circulation and anomalous temperature in the zonal planeadjacent to the equatorial boundary. Blue vectors indicate anomalous upwelling andred arrows indicate anomalous downwelling.

0° 20°N 40°N 60°N
-4
-3
-2
-1
00.1
0.5
1
1.5
2345
Latitude
Dep
th (
km)
0°N 20°N 40°N 60°N
-4
-3
-2
-1
0
0.1
0.50.5
Latitude
Dep
th (
km)
(a)
(b)
FIG. 8. Anomalous meridional overturning circulation and zonally averaged temperature(shading), given (a) a 400% increase in boundary mixing strength; (b) an 80%decrease in boundary mixing strength. Contours are labeled in Sv, with solidcontours indicating clockwise flow; isotherms are 1.35°C, 2.7°C, 5.4°C, 10.8°C, and21.6°C

0° 20°N 40°N 60°N
-4
-3
-2
-1
0
0.1
0.5
1
1.52
3
Latitude
Dep
th (
km)
0°N 20°N 40°N 60°N
-4
-3
-2
-1
0
0.1
0.5
11
1.52
Latitude
Dep
th (
km)
(a)
(b)
FIG. 9. Anomalous meridional overturning circulation and zonally averaged temperature(shading), given (a) an increase in geothermal heating along a 12° meridional stripthrough the middle of the basin, maintaining heating elsewhere; (b) a more significantincrease in heating along this mid-ocean “ridge” with zero geothermal heat inputelsewhere, so as to maintain the total heat input of the uniform geothermal heatingrun. Contours are labeled in Sv, with solid contours indicating clockwise flow;isotherms are 1.35°C, 2.7°C, 5.4°C, 10.8°C, and 21.6°C

0.02
0.06
0.08
0.1
0°
20°N
40°N
60°N
Latit
ude
0° 20°E 40°E 60°ELongitude 0.1 cm/s
4245 m Depth
0.02
0.04
0.06
0.08
0.100.10
0.10
FIG. 10. Plan view of the anomalous circulation and anomalous temperature of thebottom model layer in the “ridge”-only geothermal heating run. Blue vectors indicateanomalous upwelling and red arrows indicate anomalous downwelling.

0° 20°N 40°N 60°N
-4
-3
-2
-1
01
10
20
30
4060
80
Latitude
Dep
th (
km)
FIG. 11. Anomalous meridional overturning circulation and zonally averaged temperature(shading) produced by a uniform geothermal heating of 5 W m-2. Contours arelabeled in Sv, with solid contours indicating clockwise flow; isotherms are 1.35°C,2.7°C, 5.4°C, 10.8°C, and 21.6°C

-60°S -40°S -20°S 0° 20°N 40°N 60°N
-4
-3
-2
-1
0
0.1
0.5
1
1.5
2
2.5
-0.5
-0.1
-0.1
Latitude
Dep
th (
km)
FIG. 12. Anomalous meridional overturning circulation and zonally averaged temperature(shading) in a double hemisphere basin given uniform geothermal heating of50 mW m-2. Contours are labeled in Sv, with solid contours indicating clockwiseflow; isotherms are 1.35°C, 2.7°C, 5.4°C, 10.8°C, and 21.6°C

60°S 40°S 20°S 0° 20°N 40°N 60°N
-4
-3
-2
-1
0
0.1
0.1
0.5
1
-1.5
-1-0.5
-0.1
Latitude
Dep
th (
km)
60°S 40°S 20°S 0° 20°N 40°N 60°N
-4
-3
-2
-1
00.1
0.5
11.5
2
Latitude
Dep
th (
km)
(a)
(b)
North-only heating
South-only heating
FIG. 13. Anomalous meridional overturning circulation and zonally averaged temperature(shading) in a double hemisphere basin given (a) geothermal heating of 50 mW m-2 inthe northern hemisphere, with no geothermal heat input in the southern hemisphere;(b) geothermal heating of 50 mW m-2 in the southern hemisphere, with nogeothermal heat input in the northern hemisphere. Contours are labeled in Sv, withsolid contours indicating clockwise flow; isotherms are 1.35°C, 2.7°C, 5.4°C,10.8°C, and 21.6°C
Recommended


