
Citation: Bernardo, L.F.A.; Teixeira,
M.M.; De Domenico, D.; Gama, J.M.R.
Improved Equations for the Torsional
Strength of Reinforced Concrete
Beams for Codes of Practice Based on
the Space Truss Analogy. Materials
2022, 15, 3827. https://doi.org/
10.3390/ma15113827
Academic Editor: Angelo
Marcello Tarantino
Received: 26 April 2022
Accepted: 25 May 2022
Published: 27 May 2022
Publisher’s Note: MDPI stays neutral
with regard to jurisdictional claims in
published maps and institutional affil-
iations.
Copyright: © 2022 by the authors.
Licensee MDPI, Basel, Switzerland.
This article is an open access article
distributed under the terms and
conditions of the Creative Commons
Attribution (CC BY) license (https://
creativecommons.org/licenses/by/
4.0/).
materials
Article
Improved Equations for the Torsional Strength of ReinforcedConcrete Beams for Codes of Practice Based on the SpaceTruss AnalogyLuís F. A. Bernardo 1,* , Mafalda M. Teixeira 1, Dario De Domenico 2 and Jorge M. R. Gama 3
1 Centre of Materials and Building Technologies (C-MADE), Department of Civil Engineering and Architecture,University of Beira Interior, 6201-001 Covilhã, Portugal; [email protected]
2 Department of Engineering, University of Messina, 98166 Messina, Italy; [email protected] Center of Mathematics and Applications (CMA), Department of Mathematics, University of Beira Interior,
6201-001 Covilhã, Portugal; [email protected]* Correspondence: [email protected]
Abstract: Design codes provide the necessary tools to check the torsional strength of reinforcedconcrete (RC) members. However, some researchers have pointed out that code equations still needimprovement. This study presents a review and a comparative analysis of the calculation proceduresto predict the torsional strength of RC beams from some reference design codes, namely the Russian,American, European, and Canadian codes for RC structures. The reliability and accuracy of thenormative torsional strengths are checked against experimental results from a broad database incor-porating 202 RC rectangular beams tested under pure torsion and collected from the literature. Theresults show that both the readability and accuracy of the codes’ equations should be improved. Basedon a correlation study between the experimental torsional strengths, and geometrical and mechanicalproperties of the beams, refined yet simple equations are proposed to predict torsional strength. Itis demonstrated that the proposed formulation is characterized by a significant improvement overthe reference design codes. The efficiency of the proposed formulae is also assessed against anotherequation earlier proposed in the literature, and an improvement is noted as well. From the results, itcan be concluded that the proposed equations in this study can contribute to a more accurate andeconomical design for practice.
Keywords: reinforced concrete; beams; torsional strength; correlation study; codes of practice; spacetruss model; thin-walled tube analogy
1. Introduction
In engineering practice, structural members under pure torsion are not a commonsituation. Usually, torsional effects are combined with other internal forces in the criticalsections of the member. However, there are several practical cases in structures in whichstructural members must sustain primary torsional effects in their critical sections. Typicalexamples are encountered in bridge structures or geometrically complex building structures,in which reinforced concrete (RC) girders and columns can be subjected to primary torsiondue to the high eccentricity of static loads or complex geometry of the members (e.g.,curvature in plan). For such members, an accurate calculation of the torsional strengthis essential for the design or assessment of the torsional capacity, namely to guaranteeor check the safety at the ultimate limit states. For such purposes, current RC membersand structural engineers usually base their calculations on the rules from design codes.Nowadays, each country has its own set of design codes that govern structural design,namely for RC structures, and some of them have a high impact in other countries and alsoconstitute reference codes for the international community [1–7].
Materials 2022, 15, 3827. https://doi.org/10.3390/ma15113827 https://www.mdpi.com/journal/materials

Materials 2022, 15, 3827 2 of 34
Despite all the research effort made in recent decades by the scientific community,several current design codes for concrete structures are still somewhat scarce in providingdetailed and specific design rules for torsion. These include basic reinforcement detail-ing rules and limits for important design variables to ensure a good performance of RCmembers under torsion for both the ultimate and serviceability limit states. For example,some design codes do not provide any specific rule regarding the minimum amount oftorsional reinforcement, which is considered a basic requirement to avoid a sudden failureafter concrete cracking. The same can be stated for the maximum amount of torsionalreinforcement to ensure ductility at failure (torsional reinforcement should yield beforeconcrete crushing). Although such a maximum amount can be indirectly computed fromthe maximum compressive stress allowed for the concrete struts, this upper-stress limit canvary substantially among design codes. As there is a lack of specific rules for torsion, somecodes refer to the rules related to the reinforcement requirements for other internal forces,such as for bending (for the longitudinal reinforcement) and for shear (for the transversereinforcement). In addition to the aforementioned missing aspects, when the rules fromseveral design codes are used to predict the torsional strength of RC beams, small accuracyand high dispersion of the results, including unsafe predictions, are still observed whenthey are compared with experimental data [8,9]. This observation shows that research workon the torsion of RC beams still needs to be carried out to propose more accurate designrules to be incorporated in future revisions of design codes.
The first reference design codes, which incorporated specific design rules for torsionfor RC members, were based on the so-called skew-bending theory. This model wasproposed by Hsu in 1968 [10] and was established from empirical observations based onthe failure pattern observed in several experiments with RC rectangular beams under puretorsion. This model showed to provide accurate predictions for the torsional strengthof RC beams with common rectangular cross-sections, such as the ones used in buildingstructures. However, when applied to cross-sections with large aspect ratios or to cross-sections with more complex geometries, such as the ones used in bridge girders, this modelproduces more complex formulations and shows to be much less accurate. In spite of this,the skew-bending theory was developed over more than two decades [11–13] and had aconsiderable influence on the design rules for torsion in some reference design codes, suchas the ACI code (American code) up to 1995. Presently, the design rules for torsion of theEurasian code SiNiP 2018 [1] are still based on the skew-bending theory.
Nowadays, the torsion design rules from most design codes for concrete structures arebased on the space truss analogy. This model, first proposed by Raush in 1929 [14], was latercombined with the classical thin tube theory from Bredt [15] and further developed in thesecond half of the last century [16–19]. The space truss analogy allows for a better physicalunderstanding of how an RC beam behaves under torsion in the cracked stage and providessimple equations to compute the torsional strength, even for geometrically complex cross-sections. However, due to different hypotheses incorporated in the model, to allow for asimple torsional design, the calculation procedures for torsion can be somewhat differentamong the design codes. Because of this, noticeable differences can be observed in theresults when different design codes are used to predict the torsional strength of RC beams,although all these codes are formally based on the same space truss resisting mechanism.These observations justify the need for additional improvements to be incorporated infuture revisions of the codes.
Since the 1980s, refined versions of models based on the space truss analogy have beenproposed that allow one to compute with accuracy the strength of RC beams under puretorsion [18,20–26], RC beams under torsion combined with other internal forces [27–30].More advanced analytical models have also been proposed in the literature and applied tobeams under torsion and combined loadings [31–36]. Although these models have beenshown to be very reliable when compared with experimental results, they are not easy to beused by practitioners as they require advanced calculation procedures to be implementedon the computer. Hence, simple and reliable equations would be preferable for practice.
Materials 2022, 15, 3827 3 of 34
Based on these motivations and research needs, this study first presents a criticaloverview and a comparative analysis of the calculation procedures from design codes topredict the torsional strength of RC rectangular beams. For this, some reference designcodes considered important due to their territorial scope were chosen. Such design codesare the following ones: the Eurasian code, SiNiP 2018 [1], two different versions of Amer-ican codes, namely ACI 318R-89 [2] and ACI 318R-19 [3], the European codes MC90 [4],MC10 [5] and Eurocode 2 [6], and the Canadian code CSA A23.3-14 [7]. For comparisonpurposes, this list includes codes based on different mechanical models to establish thedesign rules for torsion, namely the skew-bending theory and the space truss analogy,and also codes with different application scopes (laws or recommendation documents).The calculation procedures from the codes are summarized and checked against a broaddatabase incorporating 202 RC rectangular beams tested under pure torsion collected fromthe literature. This database includes under- and over-reinforced beams, plain and hollowbeams, as well as normal- and high-strength concrete beams. Then, based on correlationsstudies, improved and simple equations are proposed to compute the torsional strength ofRC beams. The proposed model correlates the torsional strength and three main propertiesof the beams: the compressive concrete strength, the concrete area enclosed within the outerperimeter of the cross-section, and the amount of torsional reinforcement. The accuracyand reliability of the proposed equations are checked against the results from the referencedesign codes. They are also checked against simple equations proposed by Rahal in 2013 [8],which have a similar form to the ones proposed here and were based on a similar approachto that used in this study (by fitting experimental results). For these reasons, the researchfrom Rahal [8] was considered a benchmark. The results show that the proposed equationssignificantly improve the accuracy and reliability of the torsional strength of RC beamswhen compared with the same ones from the reference design codes. They also give slightlybetter results when compared with the ones from the equations previously proposed byRahal [8].
When compared to previous research, namely the one from Rahal [8], which constitutesa reference study, the main novelty in this study is related to the higher number of referencedesign codes studied, the higher number of reference beams considered in the database,and the somewhat different methodology used to fit the experiment results in obtainingsimple and improved equations for torsional strength.
It should be noted that this article addresses only the particular case of RC beamsunder pure torsion. It is well known that in real concrete structures, the critical sectionof members usually carries combined loadings, for instance, torsion combined with otherinternal forces (bending, shear, and axial forces). However, for some concrete members,such as girders curved in plan and girders with eccentric loadings, torsion could be theprimary internal acting force. Furthermore, the design provisions to check the interactionbetween internal forces requires the calculation of the torsional strength of the cross-section,considering only torsion as loading. Hence, the ultimate strength of the cross-section needsto be well known. This justifies the importance of this study.
2. Equations from the Reference Design Codes
From the studied design codes, the SiNiP 2018 [1] and ACI 318R-89 [2] codes are theonly ones whose equations for torsional design, i.e., to compute the torsional strength ofRC beams, are based on the skew-bending theory. Although ACI 318R-89 is no longer inuse, it was included in this study for comparison with SiNiP 2018 (which is still in use)and to better understand the influence of the underlying mechanical model in the codeformulation. The calculation procedure for torsion for all the other reference design codes(ACI 318R-19 [3], MC90 [4], MC10 [5], Eurocode 2 [6], and CSA A23.3-14 [7]) are basedon the space truss analogy. As far as the European design codes are concerned, it shouldbe stated that MC10 substituted MC90. However, as the design rules for torsion weresimplified in MC10, MC90 was also considered for comparison.

Materials 2022, 15, 3827 4 of 34
Table A1 in Appendix A summarizes the equations incorporated in each referencedesign code for torsional design and to compute the torsional strength of RC beams. InTable A1, all codes’ equations were rewritten to uniformize the symbology for better clarityand to facilitate comparison. The meaning of the used symbology can be found in theNomenclature.
American and Canadian codes incorporate specific rules to design both the longitu-dinal and transverse torsional reinforcement. In general, the European codes incorporatespecific equations to design longitudinal torsional reinforcement. However, they refer tothe rules for shear reinforcement to design the transverse torsional reinforcement.
From the presented equations in Table A1, one can highlight five main parametersthat can be defined by somewhat different rules but strongly influence the magnitude ofthe calculated torsional strength:
• The limit of the wall’s thickness of the equivalent hollow beam, which determinesand limits the area enclosed within the flow of shear stress acting on the beam’scross-section;
• The flow of shear stress, which is induced by the external torque, and the correspond-ing shear resultant forces in each wall;
• The criteria to compute the torsional strength, which, depending on the underlyingmechanical model and design code, consider separately the strength contributed bythe torsional tensile reinforcement and the strength contributed by the compressiveconcrete;
• The maximum limit allowed for the compressive stress in the concrete struts to avoida brittle failure of the beam due to concrete crushing;
• The angle of the concrete struts to the longitudinal axis of the beam.
A more detailed analysis of the summarized equations in Table A1 can be foundin some of the reference design codes and also in a previous study from the two firstauthors [9].
3. Database with Reference Beams
For this study, an extensive literature review was performed to compile the mainproperties and experimental results of RC rectangular beams tested under pure torsionuntil failure. A total of 202 beams were compiled from several studies [10,12,19,37–49] tobuild the database (with 158 plain beams and 44 hollow beams). The number of beamsfound in the literature was higher than 202; however, some of them were disregarded basedon the following criteria:
1. The main properties of the tested RC beams needed to compute the normative tor-sional strength should be given;
2. The experimental torsional strength should be given and the RC beams should havefailed in pure torsion in their ultimate stage as expected;
3. The beams should comply with reinforcement requirements from ACI 318R-19 [3]. Forinstance, and among other requirements, the spacing of the hoops should be less thanthe upper limit set by the code to avoid untypical behavior (for instance, prematurefailure) during testing. ACI 318R-19 [3] was the chosen code because it was found tobe the one that incorporates a higher number of specific detailing rules for RC beamsunder torsion.
Table A2 in Appendix A summarizes the main geometric and mechanical propertiesof the reference RC beams that are necessary to compute the torsional strength from thedesign codes. The meaning of each parameter can be found in the Nomenclature.
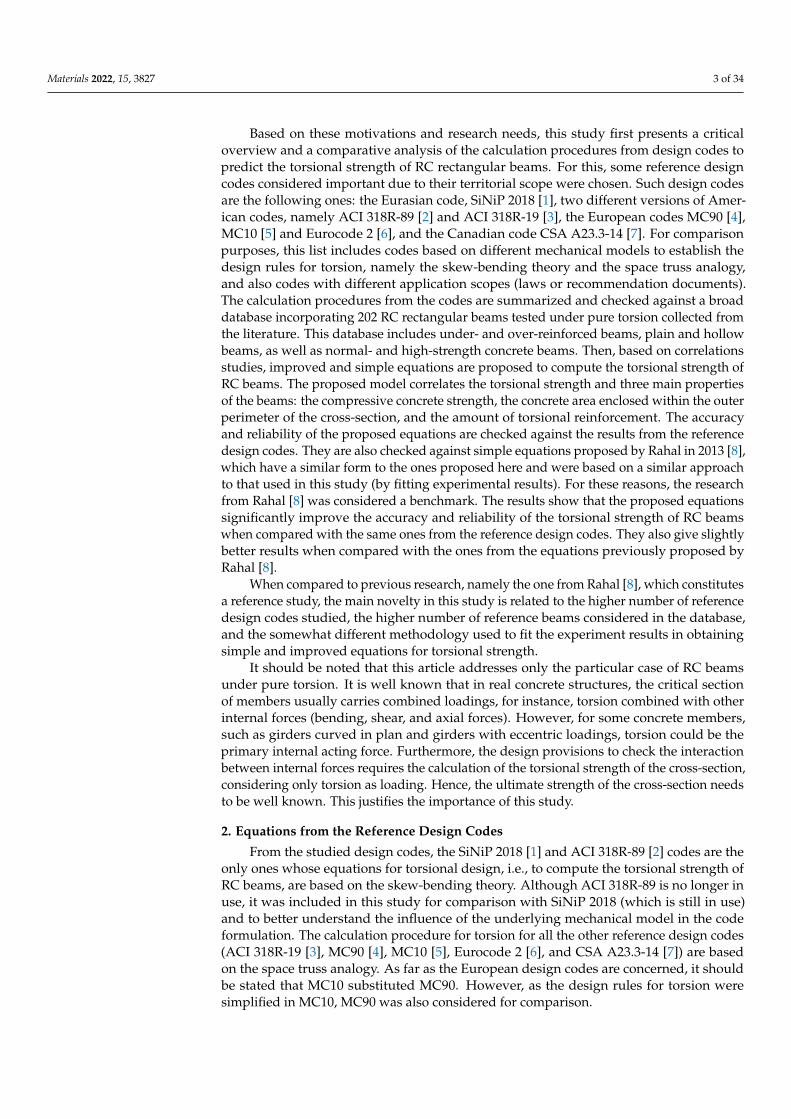
Figure 1 presents graphs with the distribution of some key parameters for the202 reference RC beams from the database. In the abscissa of the graphs, the parame-ters are: fcm is the average compressive concrete strength, ρtot = ρl + ρt is the total ratio oftorsional reinforcement, fly and fty are the average yielding stresses for longitudinal andtransverse reinforcement, respectively.

Materials 2022, 15, 3827 5 of 34
Materials 2022, 15, x FOR PEER REVIEW 5 of 33
𝑓 is the average compressive concrete strength, 𝜌 = 𝜌 + 𝜌 is the total ratio of tor-sional reinforcement, 𝑓 and 𝑓 are the average yielding stresses for longitudinal and transverse reinforcement, respectively.
(a) (b)
(c) (d)
Figure 1. Distribution of key parameters for the reference RC beams. (a) Concrete strength. (b) Total reinforcement ratio. (b) Yielding stress of longitudinal reinforcement. (d) Yielding stress of trans-verse reinforcement.
Figure 1 shows that 142 and 60 beams are built with normal- (up to 50 MPa) and high-strength concrete (over 50 MPa, according to [5]), respectively. The average concrete com-pressive strength ranges between 14 MPa and 110 MPa. The total reinforcement ratio
0
10
20
30
40
50
6010
–20
20–3
030
–40
40–5
050
–60
60–7
070
–80
80–9
090
–100
100–
110
Nr. o
f bea
ms
fcm [MPa]
0
20
40
60
80
100
120
Nr. o
f bea
ms
ρtot [%]
05
101520253035404550
Nr. o
f bea
ms
fly [MPa]
0
10
20
30
40
50
6025
0–30
030
0–35
035
0–40
040
0–45
045
0–50
050
0–55
055
0–60
060
0–65
065
0–70
070
0–75
0
Nr. o
f bea
ms
fty [MPa]
Figure 1. Distribution of key parameters for the reference RC beams. (a) Concrete strength. (b) Totalreinforcement ratio. (c) Yielding stress of longitudinal reinforcement. (d) Yielding stress of transversereinforcement.
Figure 1 shows that 142 and 60 beams are built with normal- (up to 50 MPa) andhigh-strength concrete (over 50 MPa, according to [5]), respectively. The average concretecompressive strength ranges between 14 MPa and 110 MPa. The total reinforcement ratioranges between a minimum of 0.37% and a maximum of 6.36%, being for most of the beamsin the range of 1 to 2%. The yielding stress ranges between 308.8 MPa and 723.9 MPa forthe longitudinal reinforcement and between 285 MPa and 714.8 MPa for the transversereinforcement. For most of the beams, it ranges between 300 MPa and 500 MPa.

Materials 2022, 15, 3827 6 of 34
The database used in this study is wider than the ones used in previous studies on thetorsion of RC beams. For instance, the database used by Rahal [8], which is an importantreference for this study, included 50 beams less than the database used in this study.
4. Evaluation of Design Codes
For each reference beam from the database (see Table A2), the theoretical torsionalstrength, TR,th, was computed according to the calculation procedures from each referencedesign code (see Table A1). The obtained values are presented in Table A3 in Appendix A,which also presents the corresponding experimental values, TR,exp. The calculated ratiosTR,exp/TR,th are presented in a Table A4 in Appendix A. Table 1 summarizes, for eachdesign code, the average value, x, and the coefficient of variation, cv, computed for theratios, TR,exp/TR,th, from all reference beams. The results are presented separately for plainbeams (P), hollow beams (H), and also for all beams together (P + H). This separation canbe justified because some design codes include corrections to the equations for hollowbeams, while others do not.
Table 1. Comparative analysis between design codes.
Cross SectionP H P + H
TR,exp/TR,th TR,exp/TR,th TR,exp/TR,th
SiNiP 2018 [1]x = 1.21 1.47 1.25cv = 34% 20% 32%
ACI 318R-89 [2]x = 1.12 1.27 1.15cv = 23% 26% 24%
ACI 318R-19 [3]x = 1.40 1.38 1.40cv = 31% 18% 28%
MC90 [4]x = 1.28 1.61 1.36cv = 24% 29% 28%
MC10 [5]x = 1.41 1.07 1.33cv = 44% 33% 44%
Eurocode 2 [6]x = 1.07 1.29 1.12cv = 24% 31% 28%
CSA A23.3-14 [7]x = 0.98 1.13 1.01cv = 22% 27% 24%
From Table 1, it can be stated that all design codes show a relatively high dispersion forthe ratio TR,exp/TR,th (in general cv > 20%), which represents a motivation for developingmore accurate and reliable torsional strength equations.
Design codes based on the skew-bending theory, namely Si-NiP 2018 [1] and ACI318R-89 [2] codes, present similar results. In general, they both tend to underestimate thetorsional strength, (x > 1), with x = 1.25 for Si-NiP 2018 code and x = 1.15 for ACI 318R-89code. Among these two design codes, the ACI 318R-89 code shows the best results, withx closer to 1 and less dispersion of the results disregarding the cross-section type (withcv = 24%, against cv = 32% for SiNiP 2018 code). Regarding the cross-section type, it canbe observed that the accuracy of the ACI 318R-89 code seems to be better for plain beams(with x = 1.12 and cv = 23% for plain beams and x = 1.27 and cv = 26% for hollow beams);similar trends are observed for Si-NiP 2018 code (with x = 1.21 and cv = 34% for plainbeams and x = 1.47 and cv = 20% for hollow beams). This observation can be explainedbecause the model based on the skew-bending theory was calibrated for plain beams [10].
The other design codes based on the space truss analogy (ACI 318R-19 [3], MC90 [4],MC10 [5], Eurocode 2 [6], and CSA A23.3-14 [7]) show results with some differencesamong them. Among those design codes, and disregarding the cross-section type, the CSAA23.3-14 code seems to be the most accurate (with x = 1.01 and cv = 24%), while the MC10code seems to be one of the worst (with x = 1.33 and cv = 44%). ACI 318R-19, MC90, andEurocode 2 codes show the same level of dispersion (with cv = 28% for all of them), and alltend to underestimate the torsional strength (with x ranging from 1.33 and 1.40). Regarding

Materials 2022, 15, 3827 7 of 34
the cross-section type, it can be observed that the CSA A23.3-14 code is the only one thattends to slightly overestimate the torsional strength of hollow beams (with x = 0.98 andcv = 22 %). Eurocode 2 seems to be one that provides the best results for plain sections(with x = 1.07 and cv = 24%). For hollow beams, it is not so clear because of the higherdispersion of the results.
It is also worth noting that the ACI 318R-89 code (currently not in use) provides, ingeneral, more accurate results and with less dispersion when compared with the ACI318R-19 code. This is because the majority of the reference tested beams have smallrectangular cross-sections, for which the skew-bending theory provides better results (aspreviously referred).
Based on the above considerations and balancing the accuracy with the degree ofsafety, it can be concluded that, among the codes currently in use, Eurocode 2 seems to bethe one that presents the most satisfactory results. However, some caution is required withthis conclusion (and other ones previously stated) as the dispersion of the results is highfor all codes.
The predictive accuracy of each code formulation can be assessed in Figure 2, whichpresents scatter plots relating to the experimental torsional strengths (in ordinate) with thetheoretical ones (in abscissa) for each of the reference codes. In the graphs, different markerswere used to distinguish the results for plain beams (“n”) and for hollow beams (“�”).
In each graph, an inclined line with a 45◦ angle is drawn, which represents the locationof the points in case both the experimental and theoretical torsional strengths are equal, i.e.,the code predicts exactly the torsional strength of the beam. Points located on the left sideof the referred line correspond to the case in which the code underestimates the torsionalstrength of the beams. If the points are located on the right side of the line, then the codeoverestimates the torsional strength.
From Figure 2, it can be seen that some of the design codes can overestimate thetorsional strength of several reference beams noticeably, in particular, for hollow beams.This is the case for the MC10 and CSA A23.3-14 codes.
The results from Table 1 and Figure 2 show clearly that the level of accuracy of allanalyzed codes, as well as the level of safety for some of them, should be improved.

Materials 2022, 15, 3827 8 of 34Materials 2022, 15, x FOR PEER REVIEW 8 of 33
(a)
(b)
(c)
(d)
(e)
(f)
(g)
Figure 2. Experimental vs. theoretical torsional strengths (design codes). (a) SNiP18. (b) ACI 318R_89. (c) ACI 318R_19. (d) MC90. (e) MC10. (f) EC2. (g) CSA14.
0
100
200
300
400
500
0 100 200 300 400 500
T R,ex
p[k
Nm
]
TR,th [kNm]
SNiP180
100
200
300
400
500
0 100 200 300 400 500
T R,ex
p[k
Nm
]
TR,th [kNm]
ACI 318R-89
0
100
200
300
400
500
0 100 200 300 400 500
T R,ex
p[k
Nm
]
TR,th [kNm]
ACI 318R-190
100
200
300
400
500
600
0 100 200 300 400 500 600
T R,ex
p[k
Nm
]
TR,th [kNm]
MC90
0
100
200
300
400
500
0 100 200 300 400 500
T R,ex
p[k
Nm
]
TR,th [kNm]
MC100
100
200
300
400
500
600
700
800
0 100 200 300 400 500 600 700 800
T R,ex
p[k
Nm
]
TR,th [kNm]
EC2
0
100
200
300
400
500
600
700
800
0 100 200 300 400 500 600 700 800
T R,ex
p[k
Nm
]
TR,th [kNm]
CSA14
Figure 2. Experimental vs. theoretical torsional strengths (design codes). (a) SNiP18. (b) ACI 318R_89.(c) ACI 318R_19. (d) MC90. (e) MC10. (f) EC2. (g) CSA14.

Materials 2022, 15, 3827 9 of 34
5. Equations Proposed by Rahal
Rahal, in 2013 [8], showed that for both the ACI and CSA codes, after some basicalgebraic manipulations, a general and simple torsional strength equation can be writtenin the form of Equation (1). This equation is written here with some parameters stan-dardized according to the nomenclature used in the code equations previously presented.Equation (1) was used in some previous models [18,23].
TR = 2Ak
√Al fyl
uk
At fyt
s(1)
It can be shown that the general form of Equation (1) can be obtained from all the codeequations, which are based on the space truss analogy. This is the case of the referencecodes considered in this study (ACI 318R-19 [3], MC90 [4], MC10 [5], Eurocode 2 [6], andCSA A23.3-14 [7])).
Rahal [8] pointed out the following drawbacks for Equation (1) based on experimentalevidence:
1. In the hollow tube model used in the space truss analogy, the shear flow is constantaround the perimeter of the tube walls. Design code formulations consider a constanteffective thickness for all the walls. As a consequence, the model assumes the sameshear stress and shear. As pointed out by Rahal [8], this is not consistent with theexperimental results on RC rectangular beams under torsion that show differentconditions on the different faces of the cross-section [10,12,37]. Experiments show thatlarger tensile strains are observed in the longer legs of the hoops and larger diagonalstrains are observed in the longer faces of the cross-section. In this regard and based onthese observations, a refined variable-angle space truss model incorporating differentstrut inclination angles in the different faces of the cross-section was recently proposedby De Domenico [50];
2. Rahal [8] also pointed out that Equation (1) disregards the effect of the concretecompressive strength, while experiments [10,12] show that this parameter has asignificant influence on the torsional strength;
3. In addition, Rahal [8] also noted that in most experiments [17,40,51], the concreteof the beams did not spall at the maximum torque or was limited to the corners ofthe cross-section [37,42]. However, in Equation (1), the torsional strength is relatedto the spalled concrete dimensions through area Ak (area enclosed within the shearflow path).
To solve the first drawback, Rahal [8] proposed to reduce the power by 0.5 for thereinforcement term in Equation (1) to compensate for the relatively smaller contributionof the hoops and concrete on the shorter side of the cross-section. To solve the seconddrawback, the author suggested incorporating an additional term to consider the effectof the concrete compressive strength in Equation (1). For the third drawback, the authorsimply suggested correcting Equation (1) to relate the torsional strength with the unspalledconcrete dimensions, substituting the reduced area, Ak, with the concrete area, Ac (areaenclosed within the outer perimeter of the cross-section), and the corresponding perimeteris denoted as pc (in place of ph).
Based on the experimental results collected from the literature (which included 152 RCbeams tested under torsion) and based on separated nonlinear correlations (using appro-priate subsets of the reference beams) for each of the previously referred terms/parametersto correct Equation (1), Rahal [8] proposed the improved Equations (2) and (3) to computethe torsional strength of RC beams. These equations are written here according to thenomenclature and metric units for the parameters used in this study (as referred to inSection 6):
TR = 0.33( fc)0.16 Ac
(Al fyl
At fyt
s
)0.35
(2)

Materials 2022, 15, 3827 10 of 34
≤ 2500( fc)0.3 Ac
2
pc(3)
It should be noted that, in Equation (2), the power for the concrete strength term wasempirically selected by Rahal [8] to provide good results.
Equation (2) governs the torsional strength for under-reinforced sections (the failure isgoverned by the yielding of the torsional reinforcement) and includes the “reinforcementterm” (Al fyl At fyt/s) and the “concrete strength term” (a term related to fc). The upperlimit stated in Equation (3) governs the torsional strength for over-reinforced sections (thefailure is governed by concrete crushing before reinforcement yielding) and includes the“concrete strength term.” Equations (2) and (3) are not limited to rectangular cross-sectionsand can be applied to arbitrary cross-section shapes.
Rahal [8] checked the results from Equations (2) and (3) against the experimentalresults from the 152 test specimens and very good agreement was observed. In addition,a comparison with the ACI and CSA codes showed that the proposed equations providebetter results, with higher accuracy and much less dispersion. The author also showed thatsuch good results were observed for both normal- and high-strength concrete beams, aswell as for under- and over-reinforced beams.
For this study, the torsional strengths computed from Equations (2) and (3) arerechecked against the experimental results of all 202 RC beams included in the widerdatabase built for this research. The obtained results are presented for each reference beamin Table A3 and the respective ratios TR,exp/TRahal
theo are presented in Table A4. The resultsare summarized in Table 2 and Figure 3, in the same way as previously presented in Table 1and Figure 2. The obtained results still confirm the conclusions from Rahal [8], namelythat Equations (2) and (3) provide accurate results (with x = 1.06) with a very acceptabledispersion (with cv = 15%). Table 2 also shows that the results for both plain and hollowsections are very similar.
Table 2. Comparative analysis for the torsional strength from improved equations.
Cross-SectionP H P + H
TR,exp/TR,th TR,exp/TR,th TR,exp/TR,th
Rahal [8]x = 1.05 1.08 1.06cv = 14% 17% 15%
Equations (6) and (7) x = 1.01 1.01 1.01cv = 14% 9% 13%
Equations (8) and (9) x = 0.96 0.96 0.96cv = 15% 9% 14%
6. Alternative Improvement of the Equations from Rahal
In this section, Equation (1) to compute the torsional strength of RC beams is improvedbased on the wider database built for this study and also on a somewhat different correlationmethodology than the one used by Rahal [8], namely for under-reinforced beams. Theperformed studies are presented separately for under- and over-reinforced beams.
6.1. Upper Limit to Control Concrete Crushing (Over-Reinforced Beams)
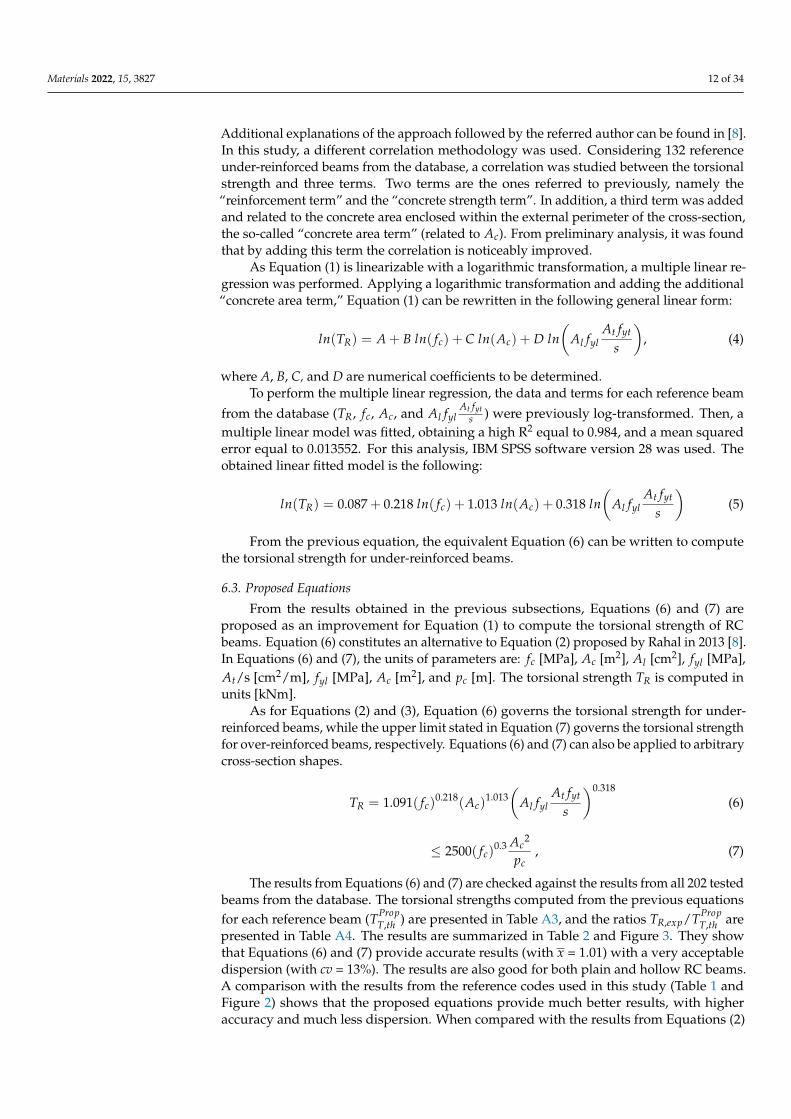
Following the same methodology from Rahal [8] to refine the upper limit stated inEquation (3) to control concrete crushing, a subset of 70 beams (62 plain beams and 8 hollowbeams) was created from the database. The failure of such beams was governed by concretecrushing in the struts without yielding the torsional reinforcement. These beams are markedwith an asterisk in Table A3 and represent beams with fragile failure. For these beams,a scatter plot is presented in Figure 4, with the average concrete compressive strength( fcm) in abscissa and the factor TR,exp pc/Ac
2 in ordinate (with the following units: TR,exp
[kNm], pc [m], and Ac [m2]). From the scatterplot, a power trendline was computed to fitthe data (1494 f 0.4
c ). In the same graph, the power trendline computed by Rahal [8] and

Materials 2022, 15, 3827 11 of 34
based on less reference beams is also plotted for comparison (2500 f 0.3c , see upper limit
stated in Equation (3)). This power trendline is slightly shifted up when compared to thepower trendline computed from the scatter plot in Figure 4. After computing, the torsionalstrengths for the over-reinforced beams from the database using an equation based on1494 f 0.4
c and after a comparative analysis with the experimental strengths, it was observedthat more unsafe values were obtained for the reference beams (the predicted torsionalstrength is higher than the real one for more beams, i.e., more points are located above thetrend curve). This observation can be explained due to the high dispersion observed for thepoints in the scatter plot in Figure 4. For practical design, this situation is not acceptableand a correction of the power trendline was studied. The results suggested that the powertrendline should be slightly shifted up to minimize the referred unsafe predictions. Aftersome attempts, it was concluded that the power trendline suggested by Rahal [8] was quiteappropriate. For this reason, the power trendline 2500 f 0.3
c was also adopted in this studyand the upper limit stated in Equation (3) remained unchanged to define the upper limit tocontrol concrete crushing (see upper limit stated in Equation (7)).
Materials 2022, 15, x FOR PEER REVIEW 11 of 33
6. Alternative Improvement of the Equations from Rahal In this section, Equation (1) to compute the torsional strength of RC beams is im-
proved based on the wider database built for this study and also on a somewhat different correlation methodology than the one used by Rahal [8], namely for under-reinforced beams. The performed studies are presented separately for under- and over-reinforced beams.
6.1. Upper Limit to Control Concrete Crushing (Over-Reinforced Beams) Following the same methodology from Rahal [8] to refine the upper limit stated in
Equation (3) to control concrete crushing, a subset of 70 beams (62 plain beams and 8 hol-low beams) was created from the database. The failure of such beams was governed by concrete crushing in the struts without yielding the torsional reinforcement. These beams are marked with an asterisk in Table A3 and represent beams with fragile failure. For these beams, a scatter plot is presented in Figure 4, with the average concrete compressive strength (𝑓 ) in abscissa and the factor 𝑇 , 𝑝 𝐴⁄ in ordinate (with the following units: 𝑇 , [kNm], 𝑝 [m], and 𝐴 [m2]). From the scatterplot, a power trendline was computed to fit the data (1494𝑓 . ). In the same graph, the power trendline computed by Rahal [8] and based on less reference beams is also plotted for comparison (2500𝑓 . , see upper limit stated in Equation (3)). This power trendline is slightly shifted up when com-pared to the power trendline computed from the scatter plot in Figure 4. After computing, the torsional strengths for the over-reinforced beams from the database using an equation based on 1494𝑓 . and after a comparative analysis with the experimental strengths, it was observed that more unsafe values were obtained for the reference beams (the pre-dicted torsional strength is higher than the real one for more beams, i.e., more points are located above the trend curve). This observation can be explained due to the high disper-sion observed for the points in the scatter plot in Figure 4. For practical design, this situa-tion is not acceptable and a correction of the power trendline was studied. The results suggested that the power trendline should be slightly shifted up to minimize the referred unsafe predictions. After some attempts, it was concluded that the power trendline sug-gested by Rahal [8] was quite appropriate. For this reason, the power trendline 2500𝑓 . was also adopted in this study and the upper limit stated in Equation (3) remained un-changed to define the upper limit to control concrete crushing (see upper limit stated in Equation (7)).
(a)
(b)
Figure 3. Experimental vs. theoretical torsional strengths (improved equations). (a) Model from Ra-hal. (b) Proposed model.
0
100
200
300
400
500
0 100 200 300 400 500
T R,e
xp[k
Nm
]
TR,th [kNm]
Rahal0
50
100
150
200
250
300
350
400
450
0 100 200 300 400
T R,e
xp[k
Nm
]
TR,th [kNm]
Proposed model
Figure 3. Experimental vs. theoretical torsional strengths (improved equations). (a) Model fromRahal. (b) Proposed model.
Materials 2022, 15, x FOR PEER REVIEW 12 of 33
Figure 4. Torsional strength in over-reinforced beams.
6.2. Reinforcement, Concrete Strength, and Concrete Area Terms (Under-Reinforced Beams) For under-reinforced beams, Rahal [8] studied separated nonlinear correlations using
appropriate subsets of reference beams from its database to study the influence of both the “reinforcement term” (𝐴 𝑓 𝐴 𝑓 𝑠⁄ ) and the “concrete strength term” (related to 𝑓 ). Additional explanations of the approach followed by the referred author can be found in [8]. In this study, a different correlation methodology was used. Considering 132 reference under-reinforced beams from the database, a correlation was studied between the tor-sional strength and three terms. Two terms are the ones referred to previously, namely the “reinforcement term” and the “concrete strength term”. In addition, a third term was added and related to the concrete area enclosed within the external perimeter of the cross-section, the so-called “concrete area term” (related to 𝐴 ). From preliminary analysis, it was found that by adding this term the correlation is noticeably improved.
As Equation (1) is linearizable with a logarithmic transformation, a multiple linear regression was performed. Applying a logarithmic transformation and adding the addi-tional “concrete area term,” Equation (1) can be rewritten in the following general linear form: 𝑙𝑛(𝑇 ) = 𝐴 + 𝐵 𝑙𝑛(𝑓 ) + 𝐶 𝑙𝑛(𝐴 ) + 𝐷 𝑙𝑛 𝐴 𝑓 , (4)
where A, B, C, and D are numerical coefficients to be determined. To perform the multiple linear regression, the data and terms for each reference beam
from the database (𝑇 , 𝑓 , 𝐴 , and 𝐴 𝑓 ) were previously log-transformed. Then, a multiple linear model was fitted, obtaining a high R2 equal to 0.984, and a mean squared error equal to 0.013552. For this analysis, IBM SPSS software version 28 was used. The obtained linear fitted model is the following: 𝑙𝑛(𝑇 ) = 0.087 + 0.218 𝑙𝑛(𝑓 ) + 1.013 𝑙𝑛(𝐴 ) + 0.318 𝑙𝑛 𝐴 𝑓 𝐴 𝑓𝑠 (5)
From the previous equation, the equivalent Equation (6) can be written to compute the torsional strength for under-reinforced beams.
6.3. Proposed Equations From the results obtained in the previous subsections, Equations (6) and (7) are pro-
posed as an improvement for Equation (1) to compute the torsional strength of RC beams.
0
2000
4000
6000
8000
10000
12000
14000
0 20 40 60 80 100 120
T R,e
xpp c
/Ac2
[kN
m2 /m
2 ]
fcm [MPa]
y = 1 494x0.4
y = 2 500x0.3
Figure 4. Torsional strength in over-reinforced beams.
6.2. Reinforcement, Concrete Strength, and Concrete Area Terms (Under-Reinforced Beams)
For under-reinforced beams, Rahal [8] studied separated nonlinear correlations usingappropriate subsets of reference beams from its database to study the influence of boththe “reinforcement term” (Al fyl At fyt/s) and the “concrete strength term” (related to fc).
Materials 2022, 15, 3827 12 of 34
Additional explanations of the approach followed by the referred author can be found in [8].In this study, a different correlation methodology was used. Considering 132 referenceunder-reinforced beams from the database, a correlation was studied between the torsionalstrength and three terms. Two terms are the ones referred to previously, namely the“reinforcement term” and the “concrete strength term”. In addition, a third term was addedand related to the concrete area enclosed within the external perimeter of the cross-section,the so-called “concrete area term” (related to Ac). From preliminary analysis, it was foundthat by adding this term the correlation is noticeably improved.
As Equation (1) is linearizable with a logarithmic transformation, a multiple linear re-gression was performed. Applying a logarithmic transformation and adding the additional“concrete area term,” Equation (1) can be rewritten in the following general linear form:
ln(TR) = A + B ln( fc) + C ln(Ac) + D ln(
Al fylAt fyt
s
), (4)
where A, B, C, and D are numerical coefficients to be determined.To perform the multiple linear regression, the data and terms for each reference beam
from the database (TR, fc, Ac, and Al fylAt fyt
s ) were previously log-transformed. Then, amultiple linear model was fitted, obtaining a high R2 equal to 0.984, and a mean squarederror equal to 0.013552. For this analysis, IBM SPSS software version 28 was used. Theobtained linear fitted model is the following:
ln(TR) = 0.087 + 0.218 ln( fc) + 1.013 ln(Ac) + 0.318 ln(
Al fylAt fyt
s
)(5)
From the previous equation, the equivalent Equation (6) can be written to computethe torsional strength for under-reinforced beams.
6.3. Proposed Equations
From the results obtained in the previous subsections, Equations (6) and (7) areproposed as an improvement for Equation (1) to compute the torsional strength of RCbeams. Equation (6) constitutes an alternative to Equation (2) proposed by Rahal in 2013 [8].In Equations (6) and (7), the units of parameters are: fc [MPa], Ac [m2], Al [cm2], fyl [MPa],At/s [cm2/m], fyl [MPa], Ac [m2], and pc [m]. The torsional strength TR is computed inunits [kNm].
As for Equations (2) and (3), Equation (6) governs the torsional strength for under-reinforced beams, while the upper limit stated in Equation (7) governs the torsional strengthfor over-reinforced beams, respectively. Equations (6) and (7) can also be applied to arbitrarycross-section shapes.
TR = 1.091( fc)0.218(Ac)
1.013(
Al fylAt fyt
s
)0.318
(6)
≤ 2500( fc)0.3 Ac
2
pc, (7)
The results from Equations (6) and (7) are checked against the results from all 202 testedbeams from the database. The torsional strengths computed from the previous equationsfor each reference beam (TProp
T,th ) are presented in Table A3, and the ratios TR,exp/TPropT,th are
presented in Table A4. The results are summarized in Table 2 and Figure 3. They showthat Equations (6) and (7) provide accurate results (with x = 1.01) with a very acceptabledispersion (with cv = 13%). The results are also good for both plain and hollow RC beams.A comparison with the results from the reference codes used in this study (Table 1 andFigure 2) shows that the proposed equations provide much better results, with higheraccuracy and much less dispersion. When compared with the results from Equations (2)

Materials 2022, 15, 3827 13 of 34
and (3) from Rahal [8], it can be concluded that they are quite similar, although the resultsfrom the equations proposed in this study are slightly better. It should also be noted thatthese good results were observed for both normal- and high-strength concrete beams, aswell as for under- and over-reinforced beams.
Finally, Table 2 also summarizes the obtained results substituting Equation (6) witha simplified version, Equation (8). Table 2 shows that, despite the very small changesin the powers and the numerical factors, the results show that the computed torsionalstrengths tend to be slightly unsafe (with x = 0.96 < 1.00). This shows that the model ishighly sensitive to the precision of the numerical values (numerical factor and powers).
TR = 1.09( fc)0.22 Ac
(Al fyl
At fyt
s
)0.32
(8)
≤ 2500( fc)0.3 Ac
2
pc, (9)
Although it is not discussed in this paper, it is worth noting that the calibration ofappropriate safety factors for material parameters as well as of a model uncertainty factorγRd for Equations (6) and (7) would produce a code-formatted design capacity equationcompliant with a predefined reliability level [52], which could be used in the design of RCbeams failing in torsion.
7. Conclusions
In this study, a review and comparative analysis of the calculation procedures to com-pute the torsional strength of RC beams from some reference design codes was performed.For this, a wide database was built, incorporating the experimental torsional strengthsof 202 RC rectangular beams tested until failure and found in the literature. In addition,based on the reference RC beams from the database and on correlation studies between thetorsional strength and some properties (amount of reinforcement, concrete strength, andconcrete area enclosed within the external perimeter of the cross-section), simple equationsto compute the torsional strength were proposed and checked.
From the obtained results, the following main conclusions can be drawn:
• In general, equations from the studied reference codes still need improvements toincrease the accuracy and reduce the observed statistical dispersion;
• Some reference design codes overestimate the torsional strength of several referenceRC beams from the database noticeably, which is not acceptable for design and justifiesfurther improvements;
• The proposed equations to compute the torsional strength of RC beams showed to bemuch more reliable and accurate in comparison with code’s equations;
• The proposed equations are simple and can easily be used for practice to assess withaccuracy the torsional strength of RC members, including plain and hollow beams,normal- and high-strength concrete beams, as well as under- and over-reinforcedbeams;
• When compared with similar equations from a previous study [8], the proposedequations were shown to be slightly better at predicting torsional strength;
• This study confirms that simple and reliable design equations can be obtained bysimply fitting the results with experimental data existing in the literature and relatedto the torsional strength of the RC beams.
Author Contributions: L.F.A.B.—conceptualization, supervision, validation, writing—review andediting. M.M.T.—methodology, investigation, formal analysis, and writing—original draft prepa-ration. D.D.D.—validation and writing—review and editing. J.M.R.G.—data curation, software,and writing—review and editing. All authors have read and agreed to the published version ofthe manuscript.
Funding: This research received no external funding.

Materials 2022, 15, 3827 14 of 34
Institutional Review Board Statement: Not applicable.
Informed Consent Statement: Not applicable.
Data Availability Statement: Not applicable.
Conflicts of Interest: The authors declare no conflict of interest.
Nomenclature
Acarea enclosed within the outer perimeter ofthe cross-section
uk perimeter of the area Ak
Akarea within the centerline of wall’s thickness (assumedto coincide with the shear flow path)
V alied shear force
Al total area of longitudinal reinforcement VR resistance shear force
Al1 area of bottom longitudinal reinforcement VRcshear force due to the compressive stresses resistedby concrete
Al2 area of tensile longitudinal steel near the vertical face VRlshear force due to the axial stresses resisted by thelongitudinal reinforcement
Ao area enclosed within circular shear flow VR,max maximum resistance shear force
Aoh area enclosed within centerline of hoops VRtshear force due to shear stresses resisted by thetransverse reinforcement
At area for one bar of the hoop x smaller dimension of the cross-sectionfc average compressive strength of concrete x1 smaller dimension of hoops
fckcharacteristic value of the compressive strength ofconcrete at 28 days
y larger dimension of the cross-section
fyl average yield strength of longitudinal reinforcement y1 larger dimension of hoops
fyt average yield strength of tranerse reinforcement zilength of wall i, equal to the distance between thecenterline intersection of adjacent walls
kc concrete reduction factor α angle of the hoops to the longitudinal axis
pc gross perimeter of the cross-section αcwcoefficient to account for the stress state of thecompressed chord
ph perimeter of the centerline of hoop αt efficiency coefficientq shear stress flow due to torsion γc partial safety factor for concrete propertiess longitudinal spacing between hoops δ numerical coefficient to account for imperfections
T applied torsional moment θangle of the diagonal compressive stresses in concretestruts to the longitudinal axis
t Wall’s thickness of the equivalent hollow section ν strength reduction factor for cracked concreteTc torsional moment resisted by concrete ρl ratio of longitudinal reinforcement: ρl = Al/xyTmax maximum torsional mome ρt ratio of transverse reinforcement: ρt = Atu/AsTR torsional moment resistance τ shear stress due to torsionTR,exp experimental torsional moment resistance φ reduction coefficientTR,th theoretical torsional moment resistance φc concrete resistance factorTs torsional moment resisted by the reinforcement φs reinforcement resistance factorTu ultimate torsional moment

Materials 2022, 15, 3827 15 of 34
Appendix A
Table A1. Equations from the reference design codes.
SinNiP 2018 ACI 318R-89
Lim
itof
the
sect
ion
wal
lthi
ckne
ss
Not available
Wall thickness of the hollow section:If t ≥ x/4the section is considered as a plain section;If x/10t ≤ t < x/4the section is considered as an equivalent plain section.
Shea
rst
ress
esan
dsh
ear
forc
esdu
eto
tors
ion
Not available Not available
Safe
tyco
ndit
ion Condition:
TR ≤ TmaxwhereTR = min{TR1; TR2}TR1 = 0.5Al1 fyly + At fyt
(x2y
s(2y+x)
)TR2 = 0.5Al2 fyl x + At fyt
(y2x
s(2x+y)
)
Condition:Tu ≤ TRwhereTR = Tc + TsFor plain section:Tc = 0.8( fc)
1/2x2yFor hollow section:Tc = 0.8( fc)
1/2x2y(
4tx
)Ts =
Ats αtx1y1 fty
whereαt = 0.66 + 0.33(y1/x1) ≤ 1.5and x1 ≤ y1
Max
imum
limit
byth
ete
nsio
nin
conc
rete
stru
ts
Maximum limit:Tmax = 0.1 fcx2y
Maximum limit:If Ts ≤ 4Tc, thenTR = Tc + TsIf Ts > 4Tc, thenTR = 5Tc
* Not available Not available
* Angle between the concrete struts and the longitudinal axis of the beams.

Materials 2022, 15, 3827 16 of 34
ACI 318R-19 MC 90
Lim
itof
the
sect
ion
wal
lthi
ckne
ss
Wall thickness of the hollow section:If t ≥ Aoh/phthe section is considered as a plainsection;If t < Aoh/phthe section is considered as an equivalentplain section.
Wall thickness of the hollow section:If t = A/u ≤ trealthe section is considered as a hollow section;If t = A/u > trealthe section is considered as a plain section (equivalenthollow section).Wall thickness of the plain section(equivalent hollow section):t = A/u and t > 2x distance between the face of the sectionand the axis of the longitudinal reinforcement.
Shea
rst
ress
esan
dsh
ear
forc
esdu
eto
tors
ion
Shear flow for a thin-walled tube:q = τtShear stress along the perimeter of thesection:τ = T
2Ao twith Ao = 0.85Aoh
Shear flow at a walli:τiti =
T2Aoδ
Shear stress at a walli:Vi =
Tzi2Aoδ
where δ = 1.0− 0.25(x/y), with y ≥ x.
Safe
tyco
ndit
ion
Condition:Tu ≤ φTRwhere φ = 1 (for the present study).TR = min{(a); (b)}
(a) TR = 2AoAts fyt cos θ
(b) TR = 2Al fyltan θ
ph
Condition:VR = min{(a); (b); (c)}(a) Shear force due to the force on the longitudinalreinforcement:VRl ≤ Al fyl/ cot θ
(c) Shear force due to the force on the transversereinforcement:VRt = At fytuk cot θ/s
Max
imum
limit
byth
ete
nsio
nin
conc
rete
stru
ts Maximum limit to plain section:
Tu ≤ φ8( fc)1/21.7 A2
ohph
Maximum limit to hollow section:Tu ≤ φ8( fc)
1/21.7Aohtwhere φ = 1 (for the present study).
Maximum limit:Shear force due to the force on the concrete struts:VRc ≤ fcd2tuk cos θ sin θ
wherefcd2 = 0.60(1− fck/250) fc
* cot2 θ =Al fyl s
At fyt phcot2 θ =
Al fyl sAt fytuk
* Angle between the concrete struts and the longitudinal axis of the beams.

Materials 2022, 15, 3827 17 of 34
MC 10 Eurocode 2
Lim
itof
the
sect
ion
wal
lthi
ckne
ss
Wall thickness of the hollow section:t = trealWall thickness of the plain section(equivalent hollow section):t = 2x distance between the face of thesection and the axis of the longitudinalreinforcement and t ≤ x/8.
Wall thickness of the hollow section:If t = A/u ≤ trealthe section is considered as a hollow section;If t = A/u > trealthe section is considered as a plain section (equivalenthollow section).Wall thickness of the plain section(equivalent hollow section):t = A/u e t > 2x distance between the face of the sectionand the axis of the longitudinal reinforcement.
Shea
rst
ress
esan
dsh
ear
forc
esdu
eto
tors
ion
Shear stress at a wall i:Vi =
Tzi2Ak
Shear flow at a wall i:τiti =
T2Ak
Shear stress at a wall i:Vi = τitizi
Safe
tyco
ndit
ion Condition:
VR = VRc + VRt ≤ VR,maxApproximation level II:VRc = 0VRt =
Ats uk fyt cot θ
Condition:T
TR,max≤ 1.0
VR = Ats uk fyt cot θ
Max
imum
limit
byth
ete
nsio
nin
conc
rete
stru
ts Maximum limit:VR,max = kc
(fckγc
)tuk
(cot θ−cot α
1+cot2 θ
)Approximation level II:kc = 0.55(30/ fck)
1/3 ≤ 0.55and α = 90
Maximum limit:TR,max = 2ναcw fc Akt sin θ cos θ
whereν = 0.6[1− ( fck/250)]and αcw = 1, for non-prestressed beams.
* cot2 θ =2Al fyl sAt fytuk
cot2 θ =Al fyl s
At fytuk
* Angle between the concrete struts and the longitudinal axis of the beams.
CSA A23.3-14
Lim
itof
the
sect
ion
wal
lth
ickn
ess Wall thickness of the hollow section:
If t ≥ Aoh/phthe section is considered as a plain section; If t < Aoh/phthe section is considered as an equivalent plains section.
Shea
rst
ress
esan
dsh
ear
forc
esdu
eto
tors
ion
Not available
Safe
tyco
ndit
ion Condition:
Tu ≤ TRwhereTR = 2Aoφs
Ats fyt cos θ
with Ao = 0, 85Aoh and φs = 1 (for the present study).
Max
imum
limit
byth
ete
nsio
nin
conc
rete
stru
ts
Maximum limit to plain section:
Tu ≤ 0.25φc fc1.7 A2oh
ph
Maximum limit to hollow section: Tu ≤ 0.25φc fc1.7Aohtwhere φc = 1 (for the present study).
* cot2 θ =Al fyl s
0.45At fyt ph
* Angle between the concrete struts and the longitudinal axis of the beams.

Materials 2022, 15, 3827 18 of 34
Table A2. Geometric and mechanical properties of the reference RC beams.
Ref
.
Beam **x y t x1 y1 Al1 Al2 Al At/s fc fyl fyt
(m) (m) (m) (m) (m) (cm2) (cm2) (cm2) (cm2/m) (MPa) (MPa) (MPa)
Hsu
(196
8)
B1 P 0.254 0.381 - 0.216 0.343 2.53 2.53 5.07 4.68 27.6 314.0 341.0B3 P 0.254 0.381 - 0.216 0.343 5.73 5.73 11.36 10.16 28.1 327.6 320.0B4 P 0.254 0.381 - 0.216 0.343 7.74 7.74 15.48 14.01 29.2 320.0 323.4B5 P 0.254 0.381 - 0.216 0.343 10.20 10.20 20.39 18.47 30.6 332.4 321.4B6 P 0.254 0.381 - 0.216 0.343 12.90 12.90 25.81 22.58 28.8 331.7 322.8B7 P 0.254 0.381 - 0.216 0.343 2.53 2.53 5.16 10.16 26.0 320.0 318.6B8 P 0.254 0.381 - 0.216 0.343 2.53 2.53 5.16 22.58 26.8 322.1 320.0B9 P 0.254 0.381 - 0.216 0.343 5.73 5.73 11.36 4.66 28.8 319.3 342.8
B10 P 0.254 0.381 - 0.216 0.343 12.90 12.90 25.8 4.66 26.5 334.0 342.0C2 P 0.254 0.254 - 0.216 0.216 2.53 2.53 5.07 6.07 26.5 334.0 345.0C4 P 0.254 0.254 - 0.216 0.216 5.73 5.73 11.36 13.11 27.2 336.6 327.6C5 P 0.254 0.254 - 0.216 0.216 7.74 7.74 15.48 17.67 27.2 328.3 329.0C6 P 0.254 0.254 - 0.216 0.216 10.20 10.20 20.39 23.91 27.6 315.9 327.6G2 P 0.254 0.508 - 0.216 0.470 3.97 3.97 7.94 5.91 30.9 323.0 334.0G3 P 0.254 0.508 - 0.216 0.470 5.73 5.73 11.36 8.29 26.8 338.6 327.6G4 P 0.254 0.508 - 0.216 0.470 7.74 7.74 15.48 11.29 28.3 325.5 321.4G5 P 0.254 0.508 - 0.216 0.470 10.20 10.20 20.39 15.05 26.9 331.0 327.6G6 P 0.254 0.508 - 0.216 0.470 2.53 3.80 7.60 5.61 29.9 334.0 350.0G7 P 0.254 0.508 - 0.216 0.470 3.97 5.96 12.00 8.84 31.0 319.3 322.8G8 P 0.254 0.508 - 0.216 0.470 5.73 8.60 17.03 12.32 28.3 322.1 329.0I2 P 0.254 0.381 - 0.216 0.343 3.97 3.97 7.94 7.25 45.2 325 349I3 P 0.254 0.381 - 0.216 0.343 5.73 5.73 11.36 10.16 44.8 343.4 333.8I4 P 0.254 0.381 - 0.216 0.343 7.74 7.74 15.48 14.01 45.0 315.2 326.2I5 P 0.254 0.381 - 0.216 0.343 10.20 10.20 20.39 18.47 45.0 310.3 325.5I6 P 0.254 0.381 - 0.216 0.343 12.90 12.90 25.81 22.58 45.8 325.5 329.0J1 P 0.254 0.381 - 0.216 0.343 2.53 2.53 5.16 4.66 14.3 327.6 346.2J2 P 0.254 0.381 - 0.216 0.343 3.97 3.97 8.00 7.21 14.6 320.0 340.7J3 P 0.254 0.381 - 0.216 0.343 5.73 5.73 11.36 10.16 16.9 388.6 337.2J4 P 0.254 0.381 - 0.216 0.343 7.74 7.74 15.48 14.01 16.8 324.1 331.7K2 P 0.152 0.495 - 0.114 0.457 2.53 3.80 7.74 6.77 30.6 335.9 337.9K3 P 0.152 0.495 - 0.114 0.457 3.97 5.96 12.00 10.42 29.0 315.9 320.7K4 P 0.152 0.495 - 0.114 0.457 5.73 8.60 17.03 15.05 28.6 344.1 340.0M1 P 0.254 0.381 - 0.216 0.343 3.97 3.97 8.00 4.76 29.9 326.2 353.1M2 P 0.254 0.381 - 0.216 0.343 5.73 5.73 11.36 6.77 30.6 329.0 357.2M3 P 0.254 0.381 - 0.216 0.343 7.74 7.74 15.48 9.24 26.8 322.1 326.2M4 P 0.254 0.381 - 0.216 0.343 10.20 10.20 20.39 12.33 26.6 318.6 326.9M5 P 0.254 0.381 - 0.216 0.343 12.90 12.90 25.81 15.63 28.0 335.2 331.0M6 P 0.254 0.381 - 0.216 0.343 10.20 15.30 30.58 15.63 29.4 317.9 340.7N1 P 0.152 0.305 - 0.130 0.283 1.43 1.43 2.84 3.50 29.5 352.4 341.4N1a P 0.152 0.305 - 0.130 0.283 1.43 1.43 2.84 3.50 28.7 346.2 344.8
** P—Plain section; H—Hollow section.

Materials 2022, 15, 3827 19 of 34R
ef.
Beam **x y t x1 y1 Al1 Al2 Al At/s fc fyl fyt
(m) (m) (m) (m) (m) (cm2) (cm2) (cm2) (cm2/m) (MPa) (MPa) (MPa)
N2 P 0.152 0.305 - 0.130 0.283 2.53 2.53 5.16 6.35 30.4 331.0 337.9N2a P 0.152 0.305 - 0.130 0.283 2.53 2.53 1.61 6.21 28.4 333.1 360.7N3 P 0.152 0.305 - 0.130 0.283 1.43 2.14 4.26 5.08 27.3 351.7 351.7N4 P 0.152 0.305 - 0.130 0.283 2.53 3.25 6.58 7.98 27.3 340.9 355.9
[17] T4 P 0.500 0.500 - 0.454 0.454 5.65 5.65 18.10 10.28 35.3 356.7 356.7
Leon
hard
t,Sc
helli
ng(1
974)
VB2 P 0.440 0.240 - 0.420 0.220 2.63 1.46 7.01 5.84 26.4 541.4 541.4VB3 P 0.440 0.240 - 0.420 0.220 2.63 1.46 7.01 5.84 39.1 541.4 541.4VB4 P 0.440 0.240 - 0.420 0.220 2.63 1.46 7.01 5.84 49.8 541.4 541.4VM1 P 0.294 0.160 - 0.280 0.146 1.50 1.00 3.00 3.63 39.1 442.4 568.9VM2 P 0.440 0.240 - 0.420 0.220 3.30 2.20 6.60 5.32 36.1 431.6 436.5VM3 P 0.587 0.320 - 0.561 0.294 6.42 4.28 12.84 7.14 40.0 461.0 442.4VQ1 P 0.324 0.324 - 0.304 0.304 1.15 1.15 3.46 2.88 19.0 557.1 557.1VQ3 P 0.580 0.186 - 0.560 0.166 1.83 0.61 4.27 3.05 17.6 432.6 432.6VQ9 P 0.806 0.140 - 0.786 0.120 2.54 0.56 5.08 2.82 19.5 441.4 441.4
VS2-VQ2 P 0.440 0.240 - 0.420 0.220 1.53 0.92 3.66 3.05 19.0 432.6 432.6VS3 P 0.440 0.240 - 0.420 0.220 2.14 1.22 5.49 4.55 19.5 432.6 432.6
VS4-VQ5 P 0.440 0.240 - 0.420 0.220 2.75 1.53 7.32 6.10 19.0 432.6 432.6VS9 P 0.440 0.240 - 0.420 0.220 1.16 1.16 3.48 2.90 17.6 570.9 570.9
VS10-VB1 P 0.440 0.240 - 0.420 0.220 2.61 1.45 6.96 5.80 19.0 570.9 570.9VU1 P 0.440 0.240 - 0.420 0.220 1.40 0.84 3.36 5.60 19.5 441.4 441.4VU2 P 0.440 0.240 - 0.420 0.220 1.96 1.12 5.04 5.60 19.5 441.4 441.4VU3 P 0.440 0.240 - 0.420 0.220 2.52 1.40 6.72 4.18 18.5 441.4 441.4VU4 P 0.440 0.240 - 0.420 0.220 2.52 1.40 6.72 2.80 18.5 441.4 441.4
McM
ulle
n,R
anga
n(1
978)
A2 P 0.254 0.254 - 0.222 0.222 2.53 2.53 5.16 7.82 38.2 380.0 285.0A3 P 0.254 0.254 - 0.219 0.219 3.97 3.97 8.00 8.94 39.4 352.4 360.0A4 P 0.254 0.254 - 0.219 0.219 5.73 5.73 11.36 12.42 39.2 351.0 360.0B1r P 0.178 0.356 - 0.146 0.324 1.43 1.43 2.85 3.87 36.3 360.0 285.0B2 P 0.178 0.356 - 0.146 0.324 2.53 2.53 5.07 7.19 39.6 380.0 285.0B3 P 0.178 0.356 - 0.143 0.321 3.97 3.97 8.00 8.60 38.6 352.4 360.0B4 P 0.178 0.356 - 0.143 0.321 5.73 5.73 11.36 11.76 38.5 351.0 360.0
Ras
mus
sen,
Bake
r(1
995)
B30.1 P 0.160 0.275 - 0.120 0.235 5.15 7.72 15.44 8.73 41.7 620.0 665.0B30.2 P 0.160 0.275 - 0.120 0.235 5.15 7.72 15.44 8.73 38.2 638.0 669.0B30.3 P 0.160 0.275 - 0.120 0.235 5.15 7.72 15.44 8.73 36.3 605.0 672.0B50.1 P 0.160 0.275 - 0.120 0.235 5.15 7.72 15.44 8.73 61.8 612.0 665.0B50.2 P 0.160 0.275 - 0.120 0.235 5.15 7.72 15.44 8.73 57.1 614.0 665.0B50.3 P 0.160 0.275 - 0.120 0.235 5.15 7.72 15.44 8.73 61.7 612.0 665.0B70.1 P 0.160 0.275 - 0.120 0.235 5.15 7.72 15.44 8.73 77.3 617.0 658.0B70.2 P 0.160 0.275 - 0.120 0.235 5.15 7.72 15.44 8.73 76.9 614.0 656.0B70.3 P 0.160 0.275 - 0.120 0.235 5.15 7.72 15.44 8.73 76.2 617.0 663.0
B110.1 P 0.160 0.275 - 0.120 0.235 5.09 7.63 15.44 8.73 109.8 618.0 655.0B110.2 P 0.160 0.275 - 0.120 0.235 5.09 7.63 15.44 8.73 105.0 634.0 660.0
** P—Plain section; H—Hollow section.

Materials 2022, 15, 3827 20 of 34R
ef.
Beam **x y t x1 y1 Al1 Al2 Al At/s fc fyl fyt
(m) (m) (m) (m) (m) (cm2) (cm2) (cm2) (cm2/m) (MPa) (MPa) (MPa)
B110.3 P 0.160 0.275 - 0.120 0.235 5.15 7.72 15.44 8.73 105.1 629.0 655.0
Kou
tcho
ukal
i,Be
larb
i(2
001)
B5UR1 P 0.203 0.305 - 0.165 0.267 2.53 2.53 5.16 6.56 39.6 386.0 373.0B7UR1 P 0.203 0.305 - 0.165 0.267 2.53 2.53 5.16 6.56 64.6 386.0 399.0B9UR1 P 0.203 0.305 - 0.165 0.267 2.53 2.53 5.16 6.56 75.0 386.0 373.0B12UR1 P 0.203 0.305 - 0.165 0.267 2.53 2.53 5.16 6.56 80.6 386.0 399.0B12UR2 P 0.203 0.305 - 0.165 0.267 2.53 2.53 5.16 6.95 76.2 386.0 386.0B12UR3 P 0.203 0.305 - 0.165 0.267 2.53 3.25 6.58 7.46 72.9 379.5 386.0B12UR4 P 0.203 0.305 - 0.165 0.267 2.53 3.80 7.74 7.88 75.9 373.0 386.0B12UR5 P 0.203 0.305 - 0.165 0.267 3.97 3.97 8.00 10.13 76.7 380.0 386.0B14UR1 P 0.203 0.305 - 0.165 0.267 2.53 2.53 5.16 6.56 93.9 386.0 386.0
Fang
,Shi
au(2
004)
H-06-06 P 0.350 0.500 - 0.300 0.450 3.97 9.93 11.92 7.13 78.5 440.0 440.0H-06-12 P 0.350 0.500 - 0.300 0.450 5.07 12.67 20.65 7.10 78.5 410.0 440.0H-07-10 P 0.350 0.500 - 0.300 0.450 5.73 14.33 17.03 7.89 68.4 500.0 420.0H-07-16 P 0.350 0.500 - 0.300 0.450 8.60 22.92 28.39 7.89 68.4 500.0 420.0H-12-12 P 0.350 0.500 - 0.300 0.450 5.07 12.67 20.65 14.19 78.5 410.0 440.0H-12-16 P 0.350 0.500 - 0.300 0.450 8.60 18.62 28.39 14.19 78.5 520.0 440.0H-14-10 P 0.350 0.500 - 0.300 0.450 5.73 14.33 17.03 16.13 68.4 500.0 360.0H-20-20 P 0.350 0.500 - 0.300 0.450 8.60 22.92 34.06 23.46 78.5 560.0 440.0N-06-06 P 0.350 0.500 - 0.300 0.450 3.97 9.93 12.00 7.10 35.5 440.0 440.0N-06-12 P 0.350 0.500 - 0.300 0.450 5.07 12.67 20.65 7.10 35.5 410.0 440.0N-07-10 P 0.350 0.500 - 0.300 0.450 5.73 14.33 17.03 7.89 33.5 500.0 420.0N-07-16 P 0.350 0.500 - 0.300 0.450 8.60 20.06 28.39 7.89 33.5 500.0 420.0N-12-12 P 0.350 0.500 - 0.300 0.450 5.07 12.67 20.65 14.19 35.5 410.0 440.0N-12-16 P 0.350 0.500 - 0.300 0.450 8.60 20.06 28.39 14.19 35.5 520.0 440.0N-14-10 P 0.350 0.500 - 0.300 0.450 5.73 14.33 17.03 16.13 33.5 500.0 360.0N-20-20 P 0.350 0.500 - 0.300 0.450 8.60 22.92 34.06 23.46 35.5 560.0 440.0
Chi
uet
al.(
2007
)
HAS-51-50 P 0.420 0.420 - 0.370 0.370 3.80 3.25 9.03 5.94 76.0 396.0 385.0NAS-61-35 P 0.420 0.420 - 0.370 0.370 4.68 4.69 10.80 4.19 48.0 394.0 385.0HAS-90-50 P 0.420 0.420 - 0.370 0.370 5.96 5.96 15.89 5.94 78.0 400.0 385.0NBS-43-44 P 0.350 0.500 - 0.300 0.450 2.53 3.80 7.60 5.09 35.0 400.0 385.0HBS-74-17 P 0.350 0.500 - 0.300 0.450 5.73 6.44 12.89 2.02 67.0 505.0 600.0HBS-82-13 P 0.350 0.500 - 0.300 0.450 5.73 7.16 14.31 1.49 67.0 493.0 600.0NBS-82-13 P 0.350 0.500 - 0.300 0.450 5.73 7.16 14.31 1.49 35.0 493.0 600.0HBS-60-61 P 0.350 0.500 - 0.300 0.450 3.97 5.24 10.48 7.13 67.0 402.0 385.0HCS-52-50 P 0.250 0.700 - 0.200 0.650 2.53 4.51 9.03 5.09 76.0 396.0 385.0HCS-91-50 P 0.250 0.700 - 0.200 0.650 3.97 7.94 15.89 5.09 78.0 400.0 385.0
Lee
and
Kim
(201
0)
T1-1 P 0.300 0.350 - 0.260 0.310 2.53 2.53 5.07 5.48 43.2 410.0 370.0T1-2 P 0.300 0.350 - 0.260 0.310 2.53 3.80 7.60 8.39 44.0 410.0 370.0T1-3 P 0.300 0.350 - 0.260 0.310 2.53 5.07 10.14 10.97 41.7 410.0 370.0T1-4 P 0.300 0.350 - 0.260 0.310 3.97 5.96 11.92 16.89 42.6 510.0 355.0T2-2 P 0.300 0.350 - 0.260 0.310 3.97 5.96 7.94 5.48 41.7 510.0 370.0
** P—Plain section; H—Hollow section.

Materials 2022, 15, 3827 21 of 34R
ef.
Beam **x y t x1 y1 Al1 Al2 Al At/s fc fyl fyt
(m) (m) (m) (m) (m) (cm2) (cm2) (cm2) (cm2/m) (MPa) (MPa) (MPa)
T2-3 P 0.300 0.350 - 0.260 0.310 3.97 5.96 11.92 8.10 42.7 510.0 370.0
T2-4 P 0.300 0.350 - 0.260 0.310 5.73 7.00 14.00 9.51 42.6 512.4 370.0
Peng
,Won
g(2
011)
SW12-1 P 0.150 1.200 - 0.100 1.150 2.26 11.31 22.62 3.93 44.2 480.0 459.0
SW10-1 P 0.150 1.000 - 0.100 0.950 2.26 9.05 18.10 3.93 29.5 499.0 459.0
SW10-2 P 0.150 1.000 - 0.098 0.948 2.26 9.05 18.10 7.54 44.2 480.0 480.0
SW10-3 P 0.150 1.000 - 0.098 0.948 2.26 9.05 18.10 11.31 29.5 499.0 499.0
SW10-4 P 0.150 1.000 - 0.094 0.944 4.02 16.08 32.16 16.08 33.8 497.0 497.0
SW8-1 P 0.150 0.800 - 0.102 0.752 1.57 7.07 14.14 4.02 29.5 459.0 433.0
SW8-2 P 0.150 0.800 - 0.098 0.748 1.57 7.07 14.14 11.31 29.5 459.0 499.0
Joh
etal
.(20
19)
RA-SD4-3.2-0.3-3.28 P 0.300 0.400 - 0.270 0.370 11.91 11.91 30.97 7.13 73.7 452.0 484.0
RA-SD5-3.2-0.3-3.21 P 0.300 0.400 - 0.270 0.370 11.61 11.61 30.97 6.48 73.7 499.0 538.0
RA-SD6-3.2-0.2-3.21 P 0.300 0.400 - 0.270 0.370 11.61 11.61 30.97 6.48 73.7 630.0 538.0
RA-SD4-3.2-0.5-2.13 P 0.300 0.400 - 0.270 0.370 5.73 8.60 17.19 7.13 84.7 456.0 484.0
RA-SD5-3.2-0.7-1.63 P 0.300 0.400 - 0.270 0.370 3.97 5.96 11.92 6.48 84.7 529.0 538.0
RA-SD6-3.2-0.6-1.63 P 0.300 0.400 - 0.270 0.370 3.97 5.96 11.92 6.48 84.7 627.0 538.0
RA-SD4-3.2-1.1-1.33 P 0.300 0.400 - 0.270 0.370 2.53 3.80 7.60 7.13 83.1 474.0 484.0
RA-SD5-3.2-1.0-1.26 P 0.300 0.400 - 0.270 0.370 2.53 3.80 7.60 6.48 83.1 522.0 538.0
RA-SD6-3.2-0.8-1.26 P 0.300 0.400 - 0.270 0.370 3.97 3.97 7.94 6.48 83.1 627.0 538.0
Juet
al.
(201
9)
MR30-0.77 P 0.350 0.500 - 0.300 0.450 2.53 3.80 7.60 3.96 29.3 489.8 467.5
MT30-1.32 P 0.350 0.500 - 0.300 0.450 5.73 8.60 17.19 3.96 29.3 500.4 467.5
MT40-1.32 P 0.350 0.500 - 0.300 0.450 5.73 8.60 17.19 3.96 40.3 500.4 467.5
MT40-1.89 P 0.350 0.500 - 0.300 0.450 5.73 8.60 17.19 10.57 40.3 489.8 489.8
Ibra
him
etal
.(2
020)
NSC-S1-C30 P 0.200 0.300 - 0.168 0.268 2.26 2.26 4.52 6.28 42.1 689.7 534.1
NSC-S1-C45 P 0.200 0.300 - 0.138 0.238 2.26 2.26 4.52 6.28 39.4 689.7 534.1
HSC-C30 P 0.200 0.300 - 0.168 0.268 2.26 2.26 4.52 6.28 60.8 689.7 534.1
HSC-C45 P 0.200 0.300 - 0.138 0.238 2.26 2.26 4.52 6.28 60.8 689.7 534.1
Kim
etal
.(20
20)
S08-3-65 P 0.400 0.600 - 0.310 0.510 5.24 7.77 18.08 10.97 35.4 313.3 334.9
S08-4-90 P 0.400 0.600 - 0.310 0.510 2.85 5.23 13.30 7.92 35.4 474.6 485.8
S08-5-122.5 P 0.400 0.600 - 0.310 0.510 3.80 3.96 10.45 5.82 35.4 569.6 595.9
S10-3-52.5 P 0.400 0.600 - 0.310 0.510 5.24 9.93 22.39 13.58 35.4 320.5 334.0
S10-4-72.5 P 0.400 0.600 - 0.310 0.510 5.07 5.78 16.63 9.83 35.4 467.6 485.1
S10-5-100 P 0.400 0.600 - 0.310 0.510 3.80 5.23 12.98 7.13 35.4 567.6 595.2
S06-3-90 P 0.400 0.600 - 0.310 0.510 2.85 5.23 13.30 7.92 35.4 319.4 334.3
S10-5-90 P 0.400 0.600 - 0.310 0.510 3.96 5.78 14.41 7.92 35.4 569.6 594.8
S08-3-72.5 P 0.400 0.600 - 0.310 0.510 5.07 5.78 16.63 9.83 35.4 308.8 334.8
S12-5-72.5 P 0.400 0.600 - 0.310 0.510 5.24 7.77 18.05 9.83 35.4 565.1 595.2
Hsu
(196
8) D3 H 0.254 0.381 0.064 0.216 0.343 * * 11.36 10.16 28.4 341.4 333.1
D4 H 0.254 0.381 0.064 0.216 0.343 30.97 30.97 15.48 14.01 30.6 330.3 333.1
[17,
38] T0 H 0.500 0.500 0.080 0.430 0.430 * * 32.16 10.28 45.1 345.2 357.0
T1 H 0.500 0.500 0.080 0.454 0.454 4.52 4.52 18.10 10.28 35.3 356.7 356.7
T2 H 0.500 0.500 0.080 0.430 0.430 * * 18.10 10.28 35.3 357.0 357.0
* No sufficient data; ** P—Plain section; H—Hollow section.

Materials 2022, 15, 3827 22 of 34R
ef.
Beam **x y t x1 y1 Al1 Al2 Al At/s fc fyl fyt
(m) (m) (m) (m) (m) (cm2) (cm2) (cm2) (cm2/m) (MPa) (MPa) (MPa)
T5 H 0.800 0.400 0.080 0.730 0.330 * * 10.00 10.28 47.1 528.6 512.9
[19] VH1 H 0.324 0.324 0.080 0.304 0.304 1.15 1.15 3.46 2.88 17.2 447.3 447.3
VH2 H 0.324 0.324 0.080 0.304 0.304 * * 6.91 5.76 17.2 447.3 447.3
Bern
ardo
,Lop
es(2
009)
A1 H 0.600 0.600 0.098 0.537 0.547 * * 6.53 3.14 48.4 695.9 636.7
A2 H 0.600 0.600 0.107 0.538 0.531 4.62 4.62 13.95 6.28 47.3 672.4 695.9
A3 H 0.600 0.600 0.109 0.535 0.535 5.65 5.65 18.10 8.27 46.2 672.4 714.8
A4 H 0.600 0.600 0.104 0.520 0.525 7.95 7.95 23.75 11.22 54.8 723.9 714.8
A5 H 0.600 0.600 0.104 0.528 0.528 9.68 9.68 30.66 14.14 53.1 723.9 672.4
B2 H 0.600 0.600 0.108 0.533 0.534 4.78 4.78 14.58 6.70 69.8 672.4 695.9
B3 H 0.600 0.600 0.109 0.535 0.537 7.95 7.95 23.75 11.22 77.8 723.9 714.8
B4 H 0.600 0.600 0.112 0.523 0.536 10.05 10.05 32.17 15.08 79.8 723.9 672.4
B5 H 0.600 0.600 0.117 0.518 0.518 12.06 12.06 40.21 18.85 76.4 723.9 672.4
C1 H 0.600 0.600 0.097 0.540 0.549 * * 6.53 3.14 91.7 695.9 636.7
C2 H 0.600 0.600 0.100 0.532 0.533 4.62 4.62 13.95 6.28 94.8 672.4 695.9
C3 H 0.600 0.600 0.103 0.545 0.540 7.95 7.95 23.75 10.47 91.6 723.9 714.8
C4 H 0.600 0.600 0.103 0.546 0.545 9.68 9.68 30.66 14.14 91.4 723.9 672.4
C5 H 0.600 0.600 0.104 0.540 0.543 12.32 12.32 36.69 17.40 96.7 723.9 672.4
C6 H 0.600 0.600 0.104 0.533 0.529 14.07 14.07 48.25 22.62 87.5 723.9 672.4
Chi
uet
al.
(200
7)
HAH-81-35 H 0.420 0.420 0.075 0.370 0.370 5.73 6.44 14.31 4.19 78.0 493.0 385.0
NCH-62-33 H 0.250 0.700 0.075 0.200 0.650 3.97 5.40 10.80 3.40 48.0 394.0 385.0
HCH-91-42 H 0.250 0.700 0.075 0.200 0.650 3.97 7.94 15.89 4.32 78.0 400.0 385.0
Jeng
(201
4)
A095c H 0.497 0.711 0.145 0.437 0.651 * * 13.16 9.93 35.1 371.0 381.0
A120a H 0.502 0.719 0.184 0.442 0.659 * * 20.00 7.59 27.6 464.0 380.0
B065b H 0.503 0.710 0.092 0.443 0.650 * * 50.97 9.93 39.2 452.0 380.0
B080a H 0.500 0.721 0.112 0.440 0.661 * * 28.39 12.90 46.5 454.0 392.0
B110a H 0.498 0.710 0.155 0.438 0.650 * * 20.00 8.60 48.1 453.0 369.0
C100a H 0.499 0.723 0.127 0.439 0.663 * * 28.39 12.90 90.6 466.0 447.0
D075a H 0.498 0.734 0.087 0.438 0.674 * * 28.39 12.90 94.9 469.0 381.0
D090a H 0.501 0.722 0.105 0.441 0.662 * * 28.39 12.90 105.7 466.0 447.0
Kim
etal
.(20
20)
H08-3-65 H 0.400 0.600 0.100 0.310 0.510 5.24 7.77 18.08 10.97 36.5 361.1 352.2
H08-4-90 H 0.400 0.600 0.100 0.310 0.510 3.96 5.23 13.30 7.92 36.5 445.7 448.9
H08-5-100 H 0.400 0.600 0.100 0.310 0.510 3.25 5.23 11.88 7.13 36.5 545.5 539.8
H10-3-52.5 H 0.400 0.600 0.100 0.310 0.510 5.96 9.21 22.39 13.58 36.5 356.9 352.4
H10-4-72.5 H 0.400 0.600 0.100 0.310 0.510 5.07 5.78 16.63 9.83 36.5 444.5 447.9
H10-5-80 H 0.400 0.600 0.100 0.310 0.510 3.96 5.78 14.41 8.91 36.5 546.3 538.6
H06-3-90 H 0.400 0.600 0.100 0.310 0.510 2.85 5.23 13.30 7.92 36.5 359.1 351.0
H10-5-135 H 0.400 0.600 0.100 0.310 0.510 3.25 3.8 9.02 5.28 36.5 548.1 540.3
H08-3-72.5 H 0.400 0.600 0.100 0.310 0.510 5.07 5.78 16.63 9.83 36.5 359.4 352.7
H12-5-72.5 H 0.400 0.600 0.100 0.310 0.510 5.07 5.78 16.63 9.83 36.5 404.1 538.7
* No sufficient data; ** P—Plain section; H—Hollow section.

Materials 2022, 15, 3827 23 of 34
Table A3. Theoretical torsional strengths.
Ref
.
Beam **TR,exp TSiNiP18
R,th TACI89R,th TACI19
R,th TMC90R,th TMC10
R,th TEC2R,th TCSA14
R,th TRahalR,th TProp
R,th
(kNm) (kNm) (kNm) (kNm) (kNm) (kNm) (kNm) (kNm) (kNm) (kNm)
Hsu
(196
8)
B1 P 22.30 16.71 22.58 19.0 20.4 12.7 24.9 20.0 21.3 22.97B3 P 37.48 37.32 37.16 29.4 32.0 27.0 38.4 43.6 36.8 37.87
B4 * P 47.30 50.25 44.11 29.9 43.6 29.2 52.3 59.5 46.0 46.51B5 * P 56.11 67.68 45.14 30.6 57.2 31.2 70.0 63.7 51.5 51.42B6 * P 61.64 70.86 43.85 29.7 54.9 28.9 68.2 60.1 50.6 50.54B7 P 26.87 23.25 36.71 27.5 21.3 25.3 25.5 29.0 27.3 28.73B8 P 32.51 33.00 42.25 28.7 31.9 24.5 38.2 43.5 36.4 37.40B9 P 29.80 29.86 22.77 28.7 22.1 23.1 26.5 30.2 28.6 30.14B10 P 34.40 61.33 22.39 28.6 34.1 15.4 40.9 46.5 38.1 38.94C2 P 15.30 15.23 15.28 14.7 15.3 10.5 22.4 16.9 15.8 16.79
C4 * P 25.29 33.72 25.50 14.8 24.0 15.2 32.0 29.1 27.2 27.48C5 * P 29.69 44.64 28.42 14.8 26.9 15.4 37.2 29.1 27.6 27.60C6 * P 34.21 45.21 28.60 14.9 27.5 15.9 37.9 29.5 27.7 27.71G2 P 40.30 29.01 39.72 33.2 40.3 36.1 42.6 34.9 36.7 39.24G3 P 49.56 42.17 49.28 43.9 37.2 35.8 56.3 50.2 46.3 47.91G4 P 64.80 55.40 57.91 45.1 49.3 39.4 69.0 66.4 56.8 57.91
G5 * P 71.91 74.68 56.48 44.0 66.5 37.4 76.0 85.8 69.4 69.29G6 P 39.10 26.53 39.41 32.9 25.7 39.5 29.4 34.7 36.3 38.78G7 P 52.61 39.56 52.00 47.2 38.1 43.3 43.5 51.3 48.1 50.14G8 P 73.38 57.33 57.98 45.1 54.3 39.1 62.1 73.2 60.8 61.64I2 P 36.00 26.87 33.17 30.4 30.0 37.4 31.3 32.1 32.0 34.54I3 P 45.61 39.05 40.66 37.1 33.4 46.2 40.1 45.6 40.9 43.14I4 P 58.02 49.93 51.03 37.2 43.4 47.8 52.1 59.3 49.2 51.00I5 P 70.67 65.14 54.81 37.2 56.7 48.5 68.0 77.4 57.8 57.77
I6 * P 76.65 84.13 55.27 37.5 71.1 49.0 85.3 95.4 58.1 58.06J1 P 21.45 17.22 20.33 19.7 15.2 8.2 18.2 20.7 19.6 20.37
J2 * P 29.13 26.33 27.78 21.1 23.1 8.7 27.7 30.3 26.4 26.66J3 * P 35.22 41.53 33.57 22.8 33.3 11.7 41.3 35.2 36.7 36.40J4 * P 40.64 41.19 33.44 22.7 33.3 12.1 41.3 34.9 42.6 41.72K2 P 23.71 20.43 21.15 14.9 17.6 18.6 19.0 21.4 22.7 23.95
K3 * P 28.45 29.96 20.60 14.5 23.8 17.5 25.8 29.5 29.3 30.11K4 * P 35.00 32.92 20.45 14.4 35.2 17.1 38.2 29.1 30.1 30.08M1 P 30.37 23.41 23.66 24.9 19.2 26.5 23.1 26.3 26.1 27.80M2 P 40.53 33.98 30.26 30.6 27.6 27.9 33.2 37.7 33.7 35.17M3 P 43.80 44.15 34.87 28.7 35.6 23.5 42.8 48.6 39.4 40.16
M4 * P 49.56 57.97 42.09 28.5 47.0 23.6 56.4 55.3 47.8 47.83M5 * P 55.65 68.83 43.22 29.3 51.8 25.5 64.3 58.4 50.1 50.10M6 * P 60.06 72.22 44.27 30.0 52.8 26.3 65.5 61.2 50.9 50.82N1 P 9.09 6.62 8.63 7.5 5.9 8.5 6.7 7.9 7.9 8.72
N1a P 8.99 6.58 8.65 7.5 5.8 8.2 6.7 7.9 7.9 8.65
* Fragile failure; ** P—Plain section; H—Hollow section.

Materials 2022, 15, 3827 24 of 34R
ef.
Beam **TR,exp TSiNiP18
R,th TACI89R,th TACI19
R,th TMC90R,th TMC10
R,th TEC2R,th TCSA14
R,th TRahalR,th TProp
R,th
(kNm) (kNm) (kNm) (kNm) (kNm) (kNm) (kNm) (kNm) (kNm) (kNm)
N2 P 14.45 11.37 12.97 10.2 10.3 9.3 11.7 13.9 11.8 12.54
N2a P 13.21 11.63 12.54 7.6 5.9 9.1 6.7 8.0 7.9 8.66
N3 P 12.19 9.33 11.53 9.7 8.8 7.6 10.0 11.9 10.4 11.08
N4 * P 15.69 15.04 12.29 9.7 13.5 8.2 15.5 18.3 14.1 14.60
[17] T4 P 138.61 80.95 124.21 126.6 83.8 121.6 111.7 133.4 124.7 128.92
Leon
hard
t,Sc
helli
ng(1
974)
VB2 * P 42.11 24.55 53.57 38.7 34.4 17.3 39.8 50.7 39.6 40.73
VB3 P 46.40 24.55 57.01 47.1 34.4 29.0 39.8 50.7 42.2 44.37
VB4 P 48.54 24.55 59.50 48.1 34.4 35.3 39.8 50.7 43.9 46.77
VM1 P 13.89 8.58 16.66 12.5 9.0 10.2 10.4 13.1 11.2 12.23
VM2 P 39.17 26.14 46.25 35.7 25.5 29.9 29.5 37.6 33.8 36.08
VM3 P 100.80 70.62 113.58 92.8 66.1 76.4 76.5 97.7 88.0 92.02
VQ1 P 21.11 15.99 24.54 25.1 15.8 12.3 21.1 26.4 23.3 24.48
VQ3 P 19.98 9.62 35.85 20.5 15.1 9.0 16.4 21.6 21.7 22.95
VQ9 P 21.90 11.08 44.31 19.9 14.9 10.6 15.6 21.0 24.2 25.64
VS2-VQ2 P 19.53 11.74 29.19 20.1 14.3 10.4 16.6 21.2 20.4 21.74
VS3 P 28.56 16.07 37.12 30.0 21.5 10.8 24.8 31.6 27.2 28.25
VS4-VQ5 * P 34.32 20.53 44.92 32.8 28.7 10.4 33.2 42.3 33.1 33.79
VS9 * P 21.56 16.31 32.69 25.2 18.0 9.1 20.8 26.5 23.6 24.70
VS10-VB1 * P 33.30 25.70 52.94 32.8 36.0 10.4 41.7 53.1 38.8 39.03
VU1 P 23.93 13.75 43.11 26.6 19.0 11.4 22.0 28.0 24.9 26.15
VU2 * P 30.37 16.47 43.11 32.6 23.3 11.2 26.9 34.3 28.7 29.75
VU3 * P 31.04 17.77 35.28 32.4 23.2 9.4 26.9 34.2 28.5 29.36
VU4 P 25.96 16.39 28.02 26.6 19.0 8.4 22.0 28.0 24.7 25.85
McM
ulle
n,R
anga
n(1
978)
A2 P 22.58 17.01 17.62 18.6 13.0 21.6 17.4 19.6 18.1 19.43
A3 P 27.77 24.69 22.16 18.7 18.8 23.6 25.1 27.7 23.4 24.68
A4 * P 34.43 35.16 28.10 18.6 26.3 23.8 35.1 38.8 29.6 30.55
B1r P 12.30 8.08 11.79 8.8 12.3 9.9 10.8 9.3 11.0 12.29
B2 P 20.80 15.05 18.22 16.5 20.8 16.5 17.7 17.4 17.2 18.62
B3 P 25.29 22.23 23.21 15.9 19.8 21.6 22.6 25.2 22.6 23.78
B4 * P 31.72 31.27 23.17 15.9 26.7 21.6 30.5 35.1 28.0 28.00
Ras
mus
sen,
Bake
r(1
995)
B30.1 * P 16.62 29.36 15.11 8.2 21.2 11.1 25.7 19.9 17.0 17.04
B30.2 * P 15.29 26.89 14.46 7.8 19.6 10.3 23.8 18.2 16.6 16.59
B30.3 * P 15.25 25.56 14.09 7.6 19.1 9.8 23.1 17.3 16.4 16.34
B50.1 * P 19.95 43.51 18.39 9.9 28.6 15.3 34.8 29.4 19.2 19.17
B50.2 * P 18.46 40.20 17.68 9.6 27.0 14.3 32.9 27.2 18.7 18.72
B50.3 * P 19.13 43.44 18.37 9.9 28.6 15.2 34.8 29.4 19.2 19.16
B70.1 * P 20.06 49.42 20.57 11.1 31.2 17.9 36.5 36.8 20.5 20.50
B70.2 * P 20.74 49.19 20.51 11.1 31.1 17.9 36.4 36.6 20.5 20.47
B70.3 * P 20.96 49.46 20.42 11.0 31.3 17.8 36.7 36.3 20.4 20.41
B110.1 * P 24.72 48.95 24.51 13.3 31.2 23.1 36.5 44.4 22.8 22.78
B110.2 * P 23.62 50.12 23.97 13.0 31.7 22.3 37.1 45.2 22.5 22.47
* Fragile failure; ** P—Plain section; H—Hollow section.

Materials 2022, 15, 3827 25 of 34R
ef.
Beam **TR,exp TSiNiP18
R,th TACI89R,th TACI19
R,th TMC90R,th TMC10
R,th TEC2R,th TCSA14
R,th TRahalR,th TProp
R,th
(kNm) (kNm) (kNm) (kNm) (kNm) (kNm) (kNm) (kNm) (kNm) (kNm)
B110.3 * P 24.77 50.24 23.98 13.0 31.5 22.3 36.8 44.8 22.5 22.48
Kou
tcho
ukal
i,Be
larb
i(2
001)
B5UR1 P 19.40 16.42 18.14 16.0 14.5 22.4 17.4 18.8 18.1 19.46
B7UR1 P 18.90 16.87 20.50 18.4 15.0 25.7 18.0 19.4 20.0 22.11
B9UR1 P 21.10 16.42 20.12 17.8 14.5 24.8 17.4 18.8 20.0 22.36
B12UR1 P 19.40 16.87 21.28 18.4 15.0 25.7 18.0 19.4 20.8 23.21
B12UR2 P 18.40 17.04 21.41 18.6 15.2 26.0 18.2 19.6 20.8 23.10
B12UR3 P 22.50 19.10 22.29 21.6 17.6 30.1 21.2 22.8 22.9 25.15
B12UR4 P 23.70 19.09 23.28 22.1 19.5 33.3 23.4 25.2 24.7 27.03
B12UR5 P 24.00 25.70 27.89 22.2 22.2 37.7 26.6 29.3 27.5 29.83
B14UR1 P 21.00 16.64 21.43 18.1 14.8 25.2 17.7 19.1 21.0 23.74
Fang
,Shi
au(2
004)
H-06-06 P 92.00 57.90 85.00 76.0 57.8 113.1 70.1 80.1 87.4 95.25
H-06-12 P 115.10 66.14 84.79 96.4 73.3 135.1 88.9 101.6 103.1 110.75
H-07-10 P 126.70 86.66 85.35 99.6 75.8 128.9 91.8 104.9 103.2 109.71
H-07-16 P 144.50 122.53 85.35 113.5 97.8 109.1 118.5 135.5 123.4 129.06
H-12-12 P 155.30 80.31 133.52 121.6 103.7 158.3 125.7 143.6 131.5 138.06
H-12-16 P 196.00 140.15 133.52 121.6 137.0 146.3 166.0 189.7 159.7 164.77
H-14-10 P 135.20 97.96 124.21 113.5 100.3 149.9 121.5 138.9 125.6 131.16
H-20-20 * P 239.00 167.22 180.32 121.6 200.1 158.5 242.5 277.1 166.9 166.74
N-06-06 P 79.70 57.84 72.98 76.1 57.9 80.6 70.2 80.2 77.0 80.17
N-06-12 P 95.20 66.14 72.98 81.8 73.3 70.1 88.9 101.6 90.8 93.16
N-07-10 P 111.70 86.66 75.24 79.4 75.8 68.7 91.8 104.9 92.1 93.90
N-07-16 P 117.30 122.53 75.24 79.4 97.8 58.2 118.5 135.5 110.1 110.46
N-12-12 * P 116.80 80.31 121.26 81.8 103.7 82.1 125.7 143.6 115.8 116.13
N-12-16 * P 138.00 140.15 121.26 81.8 137.0 75.9 166.0 183.3 131.5 131.41
N-14-10 * P 125.00 97.96 114.11 79.4 100.3 79.9 121.5 138.9 112.0 112.26
N-20-20 * P 158.00 167.22 121.26 81.8 155.4 82.2 195.1 183.3 131.5 131.41
Chi
uet
al.(
2007
)
HAS-51-50 P 84.90 40.48 73.94 54.7 37.9 82.9 50.6 57.7 68.6 76.34
NAS-61-35 P 74.70 48.22 56.00 50.2 34.8 75.0 46.3 52.8 60.0 65.34
HAS-90-50 P 104.23 63.51 74.50 73.0 50.6 109.1 67.4 76.9 84.2 92.19
NBS-43-44 P 60.60 34.20 54.67 45.8 34.8 69.1 42.2 48.2 53.8 57.82
HBS-74-17 P 62.20 65.76 52.24 52.7 40.1 78.5 48.6 55.5 65.9 72.85
HBS-82-13 P 56.30 68.29 47.26 47.1 35.8 70.1 43.4 49.6 60.9 67.83
NBS-82-13 P 52.90 68.29 38.02 47.1 35.8 47.5 43.4 49.6 54.9 58.88
HBS-60-61 P 93.70 52.35 76.14 63.7 48.5 94.8 58.8 67.2 75.3 82.25
HCS-52-50 P 73.54 40.26 63.60 44.9 37.4 65.8 41.1 47.3 64.5 72.11
HCS-91-50 P 95.86 59.72 63.93 59.9 49.9 86.1 54.8 63.1 79.2 87.07
Lee
and
Kim
(201
0)
T1-1 P 32.90 23.41 30.99 26.4 19.3 38.6 24.5 27.8 29.6 32.32
T1-2 P 45.90 27.93 40.26 39.9 29.2 50.6 37.1 42.1 39.7 42.27
T1-3 P 54.10 30.94 47.99 41.6 38.5 48.2 49.1 55.6 47.8 49.85
T1-4 P 62.40 54.32 64.60 42.0 56.7 51.1 72.1 81.7 62.8 63.97
T2-2 P 38.10 41.82 30.76 36.8 26.9 42.2 34.2 38.8 37.2 39.67
* Fragile failure; ** P—Plain section; H—Hollow section.

Materials 2022, 15, 3827 26 of 34R
ef.
Beam **TR,exp TSiNiP18
R,th TACI89R,th TACI19
R,th TMC90R,th TMC10
R,th TEC2R,th TCSA14
R,th TRahalR,th TProp
R,th
(kNm) (kNm) (kNm) (kNm) (kNm) (kNm) (kNm) (kNm) (kNm) (kNm)
T2-3 P 50.20 44.88 39.14 42.1 40.1 42.8 51.0 57.7 49.3 51.36
T2-4 P 56.40 62.46 43.55 42.0 47.1 43.4 60.0 68.0 55.2 56.94
Peng
,Won
g(2
011)
SW12-1 P 74.00 66.82 43.22 39.7 48.7 59.0 50.3 57.8 87.3 91.40
SW10-1 P 50.70 54.79 33.97 26.4 39.8 30.7 41.3 47.5 63.9 65.62
SW10-2 P 68.00 58.02 49.70 31.0 52.2 59.0 54.3 64.5 76.3 76.21
SW10-3 P 74.30 62.29 40.61 25.3 66.5 39.8 69.1 51.7 67.6 67.51
SW10-4 * P 80.50 76.05 43.46 24.9 87.1 44.2 91.6 54.5 70.4 70.32
SW8-1 P 40.40 30.61 26.43 21.1 30.8 24.6 32.3 35.3 44.8 46.59
SW8-2 P 60.10 34.63 32.48 19.5 50.2 31.7 52.7 39.8 52.3 52.30
Joh
etal
.(20
19)
RA-SD4-3.2-0.3-3.28 * P 86.80 97.32 58.91 75.6 74.0 60.9 91.1 110.0 86.5 90.30
RA-SD5-3.2-0.3-3.21 * P 88.00 103.65 59.32 75.6 78.2 58.9 96.2 116.2 89.8 93.41
RA-SD6-3.2-0.2-3.21 * P 89.40 126.46 59.32 75.6 87.8 53.7 108.1 130.5 93.5 93.41
RA-SD4-3.2-0.5-2.13 * P 76.30 63.56 60.39 78.1 55.4 80.1 68.1 82.3 72.2 77.41
RA-SD5-3.2-0.7-1.63 * P 74.50 53.42 60.80 70.4 49.9 82.7 61.4 74.2 67.1 72.47
RA-SD6-3.2-0.6-1.63 * P 70.00 61.20 60.80 76.7 54.3 79.0 66.9 80.8 71.2 76.49
RA-SD4-3.2-1.1-1.33 * P 74.20 35.28 60.18 53.0 37.5 78.8 46.2 55.8 54.8 60.21
RA-SD5-3.2-1.0-1.26 * P 67.70 37.83 60.59 55.9 39.6 83.1 48.7 58.9 56.9 62.29
RA-SD6-3.2-0.8-1.26 * P 69.90 54.08 60.59 62.6 44.4 86.2 54.6 66.0 61.6 66.96
Juet
al.
(201
9)
MR30-0.77 P 55.00 39.38 50.92 49.2 37.4 55.3 45.4 51.9 55.0 58.27
MT30-1.32 * P 57.00 80.08 50.92 74.3 56.9 43.7 69.0 78.8 73.8 76.05
MT40-1.32 * P 58.30 80.08 54.73 74.8 56.9 64.7 69.0 78.8 77.6 81.52
MT40-1.89 P 98.40 93.65 106.57 87.1 94.1 89.9 114.1 130.4 110.4 112.27
Ibra
him
etal
.(2
020)
NSC-S1-C30 * P 19.70 24.21 23.08 17.0 20.8 20.9 24.9 27.9 23.1 24.34
NSC-S1-C45 * P 12.50 24.21 18.54 10.2 16.9 21.1 20.3 21.9 22.9 23.99
HSC-C30 * P 19.90 24.21 24.13 20.5 20.8 28.0 24.9 27.9 24.5 26.37
HSC-C45 * P 13.80 24.21 19.75 12.6 16.9 28.7 20.3 21.9 24.5 26.37
Kim
etal
.(2
020)
S08-3-65 P 123.00 71.29 107.84 95.8 82.9 143.1 99.4 100.9 114.5 118.81
S08-4-90 P 124.00 63.67 111.18 102.4 89.6 149.3 107.5 109.0 120.9 124.81
S08-5-122.5 P 89.00 80.78 103.94 95.4 82.5 142.5 99.1 100.5 114.2 118.51
S10-3-52.5 P 126.00 77.60 124.27 102.4 103.7 150.3 124.4 126.2 133.9 136.98
S10-4-72.5 * P 109.00 99.74 128.72 102.4 110.7 149.5 132.8 134.7 140.2 142.79
S10-5-100 * P 108.00 90.17 118.70 102.4 101.6 147.7 121.9 123.7 132.1 135.24
S06-3-90 P 101.00 43.20 88.35 70.4 60.9 105.2 73.1 74.2 92.3 97.71
S10-5-90 * P 106.00 95.94 127.61 102.4 113.0 147.6 135.6 137.6 142.3 144.70
S08-3-72.5 P 106.00 66.73 100.60 86.3 74.7 129.0 89.7 91.0 106.5 111.23
S12-5-72.5 * P 120.00 123.96 149.33 102.4 140.4 147.6 168.5 170.9 165.6 166.13
Hsu
(196
8) D3 H 39.11 66.5 27.11 28.3 26.2 23.6 31.5 35.8 32.1 38.97
D4 * H 47.93 75.27 45.20 29.4 44.9 29.6 53.9 61.2 47.3 47.92
[17,
38] T0 H 185.50 116.4 91.25 112.2 99.9 139.4 133.3 146.6 146.8 161.65
T1 H 140.01 70.87 106.45 110.6 83.8 132.0 111.7 133.4 124.7 128.92
T2 H 143.10 74.0 87.13 99.3 76.2 127.2 101.6 111.8 116.7 128.99
* Fragile failure. ** P—Plain section; H—Hollow section.

Materials 2022, 15, 3827 27 of 34R
ef.
Beam **TR,exp TSiNiP18
R,th TACI89R,th TACI19
R,th TMC90R,th TMC10
R,th TEC2R,th TCSA14
R,th TRahalR,th TProp
R,th
(kNm) (kNm) (kNm) (kNm) (kNm) (kNm) (kNm) (kNm) (kNm) (kNm)
T5 H 156.88 87.7 192.68 135.1 109.3 216.9 124.9 142.3 165.6 185.69
[19] VH1 H 21.79 12.84 21.04 20.1 12.7 14.5 16.9 21.2 19.6 20.82
VH2 * H 34.50 25.6 46.24 32.9 30.2 15.5 41.6 51.2 49.9 32.35
Bern
ardo
,Lop
es(2
009)
A1 H 150.79 108.5 122.50 101.7 67.9 150.9 90.6 107.1 134.7 147.43
A2 H 254.08 145.39 193.85 212.2 144.6 313.0 192.8 223.6 227.8 236.84
A3 H 299.92 185.31 239.37 239.4 192.6 317.6 256.7 298.2 277.2 281.58
A4 H 368.22 269.46 291.30 238.1 266.6 352.9 355.5 398.5 357.8 359.54
A5 * H 412.24 324.19 334.84 238.9 328.7 338.0 438.3 499.1 412.2 408.84
B2 H 273.28 152.10 216.87 223.3 152.7 329.1 203.6 235.3 251.7 266.80
B3 H 355.85 269.46 321.28 312.1 266.6 471.8 355.5 414.1 378.5 388.14
B4 * H 437.85 339.83 374.47 317.1 347.8 480.9 463.7 529.4 457.6 463.09
B5 * H 456.19 413.87 434.23 309.5 434.7 474.4 579.6 641.3 496.1 495.73
C1 H 151.76 109.4 146.65 102.5 67.9 151.5 90.6 108.0 149.2 169.46
C2 H 266.14 145.39 215.62 211.0 144.6 319.0 192.8 222.4 254.5 275.56
C3 H 351.17 263.00 314.00 326.1 257.6 508.0 343.5 407.3 379.2 393.43
C4 * H 450.31 324.19 374.22 330.7 328.7 506.0 438.3 524.1 449.6 460.21
C5 * H 467.26 407.83 436.52 338.1 398.9 532.7 531.9 629.1 519.5 526.94
C6 * H 521.33 487.91 464.52 309.2 521.6 494.1 695.5 798.7 516.7 516.31
Chi
uet
al.
(200
7)
HAH-81-35 H 94.31 68.82 52.95 64.6 44.8 96.7 59.7 68.1 77.4 85.31
NCH-62-33 H 64.14 39.94 45.64 40.0 33.3 57.7 36.6 42.1 55.2 60.60
HCH-91-42 H 87.51 56.61 58.00 55.0 45.8 79.4 50.3 58.0 74.6 82.64
Jeng
(201
4)
A095c H 209.98 184.5 142.52 108.4 79.9 137.5 96.8 114.3 134.4 168.97
A120a H 215.25 189.8 96.76 101.6 65.4 112.1 79.3 107.0 124.7 184.33
B065b H 278.00 252.2 128.27 187.4 174.4 151.5 211.9 250.3 237.8 286.31
B080a H 300.66 275.2 243.23 250.9 198.2 309.1 239.8 283.5 267.9 273.75
B110a H 237.48 212.0 127.34 117.3 83.7 143.6 101.6 123.6 149.4 208.45
C100a H 370.15 344.7 308.37 291.2 214.7 393.6 259.4 306.8 315.3 333.10
D075a H 339.48 314.0 251.86 272.3 201.1 418.3 242.2 287.0 305.0 324.75
D090a H 343.08 317.6 298.37 292.0 214.9 424.1 260.1 307.6 324.0 345.40
Kim
etal
.(20
20)
H08-3-65 H 128.00 79.94 112.05 104.0 91.2 146.4 109.5 111.1 123.1 127.15
H08-4-90 H 130.00 74.29 106.20 96.4 83.4 146.8 100.1 101.6 115.6 120.10
H08-5-100 H 117.00 76.27 111.77 104.0 90.7 146.5 108.9 110.5 122.6 126.70
H10-3-52.5 H 143.00 92.53 129.59 104.0 112.4 146.7 134.8 136.8 142.4 145.15
H10-4-72.5 H 127.00 94.04 122.35 104.0 103.7 146.6 124.4 126.2 134.6 137.91
H10-5-80 H 125.00 93.70 129.86 104.0 111.7 147.2 134.0 136.0 141.8 144.59
H06-3-90 H 102.00 47.39 91.44 76.5 66.2 122.2 79.5 80.6 98.3 103.69
H10-5-135 H 95.00 70.56 92.83 78.9 68.2 126.0 81.9 83.1 100.4 105.70
H08-3-72.5 H 114.00 75.47 104.53 95.6 82.7 145.9 99.3 100.7 114.9 119.46
H12-5-72.5 H 129.00 93.25 139.33 104.0 108.4 152.7 130.1 132.0 138.9 141.88
* Fragile failure. ** P—Plain section; H—Hollow section.

Materials 2022, 15, 3827 28 of 34
Table A4. Ratios of experimental to theoretical torsional strengths.
Ref
.
Beam ** TR,exp
TSiNiP18R,th
TR,exp
TACI89R,th
TR,exp
TACI19R,th
TR,exp
TMC90R,th
TR,exp
TMC10R,th
TR,exp
TEC2R,th
TR,exp
TCSA14R,th
TR,exp
TRahalR,th
TR,exp
TPropR,th
Hsu
(196
8)
B1 P 1.33 0.99 1.17 1.09 1.76 0.90 1.11 1.05 0.97
B3 P 1.00 1.01 1.28 1.17 1.39 0.98 0.86 1.02 0.99
B4 P 0.94 1.07 1.58 1.09 1.62 0.90 0.80 1.03 1.02
B5 P 0.83 1.24 1.83 0.98 1.80 0.80 0.88 1.09 1.09
B6 P 0.87 1.41 2.07 1.12 2.13 0.90 1.03 1.22 1.22
B7 P 1.16 0.73 0.98 1.26 1.06 1.05 0.93 0.98 0.94
B8 P 0.99 0.77 1.13 1.02 1.33 0.85 0.75 0.89 0.87
B9 P 1.00 1.31 1.04 1.35 1.29 1.12 0.99 1.04 0.99
B10 P 0.56 1.54 1.20 1.01 2.24 0.84 0.74 0.90 0.88
C2 P 1.00 1.00 1.04 1.00 1.46 0.68 0.90 0.97 0.91
C4 P 0.75 0.99 1.71 1.05 1.67 0.79 0.87 0.93 0.92
C5 P 0.67 1.04 2.00 1.10 1.93 0.80 1.02 1.07 1.08
C6 P 0.76 1.20 2.29 1.24 2.15 0.90 1.16 1.23 1.23
G2 P 1.39 1.01 1.22 1.00 1.12 1.16 1.15 1.10 1.03
G3 P 1.18 1.01 1.13 1.33 1.38 1.15 0.99 1.07 1.03
G4 P 1.17 1.12 1.44 1.32 1.64 0.58 0.98 1.14 1.12
G5 P 0.96 1.27 1.64 1.08 1.92 0.95 0.84 1.04 1.04
G6 P 1.47 0.99 1.19 1.52 0.99 1.33 1.13 1.08 1.01
G7 P 1.33 1.01 1.12 1.38 1.22 1.21 1.03 1.09 1.05
G8 P 1.28 1.27 1.63 1.35 1.88 1.18 1.00 1.21 1.19
I2 P 1.34 1.09 1.18 1.20 0.96 1.15 1.12 1.13 1.04
I3 P 1.17 1.12 1.23 1.36 0.99 1.14 1.00 1.12 1.06
I4 P 1.16 1.14 1.56 1.34 1.21 1.11 0.98 1.18 1.14
I5 P 1.08 1.29 1.90 1.25 1.46 1.04 0.91 1.22 1.22
I6 P 0.91 1.39 2.04 1.08 1.57 0.90 0.80 1.32 1.32
J1 P 1.25 1.06 1.09 1.41 2.62 1.18 1.04 1.09 1.05
J2 P 1.11 1.05 1.38 1.26 3.36 1.05 0.96 1.11 1.09
J3 P 0.85 1.05 1.55 1.06 3.01 0.85 1.00 0.96 0.97
J4 P 0.99 1.22 1.79 1.22 3.36 0.98 1.16 0.95 0.97
K2 P 1.16 1.12 1.59 1.35 1.27 1.25 1.11 1.04 0.99
K3 P 0.95 1.38 1.96 1.20 1.63 1.10 0.97 0.97 0.94
K4 P 1.06 1.71 2.42 0.99 2.05 0.92 1.20 1.16 1.16
M1 P 1.30 1.28 1.22 1.58 1.14 1.31 1.16 1.17 1.09
M2 P 1.19 1.34 1.32 1.47 1.45 1.22 1.07 1.20 1.15
M3 P 0.99 1.26 1.53 1.23 1.86 1.02 0.90 1.11 1.09
M4 P 0.85 1.18 1.74 1.05 2.10 0.88 0.90 1.04 1.04
M5 P 0.81 1.29 1.90 1.07 2.19 0.87 0.95 1.11 1.11
M6 P 0.83 1.36 2.00 1.14 2.28 0.92 0.98 1.18 1.18
N1 P 1.37 1.05 1.20 1.55 1.07 1.36 1.14 1.15 1.04
N1a P 1.37 1.04 1.20 1.54 1.10 1.35 1.13 1.14 1.04
N2 P 1.27 1.11 1.41 1.41 1.56 1.23 1.04 1.23 1.15
** P—Plain section; H—Hollow section.

Materials 2022, 15, 3827 29 of 34R
ef.
Beam ** TR,exp
TSiNiP18R,th
TR,exp
TACI89R,th
TR,exp
TACI19R,th
TR,exp
TMC90R,th
TR,exp
TMC10R,th
TR,exp
TEC2R,th
TR,exp
TCSA14R,th
TR,exp
TRahalR,th
TR,exp
TPropR,th
N2a P 1.14 1.05 1.75 2.25 1.45 1.97 1.66 1.67 1.52
N3 P 1.31 1.06 1.26 1.39 1.60 1.22 1.03 1.17 1.10
N4 P 1.04 1.28 1.62 1.16 1.91 1.02 0.86 1.12 1.07
[17] T4 P 1.71 1.12 1.10 1.65 1.14 1.24 1.04 1.11 1.08
Leon
hard
t,Sc
helli
ng(1
974)
VB2 P 1.72 0.79 1.09 1.23 2.43 1.06 0.83 1.06 1.03
VB3 P 1.89 0.81 0.98 1.35 1.60 1.17 0.92 1.10 1.05
VB4 P 1.98 0.82 1.01 1.41 1.38 1.22 0.96 1.11 1.04
VM1 P 1.62 0.83 1.11 1.55 1.36 1.34 1.06 1.24 1.14
VM2 P 1.50 0.85 1.10 1.54 1.31 1.33 1.04 1.16 1.09
VM3 P 1.43 0.89 1.09 1.53 1.32 1.32 1.03 1.14 1.10
VQ1 P 1.32 0.86 0.84 1.34 1.72 1.00 0.80 0.91 0.86
VQ3 P 2.08 0.56 0.98 1.32 2.23 1.21 0.93 0.92 0.87
VQ9 P 1.98 0.49 1.10 1.47 2.07 1.41 1.04 0.90 0.85
VS2-VQ2 P 1.66 0.67 0.97 1.36 1.88 1.18 0.92 0.96 0.90
VS3 P 1.78 0.77 0.95 1.33 2.64 1.15 0.90 1.05 1.01
VS4-VQ5 P 1.67 0.76 1.04 1.20 3.31 1.03 0.81 1.04 1.02
VS9 P 1.32 0.66 0.86 1.20 2.38 1.04 0.81 0.91 0.87
VS10-VB1 P 1.30 0.63 1.01 0.93 3.21 0.80 0.63 0.86 0.85
VU1 P 1.74 0.56 0.90 1.26 2.09 1.09 0.85 0.96 0.92
VU2 P 1.84 0.70 0.93 1.31 2.70 1.13 0.88 1.06 1.02
VU3 P 1.75 0.88 0.96 1.34 3.32 1.16 0.91 1.09 1.06
VU4 P 1.58 0.93 0.98 1.37 3.08 1.18 0.93 1.05 1.00
McM
ulle
n,R
anga
n(1
978)
A2 P 1.33 1.28 1.21 1.73 1.05 1.30 1.15 1.25 1.16
A3 P 1.12 1.25 1.49 1.48 1.17 1.11 1.00 1.19 1.13
A4 P 0.98 1.23 1.85 1.31 1.45 0.98 0.89 1.16 1.13
B1r P 1.52 1.04 1.39 1.00 1.24 1.24 1.32 1.12 1.00
B2 P 1.38 1.14 1.26 1.00 1.26 1.26 1.20 1.21 1.12
B3 P 1.14 1.09 1.59 1.28 1.17 1.12 1.00 1.12 1.06
B4 P 1.01 1.37 2.00 1.19 1.47 1.04 0.90 1.13 1.13
Ras
mus
sen,
Bake
r(1
995)
B30.1 P 0.57 1.10 2.03 0.78 1.49 0.65 0.84 0.97 0.98
B30.2 P 0.57 1.06 1.96 0.78 1.49 0.64 0.84 0.92 0.92
B30.3 P 0.60 1.08 2.00 0.80 1.55 0.66 0.88 0.93 0.93
B50.1 P 0.46 1.08 2.01 0.70 1.31 0.57 0.68 1.04 1.04
B50.2 P 0.46 1.04 1.93 0.68 1.29 0.56 0.68 0.99 0.99
B50.3 P 0.44 1.04 1.92 0.67 1.26 0.55 0.65 1.00 1.00
B70.1 P 0.41 0.98 1.80 0.64 1.12 0.55 0.55 0.98 0.98
B70.2 P 0.42 1.01 1.87 0.67 1.16 0.57 0.57 1.01 1.01
B70.3 P 0.42 1.03 1.90 0.67 1.18 0.57 0.58 1.03 1.03
B110.1 P 0.50 1.01 1.86 0.79 1.07 0.68 0.56 1.08 1.09
B110.2 P 0.47 0.99 1.82 0.75 1.06 0.64 0.52 1.05 1.05
B110.3 P 0.49 1.03 1.91 0.79 1.11 0.67 0.55 1.10 1.10
B5UR1 P 1.18 1.07 1.21 1.34 0.87 1.11 1.03 1.07 1.00
** P—Plain section; H—Hollow section.

Materials 2022, 15, 3827 30 of 34R
ef.
Beam ** TR,exp
TSiNiP18R,th
TR,exp
TACI89R,th
TR,exp
TACI19R,th
TR,exp
TMC90R,th
TR,exp
TMC10R,th
TR,exp
TEC2R,th
TR,exp
TCSA14R,th
TR,exp
TRahalR,th
TR,exp
TPropR,th
Kou
tcho
ukal
i,Be
larb
i(2
001)
B7UR1 P 1.12 0.92 1.03 1.26 0.74 1.05 0.97 0.94 0.85
B9UR1 P 1.29 1.05 1.19 1.45 0.85 1.21 1.12 1.05 0.94
B12UR1 P 1.15 0.91 1.05 1.29 0.76 1.08 1.00 0.93 0.84
B12UR2 P 1.08 0.86 0.99 1.21 0.71 1.01 0.94 0.89 0.80
B12UR3 P 1.18 1.01 1.04 1.28 0.75 1.06 0.99 0.98 0.89
B12UR4 P 1.24 1.02 1.07 1.22 0.71 1.01 0.94 0.96 0.88
B12UR5 P 0.93 0.86 1.08 1.08 0.64 0.90 0.82 0.87 0.80
B14UR1 P 1.26 0.98 1.16 1.42 0.83 1.18 1.10 1.00 0.88
Fang
,Shi
au(2
004)
H-06-06 P 1.59 1.08 1.21 1.59 0.81 1.31 1.15 1.05 0.97
H-06-12 P 1.74 1.36 1.19 1.57 0.85 1.29 1.13 1.12 1.04
H-07-10 P 1.46 1.48 1.27 1.67 0.98 1.38 1.21 1.23 1.15
H-07-16 P 1.18 1.69 1.27 1.48 1.32 1.22 1.07 1.17 1.12
H-12-12 P 1.93 1.16 1.28 1.50 0.98 1.24 1.08 1.18 1.12
H-12-16 P 1.40 1.47 1.61 1.43 1.34 1.18 1.03 1.23 1.19
H-14-10 P 1.38 1.09 1.19 1.35 0.90 1.11 0.97 1.08 1.03
H-20-20 P 1.43 1.33 1.97 1.19 1.51 0.99 0.86 1.43 1.43
N-06-06 P 1.38 1.09 1.05 1.38 0.99 1.14 0.99 1.03 0.99
N-06-12 P 1.44 1.30 1.16 1.30 1.36 1.07 0.94 1.05 1.02
N-07-10 P 1.29 1.48 1.41 1.47 1.63 1.22 1.06 1.21 1.19
N-07-16 P 0.96 1.56 1.48 1.20 2.02 0.99 0.87 1.07 1.06
N-12-12 P 1.45 0.96 1.43 1.13 1.42 0.93 0.81 1.01 1.01
N-12-16 P 0.98 1.14 1.69 1.01 1.82 0.83 0.75 1.05 1.05
N-14-10 P 1.28 1.10 1.57 1.25 1.56 1.03 0.90 1.12 1.11
N-20-20 P 0.94 1.30 1.93 1.02 1.92 0.81 0.86 1.20 1.20
Chi
uet
al.
(200
7)
HAS-51-50 P 2.10 1.15 1.55 2.24 1.02 1.68 1.47 1.24 1.11
NAS-61-35 P 1.55 1.33 1.49 2.15 1.00 1.61 1.41 1.25 1.14
HAS-90-50 P 1.64 1.40 1.43 2.06 0.96 1.55 1.36 1.24 1.13
NBS-43-44 P 1.77 1.11 1.32 1.74 0.88 1.44 1.26 1.13 1.05
HBS-74-17 P 0.95 1.19 1.18 1.55 0.79 1.28 1.12 0.94 0.85
HBS-82-13 P 0.82 1.19 1.20 1.57 0.80 1.30 1.14 0.92 0.83
NBS-82-13 P 0.77 1.39 1.12 1.48 1.11 1.22 1.07 0.96 0.90
HBS-60-61 P 1.79 1.23 1.47 1.93 0.99 1.59 1.40 1.24 1.14
HCS-52-50 P 1.83 1.16 1.64 1.97 1.12 1.79 1.55 1.14 1.02
HCS-91-50 P 1.61 1.50 1.60 1.92 1.11 1.75 1.52 1.21 1.10
Lee
and
Kim
(201
0)
T1-1 P 1.41 1.06 1.25 1.71 0.85 1.34 1.18 1.11 1.02
T1-2 P 1.64 1.14 1.15 1.57 0.91 1.24 1.09 1.16 1.09
T1-3 P 1.75 1.13 1.30 1.40 1.12 1.10 0.97 1.13 1.09
T1-4 P 1.15 0.97 1.49 1.10 1.22 0.87 0.76 0.99 0.98
T2-2 P 0.91 1.24 1.04 1.42 0.90 1.11 0.98 1.03 0.96
T2-3 P 1.12 1.28 1.19 1.25 1.17 0.98 0.87 1.02 0.98
T2-4 P 0.90 1.30 1.34 1.20 1.30 0.94 0.83 1.02 0.99
SW12-1 P 1.11 1.71 1.86 1.52 1.25 1.47 1.28 0.85 0.81
** P—Plain section; H—Hollow section.

Materials 2022, 15, 3827 31 of 34R
ef.
Beam **TR,exp
TSiNiP18R,th
TR,expTACI89
R,th
TR,expTACI19
R,th
TR,expTMC90
R,th
TR,expTMC10
R,th
TR,expTEC2
R,th
TR,expTCSA14
R,th
TR,expTRahal
R,th
TR,exp
TPropR,th
Peng
,Won
g(2
011) SW10-1 P 0.93 1.49 1.92 1.28 1.65 1.23 1.07 0.79 0.77
SW10-2 P 1.17 1.37 2.19 1.30 1.15 1.25 1.05 0.89 0.89
SW10-3 P 1.19 1.83 2.93 1.12 1.86 1.08 1.44 1.10 1.10
SW10-4 P 1.06 1.85 3.23 0.92 1.82 0.88 1.48 1.14 1.14
SW8-1 P 1.32 1.53 1.91 1.31 1.64 1.25 1.15 0.90 0.87
SW8-2 P 1.74 1.85 3.08 1.20 1.90 1.14 1.51 1.15 1.15
Joh
etal
.(20
19)
RA-SD4-3.2-0.3-3.28 P 0.89 1.47 1.15 1.17 1.42 0.95 0.79 1.00 0.96
RA-SD5-3.2-0.3-3.21 P 0.85 1.48 1.16 1.13 1.49 0.91 0.76 0.98 0.94
RA-SD6-3.2-0.2-3.21 P 0.71 1.51 1.18 1.02 1.66 0.83 0.68 0.96 0.96
RA-SD4-3.2-0.5-2.13 P 1.20 1.26 0.98 1.38 0.95 1.12 0.93 1.06 0.99
RA-SD5-3.2-0.7-1.63 P 1.39 1.23 1.06 1.49 0.90 1.21 1.00 1.11 1.03
RA-SD6-3.2-0.6-1.63 P 1.14 1.15 0.91 1.29 0.89 1.05 0.87 0.98 0.92
RA-SD4-3.2-1.1-1.33 P 2.10 1.23 1.40 1.98 0.94 1.61 1.33 1.35 1.23
RA-SD5-3.2-1.0-1.26 P 1.79 1.12 1.21 1.71 0.81 1.39 1.15 1.19 1.09
RA-SD6-3.2-0.8-1.26 P 1.29 1.15 1.12 1.58 0.81 1.28 1.06 1.13 1.04
Juet
al.
(201
9)
MR30-0.77 P 1.40 1.08 1.12 1.47 0.99 1.21 1.06 1.00 0.94
MT30-1.32 P 0.71 1.12 0.77 1.00 1.30 0.83 0.72 0.77 0.75
MT40-1.32 P 0.73 1.07 0.78 1.02 0.90 0.85 0.74 0.75 0.72
MT40-1.89 P 1.05 0.92 1.13 1.05 1.09 0.86 0.75 0.89 0.88
Ibra
him
etal
.(2
020)
NSC-S1-C30 P 0.81 0.85 1.16 0.95 0.94 0.79 0.71 0.85 0.81
NSC-S1-C45 P 0.52 0.67 1.23 0.74 0.59 0.62 0.57 0.55 0.52
HSC-C30 P 0.82 0.82 0.97 0.96 0.71 0.80 0.71 0.81 0.75
HSC-C45 P 0.57 0.70 1.09 0.82 0.48 0.68 0.63 0.56 0.52
Kim
etal
.(20
20)
S08-3-65 P 1.73 1.14 1.28 1.48 0.86 1.24 1.22 1.07 1.04
S08-4-90 P 1.95 1.12 1.21 1.38 0.83 1.15 1.14 1.03 0.99
S08-5-122.5 P 1.10 0.86 0.93 1.08 0.62 0.90 0.89 0.78 0.75
S10-3-52.5 P 1.62 1.01 1.23 1.22 0.84 1.01 1.00 0.94 0.92
S10-4-72.5 P 1.09 0.85 1.06 0.98 0.73 0.82 0.81 0.78 0.76
S10-5-100 P 1.20 0.91 1.05 1.06 0.73 0.89 0.87 0.82 0.80
S06-3-90 P 2.34 1.14 1.43 1.66 0.96 1.38 1.36 1.09 1.03
S10-5-90 P 1.10 0.83 1.03 0.94 0.72 0.78 0.77 0.75 0.73
S08-3-72.5 P 1.59 1.05 1.23 1.42 0.82 1.18 1.17 1.00 0.95
S12-5-72.5 P 0.97 0.80 1.17 0.85 0.81 0.71 0.70 0.72 0.72
Hsu
(196
8) D3 H 0.59 1.44 1.38 1.49 1.65 1.24 1.09 1.22 1.00
D4 H 0.64 1.06 1.63 1.07 1.62 0.89 0.78 1.01 1.00
[17,
38]
T0 H 1.59 2.03 1.65 1.86 1.33 1.39 1.27 1.26 1.15
T1 H 1.98 1.32 1.27 1.67 1.06 1.25 1.05 1.12 1.09
T2 H 1.93 1.64 1.44 1.88 1.12 1.41 1.28 1.23 1.11
T5 H 1.79 0.81 1.16 1.44 0.72 1.26 1.10 0.95 0.84
[19] VH1 H 1.70 1.04 1.08 1.72 1.50 1.29 1.03 1.11 1.05
VH2 H 1.35 0.75 1.05 1.14 2.22 0.83 0.67 0.69 1.07
A1 H 1.39 1.23 1.48 2.22 1.00 1.66 1.41 1.12 1.02
** P—Plain section; H—Hollow section.

Materials 2022, 15, 3827 32 of 34R
ef.
Beam **TR,exp
TSiNiP18R,th
TR,expTACI89
R,th
TR,expTACI19
R,th
TR,expTMC90
R,th
TR,expTMC10
R,th
TR,expTEC2
R,th
TR,expTCSA14
R,th
TR,expTRahal
R,th
TR,exp
TPropR,th
Bern
ardo
,Lop
es(2
009)
A2 H 1.75 1.31 1.20 1.76 0.81 1.32 1.14 1.12 1.07
A3 H 1.62 1.25 1.25 1.56 0.94 1.17 1.01 1.08 1.07
A4 H 1.37 1.26 1.55 1.38 1.04 1.04 0.92 1.03 1.02
A5 H 1.27 1.23 1.73 1.25 1.22 0.94 0.83 1.00 1.01
B2 H 1.80 1.26 1.22 1.79 0.83 1.34 1.16 1.09 1.02
B3 H 1.32 1.11 1.14 1.33 0.75 1.00 0.86 0.94 0.92
B4 H 1.29 1.17 1.38 1.26 0.91 0.94 0.83 0.96 0.95
B5 H 1.10 1.05 1.47 1.05 0.96 0.79 0.71 0.92 0.92
C1 H 1.39 1.03 1.48 2.23 1.00 1.68 1.40 1.02 0.90
C2 H 1.83 1.23 1.26 1.84 0.83 1.38 1.20 1.05 0.97
C3 H 1.34 1.12 1.08 1.36 0.69 1.02 0.86 0.93 0.89
C4 H 1.39 1.20 1.36 1.37 0.89 1.03 0.86 1.00 0.98
C5 H 1.15 1.07 1.38 1.17 0.88 0.88 0.74 0.90 0.89
C6 H 1.07 1.12 1.69 1.00 1.06 0.75 0.65 1.01 1.01
Chi
uet
al.
(200
7)
HAH-81-35 H 1.37 1.78 1.46 2.11 0.97 1.58 1.39 1.22 1.11
NCH-62-33 H 1.61 1.41 1.60 1.93 1.11 1.75 1.52 1.16 1.06
HCH-91-42 H 1.55 1.51 1.59 1.91 1.10 1.74 1.51 1.17 1.06
Jeng
(201
4)
A095c H 1.13 1.47 1.94 2.63 1.53 2.17 1.84 1.56 1.24
A120a H 1.08 2.22 2.12 3.29 1.92 2.72 2.01 1.73 1.17
B065b H 1.06 2.17 1.48 1.59 1.83 1.31 1.11 1.17 0.97
B080a H 1.06 1.24 1.20 1.52 0.97 1.25 1.06 1.12 1.10
B110a H 1.12 1.86 2.02 2.84 1.65 2.34 1.92 1.59 1.14
C100a H 1.06 1.20 1.27 1.72 0.94 1.43 1.21 1.17 1.11
D075a H 1.06 1.35 1.25 1.69 0.81 1.40 1.18 1.11 1.05
D090a H 1.05 1.15 1.18 1.60 0.81 1.32 1.12 1.06 0.99
Kim
etal
.(20
20)
H08-3-65 H 1.60 1.14 1.23 1.40 0.87 1.17 1.15 1.04 1.01
H08-4-90 H 1.75 1.22 1.35 1.56 0.89 1.30 1.28 1.12 1.08
H08-5-100 H 1.53 1.05 1.12 1.29 0.80 1.07 1.06 0.95 0.92
H10-3-52.5 H 1.55 1.10 1.37 1.27 0.97 1.06 1.05 1.00 0.99
H10-4-72.5 H 1.35 1.04 1.22 1.22 0.87 1.02 1.01 0.94 0.92
H10-5-80 H 1.33 0.96 1.20 1.12 0.85 0.93 0.92 0.88 0.86
H06-3-90 H 2.15 1.12 1.33 1.54 0.83 1.28 1.27 1.04 0.98
H10-5-135 H 1.35 1.02 1.20 1.39 0.75 1.16 1.14 0.95 0.90
H08-3-72.5 H 1.51 1.09 1.19 1.38 0.78 1.15 1.13 0.99 0.95
H12-5-72.5 H 1.38 0.93 1.24 1.19 0.84 0.99 0.98 0.93 0.91
** P—Plain section; H—Hollow section.
References1. SP 63.13330.2018; Concrete and Reinforced Cocrete Structures. Ministry of Regional Development of the Russian Federation:
Moscow, Russia, 2018.2. ACI Committe 318. Building Code Requirements for Structural Concrete (ACI 318-89) and Commentary (ACI 318R-89); American
Concrete Institute: Detroi, MI, USA, 1989.3. ACI Committe 318. Building Code Requirements for Structural Concrete (ACI 318-19) and Commentary (ACI 318R-19); American
Concrete Institute: Detroi, MI, USA, 2019.4. CEB-FIP MC 90; Design of Concrete Structures. CEB-FIP Model Code 1990. Thomas Telford: London, UK, 1993.5. CEB-FIP Model Code 2010. Comité Euro-International du Béton Secretariat Permanent. Case Postale 88, CH-1015 Lausanne,
Switzerland, 2013.6. EN 1992-1-1; Eurocode 2: Design of Concrete Structures—Part 1-1: General Rules and Rules for Buildings. European Committee
for Standardization: Brussels, Belgium, 2005; 225p.7. CSA Committee A23.3-14; Design of Concrete Strutures (CAN/CSA-A23.3-14). Canadian Standards Association: Toronto, ON,
Canada, 2014.8. Rahal, K.N. Torsional strength of normal and high strength reinforced concrete beams. Eng. Struct. 2013, 56, 2206–2216. [CrossRef]9. Teixeira, M.M.; Bernardo, L.F.A. Torsional strength of reinforced concrete beams—Evaluation of some codes of practice. Concrete
structures: New trends for eco-efficiency and performance. In Proceedings of the Fib Symposium 2021, Lisbon, Portugal, 14–16June 2021; pp. 2035–2046.

Materials 2022, 15, 3827 33 of 34
10. Hsu, T.T.C. Torsion of Structural Concrete—Behavior of Reinforced Concrete Rectangular Members; Torsion of Structural Concrete,SP-18; American Concrete Institute: Detroit, MI, USA, 1968; Volume 18, pp. 261–306.
11. McMullen, A.E.; Warwaruk, J. Concrete beams in bending, torsion and shear. J. Struct. Div. 1970, 96, 885–903. [CrossRef]12. McMullen, A.E.; Rangan, B.V. Pure Torsion in Rectangular Sections—A Re-examination. ACI J. Proc. 1978, 75, 511–519.13. Elfgren, L.; Karlsson, I.; Losberg, A. Torsion-bending-shear interaction for concrete beams. J. Struct. Div. 1974, 100, 1657–1676.
[CrossRef]14. Rausch, E. Berechnung des Eisenbetons Gegen Verdrehung (Design of Reinforcerd Concrete in Torsion). Ph.D. Thesis, Technische
Hoechschule, Berlin, Germany, 1929; 53p. (In German)15. Bredt, R. Kritische Bemerkungen zur Drehungselastizitat (Critical remarks on torsional elasticity). Z. Ver. Dtsch. Ing. 1896, 40,
785–790. (In German)16. Cowan, H.J. Elastic Theory for Torsional Strength of Rectangular Reinforced Concrete Beams. Mag. Concr. Res. 1950, 2, 3–8.
[CrossRef]17. Lampert, P.; Thurlimann, B. Torsionsversuche an Stahlbetonbalken (Torsion Tests of Reinforced Concrete Beams); Bericht, Nr. 6506-2;
Institut fur Baustatik, ETH, Zurich: Graz, Austria, 1969; 101p. (In German)18. Mitchell, D.; Collins, M.P. Diagonal Compression Field Theory—A Rational Model for Structural Concrete in Pure Torsion. ACI
Struct. J. 1974, 71, 396–408.19. Leonhardt, F.; Schelling, G. Torsionsversuche an Stahl Betonbalken; Bulletin, No. 239; Deutscher Ausschuss fur Stahlbeton: Berlin,
Germany, 1974; 122p. (In German)20. Hsu, T.T.C.; Mo, Y.L. Softening of Concrete in Torsional Members—Theory and Tests. J. Am. Concr. Inst. 1985, 82, 290–303.21. Jeng, C.-H.; Hsu, T.T.C. A Softened Membrane Model for Torsion in Reinforced Concrete Members. Eng. Struct. 2009, 31,
1944–1954. [CrossRef]22. Bernardo, L.F.A.; Andrade, J.M.A. A Unified Softened Truss Model for RC and PC Concrete Beams under Torsion. J. Build. Eng.
2020, 32, 101467. [CrossRef]23. Rahal, K.N.; Collins, M.P. Simple model for predicting torsional strength of reinforced and prestressed concrete sections. J. Am.
Concr. Inst. 1996, 93, 658–666.24. Bhatti, M.A.; Almughrabi, A. Refined model to estimate torsional strength of reinforced concrete beams. J. Am. Concr. Inst. 1996,
93, 614–622.25. Wang, W.; Hsu, T.T.C. Limit analysis of reinforced concrete beams subjected to pure torsion. J. Struct. Eng. 1997, 123, 86–94.
[CrossRef]26. Bernardo, L.F.A.; Taborda, C.S.B.; Andrade, J.M.A. Generalized Softened Variable Angle Truss Model for PC Beams under Torsion.
Int. J. Concr. Struct. Mater. 2018, 12, 62. [CrossRef]27. Silva, J.R.B.; Horowitz, B.; Bernardo, L.F.A. Efficient procedure to analyze RC beam sections using the softened truss model. ACI
Struct. J. 2017, 114, 765–774.28. Greene, G.G.; Belarbi, A. Model for RC members under torsion, bending, and shear. I: Theory. J. Eng. Mech. 2009, 135, 961–969.
[CrossRef]29. Rahal, K.N.; Collins, M.P. Combined torsion and bending in reinforced and prestressed concrete beams. ACI Struct. J. 2003, 100,
157–165.30. Bernardo, L.; Taborda, C. Softened Truss Model for Reinforced Concrete Beams under Torsion Combined with Axial Force. Appl.
Mech. 2020, 1, 79–96. [CrossRef]31. Alnauimi, A.S.; Bhatt, P. Direct design of hollow reinforced concrete beams. Part I: Design procedure. Struct. Concr. 2004, 5,
139–146. [CrossRef]32. Bairan Garcia, J.M.; Mari Bernat, A.R. Shear-bending-torsion interaction in structural concrete members: A nonlinear coupled
sectional approach. Arch. Comput. Methods Eng. 2007, 14, 249–278. [CrossRef]33. Karayannis, C.G. Smeared crack analysis for plain concrete in torsion. J. Struct. Eng. 2000, 126, 638–645. [CrossRef]34. Karayannis, C.G.; Chalioris, C.E. Experimental validation of smeared analysis for plain concrete in torsion. J. Struct. Eng. 2000,
126, 646–653. [CrossRef]35. Deifalla, A.; Salem, N.M. A Machine Learning Model for Torsion Strength of Externally Bonded FRP-Reinforced Concrete Beams.
Polymers 2022, 14, 1824. [CrossRef]36. Lyu, Z.; Yu, Y.; Samali, B.; Rashidi, M.; Mohammadi, M.; Nguyen, T.N.; Nguyen, A. Cross-Validation for Prediction of Torsional
Strength of Reinforced Concrete Beam. Materials 2022, 15, 1477. [CrossRef]37. Peng, X.-N.; Wong, Y.-L. Behaviour of reinforced concrete walls subjected to monotonic pure torsion-An experimental study. Eng.
Struct. 2011, 33, 2495–2508. [CrossRef]38. Lampert, P.; Thürlimann, B. Essais de Poutre en Béton Armé sous Torsion Simple et Flexion Combinées (Torsionsversuche und
Torsions-Biege-Versuche an Stahlbetonbalken). Com. Eur. Béton BI 1969, 71, 177–207. (In German)39. Rasmussen, L.J.; Baker, G. Torsion in reinforced normal and high-strength concrete beams—Part 1: Experimental test series. ACI
Struct. J. 1995, 92, 56–62.40. Koutchoukali, N.-E.; Belarbi, A. Torsion of high-strength reinforced concrete beams and minimum reinforcement requirement.
ACI Struct. J. 2001, 98, 462–469.41. Fang, I.-K.; Shiau, J.-K. Torsional behavior of normal- and high-strength concrete beams. ACI Struct. J. 2004, 101, 304–313.

Materials 2022, 15, 3827 34 of 34
42. Chiu, H.-J.; Fang, I.-K.; Young, W.-T.; Shiau, J.-K. Behavior of reinforced concrete beams with minimum torsional reinforcement.Eng. Struct. 2007, 29, 2193–2205. [CrossRef]
43. Lee, J.-Y.; Kim, S.-W. Torsional strength of RC beams considering tension stiffening effect. J. Struct. Eng. 2010, 136, 1367–1378.[CrossRef]
44. Joh, C.; Kwahk, I.; Lee, J.; Yang, I.-H.; Kim, B.-S. Torsional behavior of high-strngth concrete beams with minimum reinforcementeratio. Adv. Civ. Eng. 2019, 2019, 1432697.
45. Ju, H.; Han, S.-J.; Zhang, D.; Kim, J.; Wu, W.; Kim, K.S. Estimation of minimum torsional reinforcement of reinforced concrete andsteel fiber-reforced concrete members. Adv. Mater. Sci. Eng. 2019, 2019, 4595363. [CrossRef]
46. Ibrahim, M.S.; Gebreyouhannes, E.; Muhdin, A.; Gebre, A. Effect of concrete cover on the pure torsional behavior of reinforcedcontrete beams. Eng. Struct. 2020, 216, 110790. [CrossRef]
47. Kim, M.-J.; Kim, H.-G.; Lee, Y.-J.; Kim, D.-H.; Lee, J.-Y.; Kim, K.-H. Pure torsional behavior of RC beams in relation to the amountof torsional reinforcment and cross-sectional properties. Constr. Build. Mater. 2020, 260, 119801. [CrossRef]
48. Bernardo, L.F.A.; Lopes, S.M.R. Torsion in HSC hollow beams: Strength and ductility analysis. ACI Struct. J. 2009, 106, 39–48.49. Jeng, C.-H. Unified softened membrane model for torsion in hollow and solid reinforced concrete members modeling the entire
pre- and post-cracking behavior. J. Struct. Eng. 2015, 141, 1–20. [CrossRef]50. De Domenico, D. Torsional strength of RC members using a plasticity-based variable-angle space truss model accounting for
non-uniform longitudinal reinforcement. Eng. Struct. 2021, 228, 111540. [CrossRef]51. Lopes, S.M.R.; Bernardo, L.F.A. Twist behavior of high-strength concrete hollow beams—Formation of plastic hinges along the
length. Eng. Struct. 2009, 31, 138–149. [CrossRef]52. EN 1990: 2002; Eurocode 0: Basis of Structural Design. Part 1-General Rules and Rules for Buildings. European Committee for
Standardization: Brussels, Belgium, 2002.
Recommended


