INELASTIC BEHAVIOUR OF
REINFORCED CONCRETE MEMBERS
WITH CYCLIC LOADING
A thesis presented for
the degree of Doctor of Philosophy
in Civil Engineering
in the University of Canterbury,
Christchurch, New Zealando
by
Do C. rENT
1969
!CY" I ldf,J(J •Li'I 'L LIU!(,
-.,
i
ABSTRACT
.-1<300 I er?:, cl
This thesis is concerned with the inelastic behaviour of reinforced concrete members subjected to cyclic overload,.
Theoretical methods for predicting the flexural behaviour of reinforced concrete members have been advanced and compared with experimental evidence at each stage in the developmento Particular attention has been paid to the influence of conventional rectangular binding steel on the stress-strain properties of concrete and the effect on ductility in reinforced concrete beams and columns" The Bauschinger Effect in cyclically-stressed structural grade reinforcing steel was studied in some detail, both experimentally and theoretically, and a mathematical model for this behaviour was derived and is incorporated in the analyses"
Since cyclic loading predictions require the complete loading histories of the component materials to be known, and since both materials have complex responses to this type of load, all of the analyses have been programmed for computer useo
A further experimental programme using cyclicallyloaded beam9 was conducted in order to compare theoretical and experimental moment-curvature and load-deflection behaviour" These beams were simply-supported and cyclically-loaded to simulate seismic response in beams at connections with columns,. Close agreement between experiment and the proposed theories was found"
- oOo -
ii
ACKNOWLEDGEMENTS
This investigation was conducted in the Civil Engineering Department of the University of Canterbury, of which Professor HoJo Hopkins is Heado
I gratefully acknowledge the assistance that I have received during the course of this project and extend my thanks to:
Professor Ro Park, supervisor for this study, for his valued encouragement and guidance throughout the project and for his helpful advice during the preparation of this thesis;
Members of the academic staff, including Dr AoJo Carr for assistance with Least Squares Analyses;
The technical assistance given me by Mr HcTo Watson, Technical Officer, Messrs NoWo Prebble and KoLo Marrion, Senior Technicians, and many others in the Department of Civil Engineeringo I particularly wish to thank Mr JoNo Byers, Senior Technician, for his practical advice and conscientous preparation of the testing equipment and test specimens;
Members of the University Computer Centre, for punching cards and for executing programs;
The University Grants Committee for financial assistance in the form of a Post-Graduate Scholarship and a research grant;
The typist, Mrs J.M. Keoghan;
and Certified Concrete Limited, Christchurch, for providing materials.
For her forbearance and encouragement I thank my Wifeo
- oOo -
iii
CONTENTS
Page 1o INTRODUCTION AND SCOPE OF RESEARCH
1o1 General o o o o • o o o • o ••• o • • • 1
1a2 Object and Scope ••• o •••• o • • • 1
1.3 Format ••• o o • • • o •• o • o • 3
Presentation of Results •
Computer Facilities • o
2. STRESS-STRAIN CHARACTERISTICS OF CONCRETE
5
5
Summary • • • • • • • • • • • • • • • • • • • • 6
2.1 Introduction
2.2 Historical Review o O O O O O O 0
2.2.1 Unconfined Concrete.
2.2o2 Concrete Confined by Lateral Steel
2.3 Stress-strain Relation for Plain
2.3.1
2 0 3 0 2
2.3.3
2.3.4
2o3o5
Concrete 0 0 0 0 0 0 o o o O O O 0
Ascending Portion of Curve
Maximum Flexural Stress •
Strain at Maximum Stress
Falling Branch Behaviour
Spalling Strain • • • • •
2.4 Factors Influencing Increased Ductility
for Confined Concrete in Compression
6
8
8
14
16
16
20
21
21
22
24
2o5 Dimensionless Analysis for Confined
Concrete o o o o o o
206 Proposed Stress-Strain Relation for
Concrete o o o o o o
20601 Tension Stress-Strain Curve o O O O 0
Compressive .Stress-Strain Curve:
Ascending Branch o o o o o o o
Compressive Stress-Strain Curve:
Falling Branch o o o o o o o o
20604 Compressive Stress-Strain Curve:
Large Strains o o o o o o o o
O o O O 0
Cyclic and Repeated Loading of Plain
and Confined Concrete
Computer Programs
Conclusions O O o o O O O O O o O O O O O
3o STRESS-STRAIN CHARACTERISTICS OF STRUCTURAL
GRADE REINFORCING STEEL
Summary o o o o o o
3o1
3o2
3o3
3o4
3o5
306
Introduction o O O O o O O O O O O O 0
Strain-hardening o o
Test Specimen for Strain-hardening o
Compression Stress o o o o o o o o
Properties of Bauschinger Effect o
0 0 0 0
Bauschinger Expression of Singh, Tulin
and Gerstle o o o o o o o o o o o o 0 0
iv
Page
30
38
38
41
41
42
44
46
47
48
48
50
51
54
55
59
Cyclic Loading Tests on Steel Coupons o o
308 Further Expressions for Bauschinger
Effect
30801 Modified Singh, Tulin and Gerstle
Expression o o o o
Exponential Function o o
O O O 0
0 0 o
30803 Quartic Polynomial Expression
30804 Sixth Power Polynomial Expression 0 0 0 0
3o9 Proposed Expression for Bauschinger
Effect O O O O O O O O O O O O O 0
3o9o1 Boundary Conditions for the Ramberg-
Osgood Function 0 0 0 0 0 0 0 0 0 0 0 0
3o9o2 Experimental and Theoretical Comparisons:
The Method of Least Squares 0 . . . . . 3.9.3 Solution for Stress, Given Strain 0 . 0 0
3.9.4 Characteristic Ratio, R ch 0 0 0 0 0 0 0 0
3.9.5 Ramberg-Osgood Parameter, r 0 0 0 0 0
3.10 Theory and Experiment Compared 0 0 0 0 . 0
3.11 Computer Programs 0 0 0 0 0 0 0 0
3.12 Conclusions 0 0 0 . 0 0 0 0 0 0 0 0 0 0 0
V
Page
60
63
63
65
65
66
66
69
70
72
75
77
81
93
94
4. MOMENT-CURVATURE RELATIONS FOR MONOTONICALLY
LOADED T AND RECTANGULAR REINFORCED CONCRETE SECTIONS
Summary ••• o • o ••
Introduction.
0 0 0 0 0 0 96
96
4.,2
4.,2., 1
Stress Block for Concrete
Region 1 E ~€ C 0
vi
Page
97
97
4 .. 2 .. 2 Region 2 : E0< Ee~ e20 ...... ., .. ., • 100
4 .. 2 .. 3 Region 3: Ge> e20 • .. .. • • • .. • .. • • 101
4.,3 Stress Block Parameters for Rectangular
Sections 0 O o O O O O o O O O o O O 0
4.,3.,1 Mode 1 . € E€ . . 0 . . cm 0 0 0 . . 0
4.3 .. 2 Mode 2 e <e ~€20 o cm 0 0 0 0 . 4 .. 3 .. 3 Mode 3 €cm> e20 0 0 . 0 0
4.3.4 Tables of o< and t Values 0 0 0 0 . 0 . . 4.4 Moment-Curvature Analysis for T Shapes
4.4.1 Reduction of Concrete Force for Top
Steel Area, CSR 0 0 0 0 . 0 . . 0 . Reduction of Concrete Force for Bottom
Steel Area, TSR 0 . . 0 0 0 0 0 0 0
4 .. 4. 3 Reduction of Concrete Force for
Neutral Axis Outside the Section
4.5 Concrete Compression Forces for General
T Sections ~ 0 0 O O O O O O O O O O 0
4 .. 5 .. 1 Case 1 0 0 0 0 0 0 0 0 0 0 0 0 0 0 0 0 0
4 .. 5 .. 2 Case 2 0 . . . 0 . . 0 . 0 . . . 4 .. 5 .. 3 Case 3 0 0 0 . 0 0 0 0 0 0 . 4.,5 .. 4 Case 4 0 . . 0 0 0 0 0 0 0 0 0 0 0 0 0 0
4 .. 5.5 Case 5 0 0 0 0 0 0 0 0 0 0 0 0 0 0 0 0 0
4.,5 .. 6 Case 6 0 0 0 . 0 0 0 0 0 0 0 0 0
101
102
104
105
106
109
112
113
113
115
115
115
116
117
117
119
Case 8 •
Case 9 • •
o O o O O O O O o O O O 0
O O 0
4 • 5 • 10 Case 10
4.5011 Case 11
0 0 0 0 0 0 0 0
O O O O O O O O 0 0 0 O O 0
Page
119
120
121
122
123
4.5012 Case 12 ••••••••••••• o • • 123
4. 6 Definitions - "Ultimate!' and "Ductility" 124
4.7 Theory Compared with Experimental
Results O O O O O O o O O O O O O O 0
4.8 Moment-Curvature Responses for
Reinforced and Prestressed Con
crete Sections
4.9 Nomograms £or Ductility and Energy
4.11
4.12
4.13
Absorption at Crushing ••
Maximum and Ultimate Moments and
Curvatures ••••
Effect of Axial Load on Ductility
Computer Programs
Conclusions 0 0 D O O O O O O O O O O 0
5. MOMENT-CURVATURE RESPONSES FOR CYCLICALLY
LOADED REINFORCED CONCRETE SECTIONS
Summary ••••••
Introduction.
Idealised Moment-Curvature Responses ••
125
127
130
134
144
150
150
152
152
153
vii
5.3
5o3o1
5 0 3 0 2
5.4
"Exact" Moment-Curvature Responses •
Cyclically-Loaded Concrete •••••
Cyclically-Loaded Reinforcing Steel
Algorithms for Computer Programs
5.4.1 Iteration and Compatibility
5.4.5
5.5
5.6
Concrete Behaviour •••• o •
Algorithm for Steel Behaviour
Considering Bauschinger Effect o
Algorithm for Elasto-Plastic Steel
Behaviour 0 0 0 0 0 O O O O O O O O O 0
Operation of the Programs O o O O O o O 0
Experimental Moment-Curvature Responses
Discussion of Experimental and
Analytical Results •••••••
Computer Programs 0 0 0 0 0 0 0 0 0 O O O
Conclusions 0 0 0 O o O O 0 • 0 •
60 DEFLECTION ANALYSIS FOR REINFORCED CONCRETE
MEMBERS
Summary o o •• o • o
6.1 Introduction. O O O O O O O O O O O 0
6.2
6.3
Bending Moment Distribution
Deflection Computations - "Exact" Method.
6.4 Deflection Computations - "Approximate"
Method. 0 0 0 0 O O O O O O O O O O O 0
viii
Page
157
157
164
164
165
167
168
168
169
169
182
185
185
187
187
188
190
192
Development of Computer Program o • o
Comparison of Theory with Experiment
Load-deflection Responses using
Idealised Moment-curvature Models o
Computer Programs o
Conclusions ••• 0 0 0 0 0 D O O O 0
7. EXPERIMENTAL RESULTS FROM REINFORCED CONCRETE
BEAMS
Summary 0 0 0 0 0 0 0 0 0 0 0 0 0 0 0 0 0 0 0 0
7.1
7.2
7.3
7.4
7.5
7.6
7.7
7.8
Introduction 0 0 0 O
Range of Variables Studied 0 0 0 0 0 0 0
Selection of Specimen Shape o
Loading Sequence • o ••
Rate of Loading •• o ••• o
Derivation of Moment-Curvature Responses
Derivation of Load-Deflection Responses o
Plastic Hinge Lengths ••••• L • •••
7o8.1 Design Recommendations for Plastic Hinge
Length
7.8.2 Influence of Shear on Plastic Hinging
7.8.3 Influence of Cyclic Loading on Plastic
Hinge Length •••••••••••
Computer Programs o
ix
Page
196
199
207
209
209
212
212
213
214
217
219
221
224
227
227
2 35
2 37
239
X
Page
Bo CONCLUSIONS AND SUGGESTED FUTURE RESEARCH
8.1 General •••• o • • • • • • • • • • 241
Summary of Conclusions
Suggested Future Research.
APPENDIX A BIBLIOGRAPHY
APPENDIX B COMPUTER PROGRAMS • • • • • • • • •
APPENDIX C : MATERIALS, EQUIPMENT AND TESTING
PROCEDURE FOR BAUSCHINGER EFFECT
C.1 Test Specimens •••
Testing Equipment and Procedure
C.2.1 Loading Frame ••
C.2.2 Load Application and Measurement
C.2.3 Loading Sequence 0 0 O O O O O 0
Specimen Yield Stress •
Strain Measurement o O O O O O o O O O 0
APPENDIX D: MATERIALS, EQUIPMENT AND TESTING
PROCEDURE FOR REINFORCED CONCRETE BEAMS
241
244
A1
B1
C1
C1
C1
C4
cs
cs
C6
D.1 Materials • • • • • • • • • • • • • • D1
D.1.1 Concrete
Steel • • •
Beam Manufacture
O O O O O 0
0 O O O 0
D1
DS
DB
D.2.1 Manufacture of Reinforcing Cages Q O O 0
Beam Moulds 0 0 0 0 0 0 0 0 0 0 0
D.2.3 Transporting the Beams O O o O O O O O 0
Testing Equipment and Procedure.
D.3.1 Loading Frame •• 0 0 0 O O O O O O 0
Load Application and Measurement 0 0
Support Conditions O O O O O O O O 0
Crack Detection ••• O O -0 0
D.3.5 Steel and Concrete Strain Readings
D.3.6 Deflections •• 0 O O O O O O O O O 0
D.3.7 Rotations • 0 0 0 0 0 0 0 0 O 0
D.3.8 Age of Beams at Test
D.3.9 Sequence of Operations
- oOo -
Page
D8
D12
D14
D14
D14
D15
D15
D17
D18
D19
D20
D23
D23
xi
2.6
LIST OF FIGURES
Hognestad's Stress-Strain Model o
Ultimate Strength Factors •• II
Rusch's Design Parameters ••
Chan's Stress-Strain Model
Moment-Rotation Curves 0 Q O O 0
Soliman and Yus' Stress-Strain Model
2o7 Assumed Compressive Stress-Strain
Relation for Unconfined Concrete
2.8 Falling Branch Property for Unconfined
2o10
2o13
2o14
Concrete
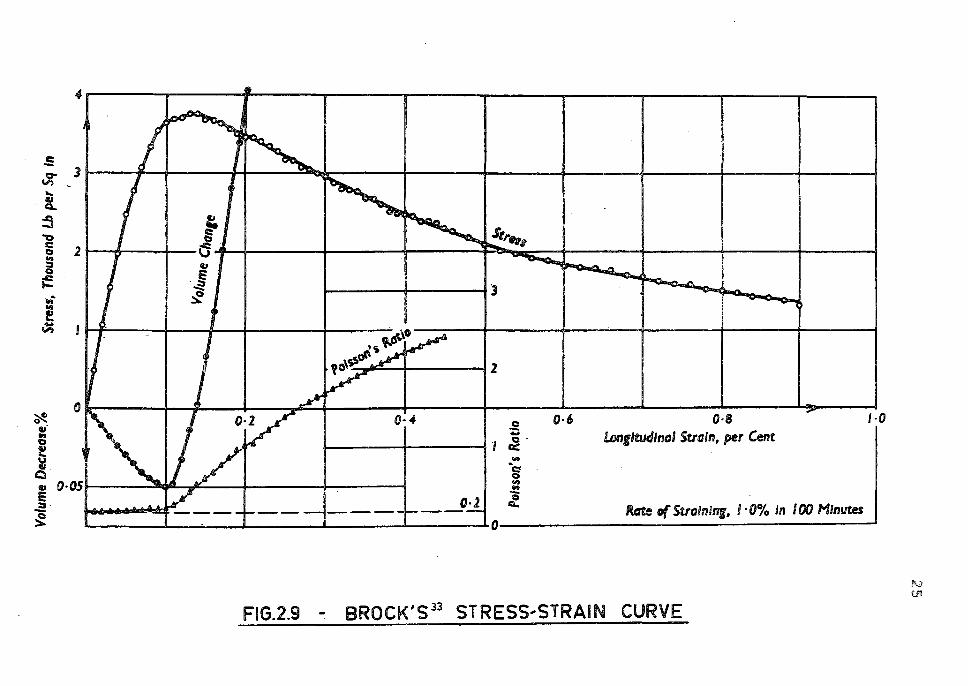
Brock's Stress-Strain Curve
Efficiency of Lateral Reinforcement.
Experimental Results for Bound Concrete o
Influence of Binding Steel on Stress-
Strain Response •
Assumed Compressive Stress-Strain
Relation for Confined Concrete
Cyclic Behaviour of Concrete
Notation for Steel
Page
10
11
13
15
17
18
19
23
25
28
36
39
40
45
49
xii
xiii
Page
3o2 Stress-Strain Relations in the Strain-
Hardening Range: Experimental and
Theoretical Plots 0 0 0 0 0 0 0 0 0 53
3o3 Bauschinger Effect Properties 0 0 0 0 0 0 57
3 0 ;4 Steel Stress-Strain Curve Showing
Possible Incremental Deformation
Cycles 0 0 0 0 0 0 0 0 0 0 0 0 0 0 58
3o5 Singh, Tulin and Gerstle Model 0 0 0 61
3.6 Ramberg-Osgood Function 0 0 0 0 0 0 0 0 0 68
3.7 Characteristic Ratio versus Strain
in Previous Cycle 0 0 0 0 0 0 . . . 76
3.8 Ramberg-Osgood Parameter versus
Cycle Number 0 0 0 0 0 0 . . 0 . 0 80
3.9 Bauschinger Specimen 6 0 0 0 0 0 0 0 84
3.10 Bauschinger Specimen 8 0 0 0 0 0 . 0 85
3.11 Bauschinger Specimen 9 0 0 0 84
3.12 Bauschinger Specimen 11 0 0 0 0 0 0 0 86
3o13 Bauschinger Specimen 12 0 0 0 0 0 87
3.14 Bauschinger Specimen 17 0 0 0 0 0 0 0 88
3o15 Bauschinger Specimen 20 0 0 0 0 0 0 0 0 0 86
3.16 Bauschinger Specimen 21 0 0 0 0 0 0 0 0 0 89
3.17 Bauschinger Specimen 21 (Detail) 0 0 0 0 90
3.18 Bauschinger Specimen 25 0 0 0 0 0 91
3.19 Bauschinger Specimen 29 0 0 0 0 0 0 0 0 0 92
3o20 Bauschinger Specimen 30 0 0 0 0 0 92
4o1
4o2
4o3
4 .. 4
4o5
406
4o7
4.8
4.9
4.10
4.11
Assumed Stress-Strain for Concrete.
Typical Concrete Stress Blocks ••
T Beam Nomenclature
General Types for T-Sections
Moment-Curvature Comparisons ••••••
Theoretical Moment-Curvature Plots •
Key to Significant Points on the
General Moment-Curvature Plot
Nomogram for Curvature Ratio at
Crushing ••••• o o o • o •
Nomogram for Energy Absorption at
Crushing o o o o o o o o o o o o o
Concentrically-Loaded Column ••
Interaction and Ductility Diagrams
for Columns
Elasto-Plastic Property 0 0 0 0 0 0 0 0
Degrading Stiffness Property
Unloading of Concrete
Discrete Elements for T-Sections •
5.5 Dual Stress-Strain Property for
Concrete o •• o
506 Moment-Curvature for Beam 24 Plastic
Hinge o O O O
5o7 Moment-Curvature for Beam 26 Plastic
Hinge O o O O O O O • 0 0
xiv
Page
98
103
110
111
126
129
131
133
135
145
146
154
154
159
161
163
171
172
xv
Page
5.8 Moment-Curvature for Beam 27 Plastic
Hinge 0 0 0 . . . 0 . 0 0 . . 0 0 0 . 173
5.9 Moment-Curvature for Beam 44 Plastic
Hinge . 0 . 0 0 0 0 0 0 0 0 0 0 0 0 0 174
5.10 Moment-Curvature for Beam 46 Plastic
Hinge 0 0 0 0 0 0 0 0 0 0 0 0 0 0 0 0 175
5.11 Moment-Curvature for Beam 47 Plastic
Hinge 0 0 0 0 0 0 0 0 0 0 0 0 0 0 0 0 176
5.12 Moment-Curvature for Beam 64 Plastic
Hinge 0 0 0 -0 0 0 0 0 0 0 0 0 0 0 0 0 177
. 5 .13 Moment-Curvature for Beam 65 Plastic
Hinge 0 0 0 0 0 . . . . 0 0 0 0 0 . 0 178
5.14 Moment-Curvature for Beam 67 Plastic
Hinge 0 0 . . . . 0 0 . 0 0 0 . . . . 179
5.15 Moment-Curvature for Beam 26 Plastic
Hinge (Elasto-Plastic Steel Response) 180
5.16 Moment-Curvature for Beam 46 Plastic
Hinge (Elasto-Plastic Steel Response) 181
6.1 Point-Loaded Cantilever . . . . . . . 0 189
6.2 Deflection Computations -"Exact" Method 191
6 " 3 Deflection Computations - "Approximate"
Method . . 0 0 . 0 . . 0 0 0 0 0 0 0 194
6.4 Load versus Equivalent Central
Deflection for Beam 24 0 0 0 0 . 0 0 200
xvi
Page
6.5 Load versus Equivalent Central
Deflection for Beam 46 0 0 . . 201
6.6 The Bond Stress Anomaly . . . . . 0 205
6.7 Load versus Equivalent Central
Deflection for Beam 24 (Idealised
Degrading Stiffness Response) 208
6.8 Load versus Equivalent Central
Deflection for Beam 46 (Idealised
Elasto-Plastic Response) . . 0 0 . 210
7.1 Specimen Shape 0 . 0 . . . 0 . 0 216
7.2 Earthquake Simulation . 0 . 0 0 0 0 . 0 220
7.3 Influence of Loading Rate 0 0 0 0 0 0 . 222
7.4 Equivalent Central Deflection 0 0 0 225
7.5 Average Curvature Profiles for Beam 26 0 228
7.6 Average Curvature Profiles for Beam 44 . 229
7.7 Average Curvature Profiles for Beam 46 0 2 30
7.8 Average Curvature Profiles for Beam 64 0 231
7.9 Diagonal Crack 0 . 0 . 0 0 . . . . . . 0 236
C.1 Bauschinger Test Specimen . . . . 0 C2
D.1 Shrinkage Strains for Beams 66 and 67 D4
D.2 Instrumentation of Beams . . . 0 0 . 0 0 D21
- oOo -
LIST OF TABLES
2o1 Test Results for Confined Concrete o
2o2 Least Squares Analysis for Confined
2o3
3o1
3o2
3o3
Concrete o o o o o
Table of Z-values
Least Squares Analysis for
Least Squares Analysis for
Comparison of Bauschinger
Theories and Experiment
r and f ch
r Given fch
Effect
0 0 0
0
4o1
4o2
Table of Alpha Values
Table of Gamma Values 0 0 O 0
4o3 Differences Between the Twelve Modes
of Figure 4o4
4o4 Properties of Mattock's Beams 0 O O O 0
4o5 Post-elastic Beam Behaviour,
pf /f' = 0o0S y C
406 Post-elastic Beam Behaviour,
pf /f' = 0o10 y C
4o7 Post-elastic Beam Behaviour,
pf /f' = 0o15 y C
408 Post-elastic Beam Behaviour,
pf /f' = 0o20 y C
xvii
Page
32
35
43
74
79
83
107
108
109
128
136
137
138
139
xviii
Page
4o9 Post-elastic Beam Behaviour,
pf /f' == 0o25 0 0 0 . 0 0 0 0 0 0 0 0 0 140 y C
4~10 Post-elastic Beam Behaviour,
pf /f' =: 0o 30 0 0 0 0 0 0 0 0 0 0 0 0 0 141 y C
4o11 Post-elastic Beam Behaviour,
pf /f' == 0o35 0 0 0 0 0 y C 0 0 0 0 0 0 0 0 142
4o12 Post-elastic Beam Behaviour,
pf /f' = 0o40 0 0 0 0 0 y C 0 0 0 0 0 0 0 . 143
7.1 Properties of Test Beams 0 0 0 0 0 0 215
7o2 Load-Deflection Cycles for Beams 0 0 0 . 226
Do1 Reinforcing Steel Properties 0 0 0 0 D7
Do2 Beam Instrumentation 0 0 0 0 0 0 0 0 0 0 D22
- oOo -
7o1
7o2
7.3
Co1
Co2
D.1
D.2
D.3
D.4
D.5
D.6
D.7
D08
LIST OF PLATES
Crack Pattern for Beam 26 o
Crack Pattern for Beam 44 o
Crack Pattern for Beam 64 o • 0 0
Bauschinger Specimen Mounting o
Bauschinger Test Rig
Jig for Strain Lugs o
Stirrup Bender
O O O 0
Reinforcing Cages •
Lug Waterproofing o
Cage in Place in Mould
Beam Transportation o
Loading Frame o
0 O o o O O
End Support o o o
- oOo -
xix
Page
238
238
2 38
C3
C3
D10
D10
D10
D10
D13
D13
D16
D13
A C
A s
A' s
A" s
B
b
b"
C u
D
D"
d
d'
d II
E C
E er
E s
xx
INDEX OF NOTATION
= Area of concrete section confined by stirrups or ties
=
=
=
=
=
=
=
=
=
=
=
=
Effective area of deformed reinforcing bar
Gross area of concrete section
Area of bottom steel
Area of top steel
Area of binder steel
M:inimum dimension of confined concrete core
Width of rectangular section or web width of T section
Ratio of confined core width to total section (or web) width
Cube strength of concrete
Diameter of longitudinal reinforcing steel
Diameter of lateral reinforcing steel
Effective depth of section
Ratio of compression steel depth to effective depth
Height of confined concrete core
Ratio of flange thickness to effective depth for T sections
Initial tangent modulus for concrete
Energy absorption of section at crushing
Young's Modulus for reinforcing steel
Et
E y
=
=
Tangent Modulus for reinforcing steel
Energy absorption of section at yield
xxi
e p = Ratio of eccentricity of point of action of axial load measured from top face of member, to effective depth
F = Yield force for reinforcing bar y
Fu = Ultimate force for reinforcing bar
f = Stress
fc = Concrete stress
f' = Cylinder strength of concrete C
fch = Characteristic stress for reinforcing steel
f = Modulus of Rupture for concrete r
f = Tension steel stress s
f' = Compression steel stress s
f = Tension steel yield stress y
f' = Compression steel yield stress y
f = Tension steel ultimate stress u
f' = Compression steel ultimate stress u
h = Ratio of total section depth to effective depth
k
LP
1 C
M
M er
of section
= Ratio of neutral axis depth to effective depth
=
=
=
=
of section
Ultimate strength design parameters of Hognestad, Hanson and McHenry (Figure 2o2)
Equivalent plastic hinge length
Ratio of length of cantilever to effective depth
Bending moment of section
Bending moment of section at crushing
M max
N
p
p
p'
p"
r
s
t
w
z
= Maximum bending moment of section
= Ultimate bending moment of section
= Bending moment of section at yield
= Cycle number for Bauschinger Effect in reinforcing steel
xxii
= Number of sections of finite length describing a cantilever
= Ratio of axial load on a section to the product of band d
= Tension steel ratio
= Compression steel ratio
= Binding steel ratio
= Total longitudinal steel ratio for symmetricallyreinforced columns
= Characteristic Ratio for Bauschinger Effect in reinforcing steel
= Ramberg-Osgood parameter for Bauschinger-Effect in reinforcing steel
= Stirrup or tie spacing
= Overall dimension of column perpendicular to the plane of bending
= Uniformly distributed load
= Parameters for strain-hardening in reinforcing steel
= Ratio of flange width to web width for T sections
= Slope of falling branch of concrete stressstrain curve
= Ratio of average concrete stress in stress block to concrete cylinder strength
€
E C
€ cm
E er
€. 1 lp
€' s
xxiii
= Distance of resultant concrete force from top of stress block, as a fraction of the neutral axis depth kd
=
=
=
=
=
=
=
=
=
=
=
=
Strain
Strain corresponding to centroid of area of concrete stress block
Concrete strain
Characteristic strain for Bauschinger Effect in Reinforcing steel
Strain in concrete fibre at top of section
Crushing strain for concrete
Plastic strain in previous cycle for cyclicallystressed reinforcing steel
Tension rupture strain for concrete
Strain in tension steel
Strain in compression steel
Strain hardening strain for tension steel
Strain hardening strain for compression steel
Strain at ultimate stress in tension steel
Strain at ultimate stress in compression steel
Concrete strain at maximum stress
Concrete strain for the falling branch of the stress-strain curve at 20 per cent maximum stress
Strain at 50 per cent maximum stress on the falling branch of the stress-strain curve for unconfined concrete
Strain at 50 per cent maximum stress on the falling branch of the stress-strain curve for confined concrete
Plastic rotation at beam plastic hinge
xxiv
0 = Curvature
95cr = Section curvature at crushing
0u = Section curvature at ultimate
(/Jy = Section curvature at yield
- oOo -

111 I li',/\1\P,Y , ii\llVH,,:ny ( l/ ( ,1\1,1
j ,,
CHAPTER 1
INTRODUCTION AND SCOPE OF RESEARCH
1o1 GENERAL
.This country is among those in which provision for the
possibility of earthquakes must be made in the design of
structureso Most design procedures recommended by codes of
practice are.based on experimental evidence, yet most prev
ious researches into ductility, plastic hinging and other
post-elastic characteristics of reinforced concrete sections,
have consisted of applying monotonically-increasing loads to
test specimens-until failure. Under most circumstances, and
particularly in the case of seismic loading, the likelihood
of a building being failed in this fashion is slight. That
the recommendations of the codes of practice may not be
applicable to the cyclic behaviour associated with seismic
loading has long been recognisedo
1.2 OBJECT AND SCOPE
The growing use of electronic computers as a design tool
has resulted in a very rapid advance in the dynamic analyses
of structureso Perhaps because this application is
2
attractive to researchers, a study of the factors on which
such analyses should be based, the behaviour of the compon
ent materials, has fallen well behind the computer analyseso
That this is so is well illustrated by the inaccurate and
even apparently unsafe, idealised models that are currently
being used to predict cyclic, inelastic behaviour of high
rise structures to seismic loadingo
Th . . t l . t. t. 50, 62, 6 7 h ree previous experimen a inves 1ga ions ave
been solely concerned with the cyclic behaviour of reinforced
concrete sectionso The first, conducted by Agrawal, Tulin
and Gerstle50 has concerned itself with the behaviour of beam
sections and has proposed a simple mathematical expression
for the Bauschinger Effect in reinforcing steel. This study
is discussed more fully in Chapter 3. The second investig-
62 ation was reported on by Hanson and Conner and is purely an
experimental programme, in which the Bauschinger Effect is
mentioned briefly, but in the writer's view not recognised as
being of great significance. Bertero and Bresler67 have
contributed with a descriptive paper in which the work of the
previous authors is also summarised.
The scope of the investigation reported herein was
restricted to the study of the cyclic, flexural behaviour of
concrete and steel, both individually and when combined to
form beams and columns. As such it was intended to make a
wide study into the effects that the various features of
3
steel and concrete stress-strain behaviour have on the res
ponse to cyclic loading 9 and to assess the relevance of
each of these factorso Therefore this thesis is a prelimin
ary study and its objective is to indicate the more
immediate needs for research in this topic rather than to
propose changes in existing seismic design techniqueso
However, experimental and theoretical evidence is presented
in the text that could justify modifications to current
practiceo
Other features of reinforced concrete behaviour under
cyclic loading, for example shear and bond capacities, have
not been studied in detail but have been mentioned briefly
hereino
1o3 FORMAT
The chapters of this thesis have been arranged as far
as possible to represent the individual stutjies within this
investigation.
In Chapter 2, the results of previously-published
experimental results for the stress-strain behaviour of -
concrete are collated. The behaviour of plain concrete has
been considered and a method for modifying the falling
branch of the stress-strain curve for confinement afforded
by conventional rectangular stirrups or ties has been prop
osed.
4
Chapter 3 describes an experimental and theoretical
investigation into the behaviour of structural-grade reinforc
ing steelo Special significance has been attached to the
response of reinforcing steel to alternating stress cycles
and this factor has been studied in some detailo
Theories developed in these two chapters are combined
in Chapter 4 and used to study the monotonic behaviour of
reinforced concrete sectionso The consequent theory is shown
to compare favourably with published test results and then
used to illustrate the effects of lateral confinement of
concrete on the ductility of beam and column sectionso
Chapter 5 extends the theory further to enable predic
tions of cyclic behaviour of reinforced concrete beam
sectionso Again this analysis is compared with experimentally
obtained moment-curvature resultso
The theory of Chapter 5 is utilised in Chapter 6 to
enlarge the scope of the investigation by considering the
deflection behaviour of simple beams, comprising a number of
discrete elements of length~
The experiments that were performed to provide compar
isons for the analyses of the previous two chapters are
described in Chapter 7o
The conclusions that have been reached and the suggest
ions for future reseach are summarised in Chapter Bo
Generally 1 conclusions appear with discussions in the body of
the thesis and therefore the formal conclusions in this
chapter are comparatively briefo
1o4 PRESENTATION OF RESULTS
5
Many diagrams and tables supplement the text of this
thesis. In many cases, these diagrams have been used rather
than text to conserve space and are therefore discussed very
briefly or even simply referred too
Many of the experimental results have been plotted and
appear in conjunction with the theoretical analyses with which
they are compared, rather than in the chapter discussing the
experimental programmeo
1.5 COMPUTER FACILITIES
For the major part of this investigation, the University
of Canterbury's principal computer was an IoB.M. 360 model 44
with 16K, 32-bit words core storage. This central storage
was doubled towards the end of this studyo Peripheral stor
age comprised two 2311 disc drives, each capable of storing
K 250,000 words. This is a third generatioh machine designed
specifically for scientific use and thus has a very rapid
execution speed.
A large part of this investigation was devoted to the
development of computer programs. The workings of these pro
grams are dealt with only briefly in the text of this thesis,
and listings and instructions for their use appear in Appendix B. i
6
CHAPTER 2
STRESS-STRAIN CHARACTERISTICS OF CONCRETE
SUMMARY
The behaviour of concrete under monotonic, repeated
and cyclic loading is consideredo Compressive stress
strain curves for plain and confined concrete based on
previously-published test data are presented and an
approximate method of predetermining concrete stress-strain
characteristics for flexural and axial loading conditions is
proposedo
2o1 INTRODUCTION
Many stress-strain curves for concrete have been
t 1 t d . recent 5,9,10,12,13,16 1 23,27 d b pos u a e in years an pro -
ably no other single aspect of Civil Engineering has been
the subject of such a vast amount of research as has this
materialo An inherent problem in determining compressive
stress-strain curves has been the difficulty of directly
measuring stress in concrete subject to flexureo Con
sequently, empirical expressions have evolved that are
either based in some way on the load-deformation responses
7
obtained from axially-loaded specimens or indirectly from
beam and column tests using numerical integration of moment
load-strain observationso The validity of the first method ~ s~
has been questioned from time to timeJ' i, but the fact
remains that any reasonable shape of stress-strain expres
sion for compressed concrete produces sufficiently accurate
estimates of ultimate bending moments in under-reinforced
beam sectionso The explanation is simply that reinforcing
steel, which has an easily defined stress-strain expression,
has by far the greater influence on flexural moments for
such beamso
Soon after Whitney's Ultimate Strength Theory, based on
the idealised rectangular stress block, was published 3 ' 4 ,
research into factors influencing the flexural stress-strain
curve for concrete lapsed, and the subject was for some time
considered as of only academic interesto More recently how
ever, the plastic hinge theories have resulted in a renewed
interest in the topic, for the ultimate curvature, and hence
the energy absorption capacity of a monotonically-loaded
section, is greatly dependent on the maximum strain to which
concrete can be subjectedo Consequently many formulae for
the determination of ultimate concrete strain have been
proposed17 , 18 , 19 , 32 , 42 , 43 , 55 , many of which are based on the
cylinder strengtho 28 As RUsch has shown, the ultimate
strain in concrete depends to a larger extent on the shape
of the section, the position of the neutral axis, and the
8
rate of loading.
Most of the developments to date have arisen from mono
tonic loading tests and this approach is now inadequate. A
clearer picture of concrete behaviour at all stages of the
stress-strain relation is required for analyses concerned
with cyclic behaviour.
2.2 HISTORICAL REVIEW
Excellent historical reviews on previous concrete
10 12 24 . research have been published by Hognestad ' ' in the
early 1950 1 s and there seems little point in repeating them
here. Since that time, however, there have been a number of
notable contributions to the literature and some should be
mentioned briefly.
2.2.1 Unconfined Concrete
In 1950, Herr and Vandegrift8 studied the compression
zones of singly-reinforced concrete beams with constant
moment zone using a photo-elastic method incorporating iso
tropic glass. This investigation was beset with experimental
difficulties caused by varying humidity and changes of
moisture content in the concrete. Consequently their find
ings should be interpretted with caution. Using concrete
with a 4,500 p.s.i. cylinder strength, they found the maximum
flexural stress to be 6,500 p.s.i.; an increase in strength
of 45 per cent. No further experimental work using this
approach has been published since these pilot t~sts.
9
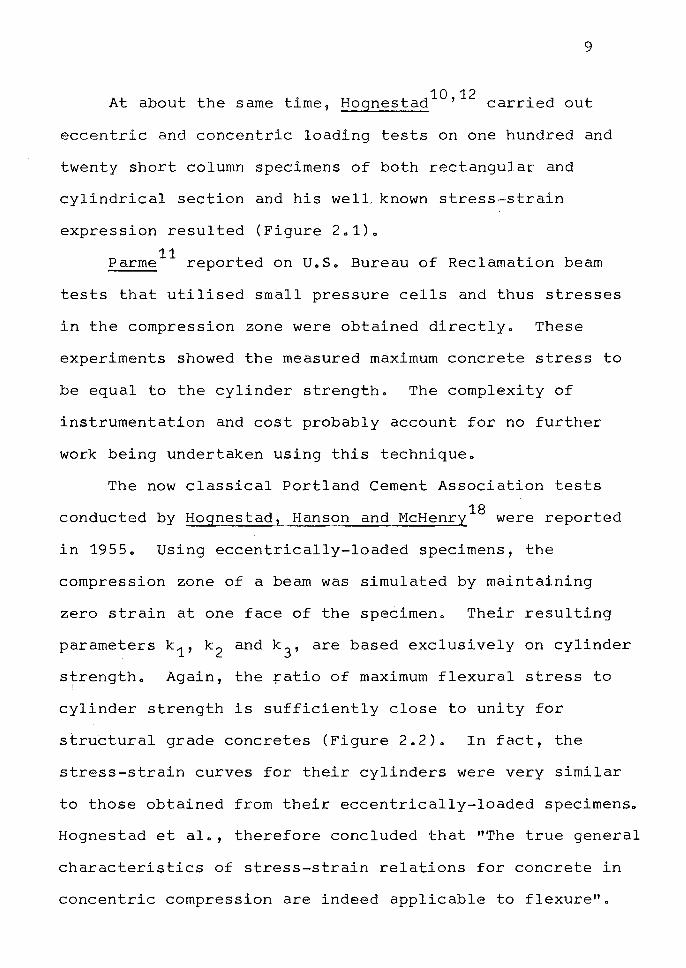
10 12 . At about the same time, Hognestad ' carried out
eccentric and concentric loading tests on one hundred and
twenty short column specimens of both rectangular and
cylindrical section and his well known stress-strain
expression resulted (Figure 2o1)o
11 Parme reported on UoSo Bureau of Reclamation beam
tests that utilised small pressure cells and thus stresses
in the compression zone were obtained directlyo These
experiments showed the measured maximum concrete stress to
be equal to the cylinder strengtho The complexity of
instrumentation and cost probably account for no further
work being undertaken using this techniqueo
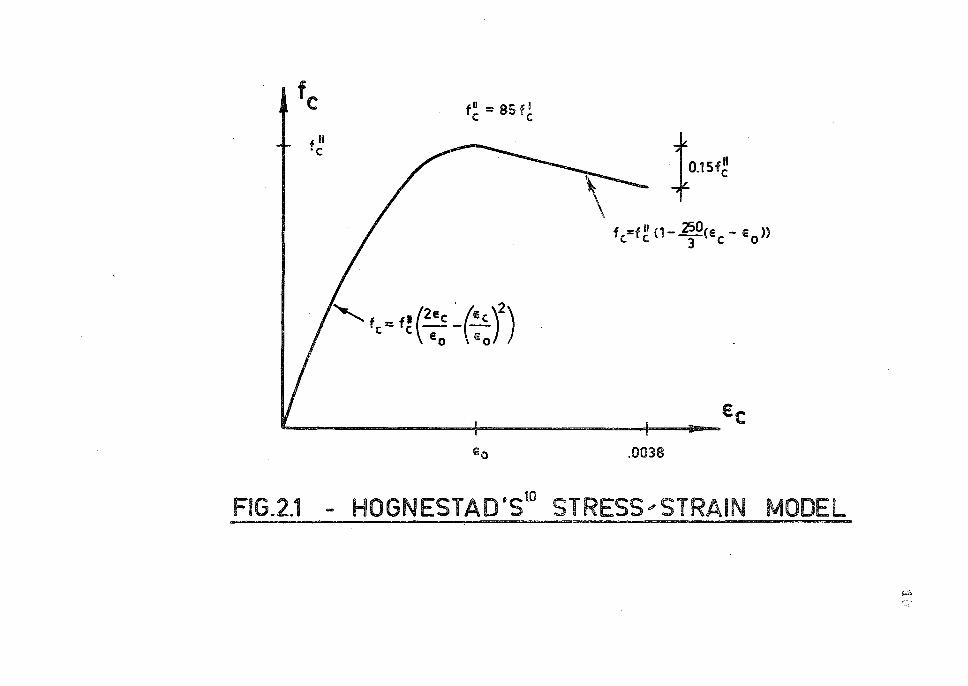
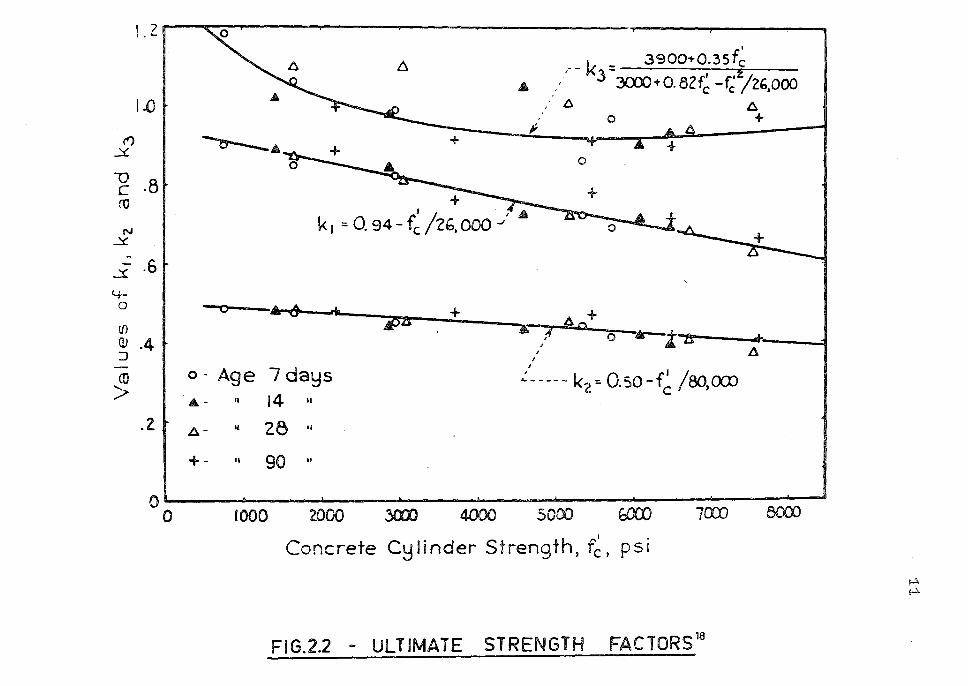
The now classical Portland Cement Association tests
18 conducted by Hognestad, Hanson and McHenry were reported
in 19550 Using eccentrically-loaded specimens, the
compression zone of a beam was simulated by maintaining
zero strain at one face of the specimeno Their resulting
parameters k 1 , k 2 and k 3 , are based exclusively on cylinder
strengtho Again, the +atio of maximum flexural stress to
cylinder strength is sufficiently close to unity for
structural grade concretes (Figure 2.2). In fact, the
stress-strain curves for their cylinders were very similar
to those obtained from their eccentrically-loaded specimenso
Hognestad et al., therefore concluded that "The true general
characteristics of stress-strain relations for concrete in
concentric compression are indeed applicable to flexure".
fc
f II C
f 81 = 85 f I C C
' 2
'- tc = ti (2::-(-::) )
Eo
t0-15f~ f =f 11 c1- 250ce - e n
C. C 3 C 0
Ee
.0038
FIG.2.1 - HOGNESTAD 'S10
STRESS.,, STRAIN NIODEL
,,:.
! .Z n
1.0
<') ..Y
-0 C -8 ro
N ~
~
~ .6 4-
0
ti)
(lJ 4 :J .
-(0
> .2
.6
__ k == 3soo1-o.3s f~ , 3 3000•0-82f~ -f~ /2b,000 I:) A
f 0 + ~. +
0
+ + I "",6
k 1 = 0. 94-fc /26,000 _,,'
--0 Ad ,4ii
Jim
o - Age 7 da~s A- 11 14 11
~- ll 28 ii
+- II 90 II
+ + A--o J -,i:4 or-t~ _...,
; A I ,
:_' _____ k2
= O.so-f~ /oo,OCJJ
o.__ __ ...__ __ ..i..--__ ......_ __ -i-__________ _...__ __ ......__
IOOO 2000 .3000 4000 5000 f:fXJJ 70C1J 8000 0
Concrete C~ Ii nder Strength, f~, psi
FIG.2.2 - ULTIMATE STRENGTH FACTORS18
!--" ~
12
An extremely thorough experimental programme.on this
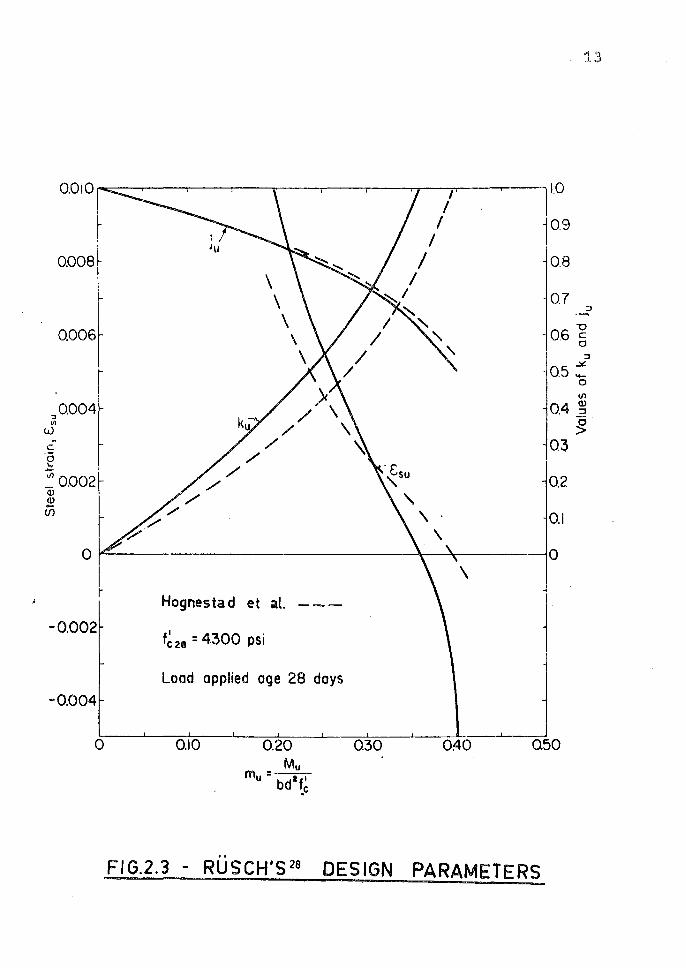
\-.. t . t ' 'b RH ' 28 . ~--- --· b' t· suuJec was in rooucea y uscn in ~~bu. Hls o Jee ive
was to determine which variables affected the stress-strain
curve and to what extent. On the basis of this more
complete knowledge, rational simplifications could be made
for de$ign purposes. Up until this time, the simplifying
assumptions had been made in advance, and Rllsch's ''grass
roots" approach was most enlightening, showing the effects
of time on the material to be very marked. Unfortunately
this work is not yet completed, but a simplified design
curve for one concrete strength was published and is com
pared with expressions derived by Hognestad et a1. 18 in
Figure 2.3.
Sinha, Gerstle and Tulin 39 proposed a method in 1964
for modifying the cylinder stress-strain curve for repeated
loading. Expressions were developed for envelope, unloading
and reloading curves. It is significant that they later411
50 found the accuracy of the stress-strain curves to be of
minor importance in beams,subjected to repeated loading.
In 1965, the question of using the concentric compres
sion curve for flexure was again aired, this time by
Sturman, Shah and Winter51 of Cornell University. By
studying microcracks, the initial cause of failure in
concrete, as observed by Richart, Brandtzaeg and Brown112
in 1928 1 they noted that a flexural strain gradient across
the section appeared to "retard and reduce" microcracking,
13
O.OiO ~-.....---,---..,..---y---,----.---rr--;;-----,---,1 LO
:, Vl
t,j
C ·e
0.008
0.006
0.004
~ 0.002 <1) <1)
if)
0.9
0.8
0.7 ::, -~
06 -g . 0
::, .:.,t:.
·05 .._ 0
V1
0.4 ~ g
03
0.2
0.1
o~--------------\-~---70
~ -0.002
-0.004
0
Hognes tad et al. - - -
f ~ 28 = 4300 psi
Load applied age 28 days
0.10 0.20 Mu
mu= bdtt' .c
\
0.30 0!40 050
FIG.2.3 - RUSCH'S 28 DESIGN PARAMETERS
14
and that this resulted in quite different stress-strain
curves for concrete in flexu~al and uniaxial compressionso
With maximum flexural stresses 20 per cent in excess of
maximum concentric stresses, their findings reinforced, to
some degree, the results of Herr and Vandegrifts 18 photo
elastic testso
2a2o2 Concrete Confined by Lateral Steel
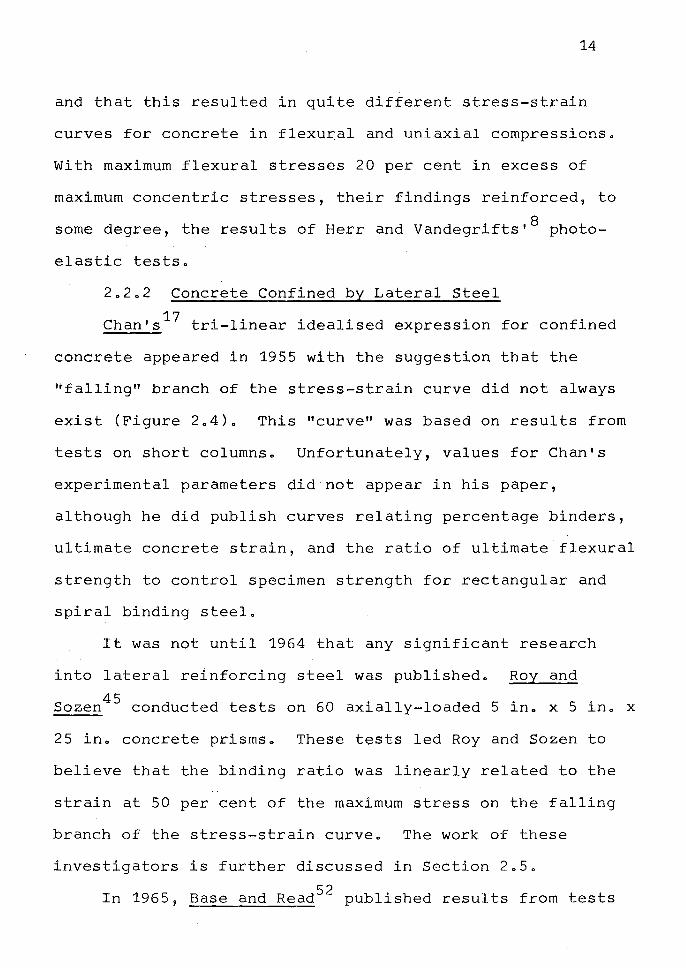
Chan 1 s 17 tri-linear idealised expression for confined
concrete appeared in 1955 with the suggestion that the
"falling'' branch of the stress-strain curve did not always
exist (Figure 2a4)o This ''curve" was based on results from
tests on short columnso Unfortunately, values for Chan's
experimental parameters did not appear in his paper,
although he did publish curves relating percentage binders,
ultimate concrete strain, and the ratio of ultimate flexural
strength to control specimen strength for rectangular and
spiral binding steelo
It was not until 1964 that any significant research
into lateral reinforcing steel was publishedo Roy and
Sozen45 conducted tests on 60 axially-loaded 5 ino x 5 ino x
25 ino concrete prismso These tests led Roy and Sozen to
believe that the binding ratio was linearly related to the
strain at 50 per cent of the maximum stress on the falling
branch of the stress-strain curveo The work of these
investigators is further discussed in Section 2.50
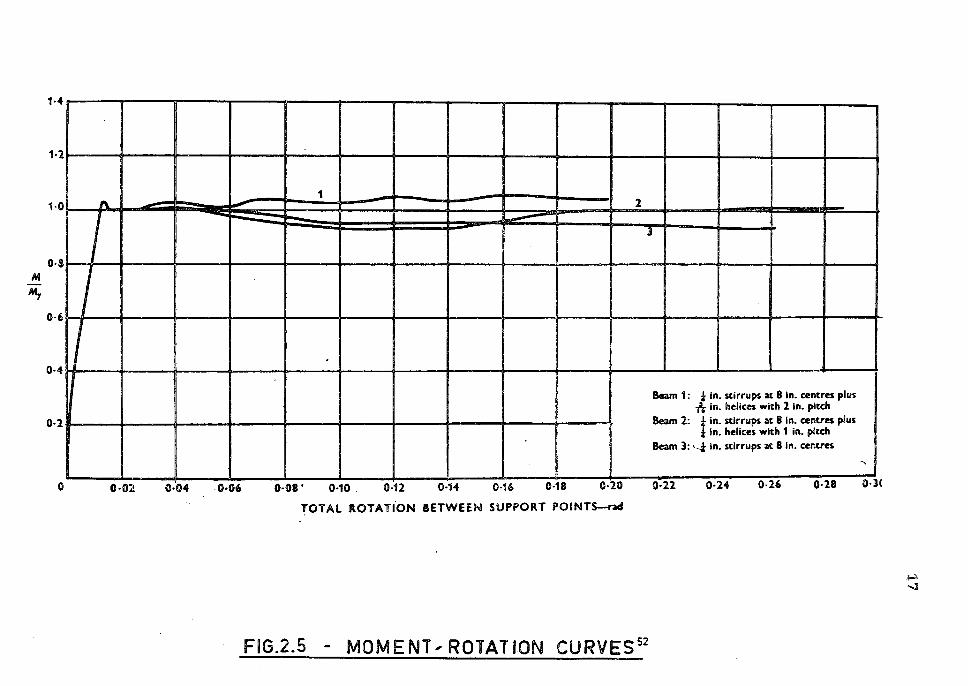
In 1965, Base and Read 52 published results from tests
fc
fy fp
fe
Gie
"2Ec
Ee
ep £u
FIG.2.4 - CHAN'S11 STRESS,STRAIN MODEL
j,,.l. u,
16
on beams with helical and conventional binding reinforcement
in the compression zone. They found that for under~
reinforced beams, the moment-curvature characteristics were
affected only to a very slight extent by the percentage
binders (Figure 2.5). The effect was, however, most marked
for over-reinforced beams.
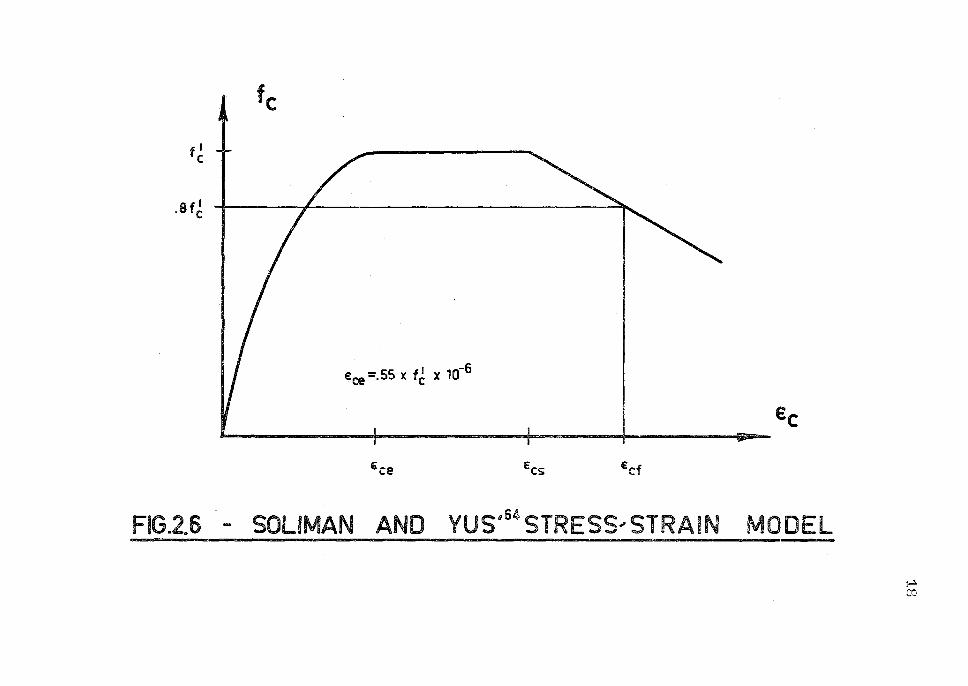
A further study into lateral reinforcement effects on
the concrete stress-strain curve was published by Soliman
and Yu64 in 1967. Using an experimental technique similar
to that employed by Hognestad et ai. 18 , their tests led to
a bilinear-parabolic expression of the type shown in Figure
2.6. The work of Soliman and Yu is also discussed more
fully later.
Other work on confined concrete has been published by
Ru h d StHckl 37 , B t d F 1· 46 d N t 1 66 sc an v er ero an e ippa an awy e a ••
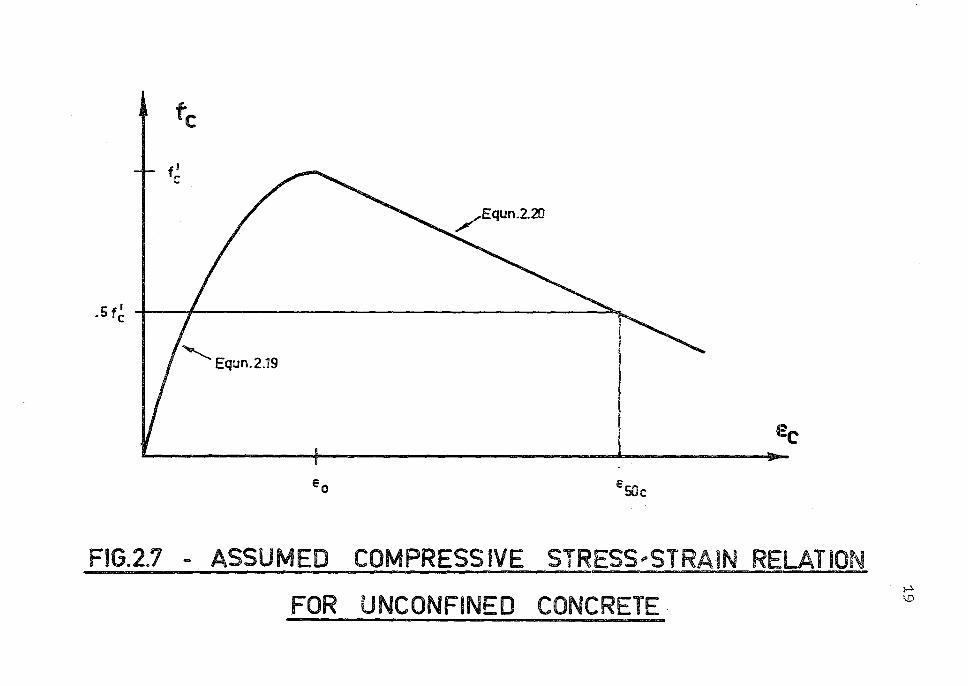
2.3 STRESS-STRAIN RELATION FOR PLAIN CONCRETE
The plain concrete uniaxial stress-strain relationship
used in this thesis is shown in Figure 2.7. Reasons for the
adoption of this curve are as follows:
2.3.1 Ascending Portion of Curve
Most investigators agree that the ascending portion of
the stress-strain curve can be represented by a parabola.
10 This thesis, in common with Hognestad and others, utilizes
Ritter's second degree parabola which has the form:
f c = f~ [
2
€€
0
c - ( :: )
2
] •••• ( 2 • 1)
1·4
1·2
1·0 "' I 0·8
M
My
0·6
I ' I \
I 0·4
0·2
0 ID·Ol 0•04 0·06
1 l
3
0·08' 0·10 . 0·12 O·H 0·16 0·18 0·20
TOTAL JlOTATION BETWEEN SUPPORT POINTS-rad
FIG.2.5 - M0MENT,R0TATION CURVES 52
Sarni: ¼ In. stirrups at 1B In. centres plus -h in. helices with 2 In. pitch
Beam 2: ¼ in. stirrups at 1B In. centres plus ¼ in. helices with 1 in. pitch
Beam 3: •--¾ in. stirrups at 1B In. centres
0·22 0·24 0-26 0·18
..,_
0-3(
~ -..1
f I C
.stl
fc
€ce =.55 X fJ X 10-6
'ce
€c
Ecs €cf
FIG.2.6 - SOLIMAN AND YUS~64 STRESS,STRAIN MODEL
~ co
I .5 f c
fc
Eo
ec
eSOc
FIG~2.7 - ASSUMED COMPRESSIVE STRESS,STRAIN RELATION
FOR UNCONFINED CONCRETE ~ '-.Cl
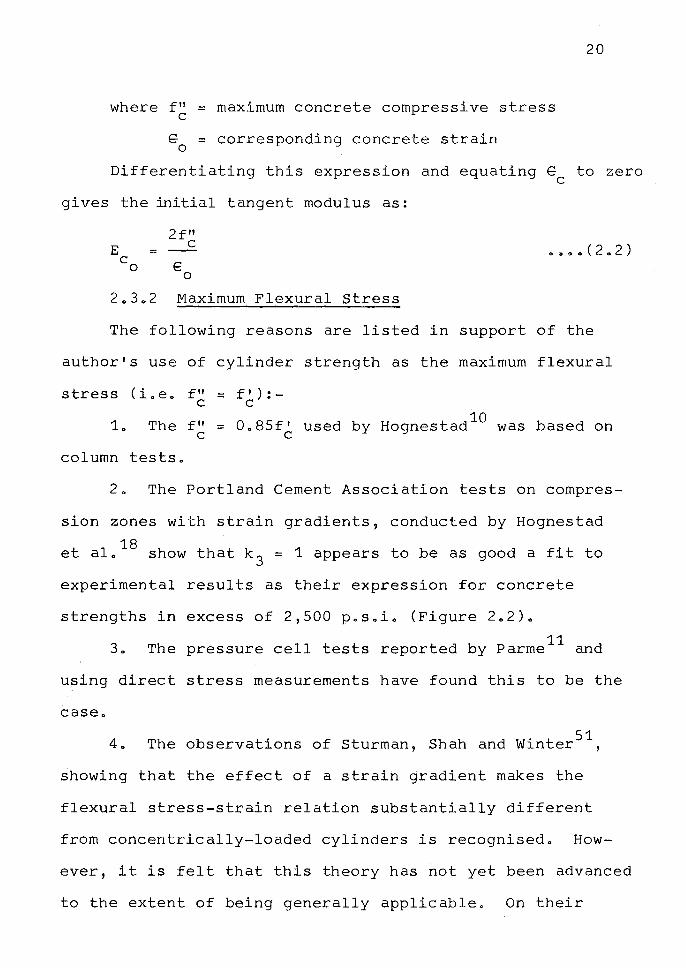
where f" = maximum concrete compressive stress C
E = corresponding concrete strain 0
20
Differentiating this expression and equating E to zero C
gives the initial tangent modulus as:
2f11 C
E 0
2o3.2 Maximum Flexural Stress
a ~ ~ o ( 2 a 2 )
The following reasons are listed in support of the
author's use of cylinder strength as the maximum flexural
stress (i.eo flt = f I ) : -
1o
C C
The f" C
10 = 0o85f' used by Hognestad was based on
C
column tests.
2. The Portland Cement Association tests on compres
sion zones with strain gradients, conducted by Hognestad
18 et alo show that k 3 = 1 appears to be as good a fit to
experimental results as their expression for concrete
strengths in excess of 2,500 p.s.io (Figure 2.2).
3. 11 The pressure cell tests reported by Parme and
using direct stress measurements have found this to be the
case.
4. The observations of Sturman, Shah and Winter51 ,
showing that the effect of a strain gradient makes the
flexural stress-strain relation substantially different
from concentrically-loaded cylinders is recognised. How
ever, it is felt that this theory has not yet been advanced
to the extent of being generally applicable. On their
findings, use of the cylinder strength as the maximum
flexural stress is a conservative assumption"
2.3.3 Strain at Maximum Stress
21
The strain,€ , corresponding to maximum stress, is 0
taken as a constant value" The tests on concrete cylinders
in the present investigation did not find a consistent
15 dependence on cylinder strength as observed by Lee :
but found€ = 00002 to be a safe limiting value. 0
2. 3. 4 "Falling'' Branch Behaviour
It is in this region of the stress-strain curve that
mathematical expressions are lacking. Various investig-
t 16,23,27,34,39,40,51 h d f t' f a ors ave propose unc ions or a
continuous stress-strain curve from zero load, through
maximum stress, to ultimate failure, but in most cases, this
advantage is outweighed by the complex expressions resulting
from integration. Furthermore, as shown later in this
chapter, such expressions cannot be easily modified for the
increase in ductility arising from lateral confinement.
Figure 2.7 shows that the falling branch has been
idealised as a linear ~elationship. This approximation has
a negligible effect on moment-curvature response as has been
shown by other investigators5 , 9 , 10 , 12 , 13 , 35 , 36 , 43 , 44 In
order to determine the falling branch characteristics the
results of other investigators will be used.
22
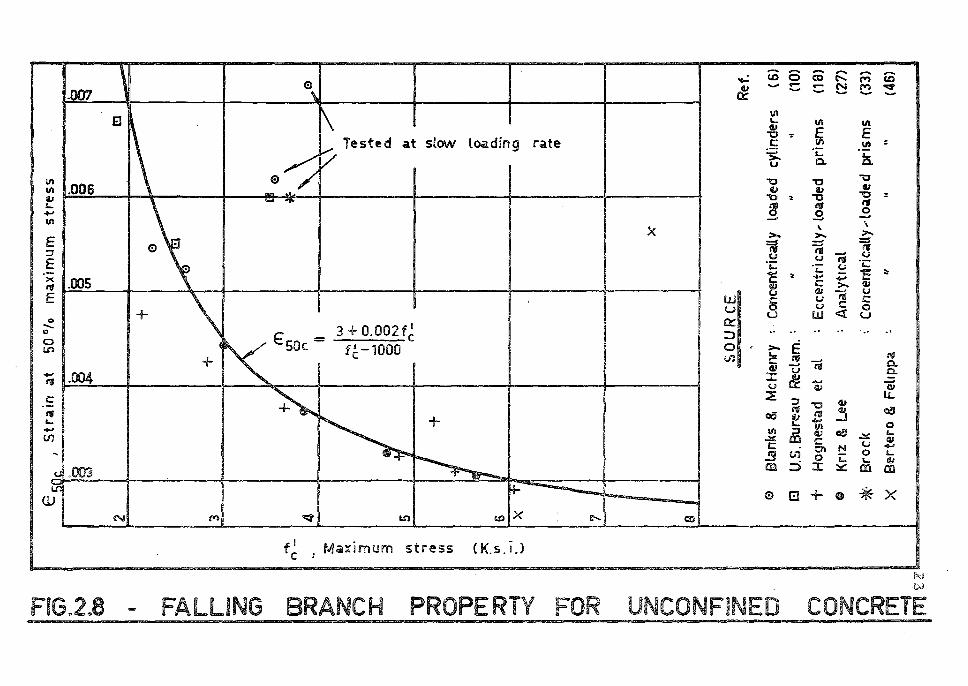
Figure 208 shows a plot of experimental results with
maximum stress, f', and the strain at 50 per cent maximum C
stress on the falling branch comparedo It can be seen that
f ·ct 1 ct· t th . t 1 . t 6,10,18,27, or rapi oa ing ra es, e experimen a poin s
33 , 45 plotted on this graph conform quite closely to the
expression: ~ /-
3 + OoOO~f~)/ = ~)
fl - 1QQQ C
RUsch 28 has shown that as the rate of straining is
decreased, an increase in €Soc is obtainedo
The implications of this relationship are that a truly
generalised dimensionless plot of (f /f') versus E cannot C C C
be achieved because the higher strength concretes have
considerably lower values for €SOc' ioe., they are more
brittle, and the falling branch then has a steeper average
slopeo It would appear then, that the ductility of concrete
depends significantly on the strength of the concrete
itselfo The neglect of this factor was probably responsible
for the discrepancies in results obtained by Roy and Sozen45
and by Bertero and Fellipa46 , since concrete strengths were
considerably higher in Bertero and Felippas' testso
2.3o5 Spalling Strain
It seems that the strain at which spalling of concrete
commences depends mainly on the strain gradient over the
cross-sectiono A wide variety of spalling strains has been
""" - G) . "' 0 m
~
r r - z G> lD
Al
)>
z n :c .,, ;;o
0 '1J rn
::0
""""4 -< .,, 0 ::0
C: z n 0 z al - z n,
CJ,
n 0 z n ;o
n,
....... rn sc
::
.... n-
~ ~
/1J
K 3 c:: 3 VI
rt- ., 111
Ill
VI ......
?- 1/1 _,
'-'
Ei:
;1 ~
, S
trai
n
at
500/
o m
ax·1
mum
str
ess
§ 8
8 0
~ 0
.I),,.
(,
fl
en
2 [l
J -
+ ~
V
+_
/ '3
K
[~
0
y rn
U
'1
,~, \ 0
4 n
0 II
la,,'
'\_\
/ w
.....
+
-I
,, .
~
lo
Ill
.... _.
0
" 0 0
0 C
l. 0
N
5 -
" n
-.... Il
l +
[ ,- 2
6 a.
5·
X
t-
\Q ., /1J
,-+
111
7
X
8
SO
UR
CE
Ref
. '
0 B
lank
s &
M
cHen
ry
: C
on
cmtr
ic~
y lo
aded
cy
lind
ers
(
6)
0 U
.S. B
urea
.u
Rec
lam
. :
., ,,
., (1
0)
+
Hog
nest
ad
et
al
: E
ccen
tric
ally
,. lo
aded
pr
ism
s (1
8)
• K
riz
& L
ee
: A
naly
tical
(2
7)
* B
rock
:
Con
cent
rica
lly.,.
load
ed p
rism
s (3
3)
X
Ber
tero
& F
elrp
pa.
: II
II
..
(46
)
24
observed and this thesis assumes a value of€ = .004 as er
being conservative in most caseso
2.4 FACTORS INFLUENCING INCREASED DUCTILITY FOR CONFINED
CONCRETE IN COMPRESSION
It is evident that lateral reinforcement has a bene
ficial effect on the stress-strain response of concrete and
results in a reduced slope for the falling branch of the
stress-strain curve. There is considerabl~ speculation
regarding the question of an increase in maximum compressive
stress due to binders, and experimental work reported'to
date17 , 45 , 52 , 64 produces conflicting results.
Sozen45 did not observe any maximum strength
t t 1 b . d b t others17 , 46 have. o rec angu ar in ers u
Roy and
increase due
There is,
however, little doubt that circular spiral binders are more
efficient than conventional rectangular stirrups or ties,
and the more efficient restraint to radial stresses
intuitively supports this observation,
This thesis assumes that lateral binding steel has no
effect on the rising portion of the stress-strain curve or
on the maximum stress. Brock 33 has shown (Figure 2.9) that
Poisson's ratio for concrete remains reasonably constant up
to about 90 per cent of the maximum stress (the "Critical"
stress) and it is therefore contended that lateral strains
are minimal in this region. Base and Read 52 have also
stated this and it appears that most investigators
0
I s l: 8 -.s
.... ~
~ .
Q
... -
G? &.
r 0
.. s
s ~
~
~
"' Q
"5-
IC
,;;
! t -0
0 Of3D
}I s,tlOSSfO
d ,...
0
l"'4
01 I
0 ~
u, b$ .lad Cf1 puosno11.1. '.ssaus 0
%'.>soa,,ac, awn101i
25 w
>
a:: ::, u z <
{ a:: .... U
l \
Ul
Ul
llJ a:: tu
,
~
u 0 0:: en
en N
lti LL
26
implicitly accept that the ascending portion of the curve
is unaffected by lateral steelo For this reason the author
feels that the triaxial stress tests on concrete performed ~ ~
by Richart et alo~,L which used a fluid pressure loading are
not strictly comparable with the confining effect provided
by lateral confining steel; this latter confinement being
the result of passive pressure at advanced longitudinal
strainso The experiments of Richart et alo 1 , 2 utilised
active pressure which were applied before the commencement
of longitudinal deformation. It can be argued that in the
limiting case, this active pressure is analogous to the
constant confinement afforded by stirrups or ties at yield,
but since it is not yet clear when, in the concrete stress
strain history, the confining steel yields, this approach,
and mathematical expressions resulting from it29 are, in
the writer's opinion, open to serious criticism. The work
of Balmer7 supports this view to some extent.
The question of whether or not the stirrups or ties
do yield is an interesting one. Frequently they do not and
in such cases a smaller binding steel percentage should
produce an identical concrete stress-strain response.
Future research aimed at an expression for concrete ductil
ity predictions will need to consider the consequences of
this.
Conventional rectangular stirrups or ties are the only
type of lateral reinforcement studied in this thesis.
27
The following variables are relevant when considering fall
ing branch behaviour of the stress-strain curve for concrete
confined in this way:-
1" Diameter of lateral reinforcement, D",
2a Spacing of lateral reinforcement, s,
3a Number of stirrups or ties at one point, NT'
4a Relationship between stirrup or tie spacing
and minimum dimension of confined core, B,
Sa Strength of concrete itself,
6a Strain gradient over section and adjacent to it,
7a Longitudinal reinforcement,
8a Rate of loading,
9a Stress in lateral reinforcement"
The first two variables are usually considered by using
the simple binding steel ratio:
p" = A" s
o 2(b"+d")
b"d"S
where A"= area of stirrup or tie s
b" = width of confined core
d" = depth of confined corea
o o a o ( 2 a 5 )
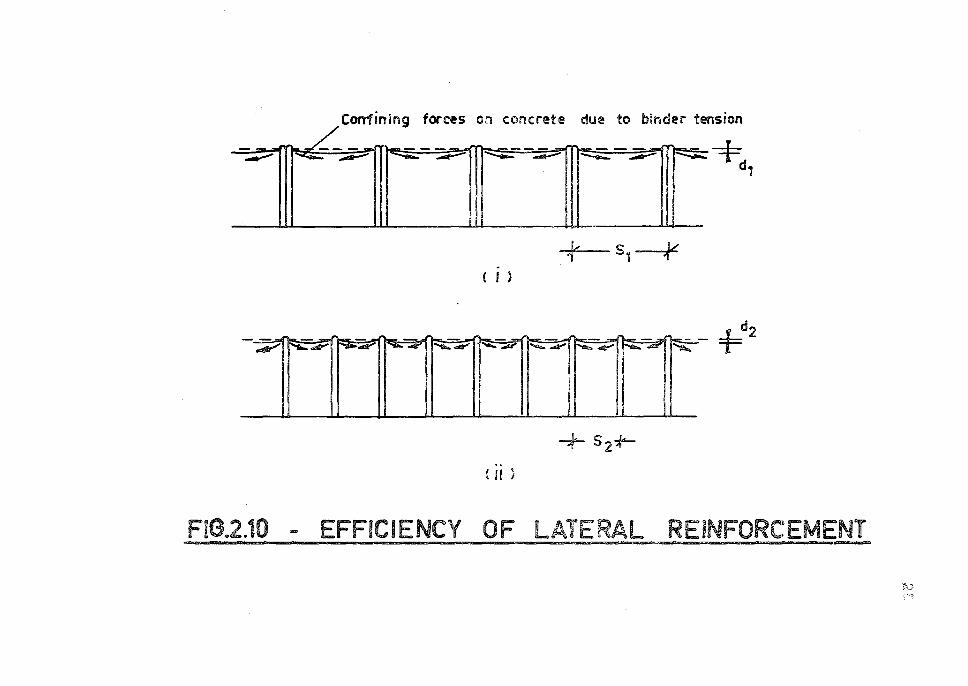
The importance of the third and fourth variables may be
illustrated with Figures 2a10(i) and 2a10(ii)o Figure 2a1~D
shows an elevation of a beam with pairs of stirrups at s1
centresa Figure 2a10(ii) ~hows an elevation of a beam with
identical b", d" and pt1 such that s 2 = ½ s 1 " It is evident
that the confinement of concrete between the stirrups relies
Confining forces on concrete due to binder tension
t s, ~ . { I )
+ 52¼-
C II }
FIG .. 2.10 ... EFFICIENCY OF LATERAL REINFORCEMENT
i'.'"'0
29
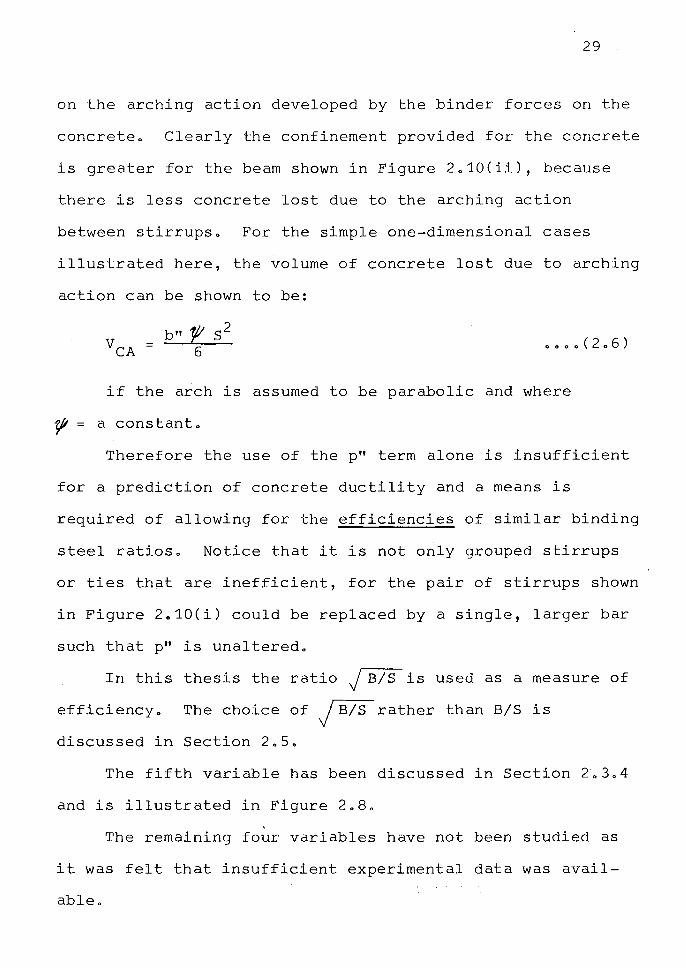
on the arching action developed by the binder forces on the
concrete. Clearly the confinement provided for the concrete
is greater for the beam shown in Figure 2.10(ii), because
there is less concrete lost due to the arching action
between stirrups. For the simple one-dimensional cases
illustrated here, the volume of concrete lost due to arching
action can be shown to be:
b" f s2
VCA = 6 0 0 0 0 ( 2 0 6 )
if the arch is assumed to be parabolic and where
¥1 = a constant.
Therefore the use of the p" term alone is insufficient
for a prediction of concrete ductility and a means is
required of allowing for the efficiencies of similar binding
steel ratios. Notice that it is not only grouped stirrups
or ties that are inefficient, for the pair of stirrups shown
in Figure 2.10(i) could be replaced by a single, larger bar
such that p" is unaltered.
In this thesis the ratio J B/S is used as a measure of
efficiency. The choice of Frather than B/S is
discussed in Section 2.5.
The fifth variable has been discussed in Section 2.3.4
and is illustrated in Figure 2.8.
The remaining four variables have not been studied as
it was felt that insufficient experimental data was avail
able.
30
0th ' t' t 42 , 55 h 'd d th t . er inves iga ors ave consi ere es rain
gradient over and adjacent to the section in expressions
for ultimate concrete strain. Similarly, expressions
exist 32 that take longitudinal reinforcement into account.
There appears to be nothing in the literature indicating a
study of stresses in the lateral reinforcement of beams
although pilot tests on spacing and size of column ties
30 have been reported •
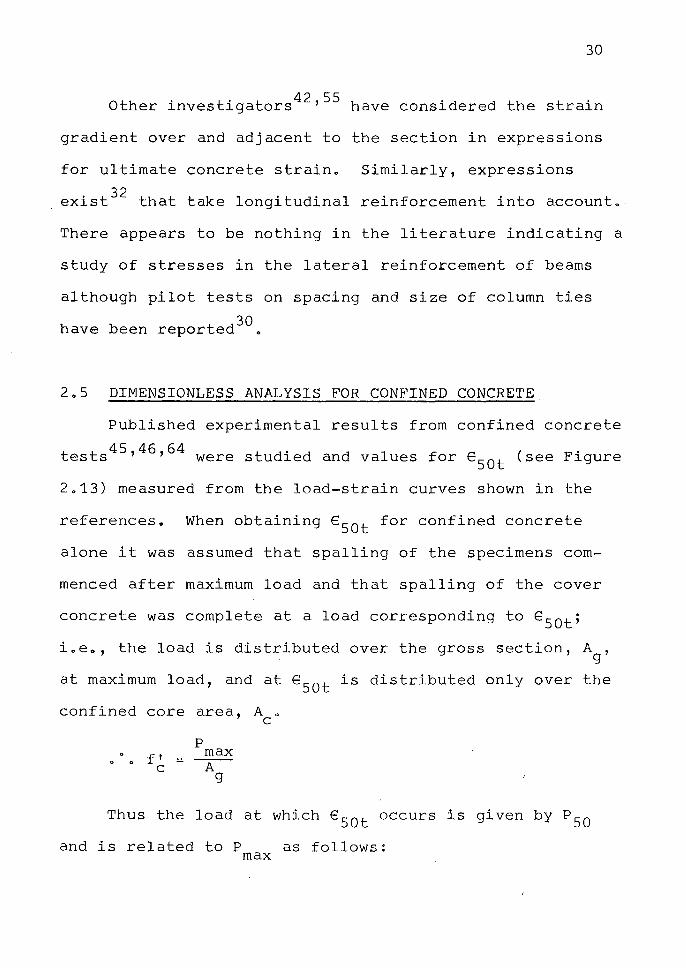
2.5 DIMENSIONLESS ANALYSIS FOR CONFINED CONCRETE
Published experimental results from confined concrete
45 46 64 . tests ' ' were studied and values for e50 t (see Figure
2.13) measured from the load-strain curves shown in the
references. When obtaining €Sot for confined concrete
alone it was assumed that spalling of the specimens com
menced after maximum load and that spalling of the cover
concrete was complete at a load corresponding to e50t;
i.e., the load is distributed over the gross section, A, g
at maximum load, and at e50
t is distributed only over the
confined core area,
f' = C
p max A g
A • C
Thus the load at which €sot occurs is given by P50
and is related to P as follows: max
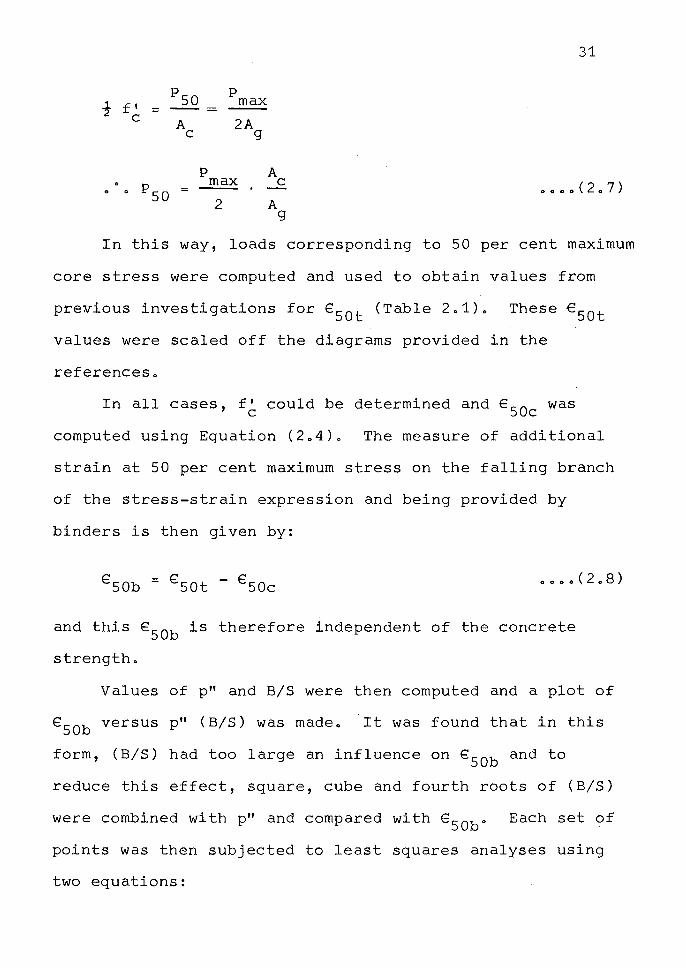
31
Pso p 1 f' max 2 = --=
C A 2A C g
p A
Pso max C
0 0 0 0 ( 2 0 7 ) C C = 2 A
g
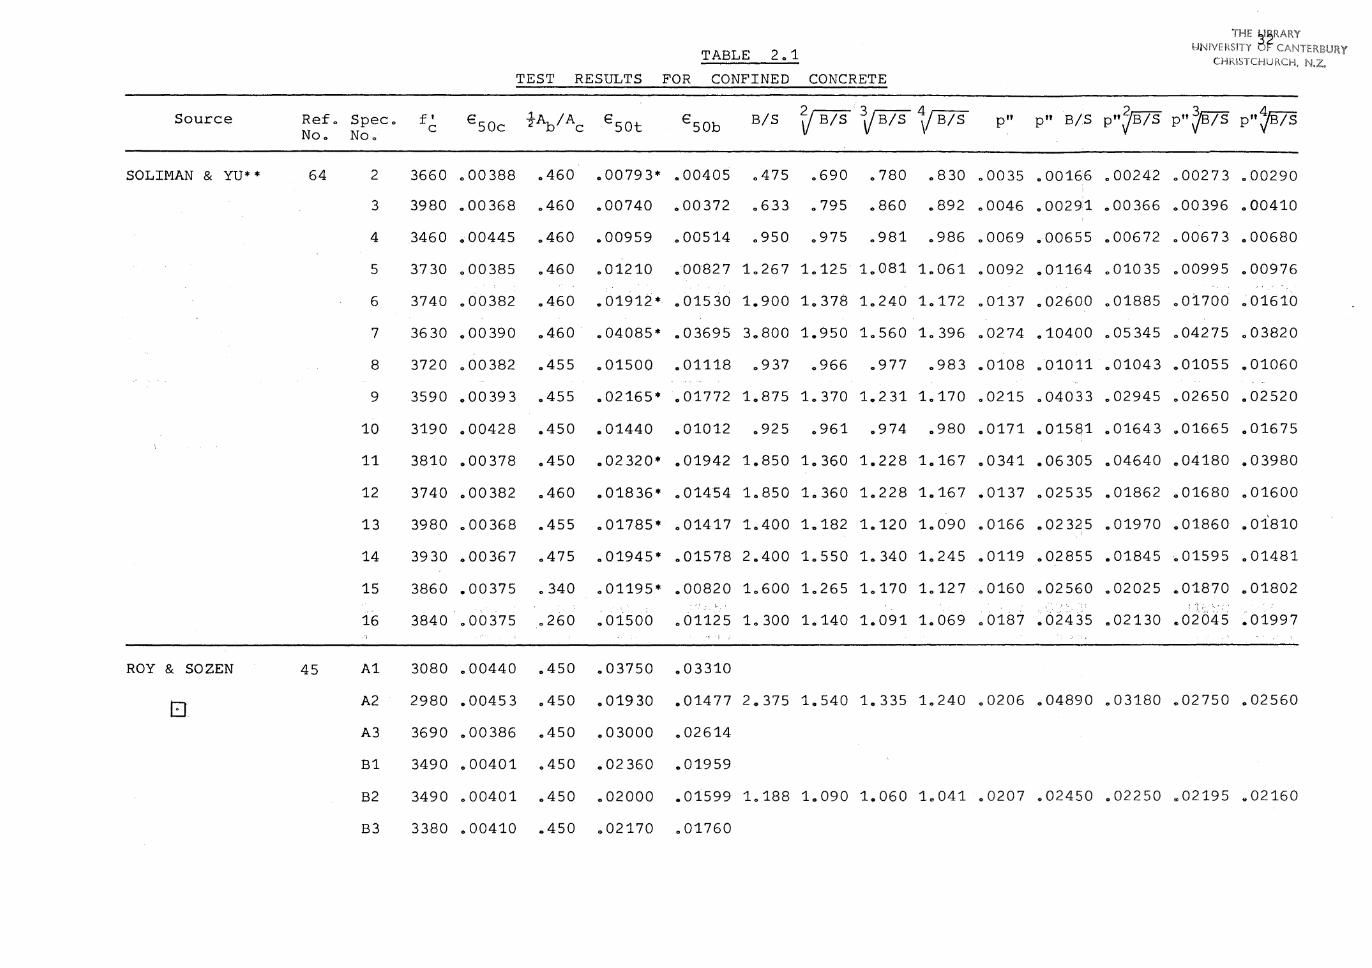
In this way, loads corresponding to 50 per cent maximum
core stress were computed and used to obtain values from
previous investigations for ESOt (Table 2o1). These €Sot
values were scaled off the diagrams provided in the
references.
In all cases, f~ could be determined and ESOc was
computed using Equation (2o4)o The measure of additional
strain at 50 per cent maximum stress on the falling branch
of the stress-strain expression and being provided by
binders is then given by:
ESOb = ESOt - ESOc 0000(2.8)
and this ESOb is therefore independent of the concrete
strengtho
Values of p" and B/S were then computed and a plot of
ESOb versus p" (B/S) was madeo It was found that in this
form, (B/S) had too large an influence on ESOb and to
reduce this effect, square, cube and fourth roots of (B/S)
were combined with p" and compared with e50bo Each set of
points was then subjected to least squares analyses using
two equations:
THE ~l(RARY
TABLE 2o1 l'JNIVERSITY -> CANTERBIJRY CHRISTCHURCH,
TEST RESULTS FOR CONFINED CONCRETE
Source Refo Speco f' €soc ½Ab/Ac €sot €50b B/S 'fl BIS VB/S ~/ B/S p" p" B/S P"jB/S p" JBIS p";jBIS Noo Noo C
SOLIMAN & YU** 64 2 3660 000388 0460 000793* 000405 0475 0690 0780 0 830 00035 000166 000242 000273 000290
3 3980 000368 0460 000740 000372 0633 0795 0860 0892 00046 000291 000366 000396 000410
4 3460 000445 0460 000959 000514 0950 0975 0981 0986 00069 000655 000672 000673 000680
5 3730 000385 0460 001210 000827 10267 10125 10081 10061 00092 .01164 0 010 35 000995 000976
6 3740 000382 0460 001912* 001530 1.900 1.378 10240 10172 00137 .02600 001885 .01700 001610
7 3630 0 00 390 0460 004085* 003695 3.800 1.950 1.560 10396 00274 010400 0 05 345 .04275 003820
8 3720 000382 0455 001500 001118 0937 0966 0977 0983 .0108 001011 001043 001055 .01060
9 3590 0 00 39 3 0455 002165* 001772 10875 10370 1 0 2 31 1.170 00215 004033 .02945 002650 .02520
10 3190 000428 .450 .01440 001012 0925 0961 0974 .980 00171 .01581 001643 .. 01665 001675
11 3810 .00378 0450 002320* .01942 1.850 10360 1.228 10167 00341 • 06 305 .04640 .. 04180 .03980
12 3740 .00382 0460 .01836* 001454 1.850 10360 10228 1.167 00137 002535 .01862 .01680 001600
13 3980 000368 .455 .01785* 001417 10400 1 .. 182 10120 10090 00166 .02325 001970 001860 .01810
14 3930 0 00 36 7 0475 001945* 001578 2.400 10550 10340 10245 00119 002855 .01845 001595 001481
15 3860 .00375 0 340 001195* .00820 10600 10265 1.170 1.127 00160 002560 ,.02025 .. 01870 .01802
16 3840 000375 .260 .01500 001125 10300 10140 10091 1.069 00187 .02435 0 02130 .. 02.645 .01997
ROY & SOZEN 45 A1 3080 000440 0450 .03750 .03310
D A2 2980 .00453 .450 0 019 30 .01477 2.375 1.540 10335 1.240 00206 004890 003180 002750 002560
A3 3690 000386 0450 003000 002614
B1 3490 000401 0450 0 02 360 001959
B2 3490 000401 0450 002000 .01599 10188 1.090 1.060 10041 00207 002450 .02250 m02195 .. 02160
B3 3380 .00410 .. 450 .. 02170 001760
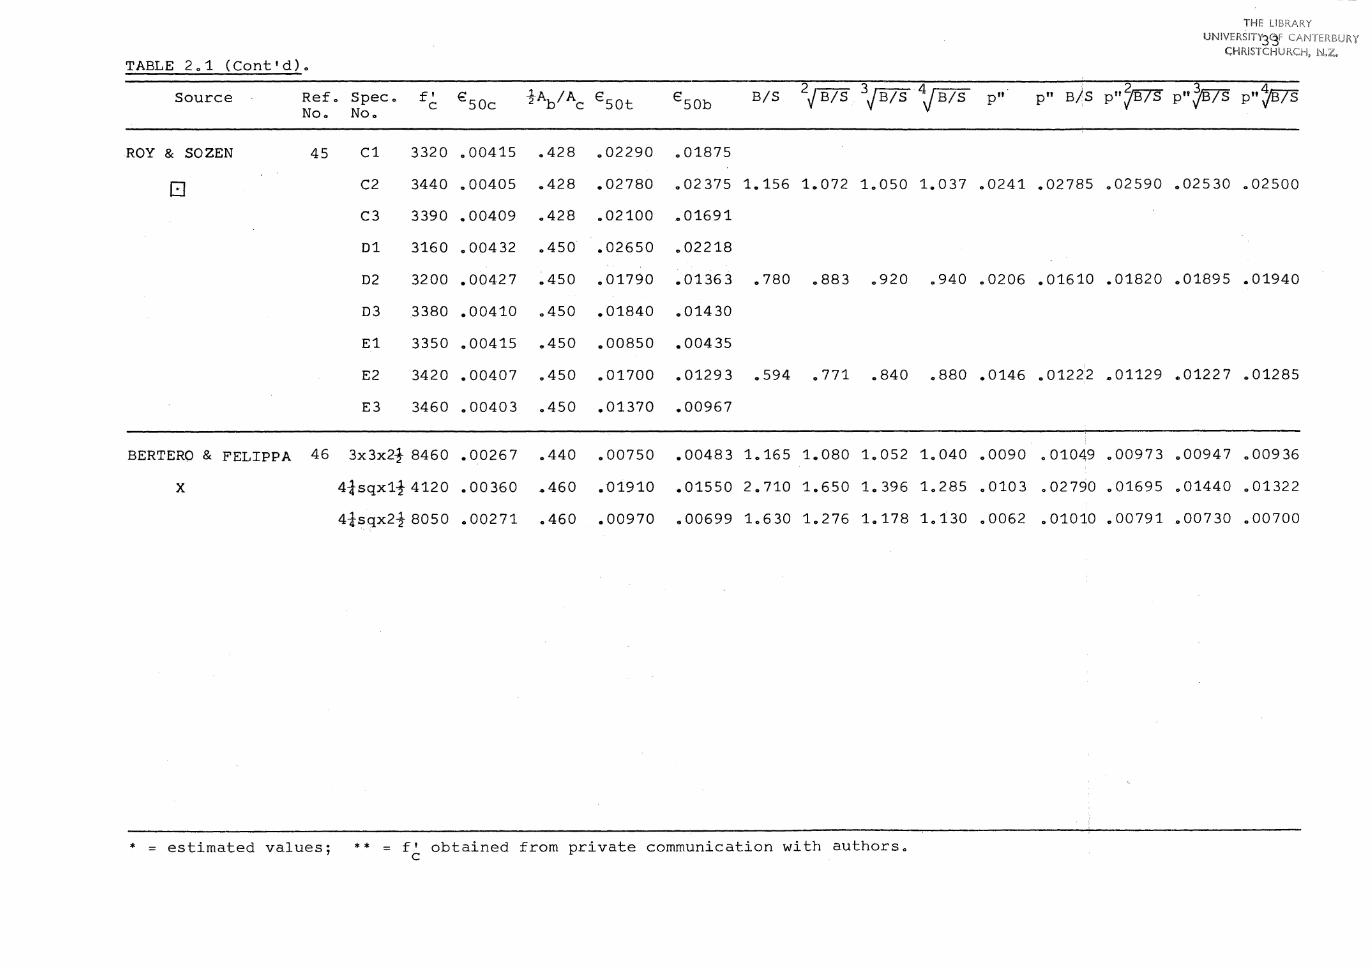
TABLE 2 o 1 (Cont 1 d)o
Source Refo Noo
ROY & SOZEN 45
EJ
BERTERO & FELIPPA 46
X
* = estimated values;
Speco f' €50c ½Ab/Ac €sot €50b B/S 2J B/S 3JB!S J B/S Noo
C
C1 3320 000415 0428 002290 001875
C2 3440 000405 .428 .02780 .02375 1.156 1.072 10050
C3 3390 .00409 .428 .02100 .01691
D1 3160 0 00432 .450 .02650 .02218
D2 3200 .00427 .450 .01790 • 0136 3 .780 .883 .920
D3 3380 .00410 .450 .01840 .01430
E1 3350 .00415 .450 .00850 .00435
E2 3420 .00407 .450 .01700 0 0129 3 .594 .771 .840
E3 3460 .00403 .450 .01370 .00967
3x3x2-½ 8460 .00267 .440 .00750 .00483 1.165 1.080 1.052
4¾sqx1-½ 4120 .00360 .460 • 01910 .01550 2.710 1.650 1., 396
4¾sqx2-½ 8050 .,00271 .460 .00970 .00699 1. 630 1.276 1.178
** = f' obtained from private communication with authorso C
1.037
.940
.880
1.040
1.285
1.130
THE LIBRARY
p" p" B)S p"~B/S p"JB?S p"~/S
00241 .02785 002590 .02530 .02500
.0206 .01610 .01820 .01895 .01940
.0146 .01222 ,.01129 e01227 .01285
.0090 0 01049 .00973 .00947 0 009 36
.0103 0 02 790 .01695 .01440 .01322
00062 0 01010 .00791 .00730 000700
34
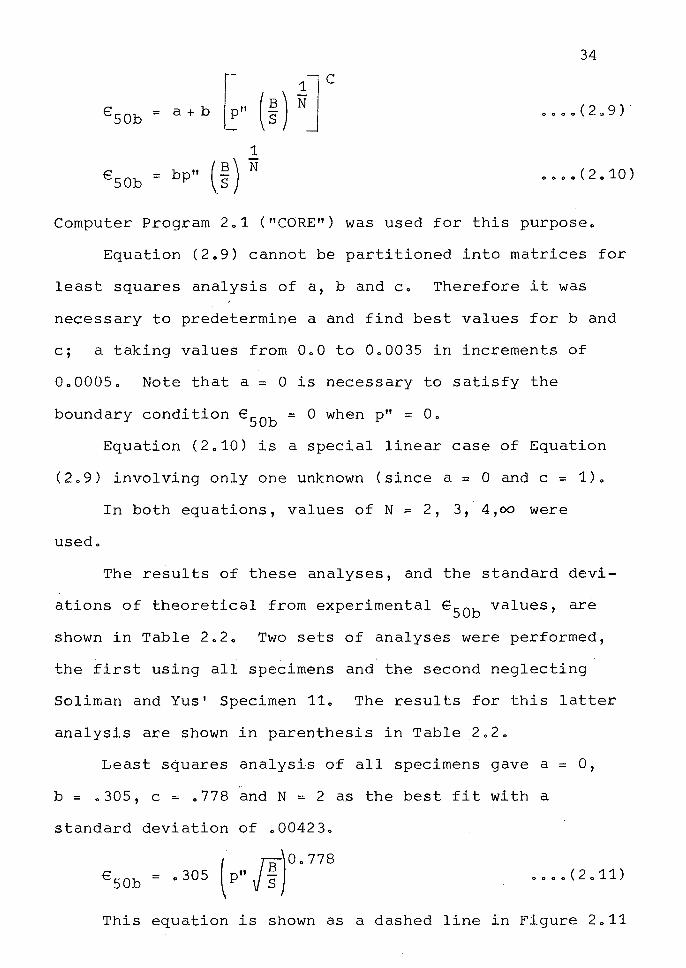
1
€ = bp" 50b (SB) N •••• ( 2 0 10)
Computer Program 2.1 ("CORE") was used for this purpose.
Equation (2.9) cannot be partitioned into matrices for
least squares analysis of a, band c. Therefore it was
necessary to predetermine a and find best values for band
c; a taking values from 0.0 to 0.0035 in increments of
0.0005. Note that a= 0 is necessary to satisfy the
boundary condition e50b = 0 when p" = O.
Equation (2.10) is a special linear case of Equation
(2.9) involving only one unknown (since a= 0 and c = 1).
In both equations, values of N = 2, 3, 4,oo were
used.
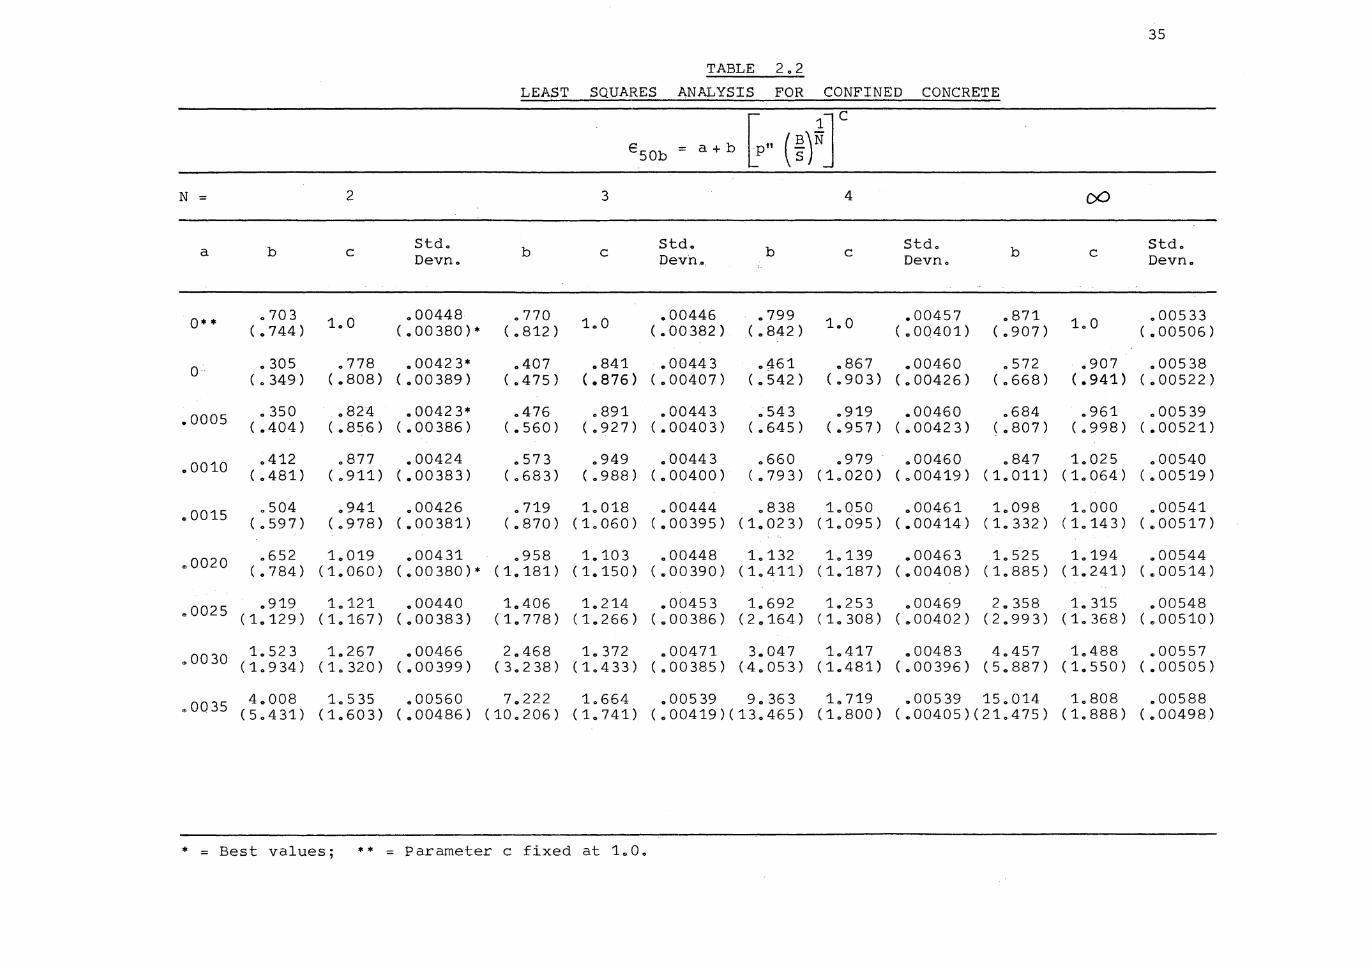
The results of these analyses, and the standard devi
ations of theoretical from experimental e50b values, are
shown in Table 2.2. Two sets of analyses were performed,
the first using all specimens and the second neglecting
Soliman and Yus' Specimen 11. The results for this latter
analysis are shown in parenthesis in Table 2.2.
Least squares analysis of all specimens gave a = 0, "
b = .305, c = .778 and N = 2 as the best fit with a
standard deviation of .00423.
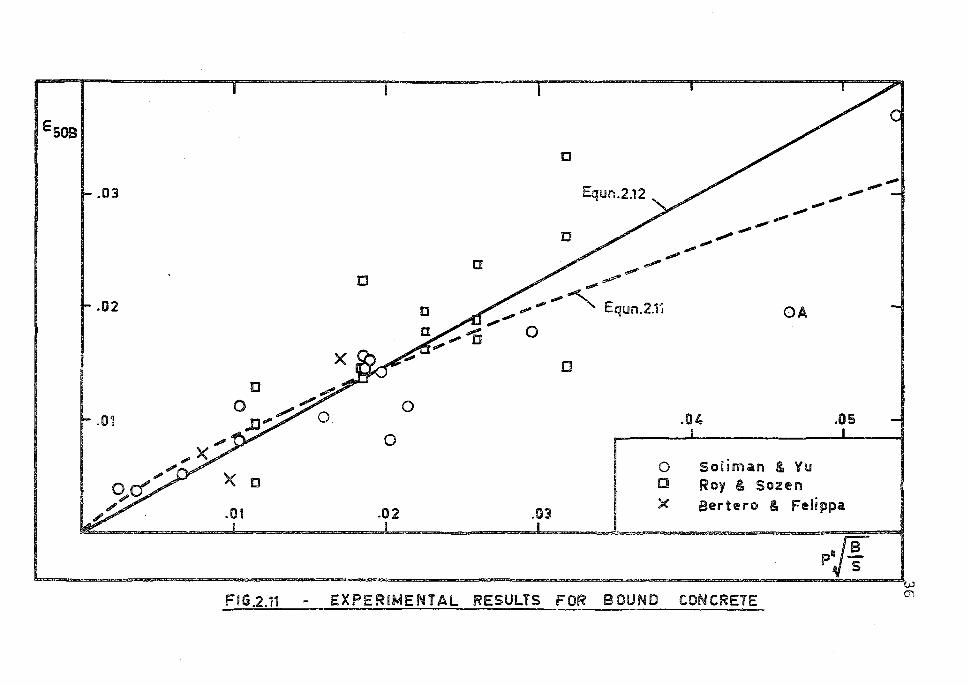
This equation is shown as a dashed line in Figure 2.11
35
TABLE 2.2
LEAST SQUARES ANALYSIS FOR CONFINED CONCRETE
6S0b = a+b ~ .. (:iT N = 2 3 4 00
b Stdo b Std. b Std. b Std. a C Devn. C Devh., C Devn. C Devn •
o•• .703 1.0 .00448 .770 1.0 • 00446 .799 1.0 .00457 .871 1.0 .00533 (.744) (.00380)• (. 812) (.00382) (. 842) (.00401) (.907) (.00506)
O-· 0 305 .778 • Q042 3• .407 .841 .00443 .~61 .867 .00460 .572 .907 .00538 (. 349) (.808) (.00389) (.475) (.876) (.00407) (.542) ( 0 90 3) (.00426) ( 0 668) (.941) (.00522)
.0005 0 350 .824 • 0042 3• .476 .891 .00443 .543 0 919 .00460 .684 .961 .00539 (.404) (.856) ( .00386) (.560) (.927) C.00403) (.645) (.957) ( .00423) (.807) (.998) (.00521)
.0010 .412 .877 .00424 .573 .949 .00443 .660 .979 · .00460 .847 1.025 .00540 (.481) (.911) (.00383) (.683) (.988) (.00400) ( • 79 3) (1.020) (.00419) (1.011) (1.064) (.00519)
.0015 .504 .941 .00426 .719 1.018 .00444 .838 1.050 .00461 1.098 1.000 .00541 (.597) (.978) (.00381) ( .870) (1.060) ( .00395) (1.023) (1.095) (.00414) (1.332) (1.143) (.00517)
.0020 .652 1.019 .,00431 .958 1.103 .00448 1.132 1.139 .00463 1.525 1.194 .00544 ( 0 784) (1.060) (.00380)* (1.181) ( 1.150) (.00390) (1.411) (1.187) (.00408) (1.885) (1.241) (.00514)
.0025 .919 1.121 .00440 1.406 1.214 .00453 1.692 1.253 .00469 2.358 1.315 .00548 (1.129) (1.167) (.00383) (1.778) (1.266) (.00386) (2.164) (1.308) (.00402) (2.993) (1.368) (.00510)
.0030 1.523 1.267 .00466 2.468 1.372 .00471 3.047 1.417 .00483 4.457 1 .. 488 .00557 ( 1. 9 34) (1.320) (.00399) ( 3. 2 38) (1.433) (.00385) (4.053) (1.481) (.00396) (5.887) (1.550) (.00505)
.. 0035 4.008 1. 5 35 .00560 7.222 1.664 • 005 39 9. 363 1 .. 719 .00539 15.014 1.808 .00588 (5.431) (1.603) (.00486) (10.206) (1.741) (.00419)(13.465) (1.800) (.00405)(21.475) (1.888) (.00498)
•=Best values; **=Parameter c fixed at 1s0.
36
\ \ \ \ \
i.n
,~ 0
\
. "'
<Ct
0.
\
a.
0
::, ·-
\
>
C
._, ai
LL
\
GO N
0
fiO
\
c: U
l ...
0
\
E oa
I..
·-&
I
\
->
, ... 0
0 ...
~
ti) 0:
GI
0
en
\ \ ..... ..-
.,... N
N
\ c
0 CJ X
C
\ :,
:, tr
C
w
z: ::> 0 m
Jr
CJ '(
a
\ •
\ \ 0
"" 0
\ \ \Cl \
C
tJ \
0 0
N
0
C
w
37
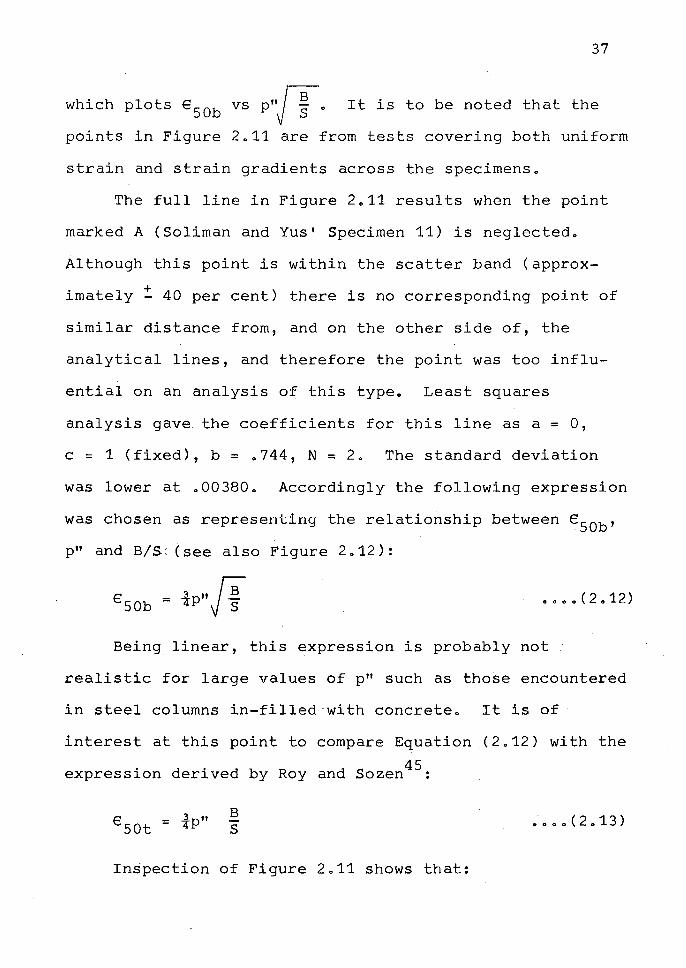
which plots e 50b vs p"/ ~ o It is to be noted that the
points in Figure 2o11 are from tests covering both uniform
strain and strain gradients across the specimenso
The full line in Figure 2o11 results when the point
marked A (Soliman and Yus' Specimen 11) is neglectedo
Although this point is within the scatter band (approx-
+ imately - 40 per cent) there is no corresponding point of
similar distance from, and on the other side of, the
analytical lines, and therefore the point was too influ
ential on an analysis of this typeo Least squares
analysis gave the coefficients for this line as a= O,
c = 1 (fixed), b = 0744, N = 2o The standard deviation
was lower at 0003800 Accordingly the following expression
was chosen as representing the relationship between eSOb'
p" and B/S: (see also Figure 2a12):
0000(2012)
Being linear, this expression is probably not
realistic for large values of p" such as those encountered
in steel columns in-filled·with concreteo It is of
interest at this point to compare Equation (2o12) with the
45 expression derived by Roy and Sozen :
€ - 3P" sot - 4 B s
Inspection of Figure 2o11 shows that:
0000(2013)
_ _l,,("i 6 50b - sP VS
38
0000(2014)
produced a line above which all experimental points
lie and therefore Equation (2o14) would be suitable for
design purposeso
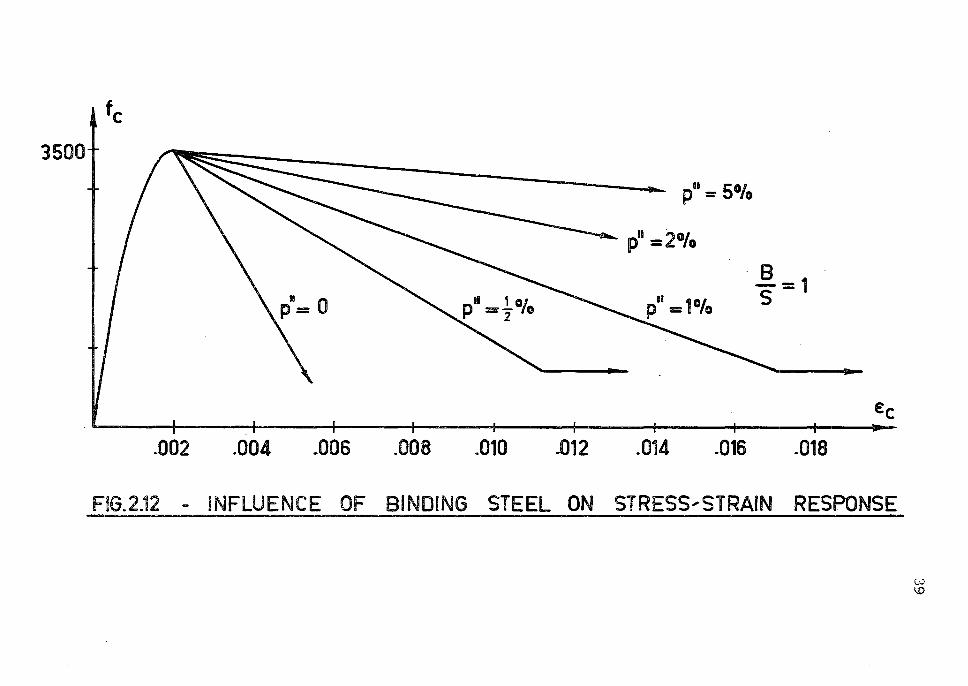
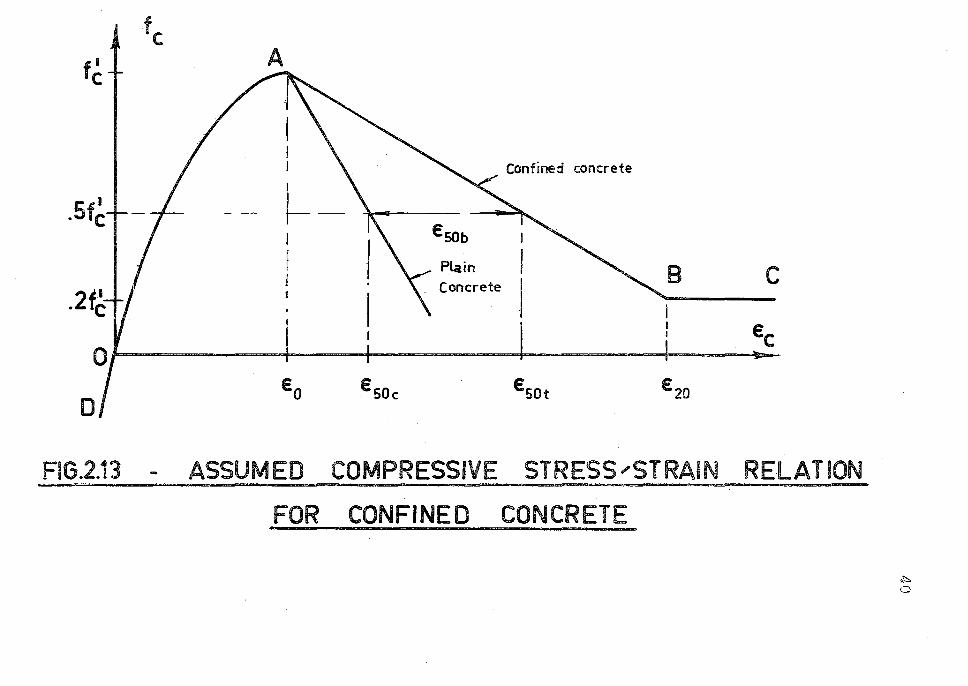
206 PROPOSED STRESS-STRAIN RELATION FOR CONCRETE
The proposed stress-strain relationship for concrete
is illustrated in Figure 2o13o
20601 Tension Stress-Strain Curve (OD of Figure 2013)
A linear response for concrete in tension is assumed.
The maximum tensile stress is termed the Modulus of Rup
ture and an expression for this has been proposed by
Warwaruk 59 as:
1000 f' C
4000+f' C
0 0 0 0 ( 2 0 15)
In the course of the author's tests ori concrete
prisms, it was found that this expression was conservative
and the following equation resulted in a better fit:
1400 f' C
4000+f' C
0 0 0 0 ( 2 0 16 )
Traditionally, the modulus of rupture is given by the
product of a constant and the square root of the cylinder
strength, but Equation (2o15) has considerable experimental
supporto It would appear that aggregate size and local
conditions, particularly curing 7 have a greater effect on
3500
fc
.002 .004 .006 .008 .010 .012
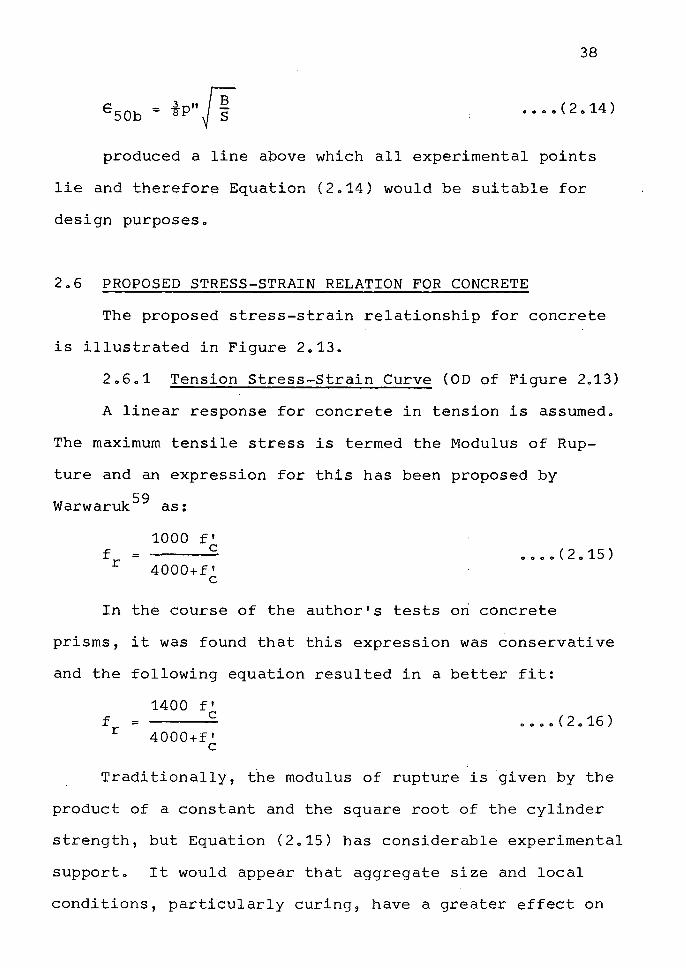
P11 = 5°/o
'?11 =2°/o
.014 .016
8 s=1
Ee
.018
FIG.2.12 - INFLUENCE OF BINDING STEEL ON STRESS,STRAIN RESPONSE
w '°
fc
f~
.5t~+-f-
o·
FIG.2.13 -
A '.'.---
Confined concrete ' "-_I'
- - i----~\ Esob I
! 1 \--- Plain I
" B C I _. __ --- - L_ I J
I \ I I I
Ee + l=t
Eo Esoc Esot £20
ASSUMED COMPRESSIVE STRESS ... STRAIN RELATION
FOR CONFINED CONCRETE
~ 0
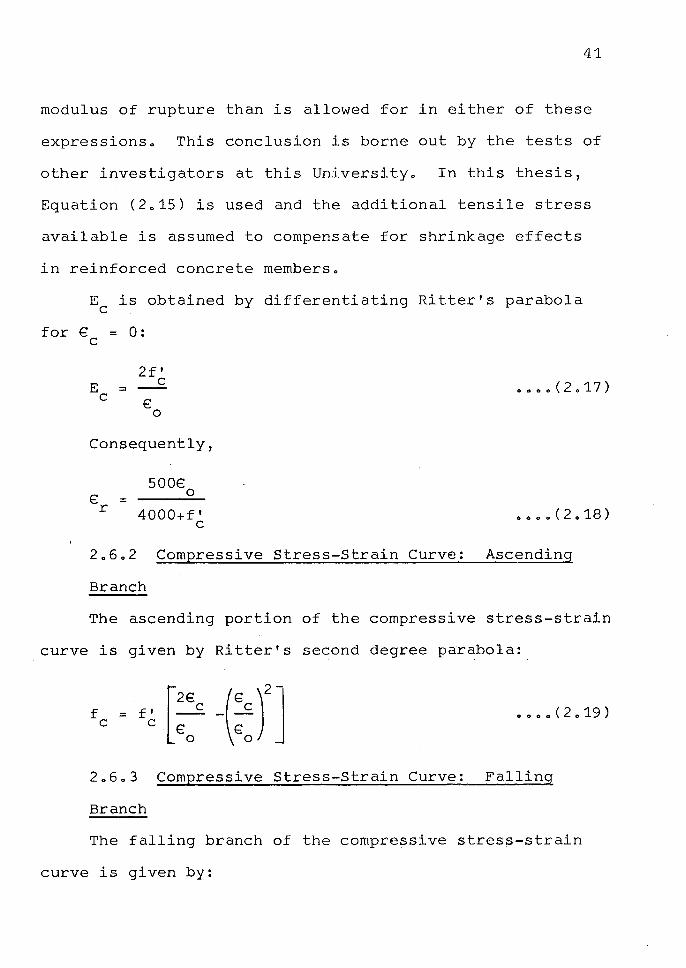
41
modulus of rupture than is allowed for in either of these
expressionso This conclusion is borne out by the tests of
other investigators at this Universityo In this thesis,
Equation (2o15) is used and the additional tensile stress
available is assumed to compensate for shrinkage effects
in reinforced concrete memberso
E is obtained by differentiating Ritter's parabola C
for€ = 0: C
E = C
2f' C
€ 0
Consequently,
500€ 0
4OOO+f' C
Compressive Stress-Strain Curve:
Branch
0 0 0 0 ( 2 0 1 7 )
Ascending
The ascending portion of the compressive stress-strain
curve is given by Ritter's second degree parabola:
20603 Compressive Stress-Strain Curve: Falling
Branch
The falling branch of the compressive stress-strain
curve is given by:
42
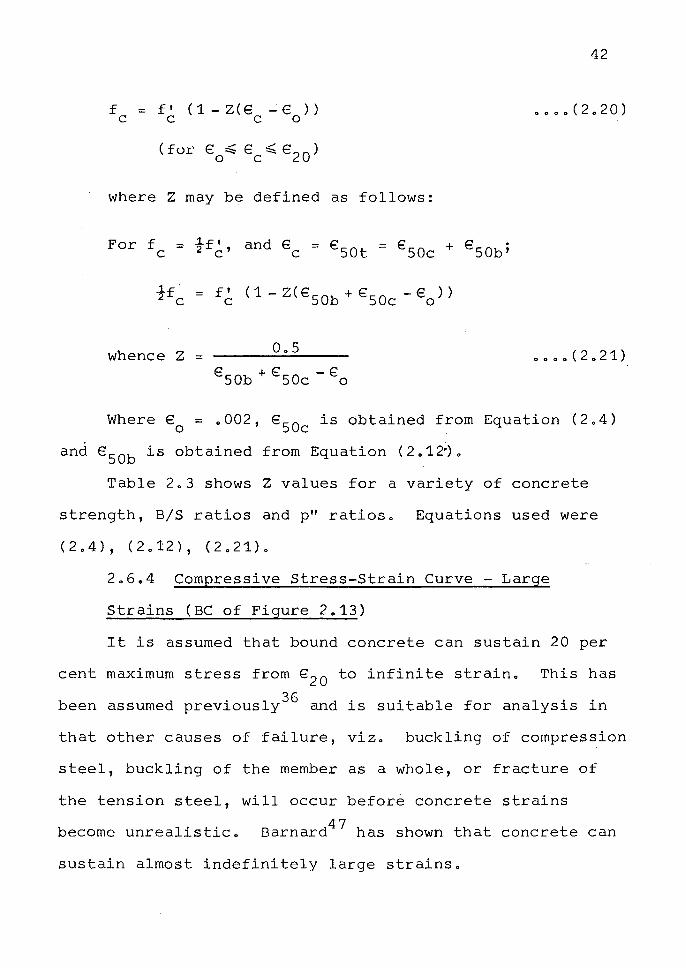
f = f' (1-Z(€ -€ )) C C C 0
•••• ( 2 0 20)
where Z may be defined as follows:
For f = .1.f' C 2 c'
whence Z = 0.5 •••• (2.21)
Where €0
= .002, e50c is obtained from Equation (2.4)
and €SOb is obtained from Equation ( 2 .12•).
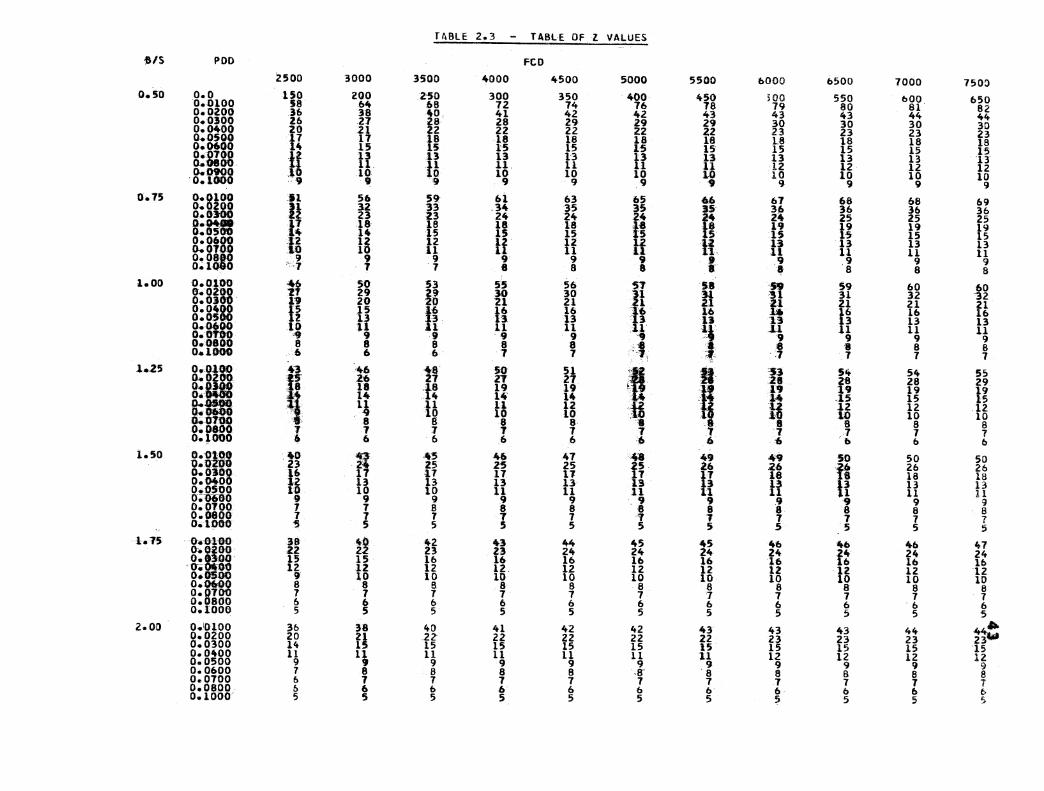
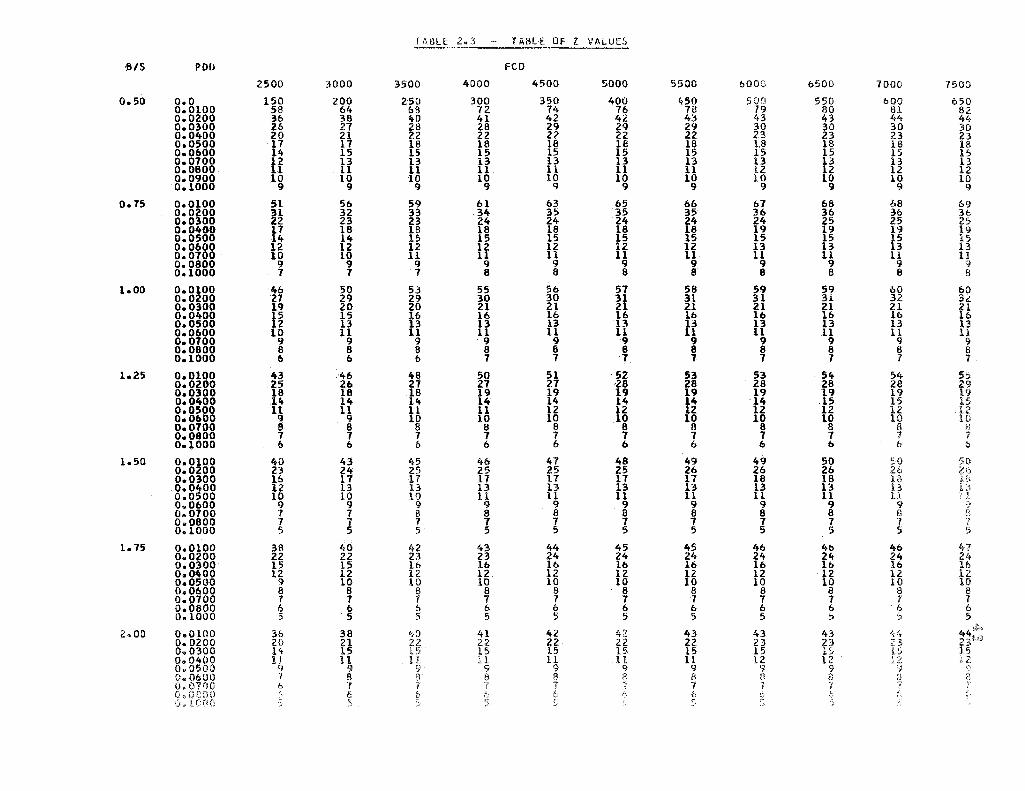
Table 2.3 shows Z values for a variety of concrete
strength, B/S ratios and p" ratios. Equations used were
(2.4), (2.12), (2.21).
2.6.4 Compressive Stress-Strain Curve - Large
Strains (BC of Figure 2.13)
It is assumed that bound concrete can sustain 20 per
cent maximum stress from e20
to infinite strain. This has
been assumed previously36 and is suitable for analysis in
that other causes of failure, viz. buckling of compression
steel, buckling of the member as a whole, or fracture of
the tension steel, will occur before concrete strains
become unrealistic. Barnard47 has shown that concrete can
sustain almost indefinitely large strains.
flHlU: 2-.3 - TABLE OF l VALUES
~/S POD FCD
2500 3000 3500 4000 4500 5000 5500 6000 0500 7000 750:)
0.50 o.o 150 200 250 300 350 400 450 500 550 bOO b50 0.0100 58 64 bB 72 74 76 7B- 79 60 81 82 0.0200 36 38 40 41 42 42 43 43 43 44 44 0.0300 26 27 28 28 29 29 29 30 30 30 30 0.0400 20 21 22 22 22 22 22 23 23 23 23 0.0500 -17 17 18 18 18 18 18 1.8 18 18 18 0.0600 14 15 15 15 15 15 15 15 15 15 15 0.0100 H 13 13 13 13 13 13 13 13 13 13 o.oeoo . 11 11 11. 11 11 11 12 12 12 12 0.0900 10 10 10 10 10 10 10 10 10 10 10 0.1000 9 9 9 9 9 9 9 9 9 9 9
0.15 0.0100 51 56 59 bl 63 65 66 67 68 68 69 0.0200 31 32 33 .34 35 35 35 36 36 36 36 0.0300 22 23 23 24 24 24 24 24 25 25 25 o.01too 17 18 18 18 18 18 18 19 19 19 19 0.0500 14 14 15 15 15 15 15 15 15 15 15 0.0600 12 12 12 12 12 12 12 13 13 13 13 0.0100 10 10 11 11 11 11 11. 11 11 11 11 o.oaoo 9 9 9 9 9 9 9 9 9 9 9 0.1000 7 7 7 8 8 8 8 8 8 8 8
1.00 0.0100 · 46 50 53 55 56 57 58 59 59 60 60 0.0200 27 29 29 30 30 31 31 31 31 32 32 0.0300 19 20 20 21 21 21 21 21 21 21 21 0.0400 B 15 u 16 16 16 lb lb 16 lb 16 0.0500 H 13 13 13 13 13 13 13 13 0.0600 10 11 11 11 11 11 11 11 11 11 o. 0700 9 9 9 9 9 9 9 9 9 9 t} o.oaoo 8 8 8 8 8 8 8 8 8 8 8 0.1000 6 b 6 1 7 7 1 7 7 1 7
1.25 0.0100 43 46 48 50 51 52 53 53 54 54 55 0.0200 ZS 26 21 27 27 28 28 28 28 28 29 0.0300 18 18 18 19 19 '19 19 19 19 19 19 o.01too 14 14 14 14 14 14 · l~ 14 15 15 15 0.0500 11 11 11 11 12 12 12 12 12 i2 0.0600 9 9 10 10 10 .10 10 10 10 10 10 o. 0700 e 8 8 8 8 8 8 8 8 8 l:l o.osoo 7 7 7 7 7 1 7. 7 7 7 7' 0.1000 6 6 6 6 6 . 6 6 6 6 b (,
1.so 0.0100 40 43 45 46 47 48 49 49 50 50 5() 0.0200 23 24 25 25 25 25 26 26 26 26 ?6 0.0300 16 17 17 17 17 17 17 18 18 Hl l~U 0.0400 12 13 13 13 13 13 13 13 H 13 13 0.0500 10 10 10 11 11 11 11 11 · u ll 0.0600 9 9 9 9 9 9 9 9 9 9 6. o. 0700 1 1 B 8 8 8 8 8 8 8 o.oaoo 7 7 - 1 7 1 1 7 7 7 7 T 0.1000 5 5 5 5 5 5 5 5 5 5 5
1.75 0.0100 38 40 ,~2 43 44 45 45 46 4b 46 47 0.0200 22 22 23 23 24 24 24 24 24 24 24 000300 15 15 16 lb 16 lb 16 16 16 lb lb
·0.0400 12 12 12 12. 12 12 12 12 12 12 12 o.osoo 9 10 10 10 10 10 10 10 10 10 10 0.0600 8 8 8 8 8 8 8 8 8 8 8 0.0100 7 1 1 7 7 7 7 7 7 1 7 o.oaoo 6 6 6 6 6 6 6 6 6 b 6 0.1000 5 5 5 5 5 5 5 5 5 5 5
2.00 0.0100 36 38 •,::) 41 42 42 43 43 43 (~It 44't;, 0.0200 20 21 22 22 22 22 22 23 23 23 z3W 0.0300 14 15 t'> 15 15 15 15 15 15 15 15 0.0400 lJ 11 . 11 H 11 11 11 12 12 12 12 o.osoo 9 9 r; 9 9 9 9 9 9 ') f_)
O.ObOO 7 B 8 8 8 Cr 8 8 8 8 ? ~ n.0100 6 ., ? 7: 7 q 7 ? 1 [ Oi.OP.,[H) ~~ 6 i) f~s 6 t, 6 £
,. (>".tOHO s, ~j ;:, s 5 .. ,
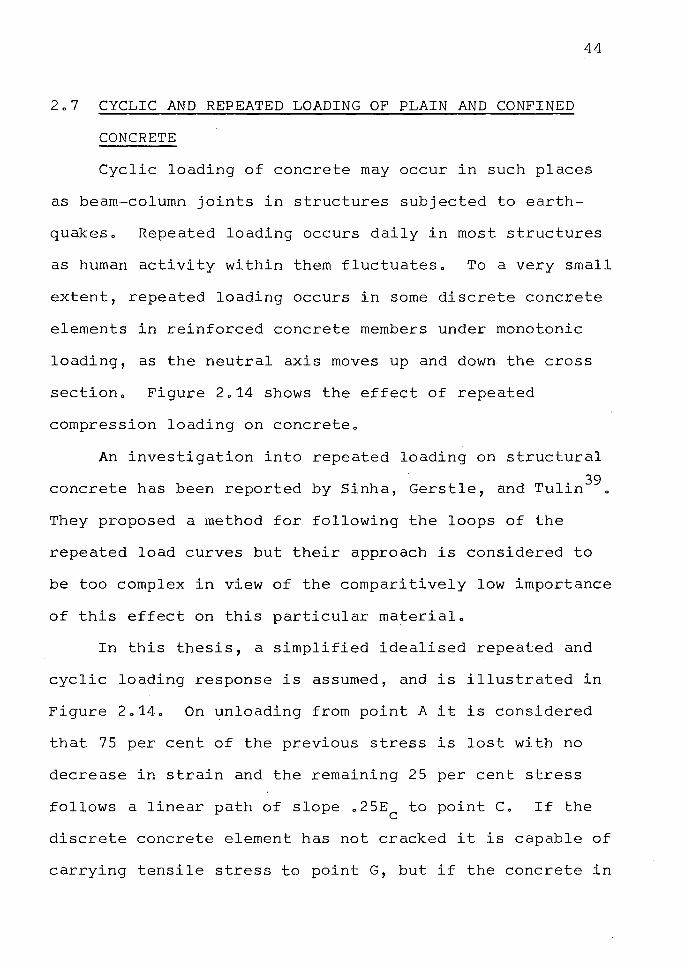
2o7 CYCLIC AND REPEATED LOADING OF PLAIN AND CONFINED
CONCRETE
44
Cyclic loading of concrete may occur in such places
as beam-column joints in structures subjected to earth
quakeso Repeated loading occurs daily in most structures
as human activity within them fluctuates. To a very small
extent, repeated loading occurs in some discrete concrete
elements in reinforced concrete members under monotonic
loading, as the neutral axis moves up and down the cross
section. Figure 2.14 shows the effect of repeated
compression loading on concrete.
An investigation into repeated loading on structural
t h b t db S • h tl d T 1· 39 concre e as een repor e y in a, Gers e, an u in •
They proposed a method for following the loops of the
repeated load curves but their approach is considered to
be too complex in view of the comparitively low importance
of this effect on this particular material.
In this thesis, a simplified idealised repeated and
cyclic loading response is assumed, and is illustrated in
Figure 2.14. On unloading from point A it is considered
that 75 per cent of the previous stress is lost with no
decrease in strain and the remaining 25 per cent stress
follows a linear path of slope .25E to point C. If the C
discrete concrete element has not cracked it is capable of
carrying tensile stress t0 point G, but if the concrete in
f' C
fr
fc
Actual response
Idealised
EJB ~ Ee
-£0 E20 --- - - - --
FIG.2.14 - CYCLIC BEHAVIOUR OF CONCRETE
ec -
,r:,, l,l"l
46
this element has previously cracked, or cracks form during
this unloading stage, then the strain reduces at zero
stress such that strain compatability with surrounding
elements is maintained. On reloading from this state, the
strain must regain the value at C before compressive
stress can be sustained again.
If reloading commences before unloading produces zero
stress, then reloading follows one of the infinite number
of paths bounded by BC and DA, one of which is shown as
ABEFA in Figure 2.14.
It is to be noted that the average slope of the
assumed (trapezoidal) loop between A and C is parallel to
the initial tangent modulus of the stress-strain curve.
It is thought that more complicated idealizations of the
loop are unwarranted.
For the purposes of the analyses presented in sub
sequent chapters of this thesis, it is further assumed
that the behaviour described above is characteristic of
unloading-reloading throughout the entire strain history.
2.8 COMPUTER PROGRAMS
Program 2.1 ("CORE"): This program was used to carry
out the least squares analysis described in Section 2.5.
Program 2.2 ("ZTABLE"): Tables of Z values for
varying concrete strengths and B/S and p" ratios are
produced (see Table 2.3).
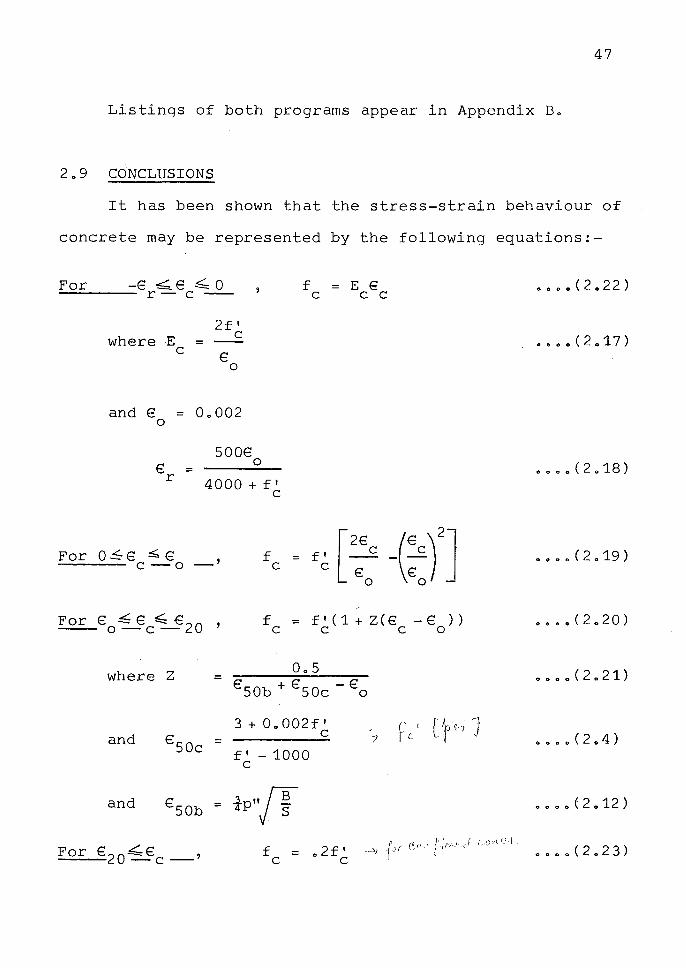
47
Listings of both programs appear in Appendix Bo
2.9 CONCLUSIONS
It has been shown that the stress-strain behaviour of
concrete may be represented by the following equations:-
For -e ~e ~ o ----- r- C
where E C
and € = 0
€ r
For O~E .s. € c-o
=
= 2f'
C
€ 0
0.002
500€ 0
4000 + f' C
_,
f = E E C C C
f =f'(1+Z(€ -€)) C C C 0
where Z
and €50c =
and €50b =
Oo5
3+OoOO2f' C
f' - 1000 C
¾P"/T f
C = 2f' o C
7 f' C Ct Y/ J
0 0 0 0 ( 2 0 22)
0 • • 0 ( 2 • 1 7 )
• 0 0 0 ( 2 0 18)
0 0 0 0 ( 2019)
0 0 0 0 ( 2 0 20)
0 0 0 0 ( 2 0 2 1 )
ooooC2o4)
0 0 0 0 ( 2012)
ooooC2o23)
SUMMARY
CHAPTER 3
STRESS-STRAIN BEHAVIOUR OF
STRUCTURAL-GRADE REINFORCING STEEL
48
The behaviour of reinforcing steel under monotonic,
repeated and cyclic loading is consideredo A modification
to Burns and Seiss• 32 stress-strain expression for the
strain-hardening range is proposed and compared with test
resultsa Tests on cyclically-loaded steel coupons are
described and a theory for the Bauschinger Effect is
presented a
3~1 INTRODUCTION
The stress-strain relation for structural steel
subjected to monotonic loading is well known and easily
defined. The expression, with the notation used in this
thesis, is shown in Figure 3.1. Under repeated loading
of the same sign, the unloading and reloading stress
strain paths closely follow the initial elastic slope and
when the strain regains the value at which unloading com
menced, the stress-strain curve continues as if unloading
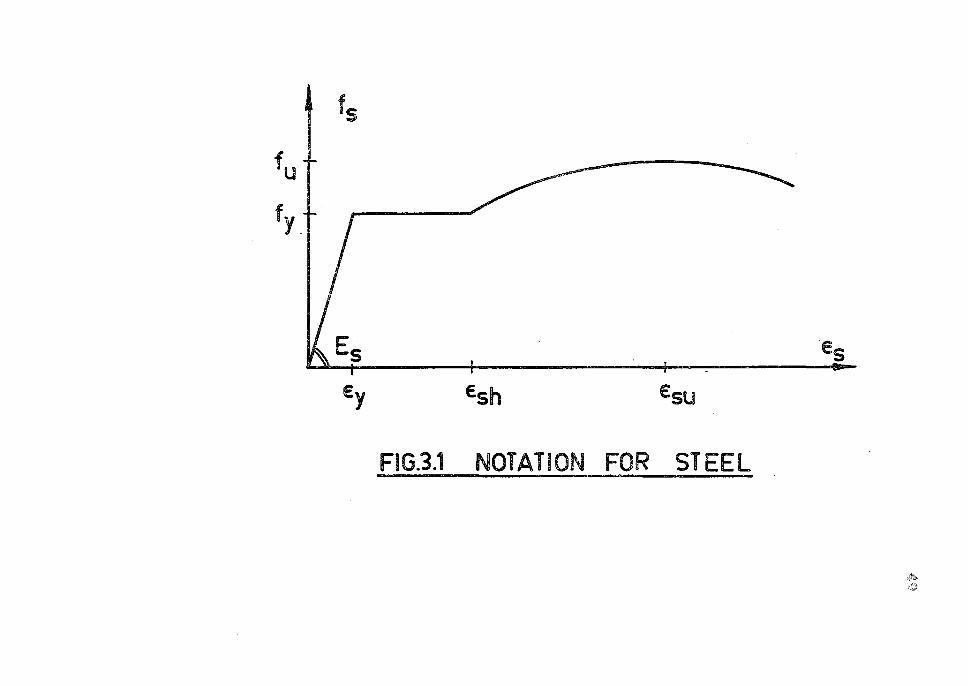
fu
fy
fs
Ey
~
Es
Esh Esu
FIG.3.1 NOTATION FOR STEEL
,§1,
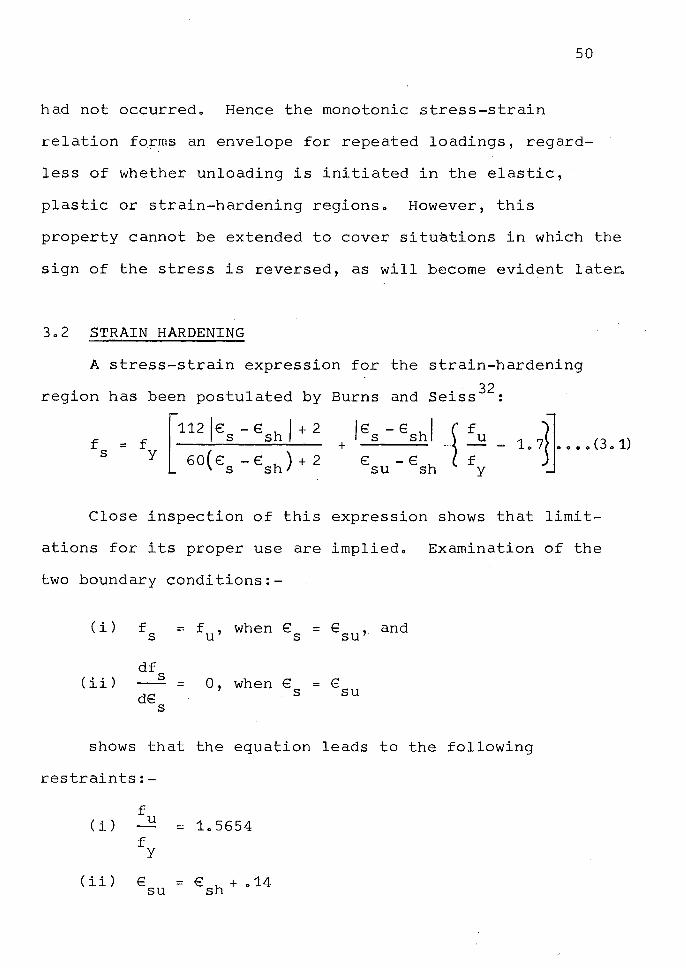
50
had not occurred. Hence the monotonic stress-strain
relation forms an envelope for repeated loadings, regard
less of whether unloading is initiated in the elastic,
plastic or strain-hardening regions. However, this
property cannot be extended to cover situa~ions in which the
sign of the stress is reversed, as will become evident late~
3.2 STRAIN HARDENING
A stress-strain expression for the strain-hardening
. h b t 1 t db B d S · 32 region as een pos u a e y urns an eiss :
f = f [112
l€s - €sh J + 2
l€s - €sh! ~ fu ~~ + --- ... - - 1. 75 0. 0 0 (3.1) s Y 60 ( E:s - €sh) + 2 €su - esh fy
Close inspection of this expression shows that limit
ations for its proper use are implied. Examination of the
two boundary conditions:-
( i ) f = f u' when € = € su' and s s
df (ii) s
0' when € € = = d€ s SU
s
shows that the equation leads to the following
restraints:-
f ( i) u 1.5654 =
f y
(ii) € SU
= €sh+.14
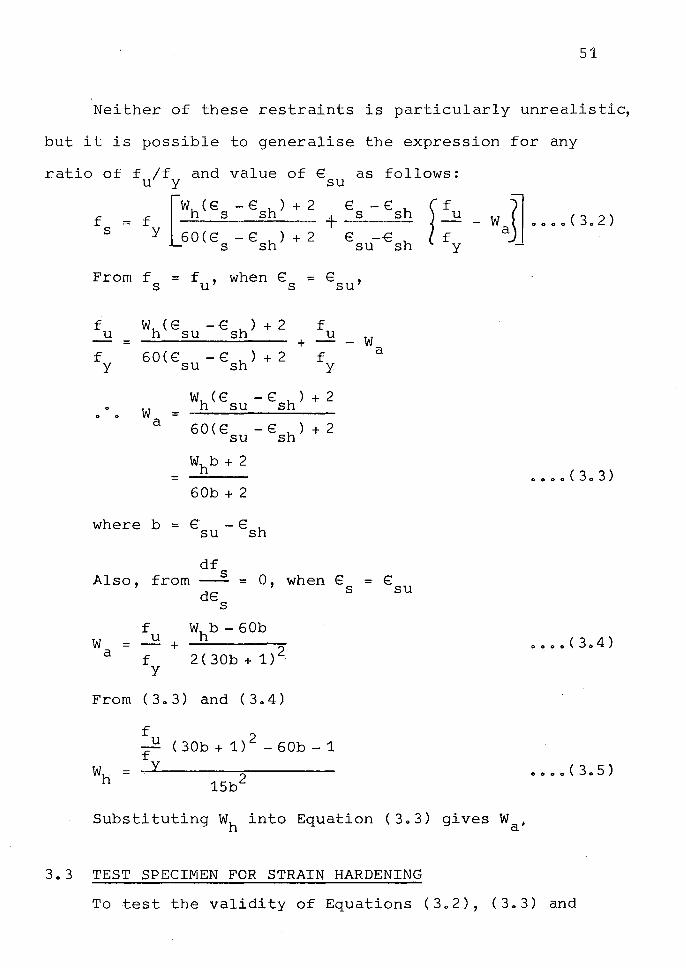
51
Neither of these restraints is particularly unrealistic,
but it is possible to generalise the expression for any
ratio off /f and value of€ U y SU
as follows:
f = f [wh ( Es - €sh) + 2
s y 60(€ -€h)+2 s s
€ -E: if + s sh ~ € -€ f
SU sh y
From f = f , when E: = Esu' s u s
f + 2 f Wh(Esu -€sh) u u - w = +
f 60(€: -€ h) + 2 f y SU S y
w (€ -E: ) + 2 w h su sh
0 0 = a 60(€ -€ h) + 2 SU S
Whb + 2 =
60b + 2
where b = € -E SU sh
Also, from df
s = 0, when E s
w a
f u = - +
f y
dE s
Whb - 60b
2(30b+1) 2
From ( 3 o 3) and ( 3 o 4)
f u f
2 ( 30b + 1) - 60b - 1
a
= € SU
- W a~ •••• ( 3. 2)
0000(303)
Substituting Wh into Equation (3o3) gives Wa•
3o3 TEST SPECIMEN FOR STRAIN HARDENING
To test the validity of Equations (3o2), (3o3) and
52
(3c5) a deformed bar, nominal i" diameter was machined and
tension tested to AoSoToM. specifications A370-61To An
Avery 25,000 lb hydraulic testing machine and an Instron
G-51-14 Strain Gauge extensomet-er 'C:oupled to a Budd Bridge
were usedo Owing to the inherent difficulty in measuring
strain near ultimate with this type of machine, it was
necessary to make an estimate for the ultimate strain.
This appeared to have a value of the order of 0o26. Figure
3.2 shows the experimental values compared with the Burns
and Seiss expression and with the modified expression prop
osed in Section 3o2o The standard deviations for the Burns
and Seiss expression and the modified expression are 3,313
p.s.io and 2,205 posoio respectively. Not too much import
ance should be attached to these values as the standard
deviations include values in the elastic and plastic ranges
and therefore show the Burns and Seiss Expression in a
correspondingly better light. Also, there is a preponder
ance of experimental points near the onset of strain
hardening. Consequently a visual assessment of the two
theories is probably more meaningful.
It is recognised that one specimen alone does not
constitute proof of a better expression. However, good
agreement is obtained in this comparison and it is expected
that the general expression is more accurate than Burns. and
Seiss' expression since account is taken of the actual
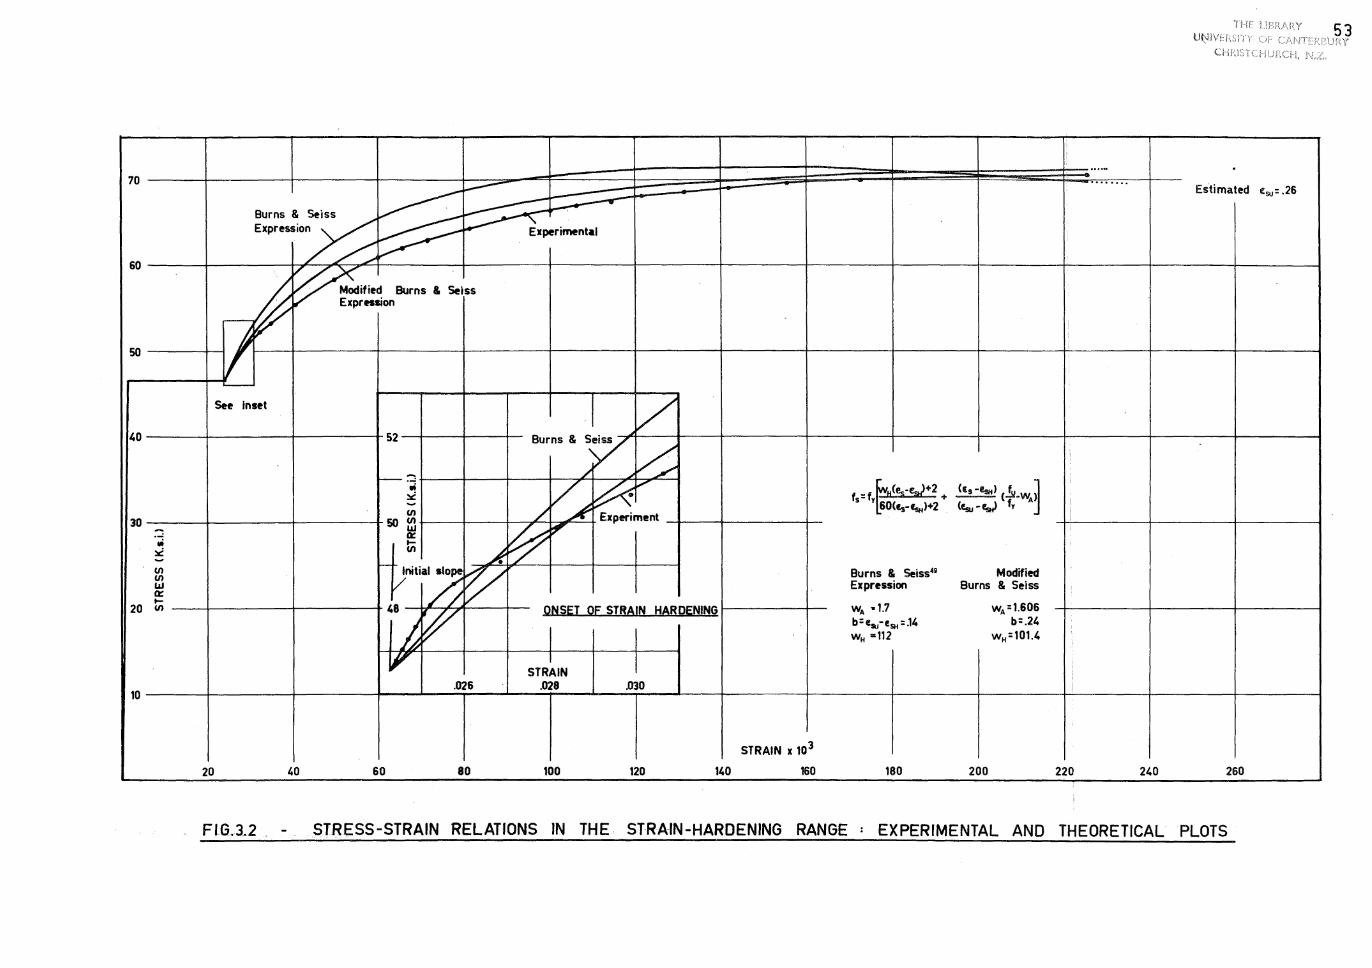
····- . 70 - .........
Estimated
~ ~ IEsu= .26
~ ~ I
Buco,& 0/4 Expression V Experimental
~ 60
-ff ~;,;.. ""'"' & s., .. ression
so ) -
See inset I Av 40 52 Burns & Seiss
./ ~ - A f f-- . ...:
~ ~~ Iii
f5 :fy~(;-e,,J+2 + (ls-~) c!ii-wAj :ii - 60<es-~>+2 <fsu-fsH} fy en / Experiment ' 30 SO en - UJ
~ ~ ' a::
vi I-
:ii en A -en ~ Initial slope
~ Burns & Seiss49 Modified en
V /j Expression Burns & Seiss UJ a:: I-
WA •1.7 WA =1.606 20 en 48 ~ Q~~l;;I QE STRAI~ HARgE;NING
b=l!ai-tSH=.14 b=.24
h I WH =112 WH:101.4 , I STRAIN
.026 .028 .030 i 10
STRAIN x 103
20 40 60 80 100 120 140 160 180 200 220 240 260
FIG.J.2 STRESS-STRAIN RELATIONS IN THE STRAIN-HARDENING RANGE EXPERIMENTAL AND THEORETICAL PLOTS
54
fu/fy ratio and the value of €su
3o4 COMPRESSION STRESS
Most investigators subject their steel coupons to more
convenient tension tests and assume the same response in
compressiono 32 This has been shown to be the case except
that strain-hardening occurs at a lower strain than in the
same specimen subjected to tensiono Whether this behaviour
is a property of compressed steel or is a consequence of
using a necessarily short test coupon is not knowno
However there is one steel characteristic relating to
compression stress that is still not adequately defined and
this is the point of bucklingo The familiar Euler formula,
later modified by Engesser for inelastic materials, can be
stated as
6 2E D2
7f t = 0000(306) er L2
0 0
Et Tangent modulus =
D = Bar diameter
L = Effective length
For steel reinforcement acting as compression steel in
beams a r6ugh estimate of the buckling stress could be
obtained by assuming that the bar is axially loaded, that
it receives no lateral support from the concrete, and that
the effective length is the stirrup spacingo Then L =Sin
Equation (306)0
55
When the compression steel enters the plastic range,
the tangent modulus becomes zero, and therefore so does
the critical stress. However, in the case of reinforced
concrete beams, the steel cannot buckle at the yield point
because the surrounding concrete provides lateral support.
Moreover, when the concrete does spall away, the steel has
followed the curvature of the concrete member and therefore,
in order to buckle, the curvature of the bar must change
sign.
It seems also that at less than a given stirrup spac
ing, compressed steel buckles between alternate stirrups,
laterally displacing the intermediate binder. Other
complications that arise are the pre-loaded curvature of
the steel and the extent to which buckling actually
advances spalling.
Clearly, a theoretical description of this behaviour
would be difficult to evolve and no attempt is made to do I
so here, but the problem is raised because this situation
arises frequently in cyclically-loaded reinforced concrete
beams which often rely on only a steel couple to provide
moment resistance (q.v. Chapter 5).
3.5 PROPERTIES OF BAUSCHINGER EFFECT
Little information is available regarding the behav
iour of reinforcing steel when subjected to alternating
tensile and compressive strains. This condition may occur
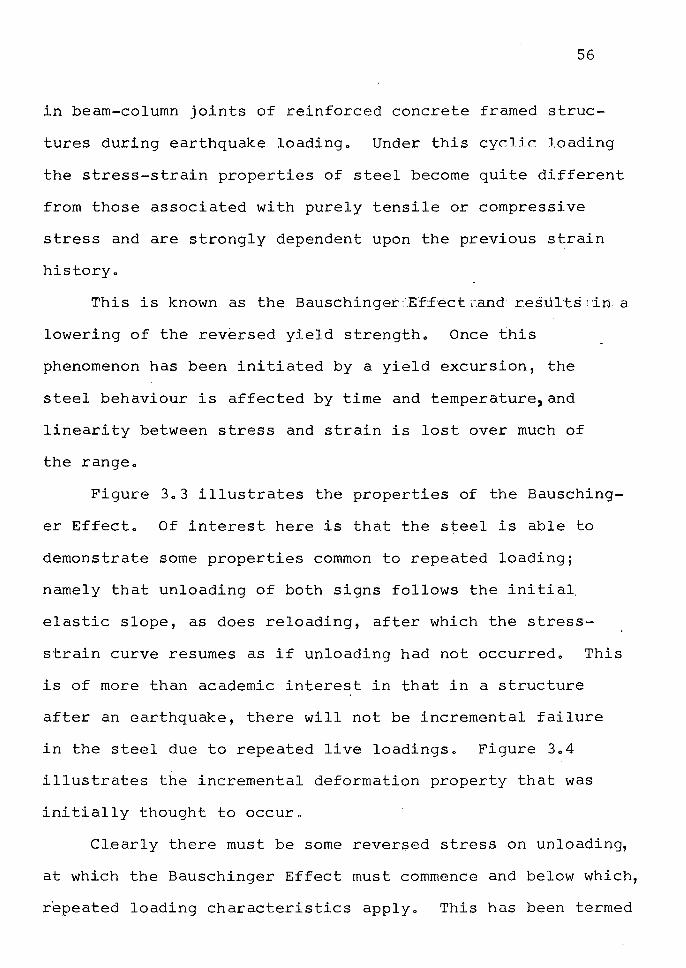
56
in beam-column joints of reinforced concrete framed struc
tures during earthquake loading. Under this cyclic loading
the stress-strain properties of steel become quite different
from those associated with purely tensile or compressive
stress and are strongly dependent upon the previous strain
history.
This is known as the Bauschinger 'K-f£:ect ,~and results 1 in a
lowering of the reversed yield strength. Once this
phenomenon has been initiated by a yield excursion, the
steel behaviour is affected by time and temperature,and
linearity between stress and strain is lost over much of
the range.
Figure 3.3 illustrates the properties of the Bausching
er Effect. Of interest here is that the steel is able to
demonstrate some properties common to repeated loading;
namely that unloading of both signs follows the initial.
elastic slope, as does reloading, after which the stress
strain curve resumes as if unloading had not occurred. This
is of more than academic interest in that in a structure
after an earthquake, there will not be incremental failure
in the steel due to repeated live loadings. Figure 3.4
illustrates the incremental deformation property that was
initially thought to occur.
Clearly there must be some reversed stress on unloading,
at which the Bauschinger Effect must commence and below which,
r·epeated loading characteristics apply. This has been termed
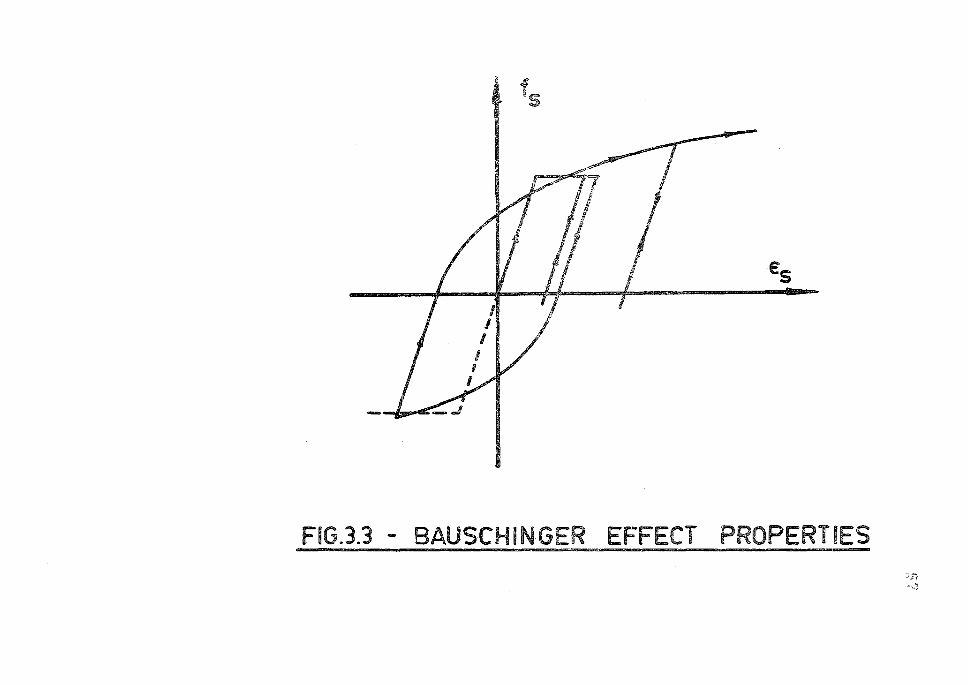
fs
Es
-~
FIG.3.3 - BAUSCHINGER EFFECT PROP1ERTIES
tn ·••~.,,j
fs
£s
FIG.3.4 - STEEL STRESS,STRAIN CURVE SHOWING
POSSIBLE INCREMENTAL DEFORMATION CYCLES
59
the "transition stress" and although in practice a definite
"point" may not exist, some estimate must be made for
theoretical analysiso
306 BAUSCHINGER EXPRESSION OF SINGH, GERSTLE AND TULIN
A preliminary study into this effect has been
conducted by Singh, Gerstle and Tulin49 and they assess the
following as the relevant factors responsible for the dif
ference between the virgin stress-strain curve and that
obtained after previous cycles of inelastic loading:-
1o Virgin properties of the material,
2o Entire previous load history,
3o Rate of straining,
4 .. Elapsed time, or ageing, between cycles,
So Temperatureo
Since the temperature range in Reinforced Concrete
members is not great, this variable was not studied by
Singh et ala 4 9 , and it was found that over the usual range
of test speeds, the rate of straining did not produce a
noticeable effecto
For a detailed account of the work of Singh et alo,
readers are referred to their paper49 but their conclusions
are repeated here for completenesso
It was found that the slope of the curved part of the
reversed stress-strain curve was reduced with larger values
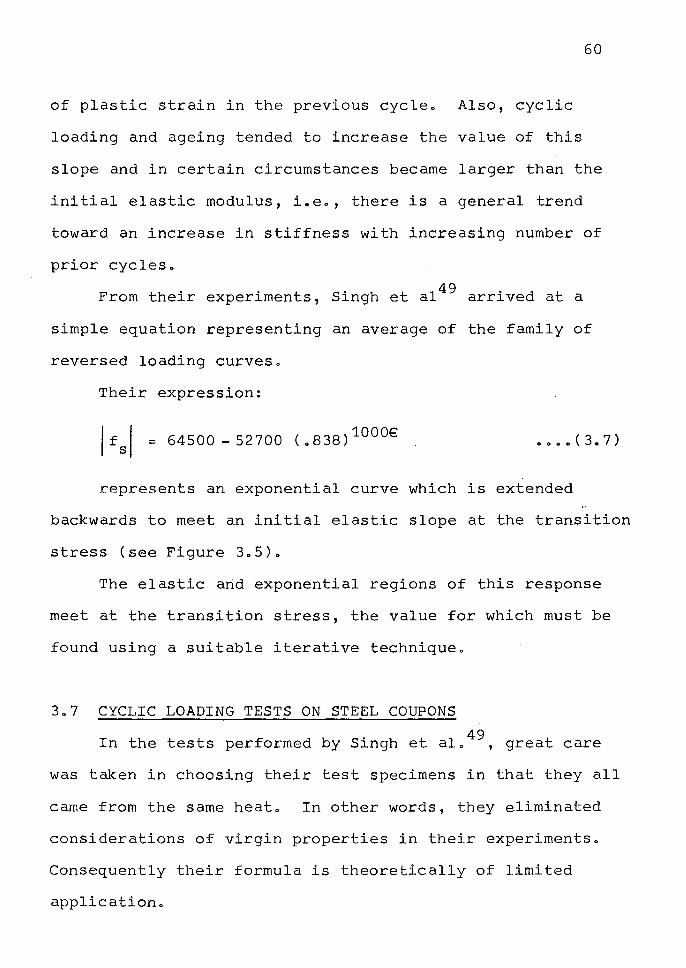
60
of plastic strain in the previous cycle. Also, cyclic
loading and ageing tended to increase the value of this
slope and in certain circumstances became larger than the
initial elastic modulus, i.e., there is a general trend
toward an increase in stiffness with increasing number of
prior cycles.
From their experiments, Singh et a1 49 arrived at a
simple equation representing an average of the family of
reversed loading curves.
Their expression:
I fsl = 64500 _ 52700 ( .838) 1000
€ 0000(3.7)
represents an exponential curve which is extended
backwards to meet an initial elastic slope at the transition
stress (see Figure 3.5).
The elastic and exponential regions of this response
meet at the transition stress, the value for which must be
found using a suitable iterative technique.
3.7 CYCLIC LOADING TESTS ON STEEL COUPONS
In the tests performed by Singh et a1. 49 , great care
was taken in choosing their test specimens in that they all
came from the same heat. In other words, they eliminated
considerations of virgin properties in their experiments.
Consequently their formula is theoretically of limited
application.
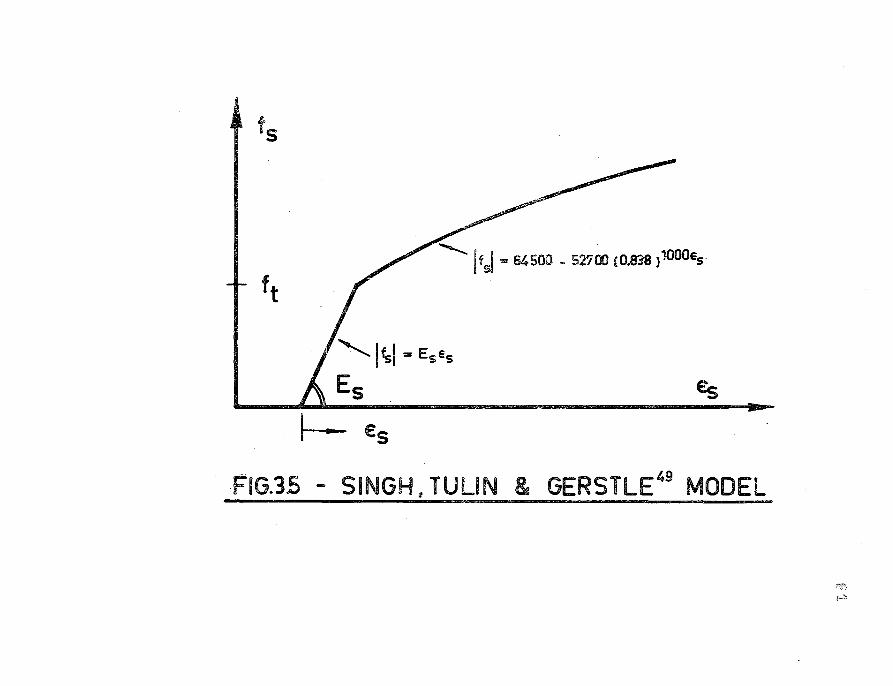
ts
ft
"-
"- lfsf = E5E5
Es
~ €5
~ ltJ .,. 64500 - 52700 {0.838) 1000e5
€s
F'IG.35 - SINGH, TULIN & GERSTLE 49 MODEL
,_;,
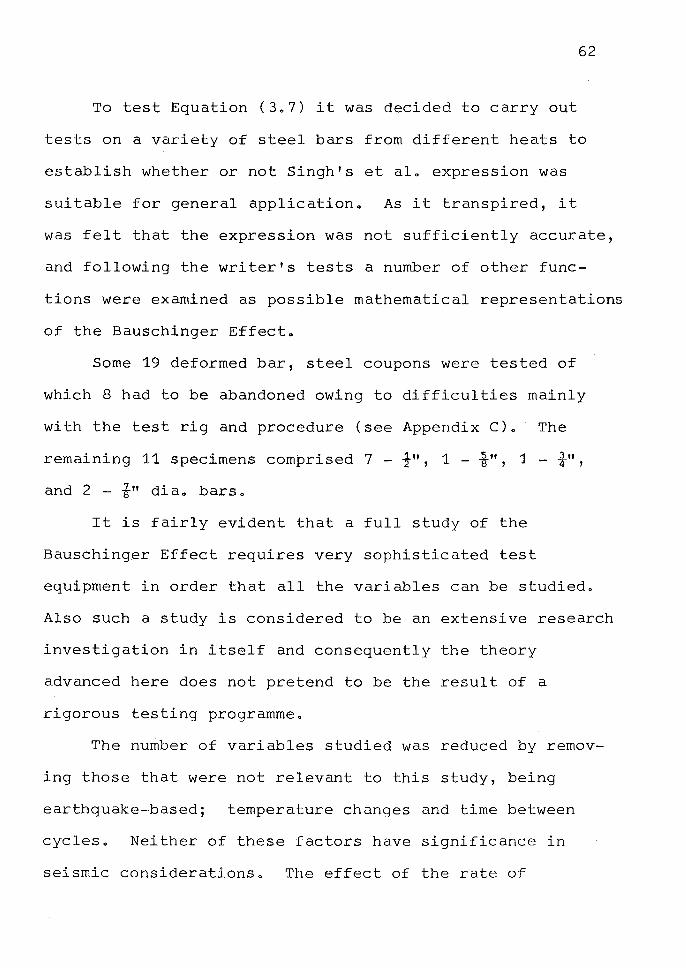
62
To test Equation (3o7) it was decided to carry out
tests on a variety of steel bars from different heats to
establish whether or not Singh's et alo expression was
suitable for general applicationo As it transpired, it
was felt that the expression was not sufficiently accurate,
and following the writer's tests a number of other func
tions were examined as possible mathematical representations
of the Bauschinger Effecto
Some 19 deformed bar, steel coupons were tested of
which 8 had to be abandoned owing to difficulties mainly
with the test rig and procedure (see Appendix C)o The
remaining 11 specimens comprised 7 - ½", 1 - i'', 1 - ¾", d 2 1 " d. b an - 8 1a. arso
It is fairly evident that a full study of the
Bauschinger Effect requires very sophisticated test
equipment in order that all the variables can be studiedo
Also such a study is considered to be an extensive research
investigation in itself and consequently the theory
advanced here does not pretend to be the result of a
rigorous testing programmeo
The number of variables studied was reduced by remov
ing those that were not relevant to this study, being
earthquake-based; temperature changes and time between
cycleso Neither of these factors have significance in
seismic considerationso The effect of the rate of
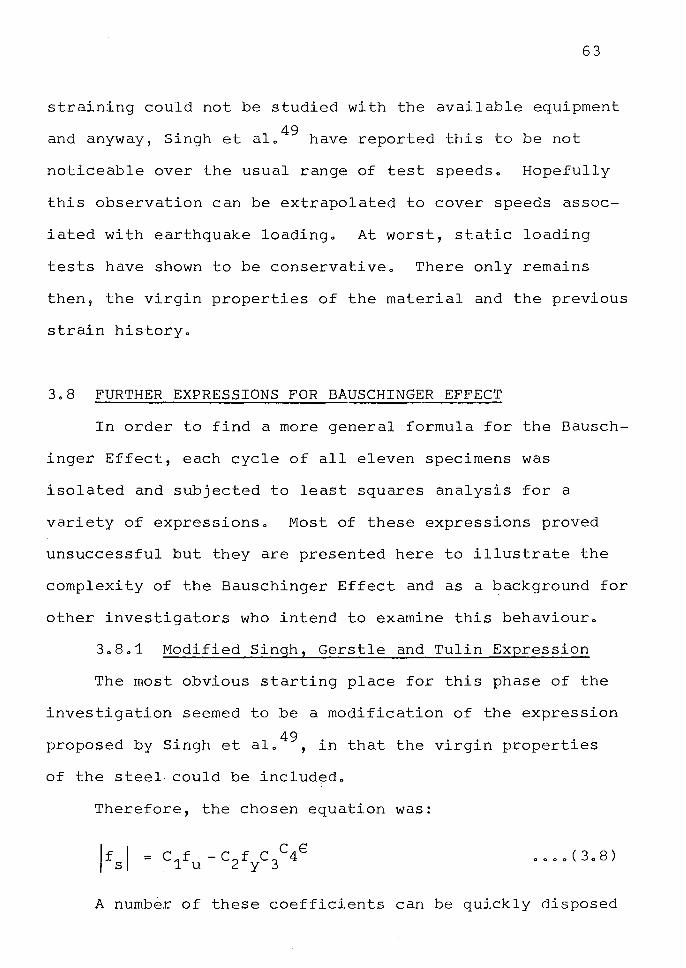
63
straining could not be studied with the available equipment
and anyway, Singh et ai. 49 have reported this to be not
noticeable over the usual range of test speeds. Hopefully
this observation can be extrapolated to cover speeds assoc
iated with earthquake loading. At worst, static loading
tests have shown to be conservative. There only remains
then, the virgin properties of the material and the previous
strain history.
3.8 FURTHER EXPRESSIONS FOR BAUSCHINGER EFFECT
In order to find a more general formula for the Bausch
inger Effect, each cycle of all eleven specimens was
isolated and subjected to least squares analysis for a
variety of expressions. Most of these expressions proved
unsuccessful but they are presented here to illustrate the
complexity of the Bauschinger Effect and as a background for
other investigators who intend to examine this behaviour.
3.8.1 Modified Singh, Gerstle and Tulin Expression
The most obvious starting place for this phase of the
investigation seemed to be a modification of the expression
49 proposed by Singh et al. , in that the virgin properties
of the steel could be included.
Therefore, the chosen equation was:
A number of these coefficients can be quickly disposed
64
of hereo A graph in Singh's et alo paper shows f to be y
approximately 52o7 K.s0i0 and therefore coefficient c 2 was
chosen as unity on comparison with Equation (3.7).
From the tests of the present investigation it appears
that, for a small number of cycles, the value of the
ultimate stress is not affected by the means of reaching it.
That is, specimens loaded directly to failure give the same
ultimate stress as those subjected to reversed loading.
This means that if c 3< 1 then as E ---oo then \fs\--c1fu •
• •• c1 = 1
If this same conclusion was reached by Singh et al.
then their ultimate stress was 64500 p.s.i. On reflection
this appears to be a very low ultimate stress for the
comparatively high yield stress, but 52700/64500 = 0.818
which is close to the 0.838 value used in Equation (3.7).
Therefore, Equation (3.8) has been simplified to:
(
f ·)c4€ f - f ..2
u y f ' u
There is a strong relationship between c 3 and c 4 in
that the initial plastic strain has a large effect on the
shape of the stress-strain curve on reversal (q.v. Section
3.6). It was intended that c4
would embody this effect and
toward this end the experimental results obtained by the
author were subjected to least squares analysis to find c 4
for each cycle.
65
Two main factors discounted this approacho Firstly,
the transition stress where the initial linear response
joined the exponential response of Equation (3o9) was too
high, being about¾ yield and therefore twice as high as
the transition stress for Singh's et alo expressiono
Secondly, c4 did not show any correlation with initial or
previous plastic strains and was in fact very randomo
30802 Exponential Function
An exponential function was next attempted of the form:
This function has several apparent advantageso It can
be differentiated and manipulated to comply with the three
boundary conditions:-
( 1)
( 2)
( 3)
df s
dE: s
df s
dE s
= E s
when€ s
= 0 when E: s
= 0
= € SU
f = f when€ = € S U S SU
However 1 the resultant expression is unduly complex and
insufficiently general to allow for considerations of
initial plastic strain or virgin properties such as the
yield stresso
30803 Quartic Polynomial Expression
An expression of the form:
66
was also tried and least squares analysis performed on
experimental cycleso Again~ this expression can be made to
comply with the boundary conditions listed in Section 3.8.2.
For experimental cycles with low strain range ( < 2E ) this y
expression produced remarkably low standard deviations of
theoretical from experimental values. However, the cubic
term caused difficulty when large strains were involved in
that points of contraflexure, and maxima and minima
appeared.
3.8.4 Sixth Power Polynomial Expression
To remove the points of discontinuity from the
theoretical expression, the cubic term in Equation (~.11)
was replaced with a power six term to give:
This change resulted in very good fits of theoretical
to experimental curves when~, /3 and d were subjected to
least squares analysis. Unfortunately as was the case with
the quartic, these coefficients could not be correlated
with any of the factors influencing Bauschinger behaviour
and the polynominal approach had to be discontinued.
3.9 PROPOSED EXPRESSION FOR BAUSCHINGER EFFECT
Finally an expression was chosen that has been used by
67
th · t· t 61 t t f 1 f o er inves iga ors as a momen -curva ure ormu a or
structural steel sections. The equation, the Ramberg-Osgood
function, has the form:
r-1 ) •••• (3.13)
Mch and <pch are "characteristic" moment and curva
ture respectively,
r is the Ramberg-Osgood parameter.
This function can be modified for stress-strain form
ulation as follows:
r-1 ) 0 0 0 0 ( 3 0 14 )
fch and €ch are "characteristic" stress and strain
respectively,
r is the Ramberg-Osgood parameter.
Depending on the value of r, the function has the
advantage of either having the form of a sweeping curve, or
of having two almost linear "limbs" joined by a sharp elbow
(see Figure 3.6).
For all values of r, the function passes through the
point:
= 2 and f fch
= 1
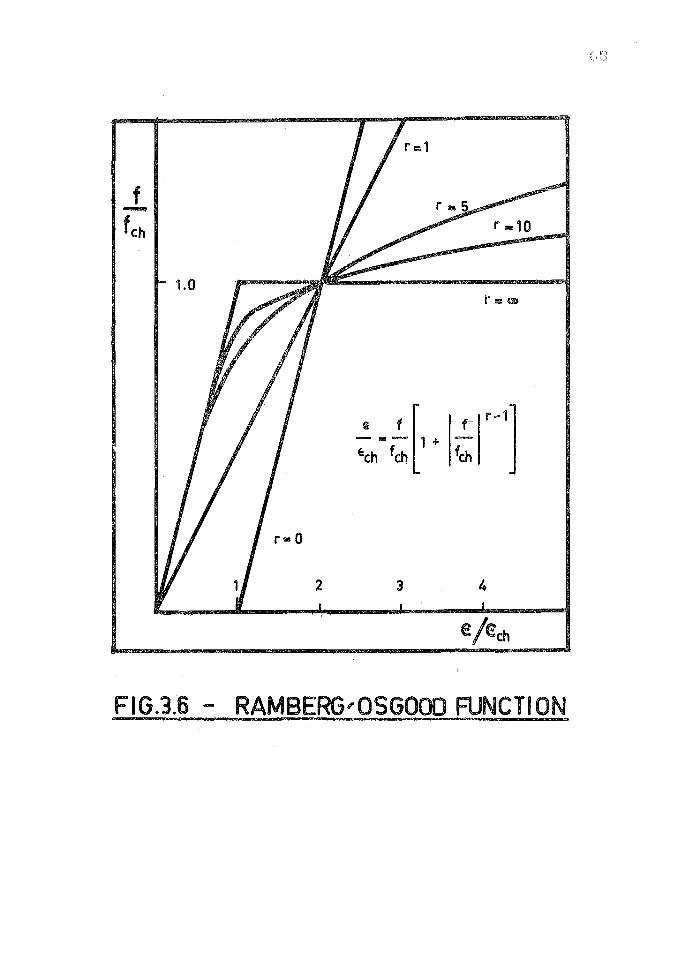
f r .10
1 .o
r• O
2 3 4
FIG.3.6 - RAMBERG,QSGOOO FUNCTION
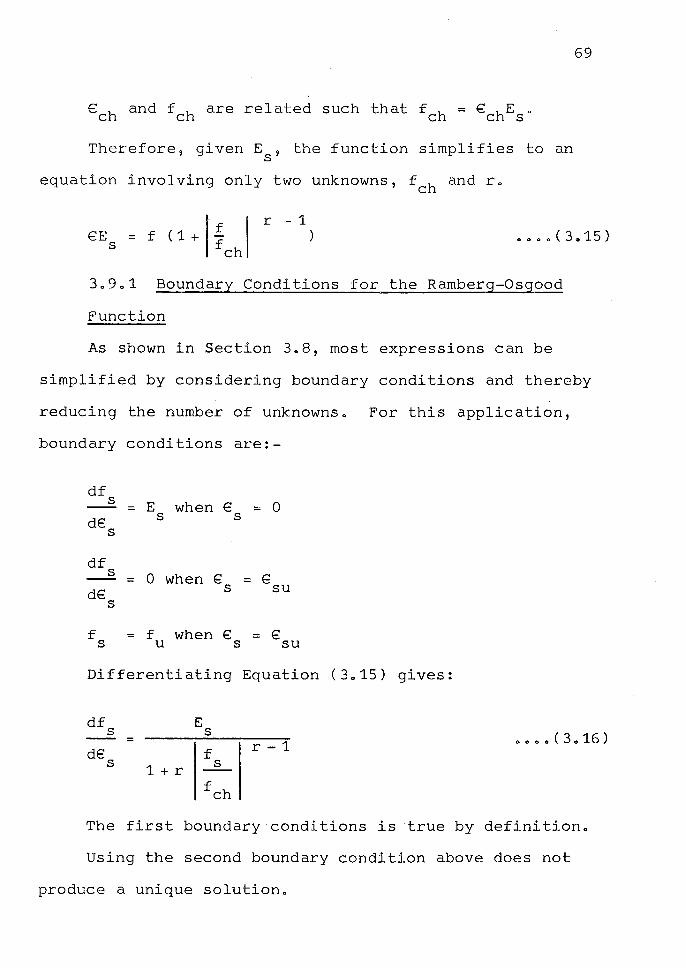
Therefore? given E 9 the function simplifies to an s
equation involving only two unknowns, fch and ro
r ~ 1
69
E:E s =f(1+[t ) 0000(3 .. 15)
ch
3o9o1 Boundary Conditions for the Ramberg-Osgood
Function
As shown in Section 308, most expressions can be
simplified by considering boundary conditions and thereby
reducing the number of unknownso For this application,
boundary conditions are:-
df s E when € 0 = = de s s
s
df s 0 when E'. E = = dE'. s SU
s
f = f when E: = E'. S U S SU
Differentiating Equation (3o15) gives:
df s
de s
=
1+r
E s
f s
r-1 o o o o ( 3o 16)
The first boundary conditions is true by definitiono
Using the second boundary condition above does not
produce a unique solutiono
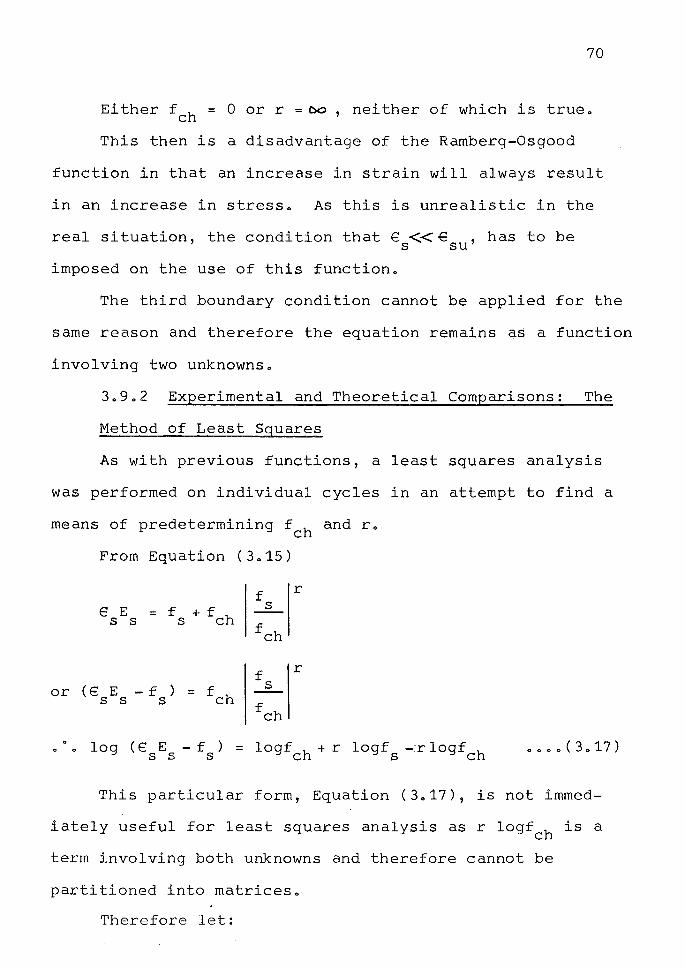
70
Either fch = 0 or r =C>o, neither of which is trueo
This then is a disadvantage of the Ramberg-Osgood
function in that an increase in strain will always result
in an increase in stresso As this is unrealistic in the
real situation, the condition that € << € , has to be S SU
imposed on the use of this functiono
The third boundary condition cannot be applied for the
same reason and therefore the equation remains as a function
involving two unknownso
3o9o2 Experimental and Theoretical Comparisons: The
Method of Least Squares
As with previous functions, a least squares analysis
was performed on individual cycles in an attempt to find a
means of predetermining fch and ro
From Equation (3o15)
e E s s = f + f h S C
or ( E'. E - f ) = s s s
f s
f s
r
r
log ( € E - f ) = logf h + r log£ -T log£ h S S S C S C
This particular form, Equation (3o17), is not immed
iately useful for least squares analysis as r logfch is a
term involving both unknowns and therefore cannot be
partitioned into matriceso
Therefore let:
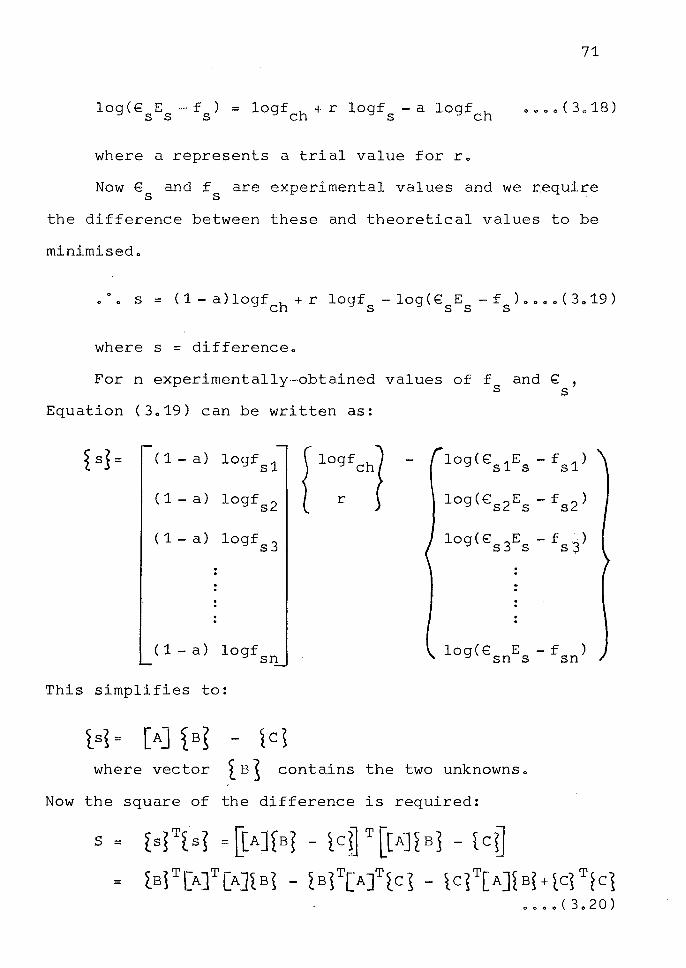
71
log ( € E = f ) = logf h + r logf - a logf h S S S C S C
oooe(3@18)
where a represents a trial value for ro
Now e and f are experimental values and we ~equire s s
the difference between these and theoretical values to be
minimisedo
wheres= differenceo
For n experimentally-obtained values off and b , s s
Equation (3o19) can be written as:
1 sJ = ( 1 - a) logfs 1
( 1 - a) logfs 2
( 1 - a) logfs 3
(1- a) logf sn
This simplifies to:
is~= [A] lB~ ic~
{ lo:fchl log(E: 1E - f 1 ) s s s
log(E: 2E -f 2 ) s s s
log ( E: 3E - f 3
) s s s
:
log(€ E -f ) sn s sn
where vector l BS contains the two unknowns o
Now the square of the difference is required:
s =
=
fs~Tfs~ =~A]fB1 - tell T[[A]~B) - fcij
[B!T[A]T[A]lB~ - ~B1T[AJT((~ - lC1T[A]tB~+tc1T~c1
0000(3020)
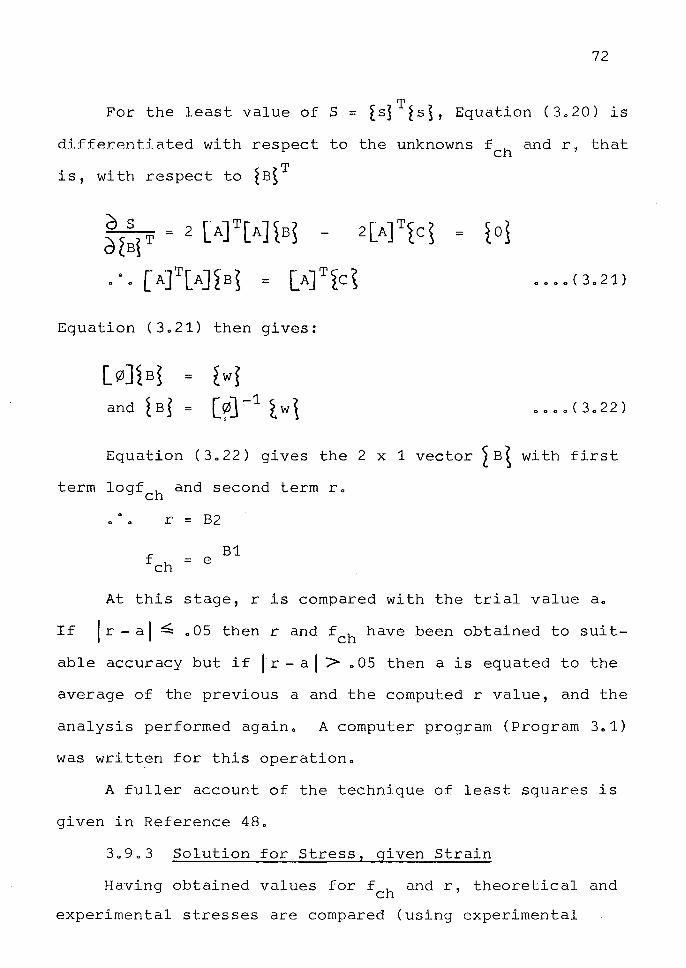
72
For the least value of S = fsJTfs!, Equation (3o20) is
differentiated with respect to the unknowns fch and r, that
is, with respect to ~B~T
=
Equation (3o21) then gives:
[0]lB~ = iwi and lB~ = [~J-1 1 W\
Equation (3o22) gives the 2 x 1 vector ~B~ with first
term logfch and second term ro
r = B2
f = e B1 ch
At this stage, r is compared with the trial value ao
If Ir - a I ~ o 05 then r and fch have been obtained to suit
able accuracy but if I r - a I > o 05 then a is equated to the
average of the previous a and the computed r value, and the
analysis performed againo A computer program (Program 3o1)
was written for this operationo
A fuller account of the technique of least squares is
given in Reference 480
3o9o3 Solution for Stress, given Strain
Having obtained values for fch and r, theoretical and
experimental stresses are compared (using experimental
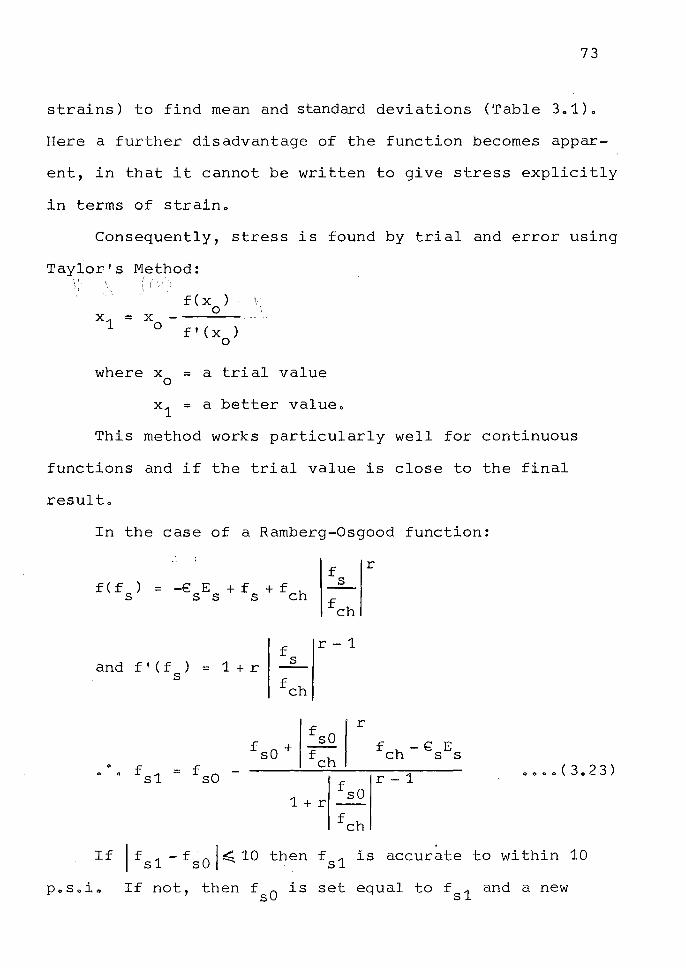
73
strains) to find mean and standard deviations (Table 3o 1) o
Here a further disadvantage of the function becomes appar
ent, in that it cannot be written to give stress explicitly
in terms of straino
Consequently, stress is found by trial and error using
Taylor's Method:
where
This
functions
resulto
f(x) 0
\,'. '\
X ----0
X 0
x1
f 1 ( X ) 0
= a trial
= a better
value
valueo
method works particularly
and if the trial value is
well for continuous
close to the final
In the case of a Ramberg-Osgood function:
f(f ) = s -€E +f +fh
S S S C
and f' ( f ) = s
. f fso s1 =
1+r
f
-
f s
so+
f s
r-1
f ·r
s0 fch
f 1+r s0
fch
r
f -~ E ch s s
r-1
If I fs 1 - fsO ,~ 10 then fs 1 is accurate to within 10
p.s.i .. If not, then fsO is set equal to fsi and a new
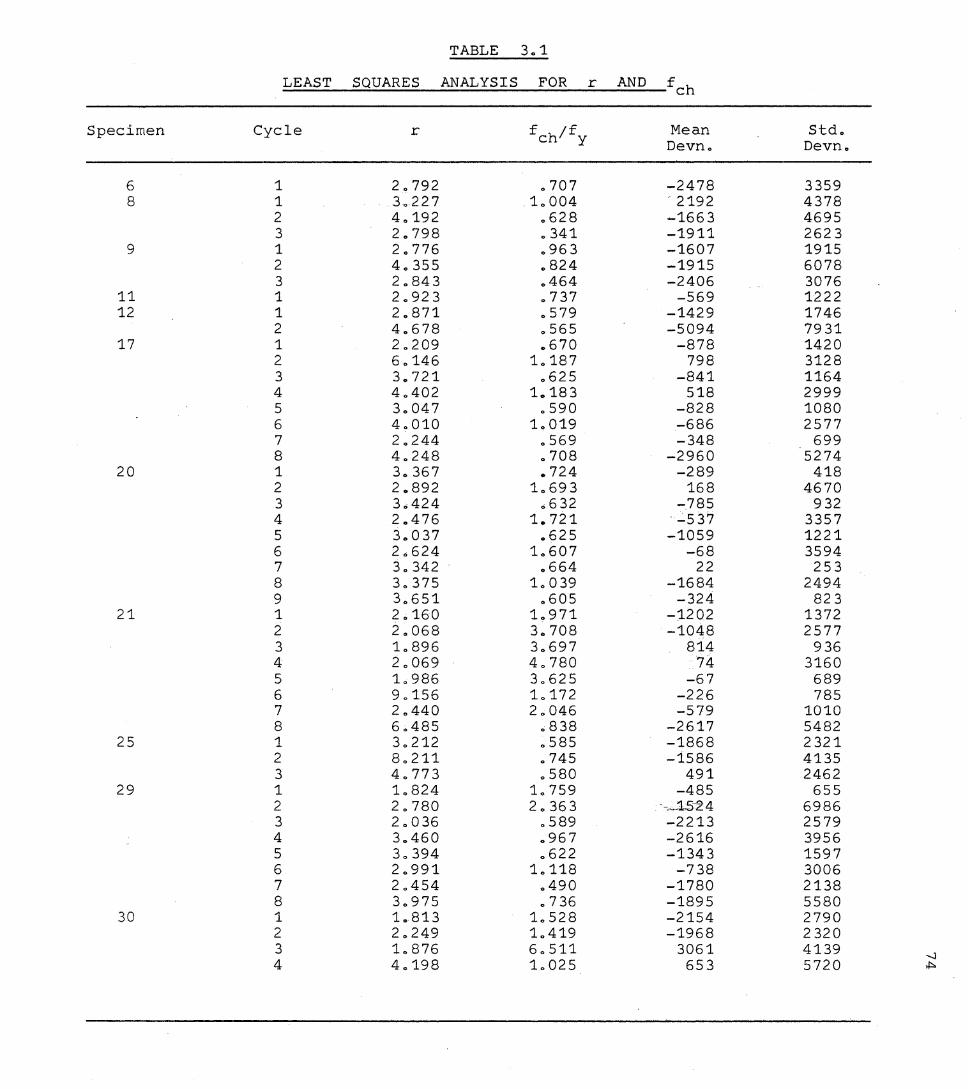
TABLE 3o1
LEAST SQUARES ANALYSIS FOR r AND fch
Specimen Cycle r f h/f Mean Stdo C y Devno Devn.
6 1 20792 0707 -2478 3359 8 1 30227 10004 2192 4378
2 4.192 0628 -1663 4695 3 20798 0 341 -1911 2623
9 1 2.776 0963 -1607 1915 2 40355 0824 -1915 6078 3 20843 0464 -2406 3076
11 1 20923 0737 -569 1222 12 1 20871 0579 -1429 1746
2 40678 .565 -5094 7931 17 1 20209 0670 -878 1420
2 60146 L187 798 3128 3 30721 0625 -841 1164 4 40402 10183 518 2999 5 30047 0590 -828 1080 6 40010 10019 -686 2577 7 2.244 0569 -348 699 8 40248 0708 -2960 5274
20 1 3.367 .724 -289 418 2 2.892 1.693 168 4670 3 3.424 0 6 32 -785 932 4 2.476 1.721 -537 3357 5 30037 0625 -1059 1221 6 2.624 L607 -68 3594 7 3.342 0664 22 253 8 30375 1. 039 -1684 2494 9 30651 .605 -324 82 3
21 1 20160 10971 -1202 1372 2 2.068 3.708 -1048 2577 3 10896 3.697 814 936 4 2.069 4.780 74 3160 5 1.986 3.625 -67 689 6 90156 10172 -226 785 7 2.440 2.046 -579 1010 8 60485 .838 -2617 5482
25 1 3.212 .585 -1868 2321 2 80211 .745 -1586 4135 3 4.773 .580 491 2462
29 1 1.824 10759 -485 655 2 2.780 2.363 ---~-24 6986 3 2.036 .589 -2213 2579 4 30460 .967 -2616 3956 5 30394 .622 -1343 1597 6 2.991 1.118 -738 3006 7 20454 .490 -1780 2138 8 3.975 0 736 -1895 5580
30 1 1.813 10528 -2154 2790 2 2.249 1.419 -1968 2320 3 1.,876 6.511 3061 4139
-..J 4 4.198 1.025 653 5720 .i::,.
75
value for fsl computedo
An initial value off 0 = € E gives convergence within s s s
two or three cycles for low strains and up to fifteen cycles
for very high strain (co2%)o
3o9o4 Characteristic Ratio, Reh
fch
fy
Inspection of the results of the least squares analysis
discussed in Section 3.9.3 indicates that the characteristic
ratio is dependent on the plastic strain produced in the
previous cycle, E. 1 lp This is shown in Figure 3o7 which
plots the characteristic ratio against€. 1 0 This relation-1p
ship complies with reported observations in that the
reversed "yield" stress is lowered with increasing prior
plastic straino
The shape of the curve in Figure 3.7 is similar to
-1 -x -4 y = log x, y = e and y = x and therefore a least
squares analysis (Program 3.2) was carried out on the
following function:
o< log( 1 + 1000€.
1) + (elOOO€ipl -1)
lp
0 + --4
E. 1 lp + s
0000(3.24)
Results from the least squares analysis of Section
3o9o3 were weighted according to the inverse of the standa~d
deviationso Weighting, in ~erms of least squares analysis,
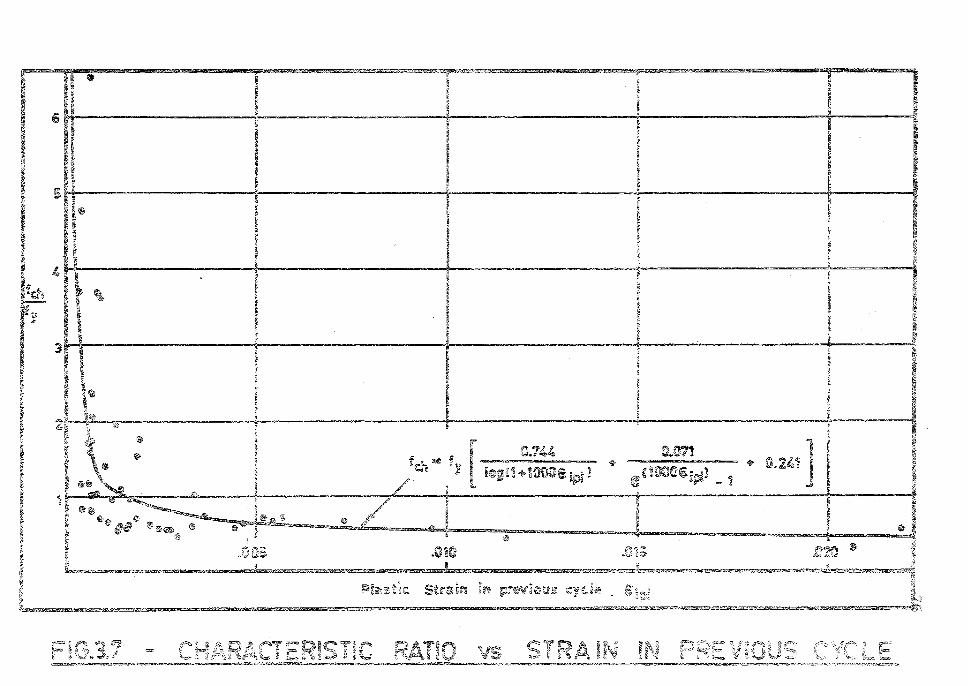
1-=o,
~e~ u.'i
·•-.ii t:-JJ
•4' 0
r-.O
(~ +
- ._,,,
,r I«
-•=
"
»~ -
©
Ji V,j
.,,.. 'M
0. - en 1.J I g
bD
.i.,,11
tfl ffl ~
'at.
77
required generation of more points for values with low
standard deviationso This technique produced the follow
ing values for the unknown coefficients in Equation (3o24)o
C><. = 00744
f> = 00071
t :::: OoO
b = 0.,241
Therefore the following relation is adopted and is
shown in Figure 3o7:
_ f [ .. 744 y log( 1 + 1000€ipl)
.071 +
( e 1000E:~pl _ 1 ) + .24~
0000(3.25)
Eh=fh/E •••• (3.26) C C S
A condition was imposed whereby f h ~ f o Although C y
Figure 3.7 shows several values of characteristic ratios in
excess of unity, these were all obtained on specimens with
a low strain range, i.e., the deviation from elastic res
ponse was not marked, and therefore the least squares
analysis for a Ramsberg-Osgood function was particularly
insensitive for these cycles.
3o9.5 Ramberg-Osgood Parameter, r
Having found a reasonably accurate method for pre
determining characteristic stress, a further least squares
analysis was carried out on the individual experimental
cycles to find best values for ro The results of this
analysis (Program 3o3) are shown in Table 3o2o
78
Comparing standard deviations in Tables 3o1 and 3.2
shows that some standard deviations have been improved by
fixing values for characteristic stress. The reason for
this is that in both analyses, when fch and r were found,
and when r was found given fch' experimental strain values
were weighted so that large strain values had a greater
effect on the analysiso
The values of r in Table 3.2 were then plotted against
various factors, and of these, only the cycle number showed
any correlation with the Ramberg-Osgood parameter (Figure
308). It can be seen that the odd-numbered cycles show
lower values of r than do the even-numbered cycles. First
yield occurs in cycle O and cycle 1 is the first post-yield
stress reveralo Also there is a noticeable trend towards
lower values of r with increasing number of prior cycles.
This behaviour is reinforced by observations reported by
Singh et a1. 49 that stiffness increases with increasing
number of prior cycles. Figure 3.6 shows that a reduction
in r corresponds to an increase in stiffnesso
A least squares analysis (Program 3o2A) using N and r
values shown in Figure 3.8 was carried out and extra values
were generated according to the strain range in cycle N to
standard deviation ratioo The analysis resulted in the.
following expressions:-
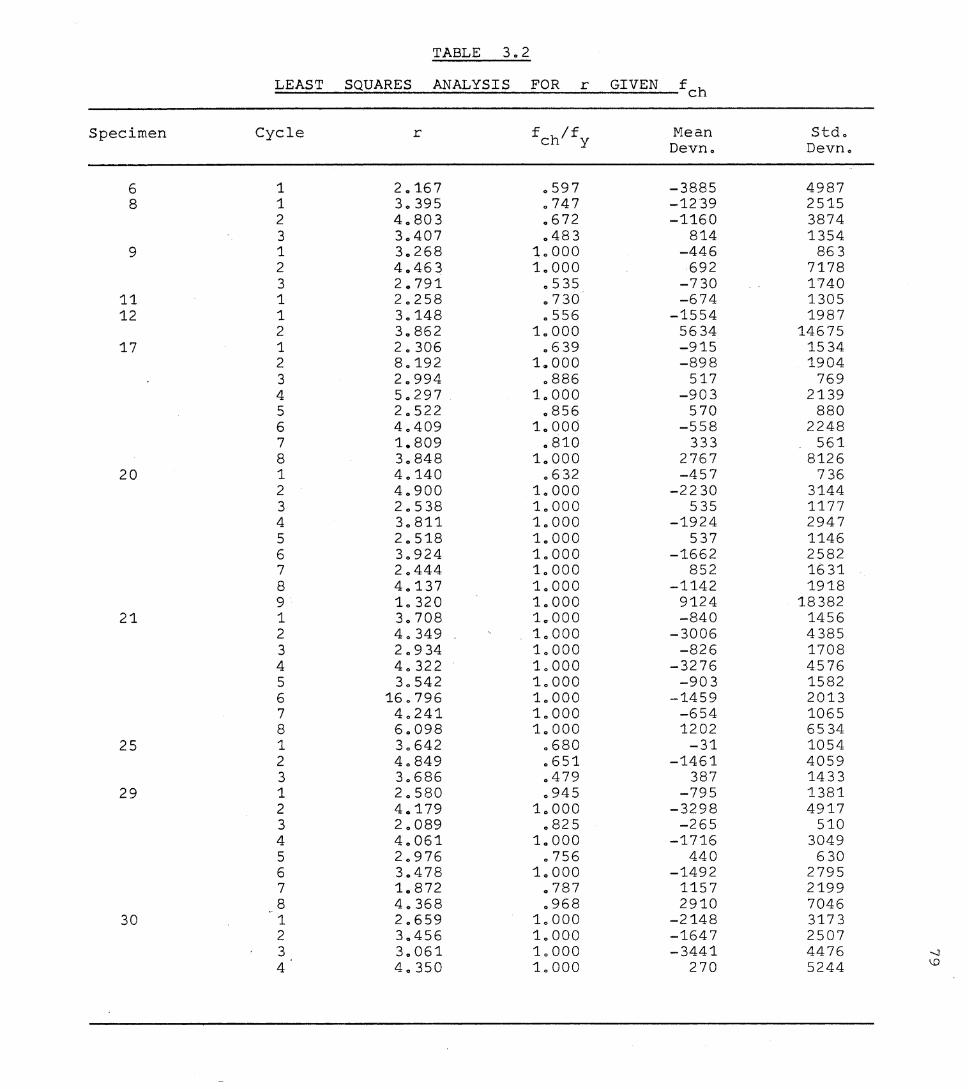
TABLE 3o2
LEAST SQUARES ANALYSIS FOR r GIVEN fch
Specimen Cycle r f h/f Mean Stdo C y Devno Devno
6 1 20167 0597 -3885 4987 8 1 30395 0747 -1239 2515
2 40803 0672 -1160 3874 3 30407 0483 814 1354
9 1 30268 10000 -446 863 2 40463 1.000 692 7178 3 2 .. 791 0 5 35 -730 1740
11 1 20258 0730 -674 1305 12 1 30148 0556 -1554 1987
2 30862 L000 5634 14675 17 1 20306 0 6 39 -915 1534
2 80192 1 .. 000 -898 1904 3 20994 0886 517 769 4 50297 10000 -903 2139 5 20522 0856 570 880 6 40409 1.000 -558 2248 7 1.809 0810 333 561 8 30848 10000 2767 8126
20 1 40140 0 632 -457 7 36 2 40900 10000 -2230 3144 3 20538 L000 5 35 1177 4 30811 10000 -1924 2947 5 20518 L000 537 1146 6 30924 10000 -1662 2582 7 20444 L000 852 1631 8 40137 L000 -1142 1918 9 10320 1.000 9124 18382
21 1 30708 L000 -840 1456 2 40349 1.000 -3006 4385 3 2 0 9 34 L000 -826 1708 4 4o 322 10000 -3276 4576 5 30542 1.000 -903 1582 6 160796 10000 -1459 2013 7 40241 1.000 -654 1065 8 60098 10000 1202 6534
25 1 30642 0680 -31 1054 2 40849 0651 -1461 4059 3 30686 0479 387 1433
29 1 20580 0945 -795 1381 2 4.179 10000 -3298 4917 3 20089 0825 -265 510 4 40061 10000 -1716 3049 5 20976 0756 440 630 6 30478 10000 -1492 2795 7 1.872 0787 1157 2199 8 40368 0968 2910 7046
30 1 20659 1.000 -2148 3173 2 30456 1.000 -1647 2507 3 30061 1.000 -3441 4476 -..J
4 4o 350 10000 270 5244 \..0
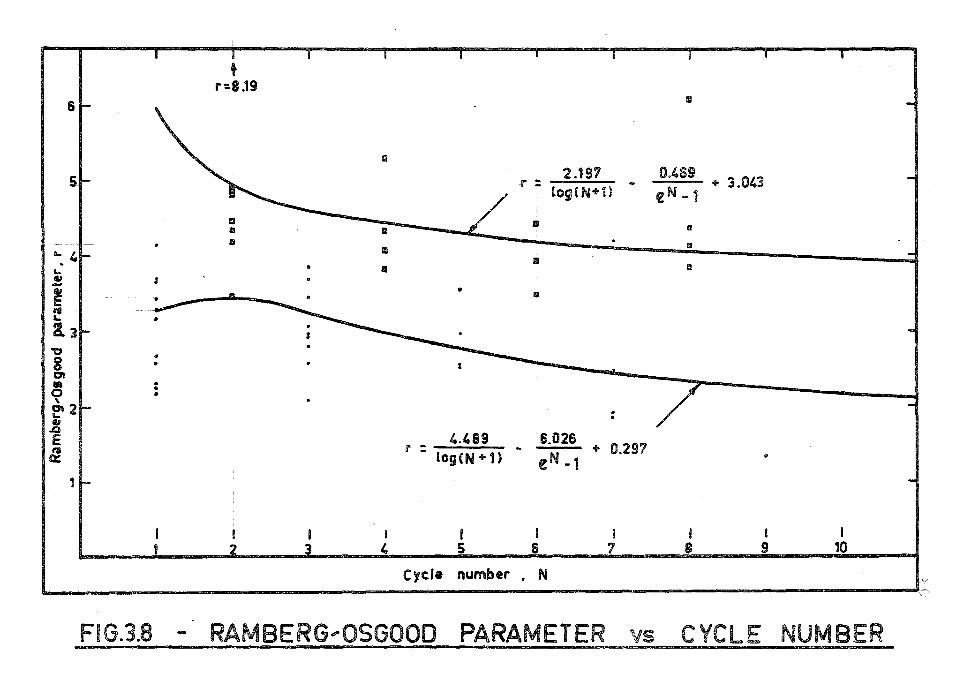
6
Sr
rr • " L. I
!. 3 •
8 I • . en ~ I . • • ' ~2
1: E RI 0::
1
FIG.3.8 -
t r:8 .19
~
D Ill
C
..
--....,,
.
.
Ill
13
1111
II
I 4
2.191 r : -
logCN+U
L D
. Ill
.. Ill
. . 4.489 6.026
+ 0.291 r : -log(N+1) eN-1
I I I 5 6 1
Cycle number • N
RAMBERG,QSGOOD PARAMETER vs
Ill
0.1.69 + 3.043
eN -1
1111
Ii!
1:1
•
I I I s 9 10
CYCLE NUMBER
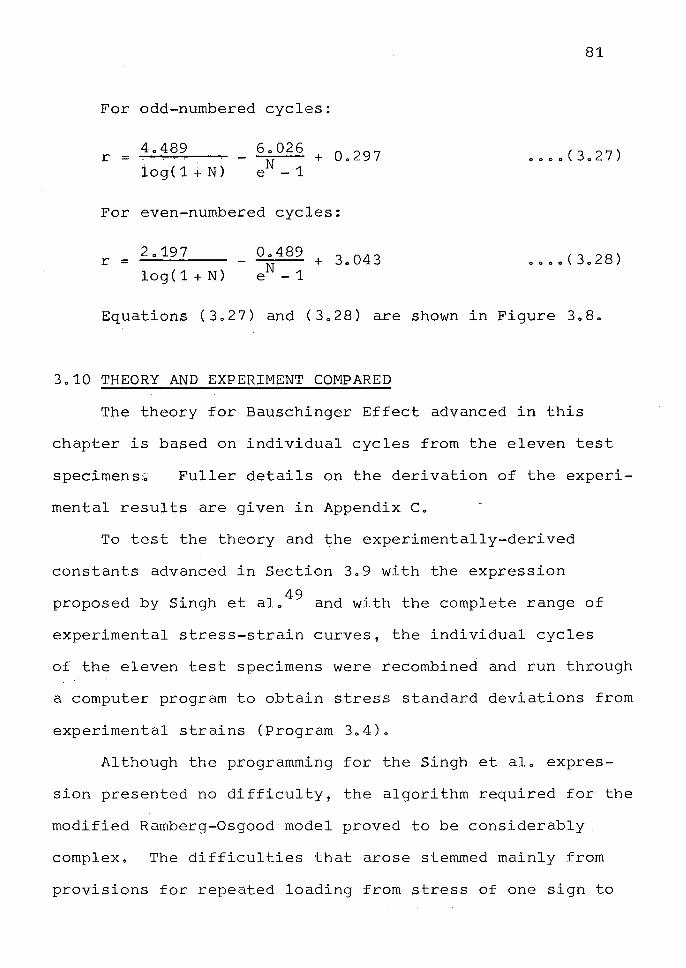
81
For odd-numbered cycles:
r = iog( 1 + N)
For even-numbered cycles:
r = log(1+N)
Equations (3027) and (3028) are shown in Figure 3080
3010 THEORY AND EXPERIMENT COMPARED
The theory for Bauschinger Effect advanced in this
chapter is based on individual cycles from the eleven test
specimens:.; Fuller details on the derivation of the experi-
mental results are given in Appendix Co
To test the theory and the experimentally-derived
constants advanced in Section 309 with the expression
proposed by Singh et alo 49 and with the complete range of
experimental stress-strain curves, the individual cycles
of the eleven test specimens were recombined and run through
a computer program to obtain stress standard deviations from
experimental strains (Program 304)0
Although the programming for the Singh et al0 expres
sion presented no difficulty, the algorithm required for the
modified Ramberg-Osgood model proved to be considerably
complex. The difficulties that arose stemmed mainly from
provisions for repeated loading from stress of one sign to
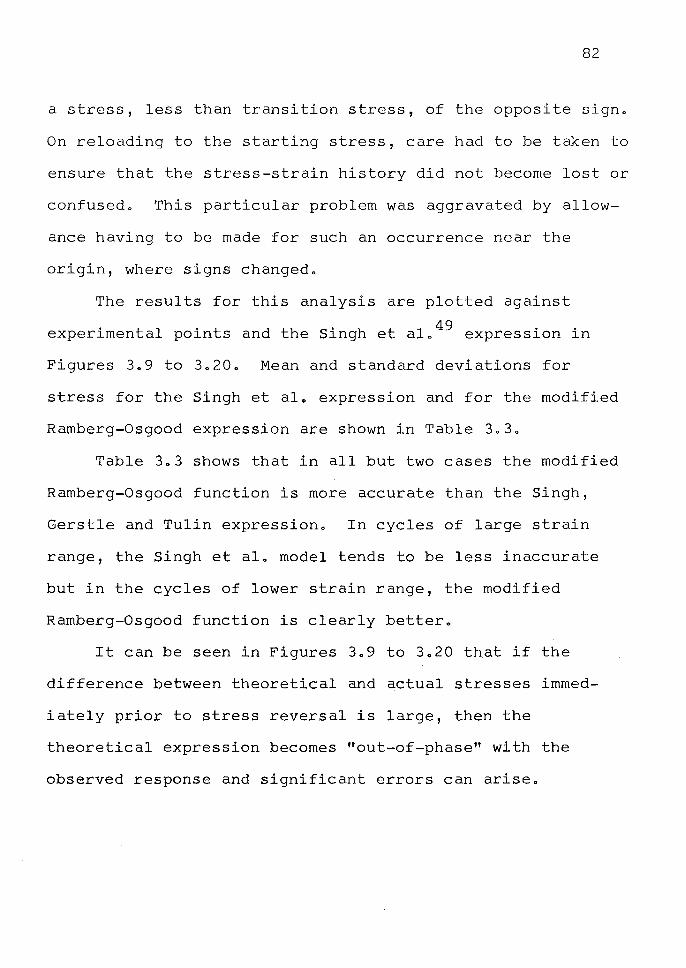
82
a stress, less than transition stress, of the opposite signo
On reloading to the starting stress, care had to be taken to
ensure that the stress-strain history did not become lost or
confusedo This particular problem was aggravated by allow
ance having to be made for such an occurrence near the
origin, where signs changedo
The results for this analysis are plotted against
experimental points and the Singh et alo 49 expression in
Figures 3o9 to 3o20o Mean and standard deviations for
stress for the Singh et alo expression and for the modified
Ramberg-Osgood expression are shown in Table 3o3o
Table 3o3 shows that in all but two cases the modified
Ramberg-Osgood function is more accurate than the Singh,
Gerstle and Tulin expressiono In cycles of large strain
range, the Singh et alo model tends to be less inaccurate
but in the cycles of lower strain range, the modified
Ramberg-Osgood function is clearly bettero
It can be seen in Figures 3o9 to 3o20 that if the
difference between theoretical and actual stresses immed
iately prior to stress reversal is large, then the
theoretical expression becomes "out-of-phase" with the
observed response and significant errors can ariseo
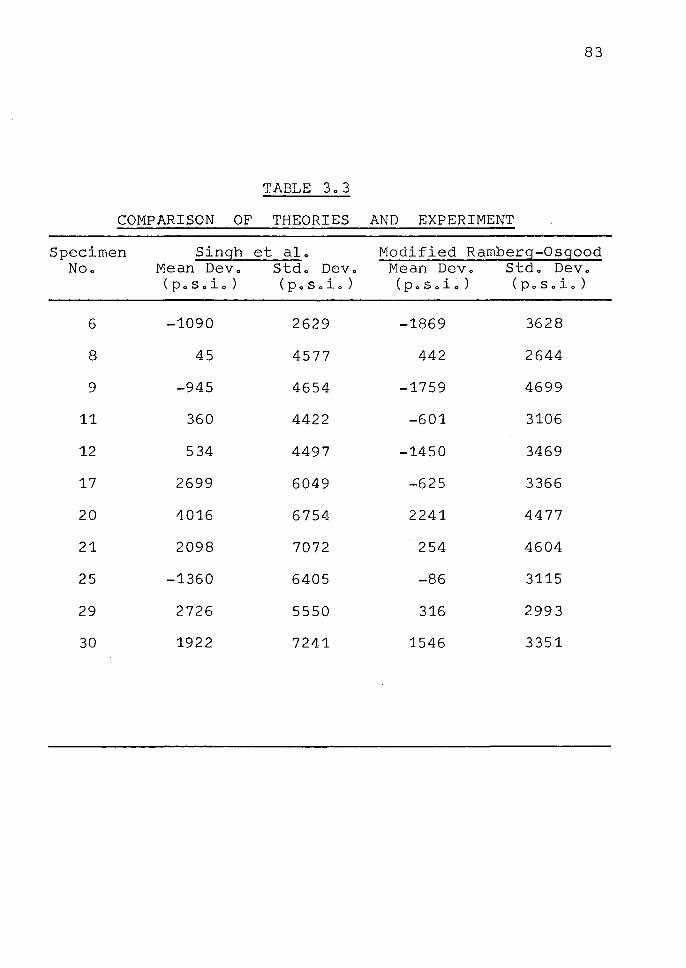
83
TP.~BLE 3o3
COMPARISON OF THEORIES AND EXPERIMENT
Specimen Singh et alo Modified Ramberg-Osgood Noo Mean Devo Stdo Devo Mean Devo Stdo Devo
(poSoio) (poSoio) (poSoio) (poSoio)
6 -1090 2629 -1869 3628
8 45 4577 442 2644
9 -945 4654 -1759 4699
11 360 4422 -601 3106
12 534 4497 -1450 3469
17 2699 6049 -625 3366
20 4016 6754 2241 4477
21 2098 7072 254 4604
25 -1360 6405 -86 3115
29 2726 5550 316 2993
30 1922 7241 1546 3351
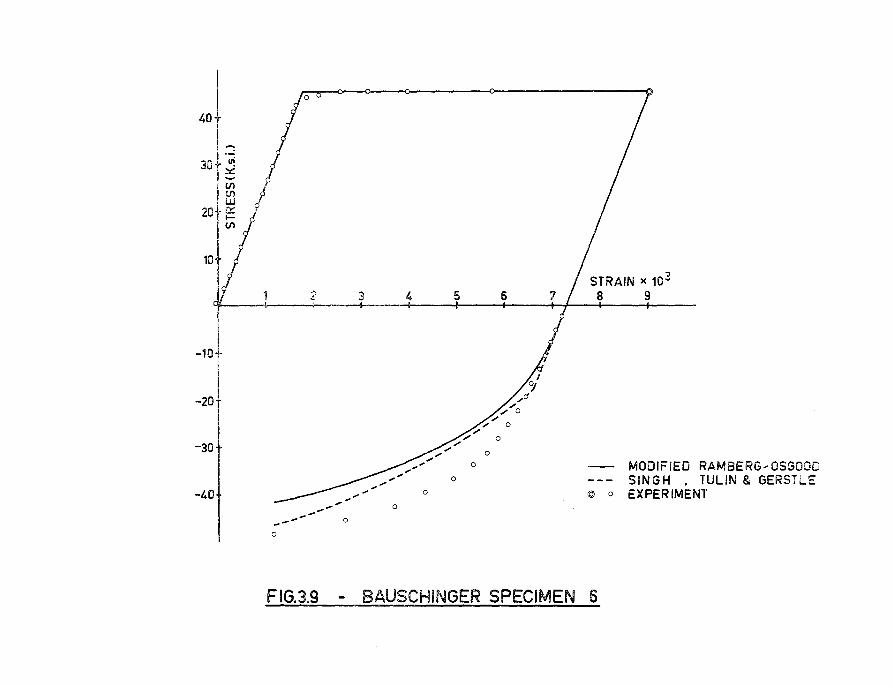
::t ~ ::ii:: -(/) (I) w d 20· ~
10
! -10
-20
-30
-40
:I 0
2 3
.,,.,,.,,,. __ .,, ------
--- 0 0
.,,
4
.,, ...... .,, .,
0
0
.,,
5
,, .,,
0
6
I o/
_,,rJ
",,/'o /
",; 0 /
/ 0
0
0
STRAIN x 103
8 9
MODIFIED RAMBERG, OSGOOD SINGH • TULIN & GERSTLE
@ o EXPERIMENT
FIG.3.9 - BAUSCHINGER SPECIMEN 6
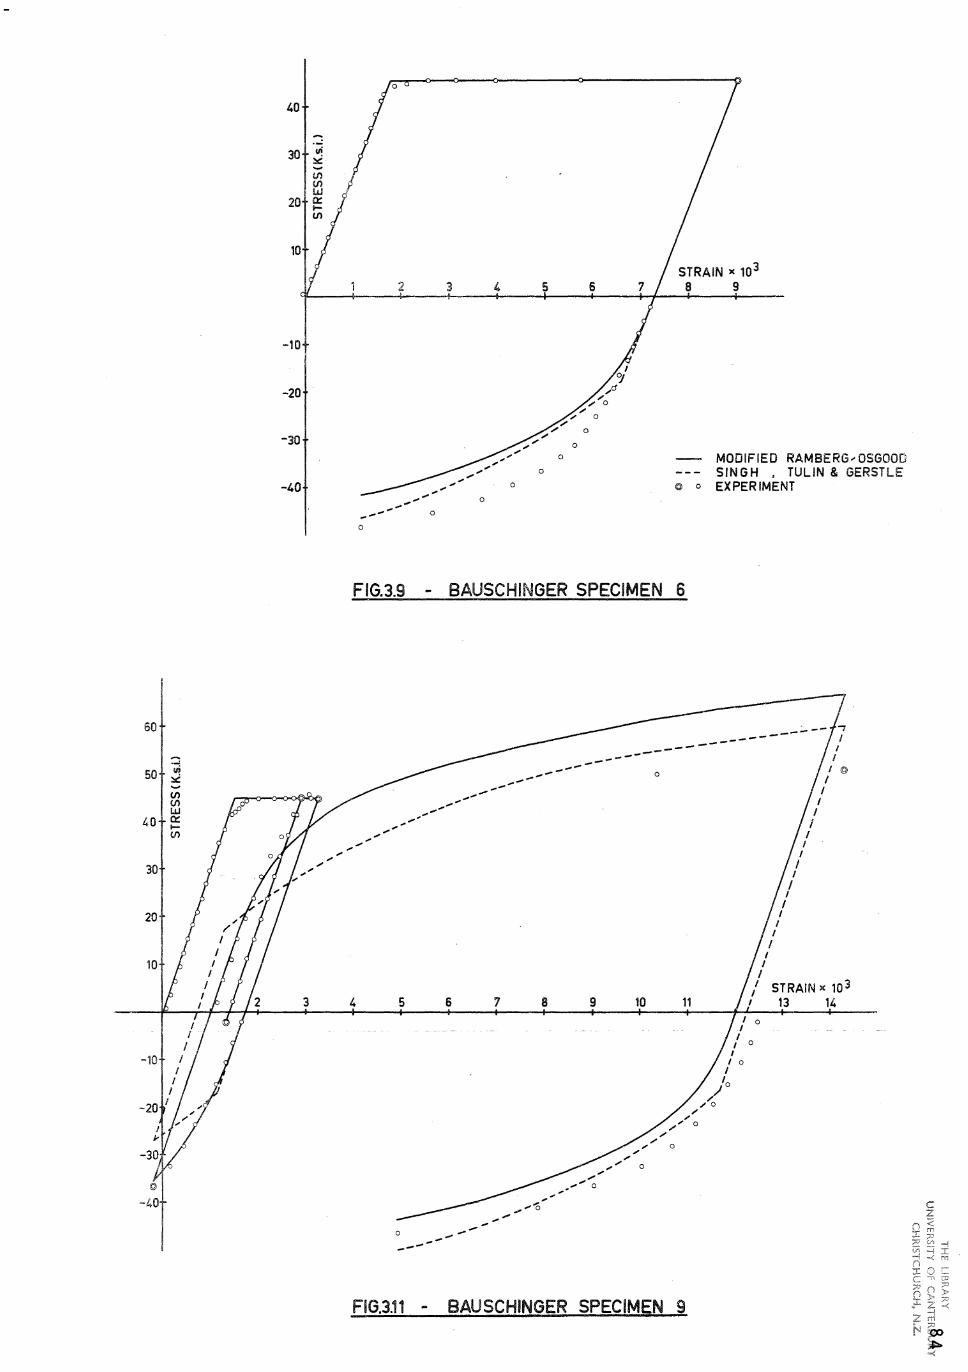
60
50
40
30
20
-10
©
-40
Iii ::ic: -(/) (/) w a::: I-(/)
40
30
20
10
-10
-20
-30
-40
3
0
2
0
FIG.3.9
__ .,.., ... --,, -,,
3 4 5
0
0
0
0
6
0
0
0
STRAIN x 103 8 9
MODIFIED RAMBERG.- OSGOOD SINGH , TULIN & GERSTLE
@ 0 EXPERIMENT
- BAUSCHINGER SPECIMEN 6
----- -------------
---- ----- 0 I @
.... -- I -- I ---- I ------- I I
I I
I I
I I
I I
I I
I I
STRAIN x 10 3 4 5 6 8 9 10 11 13 14
,, .,, ,,,,.,,,,,-
.,,..,,. 0
...,,. ..... "'c, .,,. .,, -0 ----------
,,,
I o I
I I o
I I o
I lo
/ / 0 ,,
,,,.,, 0 ,, / .,, 0 ,,, -... - 0
FIG.3.11 - BAUSCHINGER SPECIMEN 9
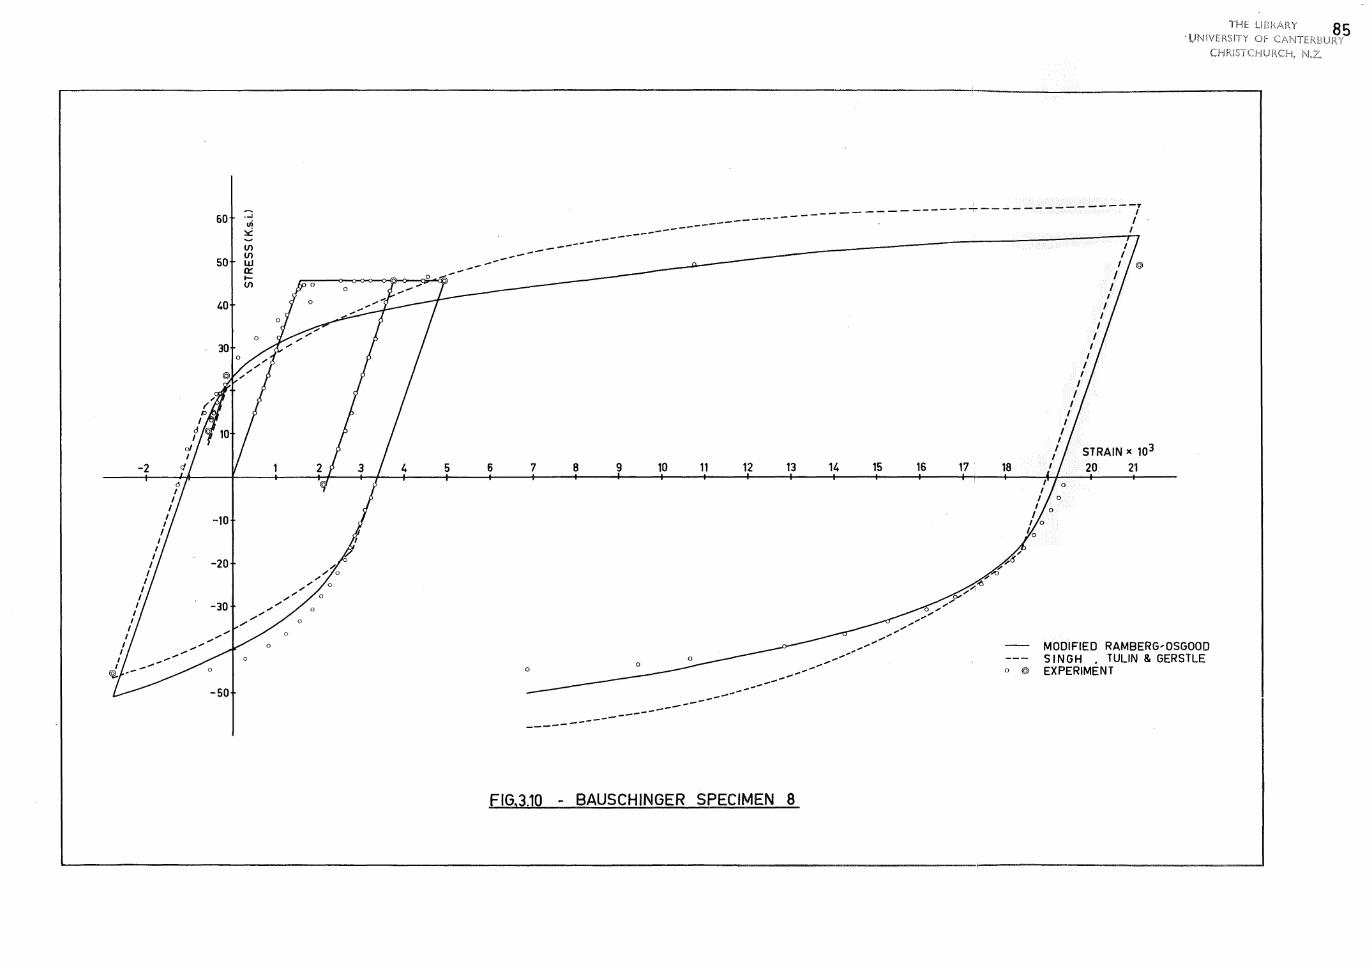
-2 cl I
I I
I I
I I
I I
I I
I I
I I
I I
I I
I I
I I ~ --
60 ·-.,; :le: V) V) so w 0::
_ .... -I-V)
0
40
30
4 s
-so
---------------------------- ---------
6 7 8 9 10 11 12 13 14
---
--------------------------7
15
---- ,, _, ----
.... -- ....
16 17
_.;.\'(\
o_..- "_.o.-,,,,
18
" ,, "'
,, .. ~
I I
I I
I I
I I
I I
I I
I I
I I
I I
I I
I I
I I STRAIN x 103
I I 20 21
THE LIBR,iliRY 85 · UNIVERSITY Of CANTERBURY
CHRlSTCHURCH,
0 __ .... ----.,,...,.. 0 @
MODIFIED RAMBERG,QSGOOD SINGH . TULIN & GERSTLE EXPERIMENT ------.... -------------------------
FIG,3.10 - BAUSCHINGER SPECIMEN 8
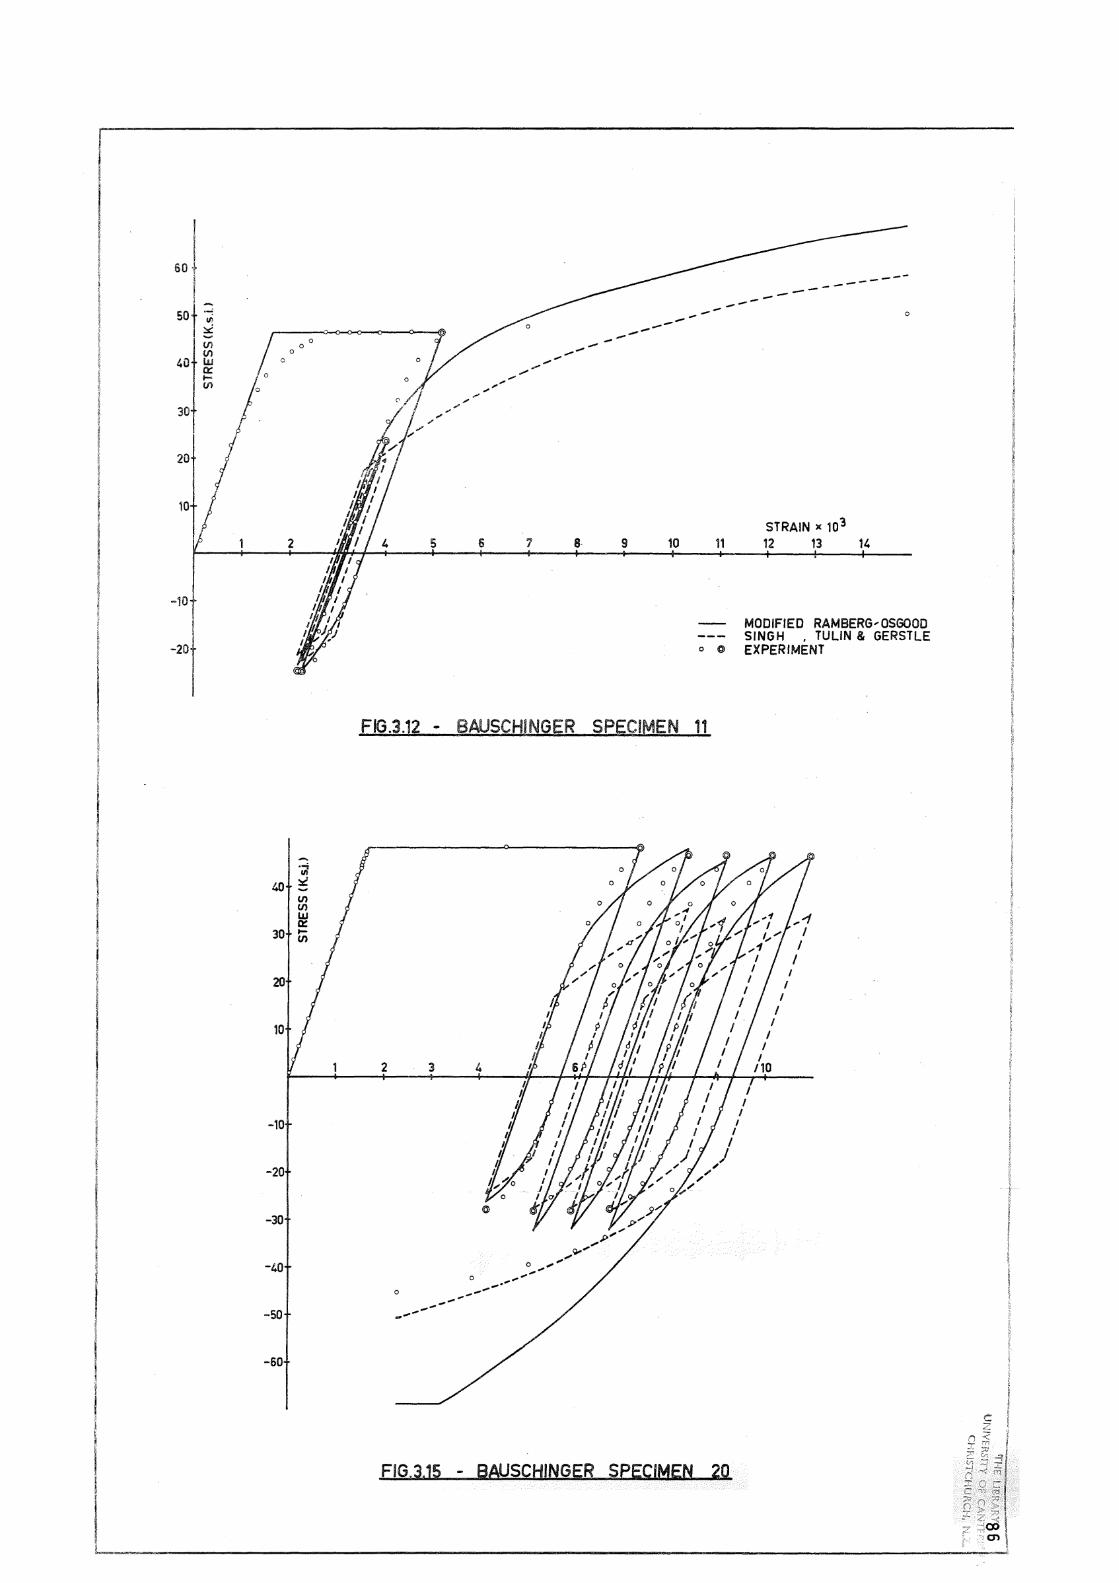
I I
I ' i I ! I !
I I
! 60 +
I 50
40
30
20
10
-10
IJ)
:::.c: ~
0 U') 0 (,/') 0
Lu 0
a::
/ I-(/1
,., J
I
I
·-i rr,
40 x V) U) u, a::
30 I-(/)
20
10
-10
-20
-30
-40
-so
-so
-----_ ..... ... ..,. .,., ,,,, ... ,,. ... ,,. .:~
5 6 1 8 9
---
10 11
-------- ------- 0
STRAIN x 103
12 13 14
MODIFIED RAMBERG--0S6000 SINGH • TULIN & GERSTLE
0 @ EXPERIMENT
FIG.3.12 - BAUSCHINGER SPECIMEN 11
2
0
----- ----
FIG,3.15
4
0
0 ,,,,,,,
,,, ,,,
I I
I I
I I
,,,I
I I
I I
I /10
I I
I
c.:
L-.,_-~-----------------------------------------------------,,-
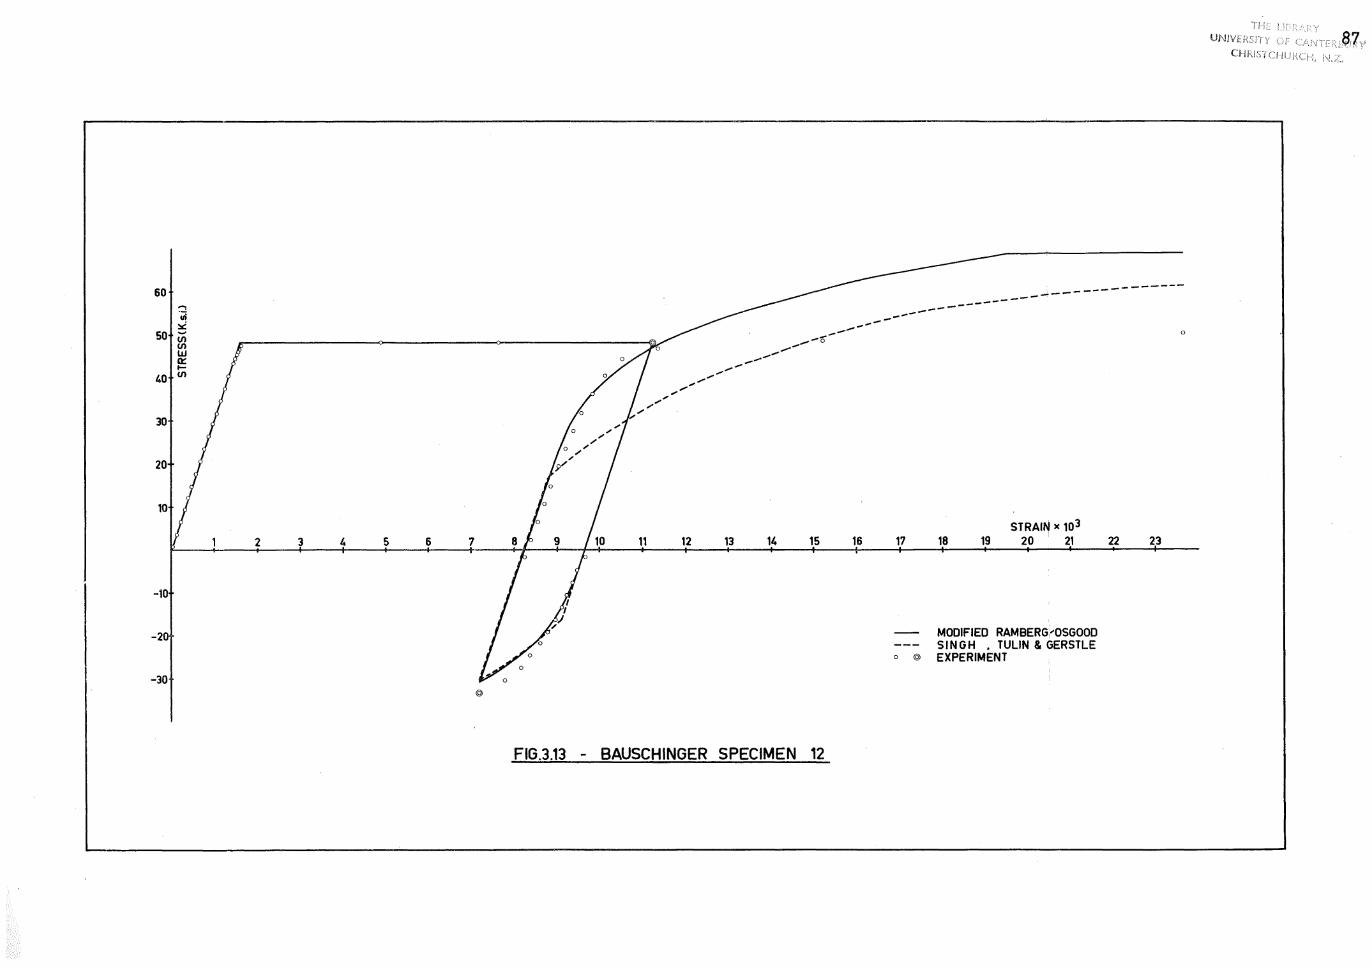
60 -, "ui ~
50 ~
40
.,,,,,,,.-"a-..,...---------------.,,,. ,,,
.,, ...... ..-'
--30
20
10
2 3 4 5 6 1 11 12 13 14 15
-10
-2
-30 @
FIG.3.13 - BAUSCHINGER SPECIMEN 12
------
16
---
17
---------------------
STRAIN x 103 18 19 20 21
MODIFIED RAMBERG,.OSGOOD SINGH • TULIN & GERSTLE
22
0 @ EXPERIMENT
-------
0
23
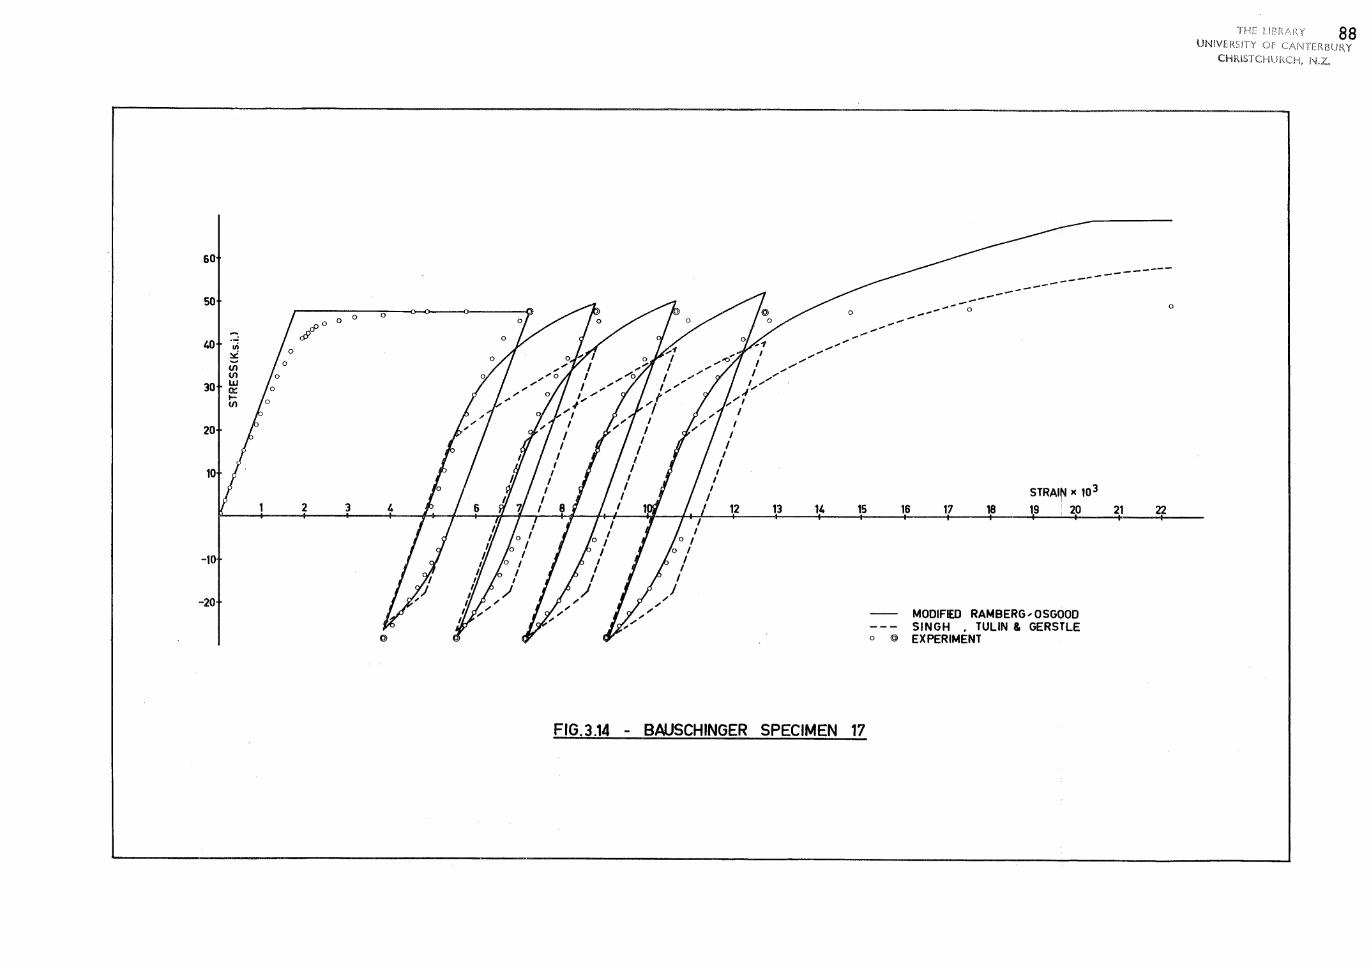
60
50 0 0 0
cP 0
40 o9
30
20
2 3 4 12 13 14 15 I
I 0 /
0 ' -10 I I
I J
-20 ,, ,, ,, ,, ,, ,
FIG.3.14 - BAUSCHINGER SPECIMEN 17
---------------------------- 0
STRAI~ x 10 3
16 17 18 19 1 20 21
MODIFIED RAMBERG, 0 SGOOO SINGH , TULIN & GERSTLE
0 @ EXPERIMENT
UB.f\/\RY 88 UNIVERSITY OF CANTERBURY
----
0
22
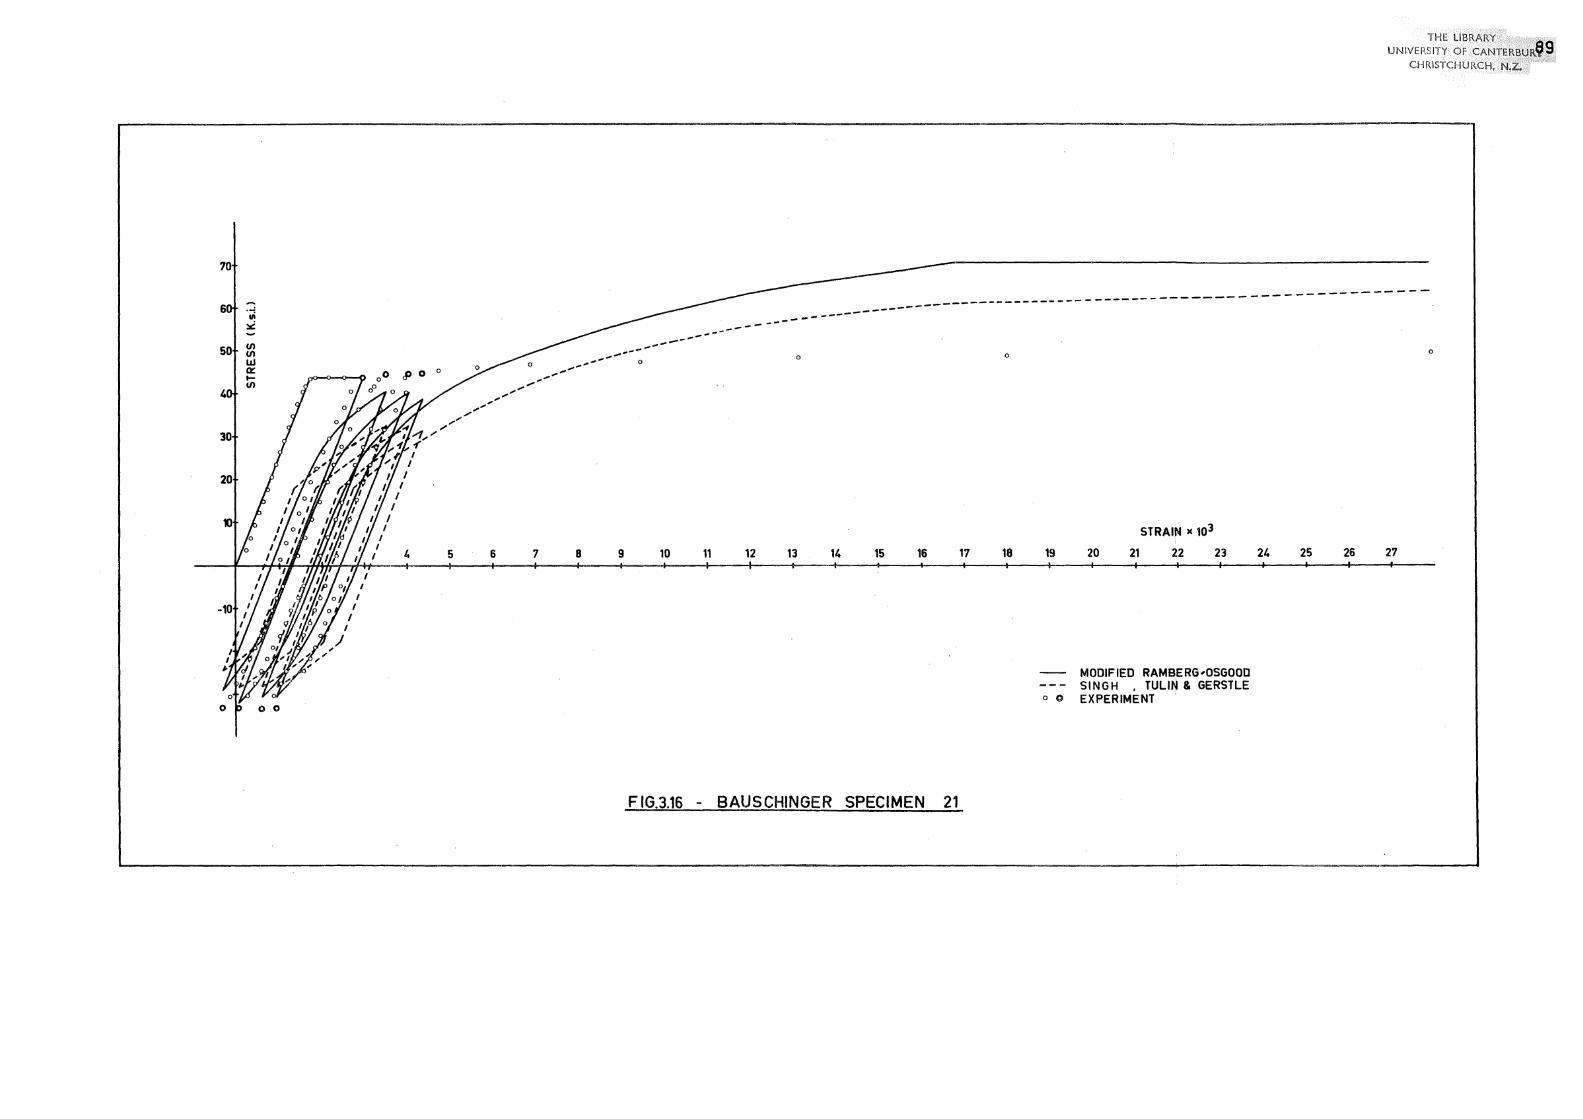
70
6 ·;;; ::0::
50 (/) (/)
UJ 0::
00 ,9 0 0 .... (/)
4
30
20
4 5 6 7 B 9
------------ ---- - ---- -------0
0
10 11 12 13 14 15
-----
16
------------- --- - ------- ------ -- - --
0
17 18 19
STRAIN x 103
20 21 22 23
MODIFIED RAMBERG,QSGOOD SINGH , TULIN & GERSTLE
0 @ EXPERIMENT
24 25
FIG.3.16 - BAUSCHINGER SPECIMEN 21
THE LIBRARY .· . . ., t'I
UNIVERSITY OF CAI\ITERBUR.~ill:II CllRISTCHlJRCH, N,z..'.'i '
----------
0
26 27
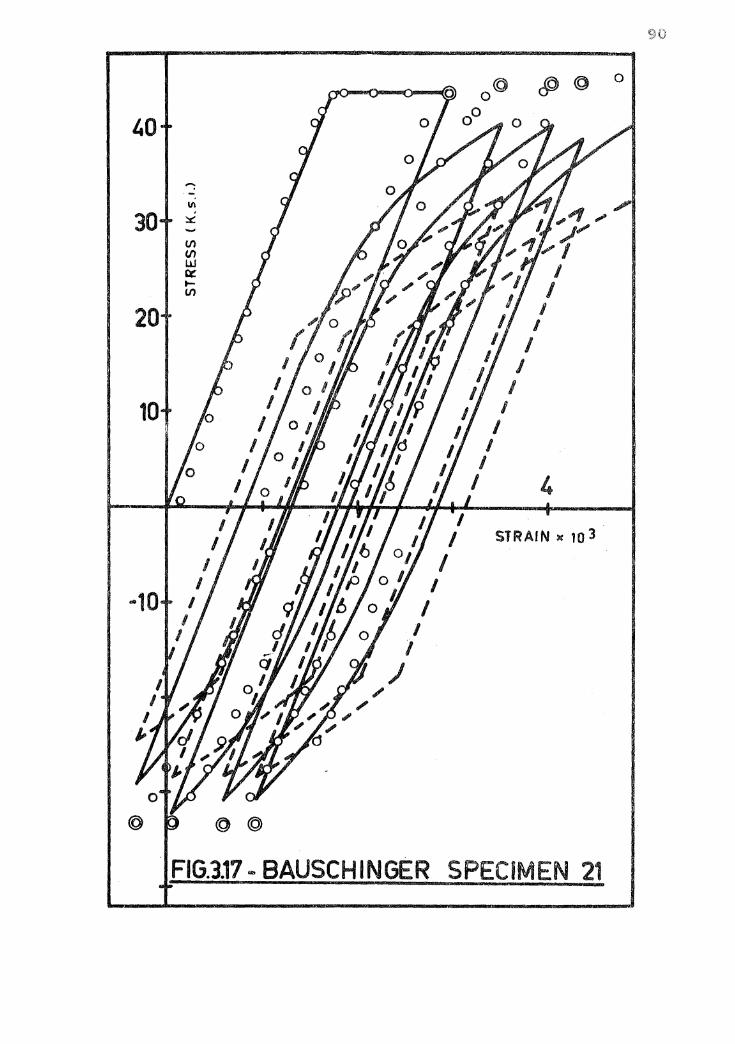
~
V\
30 :::s::: --1./l I.I)
LIJ ~ t--V,
20
10
4
STRAIN )t 10 3
. FIG.3.17 ... BAUSCHINGER SPECIMEN 21
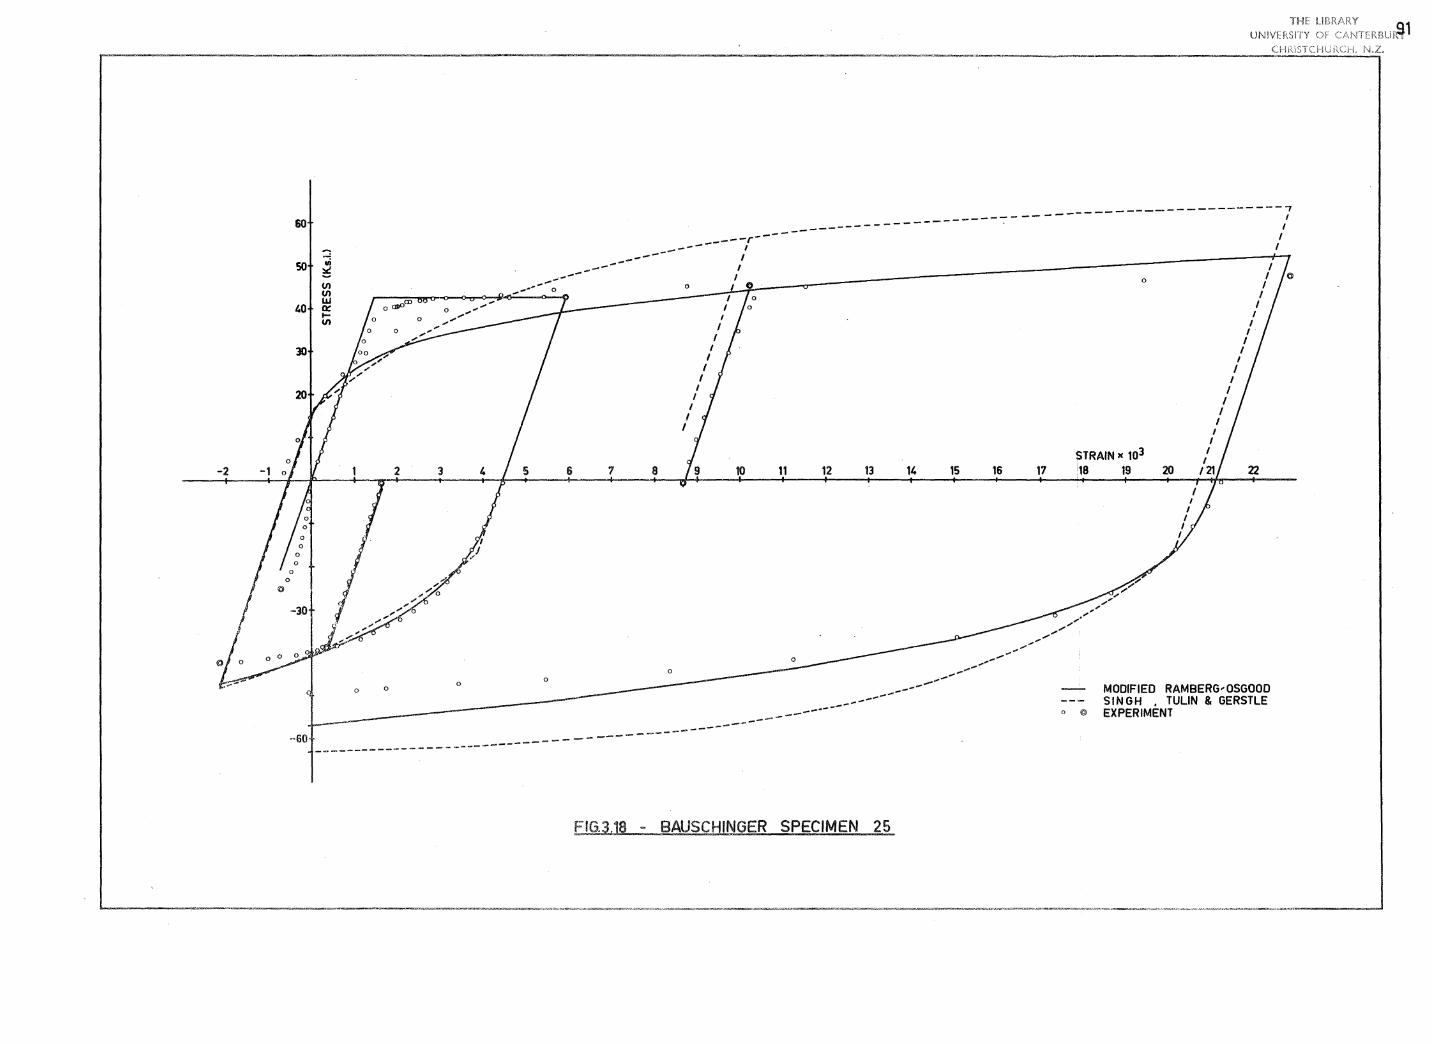
-2
&O
-50
·;;; ~ Ul Ul
,o LI.I a: I- 0 en
30
2 3 '
-----------::-- --
THE LIBRARY UNIVERSITY Of CIINTERBU~1
CH1{.ISTCHURCH. N.Z.
--------------- -,, -------------- I -r--- I _________ I I
---- I ---~- I 0 -~,--- I __ , 0 0
5 & 1 8
0
I I
I
I I
I
I I
I I
I I
I I
10
0
11 12 13 1, 15
...... _ ...
16
.......... .......
17
,..,. ,,. .... ,,.,
STRAIN ic 103 l1s 19 20
,,' ,· ,,,
,,,.,,,, ,,
22
L~_:___o ~o ---- ___ .,. 0 0 ------------------------·-----
......
---~ 0 @
MODIFIED RAMBERG,QSGOOD SINGH • TULIN & GERSTLE EXPERIMENT
------------------------------------------60
FIG.3,18 - BAUSCHINGER SPECIMEN 25
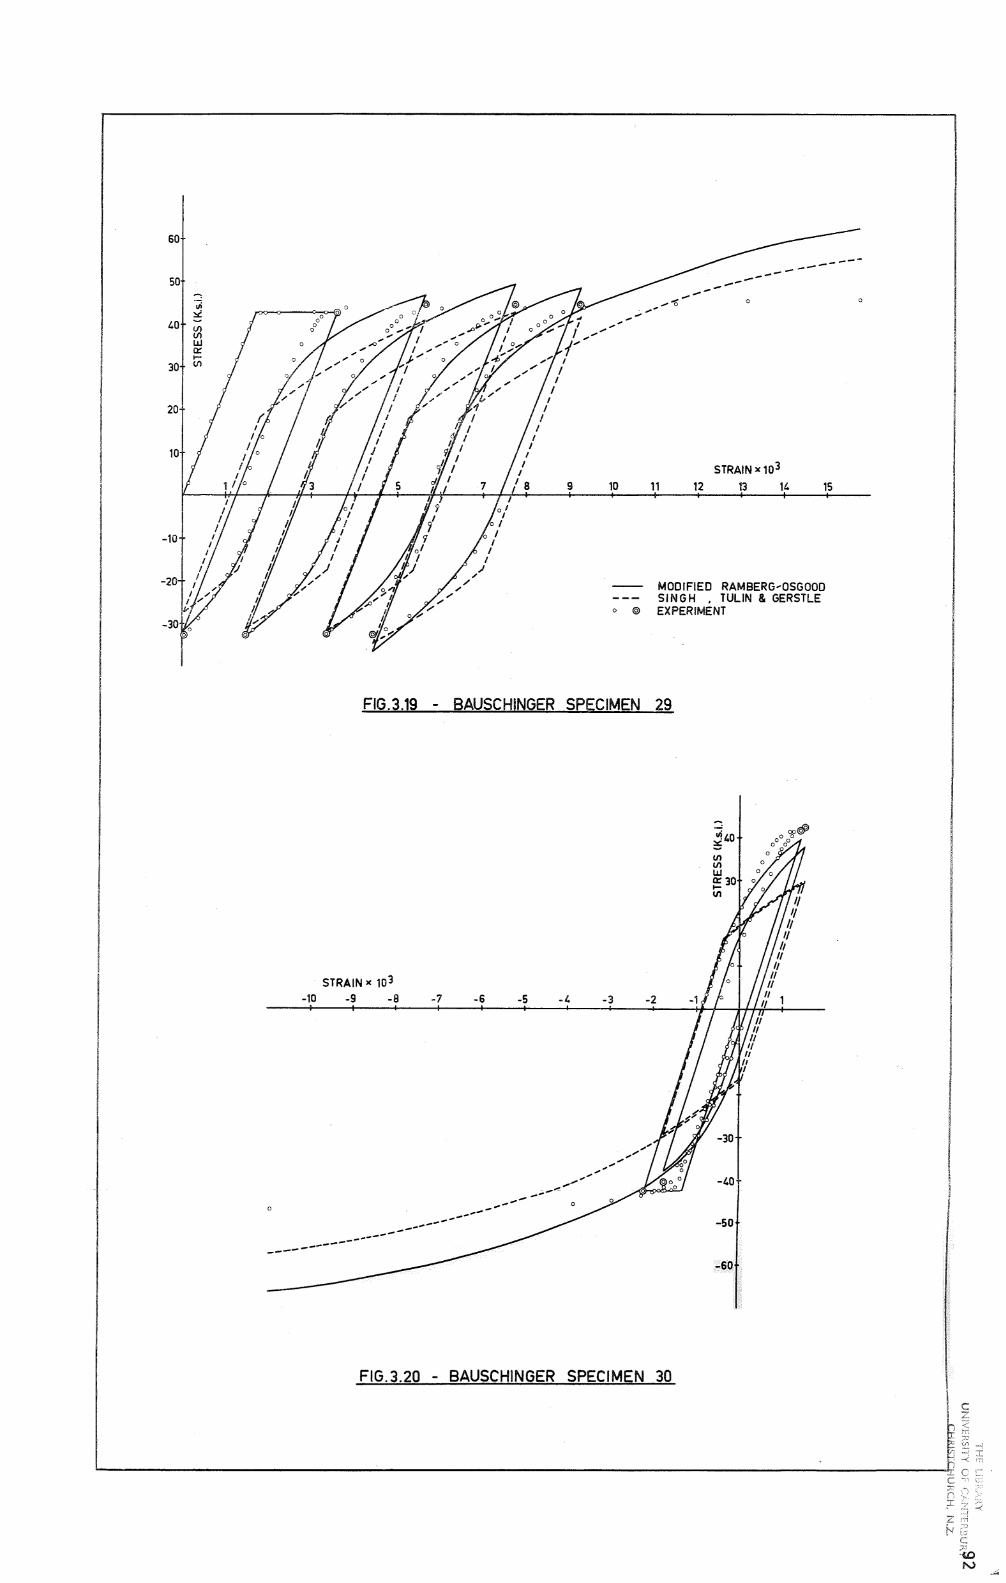
60
50
ui ~
40 VI VI UJ Ck: ,-..
30 (/)
20
-10
-20
FIG.3.19
STRAIN x 103
-10 -9 -8
0
9 10
---------------_.-,; 0
. --
STRAINx103
11 12 13 14 15
MODIFIED RAMBERG,QSGOOO SINGH • TULIN & GERSTLE
0 @ EXPERIMENT
BAUSCH!NGER SPECIMEN 29
-7 -6 -5 -4 -3
.,,,.
__ ... --_ ...... ---------------
-2
-30 ., .... .,,,,.
-40
-50
I/ I/
II I/
It II
II II
II II 1
II
-----------------------
FIG.3.20 - BAUSCHINGER SPECIMEN 30
---0
93
3.11 COMPUTER PROGRAMS
A number of computer programs were written for
theoretica~ analyses of structural reinforcing steel prop
erties. The programs written for the unsuccessful functions
discussed in Section 3.8 are not included in this thesis and
only those referred to in the text are described briefly
below. Listings of these programs appear in Appendix B.
Program 3.1 ("FCHANDR"): Least squares analysis to find
characteristic stress and Ramberg-Osgood parameter
given individual experimental Bauschinger cycles (refer
Section 3.9.2).
Program 3.2 ("FCOR"): Least squares analysis to find
expression relating characteristic ratio and plastic
strain in the previous cycle for steel (refer Section
3.9.4).
Program 3.3 ("FINDR"): Least squares analysis to find
Ramberg-Osgood parameter, r, given characteristic
stress (Equation 3.25) (refer Section 3.9.5).
Program 3.2A ("FCOR"): Least squares analysis to find
Ramberg-Osgood parameter, r, in terms of cycle number
N. Program 3.2 was modified for this analysis (refer
Section 3.9.5).
Program 3.4 ("STEEL"): Comparison of modified Ramberg
Osgood and Singh et a1. 49 with experimental results for
each specimen. Ramberg-Osgood expression uses rand
fch values found from previous programs (refer
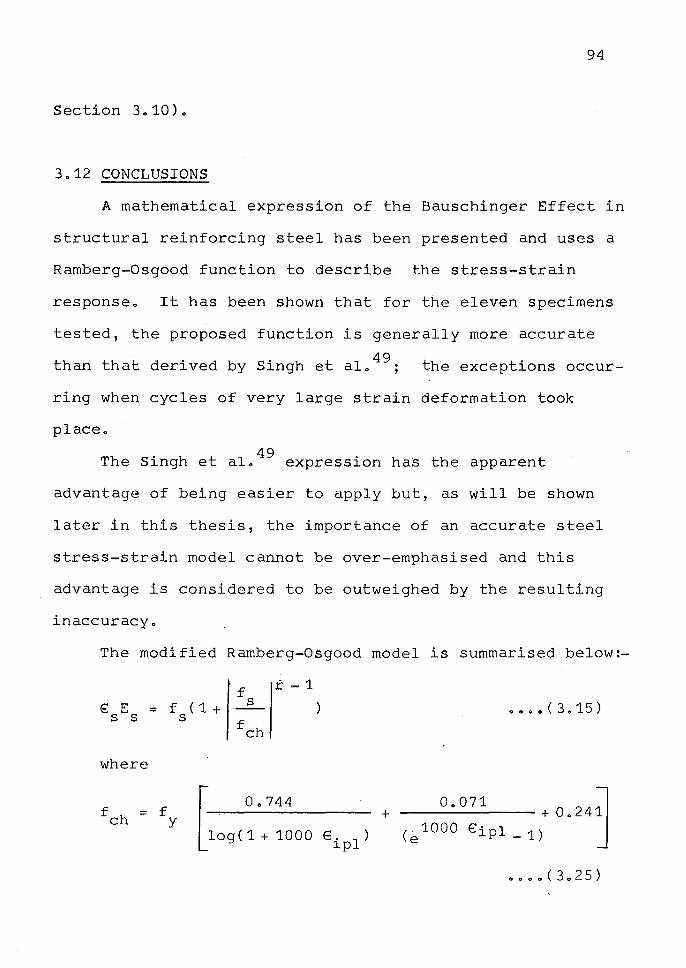
94
Section 3 o 10) o
3.12 CONCLUSIONS
A mathematical expression of the Bauschinger Effect in
structural reinforcing steel has been presented and uses a
Ramberg-Osgood function to describe:· the stress-strain
response. It has been shown that for the eleven specimens
tested, the proposed function is generally more accurate
than that derived by Singh et a1. 49 ; the exceptions occur
ring when cycles of very large strain deformation took
place.
The Singh et a1. 49 expression has the apparent
advantage of being easier to apply but, as will be shown
later in this thesis, the importance of an accurate steel
stress-strain model cannot be over-emphasised and this
advantage is considered to be outweighed by the resulting
inaccuracy.
The modified Ramberg-Osgood model is summarised below:-
€ E =- f ( 1 + I·~ s s s f ch
r-1 0 0 0 0 ( 3 0 15)
where
= f y [
0 o 744
log ( 1 + 1000 €ipl)
+ 0.071 + 0.24J
(e 1000 €ipl _ 1) J 0000(3.25)
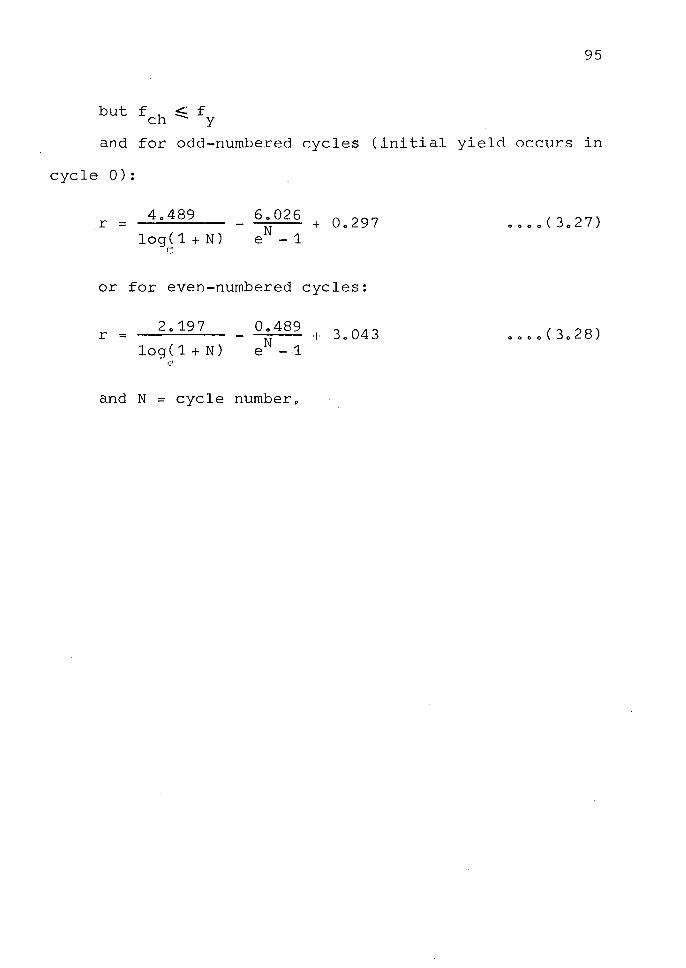
95
but fch ~ fy
and for odd-numbered cycles (initial yield occurs in
cycle 0):
4.489 6.026 0.297 r = N + log ( 1 + N) e -1
e
or for even-numbered cycles:
2.197 0.489 3. 043 r = N + log( 1 + N) e -1
•••• (3.28)
c-'
and N = cycle number.
96
CHAPTER 4
MOMENT-CURVATURE RELATIONS FOR MONOTONICALLY-LOADED
T AND RECTANGULAR REINFORCED CONCRETE SECTIONS
SUMMARY
-Moment-curvature models for T and rectangular sections
are developed and the resulting theory is compared with
published test resultso Design charts for stress block
parameters~ and Oare presented and nomograms for section
curvatures and ductility at the crushing of the concrete
have been constructedo The effect of axial stress,
compression steel, and parameter Z on curvature of sections
is discussed and tables for moment and curvature after
crushing are included.
4o1 INTRODUCTION
Using the concrete theories developed in Chapter 2, it
is possible to obtain moment-curvature responses for
monotonically-loaded T sections with or without axial load.
Rectangular sections can be considered as special cases of
the generalised T-shape with flange width equal to web
width and flange depth equal to any percentage of
97
effective depth~
Using the analyses discussed in this chapter, a
computer program was written for the solution of these
moment-curvature relations and the effects of steel content,
parameter z, and axial load on ductility were studiedo
4o2 STRESS BLOCK FOR CONCRETE
Two simplifying assumptions were made when considering
the stress block for concrete:
1o Tension capacity of concrete was neglected because
it was felt that the additional programming was not
warranted, there being twelve general section types for
consideration anyway and the effect of concrete tension
after cracking is negligible in practical caseso
2o The stress-strain response of unconfined concrete
is assumed to follow the stress-strain response of the
bound concrete in the section up to spalling strain, after
which the unbound concrete makes no contributiono The
reason for this simplification is discussed fully in Chap
ter 5o
The stress-strain response for concrete adopted in
this thesis is reproduced in Figure 4o1o
4o2o1 Region 1: E ~ E C 0
In this region the stress is given as:
[
2€ f = f' __£
c1 c E 0
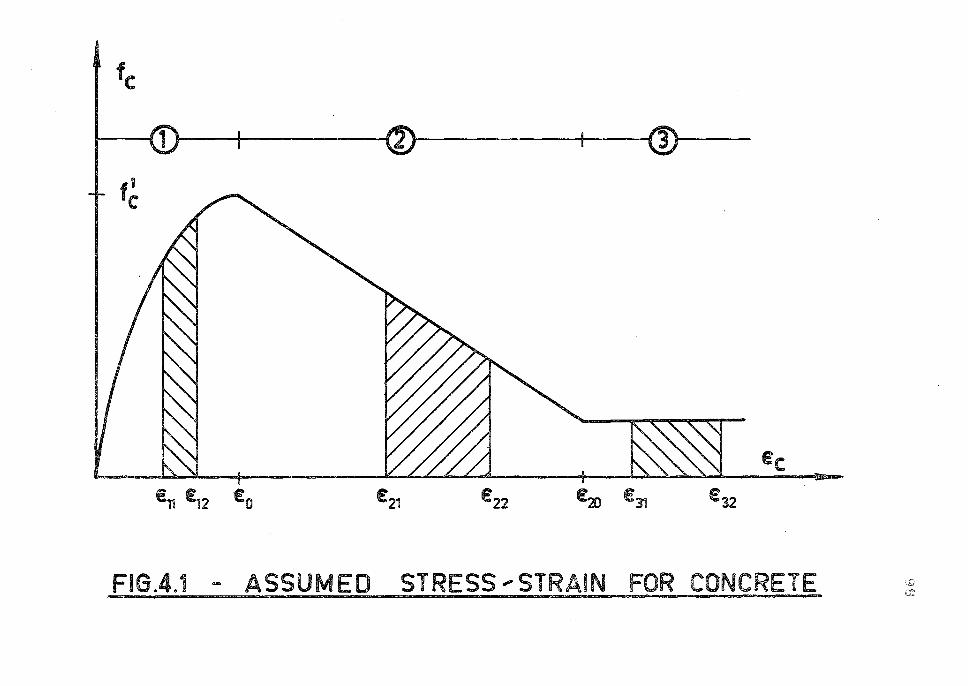
fc
I •1 -----------«
f; C
E11 £12 £ 0 t2,
-------)--
Ee -€22 Eai €31 £32
FIG.4.1 - ASSUMED STRESS--STRAIN FOR CONCRETE -
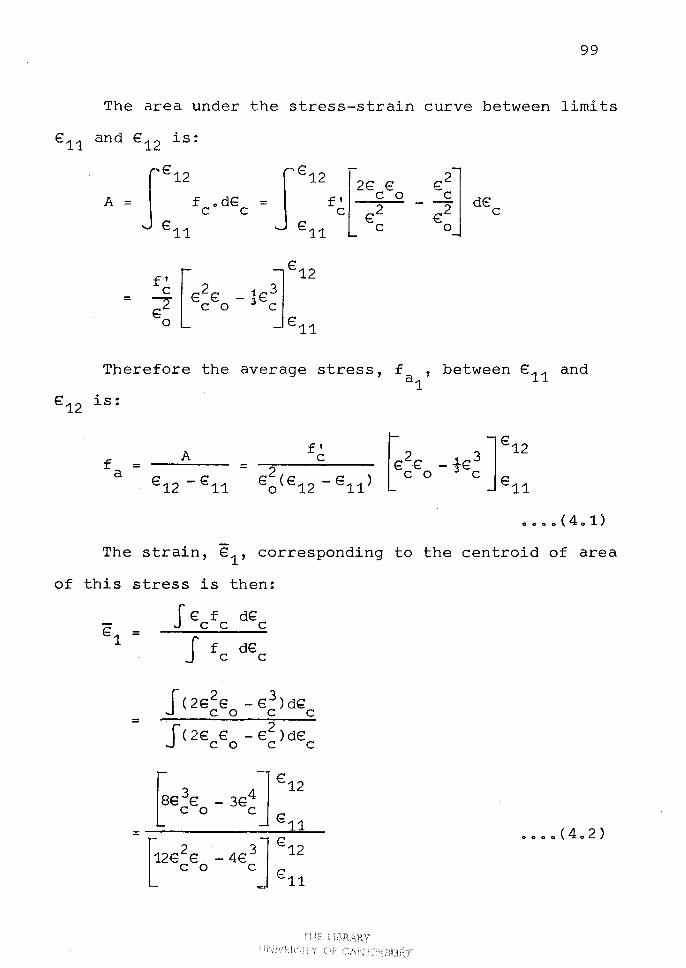
99
The area under the stress-strain curve between limits
J-€ l 12 2€ € = f I C 0
C €2 €11 C
=
d€ C
Therefore the average stress, fa1
, between € 11 and
€12 is:
f = a
A f' C
The strain, E1 , corresponding to the centroid of area
of this stress is then:
=
J € f C C
d€ C
d€ C
J(2€ € -€2 )d€
C O C C
~€3€ - 3€4] €12 L C O C € = ---------=-1 .... 1_
[12€2€ _ 4€3J €12
C O C € 11
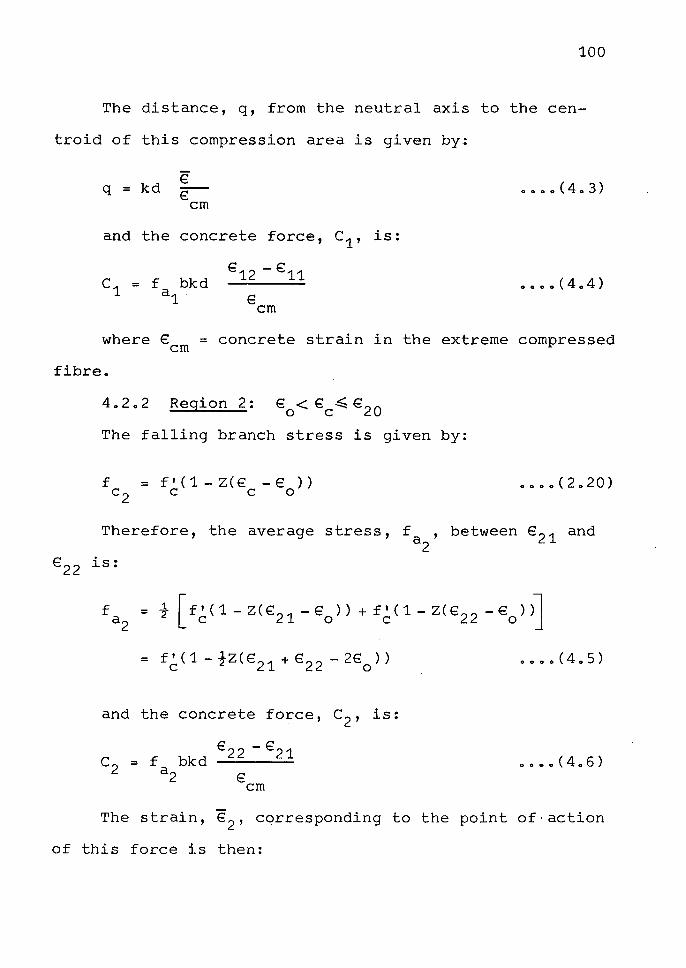
100
The distance, q, from the neutral axis to the cen
troid of this compression area is given by;
q = kd € r-em
and the concrete force, c1 , is:
= f bkd a1
oooo(4o3)
where€ = concrete strain in the extreme compressed cm
fibreo
4o2o2 Region 2: € < € ~ €20 0 C .
The falling branch stress is given by:
f = f'(1-Z(€ -€ )) c 2 C C O
0000(2020)
Therefore, the average stress, fa2
, between € 21 and
€22 is:
0000(405)
and the concrete force, c2 , is:
€22 - €21 c2 = f bkd ---- • 000(4.6)
a2 € cm
The strain, E2 , corresponding to the point of·action
of this force is then:
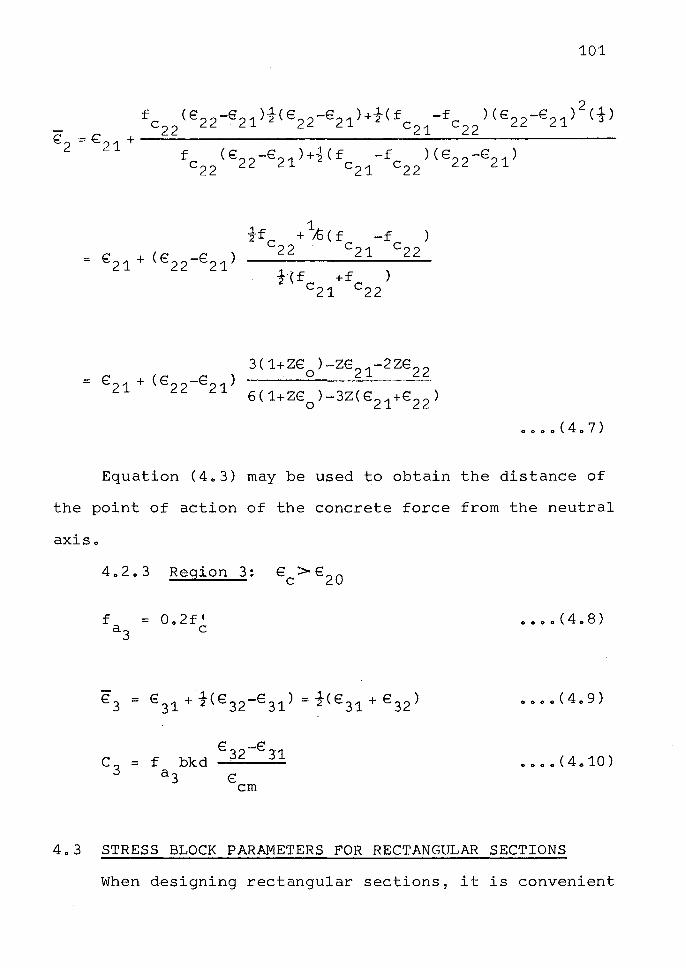
101
Equation (4o3) may be used to obtain the distance of
the point of action of the concrete force from the neutral
axiso
= 0 2f 1 o C
4.3 STRESS BLOCK PARAMETERS FOR RECTANGULAR SECTIONS
When designing rectangular sections, it is convenient
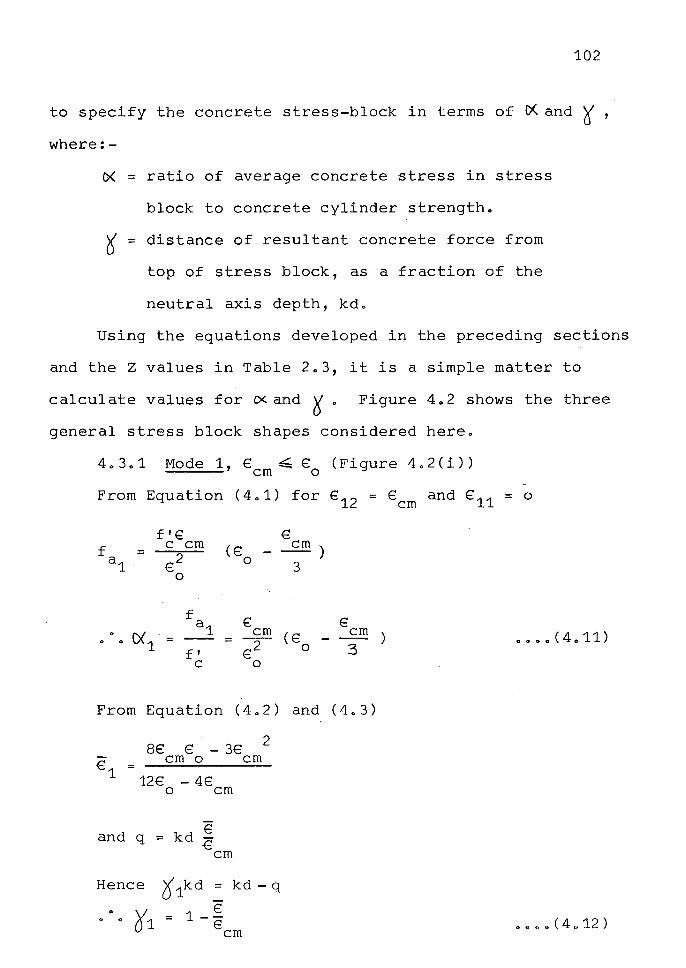
102
to specify the concrete stress-block in terms of o< and t, where:-
D( = ratio of average concrete stress in stress
block to concrete cylinder strengtho
~=distance of resultant concrete force from
top of stress block, as a fraction of the
neutral axis depth, kdo
Using the equations developed in the preceding sections
and the Z values in Table 2o3, it is a simple matter to
calculate values for <X and t o Figure 4 o 2 shows the three
general stress block shapes considered here.
Mode 1, € ~ € (Figure 4.2(i)) cm o
From Equation (4.1) for e12 = €cm and € 11 = o
f'€ c cm €2
0
(€ -0
€
€ cm) 3
0 0( 0 0 1 = = cm(€ 70 f'
C 0
From Equation (4.2) and (4.3)
8€ € - 3E cm o cm €
1 12€ - 4€
and q
o cm
= kd ~ € cm
2
Hence t 1kd = kd - q
o
0
o~\=1-! cm
o e o o ( 4@ 12 )
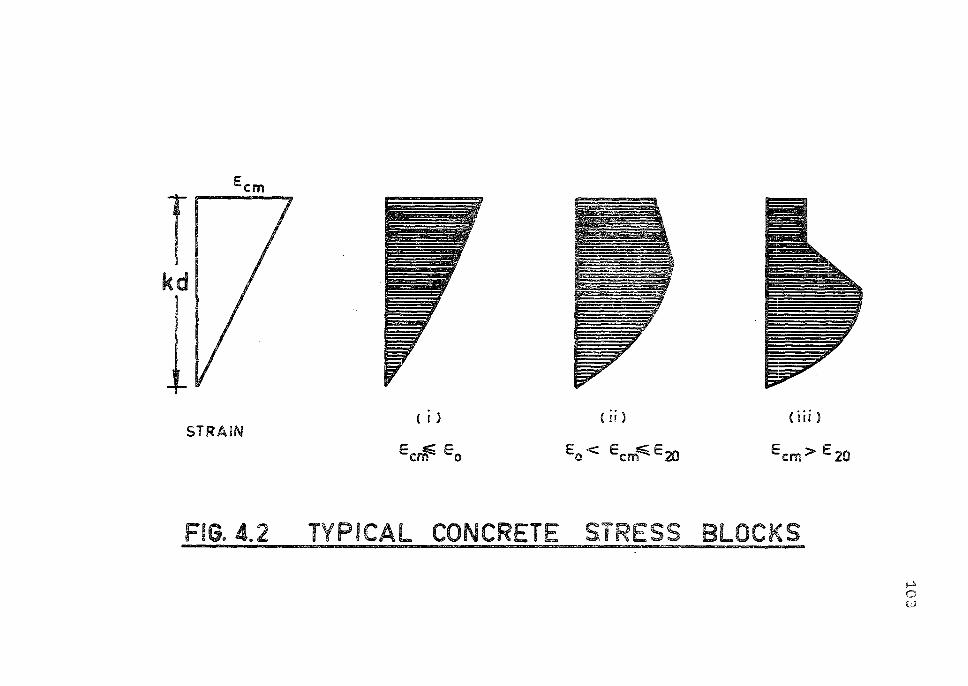
Ecm
T kd
STRAIN
FIG. 4.2
( i }
Ee~ Eo
( ii )
Eo < Ecm~E20
(ii i )
Ecm> IE20
TYPICAL CONCRETE STRESS BLOCK:S
1-1 0 t,)
4a3o2 Mode 2, € <€ ~€20 (Figure 4o2(ii)) o cm
Region 1: E ~ € C 0
f = .2.fl c1 = f bkd a1 3 C ' a1
€1 _s_E kd €1
= 8 0 ' q1 = €
cm
Region 2: e <E ~ € o c cm
f = f I ( 1 - tz( € - € ) ) a2 c cm o
€ -E c2 f bkd cm 0
= a2 € cm
From Equations (4o7) and (4o3):
E2 = e + ( e - e ) o cm o
e cm
Parameters 0<. and r
3-2Z(E -€) cm o
6 - 3Z(E - € ) cm o
E _£
€ cm
104
()(2 =
q =
C bkdf'
C = t
Region 1:
e o + (1-½Z(E: -€ ))
cm o €cm
E -<.e C 0
As for Mode 2
From Equations (4o7) and (4o3):
E cm
Region 3:
3 - 22( € - € ) 20 0
e20~ e ~ e c cm
~ - e cm o
e cm
105
0000(4014)
From Equations (4o9) and (4o3):
Parameters CX: and a:1
()(3 = c1 + c2 + c3
bkdf'. C
q = C1q1 + C2q2 + C3q3
c1 + c2 + c3
= 1 _ SI kd
4a3.4 Tables of 0( and 6 Values
106
0 0 0 0 ( 4 0 16 )
Tables 4.1 and 4o2 show values of~ and t respectiv-
ely, computed for Modes 2 and 3 (i.e. e ~ e , where € = cm o o
0.002). Note that if a value of e greater than the cm
spalling strain, ecr' where €er= 0.004, is chosen, then
the stress-block should refer only to the bound concrete
section.
For Mode 1, i.e. € <t , IX and V can be found simply cm o 0
from Equations (4.11) and (4.12).
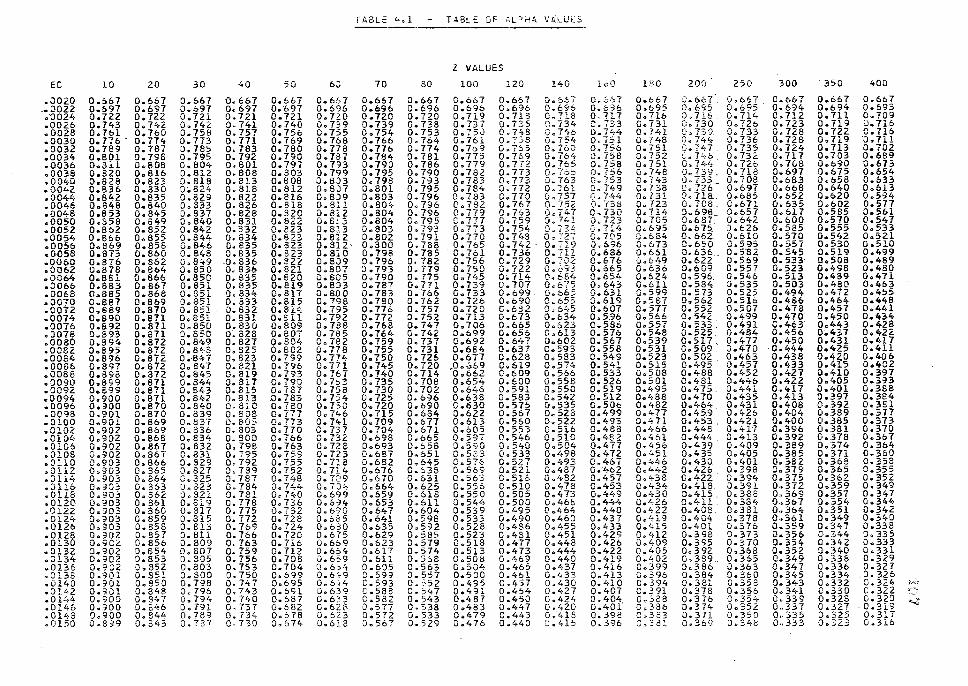
rAoLE 4.1 - TABLE GF ALDrlA v,LUES
Z VALUES
EC 10 20 30 40 50 6J 70 80 100 120 140 loO lBO zoo 250 300 . 350 400
.0020 0.&67 0.667 D.667 0.667 0.667 O.M7 0.667 0.667 0.667 0.667 0.667 o. 2,6 7 0.667 o.&6t. o.667 o.667 0.667 0.667 .• 0022 o.&97 0.697 0.697 o.&97 0.697 0.696 O.f,96 0.696 0.696 0.696 0.696 o. 696 0.695 0.695 0.695. 0.694 0.694 0.693 ,.-0024 0.122 o. 722 0.121 0.721 0.721 o.no 0.720 0.720 0.719 o. 718 o. 718 o. ?l..1 o.716 0~ 716 o. 714 o. 712 o. 711 0.709 .0026 o. 743 o.742 0.742 o. 741 0.740 o.739 o.739 0.738 0.131 o. 735 o.734 o. 733 0.131 c: .. 730 0.726 0.723 0.719 o. 716 .0028 o. 761 0.760 0.758 0.757 0.756 0.755 0.754 0.753 0.75J o. 7+8 0.7'+6 0.744 0.741 01a7'39 0.733 0.728 0.122 o. 716 .0030 o.776 · o.774 o. 773 o. 771 o.769 o.768 0.766 o.764 0.761 0.'?58 0.,754 o .. 1s1 o. 748 o. 74';, 0.736 0.728 0.119 ·o. 111 .0032 o.789 0.787 o.785 o.1a3 o.1ao 0.778 0.776 0.774 0.769 0.765 0.760 o.7:-o 0.151 G.747. 0.735 0.724 o. 713 0.102 .0034 0.801 0.798 o.795 o. 792 0.790 0.787 o.784 0.781 o.775 o.769 o.764 0.758 0.152 C. 7 <,6 0.732 o. 717 0.703 0.689 .0036 0.811 0.808 0.804 0,801 0.797 0.793 0.790 0.786 0.779 o. 772 0.765 0.758 o. 751 0. 7'-cl: 0.726 0.708 0.690 0.673 .0038 o.820 0.816 0.812 o.808 o.ao3 o. 799 o.195 0.790 0.782 0.773 Q.,765 o.?56 o.748 Q. 739. o. 718 0.697 0.675 0.654 .0040 D.828 0.823 0.818 o.813 0.808 0.8)3 0.798 0.793 0.783 o.,, 773 o.763 Oc. 753 o.743 o.733 o.,os 0.683 0.658 0.633 .0042 0.836 0.830 0.824 o.a1a o.a12 0.807 0.801 0.795 o.784 o. 772 0.,61 o.749 0.13a c. 726- 0.697 0.668 0.640 0.613 .0044 0.842 0.835 0.829 0.822 0.816 0.8J9 D.803 0.796 0.783 o. 770 0.757 0~744 o. 731 o. 11a. 0.685 o. 652 0.620 0.594 .0046 0.848 0.840 0.833 0,826 0.818 o. 811 0.804 0.796 o.1s2 0.767 o. 752 0.73l:l 0.123 0. 708. 0.-671 0.635 0.602 0.577 .0048 0.853 0.845 0.837 0.828 0.320 0.812 0.004 o. 796 o. 779 o.7o3 0,747 0.130 o. 714 0.698_. 0.657 o. 617 o.585 o.561 .ooso o.s5s o.649 0.840 o. 831 0.822 o. 8.:.3 0.804 0.795 0.111 o.759 0~741 0.723 0.10s o. 687 0.642 o. 600 0.570 0.547 .0052 o.862 o.ss2 o.B42 o.s32 o.s23 0.813 0.803 0.793 0.773 0.754 Q;;, :·34 (L 714 0.695 0.675_ 0.626 0.585 0.555 o.533 .0054 0.866 0.855 0.844 0,834 0.823 o. 812 0.802 0.791 0.110 o. 748 Qi;., J27 Ci. 705 D .. 684 0.662 0.610 0.570 0.542 0.521 .0056 0.869 0.858 o. 8-46 o. 835 o.823 0.812 o.aoo 0.788 0.765 o. 742 · o. 719 0.696 0.673 0.650 0.595 o.557 o.530 o.510 .ooss 0.873 0.860 0.848 0.835 0.823 o. 810 0.798 0.785 00761 0.736 o. 711 0.686 0.661 o. 636 ... 0.582 0.545 0.519 0.499 .0060 0.876 0.862 o.849 -0. 836 o.s22 0.809 o.796 o. 782 0.756 o. 729 O."?OL 0.676 0.649 0.622 o.569 0.533 o.5oa 0.489 .0062 ll.878 o.864 o. 850 0, 836 0.821 0.807 0.793 o. 779 0.750 o. 722 0(,,:,9,3 0.665 0.636 0.609 0.557 0.523 0.498 0.480 .0064 0.881 0.866 0.850 o. 835 o.820 a.sos 0.190 o. 775 o.745 o. 714 0~664 ().b54 0.624 o. 596. 0.546 o.513 0.489 0.471 .0066 0.883 0.867 0.851 0,835 0.819 0.803 0.787 O.T!l o. 739 0.707 0.675 ().643 0.611 0.584 0.535 0.503 0.480 0.463 .0068 0.885 0.868 0.851 0.834 0~817 o. 800 o.783 o.766 0.733 0.699. 0.665 o. 631 Q.599 o. 573 0.525 0.494 0.472 0.455 .0010 0.887 0.869 0.851 0.833 0.815 o. 798 0.180 0.762 o.726 0.690 0 .. 655 0.619 0.587 0.562 0.516 0.486 0.464 0.44B .0072 0.889 0.870 o. 851 0.832 0.814 0.795 o.776 0.757 0.720 G.682 O,.cAS 0.607 o.577 o. 552 . 0.507 0.478 0.457 0.441 .0074 0.890 0.871 o. 851 o. 831 o.s11 0.792 o. 772 0.752 o. 713 0.673 0.634 0.596 o.566 0.542 0.499 0.470 0.450 0.434 .0076 O.B92 o.871 o.aso o. 830 0.809 o.1aa o.768 o.747 0.706 0.665 0.623 o.586 o.557 o. 533 . 0.491 0.463 0.443 0.428 .0078 0.893 0.871 0.850 0~828 0.807 0.785 o.764 0.142 0.699 0.656 0.613 o.576 o.548 o.525 0.484 0.456 0.437 00422 .0080 0.894 0.872 0.849 0.827 o.804 0.782 0.759 0.737 0.692 0.647 0.602 0.567 c.539 o. 517 .. 0.477 0,450 o.r.31 0.417 .0082 o.895 o.a12 0.8',-S 0.825 0.802 o. 778 o.155 o. 731 0.684 0.637 o.593 o.558 o.531 0,509 0,470 0.444 0.425 0.411 .0084 0.896 0.872 0.·847 o. 823 o.799 0.774 0.750 o. 726 o.677 0.628 o.583 o. 549 0.523 o.so2 0.463 0,438 o.,c.;;o 0.406 .0086 0.897 o. 872 o. 847 0.821 o.796 o. 771 o.745 0.120 _0.669 0.619 0.574 0.541 o.s1s 0.495 0.457 0,433 0.•415 0.402 .0088 0.898 0.872 0.845 o. 819 o. 793 o.767 0.740 D.714 0.662 O.c09 o.566 o.533 a.sos 0.488 0.452 0,.427 0,410 0.397 .0090 0.899 o.sn o.844 o. 817 0.190 o. 763 0.735 0.708 0.654 0.600 o.55£ 0.526 0.501 0,481 0.446 0 .. 422 0,·1+05 0.393 .0092 0,899 0.871 0.843 0.815 o.787 0.758 0.730 0.102 0 • 64,6 0.591 o.sso 0.519 0,495 0.475. 0.441 0 .• 411 0.401 0.388 .0094 0.900 0.871 0.842 0.813 .o. 783 o.754 0.725 0.696 0.638 0.583 0.542 0.512 0.488 0.470 0.435 0,,413 0.397 0.384 .0096 0.900 0.870 0.840 o.810 o.7ao o.1so 0.120 0.690 0.630 0.575 o.535 0.506 0.482 0.464. 0.431 o .• 4os 0.392 0.381 .0098 0.901 0.870 0.839 Q.808 0a777 o.746 o. 715 0.684 0.622 0.567 o. 528 0.499 Q.477 0.459 0.426 0,.404 0.389 0.377 .0100 0.901 0.869 0.837 0.805 o. 773 0.741 0.709 0.677 0.613 0.560 0.522 0.493 0.471 o. 453 . 0 .421 0 .. 400 0.385 0.373 .0102 0.902 o.869 0.836 o. 803 o.710 0.737 0.704 0.671 0.605 0.553 o.516 0.488 o.466 o. 448 0.417 o,.396 0.3B1 0.310 • 0104 0.902 0.86B 0.834 o. 900 o.766 o. 732 0.698 0.665 0111 5917 0.546 o.s10 0.482 0.461 0.444 0.413 o .• 392 0.378 0.3&7 .010& 0.902 0.867 o.832 0.798 o.763 0.728 0.693 0.658 0 .. 590 o.540 o.504 o.477 0,456 0-439 0.409 0 .. 389 0.374 0.364 .0108 0.902 0.867 0.831 0.795 o.759 0.123 0.687 o. 1>51 o.583 0.533 0.498 0.472 o.451 0.435 0.405 0,.385 0.371 0.360 .0110 C.903 0.866 0.829 0.792 o.755 o. 718 0.682 0,645 0.576 00327 0.493 0.467 0.446 0.430 0.401 0 .. 382 0.368 0.358 .0!12 00903 0.865 o.s21 o.789 0.152 o. 714 0$676 0.638 0.569 0.521 0.4B7 o.·4o2 0.442 o.426 0.398 0 .. 379 0.365 0.355 .0114 0.903 0.864 o.825 0.787 0.748 o. 7[•9 0.610 0.631 o.563 0.516 0.482 0.457 0.438 0.422 0.394 0 .. 375 0.362 0.352 o0ll6 0.':103 0.863 o.823 0.784 o.744 0(1 70!;- 0.664 0.625 o.556 0.510 0.478 0.453 0.434 o. 418. 0.391 0 .. 372 0.359 0.349 .0118 0.903 0.862 0.821 0.781 0.740 0.699 0.659 0.618 o.sso 0.505 0.473 0.449 0.430 0.415. 0.388 0 .. 369 0.357 0.347 .0120 0.903 0.861 0.819 o.778 o. 736 0.694 0.653 0.611 o.544 0.500 0.46b 0.444 0.426 o.411 0.384 0,,31>7 0.354 0,344 .0122 0.903 0.860 0.817 o. 775 o. 732 0.6S?O 0.647 0.604 0.539 0,495 o.,,,64 0.440 0.422 0.408. 0.381 0 .. 364 0.351 0.342 .0124 0.903 o.859 0.815 o. 772 0.728 0.685 0.641 0.598 0.533 0.490 0.460 0.437 0.419 0.404 0.378 o,.361 o.349 0.340 .0126 0.903 0.858 0.813 0.769 0.724 0.630 0.635 0.592 o.sze 0.486 0.455 0.433 0.415 0.401 0.376 0 .. 359 0.347 o.338 • 0128 0.902 0.857 o. 811 o.766 0.120 0.675 0.629 0.585 o.523 0.431 0.451 0.429 0.412 0.398 0.373 0 .. 356 0.344 o. 335 .0130 0.902 0.856 0.809 0,763 o. 716 0.669 0.623 0.579 o.518 0.477 0.448 0.426 0.409 o.395 0.370 0,.354 0.342 0.333 .0132 0.902 0.854 o.so1 o. 759 o. 712 o. 664 0.617 o.574 o.513 0.473 0.444 0.422 Q.405 o. 392 0.368 0 .. 352 o.:)40 0.331 .0134 0.902 0.853 0.805 0.756 0.10s 0.659 o. 611 0.5&8 0.508 0.4h9 0.440 0.419 0.402 0.339 0.365 0,.349 0.338 0.329 .0136 0.902 0.852 0.803 o. 753 0.704 0.6:i4 0.605 0.563 0.504 0.465 0.437 0.416 o.399 o.386 0.363 0,.347 0.336 0.327 .0138 0.901 0.851 0.800 o.1so 0.699 o.r,c.9 0.599 o. 557 o.soo 0.461 0.433 0.413 o.396 o.384 0.360 0,.345 0.334 . 0. 326 .0140 0.901 0.850 0.798 o.747 0.695 0. &,, 4 0.593 0.552 0.495 0.457 0.430 0.410 0.394 o.381 0.35S 0 .. 343 0.332 0.324 • Ol.<s2 0.901 0.848 o. 796 o. 743 0.691 o. 639 o.588 o. :,47 0.491 0.454 0.427 0.407 o. 391 0.378 0.356 o .. 341 0.330 C.322 .0144 0.900 0.847 o. 794 0.740 0.687 0.633 0.582 0.543 0.487 0,450 Oc0424 g:zg1- 0.338 o.376 0.354 c .. 339 0.328 0.320 -..J .0146 0.900 0.646 O. Hl 0,737 0.682 0.628 0.577 0,538 0.483 0.447 0-420 0,386 o.374 0.352 0,.337 0.327 .0.3i9 • 014-8 0.900 o. 844 0,789 o. 734 0.678 0.623 o.572 0.533 0.479 0.443 O.t..18 0.398 C.383 0,371 0.350 o .. 335 0.325 o. 317 .0150 0,899 0.843 o. 737 o. 730 0.674 0.618 0.567 o. 529 0.476 0.440 lJ. 415 Q..,396 0~381 o.369 o.348 0,,333 0.323 0.316
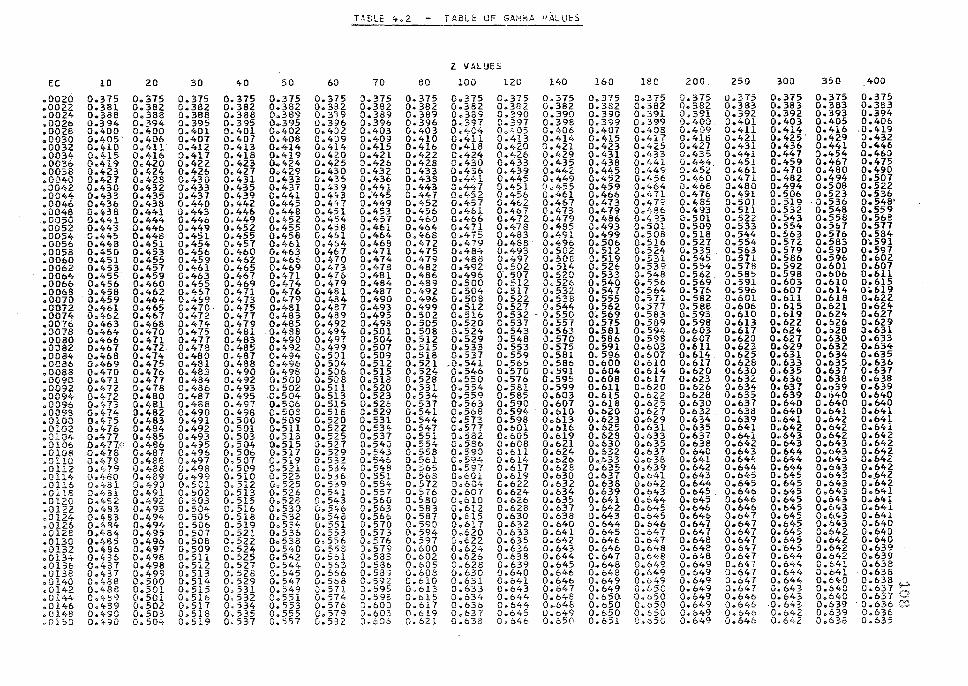
T~BLE 4~2 - TABLE OF GAMMA viLu~s
Z VALUES
EC 10 20 30 40 50 60 70 80 100 120 140 160 180 200. 250 300 3150 400
.0020 0.375 0.375 0.375 0.375 0.375 0.375 D.375 0.375 0.375 0.375 0.375 0.375 0.375 0.375 o.375 C•• 375 0.375 0.375
.0022 0.381 0.382 0.382 0,382 0.382 o. 382 0.382 o.382 o.382 0.382 0.382 o.382 0.382 0.382 0.383 o. 383 0.383 0.383
.0024 0.388 o.388 0.388 o.388 o.3s9 0.339 0.389 0.389 0.389 0.390 0.390 0.390 0.391 0,391 0.392 Cl.392 o.393 0.394
.0026 0.394 0.394 0.395 0.395 o •. 395 0.3::16 0.396 0-396 o.397 0.397 o.398 Oc399 o.399 0.400 0.401 0.403 o.405 0.406
.0028 0.400 0.400 0.401 0.401 0.402 o. 4:)2 0.403 0.403 0$404 Do ,;05 0.406 0.407 0.408 o. 409 0.411 0.414 0.416 .0.419
.0030 0.405· 0.406 0.407 0.407 0.408 0.409 0.409 0-410 0.411 0.413 o.414 0.415 o.417 0.416 0.421 0.425' 0.429 0.432
.0032 0.410 0.411 0.412 o.413 0.414 0.414 0.415 0-416 0.418 0.420 0.421 0.423 0.425 0.427 0.431 01• 436 0.441 0.446
.0034 0.4-15 0.416 0.417 0.418 0.419 o.420 0.421 Q.422 o.424 0.426 0.429 0.431 0.433 0.435 0.441 0.447 o.454 0.460
.0036 0.419 0.420 0.422 0-423 I)., 424 0.425 0.426 0.428 0.430 0.433 0.435 0.438 o.441 0.444. 0.451 Ol.459 0.467 0.475 • 0038 0.423 0.424 0.426 0.427 0.429 0.430 0.432 0.433 0.436 0.439 0.442 0.445 Q.449 0.452 0.461 0.470 o.480 0.490 .0040 0.427 0.428 0.430 0.431 0.433 0.435 0.436 0.438 0 .4.:,1 0.445 0.449 0.452 0.456 0.460 0.471 0.482 0.494 o.5o7 .0042 0.430 0.432 o.433 0.435 0.437 0.439 0.441 0.443 !)0447 0.451 0.455 0.459 0.464 0.468 0.480 0.494 o.508 o.522 .0044 0.433 0.435 o.437 0.439 0.441 0.4'>3 0;445 0.447 o.452 0.456 0.461 C.466 o.471 0.476 0.491 C.506 o.523 0.536 .0046 0.436 0.438 0.440 0.442 0.445 0.447 0.449 0.452 0.457 0.462 0.467 0.473 0.479 0.485 0.501 0.519 .Q.536 0.548· .0048 0.438 0.441 0.443 o.446 0.448 0.451 0.453 0.456 o.461 0.467 o.473 0.479 o.486 0.493 0.511 0.532 o.548 o.559 .0050 0.441 0.444 0.446 o.449 0.452 0.454 0.457 0.460 C.466 0.472 0.479 0.496 o • .;,si::; 0.501 0.522 0.543 o.558 0.568 .0052 0.443 0.446 0.449 0.452 0.455 0.458 0.461 0.464 0.471 0.478 0.485 0.493 o.so1 0.509 0.533 o.554 o.567 o.s11 .0054 0.445 0.448 0.451 0.455 0.458 0.4E>l 0.464 0.468 0.475 0.483 0.491 0.499 0.508 0.518 0.544 0.-563 o.576 o.584 .0056 0.448 o. ,,51 o.454 0.457 0.<,61 0.4&4 0.468 0.472 0.479 0.488· 0.496 0.50b o.516 0.521_ o.554 o.512 o.583 0-.591 .0058 0.450 0.453 0.456 0.460 0.463 0.467 0.471 0.475 0.484 0.493 o.502 0.512 o.524 0.535 0.563 0.579 0.590 o.597 .0060 0.451 0.455 0.459 0-462 0.466 0.470 0.474 0.479 0.488 0.497 o.soe 0.519 0.531 o.545 o.571 0.586 o.596 0.602 .0062 0.453 0.457 0.461 0.465 0.469 0.473 0.478 0.482 0~4gz 0.502 0.514 0.526 o.539 o. 554 0.578 o. 592 0.601 0.607 .00&4 0.455 0.459 0.463 0.467 0.471 0.476 0.481 0.486 00496 0-.507 0.520 0.533 0.548 0.562 o.585 0.598 0.606 0.611 .0066 0.456 0.460 0.465 0.469 0.474 0.479 0.484 0.489 0.500 o.s12 0.526 0.540 o.556 0.569 0.591 0.603 0.610 o.615 .0068 0.458 0.462 o.467 0.471 0.476 0~481 0.487 0.492 o.so4 0.517 o.532 0.547 o.564 o. 576. 0.5% 0.607 0.614 0~619 .0070. 0.459 0.464 0.45-9 0.473 0.479 0.434 0.490 O-e496 o.5oa 0.522 0.538 0.555 o.57l 0.582 0.601 0.611 0.618 0.622 .0072 0.461 0.465 0.470 0.475 0.481 0.487 0.493 0.499 o.512 0.527 0.544 0.562 0.:577 o. 588 0.606 0,615 0.021 0.624 ,0074 0.462 0.467 0.472 0.477 0.483 0.489 0.495 0.502 o.516 0.532 - 0.550 0.569 o.583 0.593 0.610 0.619 0.624 0.627 .0076 0.463 0.468 0.474 0.479 o.485 0.492 0.498 0.505 o.520 0.537 o.557 0.575 o.5a9 o.598 0.613 0,622 0.626 o.629 .0078 0 .. 4!>4 0.470 0.475 0.481 0.486 0.494 0.501 0.508 o.524 0.543 0.563 o.5a1 0.594, 0.603 0.617 0 .. 624 0.028 o.631 .0080 0.466 0.471 0.417 0.483 0.490 0.497 o.504 o.512 o.s29 o.548 0.570 0.586 o.598 0.607 0.620 0.627 0.630 0.633 .0082 o.467 0.472 0.478 0.485 o.492 0.499 0.507 0.515 0.533 0.553 0.575 0.591 0.003 0,611 0.623 0 .. 629 0.632 o.634 .0084 0.468 0.474 0.480 o.487 0,494 o.501 0.509 0.518 0.537 0.559 0.581 0.596 0.607 0,614 0.625 0 .. 631 0.634 0.635 .0086 0,469 0.475 0.481 0.488 Orir496 0.504 0.512 0.521 .0.541 0.565 0.586 0.600 0.610 0.617 0.628 0.633 o.635 .0.636 .0088 0.410 0.476 0.483 0.490 0.498 o.506 o.515 0.524 o.546 0;570 o.591 0.604 0.614 o. 620 0.630 0 .. 635 0.637 0.637 .0090 o.471 0.477 0.484 0,492 0,500 o. 508 0.518 0.528 0~550 0.576 0.595 0.608 0.617 0.623 0.632 0.636 0.638 0.638 .0092 0.472 0.478 0.486 0.493 D,502 0.511 0.520 o.s31 o.554 o.581 o.599 0.611 0.620 0.626 0.634 0 .. 637 0.639 o.639 .0094 0.4-72 0.480 0.487 0,495 0.504 0.513 o.523 0.534 o.559 o.585 0.603 0.615 0.622 0.628 0.635 0 .. 639 0.640 0.640 .0096 0 .. 473 0.481 0.488 0.497 o.so6 0.515 0.526 0.537 o.563 o.590 0.607 0.618 0.625 o.630 0.637 0 .. 640 0.640 0.640 .OOSl8 0,474 0.482 0.490 0.498 o.sos o. 518 o.529 0.541 o.5cs o.594 0.010 0.620 0.627 0.032 0.638 0.640 0.041 0.641 .0100 o.475 0.483 0.491 0.500 0.509 0.520 D.531 0.544 o.573 0~598 0.613 o.623 0.629 0.634 0.63.9 0 .. 641 0.642 o.641 .0102 00476 0.484 0.492 0.501 o.511 0.522 o.534 o.547 o.577 0.601 0.016 0.625 0.631 0.635 0.641 0 .. 642 0.642 0.641 .Ol04 o.477 0.485 0.493 0.503 0.513 0.525 0.537 0.551 0.582 0.605 0.619 0.628 0.633 0.637 0.641 0 .. 643 o.642 o.642 .0106 0.477:t 0.486 0.495 o. 504 o.515 0.527 0.540 o.554 o.5sc Q.608 0.621 0.630 0.635 0.638 0.642 0.643 0.643 0.642 .0108 0.478 0.487 0.496 0,506 o.s11 0.529 0.543 0.558 o.590 0.611 0.624 0.632 0.637 0.640 0.643 o.,644 0.643 o.642 .ono o. '!-79 0.488 0.497 0.507 0.519 0.532 o.546 o.561 Oto594 0.614 O.c26 o._633 0.638 0.641 O.b44 0 .. 644 o.&43 0.642 .(ll.12 0.,,79 0.488 0.498 0,509 Oo52l o. 534 0.548 0.565 0~597 0.617 0.628 0.635 0.639 0.642 0.644 0.644 0.643 o.642 =0114 o.4so 0.489 0.499 0.510 0-11523 0.536 0.551 0.568 0.601 0.619 0.630 0.637 0.641 o.643 0.645 0.645 o.t,43 o._642 .0116 O.G,B l D .. ~90 0.501 0.512 0.525 0.539 0.554 o.572 00604 0.622 0.632 0.638 0.642 0.644 0.645 0.645 0.643 o.642 e0ll8 0$!v6l 0.491 0.502 o. 513 o.526 0.541 0.557 0.576 0.607 o.624 0.634 0.639 0.643 o.645 0.646 0.645 o.&43 0.641 .0120 0.482 0.492 0,503 0.515 o.528 D.543 0.560 0.560 0.610 0.626 0.635 0.641 0.644 0.645 0.646 0.645 0.643 0.641 .0122 0.483 0.493 o.504 o.516 0.530 o. 5:.6 0.563 0.583 0.612 0.628 0.637 0.642 0.645 0.646 0.646 0.645 0.643 0.641 .0124 0.4B3 0.494 0.505 0.518 0.532 o. 548 0.566 0.587 0.615 0.630 0.638 0.643 0.645 0.64b 0.647 o. 645 0.643 0.641 .0126 o.•,84 0.494 0.506 0.519 o.534 o.ss1 0.570 0.590 0.617 0.632 0.640 0.644 0.646 0.647 0.647 0.645 00643 o.&40 .0128 o.484 O.t.,95 0.507 o. 521 o.536 0.553 0.573 0.594 0.620 0.633 0.641 0.645 0.647 0.647 0.647 0.645 0.642 o.640 .0130 o.465 0.496 o.508 o.522 o.538 o.556 o.576 0.597 0.622 Q.635 0.642 0.646 0.647 0.648 0.647 0.645 0.642 o.640 .0132 0.4-86 0.497 0.509 0.524 0.540 o. 558 0.579 0.600 0.624 0.636 0.643 0.646 0.648 0.648 0.647 0.045 0.642 0.639 .0134 Q.486 0.498 0.511 0.525 o.542 o.561 o.533 0.602 0.626 0.638 0.644 0.647 o. 64-8 0.648 0.647 0.644 0.642 0.639 .0136 0.487 0.498 0.512 o. 527 o.544 o.563 0.586 0.605 0.628 0.639 0.645 0.648 0.649 0.649 Q,.647 0.644 o.&41 0.638 .0138 0.487 0.499 0.513 0.526 o. 545 o.566 0.589 0.608 0.630 Q.640 0.646 0.648 0.649 0.649 0.647 0.644 o.t:,41 0.638 ';JO 1~70 0.488 0.500 0.514 o.529 o. 547 0.568 0.592. 0.610 0.631 0.641 o.64o 0.649 0.649 0.649 0.647 0.644 0.640 0.638 .0142 0.488 o.501 0.515 0,531 0.549 ;).571 Da595 0,613 0.633 0-643 0.647 0.649 0.650 0.649 0.647 O.b43 0.1>40 0.637 .0144 o.,;.e9 0.5{)1 0.516 0.532 o.551 Oo574 0.598 0.615 0.634 0.644 0.64E 0. 6 50. 0.650 O.b49 o.64o 0.643 0.640 0.637 .0146 o. 489 0.502 0.517 0.534 0.553 o.576 0.60::l 0.617 0.636 Q.644 0.648 0.650 0.650 0.649 o.&46 0.643 0.639 · 0.636 .0148 0.490 0.503 0.51B 0.535 0.555 o.579 0.603 0.619 0.637 0.645 O.c49 0.650 O.t-50 0.649 0.646 0.642 0.639 0.636 •. 0150 o.:.90 o.,oc. 0.519 0,537 0.557 o.532 0.606 0.621 0.638 0.646 o. 65(• 0.651 0,.,050 0.649 0.646 0.642 0.638 0.635
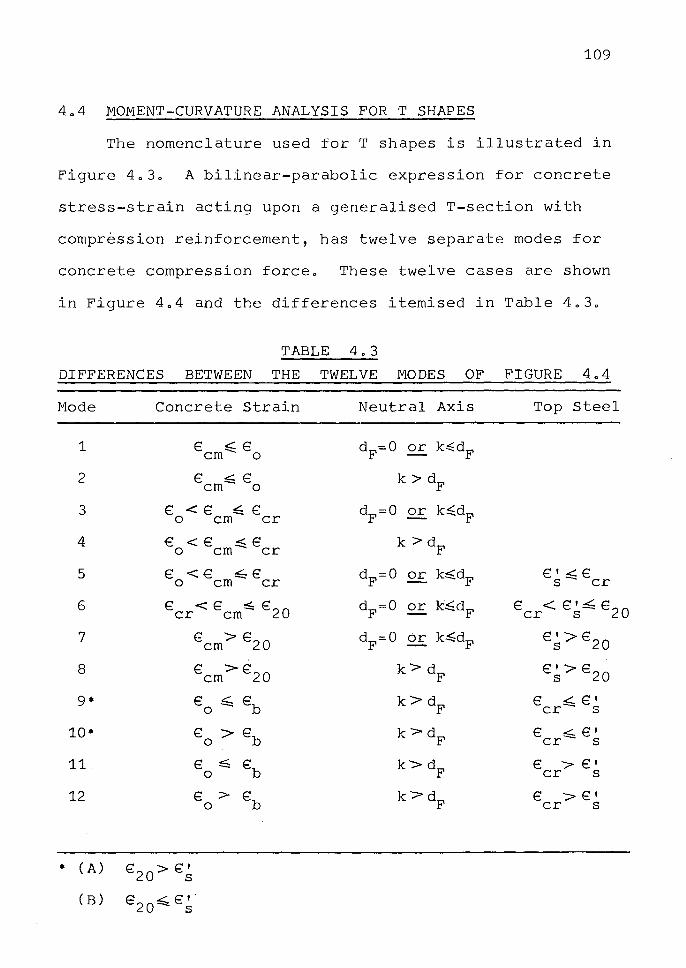
109
4o4 MOMENT-CURVATURE ANALYSIS FORT SHAPES
The nomenclature used for T shapes is illustrated in
Figure 4o3o A bilinear-parabolic expression for concrete
stress-strain acting upon a generalised T-section with
compression reinforcement, has twelve separate modes for
concrete compression forceo These twelve cases are shown
in Figure 4o4 and the differences itemised in Table 4o3o
TABLE 4o3
DIFFERENCES BETWEEN THE TWELVE MODES OF FIGURE 4o4
Mode Concrete Strain
1 € ~€ cm o
2 € ~€ cm o
3 € <€ ~ € 0 cm er
4 € <€ <€ 0 cm--.. er
5 € <€ ~€ 0 cm er
6 E: < E ~ €20 er cm
7 8 cm> 6 20
8 € >€ cm 20
9* € ~ Eb 0
10* € > Eb 0
11 € ~ Eb 0
12 € > Eb 0
* (A) 8 20> €~
(B) e20~€~
Neutral Axis
dp=0 2.E, k~dF
k > dF
dF = 0 2.E, k::'.;.dF
k >dF
d =0 F or k~dF
d =0 F or k~dF
d =0 F or k~dF
k> d F
k>dF
k > d F
k>dF
k> d F
Top Steel
€' <€ s -- er
€ <€'~ 6 20 er s
€~ > €20
€~ > €20
€ <'.'.. €' er--- s
€ ,.:::_ €' er~ s
€ > €' er s
€ >€' er s
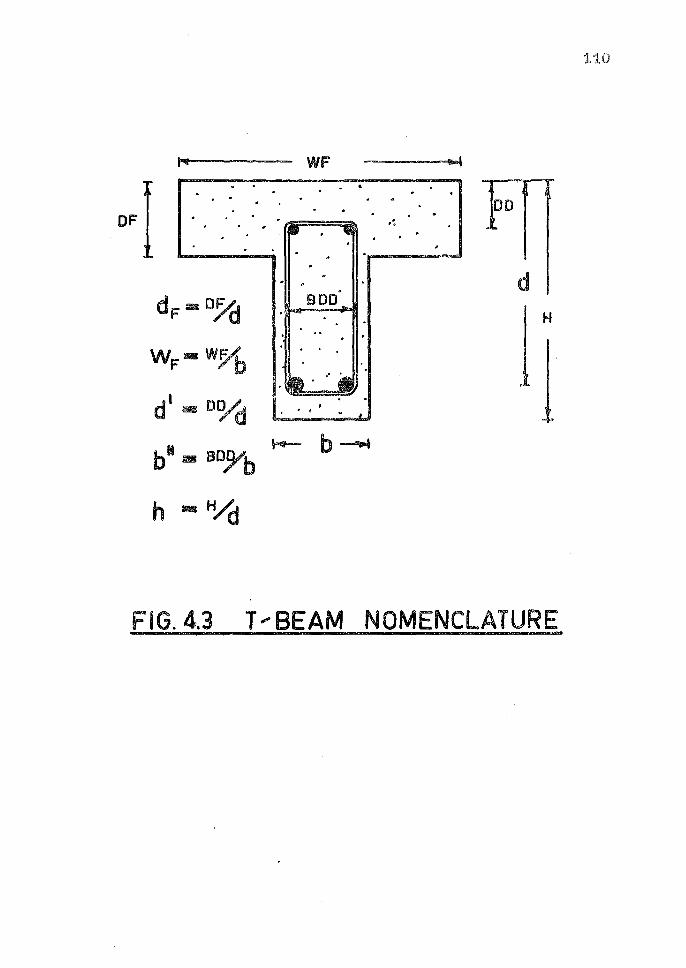
N----- WF
dF=D!YcJ
WF• W9b l d aD'½J •
' , 0 G>
~ b~ b N = eo;i.,~b
h - H/cJ
FIG.4.3 T---BEAM NOMENCLATURE
'110
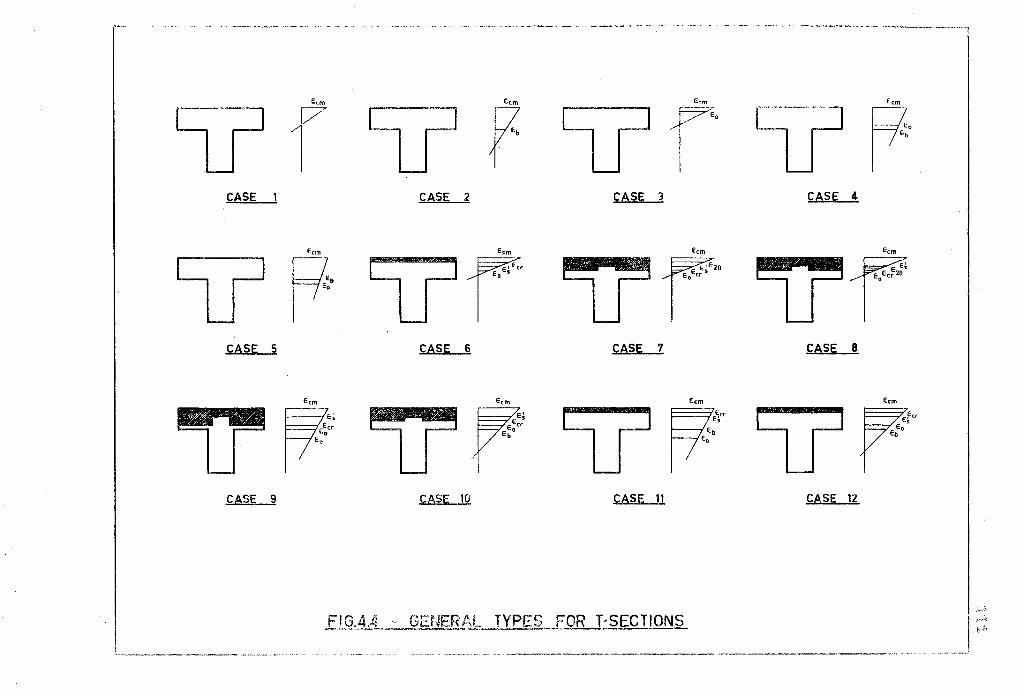
CASE 1 CASE 2 CASE 3 CASE 4
CASE 5 CASE 6 CASE 7 CASE 8
CASE 9 CASE 10 CASE 11 CASE 12
£1G:A~4 __ ~ GENERAL . TYPES FOR T-SECTIONS
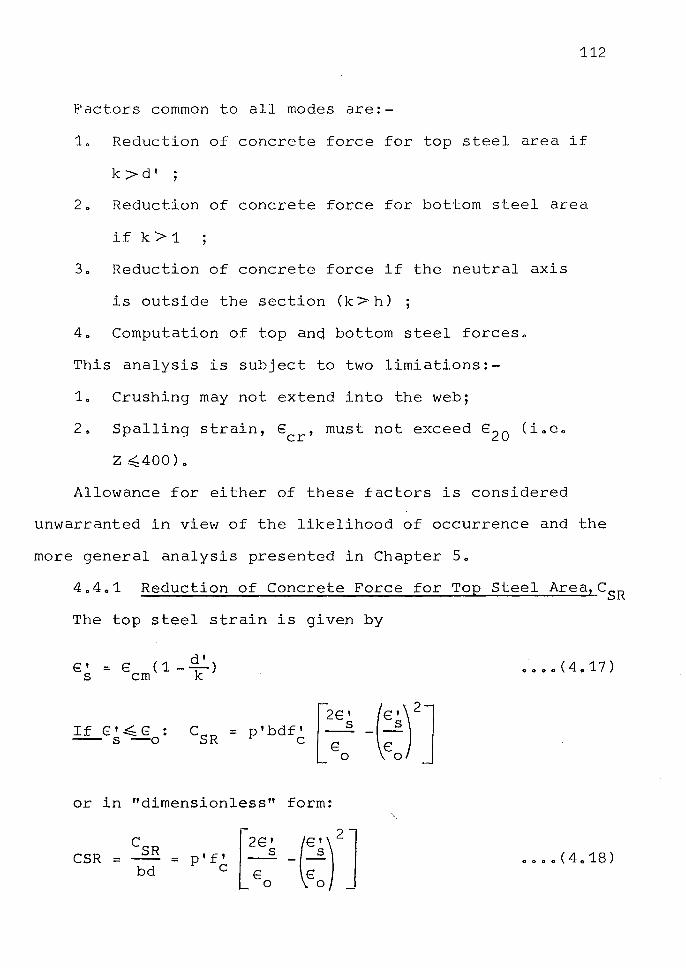
112
Factors common to all modes are:-
1o Reduction of concrete force for top steel area if
k>d'
2o Reduction of concrete force for bottom steel area
if k > 1
3o Reduction of concrete force if the neutral axis
is outside the section (k > h)
4o Computation of top and bottom steel forceso
This analysis is subject to two limiations:-
1o Crushing may not extend into the web;
2o Spalling strain, Ecr' must not exceed E20 (ioeo
Z~400)o
Allowance for either of these factors is considered
unwarranted in view of the likelihood of occurrence and the
more general analysis presented in Chapter So
4o4o1 Reduction of Concrete Force for Top Steel Area,CSR
The top steel strain is given by
€' s
If E'~E : C = p'bdf' ·r2€~ -(€~\2
] -- s -o SR c E € }
0 . 0
or in "dimensionless" form:
csR = csR == P' f~ l2e~ -(€~)2 I bd E €
0 0 _
0000(4018)
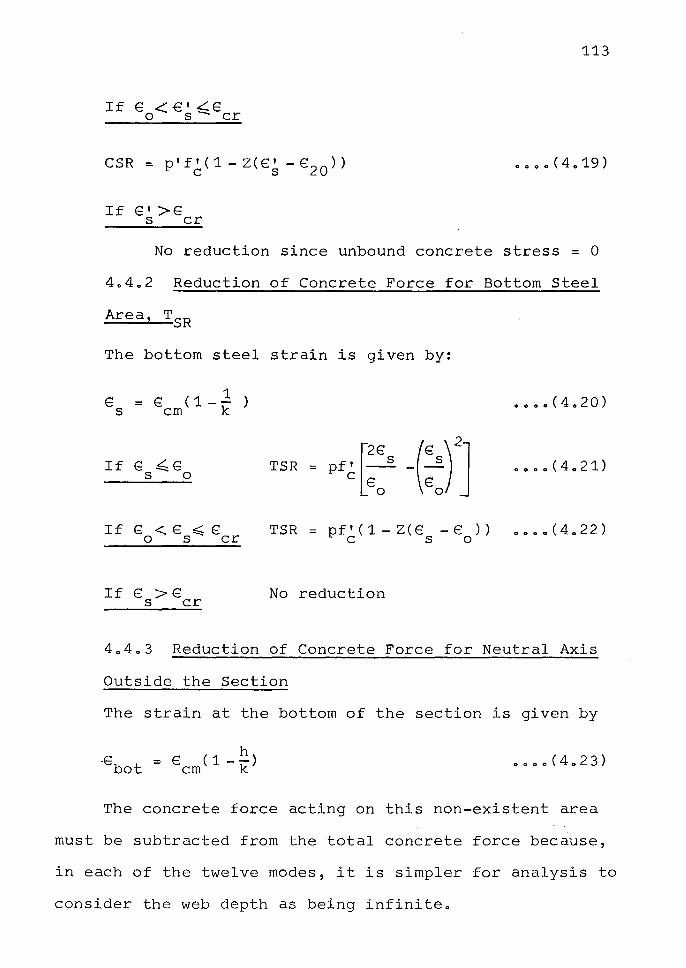
113
CSR= p'f'(1-Z(€' -€ )) C S 20
If €' >E s er
No reduction since unbound concrete stress= 0
4o4o2 Reduction of Concrete Force for Bottom Steel
Area, TSR
The bottom steel strain is given by:
e s
1 = ~cm ( 1 - k )
If€ ~E S 0
If € < E ~ € o s er
If € > € s er
TSR c pf~ [::S -(::)1 • • • • (4.21)
TSR = pf'(1-Z(€ -e )) 0000(4022) C S 0
No reduction
4o4o3 Reduction of Concrete Force for Neutral Axis
Outside the Section
The strain at the bottom of the section is given by
h -e = E (1--) bot cm k 0000(4 .. 23)
The concrete force acting on this non-existent area
must be subtracted from the total concrete force because,
in each of the twelve modes, it is simpler for analysis to
consider the web depth as being infinite.
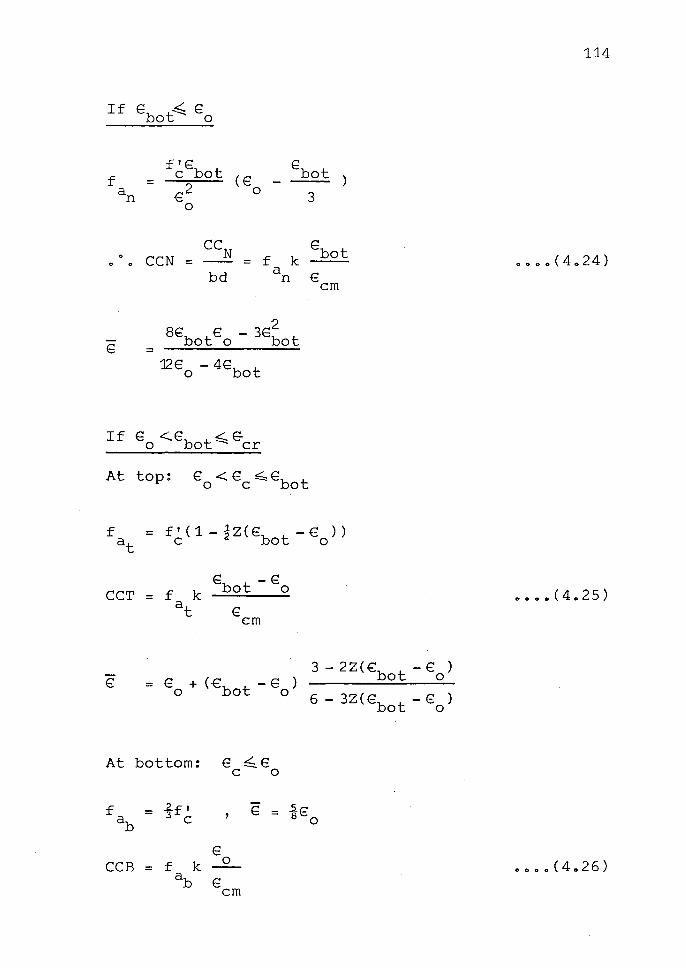
f f~Ebot
(E Ebot
) = €2
---an 0 3
0
0 CCN CCN
f k 8 bot
0 0 = = bd a
€ n cm
2
G BEbotEo - 3€bot
= '12E o - 4 Ebot
If G <.. Eb t ~ G-o o er
At top: E'. <E ~Gb t 0 C 0
= f' ( 1 -12 ( Eb t - € ) ) C O 0
CCT
e 3-22(€: -€)
bot o
6 - 32(€ - € ) bot o
At bottom: e ~e C 0
f = ff' E = A€ ab C 8 0
€ CCB f k 0
= ab E cm
114
0000(4024)
I'
0000(4025)
0000(4026)
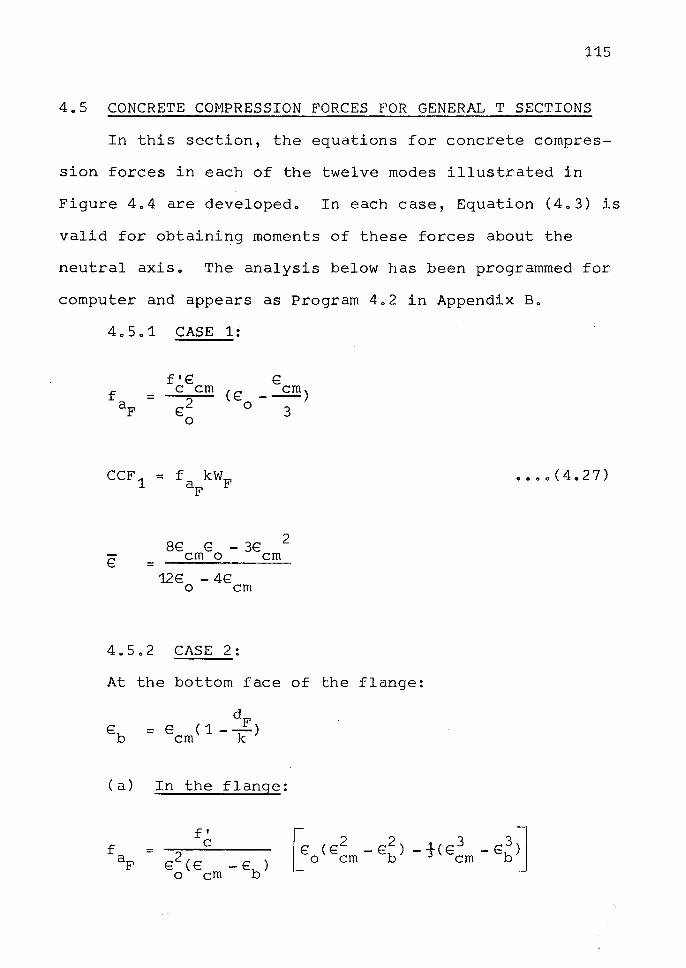
115
4.5 CONCRETE COMPRESSION FORCES FOR GENERAL T SECTIONS
In this section, the equations for concrete compres
sion forces in each of the twelve modes illustrated in
Figure 4.4 are developed. In each case, Equation (4.3) is
valid for obtaining moments of these forces about the
neutral axis. The analysis below has been programmed for
computer and appears as Program 4.2 in Appendix B.
4.5.1 CASE 1:
f'€ c cm €2
0
BE: G - 3€ 2
cm o cm =
12E: - 48 o cm
4.5.2 CASE 2:
At the bottom face of the flange:
(a) In the flange:
f' C
0000(4.27)
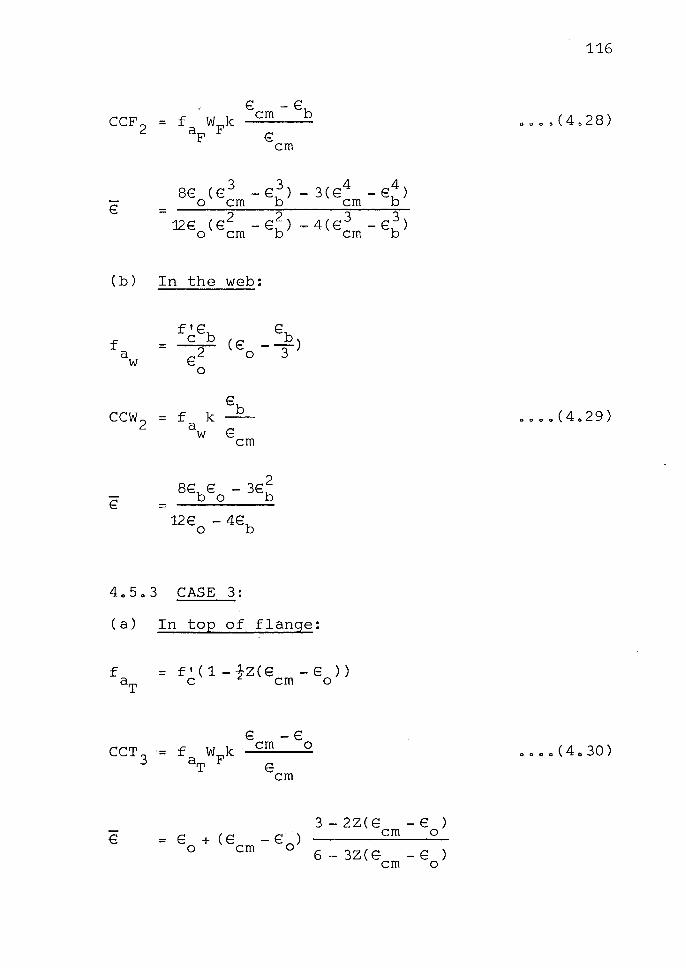
E
( b)
f a w
ccw2
E
( a)
E'. - E cm b
-f'. cm
In the web:
f'E Eb c b = 7
(E'. --) o 3
0
f k Eb
= a E w cm
CASE 3:
In top of flange:
== f'(1-½Z(E: -E )) c cm o
E - E cm o
3-2Z(E: -€) cm o
= E + ( e - E0
) o cm ) 6-3Z(E- -E cm o
116
0000(4029)
0000(4030)
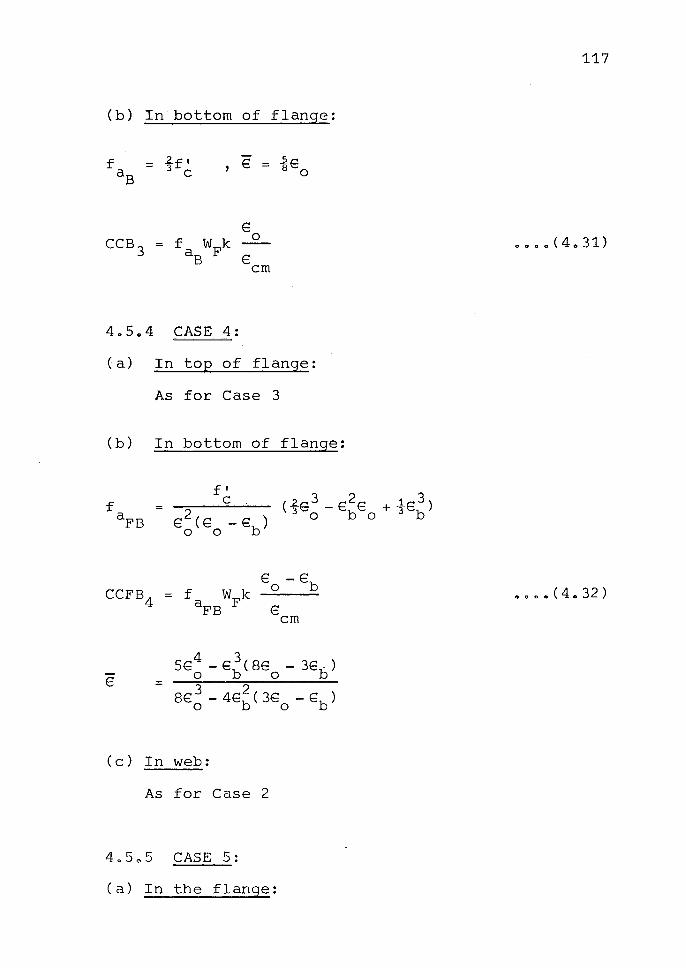
117
(b) In.bottom of flange:
f = .£f I E = .!!e aB 3 C 8 0
e CCB 3 f WFk
0 0000(4031) = aB E cm
4o5o4 CASE 4:
( a) In toE of flange:
As for Case 3
( b) In bottom of flange:
f' ( 2-G3 - E2€ 1 3) f C
= E2 ( E - €b)
+ 3Eb aFB
3 o b o 0 0
E -E CCFB4 f W k o b
= aFB F €
0000(4032)
cm
4 3 56 - E ( 8€ - 3G - ) E
o b o b =
8€; - 4E~ ( 3€0
- Eb)
(c) In web:
As for Case 2
4o5e5 CASE 5:
(a) In the flange:
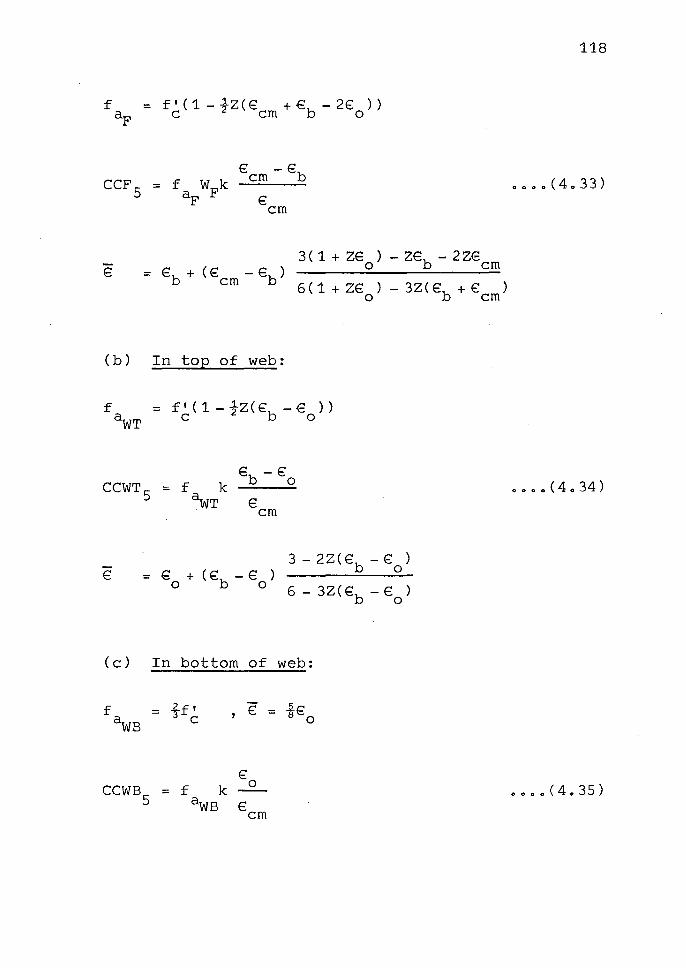
= f' ( 1 - -½Z ( E'. + €b - 2€ ) ) c cm o
E'. - E'. CCF 5 = cm b
E'. cm
3 ( 1 + 2€ ) - Z€b - 2 ZG = E'. + ( € _ € ) o cm
b cm b 6 ( 1 + ZE'. ) - 3Z( E'.b + E'. ) o cm
( b) In top of web:
CCWTS =
E'. = € o + ( E'.b - E'. o )
(c) In bottom of
f = £fl € = ¾rn 3 C
E'. CCWB
5 f k
0 =
aWB € cm
3-2Z(E'. -E'.) b o
6-3Z(E -E'.) b o
web:
2E'. 8 0
118
0 0 0 0 ( 4 0 34)
0000(4035)
4.5.6 CASE 6:
(a) In top of flange:
No concrete force - spalling has occurred.
(b) In middle of flange:
f = f' ( 1 - tz< E - E ) ) aFM c er o
€ - € f WFk
aFM
€ = € + (€ - E ) o er o
er o
E cm
3-22(€ -€) er o
6-3Z(E -€) er o
(c) In bottom of flange:
As for Case 3.
4.5.7 CASE 7:
(a) Unbound concrete:
No concrete force - spalling has occurred.
(b) Bound concrete: € >E c er
f = f' < 1 - -tz < e' + € - 2e ) ) aB c s er o
€' - € s er
€ cm
119
0 0 0 0 ( 4 0 36)
E=E +(E'-E) 3 ( 1 + ZE ) - Z€ - 2 ZE 1
o er s er s er 6 < 1 + ze ) - 3 z < E + e , )
o er s
(c) Top of uncrushed flange:
f = f'(1-½Z(E -€ )) aFT c er o
CCFT7
E = E + (€ - E ) o er o
3 - 2Z( € - E ) er o
6-32(€ -€) er o
(d) Bottom of uncrushed flange:
As for Case 3o
40508 CASE 8:
( a) Unbound concrete: € > € c er
No concrete force - spalling has occurredo
( b) Top of bound concrete: €~?::Ee~ E20
f = )5 f' , E = ½(Es'+ e20 ) aBT c
CCBT8
= f b"k aBT
120
0 0 0 0 ( 4 0 38)
0000(4039)
121
(c) Bottom of bound concrete: e20 ~E ~ E c er
f = f J ( 1 - fz( E20 + E - 2E ) ) aBB c er o
0000(4040)
(d) Top of uncrushed flange:
As for Case 7.
(e) Bottom of uncrushed flange:
As for Case 3.
CASE 9A: E 20> E~
(a) Unbound concrete: Ec>Ecr
No concrete force - spalling has occurred.
(b) Bound concrete:
As for Case 7.
E: >E' c er
(c) Uncrushed flange concrete:
f = f, < 1 -1z < E + Eb - 2€ ) ) aF c er o
E - E er b
E cm
0000(4041)
122
3 ( 1 + ZE ) - Z€b - 2 Z.€ - ) o er E'. = E'.b + (€er -€b
6 ( 1 + ZE ) - 3Z ( Eb + € ) o er
(d) Top of web concrete:
As for Case 5.
(e) Bottom of web concrete:
As for Case 5.
CASE 9B: € 20 ~ e; This case differs from Case 9A only in that the bound
concrete now spans two regions of the concrete compression
strain curve. As such, the bound concrete compression
forces are those for Case 8, i.e., Equations (4.39) and
(4.40).
4.5.10 CASE 10:
CASE 10A: € >€' 20 s
( a) Unbound concrete: Ee >€er
No concrete force - spalling has occurred.
(b) Bound concrete:
As for Case 7.
(c) Top of uncrushed flange:
As for Case 7.
(d) Bottom of uncrushed flange:
As for Case 4.
123
(e) Web concrete:
As for Case 2a
CASE 10B: € 20 :!(,_ €~
As with Case 9, Case 10B differs from Case 10A only
in that the bound concrete strain has exceeded € 20 0 Equa
tions (4o39) and (4o40) applya
4o5o11 CASE 11:
( a) Unbound flange concrete: €c > €er
No concrete force - spalling has occurredo
(b) Uncrushed flange. concrete:
As for Case 9.
(c) Top of web:
As for Case So
(d) Bottom of web:
As for Case 5 o
4o5a12 CASE 12:
(a) Top of flange: G >€ c er
No concrete force - spalling has occurreda
(b) Middle of flange:
As for Case 6.
(c) Bottom of flange:
As for Case 4a
124
(d) Web concrete:
As for Case 2.
4.6 DEFINITIONS - "ULTIMATE" AND "DUCTILITY"
Frequently the terms "maximumn and ttultimate" moments
are used synonymously, and since there is, in many beams
considerable capacity for energy absorption available
beyond the maximum moment, a distinction must be made
between these two terms. There are many opinions regard
ing a definition of "ultimate" behaviour but in this thesis
the following meaning will be attached to this term: that
"ultimate" moment corresponds to fracture of the tension
steel, in which case maximum usually equals ultimate, or a
20 per cent reduction in moment from the maximum. Clearly,
buckling of compression steel would in many cases consti
tute failure but, as has been mentioned in the previous
chapter, no theoretical means of determining the onset of
this type of failure exists at present, and so no account
is taken of it in this theoryo
Also there is some confusion concerning the term
"ductility". In this thesis the term "deflection ductil
itJ'will refer to a specified ratio of member deflections,
while "curvature ductility" will consider section
curvature ratios. "Ductility" without a prefix will mean
curvature ductility.

125
4.7 THEORY COMPARED WITH EXPERIMENTAL RESULTS
Very few writers have published complete moment
curvature responses from test beams and it is therefore
difficult to subject this theory to a rigorous test.
42 However, Mattock reproduced eight experimental moment-
curvature plots from his series and these are shown, com
pared with Mattock's theory and the theory developed in
this chapter in Figure 4e5. It can be seen that the theory
described in this chapter predicts low maximum moments for
beams C1, C2, C3, C4, cs, and C6 and this may be due to the
fact that these beams were tested with a central point
load. The resulting confinement afforded to the compressed
concrete delays spalling of the concrete and results in an
increase in moment that such a beam can sustain at large
strains. The theory compares very well with beams C2A and
CSA and these were both subjected to two point loads giving
a constant moment region with no additional concrete
confinement.
Mattock's beam details and test results were partic
ularly well-documented and it was therefore possible to
compare the present theory with experiment for yield
moments and some maximum moments. It was assumed that
point loading had no effect on the yield moment since at
this stage, the concrete in the extreme fibre had not
reached maximum stress, hence Poisson's ratio is low, and
so confinement effects are negligible (q.v. Chapter 2).
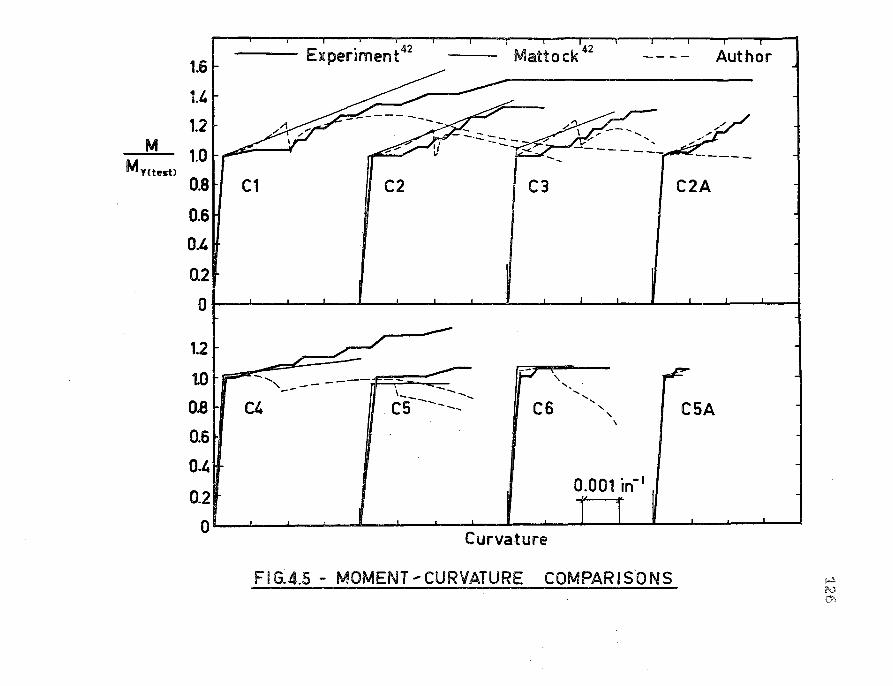
Experiment42 · Matto ck.42 ---- Author 1.6 L
1.,
1.2
M..._ 1.0 Mvuest>
0.8t/ C1 ll C2 / C3 I C2A
0.6
0.4
0.2
0
12
tOtr-----.. -- ----~ r C6 ',,,,,,\ -- \ ~~ 0.8 ti C4 cs ______ , f CSA
0.6
o., 0.2· • .. 0.001 in-•
0 Curvature
Fl G.4.5 - MOMENT .... CURVATURE COMPARISONS
127
For this reason 1 only those beams with tWO-point loading
are compared at maximum moment.
A summary of these comparisons appears in Table 4.4
and shows the theory developed earlier in this chapter to
agree very well with Mattock's experimental results. It
is relevant to note that this theory is conservative in
predicting maximum moments and corresponding curvatures
for beams with point loads.
4.8 MOMENT-CURVATURE RESPONSES FOR REINFORCED AND
PRESTRESSED CONCRETE SECTIONS
Figure 4.6 illustrates theoretical moment-curvature
responses for typical reinforced concrete sections with
varying amounts of longitudinal steel. The effects of
concrete confinement are considered by means of two dif
ferent values for Z. For comparison, prestressed concrete
moment-curvature responses from an analytical study by
65 Sherbourne and Parameswar are also shown.
It can be seen in Figure 4.6 that for prestressed and
reinforced concrete beams of similar size and effective
depth, the reinforced concrete behaves in a more ductile
manner. Clearly such comparisons are open to criticism,
for the prestressed concrete sections have considerably
lower steel percentages and the difference in concrete
strengths greatly affects (M/f'bd2 ) but for the same C '
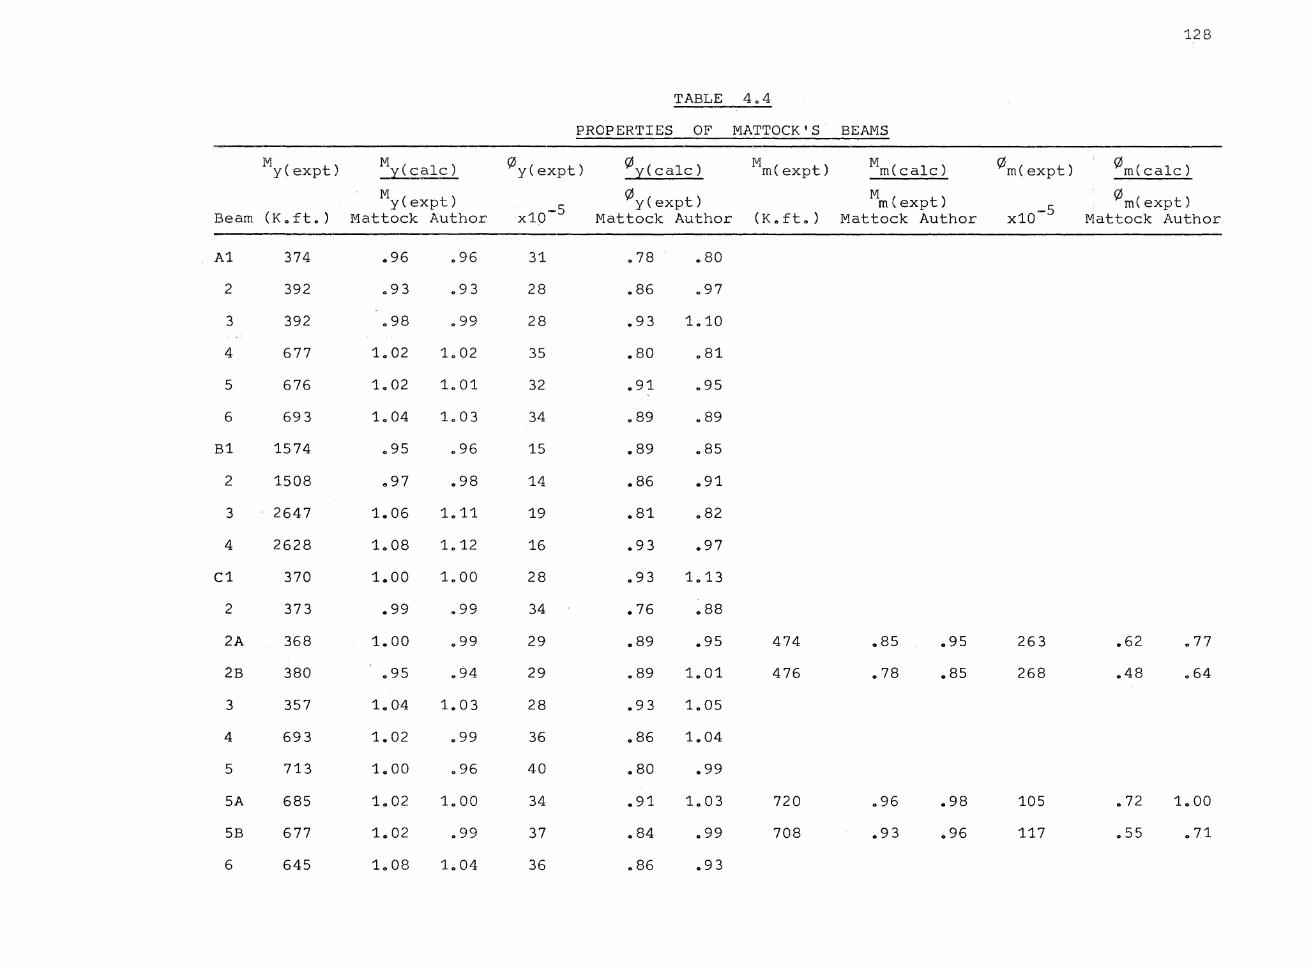
128
TABLE 4.,4
PROPERTIES OF MATTOCK'S BEAMS
M y(expt) M y(calc) 9ly(expt) 9ly(calc) M m(expt) M m(calc) 0m(expt) 0m( calc)
M 0y(expt) M 0m(expt) y(expt) x10-5
m{expt) x10-5 Beam (K.ft.) Mattock Author Mattock Author (K.ft.) Mattock Author Mattock Author
A1 374 .96 .96 31 ,. 78 .,80
2 392 .93 • 9 3 28 .86 .97
3 392 .98 .99 28 .93 1.10
4 677 1.02 1.02 35 .80 .81
5 676 1.02 1.01 32 .91 .95
6 693 1 .. 04 1.03 34 .89 0 89
B1 1574 .95 .96 15 .89 .85
2 1508 .. 97 .98 14 .86 .91
3 2647 1.06 1.11 19 .81 .82
4 2628 1.08 1.12 16 .93 .97
C1 370 1 .. 00 1.00 28 .93 1.13
2 373 .99 999 34 .76 .88
2A 368 1.00 ., 99 29 .89 .95 474 .85 .95 263 .62 .77
2B 380 .95 .94 29 .89 1.01 476 .78 .85 268 .48 .64
3 357 1.04 1.03 28 0 9 3 1.05
4 693 1.02 .99 36 .86 1.04
5 713 1.00 .96 40 .80 .99
SA 685 1.02 1.00 34 .91 1.03 720 .96 .98 105 D 72 1.00
SB 677 1.02 .99 37 .84 .99 708 .93 .96 117 .55 .71
6 645 1.08 1.04 36 .86 D 93
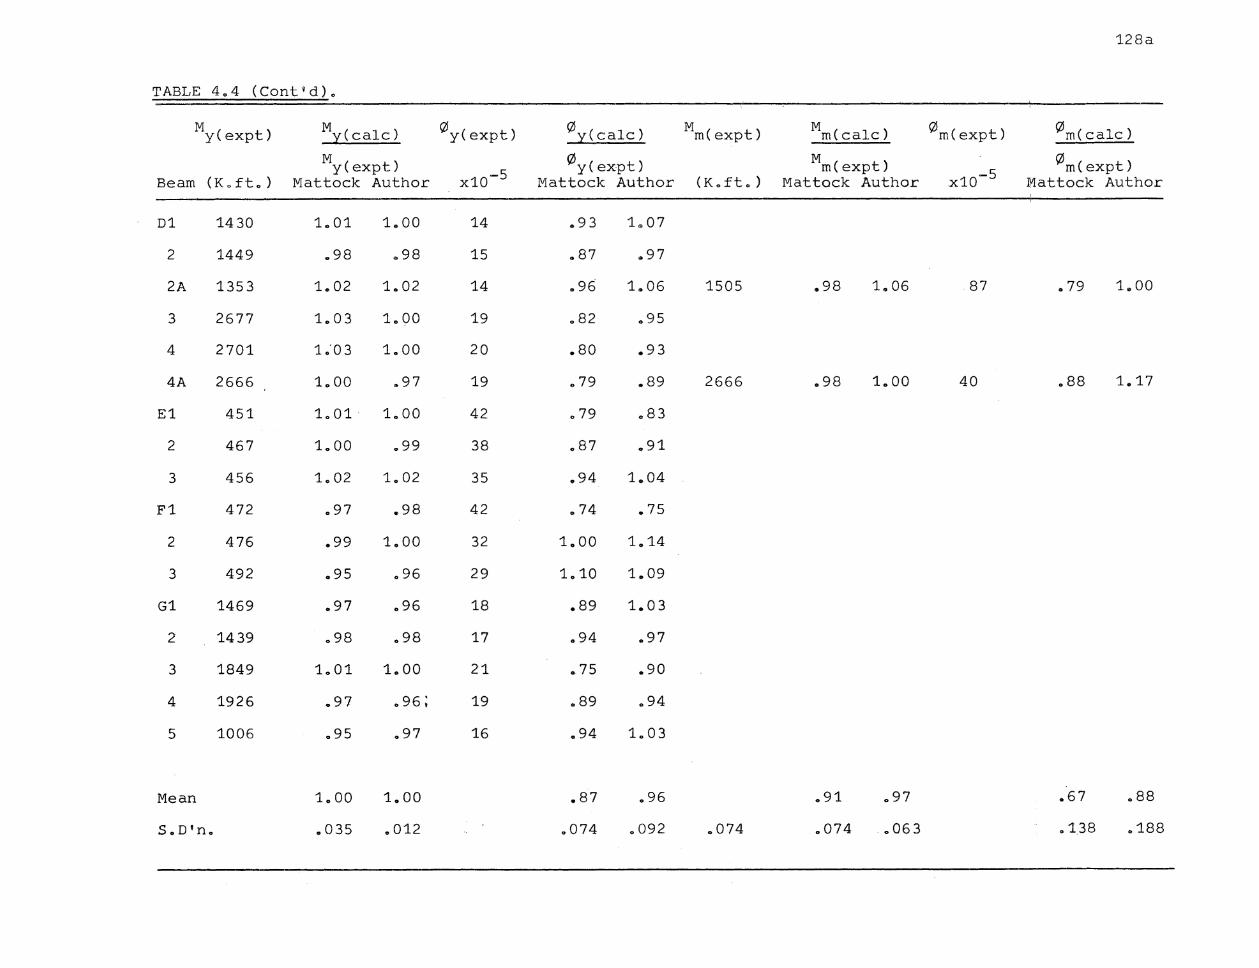
TABLE 4.4 (Cont'd).
M y(expt)
Beam (K.ft.)
D1 1430
2 1449
2A 1353
3 2677
4 2701
4A 2666
E1 451
2 467
3 456
F1 472
2 476
3 492
G1 1469
2 1439
3 1849
4 1926
5 1006
Mean
M y(calc)
M y(expt) Mattock Author
1 .. 01
.. 98
1.02
1. 0 3
1.·03
1 .. 00
1.01·
1.00
1.02
.97
.99
.95
.97
.98
1.01
.97
.95
1 .. 00
"98
1.02
1.00
1.00
.. 97
1.00
.99
1.02
.. 98
1.00
.96
.96
.98
1.00
.96;
.97
LOO
.012
0y(expt)
x10-5
14
15
14
19
20
19
42
38
35
42
32
29
18
17
21
19
16
0y( calc)
0y( expt) Mattock Author
0 9 3
.87
.96
.82
.80
., 79
0 79
.87
.94
0 74
1.00
1.10
.89
.94
0 75
.89
.94
.87
.074
1.,07
.97
1 .. 06
.95
• 9 3
.89
.83
.91
1._04
.75
1.14
1.09
1. 03
.97
.90
.94
1.03
.96
.092
M m(expt)
(K.ft.)
1505
2666
.074
M m(calc)
M m(expt) Mattock Author
.98 1 .. 06
.98 1.00
.074 .063
0m(expt)
x10- 5
87
40
128a
0m( calc)
0m(expt) Mattock Author
0 79
.88
.67
.138
1 .. 00
1.17
.188
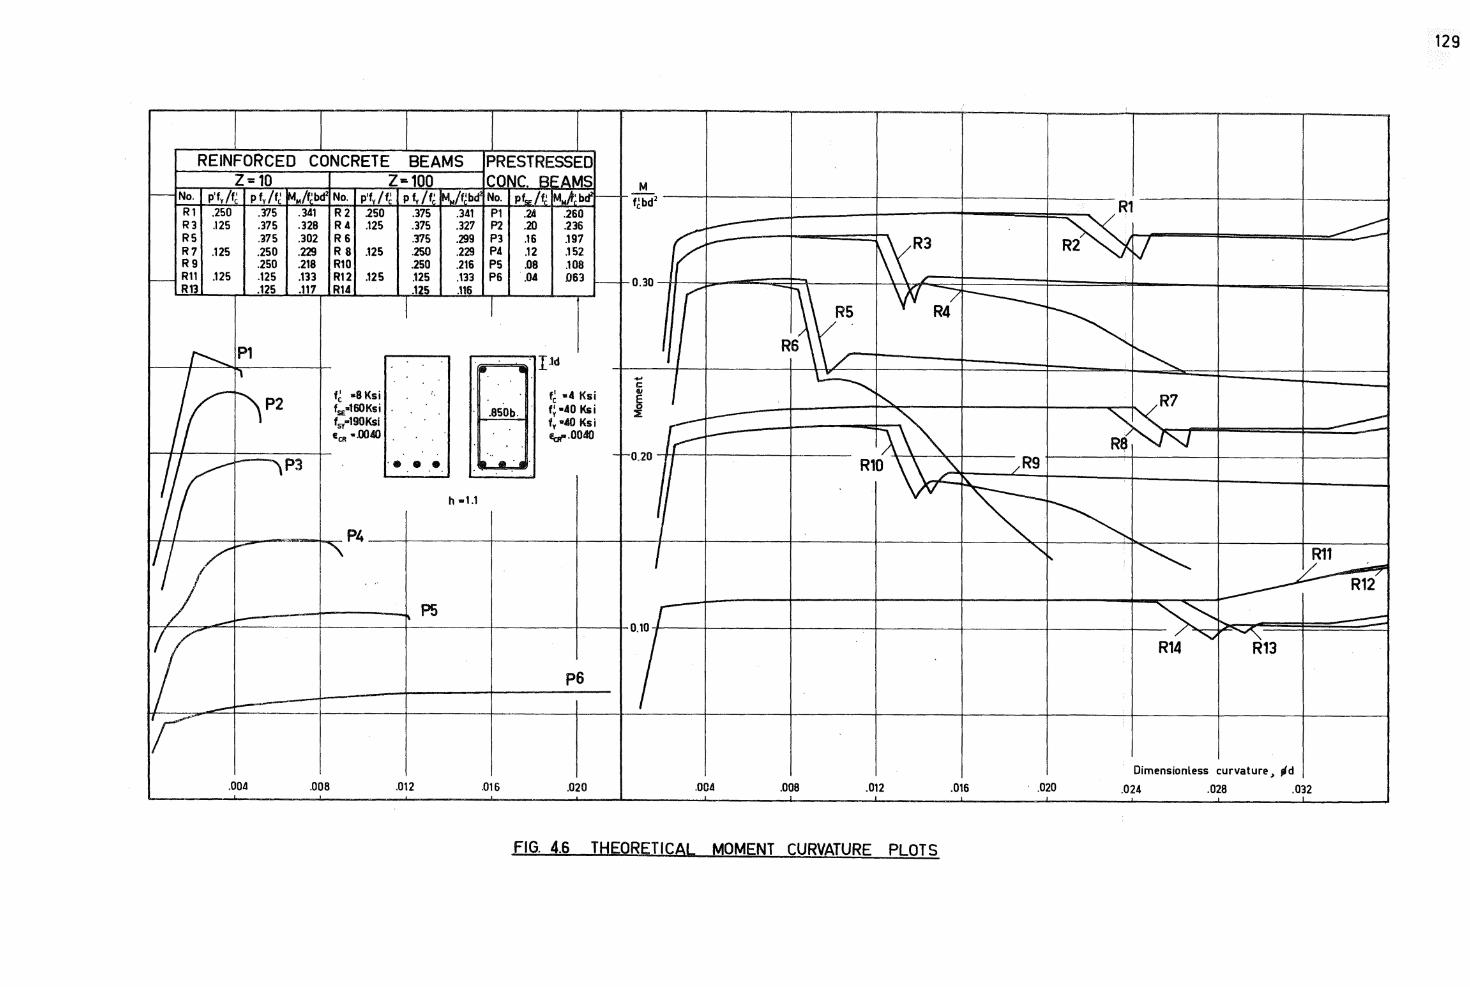
129
REINFORCED CONCRETE BEAMS PREST RESSE• Z=10 z-100 CONC A~AMS M ,__ No. p'fv/f~ pfv/t~ IMM/f;bd2 No. p'fv/f~ p fy / t; M../tibd No. pf.,, /t; MJi;b~' f'bd 2 R1 C Rl .250 .375 .341 R2 150 .375 .341 P1 .24 .260
~v ~ R3 .125 .375 .328 R4 .125 .375 .327 P2 .20 .236
? ~
RS .375 .302 R6 .375 .299 Pl .16 .197 i,-
~\(~ R7 .125 .250 .229 RS .125 .250 .229 P4 .12 .152 R9 .250 .218 R10 .250 .216 PS .08 .108
,___ R11 .125 .125 .133 R12 .125 .125 .133 P6 ,04 .063 ~ ,- 0.30
R13 .125 .117 R14 .125 .116 r \fl 7 r----. I I R4
~ ~ ,-.........,.., Pl
l.1.d I
n .. • \ ~ .., C
J ............
r l'\P2 f~ -a Ksi ' f~ •4 Ksi 4IJ
r--..... ~R7 ~ fSE•160Ksi .850b. f~ •40 Ksi ~ i.--
I\~ " ---= f5y•190Ksi fv •40 Ksi Ir ECI! •.0040 Eaft.0040 - R8
ir .. _,_0.20 I
R10 \)_;,' /R9 P3 ·• .. ID A·•.
" h •1.1
~ ~ j
P4 ;;_:J_<l,,.ll.:
I ""' ~ II/ f ...... '"'\. R11 ·-
-/
R12 v,; I\ P5 r ~ -i.------~
7 "v -
R14 R13
PS
------~-----r Dimensionless curvature, pd
.004 .008 .012 .016 .020 .004 .008 .012 .016 · .020 .024 .028 .0~2 ' ·-
FIG. 4.6 THEORETICAL MOMENT CURVATURE PLOTS
130
value of maximum moment (and hence design moment), there
is more energy-absorption available in the reinforced
concrete section than in its prestressed concrete counter
part (cofo P2 and R10 in Figure 406)0
31 The SEAOC Code specifies the following limitation
on reinforcement ratio:
The commentary on the code states the requirement as
being based on provision for ductility when higher yield
strength steels are used in flexural memberso Of the
reinforced concrete sections in Figure 406, only two
comply with this requirement (R11 and R12) and it is
interesting to note that in these sections, the rapid loss
of moment is not present, since strain hardening of the
tension steel occurs before the commencement of crushingo
Sections R7 and R8 come close to meeting this requirement
and this is illustrated by a comparatively low moment loss
at crushingo
A key to significant points on the Reinforced Concrete
moment-curvature plot appears in Figure 4o7o
4o9 NOMOGRAMS FOR DUCTILITY AND ENERGY ABSORPTION AT
CRUSHING
Using this theory, a nomogram giving the ratio of
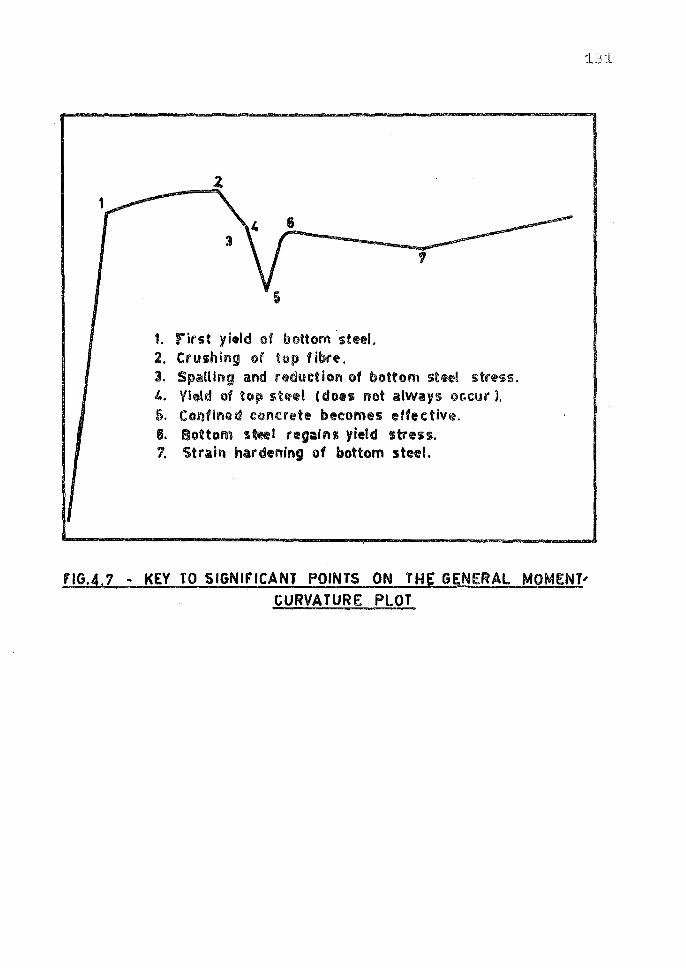
1. first yield of bottom st~el. 2. Crushing of fop f ibr~. 3. SpaiUlng and reduction of bottom stffl str~n. I.. Yl~d of top ste>~l C does not always occur). 6. Confined concrete becomes effective. 6. Bottom steel regains yield stress. 1. Strain hardening of bottom steel.
13'.1
f'IG.4. 7 - KEY TO SIGNIFICANT POINTS ON THE GENERAL MOMENT, CURVATURE PLOT
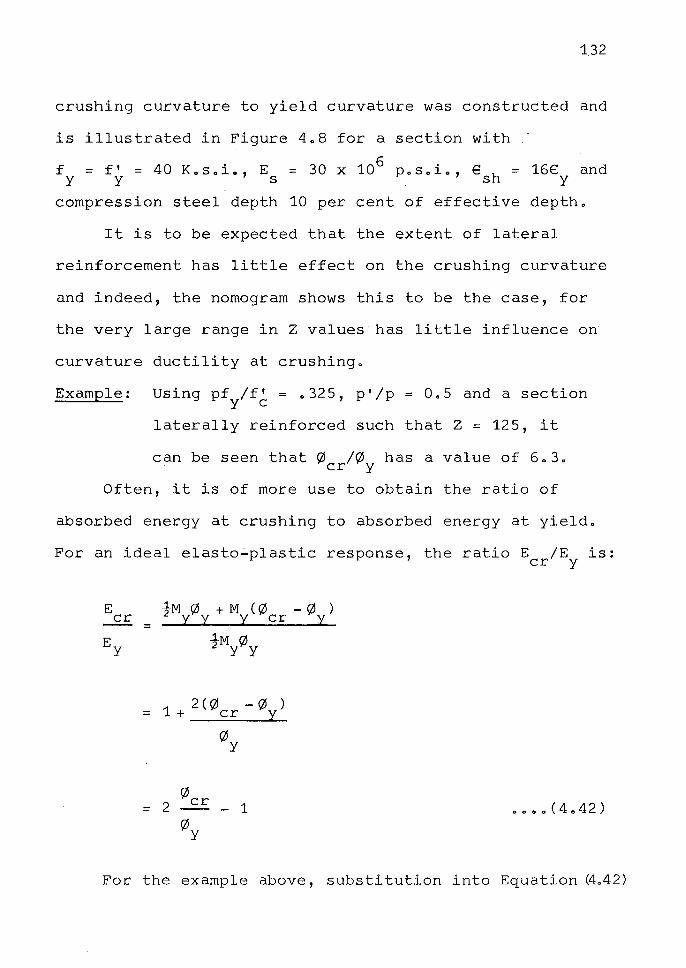
132
crushing curvature to yield curvature was constructed and
is illustrated in Figure 408 for a section with
f = f' = 40 KoSoi., E y y s
= 30 X 106 p S l0
O O O ' esh = 16€Y and
compression steel depth 10 per cent of effective deptho
It is to be expected that the extent of lateral
reinforcement has little effect on the crushing curvature
and indeed, the nomogram shows this to be the case, for
the very large range in Z values has little influence on
curvature ductility at crushingo
Example: Using pf /f' = 0325, p'/p = 0o5 and a section y C
laterally reinforced such that Z = 125, it
can be seen that 0 /0 has a value of 6030 er y
Often, it is of more use to obtain the ratio of
absorbed energy at crushing to absorbed energy at yieldo
For an ideal elasto~plastic response, the ratio E /E is: er y
E er =
fM 0 + M (0 - 0 ) y y y er y .1.M I'll 2 yy;y
2(0 -0 ) = 1 + er y
0y
0cr = 2 - 1 oooo(4e42)
For the example above, substitution into Equation ~o42)
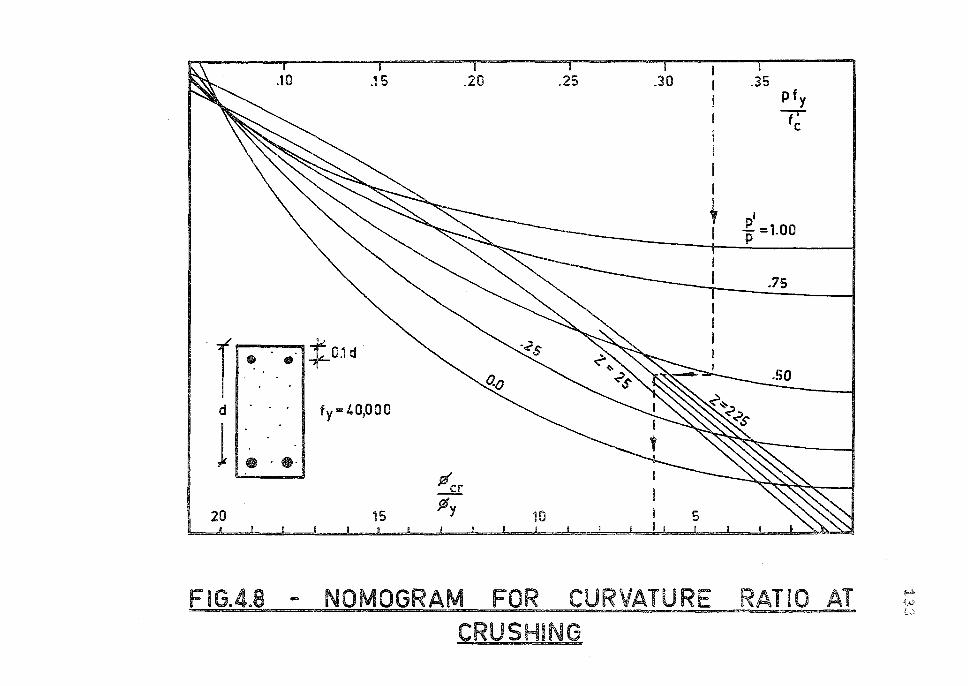
.10 .15 .20
r I •.• ,+-0.1 d
d I . · · I t y • 4 ODO O 0
l, •. •· 91cr
20 15 J11y
HJ
.25 .30
i 5 ! I
.35
I
Pfy
7 C
+ pl =1.00 I P
.75
FIG.4.8 - NOMOGRAM FOR CURVATURE RATIO .AT CRUSHING
~
tw L0
134
would produce E = 11.6E. er y
Figure 4.9 illustrates a nomogram for strain energy
at crushing to strain energy at yield ratios, and using
the section described in the above example, an energy
absorption ratio of 13.2 is obtained. The reason for this
difference in energy absorption ratios is that the rein
forced concrete does not behave ideally elasto-plastically
and the deviation from elasto-plastic behaviour becomes
more marked with increased tension steel content, as
illustrated in Figure 4.6.
Nomograms such as those illustrated in Figures 4.8
and 4.9 may be used for designing structures in which it
is undesirable to have spalling of concrete during post
elastic deformation.
4.10 MAXIMUM AND ULTIMATE MOMENTS AND CURVATURES:
Tables 4.5 to 4.12 show the essential details for
moment-curvature responses of reinforced concrete
rectangular sections for a variety of concrete strengths,
Z values, and rinforcement ratios. In all cases, constant
quantities are f = 40 K.s.i., f = 68 K.s.i., y u
E = 30 X 106 p.s.i., € = 16 € y' E = -€ + .14 and
s sh u sh
ratio of core width to section width, b" = 0.8. Depth
from top of section to compression steel, when present, is
10 per cent of effective depth.
Dimensionless (0d) and (M/f'bd2 ) values are tabulated C
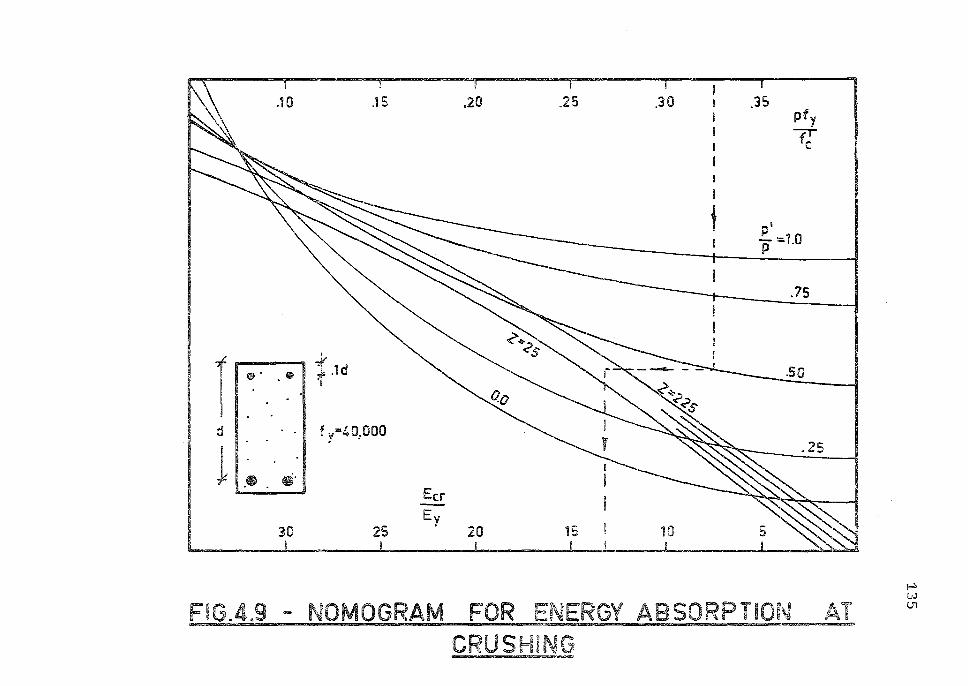
.10 .15 .20
rnt.ld " ~
d I -_ . · I f y•40,000
11. •• Ecr
30 25 Ey
20
.25 .30
I
I
t
.35 pfy 7T C
I
E.. =1.0 p
.75
~r~----~ .so
~~' "~ .25
15 I 10 5 '
FIG.4.9 - NOMOGRAM FOR ENERGY ABSORPTION AT CRUSHING
i..:. w U1
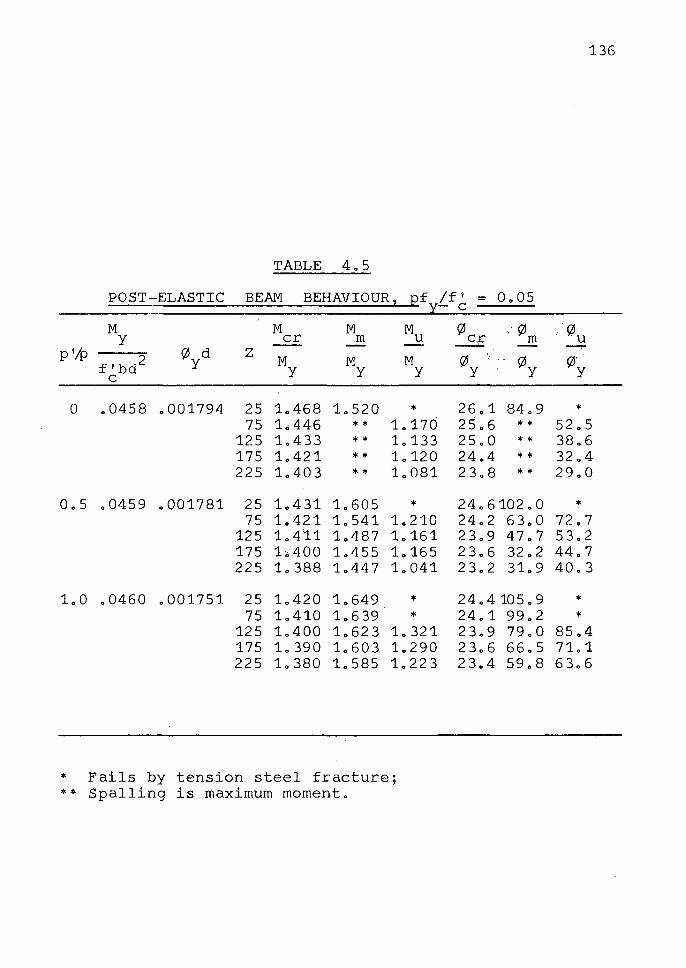
TABLE 4o5
POST-ELASTIC BEAM BEHAVIOUR, pf
M M M M y er m u
p';p (;2l d z f'bd
2 y M M M C
y y y
0 00458 0001794 25 10468 1.520 * 75 L446 ** 10170
125 1.433 ** 1.133 175 1.421 * * 10120 225 1.403 ** 1.081
0.5 .0459 .001781 25 10431 1.605 * 75 1.421 1. 541 1.210
125 1.411 1.487 10161 175 1.400 10455 1.165 225 1.388 1.447 1.041
1.0 00460 .001751 25 1.420 1.649 * 75 1.410 1. 6 39 *
125 1.400 1.623 1.321 175 1.390 1.603 1.290 225 1.380 1.585 1.223
* Fails by tension steel fracture; ** Spalling is maximum moment.
136
/f' = - C
Oo05
(;2lq:-,(/J {?Ju m
-, (/J '1
y (/Jy (;2l' y
26o1 84o9 * 25.6 ** 52.5 25.0 ** 3806 24.4 ** 32.4 2 3. 8 * * 29.0
24.610200 * 24.2 63. 0 72o7 23.9 47.7 53.2 23.6 32.2 44o7 2 3. 2 31.9 40.3
24.4105.9 * 24.1 99.2 * 2 3. 9 79.0 85.4 23.6 66.5 71.1 2 3. 4 59.8 63.6
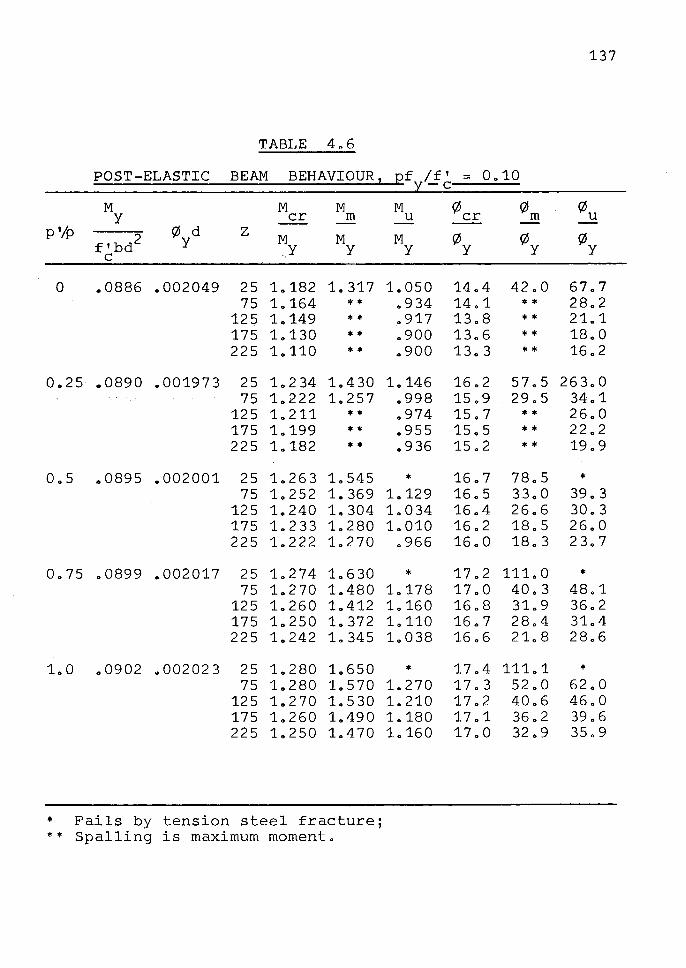
TABLE 406
POST-ELASTIC BEAM BEHAVIOUR,
M M M y er m
p 'A:> f'bd
2 0 d z M M y y y
C
0 00886 .002049 25 1.182 1. 317 75 1.164 **
125 1.149 ** 175 1.130 ** 225 1.110 **
0.25 .0890 .001973 25 1o 2 34 1.430 75 1.222 1.257
125 1o 211 * * 175 10199 ** 225 10182 **
Oo5 .0895 0002001 25 10263 1.545 75 10252 1.369
125 1.240 1.304 175 1.233 10280 225 10222 10270
0.75 .0899 0002017 25 1.274 1o 630 75 1. 2 70 1.480
125 1.260 1.412 175 10250 1. 372 225 1.242 1. 345
1.0 .0902 .002023 25 10280 1.650 75 1.280 1.570
125 1.270 1.530 175 1.260 1.490 225 1.250 1.470
* Fails by tension steel fracture; ** Spalling is maximum moment.
137
pf /f' = Oo10 v-c
M 0 cr 0m 0u u
M 0y 0y 0y y
1.050 14o4 42o0 67o7 0 934 14.1 ** 28.2 0917 13.8 * * 21.1 0900 1306 * * 18o0 .. 900 13o3 * * 16.2
1.146 16o2 57o5 26 3o 0 0998 15o9 29o5 34o1 0974 15o7 * * 26o0 0955 15o5 * * 22 0 2 0 936 15o2 * * 19o9
* 16o7 78o5 * 1.129 16o5 33o0 39 0 3 1.034 16 .. 4 26.6 30.3 1.010 16.2 18.5 26.0
0966 16o0 18o3 23o7
* 17.2 111.0 * 1.178 17o0 40o3 48.1 1.160 16.8 31o9 36.2 1.110 16o7 28o4 31.4 10038 16.6 21.8 28.6
* 17.4 111.1 * 1.270 17.3 52o0 62.0 1.210 17.2 4006 46.0 1.180 17.1 36o2 3906 1.160 17o0 32 0 9 35.9
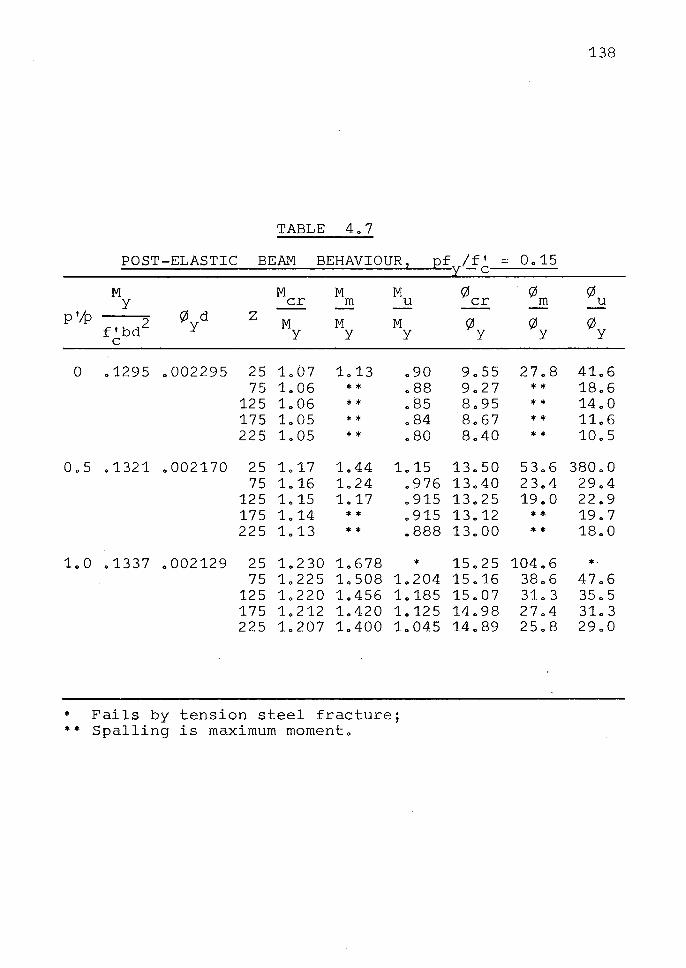
TABLE 4o7
POST-ELASTIC BEAM BEHAVIOUR 2 J2f
M M M M y er m u
p ',,P f'bd
2 0 d z M M M y y y y
C
0 01295 0002295 25 L07 1.13 090 75 1.06 ** 088
125 1.06 * * 085 175 1.05 * * 084 225 1.05 ** 080
Oo5 .1321 0002170 25 1.17 1.44 L15 75 L16 1o24 .976
125 L15 1o17 0915 175 1.14 ** .915 225 1.13 * * 0888
1o0 .1337 0002129 25 1. 2 30 10678 * 75 1.225 1.508 10204
125 1.220 1.456 1.185 175 1.212 1.420 1.125 225 L207 1.400 1.045
* Fails by tension steel fracture; ** Spalling is maximum moment.
138
/f' = Oo15 -c
0 cr 0m 0u
0y 0y 0y
9o55 2708 41.6 9o27 * * 1806 8095 * * 14o0 8067 * * 11.6 8040 * * 10o5
13050 5306 380.0 13040 2 3o 4 29.4 13025 19o0 22o9 13012 * * 19.7 13000 * * 18o0
15.25 104.6 * 15.16 38.6 47.6 15007 31. 3 35.5 14.98 27.4 3L3 14089 25.8 29.0
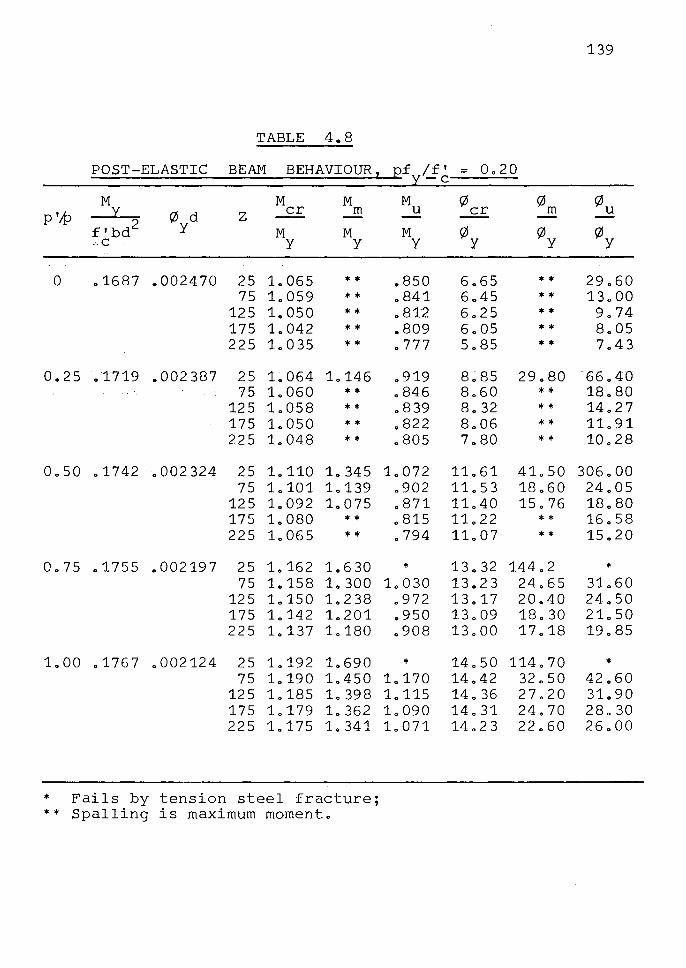
TABLE 4.8
POST-ELASTIC BEAM BEHAVIOUR 2
M M M p',,p y (/J d z er m
fibd 2 y M M :,:c y y
0 .1687 .002470 25 1.065 ** 75 1.059 * *
125 1.050 * * 175 1.042 * * 225 1.035 * *
0.25 .1719 • 002 387 25 L064 1.146 75 1.060 **
125 1.058 ** 175 1.050 ** 225 1.048 * *
0.50 .1742 .002324 25 1.110 1.345 75 1.101 1.139
125 1.092 1.075 175 1.080 ** 225 1.065 **
0.75 .1755 .002197 25 1.162 1. 6 30 75 1.158 1.300
125 1.150 1. 2 38 175 1.142 1.201 225 1.137 10180
1.00 01767 .002124 25 1.192 1.690 75 1.190 10450
125 10185 1. 398 175 1.179 10362 225 1.175 1o 341
* Fails by tension steel fracture; ** Spalling is maximum momenta
139
2£ I..!~ = 0.20
M 0cr </Jm (/Ju u
M (/Jy (/Jy (/J y y
.850 6.65 * * 29.60
.841 6.45 * * 13.00 0 812 6.25 ** 9.74 .809 6.05 *-. 8.05 .777 5.85 * * 7 0 43
.919 8.85 29.80 66.40
.846 8.60 * * 18.80 0 839 8. 32 * * 14.27 .822 8.06 * * 11. 91 .805 7.80 * * 10.28
1.072 11.61 41. 50 306.00 .902 11.53 18.60 24.05 .871 11.40 15.76 18.80 .815 11. 22 ** 16.58 .794 11.07 ** 15.20
* 13.32 144.2 * 1.030 13.23 24.65 31.60
.972 13.17 20.40 24.50
.950 13.09 18.30 21. 50 0908 13000 17018 19085
* 14.50 114.70 * 1.170 14.42 32 0 50 42060 1.115 140 36 27.20 31.90 1.090 14031 24.70 28.30 1.071 14. 2 3 22.60 26000
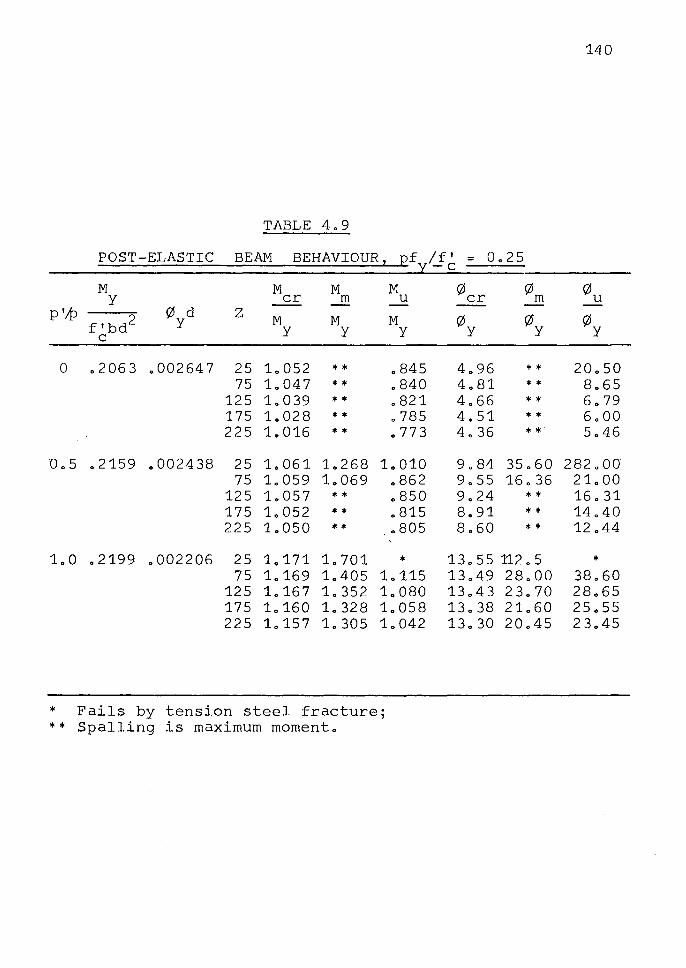
TABLE 4.9
POST-ELASTIC BEAM BEHAVIOUR 2 12£
M M M M y er m u p ';p 0 d z
f'bd 2 y M M M C
y y y
0 .2063 .002647 25 1.052 ** .845 75 1.047 ** .840
125 1.039 ** .821 175 1.028 * * .785 225 1.016 * * .773
0.5 .2159 .002438 25 1.061 1.268 1.010 75 1.059 1.069 .862
125 1.057 ** .850 175 1.052 ** .815 225 1.050 ** .805
1.0 .2199 .002206 25 1.171 1.701 * 75 1.169 1.405 1.115
125 1.167 1.352 1.080 175 1.160 1. 328 1.058 225 1.157 1.305 1.042
* Fails by tension steel fracture; ** Spalling is maximum moment.
140
/f' = 0.25 -c
0 cr 0m 0u
0y 0y 0y
4.96 * * 20.50 4.81 ** 8.65 4.66 * * 6.79 4.51 * * 6.00 4. 36 * * 5.46
9.84 35.60 282.00 9.55 16. 36 21.00 9.24 * * 16.31 8.91 * * 14.40 8.60 * * 12.44
13.55112.5 * 13.49 28.00 38.60 13.43 23. 70 28.65 13.38 21.60 25 .,55 13.30 20.45 2 3.45
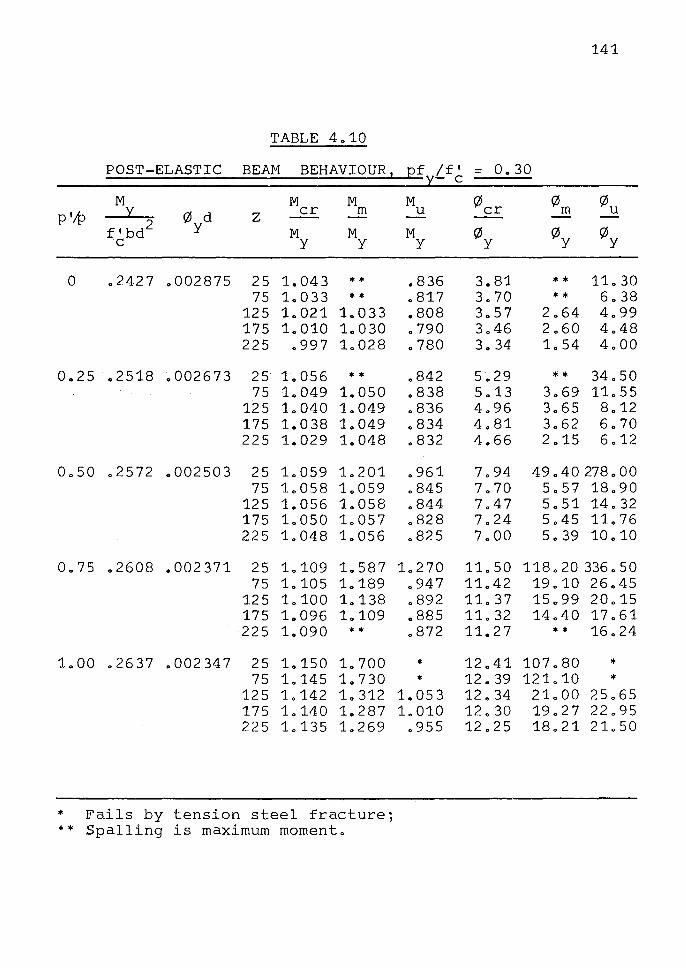
TABLE 4o10
POST-ELASTIC BEAM BEHAVIOUR 2
M M M P'IP Y. 0 d z er m
f'bd2 y M M
C y y
0 .2427 .002875 25 1.043 ** 75 1.033 **
125 1.021 1.033 175 1.010 1.030 225 0997 1.028
0.25 .2518 .002673 25 1.056 ** 75 1.049 1.050
125 1.040 1.049 175 1.038 1.049 225 1.029 1.048
Oo50 .2572 .002503 25 1.059 1.201 75 1.058 1.059
125 1.056 1.058 175 1.050 1.057 225 1.048 1.056
0.75 .2608 .002371 25 1.109 1.587 75 1.105 1.189
125 1.100 1.138 175 1.096 1.109 225 1.090 **
1.00 .2637 .002347 25 1.150 1.700 75 1.145 1.730
125 1.142 1. 312 175 1.140 1.287 225 1.135 1.269
* Fails by tension steel fracture; ** Spalling is maximum moment.
141
pf /f' = 0.30 - C
M 0 cr 0m 0u u
M 0y 0y 0y y
0 836 3.81 * * 11.30 .817 3.70 ** 6.38 .808 3.57 2.64 4.99 .790 3.46 2o60 4o48 .780 3.34 1.54 4.00
.842 5o29 * * 34050
.838 5.13 3.69 11.55
.836 4o96 3.65 8.12 0834 4o81 3o62 6.70 .832 4.66 2.15 6012
.961 7.94 49.40 278.00
.845 7.70 5.57 18.90
.844 7.47 5 0 51 14 0 32
.828 7.24 5.45 11.76
.825 7.00 5.39 10.10
1.270 11.50 118.20336050 .947 11.42 19010 26045 .892 11. 37 15.99 20.15 .885 110 32 14.40 17.61 .872 11.27 ** 16.24
* 12041 107.80 * * 12 0 39 121.10 *
1.053 12.34 21.00 25.65 1.010 12 0 30 19.27 22.95
.955 12025 18021 21.50
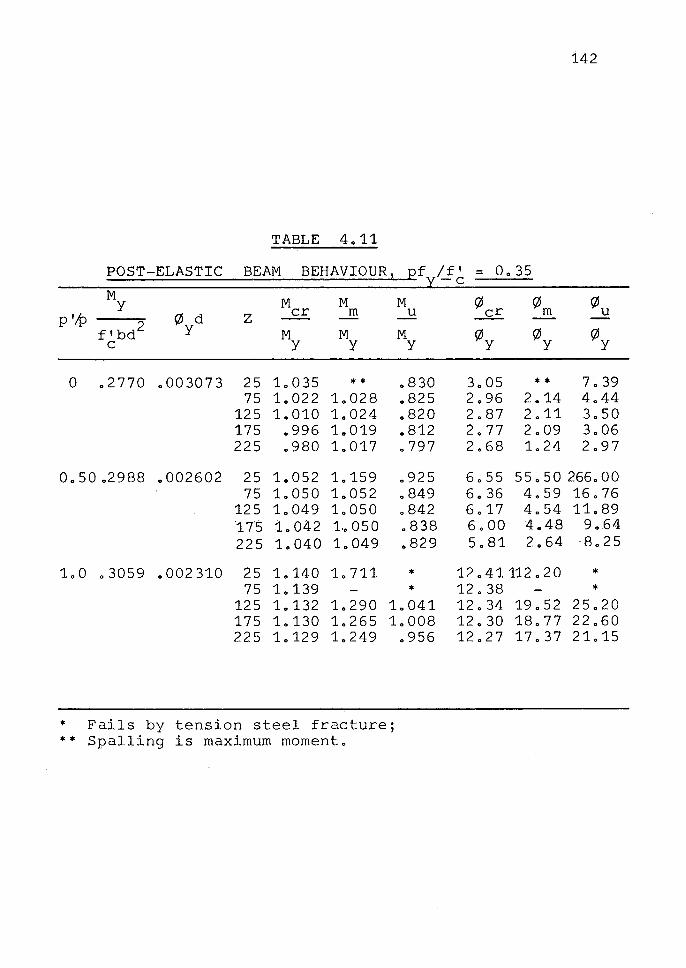
TABLE 4o11
POST-ELASTIC BEAM BEHAVIOUR 2 :ef M
M M M y p ';p (2J d z er m u
f'bd2 y
M M M C y y y
0 02770 0003073 25 LO35 ** 0 830 75 LO22 LO28 0825
125 10010 LO24 0820 175 0996 LO19 0812 225 0980 LO17 0797
005002988 0002602 25 1.052 1 0 159 0925 75 LOSO LO52 0849
125 LO49 LOSO 0842 '17'5 LO42 1,o 050 0838 225 10040 LO49 0829
LO 03059 0002310 25 10140 L711 * 75 L139 *
125 L132 L29O LO41 175 L13O L265 LOOS 225 10129 L249 0956
* Fails by tension steel fracture; ** Spalling is maximum momenta
142
/f' = Oo 35 -c
(per (2J m (2J u
(/) y QJY (/) y
3oO5 * * 7 0 39 2o96 2o14 4o44 2087 2011 3050 2o77 2oO9 3oO6 2068 L24 2o97
6055 55 0 50 2660 00 6 0 36 4o59 16076 6017 4o54 1L89 6000 4o48 9o64 5o81 2 0 64--8025
12 0 41112 0 2 0 * 12038 * 12 0 34 19052 25020 12 0 30 18077 22060 12027 17037 2L15
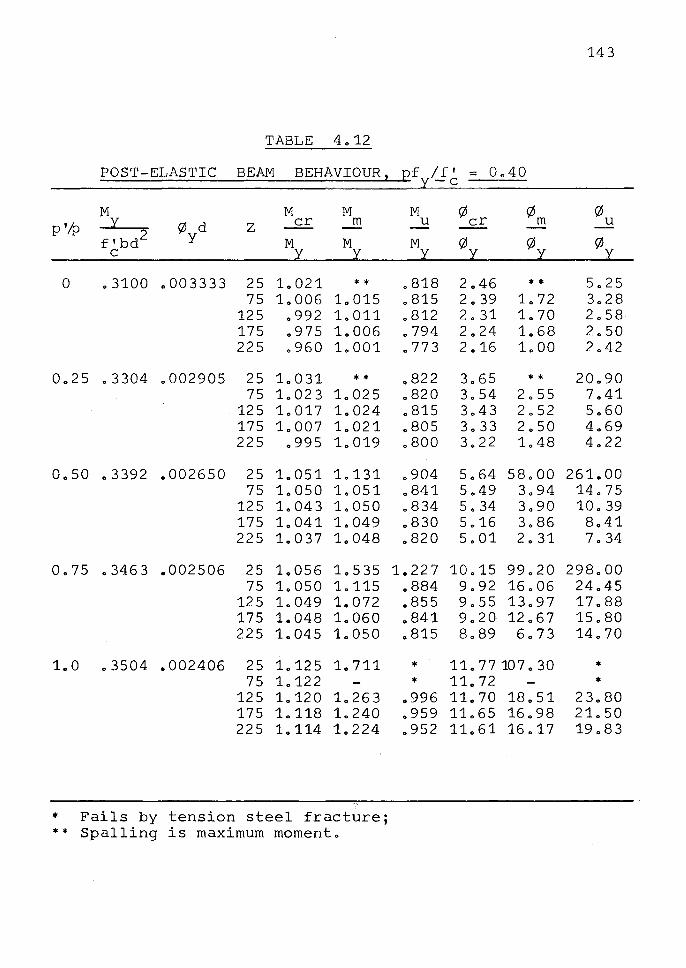
TABLE 4o12
POST-ELASTIC BEAM BEHAVIOUR 2
M M M p ';p Y. 0 d z er m
f'bct 2 y M M
C y y
0 0 3100 0003333 25 1.021 ** 75 1.006 10015
125 0992 1.011 175 0975 1.006 225 0960 10001
0.25 0 3304 0002905 25 1.031 ** 75 1.023 10025
125 1.017 1. 024 175 1.007 1.021 225 .995 1.019
0.50 03392 .002650 25 1.051 1.131 75 1.050 1.051
125 1.043 1.050 175 1.041 1.049 225 1.037 1.048
0.75 0 346 3 .002506 25 1.056 1.535 75 1.050 10115
125 1.049 1.072 175 1.048 1.060 225 1.045 1.050
1.0 03504 .002406 25 1.125 1.711 75 1.122
125 1.120 1o 263 175 10118 1. 240 225 10114 1.224
* Fails by tension steel fracture; ** Spalling is maximum moment.
143
pf /f I :::, Oo40 -c
M 0 cr 0m 0u u
M 0y 0y 0y y
0818 2o46 * * 5o25 0815 2o39 1o72 3o28 0812 2.31 1.70 2.58 .794 2o24 1.68 2o50 .773 2.16 1.00 2o42
0822 3o65 * * 20090 0 820 3o54 2o55 7o41 .815 3o43 2.52 5.60 0805 3.33 2.50 4.69 0800 3.22 1.48 4o22
.904 5o64 58.00 261000 0 841 5o49 3o94 14075 0834 5 0 34 3.90 100 39 0830 5o16 3086 8041 0820 5o01 2o31 7 0 34
1.227 10.15 99020 298000 0884 9o92 16.06 24045 .855 9o55 130 97 17088 0 841 9o20 12067 15.80 .815 8089 6073 14070
* 11. 77 107 0 30 * * 11.72 *
.996 11. 70 18051 23080 0959 11.65 16098 21.50 0952 11.61 16017 19083
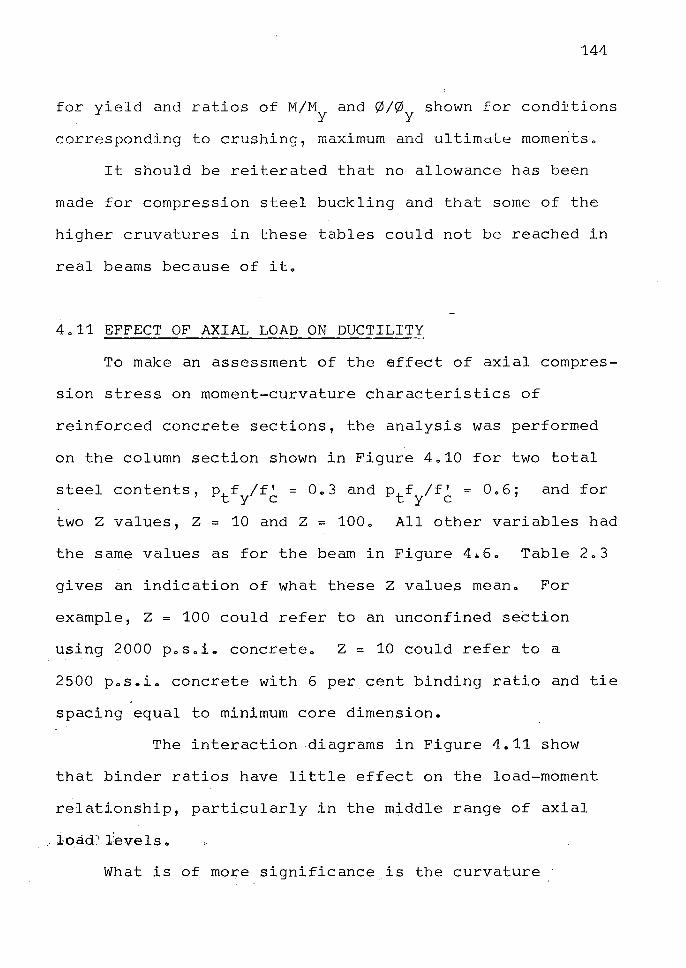
144
for yield and ratios of M/M and 0/0 shown for conditions y y
corresponding to crushing, maximum and ultimate momerits.
It should be reiterated that no allowance has been
made for compression steel buckling and that some of the
higher cruvatures in these tables could not be reached in
real beams because of it.
4.11 EFFECT OF AXIAL LOAD ON DUCTILITY
To make an assessment of the effect of axial compres
sion stress on moment-curvature characteristics of
reinforced concrete sections, the analysis was performed
on the column section shown in Figure 4.10 for two total
steel contents, ptf /ft = 0.3 and pf /f' = 0.6· and for y C t y C '
two Z values, Z = 10 and Z = 100. All other variables had
the same values as for the beam in Figure 406. Table 2.3
gives an indication of what these Z values mean. For
example, Z = 100 could refer to an unconfined section
using 2000 p.s.i. concrete. Z = 10 could refer to a
2500 p.s.i. concrete with 6 per cent binding ratio and tie
spacing equal to minimum core dimension.
The interaction diagrams in Figure 4.11 show
that binder ratios have little effect on the load-moment
relationship, particularly in the middle range of axial
What is of more significance is the curvature
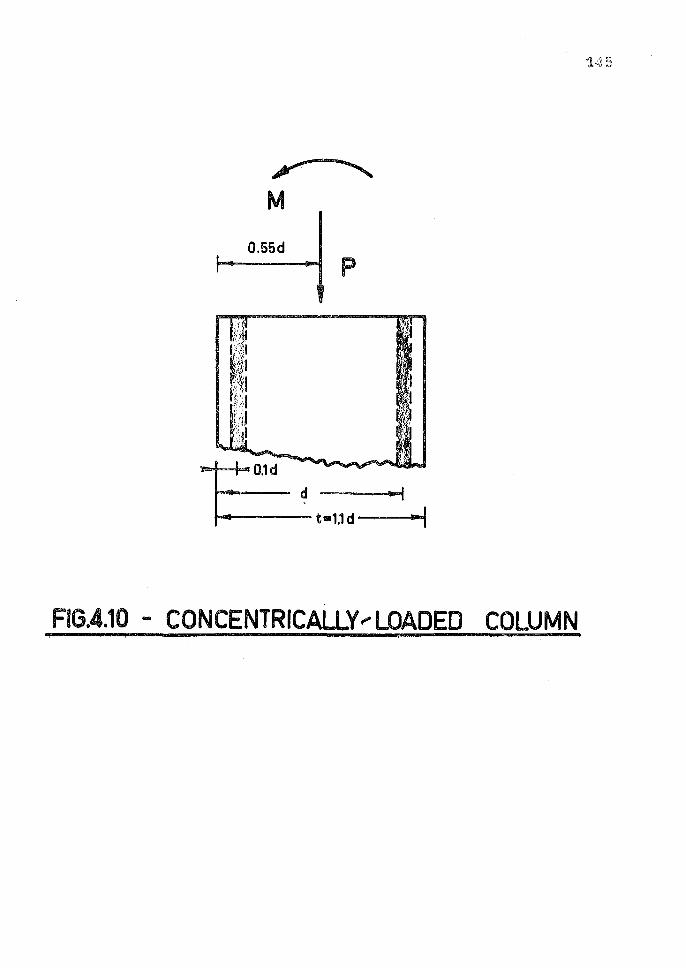
0.55d p
~-d--..,.... --~t•1.1d
FIG.4.10 - CONCENTRICALLY~ LOADED COLUMN
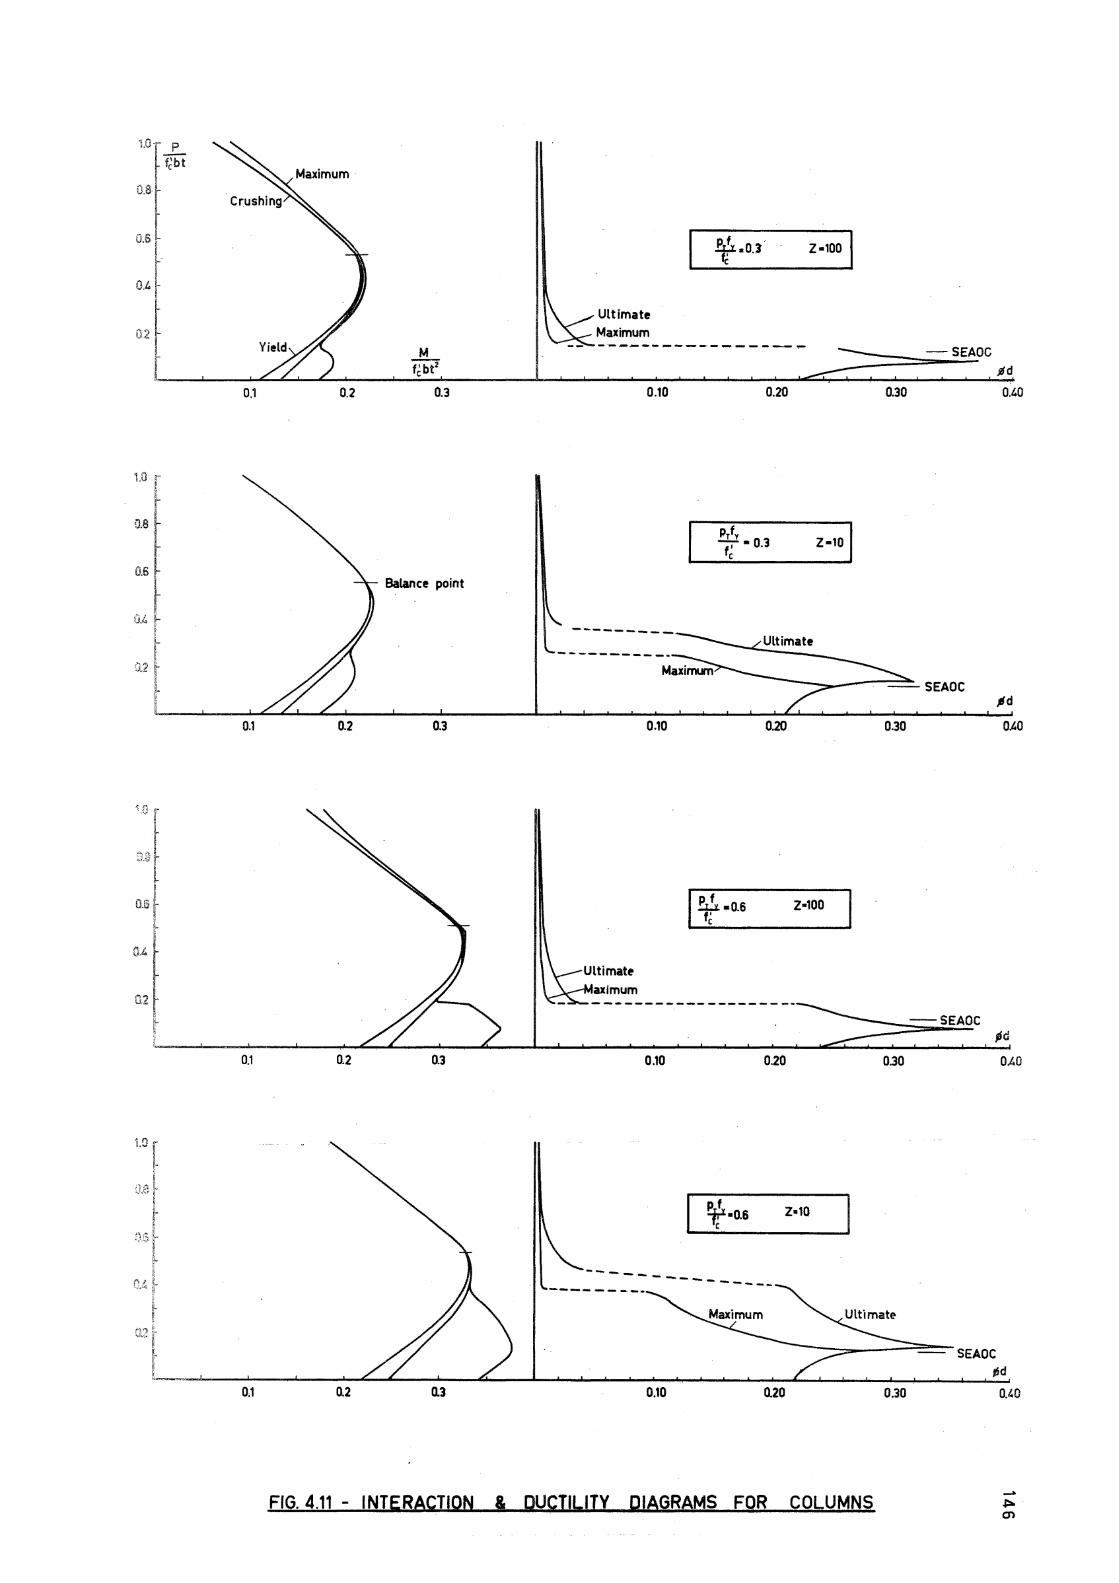
'!.()-•- p
f~bt
0.8
~ 0 rL !
0.8
0.6
n,, ~--•~-• ~
L I t t ' ~
0.1 0.2
Balance point
Ultimate Maximum
.&!r. o~· fc • .IJ z-,oo I
-·---.---.-.----...----- "!-"
--------------------
P/v 7-0.1
C
Ultimate
Z•lO I
l __ ......, _ __._ __ ...._..._ ............. __ ....__ ____________ .,___.___.____._.,__ __
02
Hl
1"7 t ./.'4
0.1
0.1
0.1
0.2 0.3 0.10 0.20
I p,;x •0.6 z-100
axlmum -------------~------
0.2 0.3 0.10 0.20
I. pf ,-f•0.6
C
--- ..... __ ----- -------------
0.2 0.3 0.10 0.20
FIG. 4.11 - INTERACTION & DUCTILITY DIAGRAMS FOR COLUMNS
0.30
0.30
0.30
-SEAOC
1d
O.GO
-SEAOC
0.40
SEAOC pd
0.LO
147
profiles illustrated in Figure 4011, in which curvatures
corresponding to maximum and ultimate moments are
compared with axial load levelo
The axial load, P = 0o12 f~bt, is the value recom-
31 mended by the SEAOC code as being the limit above which
the sum of the ultimate moments of the column sections
above and below the beam joints should be greater than
the sum of the ultimate moments of the adjoining beamso
Figure 4o11 shows that the SEAOC axial load level closely
corresponds to the optimum amount of ductility available
from any section under combined axial and bending loads,
and these peaks occur at curvature ductility factors of
approximately 1000
The reason for this is that at axial load levels
increasing toward the peak curvature value, the onset of
yield and fracture in the "tension" steel is retarded and
so greater curvatures resulto As this peak is reached
and passed, failure is caused at increasingly lower
curvatures by the "compression" steel reaching ultimate
straino Hence the very rapid drop off of curvatures at
axial loads just higher than that at the peak curvature
valueo This drop-off is in turn retarded by better con
finement since the concrete is better able to relieve the
"compression" steel of load, and at such high strains,
the difference in concrete stress between a Z = 100 core
and a Z = 10 core is considerableo
Also it can be seen from Figure 4011, that an
increase in binding efficiency from Z; 100 to Z: 10,
doubles the axial load range over which significant
ductility is availableo
In comparing the effects of z on the moment-load
interaction diagrams it can be seen that for a Z value
148
of 10, maximum and crushing moments are nearly coincident
above the balance point (so nearly coincident that the
difference cannot be plotted)" This is not so for the
Z = 100 columnso In these columns, the maximum moment
occurs before crushing and this is explained by the faster
drop-off of load-carrying capacity of the Z = 100 core
after maximum stress is passedo For the Z = 10 core, the
concrete stress at crushing is 98 per cent of that at
maximum stress; while for the Z = 100 core, the concrete
stress has fallen to 80 per cent of the maximum value.
It is of interest to consider this Z value by means
of two examples. By A.C.I. code requirements, a 19"
square column must have a core size of no more than 16"
square. This being the case, the requirements of AoCoio38
clause 913 and SoE.A.OoCo clause 2630(e)4c, give a minimum
binding steel ratio, p" = 003690 ¾" diao hoops at 3"
centres satisfy this condition and, for a 4000 posoio
concrete, leads to a Z value of 25. It can be seen from
Figure 4.11 that such a value for z will place the peak
curvature even closer to the SoEoAoOoCo value of
P = 0.12f'bL C
A 15" square column, satisfying exactly the same
149
requirements with i" diao hoops at 2" centres, produces
Z = 5. This substantial increase in ductility required for
smaller columns is the subject of much controversy. The
problems stem from A.Coio Equation (9.1), which when
modified for rectangular ties and the notation used in this
thesis, has the form:
f' C
A ( -..SI... - 1 )
f A y C
0000(4.43)
Since the cover to the steel is fixed, then as the
columns become smaller the A /A term increases exponeng C
tially. For example, a 24" square column with 1f" cover
to. ties has A / A = 1. 31. A 12" square column has g C
A /A = 1.78. This discrepancy is not immediately signifg C
icant but a "difference of comparatively large numbersn
effect occurs when unity is subtracted from A /A in g C
Equation (4o43) and thus p" for the 12" square column is
more than twice that required for the 24" column.
The philosophy adopted in the use of Equation (4o43)
is that the strength of an axially-loaded column after
spalling of the cover concrete should be at least equal to
that just before spallingo There is an anomaly here when
this equation is applied to eccentrically-loaded columns,
in that provision for strength rather than adequate
ductility is requiredo
4o12 COMPUTER PROGRAMS
150
Two computer programs were written for work described
in this chaptero The first for producing stress-block
parameters D( and c( , and the second for moment-curvature
responses of reinforced concrete Tor rectangular sections
with or without axial loado Listings of these programs
appear in Appendix Bo
Program 4o1 ("GAMMATAB"): Production of tables for stress
block parameters~ and tusing equations derived in
Section 4o3o
Program 4o2 ("TBEAMS"): Moment-curvature responses for
T and rectangular sections with or without axial load are
producedo To obtain theoretical moments and curvatures,
the value of the strain in the top concrete fibre is
incremented by a fixed amounto For each increment, the
neutral axis is found using an iterative technique and
force compatibility and thus moments and curvatures may be
computedo This type of approach is discussed more fully
in Chapter 5 o
4o13 CONCLUSIONS
It has been shown that the analysis developed in this
151
chapter can predict moments and curvatures that correspond
with reasonable accuracy to experimental results.
The effects on ductility of top and bottom steel
contents, parameter z, and axial load have been studied.
In the case of beams, the most significant contribution
to ductility is obtained by increasing p'/p or decreasing p
or both. Parameter z, describing the confinement of the
core concrete, has a comparatively small effect, partic
ularly at low tension steel percentages.
Columns tend to reflect the dependence on good binding
more definitely. As with beams, z has negligible effects
on load carrying capacity, but has beneficial effects on
the capacity for energy absorption and the range of axial
load levels over which a column can be considered as
ductile.
CHAPTER 5
MOMENT-CURVATURE RESPONSES FOR CYCLICALLY
LOADED REINFORCED CONCRETE SECTIONS
SUMMARY
152
Previously used idealised moment-curvature responses
for reinforced concrete sections are discussed. An ''exact"
moment-curvature analysis for such sections is developed in
accordance with the theory presented in Chapters 2 and 3,
and tested against nine experimental moment-curvature res
ponses for beam sections.
5.1 INTRODUCTION
Most previous researches into ductility, plastic
\1inging and other post-elastic characteristics of reinforced
concrete sections have consisted of applying monotonically
increasing loads to test specimens until failure. Under
most circumstances, particularly in the case of seismic
loading, the likelihood of a building being loaded to
failure in this fashion is slight. What has not been
considered fully is the effect that cyclic loading has on
concrete sections and the structural deterioration
153
that results o
In this chapter, a method is derived for predicting
the flexural behaviour of concrete sections under earth
quake-type loading, more specifically, the deformation
properties and energy-absorbing capacityo The analysis is
compared with experimental moment-curvature responses
obtained £Jorn beams tested specifically for this purposeo
5o2 IDEALISED MOMENT-CURVATURE RESPONSES
To date, two idealised moment-curvature (or load
deflection) responses, have been used by investigators in
studying post-elastic cyclic behaviour of structureso
The first, and still most common idealisation, is the
elasto-plastic response shown in Figure Solo Such a
system returns to its original stiffness during all
intervals when it is not actually yielding and behaves '
exactly like an undamaged section during such intervalsa
This expression errs on the unsafe side for analysing
both structural steel and concrete sectionso In the case
of structural steel, the phenomenon known as the
Bauschinger Effect allows considerably less stiffness on
reversal than is represented by an elasto-plastic responseo
The opening and closing of cracks in concrete sections,
and again the Bauschinger Effect, generally produce moment
curvature responses that are difficult to idealise at all,
and assumed elasto-plastic behaviour would predict greater
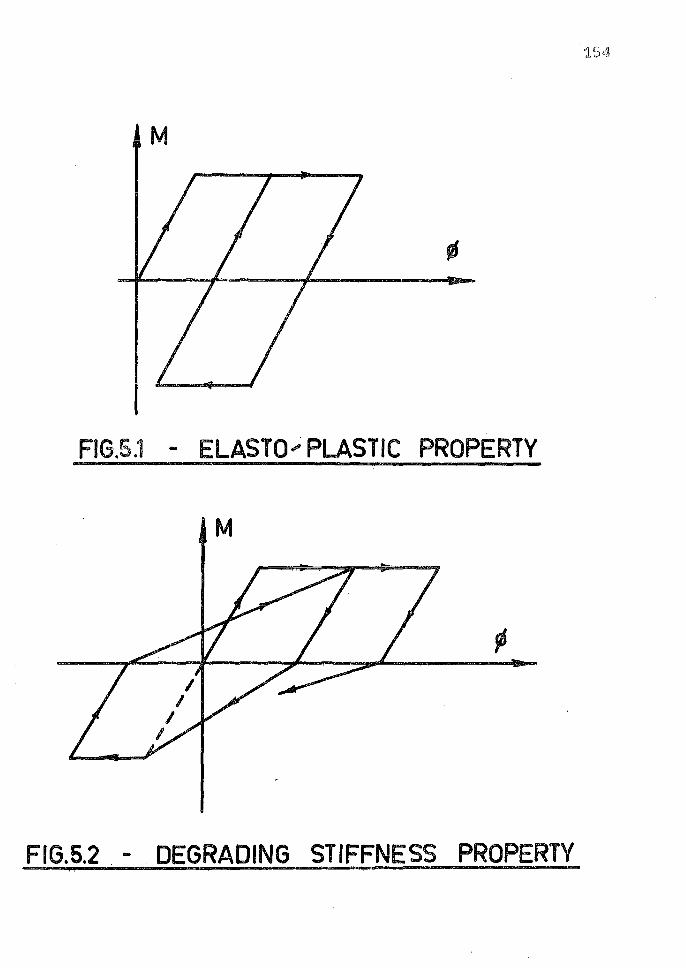
M
FIG.5.1 .. ELASTO; PLASTIC PROPERTY
M
FIG.5.2 . - DEGRADING STIFFNESS PROPERTY

155
stiffnesses than would occur in the real structure.
The second, and probably more realistic idealisation,
is the "degrading stiffness" response proposed by Clough58
as a load-deflection plot. Figure 5.2 illustrates the
degrading stiffness property, and shows that it is much
less resistant to deformation after it has undergone yield
deformation, and thus responds to later phases of cyclic
loading in a fashion completely different from its initial
response behaviour. This degrading stiffness property is
more typical of reinforced concrete and would generally
prove to be conservative for structural steel framed
structures. Clough's approximation is based on test
results.
It is uneconomic to design for seismicity such that
the maximum expected load lies within the elastic range of
all structural components. The current ACI code, in
common with most other building codes, recommends that the
"reserve energy" brought about by post-elastic deform
ations, at critical sections, be utilised for earthquake
resistance. Consequently, the properties after elastic
behaviour of buildings which have been designed to this
philosophy need to be studied.
Clough has applied a series of earthquake accelero
grams to a simple single degree of freedom system and
compared the ductility requirements of the elasto-plastic
156
and degrading stiffness responseso The results show that
ductility requirements vary most markedly with the period
of vibrationo Taking the worst case considered by Clough,
an undamped single degree of freedom system with an
elasto-plastic response··requires a deflection ductility
factor of about 9 for a Oo3 second period, and less than
3 for a 2o7 second periodo If the same accelerogram is
applied to a similar system with a degrading stiffness
response, the ductility requirement for the low period has
become 240 The more flexible structure is unaffected, but
Clough suggests that the higher mode behaviour of larger
period buildings may be somewhat similar to the response
of short period structures, in which case the degrading
stiffness property could have a detrimental effect on the
performance of such structureso
It is therefore evident that a more accurate predic
tion of post-elastic response is necessaryo
Aoyama44 studied the moment-curvature characteristics
of rectangular reinforced concrete members subjected to
axial load and reversal of bendingo While not an ideal
ised moment-curvature response in the direct sense,
Aoyama's analysis was based on elasto-plastic reinforcing
steel response and elasto-plastic concrete response with
tension neglectedo His conclusion to the effect that "the
amount of plastic deformation under previous loading made
drastic changes" illustrated the necessity for a description
157
of the Bauschinger Effecto
5o3 "EXACT" MOMENT-CURVATURE RESPONSES
The term "exact", in the context of this chapter,
refers to moment-curvature responses that are not ideal
ised but that are derived from assumed material properties
with known loading historieso The term is not intended to
imply that the results of the "exact" analysis are
absolutely correct.
The analysis developed in this section draws largely
from the theories presented in Chapters 2 and 3 and is for
use with either cyclically- or monotonically-loaded T sec
tions (of which rectangular sections are a special case),
either with or without axial compressiono (It is possible
to consider axial tension but no consideration of shear
capacity is included in this analysiso)
The analysis has been programmed for computer useo
5o3o1 Cyclically-loaded Concrete
The assumed behaviour of concrete when loaded
cyclically has been presented in Section 2o7 and is
illustrated in Figure 2014. It was shown in Chapter 4
that for monotonic loading using the proposed concrete
stress-strain response, there are twelve general cases
for the compression stress blocko It is not known how
many such cases would be needed for cyclic loading but
158
a simple elasto-plastic response as used by Aoyama, giving
only two general stress blocks for monotonic loading,
requires eighteen such general stress blocks for cyclic
loading. It is therefore clear that some other algorithm
is required to mathematically describe the stress-strain
behaviour of cyclically-loaded concrete and this is con
firmed by the situation represented in Figure 5.3.
Figure 5.3(i) is the general concrete stress-strain
curve assumed for this thesis. Figure 5.3(ii) shows stress
and strain profiles resulting from the confined concrete
being loaded monotonically, such that the strain in the
extreme fibre reaches €ex (where €cx>e20 ). The concrete
can then be unloaded and the strain in the extreme fibre
reduced by a small amount 6e such that the stress in the ex
top fibre becomes zero. Hence at the point corresponding
to a strain of 0.75€ before unloading, the strain reduccx
tion must be 0.75~€ (assuming that plane sections remain ex
plane and for simplicity, that the neutral axis does not
move). Similarly for the points originally corresponding
to 0.50€ ex and 0.25€ ex Therefore, although the strain
distribution after unloading (Figure 5.3(iii)) is little
different from that prior to unloading, the stress dis
tribution is markedly altered.
The above example is not complicated by a shift in
the neutral axis position.
To solve this problem, the approach adopted in this
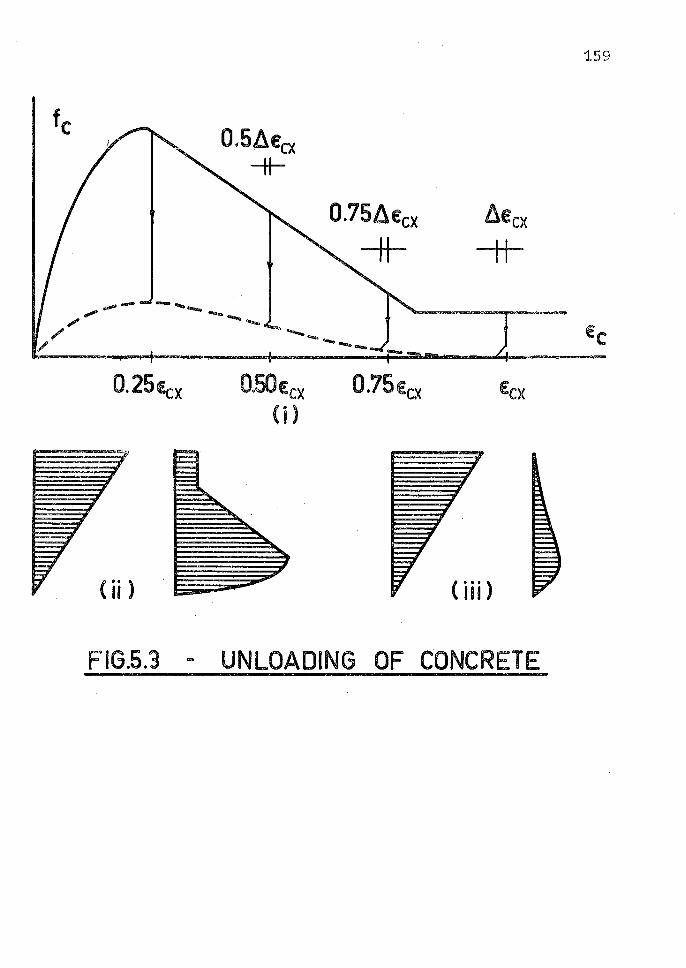
159
0.25£cx 0.50 Ecx O. 75 Ee.'< (i)
( ii ) ( iii)
FIG.5.3 - UNLOADING OF CONCRETE
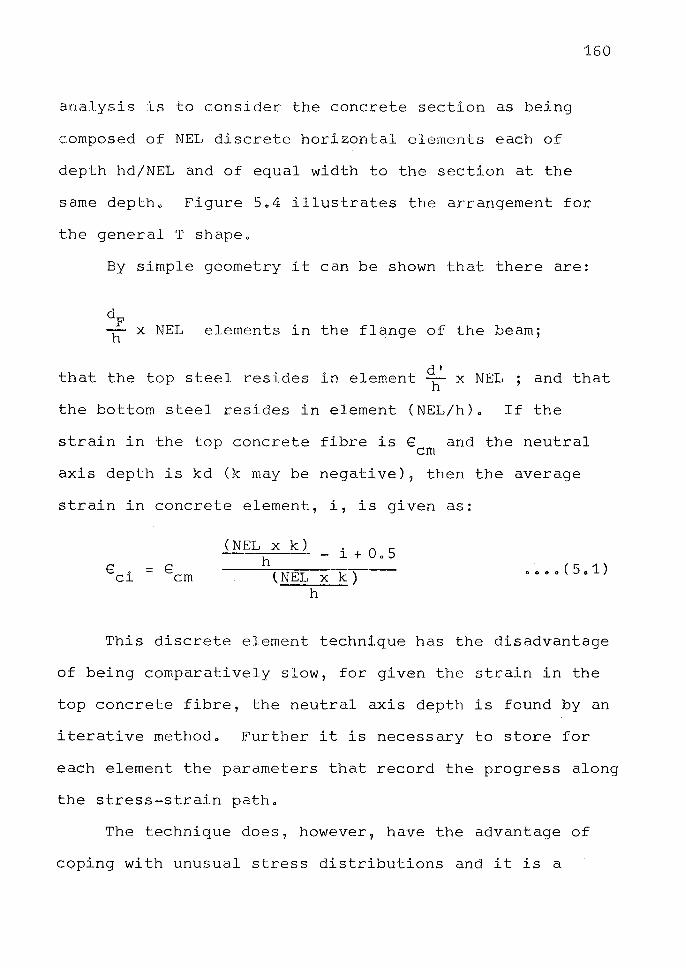
'160
analysis is to consider the concrete section as being
composed of NEL discrete horizontal elements each of
depth hd/NEL and of equal width to the section at the
same depthc Figure 5o4 illustrates the arrangement for
the general T shapeo
By simple geometry it can be shown that there are:
dF h x NEL elements in the flange of the beam;
that the top steel resides in element~• x NEL ; and that
the bottom steel resides in element (NEL/h)o If the
strain in the top concrete fibre is E: and the neutral cm
axis depth is kd (k may be negative), then the average
strain in concrete element, i, is given as:
E: • = E c1 cm
(NEL x k) . OS h - l + o
(NEL x k) h
This discrete element technique has the disadvantage
of being comparatively slow, for given the strain in the
top concrete fibre, the neutral axis depth is found by an
iterative methodo Further it is necessary to store for
each element the parameters that record the progress along
the stress-strain patho
The technique does, however, have the advantage of
coping with unusual stress distributions and it is a
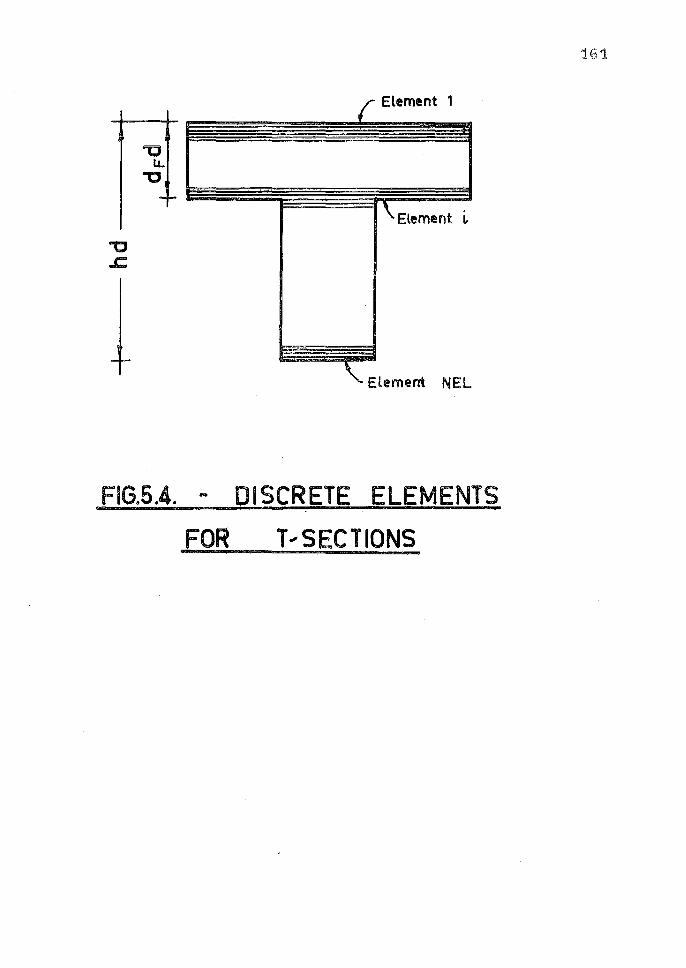
"'C .c.
r El t 1 emen
\Element ~
\. Element NEL
FIG.5.4. - DISCRETE ELEMENTS
FOR T--SECTIONS
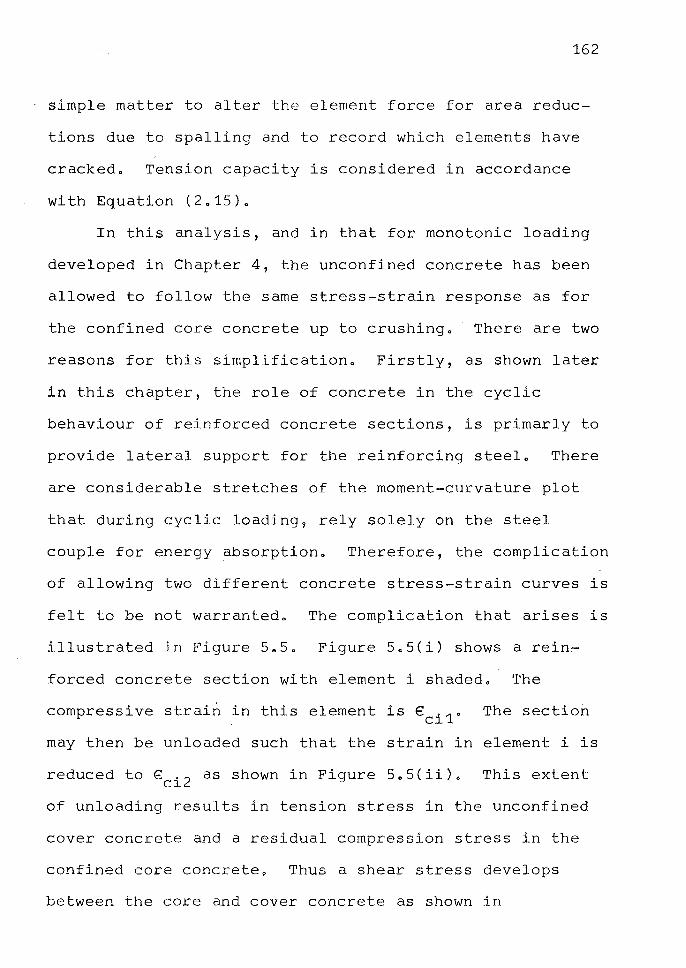
162
simple matter to alter the element force for area reduc-
tions due to spalling and to record which elements have
cracked. Tension capacity is considered in accordance
with Equation (2.15).
In this analysis, and in that for monotonic loading
developed in Chapter 4, the unconfined concrete has been
allowed to follow the same stress~strain response as for
the confined core concrete up to crushing. There are two
reasons for this simplification. Firstly, as shown later
in this chapter, the role of concrete in the cyclic
behaviour of reinforced concrete sections, is primarly to
provide lateral support for the reinforcing steel. There
are considerable stretches of the moment-curvature plot
that during cyclic loading 1 rely solely on the steel
couple for energy absorption. Therefore, the complication
of allowing two different concrete stress-strain curves is
felt to be not warranted. The complication that arises is
illustrated in Figure 5e5. Figure 5.S(i) shows a rein~
forced concrete section with element i shaded. The
compressive strain in this element is€ . 1 • The section Cl
may then be unloaded such that the strain in element i is
reduced toe . 2 as shown in Figure 5.5(ii). This extent Cl
of unloading results in tension stress in the unconfined
cover concrete and a residual compression stress in the
confined core concrete. Thus a shear stress develops
between the core and cover concrete as shown in
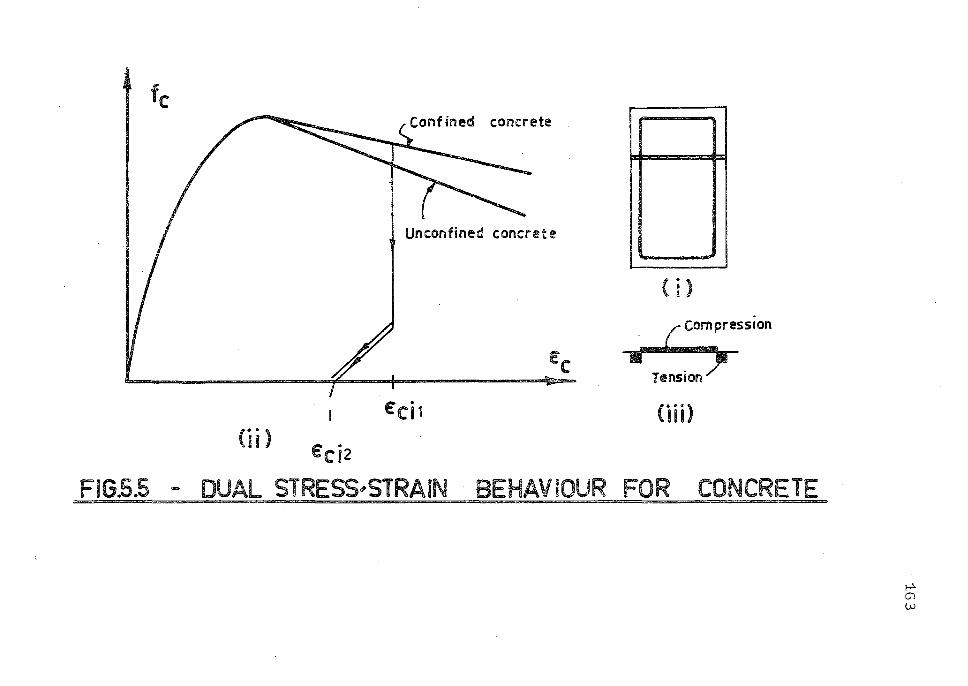
fc confined concrete
Unconfined concrete
( i )
EC
£ci1 CHD (ii)
£ci2
FIG.5.5 - DUAL STRESS,STRAIN BEHAVIOUR FOR CONCRETE =======~~~~~======-=~====-========-=
p Cl w
164
Figure 5o5(iii). Note that it is not necessary for the
core concrete to be in tension for a shear stress to
develop between core and cover concretes, nor is it even
necessary to unload the concrete at all. This situation
may well arise in reality but its inclusion in this analy
sis is considered to be a refinement beyond the accuracy
of the present concrete stress-strain representation.
Further, the unconfined concrete is assumed to be ineffect
ive at strains exceeding€ = 0.004, at which strain, er
deviations in stress between confined and unconfined
concretes are not generally large.
5.3.2 Cyclically-loaded Reinforcing Stee!
The expression for Bauschinger Effect in reinforcing
steel, proposed in Section 3.9, is incorporated in this
analysis.
5.4 ALGORITHMS FOR COMPUTER PROGRAMS
Two computer programs were developed for this analysis.
The first computes bending moments, curvatures and energy
absorptions for cylically-loaded reinforced concrete Tor
rectangular sections, with or without constant axial
compression stress, and considers the Bauschinger Effect
expressions advanced in Chapter 3. The programs operate
within stipulated curvature cycles. The second program was
almost identical to the first, the only difference being
that the stress-strain behaviour of the reinforcing steel
165
was allowed to be elasto-plastic. The algebra of the
analysis appears in the program listings in Appendix B.
In order to keep the analysis general, the dimensions
band dare eliminated by using the dimensionless para
meters dF' WF, d', b" and has illustrated previously in
Figure 4.3. Other input requirements are: steel
properties (f, f, p € h' E) for top and bottom steels; u y ' s s
concrete properties (€ , € , z, f'); and the number of o er c
elements, NEL. Axial load in the form (P/bd) p.s.i. can
be read in conjunction with ep (where epd is the distance
from the top of the section to the point of action of the
axial load) if axial compression is required. Finally,
dimensionless curvature readings, ~d, representing points
of curvature reversal are required.
From this input, various other properties are
established, including the strain hardening parameters
discussed in Chapter 3, and arrays are initialised.
5.4.1 Iteration and Compatibility
The iterative technique used is based on adjusting
the strain,€ , in the top concrete fibre by a fixed cm
positive or negative amount, depending on whether it is
desired to increase or decrease the curvature respectively.
Having established€ , k is chosen as -20000 and all cm
concrete and steel strains, and hence stresses, are computed
for this neutral axis depth. From a force compatibility
test it is then established whether or not the actual
166
neutral axis depth is positive or negative. If it is found
to be positive, k is set equal to 100 and the concrete and
steel stresses and strains recomputed. Subsequently, if
the neutral axis is found to be too high, k is incremented
by g (where initially g is +20000 for negative neutral axis
depth, and is +100 for positive neutral axis depth). If k
is too large, it is reduced by g; g is then halved, and the
new g added to k. If I k Is. 0. 001, it is considered as being
too large and is reduced by g. In this way, neutral axis
depths within the range - 20000d to +15000d are allowed. If
the neutral axis depth is not within these limits, the
analysis proceeds to the next value for€ cm In any case, a
maximum of 150 trial values fork is permitted for each€ cm
value. If compatibility is not obtained to within (bd/3)lb
before 150 k values have been studied, the k value giving
the least force compatibility error is chosen. Using the
sign convention, compression positive, the criterion for
determining whether k is to be increased or decreased depends
on whether € x (2 compression forces -~ tension forces -cm L
axial force) is negative or positive respectively.
Having obtained compatibility the bending moment and
curvature are computed. If, at this stage, the computed
curvature is found to exceed the input value for curvature
for the cycle being considered, an assumed linear relation
between€ and computed curvature values of the previous cm
increment, and the€ and computed curvature values of the cm
167
current increment 1 is used to obtain an e value that will cm
produce the required curvature valueo In all cases studied,
this technique resulted in calculated curvatures that
coincided with input curvature values for the extremities of
the cycleso
Algorithms for obtaining concrete and steel stresses from
the computed strains were found to be considerably more compleXo
5o4o2 Concrete Behaviour
In the case of the concrete, the first check for each
element is to establish whether or not the strain is greater
than that previously experienced by the element" If it is a
maximum value, the stress is computed from Equations (2o19)
or (2a20) or (2a23)o If however, the strain value is less
than a previous maximum value, the concrete could be in one
of four states" Either it is being unloaded, or it is in
tension, or it is being reloaded, or the strain may be such
that no stress exists at alla In all four cases, a necess
ary parameter is the stress in the element at the maximum
strain value" Also, in the case of the unloading and
reloading states, the values for concrete strain in the
previous increment and at the next zero stress are required
to determine whether the concrete element is being unloaded
or reloaded" If the strain indicates tension stress, a
check is made to establish whether the element can sustain
this stress, ioea whether f is exceeded or whether the , r
element has cracked previouslyo
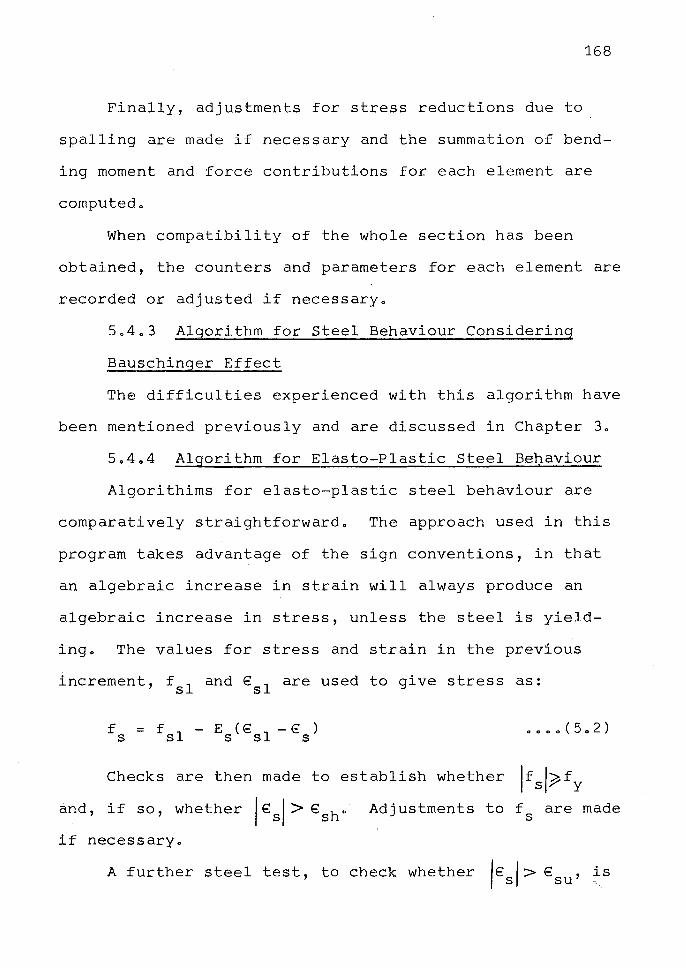
168
Finally, adjustments for stress reductions due to
spalling are made if necessary and the summation of bend
ing moment and force contributions for each element are
computed.
When compatibility of the whole section has been
obtained, the counters and parameters for each element are
recorded or adjusted if necessary.
5.4.3 Algorithm for Steel Behaviour Considering
Bauschinger Effect
The difficulties experienced with this algorithm have
been mentioned previously and are discussed in Chapter 3.
5.4.4 Algorithm for Elasto-Plastic Steel Behaviour
Algorithims for elasto-plastic steel behaviour are
comparatively straightforward. The approach used in this
program takes advantage of the sign conventions, in that
an algebraic increase in strain will always produce an
algebraic increase in stress, unless the steel is yield
ing. The values for stress and strain in the previous
increment, fsl and €sl are used to give stress as:
• • • • ( 5 0 2 )
Checks are then made to establish whether If sl~fy
and, if so, whether jesl> €sh· Adjustments to fs are made
if necessary.
A further steel test, to check whether 1€ ·I>€ , is S SU
169
performed following each successful force compatibility
equilibriumo
5.4.5 Operation of the Programs
Using the analysis described here, computer time
required for the production of moment-curvature responses
for each beam with 14 or 15 loading cycles, was of the order
of 60 minutes for 100 elements and an E increment of 10-4 • cm
Some comparisons using 200 elements indicated no difference
in any computed values, and comparisons using 50 elements
indicated very small differences compared with the 100-
element analysis. All neutral axis depths fell within the
range allowed by the program.
5.5 EXPERIMENTAL MOMENT-CURVATURE RESPONSES
Very little experimental effort has been directed at
the study of cyclically-loaded reinforced concrete sections
and it was therefore necessary to conduct a test series to
assess the accuracy of this analysis. Full details of this
investigation and of the derivation of moment-curvature
responses appear in Chapter 7 and in Appendix D;
Of the eleven beams tested, nine were considered to
give acceptable results.
Each beam was 10' - 0" long and was simply supported
over 9' - 0" by means of an axle at beam mid-depth. The
central part of the beam simulated a column stub, to which
the point loads we.re applied. All beams were of 4 15/16"x8"
170
section with 2 ~ ½" dia. deformed bars top steel and ¼"
diao plain bar stirrupso Cover to all main steel was 1 110
Stirrup spacings considered were 2", 4 11 and 6 11 and the
first digit of the beam number indicates this spacingo The
second digit of the beam number specifies the nominal
diameter in i" of the two deformed bars at the bottom of
the beam, i o e o Beam 2 7 has 2" stirrup spacing and ]" di a.
bottom steel.
Figures 5.6 to 5.14 illustrate experimental moment
average curvature responses for the critical sections of
the nine beams, compared with the theoretical behaviour
predicted by the analysis presented in this chapter. In
all cases, the experimental curvatures at load reversal
points were given, and the moments computed at these points
and at intervals between successive points. The sign
conventions adopted are as follows: positive bending
moment arises from a downward load being applied to the
beam; positive curvature corresponds to tension on the
bottom of the beam. Dead load bending moment at critical
sections was approximately 6 K.in. for all beams as shown.
Figures 5.15- and 5o16 show experimental moment
curvature responses for two of the beams compared with a
theoretical analysis using an elasto-plastic reinforcing
steel response.
Lines, rather than points, illustrate the experimental
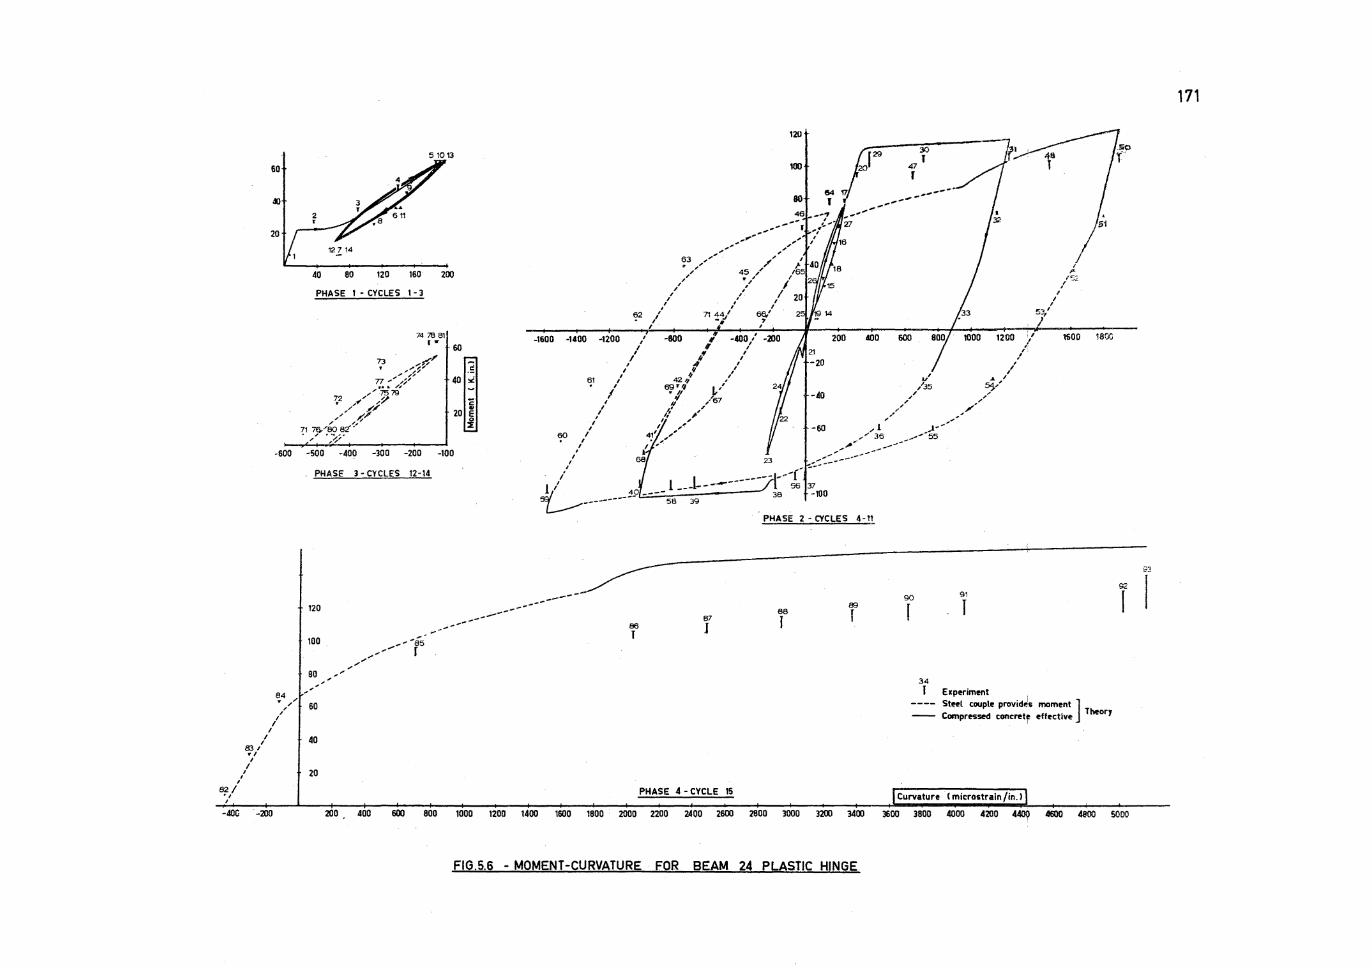
82/ ., I
60
«>
20
-600
€;4 .......... , /
/ I
I I
83 I
I I
I
., I
I
-40C -200
2 r
12 !. 14
40 80 120
PHASE 1 • CYCLES
51013
160 200
1·3
74 78 81 I w
60
::~ -500 -400 -300 -200 -100
PHASE 3 • CYCLES 12-14
62
I
, , /
I
_,-"""' 63 ,,.,,,,,
:.,,,,' /
_,,. --
120
100
80
46 -,.,,.,,- I
-1600 -1400 -1200 / -800 ~ -.00 / -200 200 400 600 1200 :,, I # /
I ,! / , ,' 4"' / ,'
I J.1/ / / 61 / 42 1/'I I 1/ ..a. ,
/ 69TIJ 1 _/35 ~1-/ / • 11 I,' -40 / '
1 ,l /67 / _, _,,,.,' l ,t' ,, _.; ,,,,. - ,.
I I ,, , _.,
,' I ,~ -60 .,..1 ,.1,,.. ..... ~ ,' 411 ,,,, ,,,/ 36 ,......-'"'55
I I• ,,,,' ;" __ .,--, l .,,,, ----
/ 68 23 ,-::::------,' - ,.,, --
/ I ------l/ f 1 ,' 1 _.-1------ 56 37 ,;/ 40 ____ 38 -TOO £---"---------- 58 39 .
PHASE 2 - CYCLES 4-11
------ 90 91
I I
I
53,'
I ,. ,/52
1500 18%
120 ---------------B6 T
87
J r l 88
l 89
f 100 ---as
,,.,,.,.,---- f
80 ,-
60
40
20
--
PHASE 4 - CYCLE 15
34 J Experiment
Steel couple provid~s moment ] Compressed concrete effective Theory
I
Curvature ( microstrain /in. l
92
[
200 400 600 800 1000 1200 1400 1600 1800 2000 2200 2400 2600 2800 3000 3200 3400 3600 3800 4000 4200 440Q IIEllO 4800 5000
FIG.5.6 - MOMENT-CURVATURE FOR BEAM 24 PLASTIC HINGE
171
93
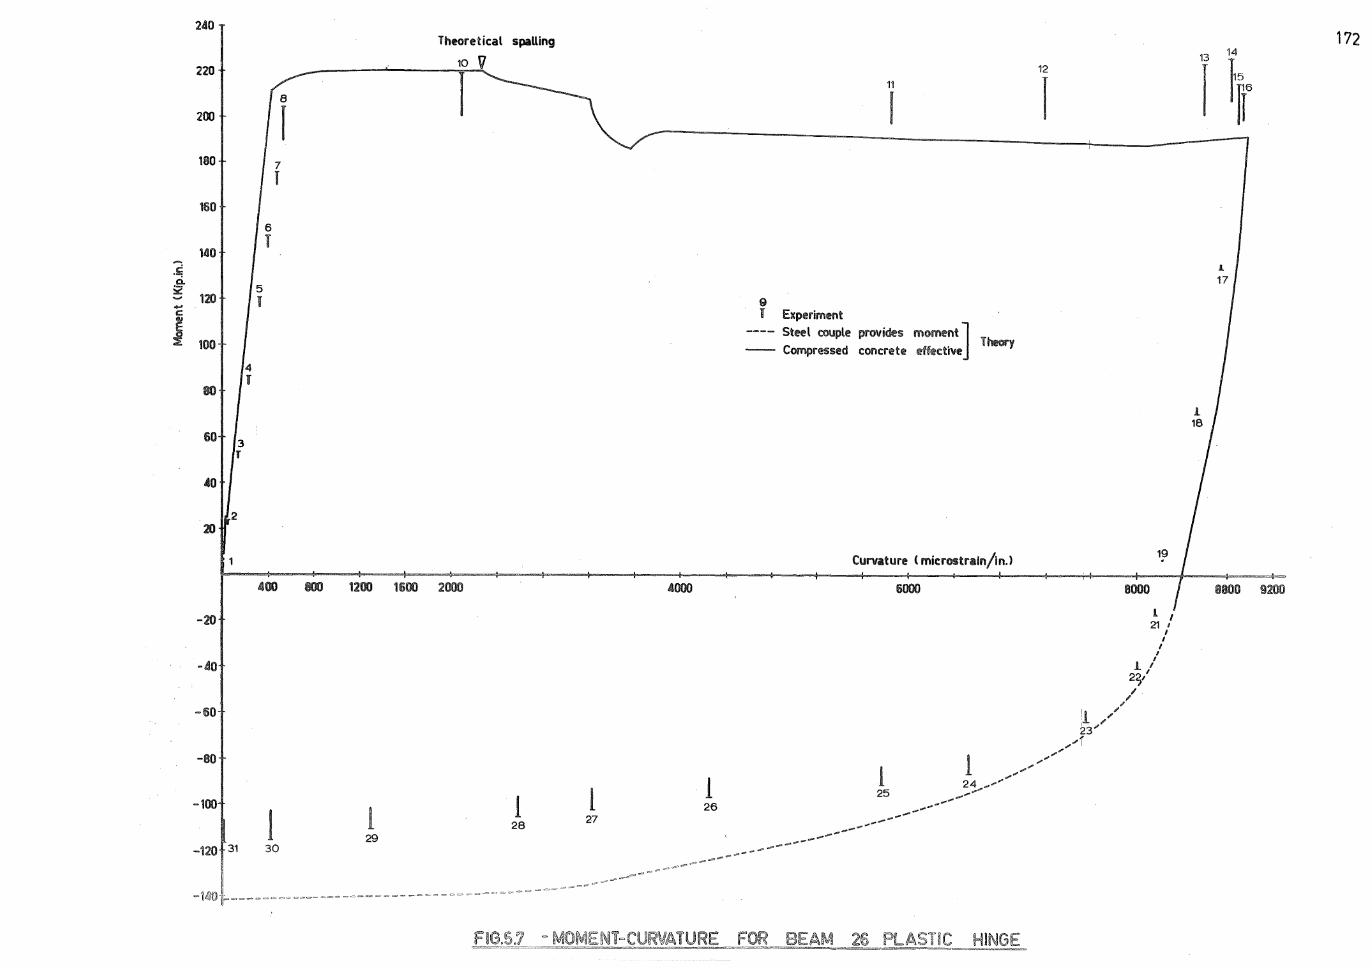
240
220
200
180 7
I 160
6
l 140 --~ .e- 5 ::ii:: 120 I ....
C
j 100
4
' 8()
60 3 r
.to
2 20
400 800
-20
-.iO
-60
-80
-100
1 -120 31 30
Theoretical spaUing
10 V
l
1200 1600 2000 £000
1 l 28
l 27
l 26
29
11
J
9 J !Experiment
---- Steel oouple provides moment] Theory
-- Compressed concrete ieffective
Cun,ature ( mic:rostraln/in.>
6000
1 l 25
12
r
8000
19
A
17
172
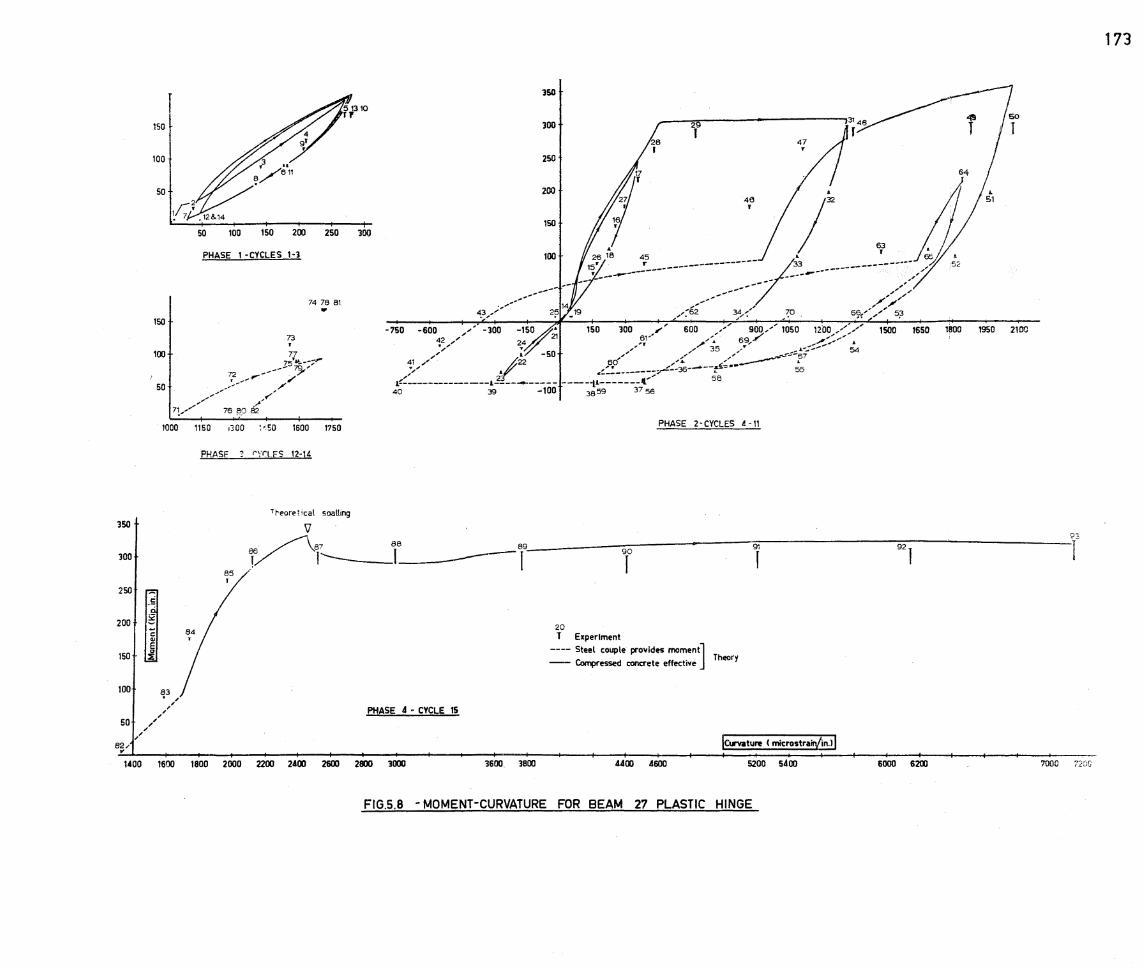
350
300
250
200
150
100
so
150
100
50
150
100
so
so 100 150 200 250
PHASE 1 ·CYCLES 1-3
73
74 78 81 .. 77
75•»--~ 72 ----- ~, _:/ __ r /✓
,,.,,...... ,.,,,,, 11,/ 76 ~o ~
.,/ /
1000 1150 ,100 ~ ,so 1600 1750
PHASE ? f'Yl'.'LE"S 12·14
Treore!ical soalling
83 . ., ,,,,'
300
-750 -~oo ,-,
41 .,, . .,, .,-
12,,' .,,'
1""-------40
PHASE 4 - CYCLE 1S
350
300
250
200
150
100
47 ~
f \' /~ , 1, ~---Y---------------r---~-------------------,,
_ ... ---- ;," ------- .,.,,:.,,., / ., -
...,:s2 3;,--: ~o . ~r'"' ,,' ~
-300 -1~0 • 150 300 ,,,, 600 __ ,, 900/' 1050 1200/::--,,., 1500 1650 24 21 e1-' ~,~ 69,/ .,....,;:-~ •
T O ,,,,''fl ,, 35 ,,;r -·---- !54
/~ -5 60 -< / ____.-r.,-:-,p
'.. ,:-35------&~-==-- 55 --1------------ -----t=----;::;:;- ;8
39 -100 3559 37 56
PHASE 2·CYCLES 4 ·11
20 T Experiment
--- Steel couple provides moment] -- Compressed concrete effective
!Curvature ( microstrain/in.> ! 3600. 3800 4400 4600 5200 5400 6000 6200
FIG.5.8 - MOMENT-CURVATURE FOR BEAM 27 PLASTIC HINGE
173
1800 1950 2100
7000 72:iG
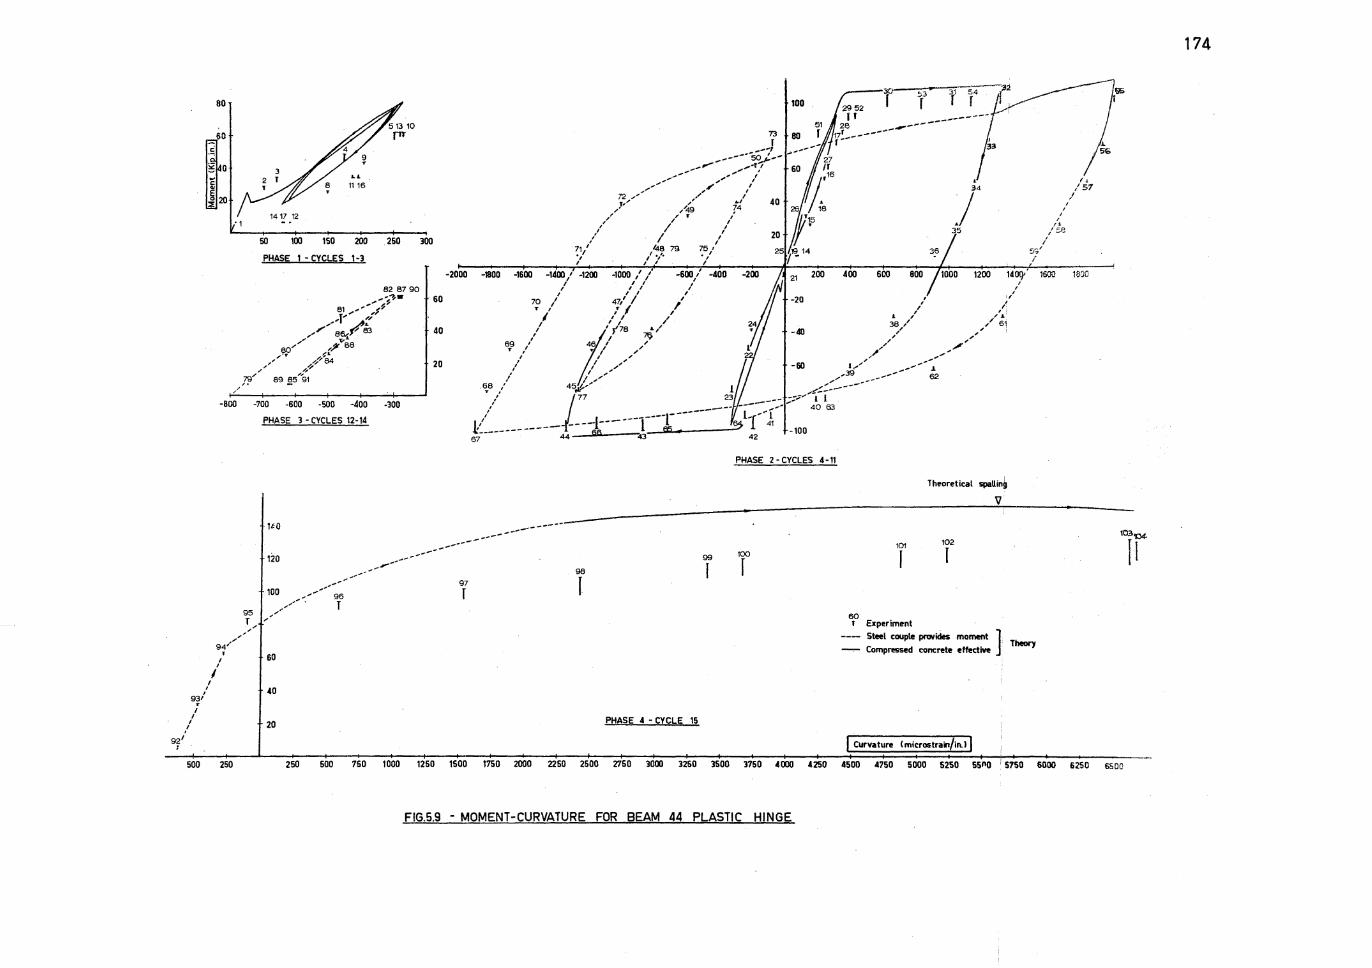
I I
I 9~1 I
I I
/
500
50 100 150 200 250 300
PHASE 1 • CYCLES 1-3
-2000
60
40
20
-800 -700 -600 -500 -400 -300
PHASE 3 - CYCLES 12-14
,oo J0---'.:-3-----:;~,;-1-;;54
I r , r ----------~
35
-1800 -1600 -1400 1 -1200 -1000 / / -600 / -400 -200 400 600 800 1200 1409" l I I ,' I
I I I I I J I I I ,/
70 / 47. 1 / 1 -20 ,' T , ,/ I ,, ,, ,l
11 l / / ::S / 1 /, t1 I I J"78 a./ -40 / ,,,' ,
69 ,/ / , ,,' ,,,,."""'' T // // ,"" ,,,,~' ,,,..,,,,
,,, ,' ,,,,,' -60 .,,, _,_ .......... .1
' / ,, ,..39 .... ,- 62 1
/ I .,,,,,,, .,,..,," ______ _ . ~8 ,' 45~,... 1 ,~.:.---., j 77 23 ____ _;;.:v 1 l
,' --- -- .,..-- 40 63
• / -1-------1----r------ =1-r--1
I I
5;' I
I I
I I ,.
/SB
1600
.i:: ____________ 44 ___ §§ '13 f§ 7 42 -100
67
1tO --------------------
120 _,.---------,,, ......
---- 97 100 -- T .,,,,,. ... _,.,.,. 96
,,"" T /'
98
l ,,
60
40
20 PHASE 4 · CYCLE 15
PHASE 2 • CYCLES 4-11
99
r 100
f
60 T
Theoretical spallin~
V
101 102
r r
Experiment
Steel couple provides moment ] Compressed concrete effective
! Curvature <microstrain/in.> l
Theory
) lo
/57 /
10.3'Q4.
iI
250 250 500 750 1000 1250 1500 1750 2000 2250 2500 2750 3000 3250 3500 3750 4000 4250 4500 4750 5000 5250 551\0 I 5750 6000 6250 6500
FIG.5.9 - MOMENT-CURVATURE FOR BEAM 44 PLASTIC HINGE
174
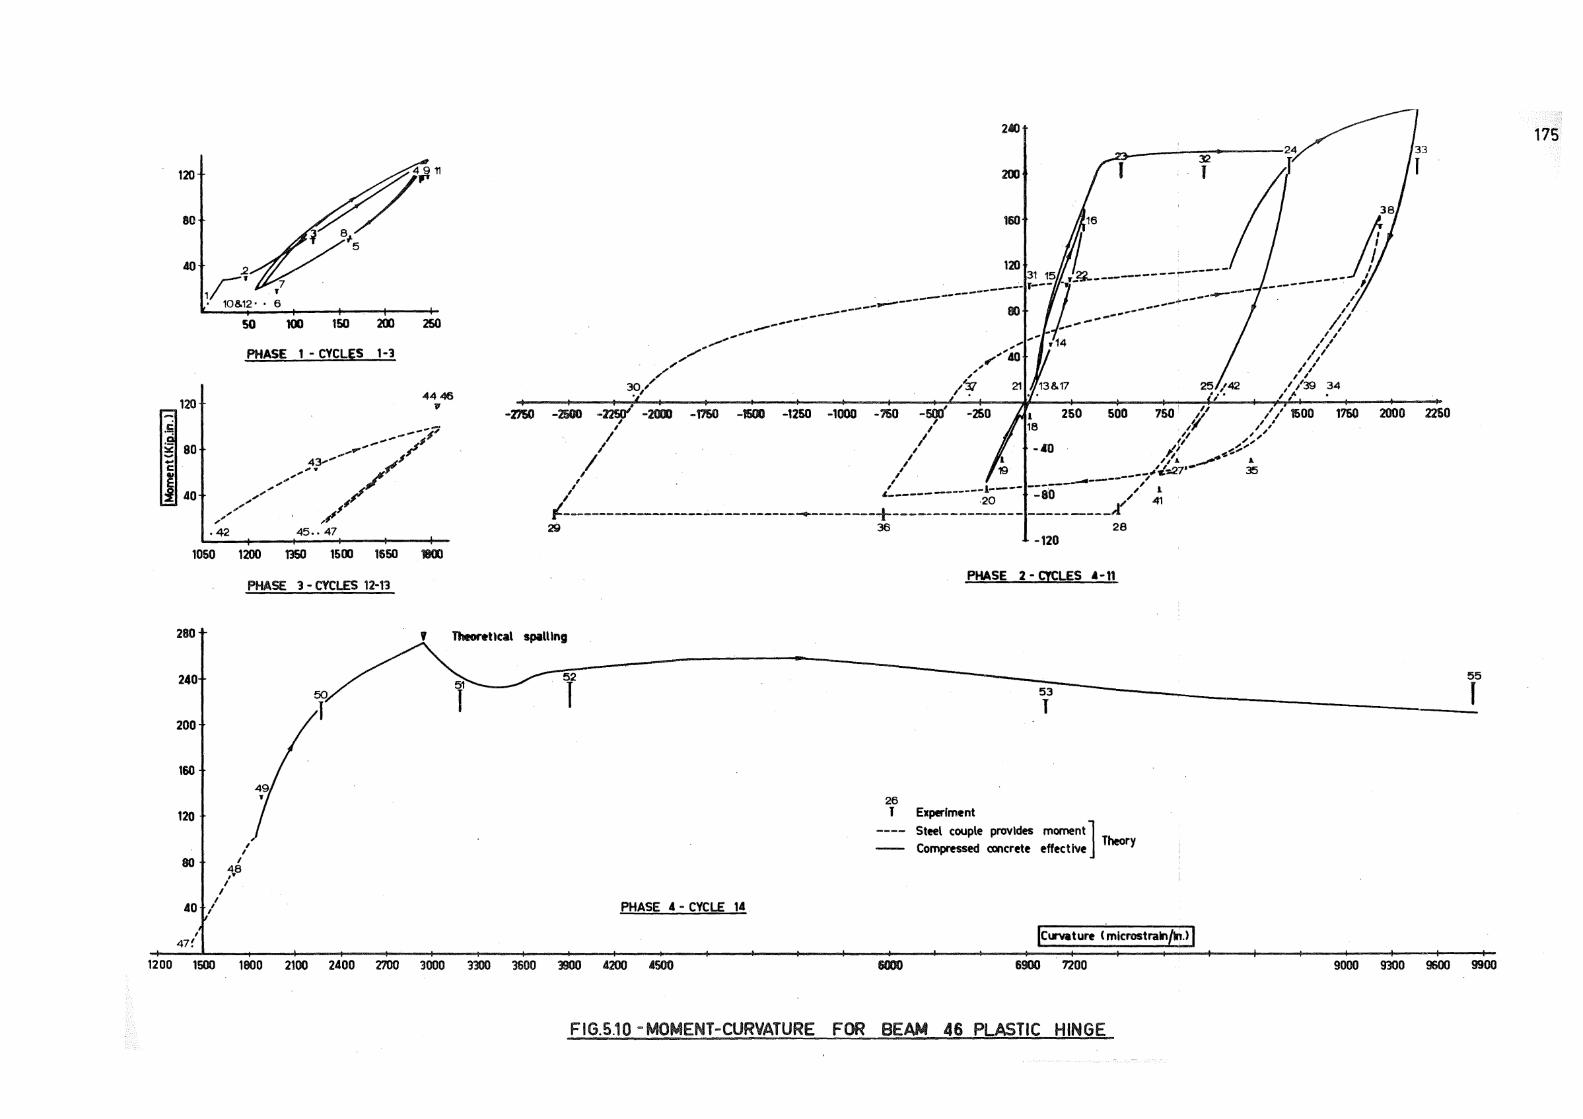
.~ ~ ... t: et
j
120
80
40
120
80
40
2
1ry 10&12· · 6
50 100 150 200
PHASE 1 - CYCLES 1-l
250
-4446 y
1050 1200 1150 1500 1650 1800
PHASE l - CYCLES 12-1'3
280
240
200
160
-2750 -2500 -'l'lfj"· -2000 -1150 -1500 -1250 -1000 -750 -r;P' -250 250 500 750 ,,,f' /:/ 1500 1750 I I ,,, , ,,
I I _.,. ,,(' ,..~., I •u /', I ._~,
/ / ,/A. _,,.,. .I.
, / --~'..tT-2.7'- 35 , , ----------- , l .' --------1---- --8.-0-- ,' l
I •----- - " ' -------------- ·-------------------+---------- -20 --- _________ ,r' 41
2000 2250
- ~ w -120
PHASE 2 - CJCLES A - 11
240
f ThforeUcal spalllng
1~T5f -------7y---__ _Jr 200
160
120
80
I I
40 I I
I
47!
, I
I 48 , ..
I
,
PHASE 4 - CYCLE 14
26 T Experiment
Steel couple provides moment] Compressed concrete effective Theory
1200 1500 1800 2100 2400 2700 3000 3300 3600 1900 4200 4500 6900 7200 9000 9300 9600 9900
FIG.5.10 -MOMENT-CURVATURE FOR BEAM 46 PLASTIC HINGE
175
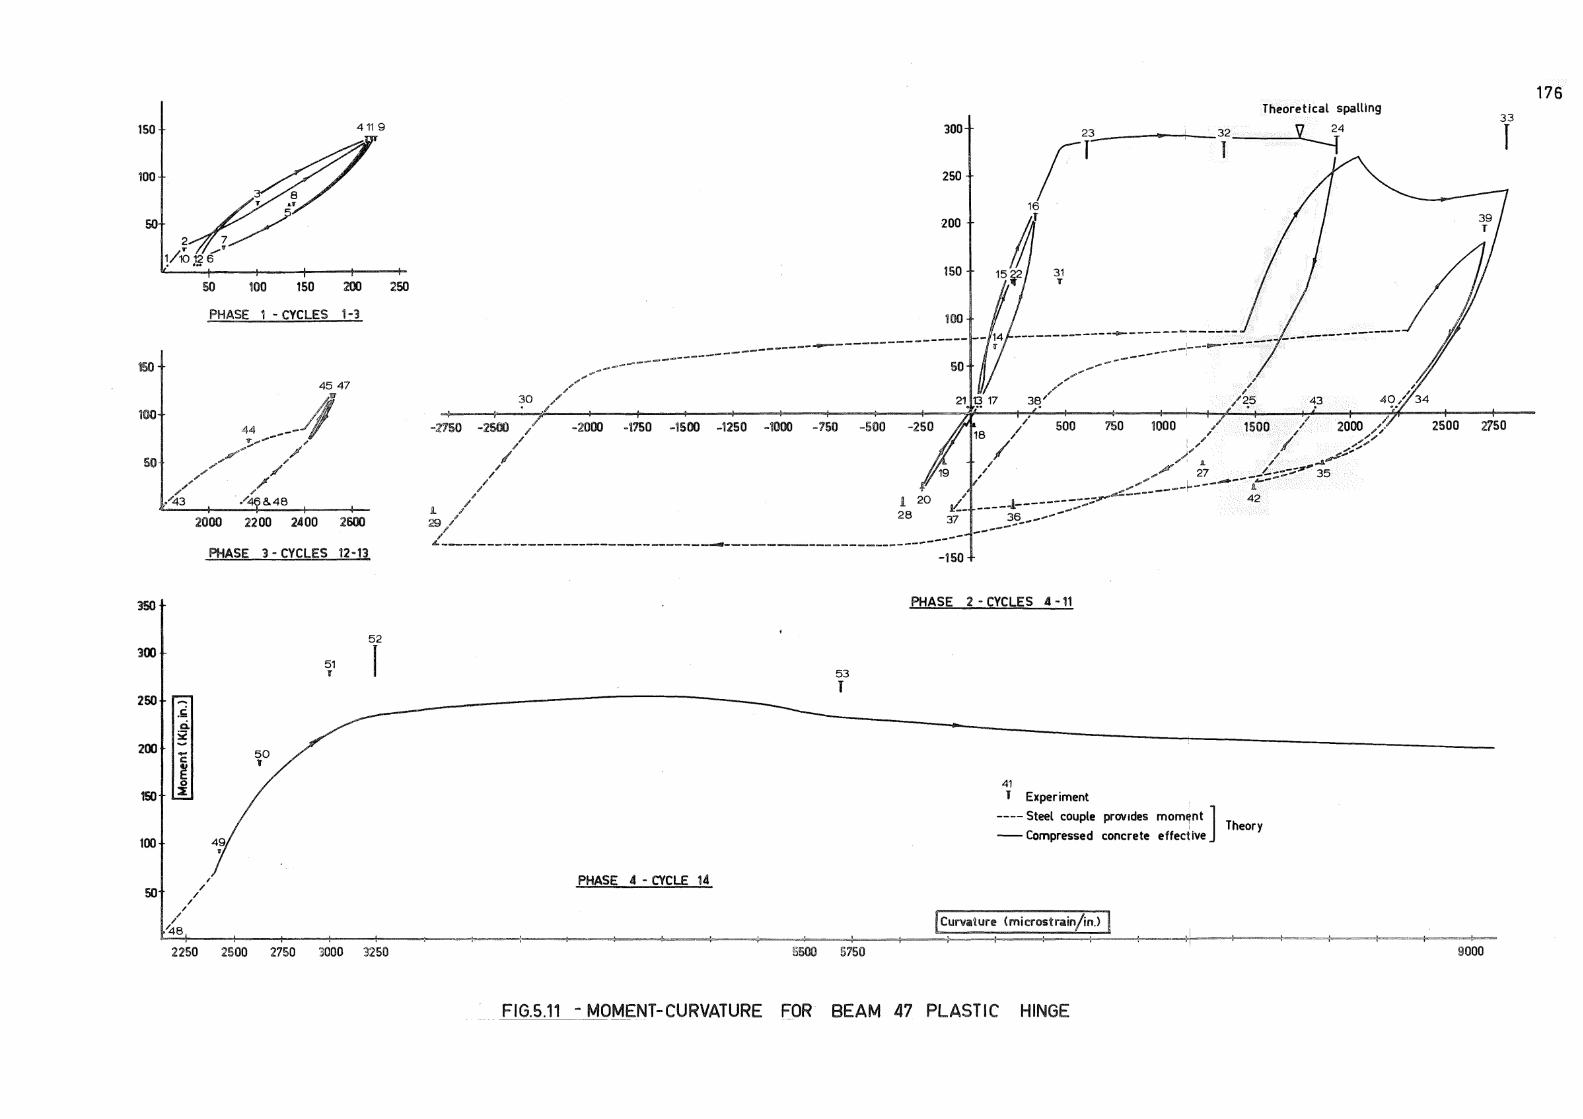
150 4119
'lOO ~ T >.T
50 2 7/ ... _,,,,,..,
1/10 12 6 . . .. 50 100 150
PHASE 1 - CYCLES 1-3
45 47
'1(00 44 ____ f v,-' .f' ,, . ..-- /
·"' ,, .,,,,, / / /
.,/' / /43 . /46&48
2000 2200 2400 2600
PHASE 3 - CYCLES 12-13
350
52 300
r 51
' 250
.& C. i:
200 .... C
~ 0
150 ::I:
100
, 50 /
/
" , /
I 148
2250 2500 2750 3000 3250
250
300
250
200
150
100
t?"";O...,. .. ,.- .. -=-=' -------------------- --------
30
-mo -2soo / -2000 -1750 -1soo -12so -moo -750 -500 -250
.ll. / 29 / ,,
/
" ,,/' .,
/ /
/
L------------------------• --- ---
Jl 20 28
., ., t'-37
-----~-----------------150
PHASE 2 - CYCLES 4 -11
53 I
41 T Experiment
Theoretical spalling
y~4
---- Steel couple provides mom~nt J Theory - Compressed concrete effective
PHASE 4 - CYCLE 14
I Curvature (microstrain/inJ I J-,=· ~--i=.c- ... ---:=-== =-7~-
5500 5750
.... _flG.5.11 -_MOMENT-CURVATURE FOR BEAM 47 PLASTIC HINGE
176 33
r
2500 2750
J,--=
9000
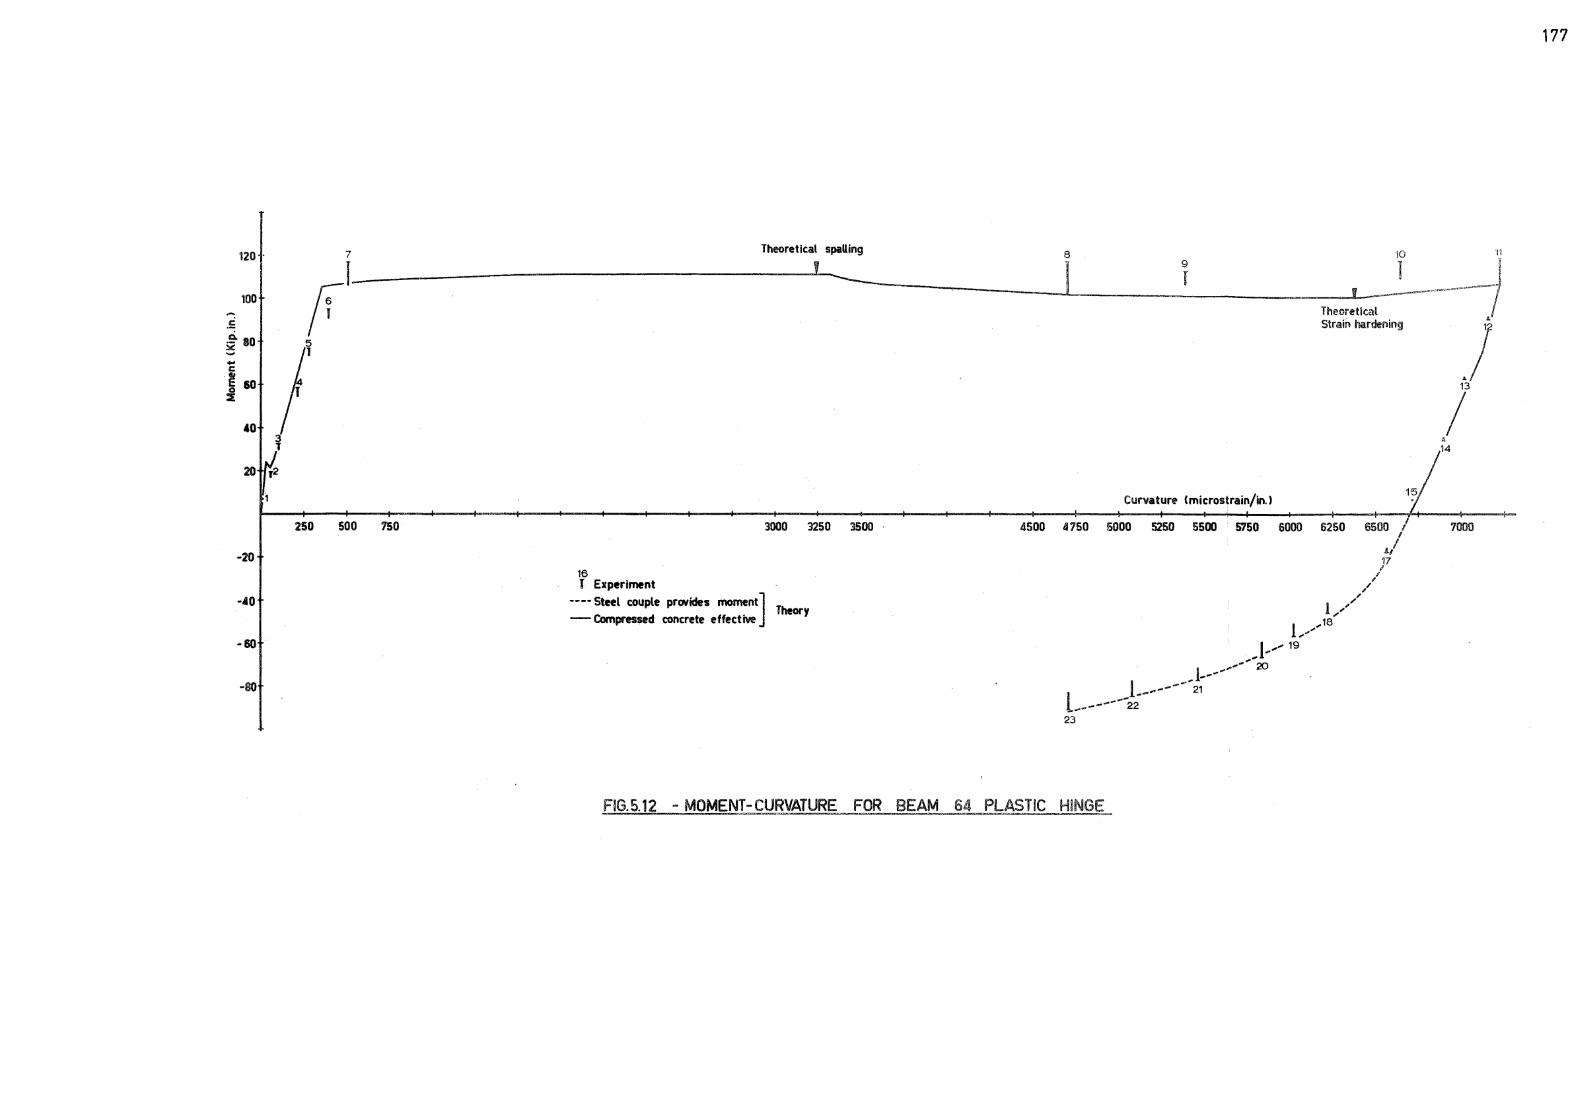
120 · 7
100 r' -.E 180 -... C
·~ 0 60 :I:
,o i
20 r2
250 500 750
-20
-•o
-so
Theoretical spatting 8 9
T
Curvature <microstrain/in.)
3000 3250 3500 · 4500 4150 5000 5250 5500 5750 6000 6250 6500 ,
16 T Experiment
---- Steel c:ou. ple prD'lides moment] Theory - Compressed concrete effective
1 ,,,,, ,, 1 .... 18 ,. ..
1------ 19 l ............. 20
l l---------2; .... -______ ,-22
23
FIG.5.12 - MOMENT-.~JJ_RVATURE _ FOR BEAM,6~~ J:bASTIC HINGE
,/ ,,
I
.1./ 17
,I ✓
,I
177
7000
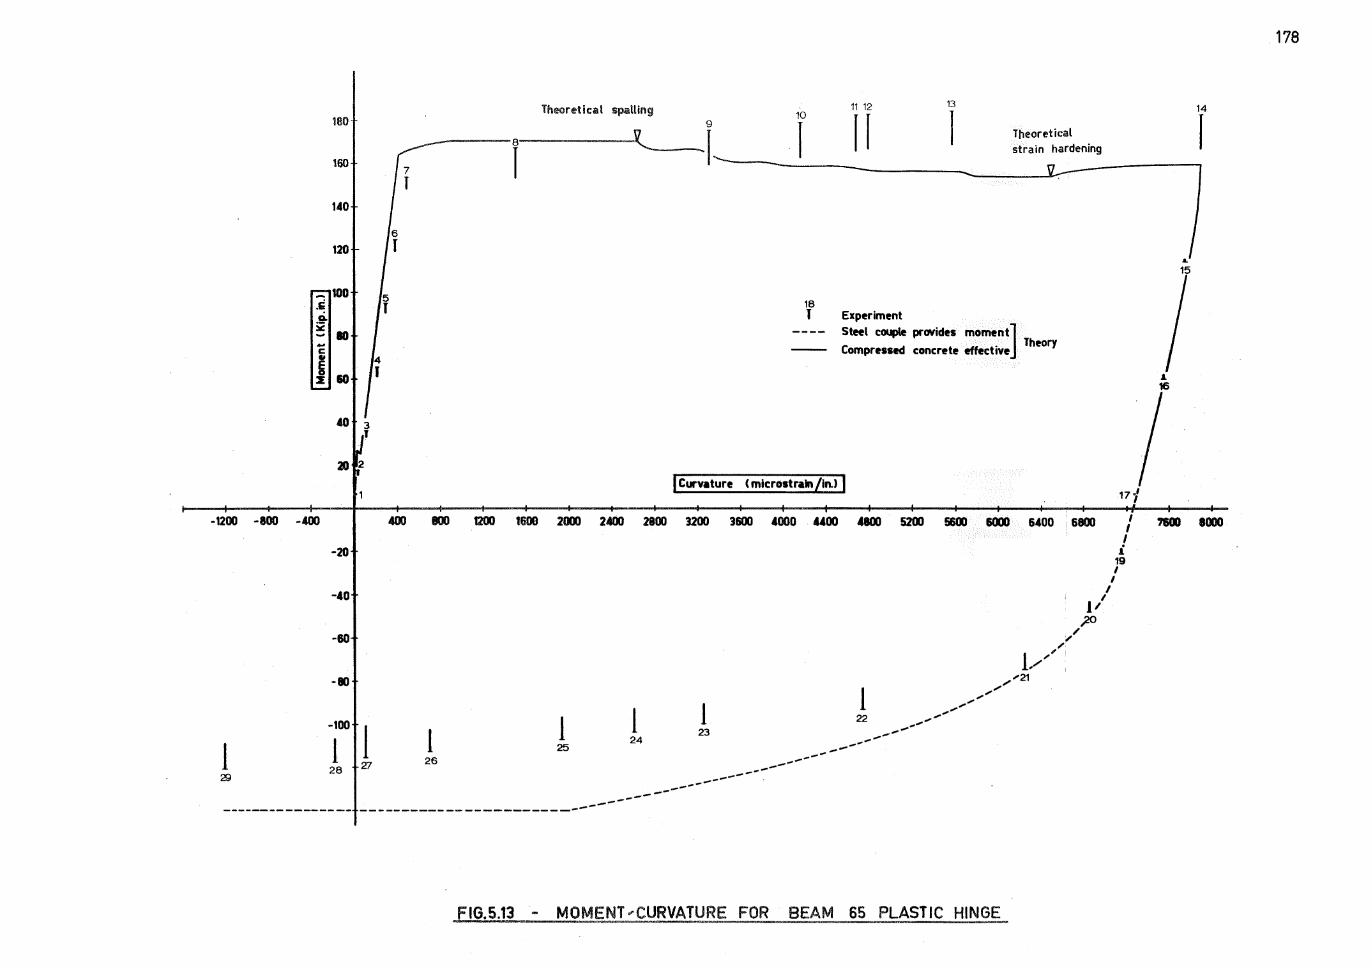
180·
160
140
120
- 100 .r; .9-lll::
80 -C
I IO :I:
40
20
-1200 -800 -400
-20
-40
-IO
-80
-100
l 1 28 29
8
l 6
l
5 J
4 J
2
400 800 1200 1608
l 1 'Z1 26
Theoretical spalling 11 12 13 10
l l l 9
l 'iJ -l Ttieoretical
' strain hardening
18 T Experiment
Steel couple provides moment] . Theory
Compressed concrete effective
I Curvature < microstraln /in.)]
2000 2400 2800 3200 3600 4400
l l 24
25
1 23 --------------------------
5200 5600
., .,., .,.,, ,, ...... --_ ... ----l
22
6000 6400
,, 1, ...........
.,,,, .,.,21
6800 I I I
i 19 I
I
/ ,,
I I 1,,
JlO
----------------------------
FIG.5.13 - MOMENT .-CURVATURE FOR BEAM 65 PLASTIC HINGE
178
14
r
... 15
8000
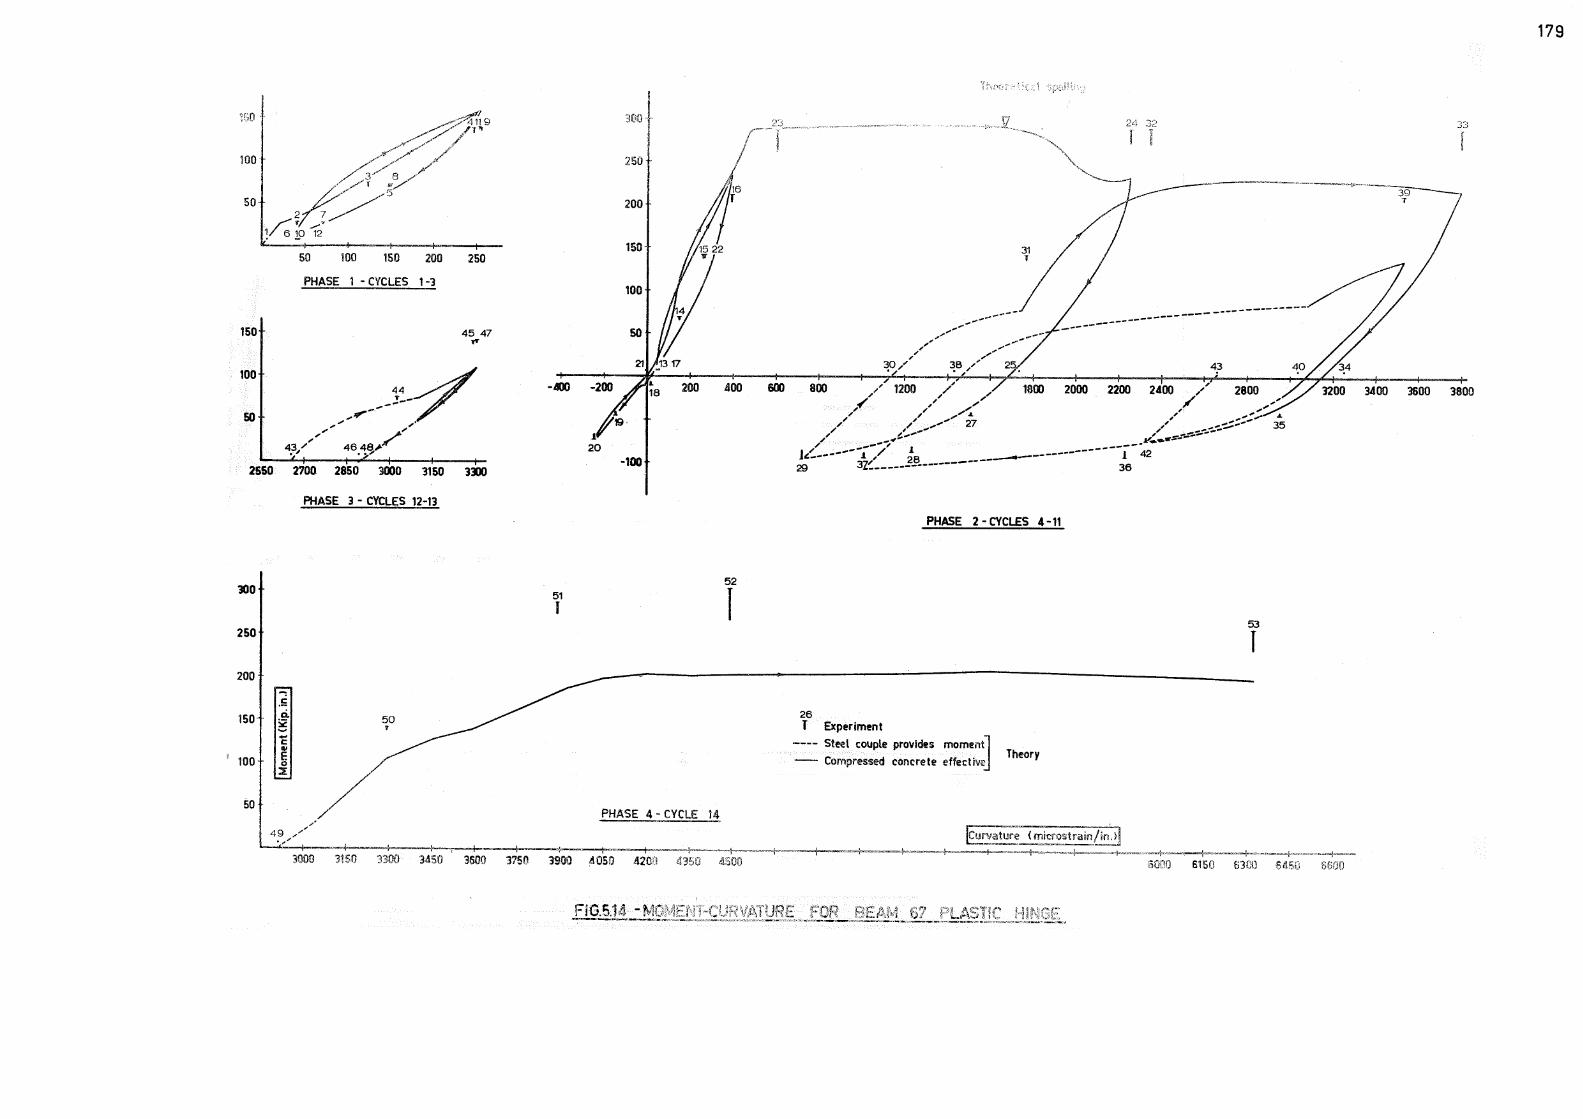
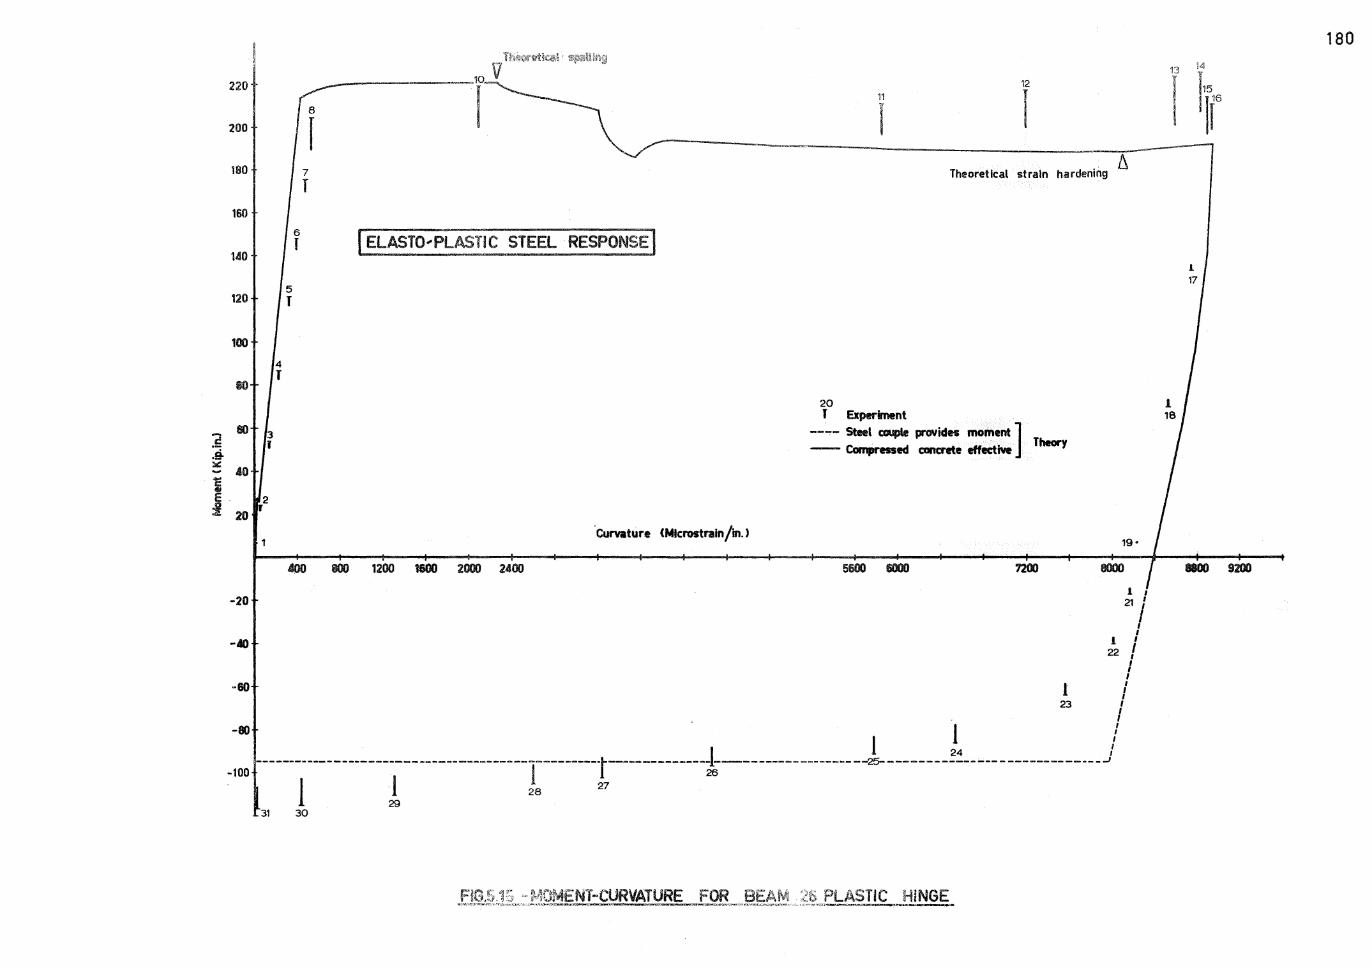
~ .9-:.::
i j
220
8
200 r 180 7
r 160
6
J 140
IELAsro,Pl:_A$l1c STEEL RESPONS~
5 120 l
100
4 T
00
80 3 i
40
2
20 ' Curvature <Mtcrostraln /in. >
,00 800 1200 1600 2000 2400
-20
-40
12
11
l I T . ~ heoretical strain hardening
20 J Experiment
---- Steel couple provides moment ] -- Compressed concrete effective
Theory
7200
l 23
19 •
1 , 21 1
I I l ,
22 / I
I I I
I I
I -80 l /
l l 24 I -------------------------------------------------- t-------------- ------------------ -25------------- --- - -------- ---- - ..J
~100 .1 l 26 l 29 28 27
31 30
l 17
180
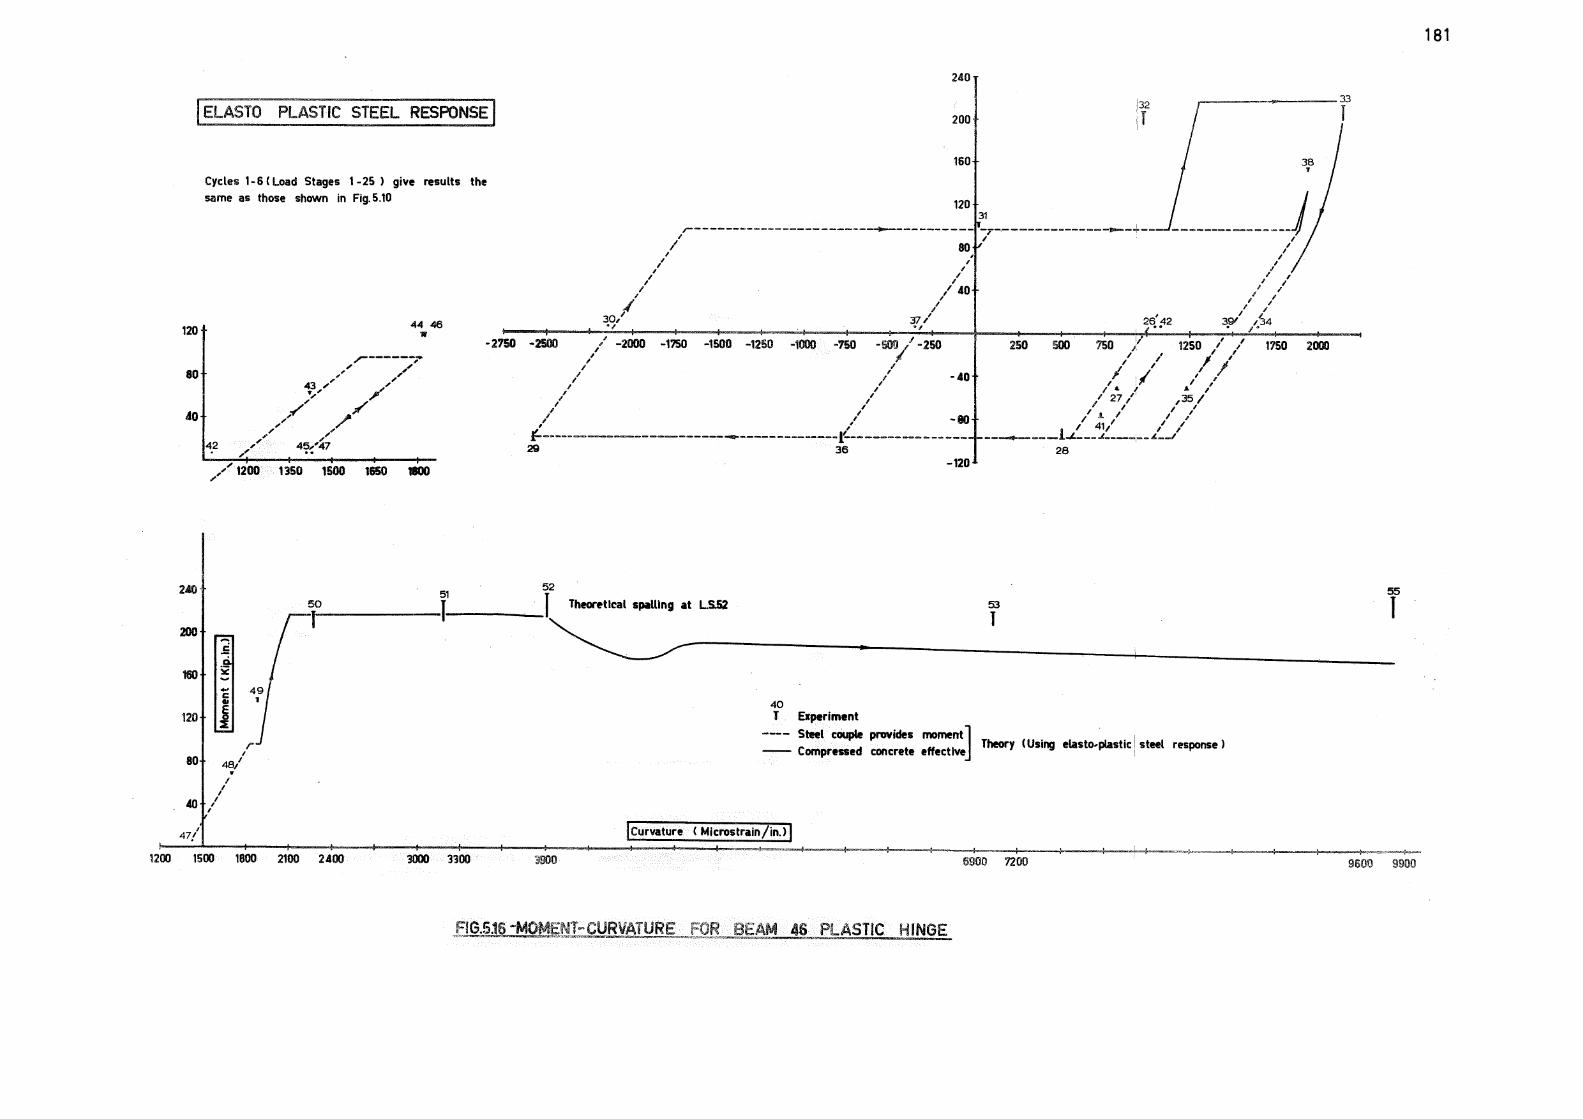
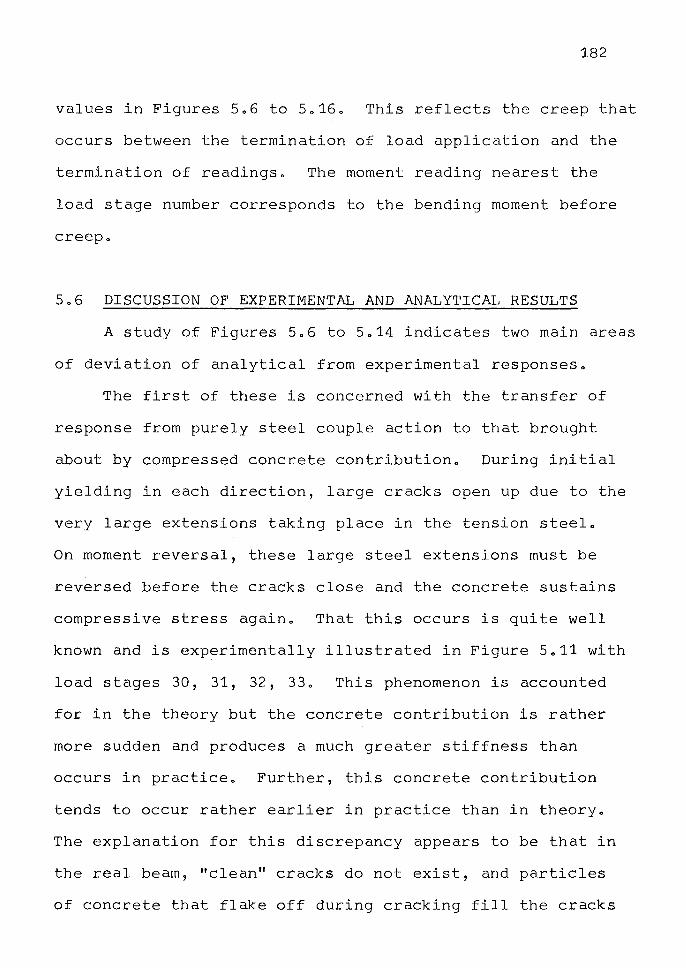
182
values in Figures 5.6 to 5.16. This reflects the creep that
occurs between the termination of load application and the
termination of readings. The moment reading nearest the
load stage number corresponds to the bending moment before
creep.
5.6 DISCUSSION OF EXPERIMENTAL AND ANALYTICAL RESULTS
A study of Figures 5.6 to 5.14 indicates two main areas
of deviation of analytical from experimental responses.
The first of these is concerned with the transfer of
response from purely steel couple action to that brought
about by compressed concrete contribution. During initial
yielding in each direction, large cracks open up due to the
very large extensions taking place in the tension steel.
On moment reversal, these large steel extensions must be
reversed before the cracks close and the concrete sustains
compressive stress again. That this occurs is quite well
known and is experimentally illustrated in Figure 5.11 with
load stages 30, 31, 32, 33. This phenomenon is accounted
for in the theory but the concrete contribution is rather
more sudden and produces a much greater stiffness than
occurs in practice. Further, this concrete contribution
tends to occur rather earlier in practice than in theory.
The explanation for this discrepancy appears to be that in
the real beam, "clean 11 cracks do not exist, and particles
of concrete that flake off during cracking fill the cracks
183
and so the cracks effectively close more quickly. Also,
because these particles do not comprise the full surface
area of the cracked section, their contribution to stiff
ness is initially rather less and so a more "gentle''
increase in stiffness than is represented by the theory
takes place.
The second deviation of theory from practice is
illustrated for Phase 4 of Beams 24, 27, 44, 46, 47 and 67.
This last loading phase is a downward push to failure.
Beams 27 and 46 show good agreement of theory and experi
ment for this phase but bending moment predictions for
Beams 24 and 44 are rather high while for Beams 47 and 67
the prediction is low. In the case of Beams 24 and 44,
both lightly reinforced with equal steel areas top and
bottom, the cause of this deviation is derived from the
limitation on the Bauschinger Effect expression described
in Section 3.9.1. In these beams, the tension steel is
highly strained and the theoretical stress corresponds to
ultimate stress. This is due to the fact that the
Ramberg-Osgood function it not assymptotic to a given
limiting stress, and for the parameters used for this steel,
the theoretical stress rises to an imposed limiting stress
(ultimate) at comparatively low strains.
The case for Beams 47 and 67 is rather different. In
these beams it is the inability to sustain additional
184
compression stress which results in the low bending moment
predictions. Both are comparatively poorly confined with
4" and 6'' stirrup spacing, and the concrete is highly
strained, and the neutral axis rather low. Therefore, in
theory, most of the unconfined concrete on the side of the
section is ineffective, and with a low core width to total
width ratio of 0.66, this unconfined concrete amounts to a
large proportioh of concrete area. With higher and more
realistic ratios of core width to total section width,
this discrepancy will become negligible.
The good agreement between theory and experiment
exhibited in Phase 4 of Beams 27 and 46 is probably a
result of the two effects described above cancelling each
other.
Other aspects of the theoretical and experimental
moment-curvature responses indicate very good agreement.
It is of interest to note the theoretical moment
curvatures produced by assuming elasto-plastic steel
response. Figures 5.15 and 5.16 illustrate two such
responses and may be compared with Figures 5.7 and 5.10
respectively. Because concrete stress plays such a minor
role in the cyclic behaviour of sections, the moment
curvature inter~relationship follows the steel behaviour
very closely. Consequently, an elasto-plastic steel gives
an elasto-plastic moment-curvature relationship when the
concrete is ineffective. The consequences of this
185
similarity are discussed more fully in Chapter 8.
5.7 COMPUTER PROGRAMS
Two computer programs were written for this section of
the work and listings appear in Appendix B.
Program 5.1 ("C)'."CBAUS"): Cyclic loading of reinforced con
crete T sections with or without axial compression, using
up to 500 discrete elements for concrete force, and using
the Bauschinger Effect representation for reinforcing steel
developed in Chapter 3.
Program 5.2 ("CYCBMS"): As for Program 5.1 but using an
elasto-plastic reinforcing steel response.
5.8 CONCLUSIONS
It has been shown that the theories for concrete and
steel behaviour developed in Chapters 2 and 3 can be applied
to cyclically-loaded reinforced concrete sections. Further,
that this application results in moment-curvature responses
that, with some exceptions, show good agreement with
experimentally-obtained behaviour. These exceptions are:
that the Ramberg-Osgood function for Bauschinger Effect
limits the absolute steel strains (considering the strain
at which stress was last zero as origin) for good theoretical
predictions; and that the assumption of a limiting concrete
strain above which the concrete is considered to be
186
ineffective requires the ratio of bound concrete width to
total section width 1 to be reasonably high for low p'/p
ratios.
Figures 5.15 and 5.16 comparing experimental moment
curvature responses with theory using an elasto-plastic
reinforcing steel stress-strain relationship, illustrate
the necessity for a consideration of the Bauschinger Effect.
The computer programs currently use curvature readings
as input for determining the point at which moment reversal
is to take place. This has proved the most successful
method of testing the analysis against the available test
data. It may well be that in using the programs for
prediction of deformations, required energy-absorptions
would be a more useful input. The modifications to the
programs required to allow for this are very minor.
SUMMARY
CHAPTER 6
DEFLECTION ANALYSIS FOR REINFORCED
CONCRETE MEMBERS
187
The theory advanced in Chapter 5 is extended to
predict the deflection behaviour of reinforced concrete
members and is compared with experimental load-deflection
plotso Clough's idealised degrading stiffness model is
confirmed as a reasonable design approximation.
6.1 INTRODUCTION
Building on theory developed in earlier chapters,
the analysis has been extended beyond the consideration of
concrete sections to members composed of a number of such
sections. This chapter is concerned with deflection
profiles for a cyclically-loaded simple cantilever. Some
generality is obtained by considering a cantilever as half
of a simply-supported beam, such that the fixed end of the
cantilever coincides with the centre of the beam span.
A computer program is developed for the determination
of loads and bending moments for given deflections.
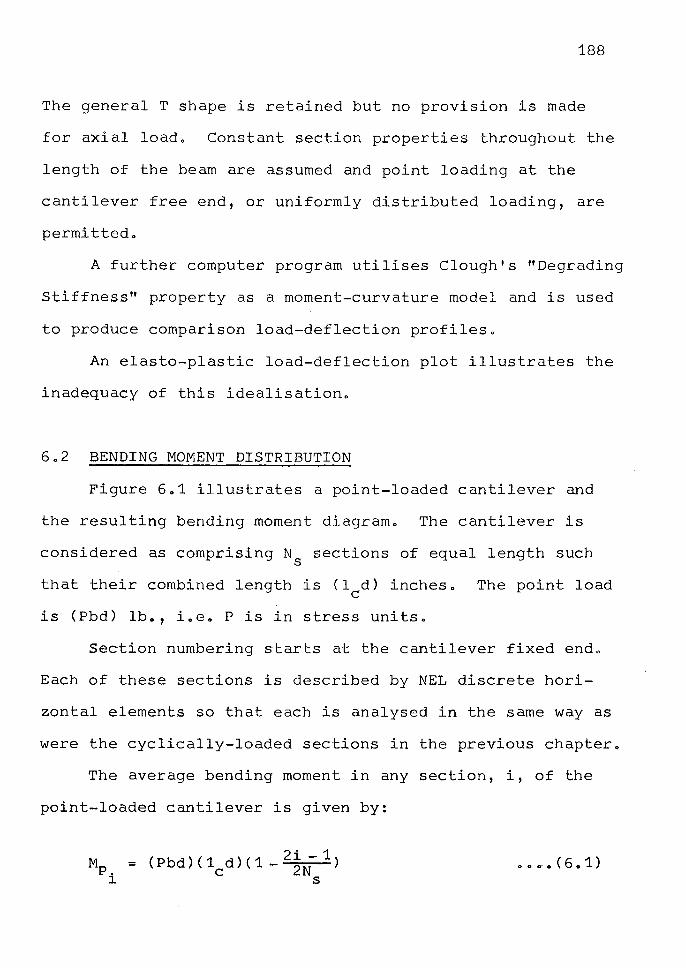
188
The general T shape is retained but no provision is made
for axial loado Constant section properties throughout the
length of the beam are assumed and point loading at the
cantilever free end, or uniformly distributed loading, are
permittedo
A further computer program utilises Clough's "Degrading
Stiffness" property as a moment-curvature model and is used
to produce comparison load-deflection profileso
An elasto-plastic load-deflection plot illustrates the
inadequacy of this idealisationo
602 BENDING MOMENT DISTRIBUTION
Figure 601 illustrates a point-loaded cantilever and
the resulting bending moment diagramo The cantilever is
considered as comprising N sections of equal length such s
that their combined length is (1 d) incheso The point load C
is (Pbd) lbo, ioeo Pis in stress unitso
Section numbering starts at the cantilever fixed endo
Each of these sections is described by NEL discrete hori
zontal elements so that each is analysed in the same way as
were the cyclically-loaded sections in the previous chaptero
The average bending moment in any section, i, of the
point-loaded cantilever is given by:
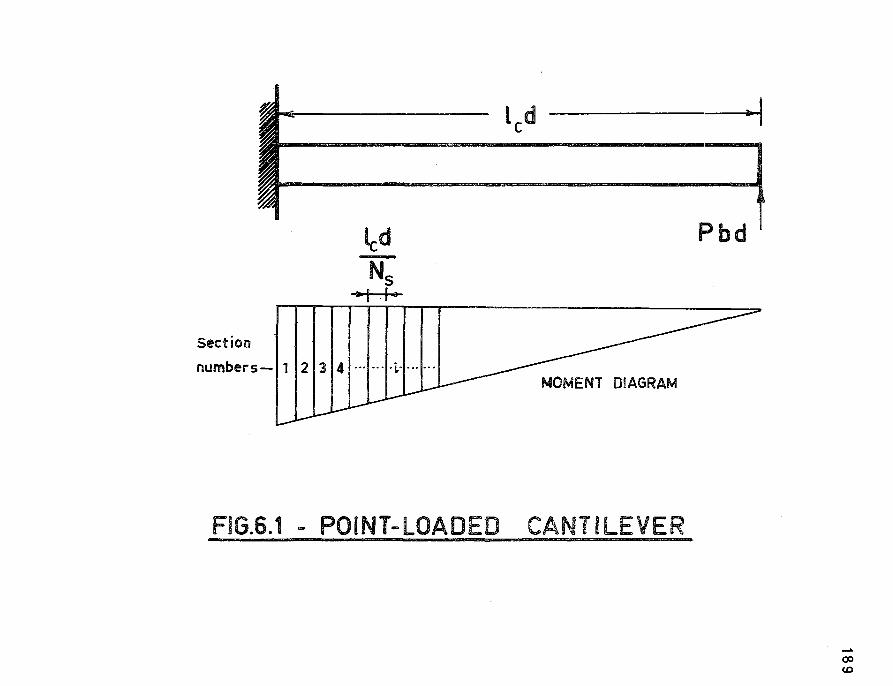
led -NS aa I . I .a
Section
numbers-I1I2I3I4I··-l-··H·•···•···
led
MOMENT DIAGRAM
FIG.6.1 - POINT-LOADED CANTILEVER
Pbd
.... a:, (,Q
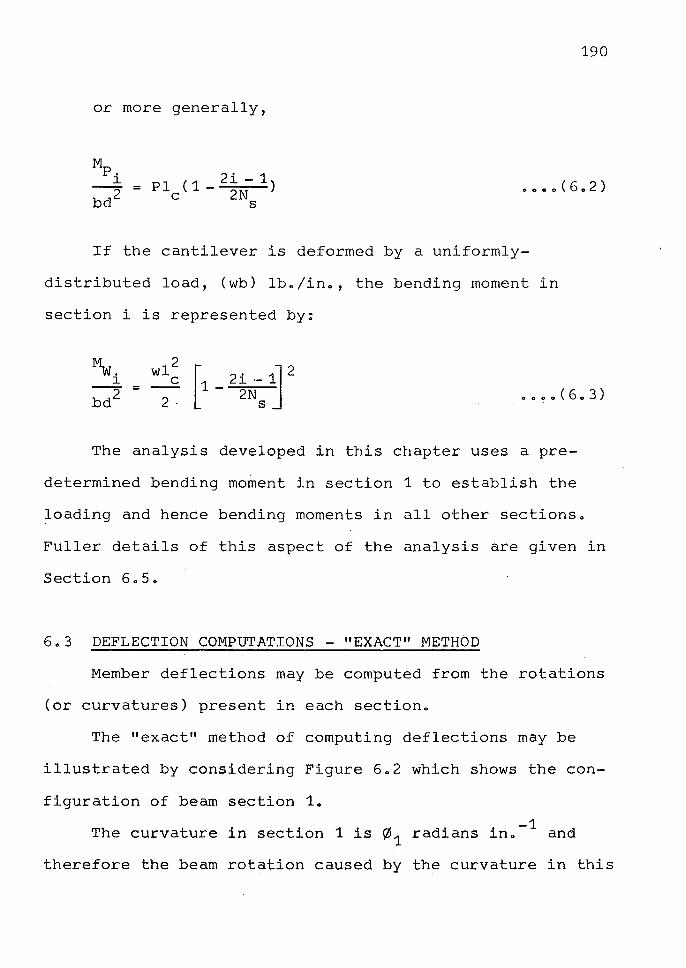
190
or more generally,
0 0 0 @ ( 6 0 2 )
If the cantilever is deformed by a uniformly
distributed load, (wb) lbo/ino, the bending moment in
section i is represented by:
The analysis developed in this chapter uses a pre
determined bending moment in section 1 to establish the
loading and hence bending moments in all other sectionso
Fuller details of this aspect of the analysis are given in
Section 605.
6.3 DEFLECTION COMPUTATIONS - "EXACT" METHOD
Member deflections may be computed from the rotations
(or curvatures) present in each section.
The "exact" method of computing deflections may be
illustrated by considering Figure 6.2 which shows the con
figuration of beam section 1.
The curvature in section 1 is ~ 1 radians in.-1 and
therefore the beam rotation caused by the curvature in this
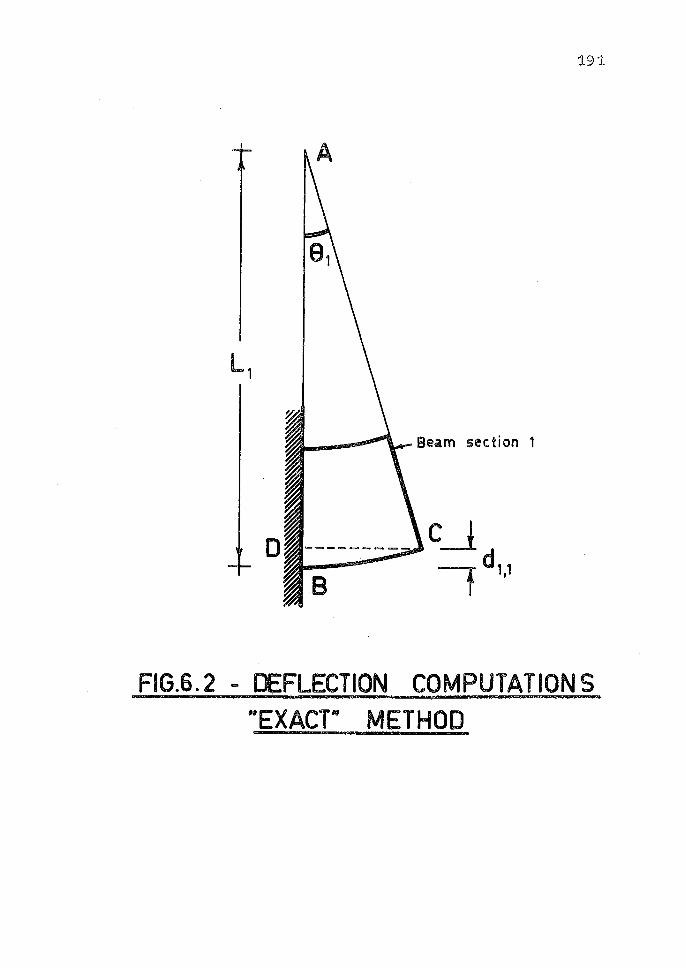
A
L,
D c_J 7d,,,
191
FIG.6.2 .. DEFLECTION COMPUTATIONS "EXACT" METHOD
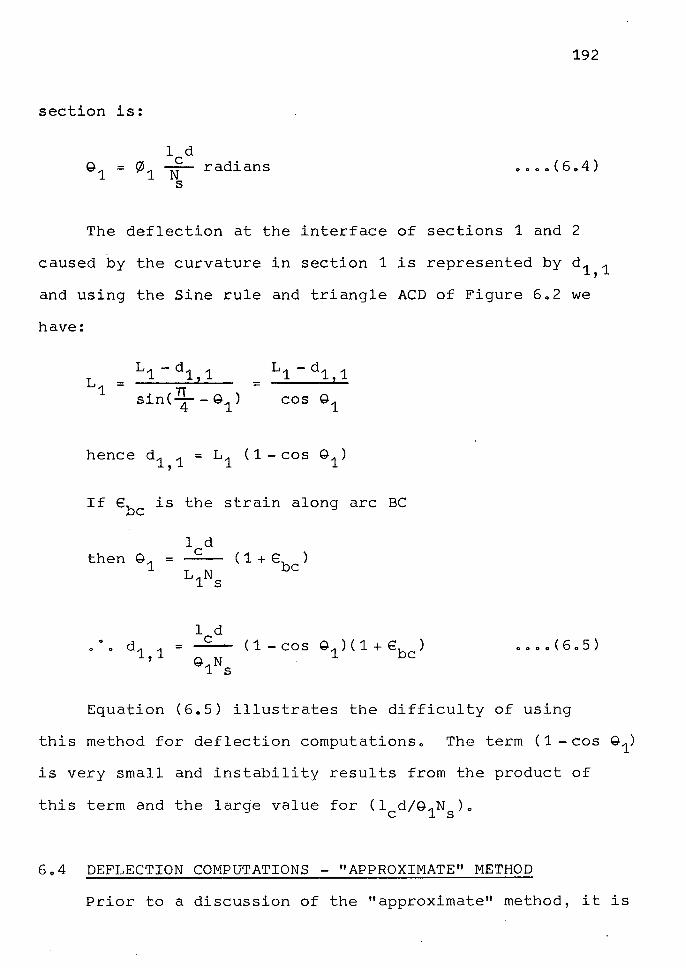
section is:
G1 1 d
C = ~ 1 N radians
s
192
The deflection at the interface of sections 1 and 2
caused by the curvature in section 1 is represented by d 1 1 '
and using the Sine rule and triangle ACD of Figure 6.2 we
have:
= L1 -d1,1
sin(1L-G) 4 1
hence d1 1 = L1 ( 1 - cos G1 )
' If €be is the strain along
1 d then G1
C ( 1 +€be) =
L1Ns
arc BC
• • • • ( 6 • 5 )
Equation (6.5) illustrates the difficulty of using
this method for deflection computations. The term ( 1 - cos G1)
is very small and instability results from the product of
this term and the large value for (1 d/G1N ). C S
6.4 DEFLECTION COMPUTATIONS - "APPROXIMATE" METHOD
Prior to a discussion of the "approximate" method, it is
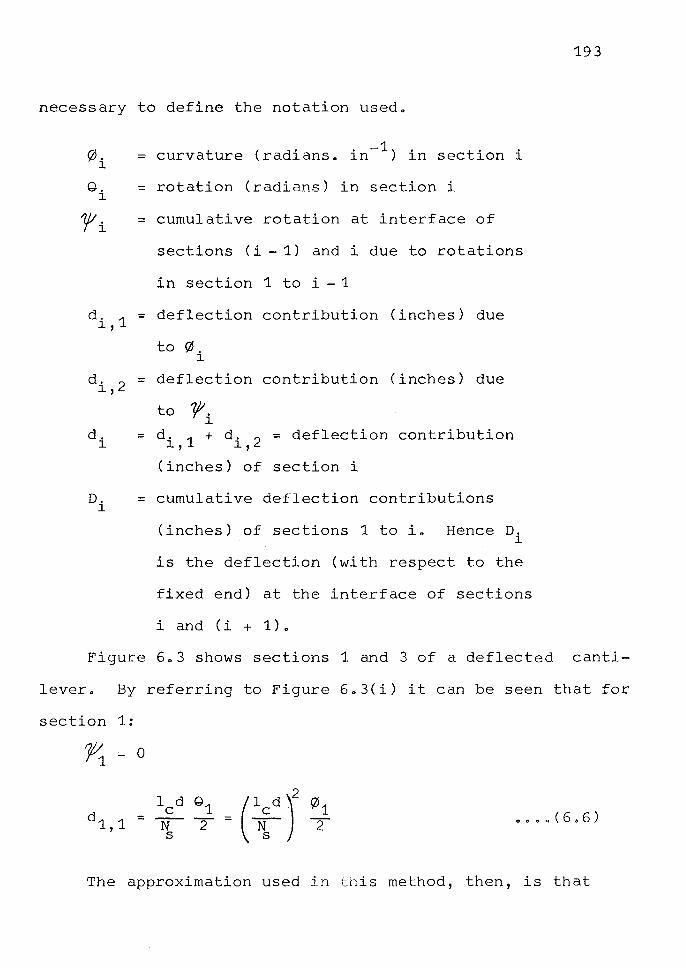
necessary to define the notation usedo
~- curvature ( radians o . -1) in section i = in l
G. = rotation (radians) in section i l
ri = cumulative rotation at interface of
sections ( i - 1) and i due to rotations
in section 1 to i-1
d. 1 = deflection contribution (inches) due l'
to 0. l
d. 2 = deflection 1,
contribution (inches) due
to Y. l
d. = d. 1 + d. 2 = deflection contribution l 1, l,
(inches) of section i
D. = cumulative deflection contributions l
(inches) of sections 1 to io Hence Di
is the deflection (with respect to the
fixed end) at the interface of sections
i and ( i + 1) o
193
Figure 603 shows sections 1 and 3 of a deflected canti
levero By referring to Figure 6o3(i) it can be seen that for
section 1:
0 0 0 • ( 6 • 6 )
The approximation used in this method, then, is that
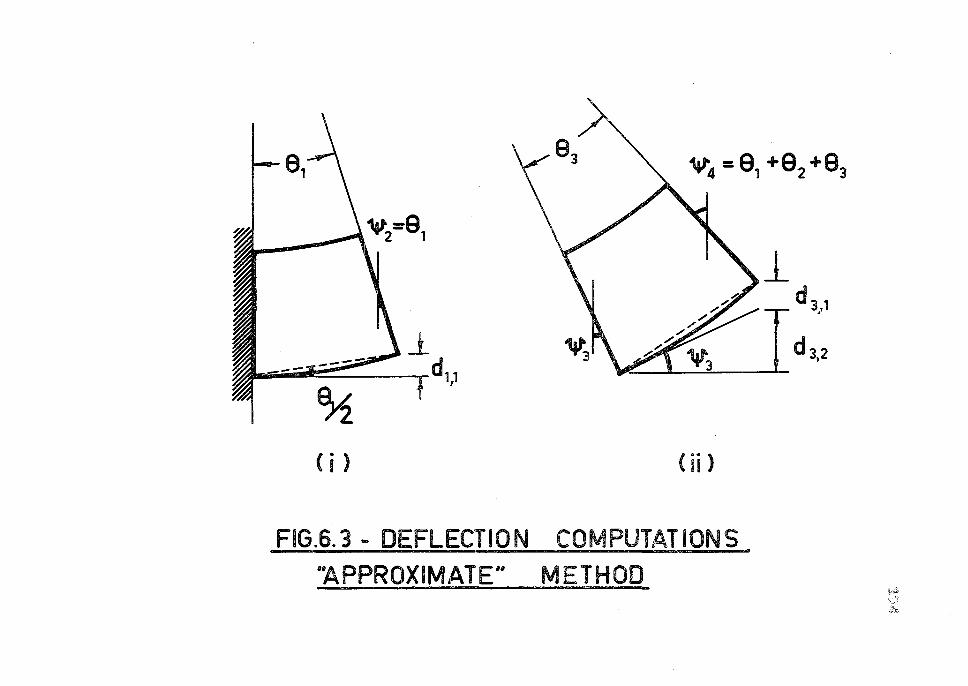
M
CD ....
+
N
M"
, .. ,-N
"'C
"'C
(])
~
+ ....
(])
II U
l
~
-z
·-0
·- ......, ~
....,: • ::, a..
0 ~
:I: 0
1--
u w
~
z 0 .. ..
1--lJJ
u 1--
...... LLJ
<(
... "'O
....J ~
--, LL
X
w
• 0 a::
8 a..
-("I'\
a.. ....
. !.t
......, C
D . ..
(!) ...... LL
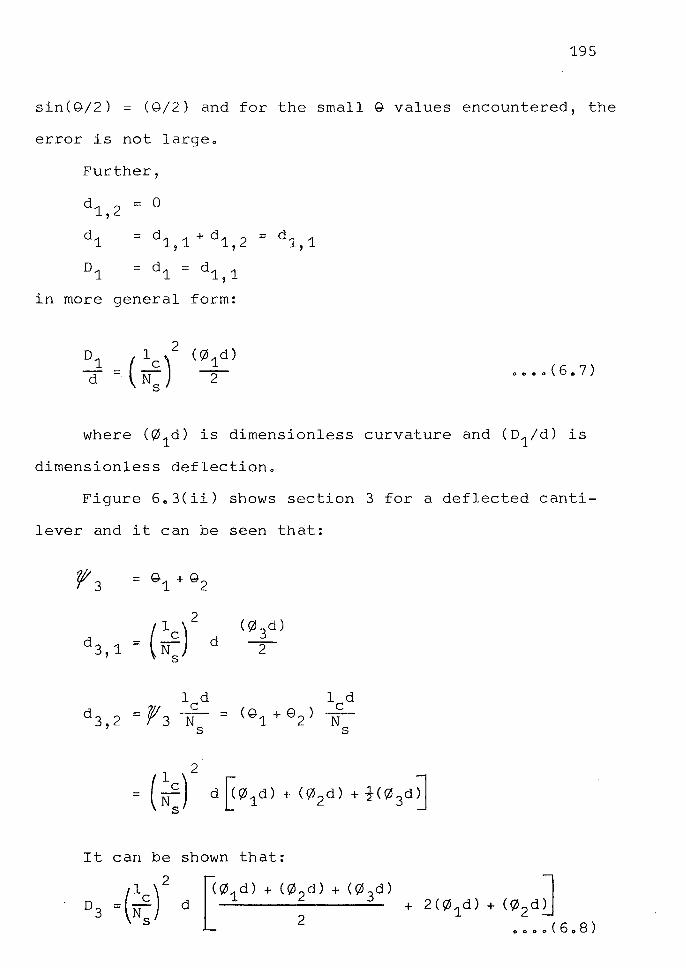
195
sin(G/2) = (G/2) and for the small G values encountered, the
error is not largeo
Further,
d1 2 = 0
' d1 = d1 1 + d1 2 = d1 1
' ' ' D1 = d1 = d1 1
' in more general form:
D1 1 2
(\;\d) = ( N c) 0 0 0 0 ( 6 0 7 )
d -2-s
where (0 1d) is dimensionless curvature and (D1 /d) is
dimensionless deflectiono
Figure 6o3(ii) shows section 3 for a deflected canti
lever and it can be seen that:
1 2
d3,1 = (N:) d
It can be shown that:
+ 2(!1l 1 d) + (\,l 2 ctJ 0000(608)
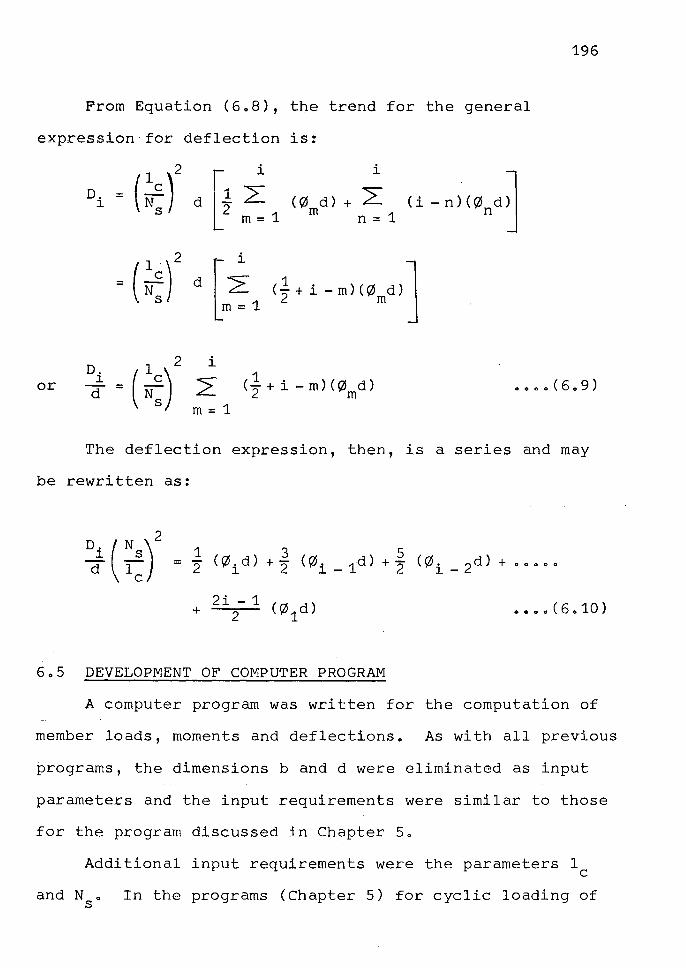
196
From Equation (6.8), the trend for the general
expression for deflection is:
1 )2
Di = ( N: d [
-1 ~ 2
m=1
i
or 2 m = 1
i
({tj d) + ~ m n = 1
• • 0 0 ( 6 0 9 )
The deflection expression, then, is a series and may
be rewritten as:
DI ( ::)2
1 ({tjid)
3 (0i-1d)
5 (0i-2d)+ = 2 +- +- 0 0 Q O 0 2 2
2i - 1 (01
d) 0 .. 0 0 ( 6 0 10) + 2
6.5 DEVELOPMENT OF COMPUTER PROGRAM
A computer program was written for the computation of
member loads, moments and deflectionso As with all previous
programs, the dimensions band d were eliminated as input
parameters and the input requirements were similar to those
for the program discussed in Chapter 5.
Additional input requirements were the parameters 1 C
and N. In the programs (Chapter 5) for cyclic loading of s
197
sections computed within stipulated curvature cycles, the
dimensionless curvature values corresponding to the extrem
ities of each cycle were requiredo In this program, the
method was similar although deflection cycles were being
considered, and therefore dimensionless deflection readings
were required as input to define the extremities of cycleso
Finally, a code number indicating either point or uniform
loading is requiredo
The cantilever sign convention used is compression
strain, upward deflection and upward loading positive.
This convention is not that generally used for cantilevers,
but was the most convenient for comparison with beam experi
mentso For such an application, the theoretical load
corresponds to the end reaction of a simply-supported beamo
Iterations within deflection cycles were performed by
increasing or decreasing the concrete strain in the top
concrete element,€ , of section 1, depending on whether cm
it was desired to increase or decrease the deflection of the
~beamo Using the same iterative technique as that discussed
in Sectiori So4, the neutral axis depth, bending moment and
curvature were evaluated for section 1o Using either
Equation (601) or Equation (603), the loading producing this
bending moment in section 1 could be established and hence
the bending moments in the remaining sections determined.
The procedure for each of these remaining sections was
to increase or decrease the €cm value obtained for that
198
section in the previous increment, locate the neutral axis
depth from force compatibility, and then compute the bend
ing moment in the section for the given trial value of E o cm
The computed bending moment was then compared with that
required and E adjusted, and the iteration repeated, cm
until the computed and required bending moments coincided
to within 1 per cent of the required momento If computed
moments were not within this limit after twenty trial
values for E , the€ value giving the least bending cm cm
moment error for that section was selectedo In this way,
bending moments and curvatures for all sections were
calculatedo
Having obtained curvatures for all sections, the
deflection profile was calculated using Equation (609) and
the computed deflection at the free end of the cantilever
was then compared with the input value limiting the
deflection in the cycle under considerationo This process
continued until the computed deflection was found to exceed
the input value for the cycle, when an assumed linear
relation between E for section 1 and the deflection in cm
the previous cycle, and€ for section 1 and the defleccm
tion in the c~rrent cycle, was used to give a value for G
in section 1, that would produce a cantilever free-end
cm
deflection that coincided with the input requirementso In
most cases this linear assumption was found to be
199
satisfactory, though not as accurate as when applied to
moment-curvature behaviour (q.v. Section 5.4).
6.6 COMPARISON OF THEORY WITH EXPERIMENT
The experimental load-deflection plots for two beams
were used to test the validity of the theory developed in
this chapter. The measured deflection readings at beam
midspan were corrected to "Equivalent Central Deflections"
and this step is discussed fully in Chapter 7.
Figures 6.4 and 6.5 illustrate the experimental and
theoretical load-central deflection plots for Beams 24 and
46 respectively.
Prior to a discussion of theoretical and experimental
comparisons, it is of interest to note one aspect of the
theoretical behaviour. The load-deflection response of
the beam is greatly influenced by the moment-curvature
behaviour at the critical section (c.f. Figures 5.6 and
5.10). Although it is obvious that this must be the case,
the actual extent of this influence is very marked. This
effect is probably accentuated by the fact that each beam
shank (cantilever) was comprised of only 9 sections, and
each section of only 10 discrete horizontal elements, owing
to limitations in the core store of the computer at the
time. The errors induced by having only 10 elements per
section would be of the order of 10 per cent at most, but
it is difficult to assess the effect that the number of
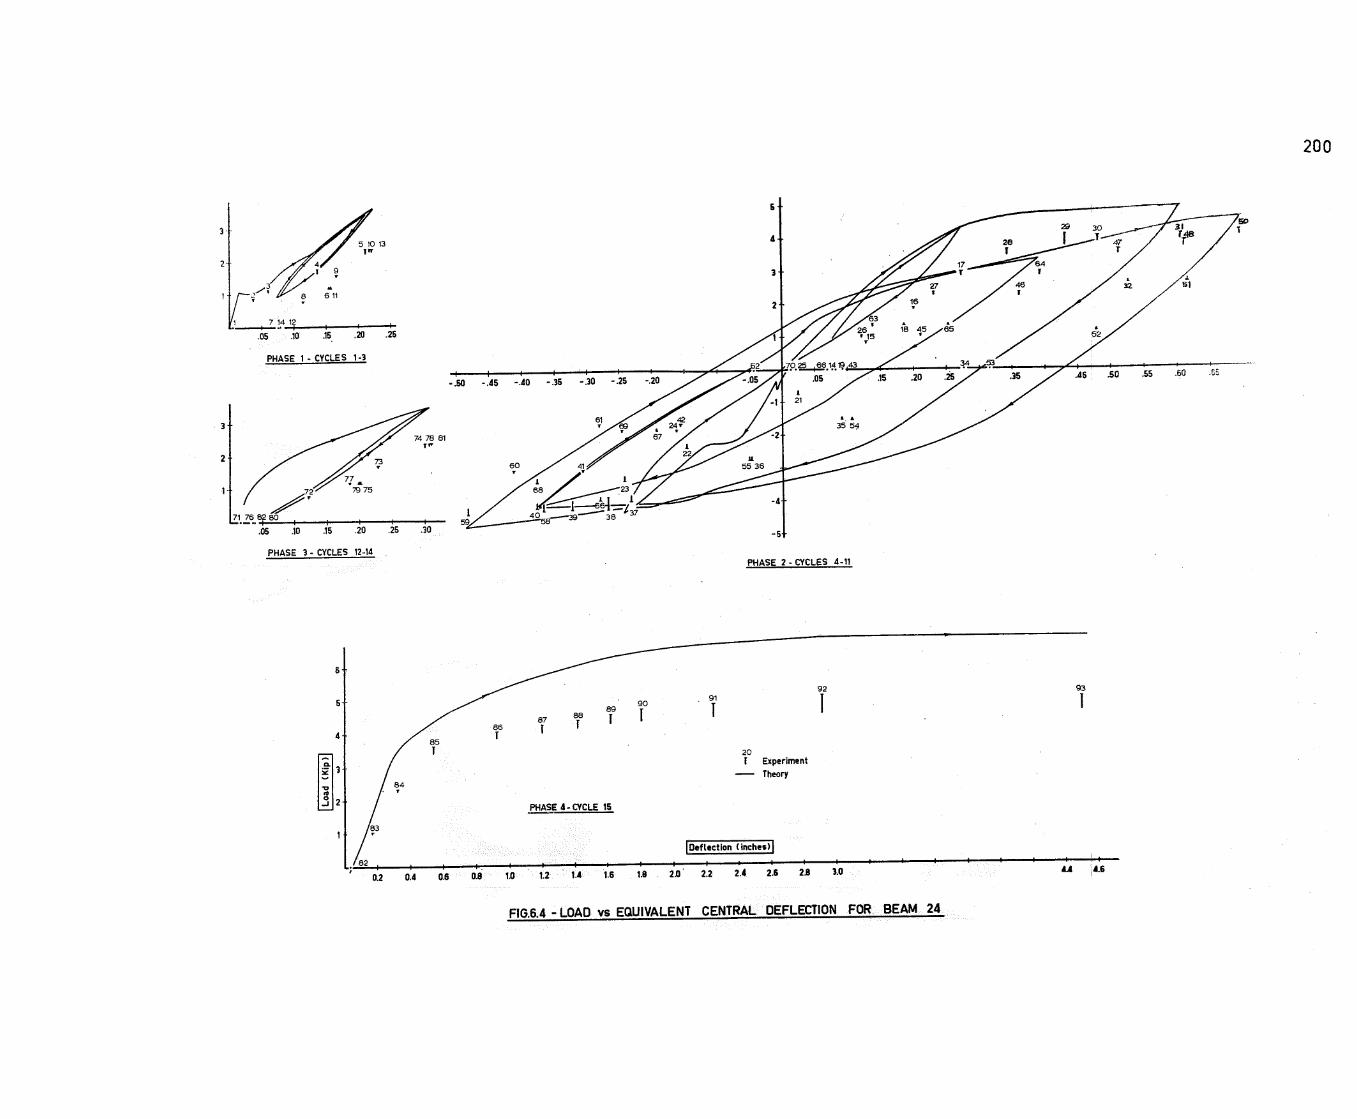
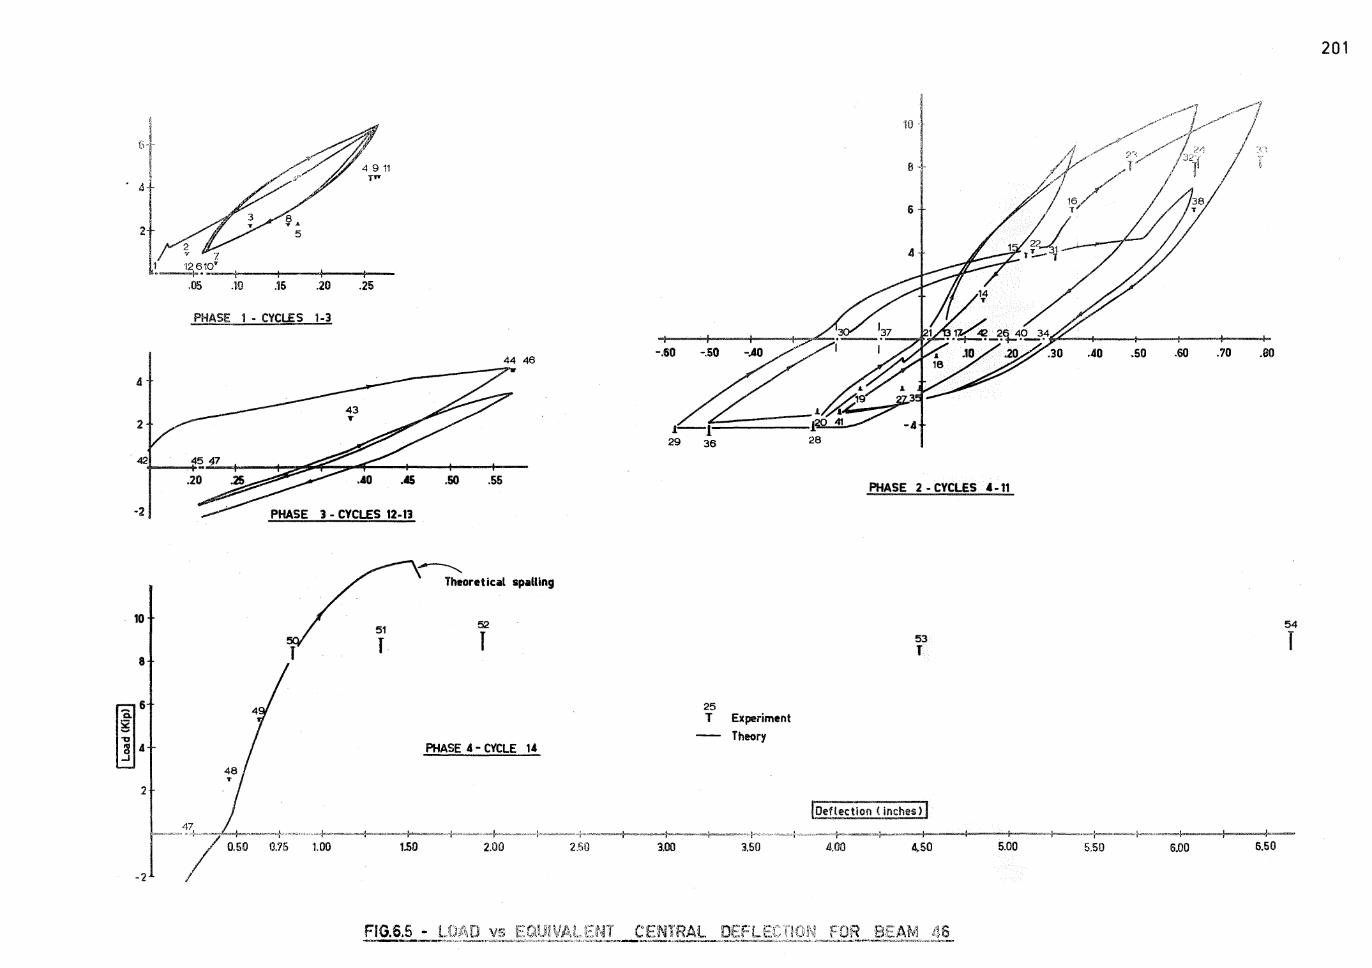
hJ
d
2 5
PHASE 1 - CYCLES 1-3
44 46
42 ..... _,.4~..:4;;.,7-+--~~ ..... ~::P""""fo---+--+----+-
-2
10
8
~6
~4
2
.20 .45 .50 .55
PHASE 3 - CYCLES 12-13
PHASE 4 - CYCLE 14
25 T Experiment
Theory
PHASE 2 - CYCLES 4-11
53 T
l•eflection ( inches) I
54
l
_,I -~-t-,,·-·--------......;.-~..;.=----- -·l«-~~--~-~---+----+--+----+--~-~+..' --l---...+----+--
2.50 3.00 3.50 4.00 4,.50 5.00 5.50 6.00 6.50
201
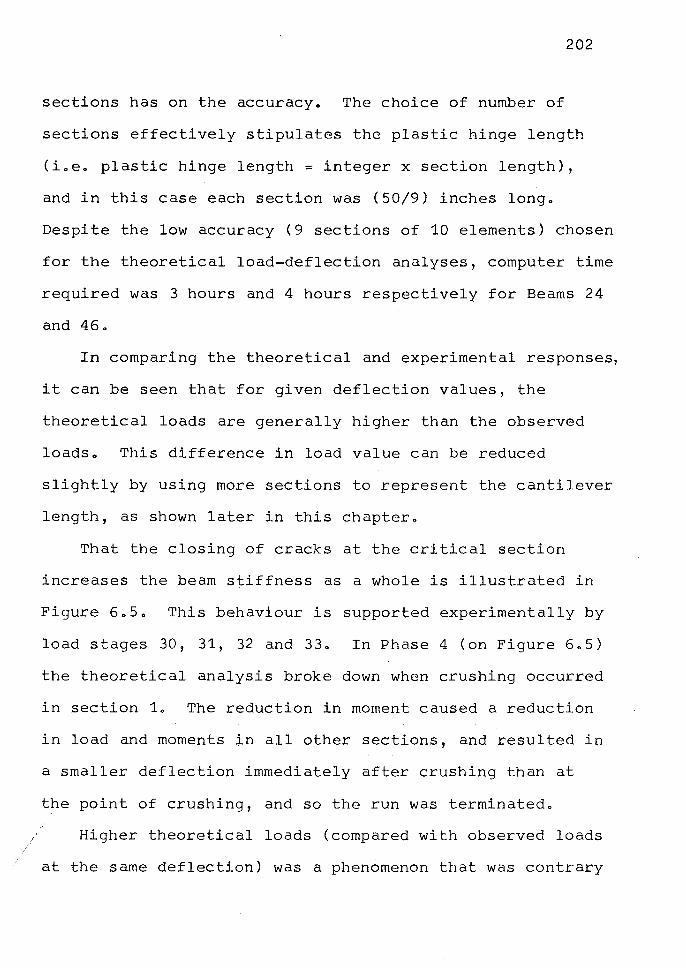
202
sections has on the accuracyo The choice of number of
sections effectively stipulates the plastic hinge length
(ioeo plastic hinge length= integer x section length),
and in this case each section was (50/9) inches longo
Despite the low accuracy (9 sections of 10 elements) chosen
for the theoretical load-deflection analyses, computer time
required was 3 hours and 4 hours respectively for Beams 24
and 460
In comparing the theoretical and experimental responses,
it can be seen that for given deflection values, the
theoretical loads are generally higher than the observed
loadso This difference in load value can be reduced
slightly by using more sections to represent the cantilever
length, as shown later in this chapter.
That the closing of cracks at the critical section
increases the beam stiffness as a whole is illustrated in
Figure 605. This behaviour is supported experimentally by
load stages 30, 31, 32 and 33. In Phase 4 (on Figure 605)
the theoretical analysis broke down when crushing occurred
in section 1. The reduction in moment caused a reduction
in load and moments in all other sections, and resulted in
a smaller deflection immediately after crushing than at
the point of crushing, and so the run was terminated.
Higher theoretical loads (compared with observed loads
at the same deflection) was a phenomenon that was contrary
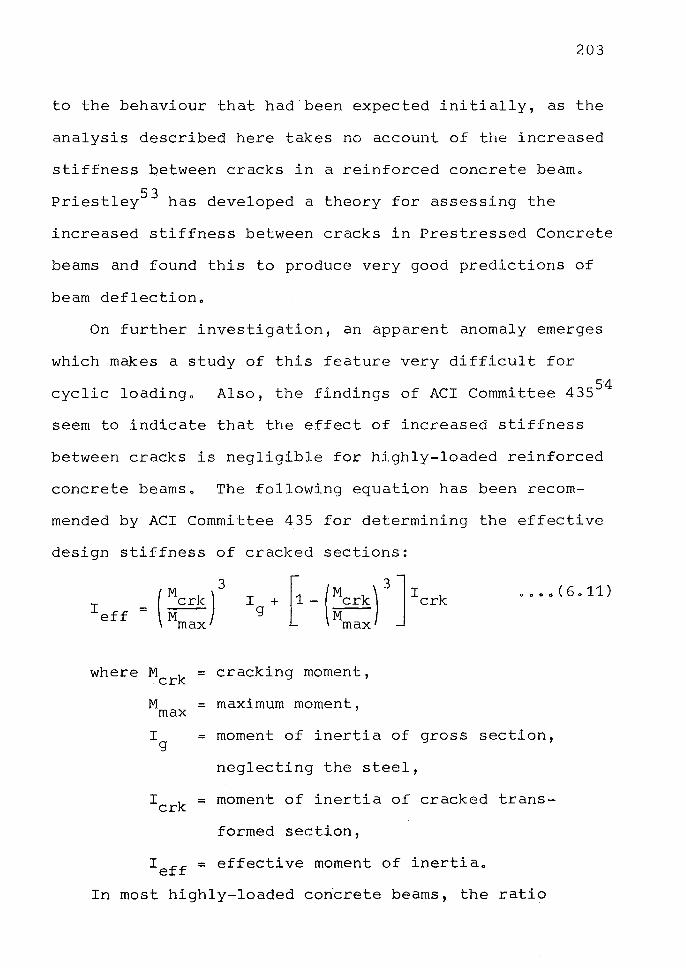
203
to the behaviour that had been expected initially, as the
analysis described here takes no account of the increased
stiffness petween cracks in a reinforced concrete beamo
53 Priestley has developed a theory for assessing the
increased stiffness between cracks in Prestressed Concrete
beams and found this to produce very good predictions of
beam deflectiono
On further investigation, an apparent anomaly emerges
which makes a study of this feature very difficult for
54 cyclic loadingo Also, the findings of ACI Committee 435
seem to indicate that the effect of increased stiffness
between cracks is negligible for highly-loaded reinforced
concrete beamso The following equation has been recom
mended by ACI Committee 435 for determining the effective
design stiffness of cracked sections:
0 0 0 0 ( 6 0 11)
where Merk= cracking moment,
M = maximum moment, max
I = moment of inertia of gross section, g
neglecting the steel,
Icrk = moment of inertia of cracked trans
formed section,
Ieff = effective moment of inertia.
In most highly-loaded concrete beams, the ratio
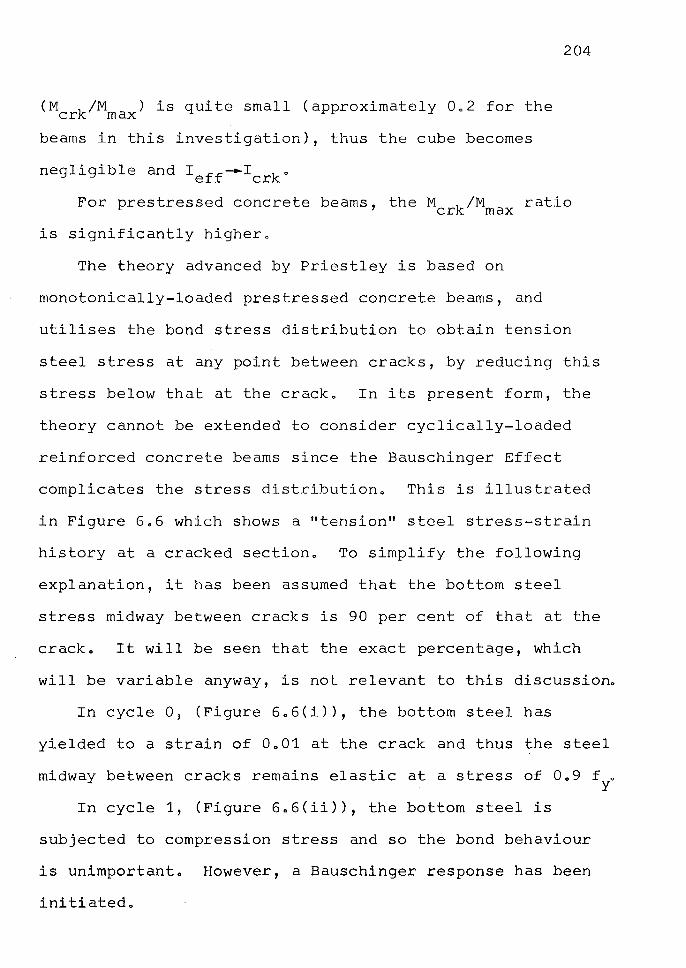
(M k/M ) is quite small (approximately Oo2 for the er max
beams in this investigation), thus the cube becomes
negligible and Ieff-Icrk 0
204
For prestressed concrete beams, the M k/M ratio er max
is significantly highero
The theory advanced by Priestley is based on
monotonically-loaded prestressed concrete beams, and
utilises the bond stress distribution to obtain tension
steel stress at any point between cracks, by reducing this
stress below that at the cracko In its present form, the
theory cannot be extended to consider cyclically-loaded
reinforced concrete beams since the Bauschinger Effect
complicates the stress distributiono This is illustrated
in Figure 606 which shows a "tension" steel stress-strain
history at a cracked sectiono To simplify the following
explanation, it has been assumed that the bottom steel
stress midway between cracks is 90 per cent of that at the
cracko It will be seen that the exact percentage, which
will be variable anyway, is not relevant to this discussiono
In cycle O, (Figure 6o6(i)), the bottom steel has
yielded to a strain of OoO1 at the crack and thus the steel
midway between cracks remains elastic at a stress of Oo9 f o y
In cycle 1, (Figure 6o6(ii)), the bottom steel is
subjected to compression stress and so the bond behaviour
is unimportanto However, a Bauschinger response has been
ini tiatedo
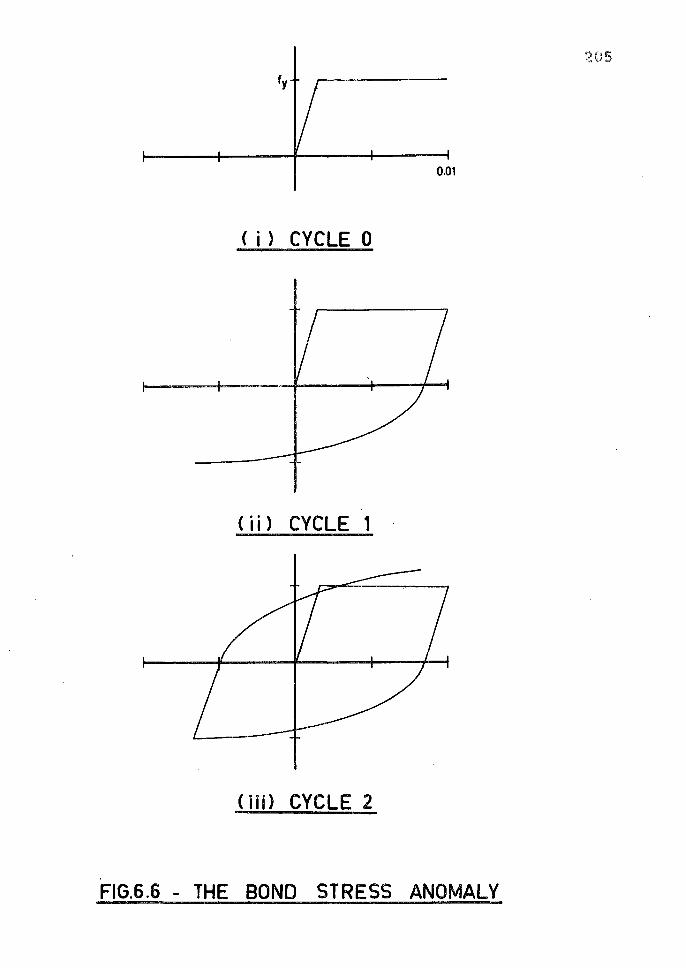
'.205
fy
Q.O,
C i ) CYCLE 0
Ci i) CYCLE 1
C iii) CYCLE 2
FIG.6.6 - THE BOND STRESS ANOMALY
206
In the final cycle shown (Figure 6o6(iii)), the bottom
steel stress at the crack has risen to 1o20 f at a tension y
strain of 0.0080 The assumed 10 per cent stress reduction
for steel between cracks requires a stress of 1o08 f. y
Therefore this section of the steel, which has remained
elastic up until this point, is strain hardening at a strain
of the order of three times that at the cracko This is
clearly impossible.
An event has been excluded from the discussion of cycle
1 which explains why this anomaly is only ''apparent"o In
cycle 0, the concrete at the bottom of the beam will cracko
In cycle 1, the concrete .at the top of the beam will crack
and a fully-cracked section develops. Therefore, whether
or not bond stress is effective in increasing stiffness is
irrelevant, as the beam now becomes sections of concrete
joined with reinforcing steelo
As with moment-curvature behaviour then, the main
benefit derived from the concrete after cyclic loading, is
that it prevents steel from buckling and maintains the
lever arm. Further, it would appear that resistance to
shear must rely almost entirely on dowel action, and per
haps to a lesser and irregular extent, on aggregate inter
locko
607 LOAD-DEFLECTION RESPONSES USING IDEALISED MOMENT
CURVATURE MODELS
207
The view that Moment-Curvature responses are difficult
to idealise accurately has already been expressedo It is
obvious, however, that some simplification is necessary as
considerable computer time is required to produce load
deflection plots using the theory developed in this thesiso
As Clough's "Degrading Stiffness" approximation is
intuitively better than the elasto-plastic assumption, and
has been shown in Chapter 5 to be more accurate, it was
decided to apply this property (in the form of a moment
curvature response) to a cantilever subjected to point
loadingo
A computer program (Program 602) was written for this
purpose and provision was made for differing initial (and
unloading) stiffnesses for both positive and negative
momentso
The experimental deflection cycles of Beam 24 were
used as data to test this idealisation and analyses were
performed with 10 and 100 beams sectionso The results are
shown in Figure 6070
It will be appreciated that since the bending moment
in section 1 must be greater than that in all other
sections, then all other sections must remain elastico
This results in a theoretical load-deflection plot that is
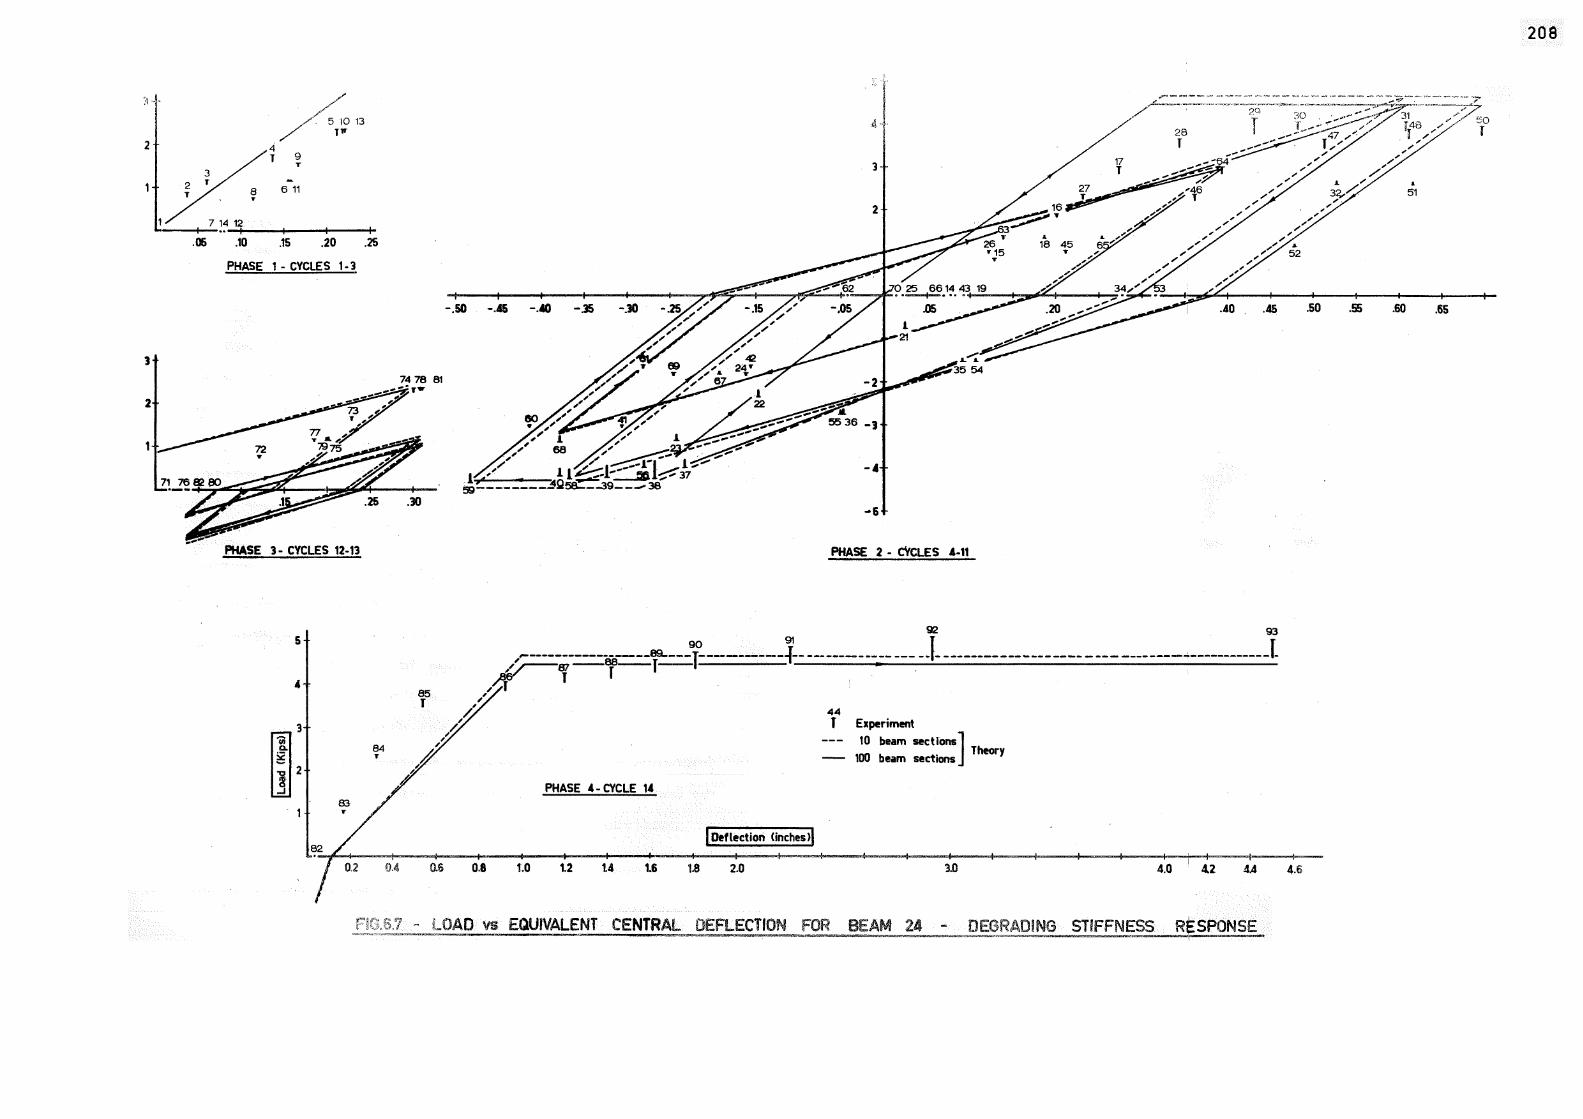
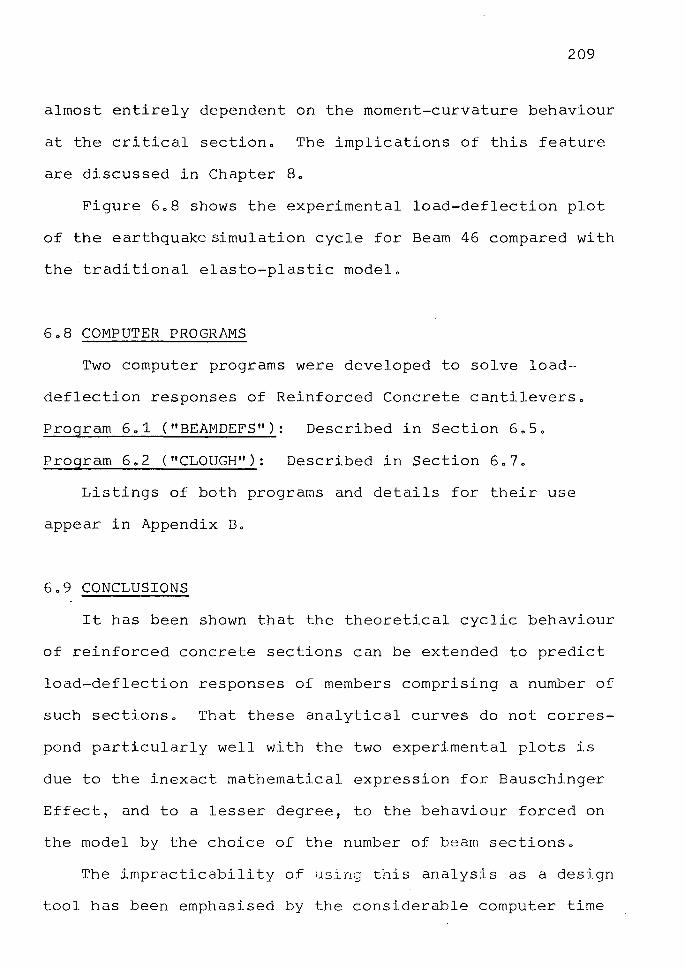
209
almost entirely dependent on the moment-curvature behaviour
at the critical section. The implications of this feature
are discussed in Chapter 8.
Figure 6.8 shows th€ experimental load-deflection plot
of the earthquake simulation cycle for Beam 46 compared with
the traditional elasto-plastic model.
6.8 COMPUTER PROGRAMS
Two computer programs were developed to solve load
deflection responses of Reinforced Concrete cantilevers.
Program 6.1 ("BEAMDEFS"): Described in Section 6.5.
Program 6.2 ("CLOUGH"): Described in Section 6.7.
Listings of both programs and details for their use
appear in Appendix B.
6.9 CONCLUSIONS
It has been shown that the theoretical cyclic behaviour
of reinforced concrete sections can be extended to predict
load-deflection responses of members comprising a number of
such sections. That these analytical curves do not corres
pond particularly well with the two experimental plots is
due to the inexact mathematical expression for Bauschinger
Effect, and to a lesser degree, to the behaviour forced on
the model by the choice of the number of beam sections.
The impracticability of using this analysis as a design
tool has been emphasised by the considerable computer time
HJj
24 33 '/-··;,Tl/T /
Inches 'P-¥,i.--.......,1:..s.i,.----+---• -·--+----,--
-.60 .50 .so .70 .80
T Experiment
- Theory (Elasto--plastic)
2e
FfG.6.8 - LOAD vs EQUIVALENT CENTRAL DEFLECTION FOR BEAM 46
l\)
;..l. 0
211
required to obtain load-deflection profiles for e~en a
simple cantilever. However, given a more exact represent
ation of the Bauschinger Effect, the analysis could be
used to produce "exactn load-deflection profiles that
could be systematically idealised to give realistic load
deflection models for design purposes.
Clough's Degrading Stiffness model is generally
conservative both when applied as a moment-curvature and
as a load-deflection response.
Conversely, the elasto-plastic model has been shown to
predict considerably more energy absorption than is in
fact available.
212
CHAPTER 7
EXPERIMENTAL RESULTS FROM REINFORCED
CONCRETE BEAMS
SUMMARY
Eleven reinforced concrete beams were tested to obtain
experimental comparison with the theories developed in this
thesiso Of particular significance was the moment
curvature responses of the plastic hinges and load
deflection behaviour of these beams, which have been
compared with theory in previous chapters. This chapter
discusses the aims, limitations and results of this experi
mental programme, and also compares the measured lengths of
plastic hinges with some design expressions proposed by
other investigatorso
7.1 INTRODUCTION
The tests on beams described in this thesis were
conducted with the aim of comparing the results so obtained
with the theories of the previous chapters.
A large number of readings and measurements were taken
to ensure that all aspects of behaviour could be studied.
The principal purpose of the experimental programme was
213
to obtain moment-curvature and load-deflection responses of
reinforced concrete beams to cyclic loading, and these
responses have been discussed fully in Chapters 5 and 60
Therefore this chapter deals only briefly with the deriv
ation of these responses and with the properties of the
beamso The effect of cyclic loading on plastic hinge
length is discussed by comparing two pairs of comparison
beams, and the design recommendations for plastic hinge
43 55 lengths proposed by Baker and Amarakone and by Corley ,
are compared with experimental evidenceo
Of the eleven beams tested, two will not be discussed
in this thesiso One of these was a pilot test and showed
the column stub as being poorly shaped for obtaining strain
readings adjacent to the column; ·insufficient readings
were recorded for the other.
A detailed description of the materials, equipment,
and testing procedure used in these experiments appears
in Appendix D.
7.2 RANGE OF VARIABLES STUDIED
Principal vaiables for this investigation were:
tension steel ratio, p; binding ratio, p", and effect of
rectangular lateral binding steel; and the ratio of
compression steel to tension steel, p'/po It was not
intended that concrete cylinder strength be a significant
214
variable in this programme but a large range of values for
this parameter was obtainedo It is well known, however,
and has been illustrated in Chapter 4, that the influence
of concrete strength on the ductility of under-reinforced
beams is not markedo
The main properties of the beams in this series are
summarised in Table 7o1o
7o3 SELECTION OF SPECIMEN SHAPE
In a typical, multi-storey all-frame structure,
seismic lateral loads produce points of contraflexure in
beams at approximately mid-spano Also, the cyclic nature
of this type of loading induces bending moments in the
beams that increase in magnitude to a maximum at the
column face and these moments change sign each time the
earthquake changes direction. It therefore seemed that a
convenient test specimen shape would be that represented
by a length of beam spanni~g between two adjacent points
of contraf1exure and having a column stub midway between
these points (Figure 7o1 illustrates the selected specimen
shape and its derivation). Further, by simply-supporting
the specimen at its ends, and by applying upward and down
ward point loads to the column stub, the triangular bend
ing moment diagram and moment sign changes will occur as
in the real structureo
There is one major inconsistency, however, between
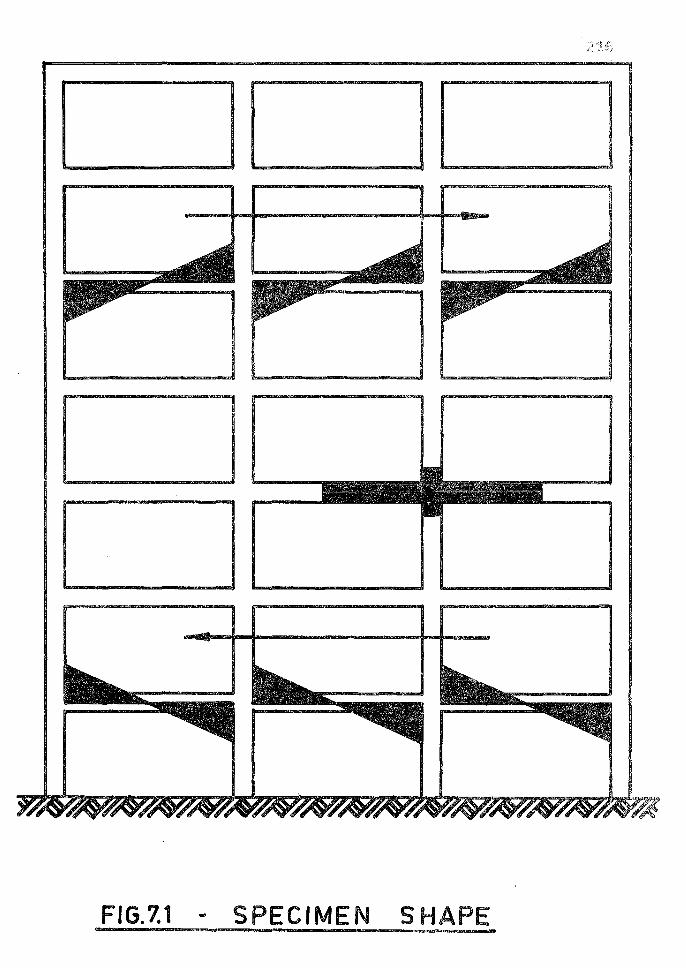
FIG.7.1 .. SPECIMEN SHAPE
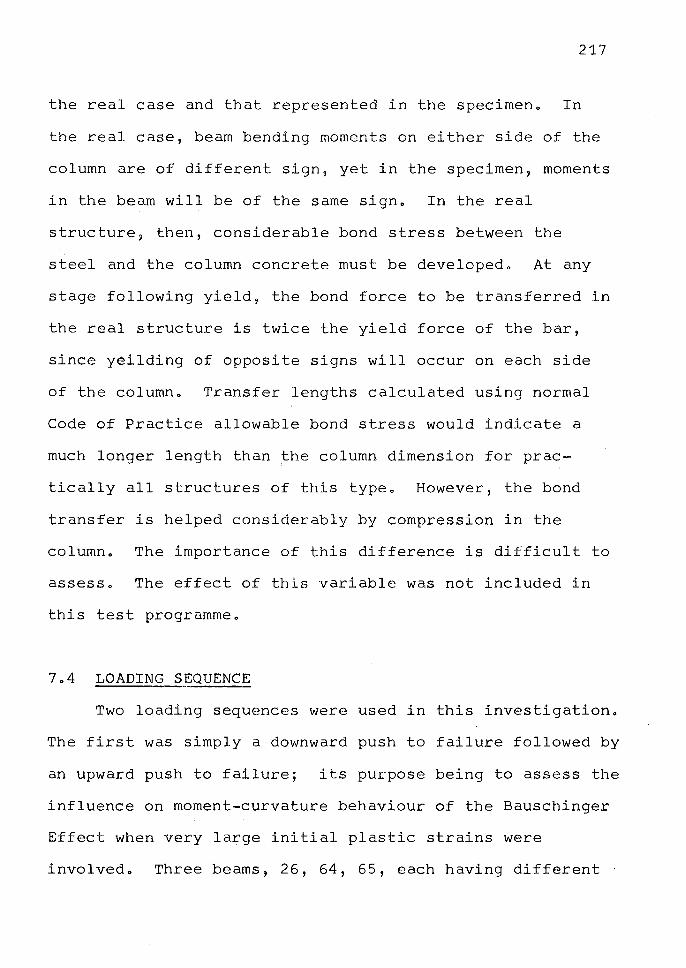
217
the real case and that represented in the specimeno In
the real case, beam bending moments on either side of the
column are of different sign, yet in the specimen, moments
in the beam will be of the same signo In the real
structure~ then, considerable bond stress between the
steel and the column concrete must be developedo At any
stage following yield, the bond force to be transferred in
the real structure is twice the yield force of the bar,
since yeilding of opposite signs will occur on each side
of the columno Transfer lengths calculated using normal
Code of Practice allowable bond stress would indicate a
much longer length than the column dimension for prac
tically all structures of this type. However, the bond
transfer is helped considerably by compression in the
columno The importance of this difference is difficult to
assesso The effect of this variable was not included in
this test programmeo
7o4 LOADING SEQUENCE
Two loading sequences were used in this investigationo
The first was simply a downward push to failure followed by
an upward push to failure; its purpose being to assess the
influence on moment-curvature behaviour of the Bauschinger
Effect when very large initial plastic strains were
involvedo Three beams, 26, 64, 65, each having different
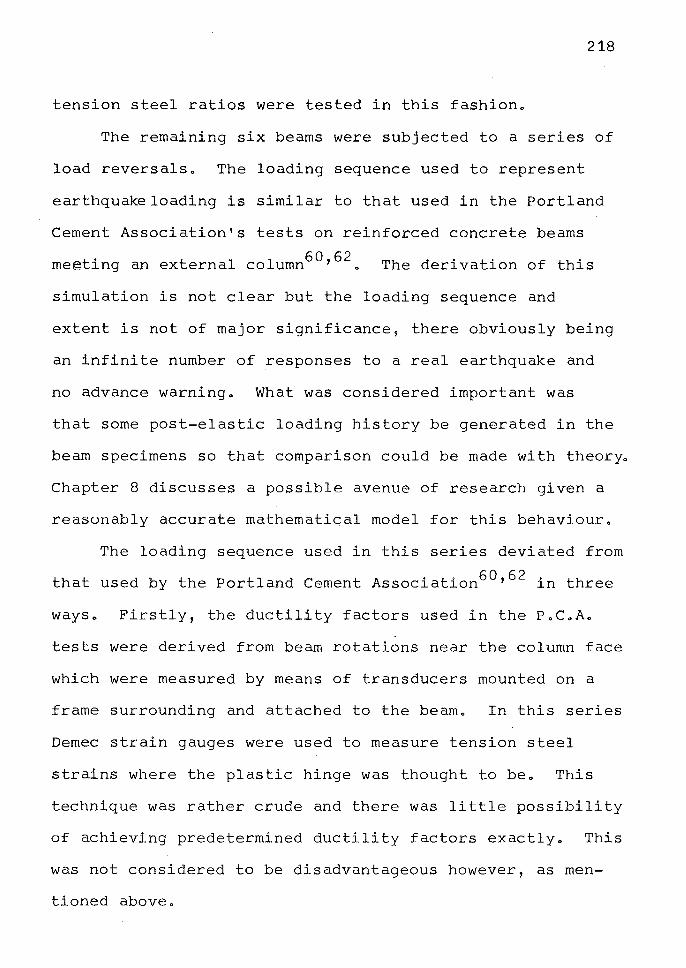
218
tension steel ratios were tested in this fashion"
The remaining six beams were subjected to a series of
load reversals" The loading sequence used to represent
earthquake loading is similar to that used in the Portland
Cement Association's tests on reinforced concrete beams
60 62 me©ting an external column ' " The derivation of this
simulation is not clear but the loading sequence and
extent is not of major significance, there obviously being
an infinite number of !esponses to a real earthquake and
no advance warning" What was considered important was
that some post-elastic loading history be generated in the
beam specimens so that comparison could be made with theory"
Chapter 8 discusses a possible avenue of research given a
reasonably accurate mathematical model for this behaviour"
The loading sequence used in this series deviated from
th t db th P tl d C t A . t' 60,62 . th a use y e or an emen ssocia ion in ree
ways" Firstly, the ductility factors used in the P.CaAo
tests were derived from beam rotations near the column face
which were measured by means of transducers mounted on a
frame surrounding and attached to the beam. In this series
Demec strain gauges were used to measure tension steel
strains where the plastic hinge was thought to be. This
technique was rather crude and there was little possibility
of achieving predetermined ductility factors exactly. This
was not considered to be disadvantageous however, as men
tioned above"
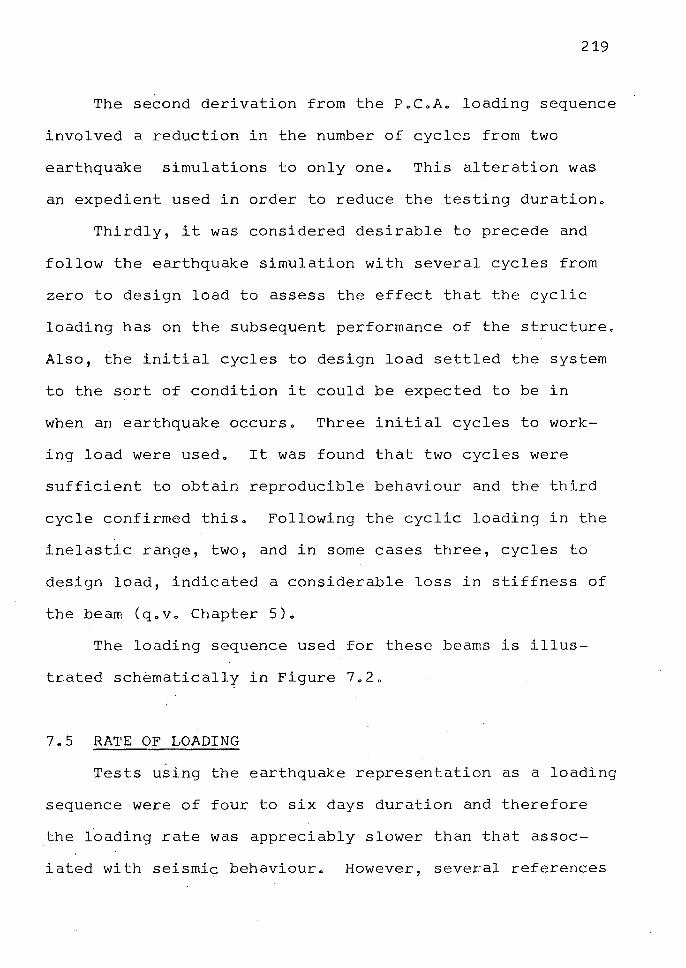
219
The second derivation from the PoCoAo loading sequence
involved a reduction in the number of cycles from two
earthquake simulations to only oneo This alteration was
an expedient used in order to reduce the testing durationo
Thirdly, it was considered desirable to precede and
follow the earthquake simulation with several cycles from
zero to design load to assess the effect that the cyclic
loading has on the subsequent performance of the structureo
Also, the initial cycles to design load settled the system
to the sort of condition it could be expected to be in
when an earthquake occurs. Three initial cycles to work
ing load were used. It was found that two cycles were
sufficient to obtain reproducible behaviour and the third
cycle confirmed this. Following the cyclic loading in the
inelastic range, two, and in some cases three, cycles to
design load, indicated a considerable loss in stiffness of
the beam (q.v. Chapter 5).
The loading sequence used for these beams is illus
tr,ated schematically in Figure 7.20
7.5 RATE OF LOADING
Tests using the earthquake representation as a loading
sequence were of four to six days duration and therefore
the 16ading rate was appreciably slower than that assoc
iated with seismic behaviour. However, several references
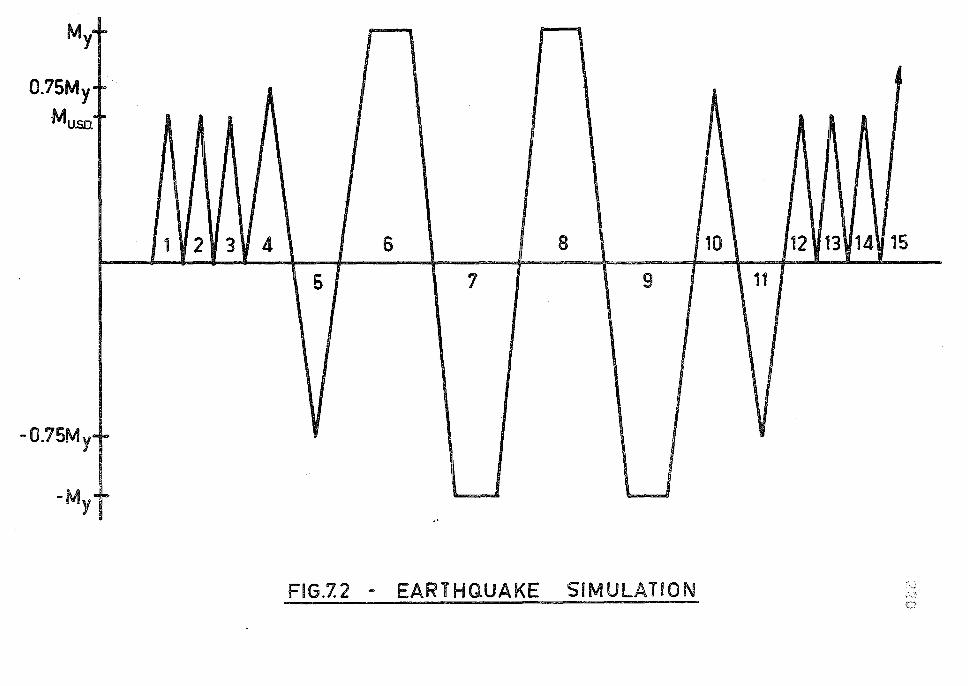
My
0.75My
Mu.so.
-0.75My
-My
...
.. -
• lo
' ...
I
1 2 3 ~ 4 I
, I
6 8 10 12 13 14 15
6 7 9 11
' ~ '
I l
FIG.Z2 - EARTHQUAKE SIMULATION
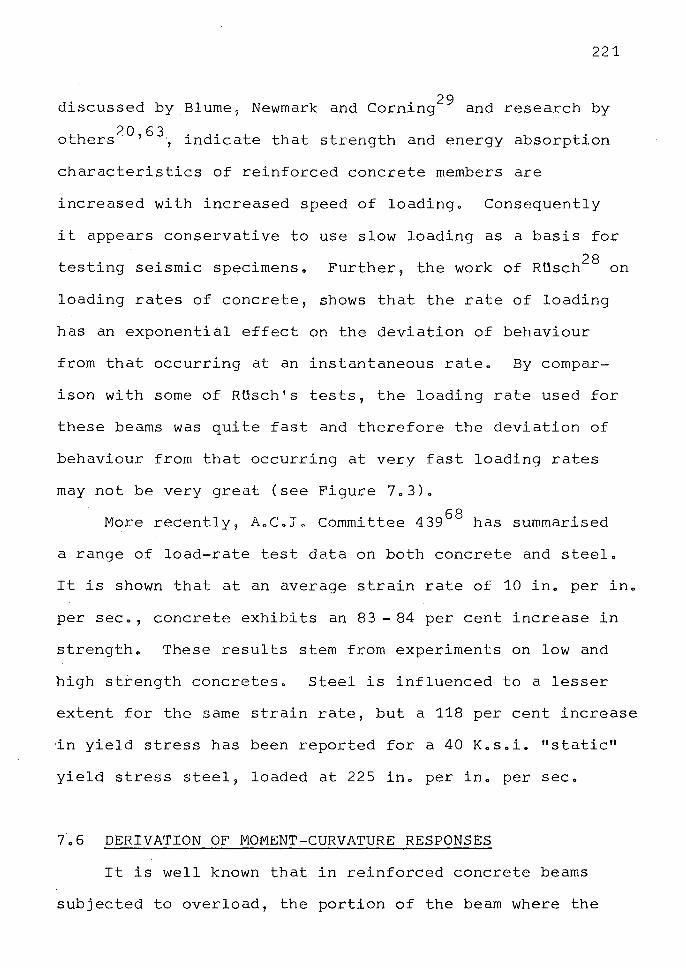
221
d . db Bl N k d C . 29 d h b iscusse y ume, ewmar an orning an researc y
20 63 others ' ~ indicate that strength and energy absorption
characteristics of reinforced concrete members are
increased with increased speed of loadingo Consequently
it appears conservative to use slow loading as a basis for
testing seismic specimenso 28 Further, the work of RUsch on
loading rates of concrete, shows that the rate of loading
has an exponential effect on the deviation of behaviour
from that occurring at an instantaneous rateo By compar
ison with some of RUsch's tests, the loading rate used for
these beams was quite fast and therefore the deviation of
behaviour from that occurring at very fast loading rates
may not be very great (see Figure 7o3).
More recently, AoCoio Committee 439 68 has summarised
a range of load-rate test data on both concrete and steelo
It is shown that at an average strain rate of 10 ino per ino
per sec o, concrete exhibits an 83 - 84 per cent increase in
strength. These results stem from experiments on low and
high strength concreteso Steel is influenced to a lesser
extent for the same strain rate, but a 118 per cent increase
·in yield stress has been reported for a 40 K. soi. "static"
yield stress steel, loaded at 225 ino per ino per sec.
7.6 DERIVATION OF MOMENT-CURVATURE RESPONSES
It is well known that in reinforced concrete beams
subjected to overload, the portion of the beam where the
22
2
w ~
O!
(!) z ........ • <
( 0 ...J
LLI LL
~
0 Ck:
l!) LJJ
z u
Cl
g z
...J w
::::, _
J
LL z ......
3SN
Od
S3~
sn03N
'v'lN'v1S
NI
NO
3JN3ITT.:IN
I
223
tension steel yields will deform inelastically.
The beam cannot sustain a load that is significantly
larger than the yield load, and because it undergoes a
considerable reduction in stiffness in the region of yield
ing, this portion will deform considerably while others
about it undergo relatively little change in moment or
curvature. This phenomenon is known as "plastic hinging"
and the extent over which it occurs is termed the "plastic
hinge length". It has been illustrated in Chapter 6 that
the load-deformation response of a beam after yielding is
determined almost entirely by the properties of the plastic
hinge and it is on this behaviour~that the energy absorption
requirements of seismic design relies.
The experimental moment-curvature curves illustrated in
Chapter 5 are those corresponding to the critical 2 11 gauge
lengths adjacent to the column stubs in the beams. It has
already been explained in Chapter 5 that the concrete strain
readings obtained from these experiments were considered to
be unsuitable for curvature determination because of the
crack formation down the whole depth of the member. There
fore the standard method of obtaining curvature, based on
the strain distribution in the compressed concrete, could
not be used. Instead, the assumption was made that plane
sections remain plane, and the strains in the tension and
compression steels were· used to obtain curvature.
224
Because two strains at least are required to compute curv
ature, and since only two values were available, great care
was taken when measuring these strainso
7.7 DERIVATION OF LOAD-DEFLECTION RESPONSES
Since concrete is a non-uniform material and fabric
ation methods are not perfect, the properties of the beam
sections on either side of the column stub were not
identical. Therefore plastic hinging did not occur to the
same extent on both sides of the stub but favoured the
weaker section, and so the beams deflected asymmetricallyo
Had the sections on both sides of the stub been identical,
the central deflection of the beam would have been greatero
In order that theoretical and experimental load-deflection
behaviour could be compared, it was necessary to modify the
observed central deflections and to compute the "equivalent
central deflections" which would occur if the beam had
deflected symmetrically with two equally-weak sections.
This process is illustrated in Figure 7.40 The rotation of
the column stub, G, was found from the average of the
inclinometer readings at the top and bottom of the stub.
The initial loads and equivalent central deflections at
the cycle extremities of the seven. beams for which load
deflection curves are.not plotted, are shown in Table 7.20
The load-deflection information for the other beams is shown
plotted in Figures 6.4 and 6.5.
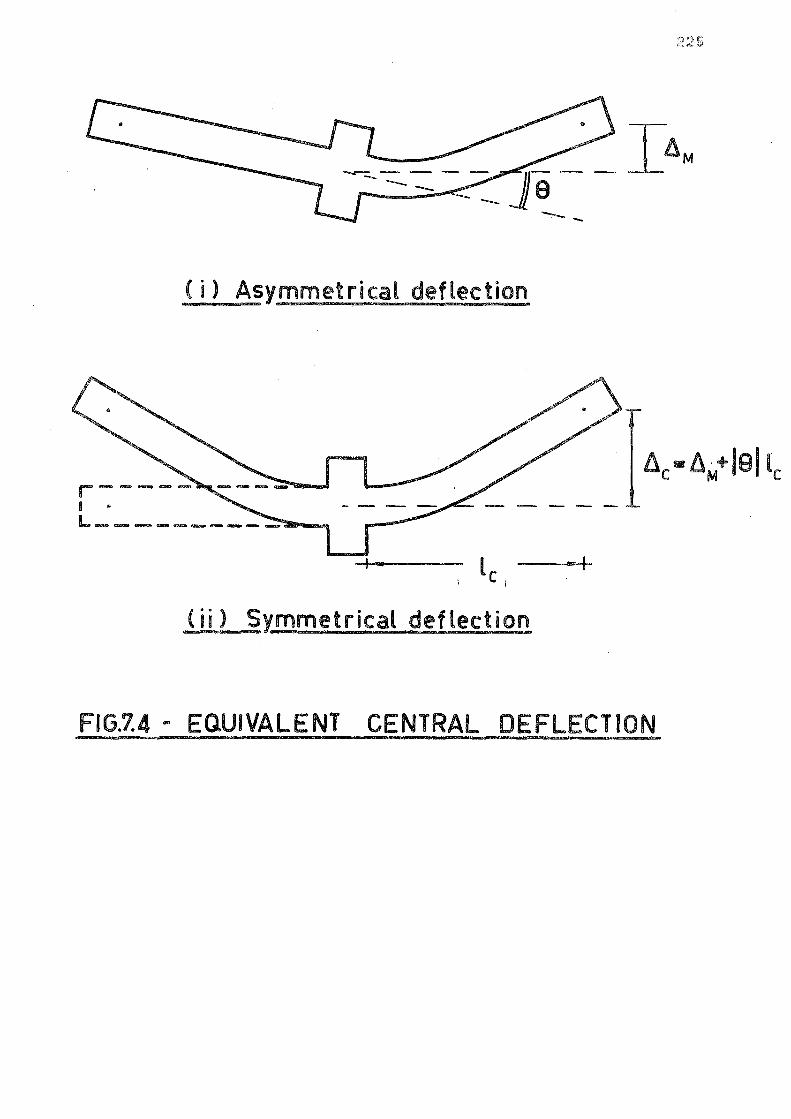
( i) Asymmetrical deflection
ti =6·+181 l C M C
(ii) SY.mmetrical deflection
FIG.7.4 - EQUIVALENT CENTRAL DEFLECTION
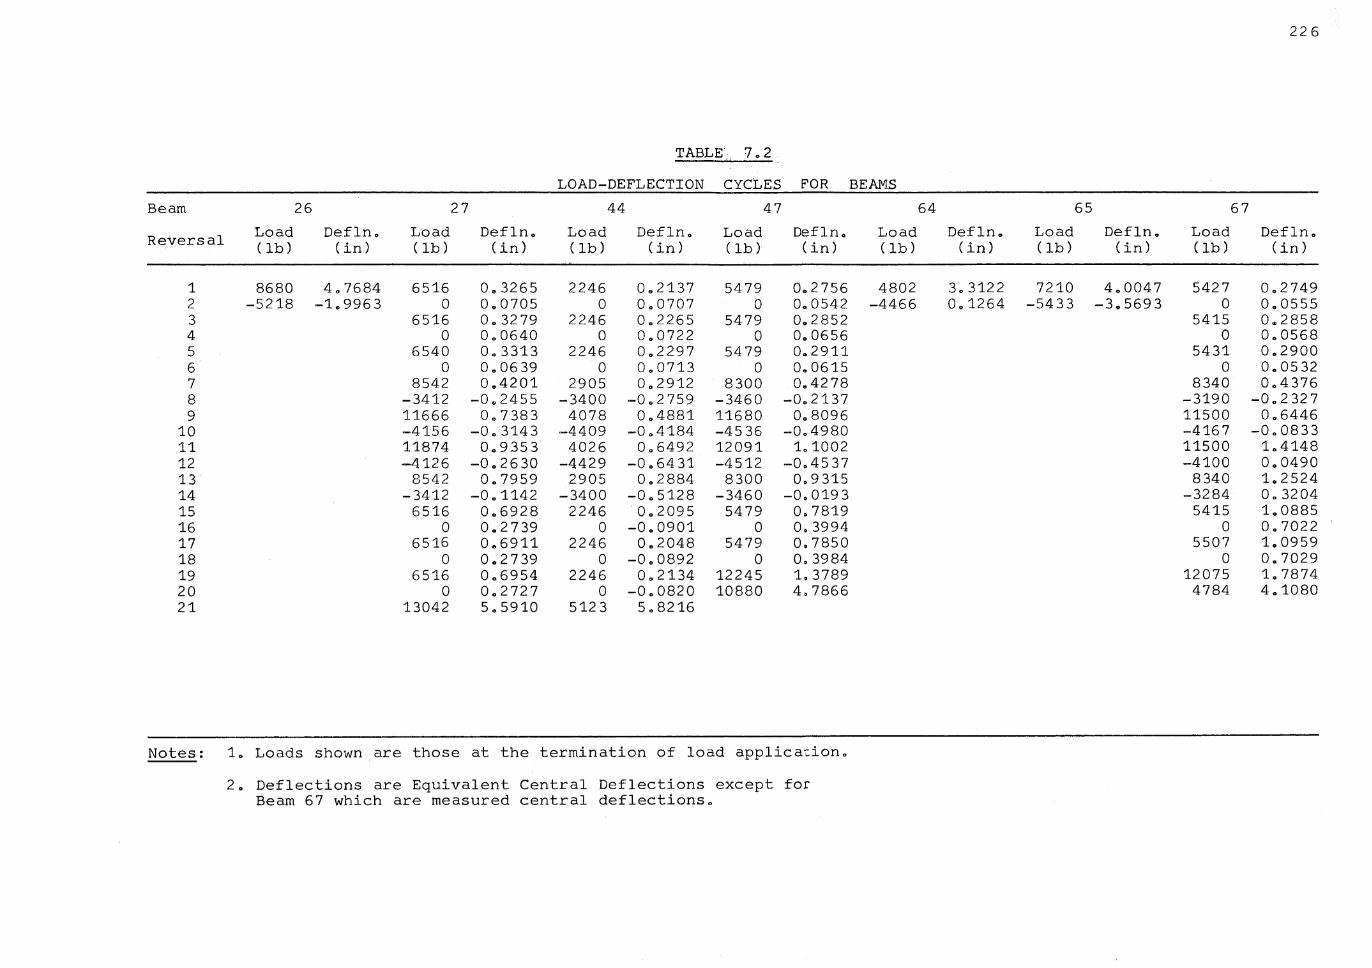
TABLE 7.2
LOAD-DEFLECTION CYCLES POR
Beam 26 27 44 47
Reversal Load Defln. Load Deflno- Load Defln. Load Defln. (lb) (in) (lb) (in) (lb) (in) (lb) (in)
1 8680 407684 6516 Oe3265 2246 0.,2137 5479 0 .. 2756 2 -5218 -1 .. 9963 0 000705 0 000707 0 0.0542 3 6516 0 0 32 79 2246 002265 5479 002852 4 0 0.0640 0 0.0722 0 000656 5 6540 003313 2246 0.,2297 5479 o .. 2911 6 0 0 .. 0639 0 0 .. 0713 0 o. 0615 7 8542 0.,4201 2905 0.,2912 8300 Ou4278 8 -3412 -002455 -3400 -002759 -3460 -0.2137 9 11666 007383 4078 004881 11680 0.8096
10 -4156 -003143 -4409 -0 .. 4184 -4536 -0 .. 4980 11 11874 0 .. 9353 4026 006492 12091 1.1002 12 -4126 -0.2630 -4429 -0.6431 -4512 -0.4537 13 8542 0.7959 2905 0.2884 8300 0.9315 14 -3412 -001142 -3400 -0.5128 -3460 -0.0193 15 6516 0.6928 2246 ·0.2095 5479 0.7819 16 0 0.2739 0 -0.0901 0 0.3994 17 6516 0.6911 2246 0.2048 5479 0.7850 18 0 0. 2 7 39 0 -000892 0 o. 3984 19 6516 0.6954 2246 o .. 2134 12245 1.3789 20 0 0.2727 0 -0.0820 10880 4.7866 21 13042 5.5910 5123 5.8216
Notes: 1o Loads shown.are those at the termination of load application.
2. Deflections are Equivalent Central Deflections except for Beam 67 which are measured central deflections.
226
BEAMS
64 65 67
Load Defln. Load Deflno Load Defln. (lb) ( in) (lb) (in) (lb) (in)
4802 3 .. 3122 7210 400047 5427 0.2749 -4466 0.,1264 -5433 -3.5693 0 000555
5415 0 .. 2858 0 000568
5431 0.2900 0 0.0532
8340 0 .. 4376 -3190 -0 0 2 32 7 11500 006446 -4167 -0 .. 0833 11500 1 .. 4148 -4100 0.0490
8340 1.2524 -3284 003204
5415 100885 0 0.7022
5507 1.0959 0 0.7029
12075 1. 7874 4784 4.1080
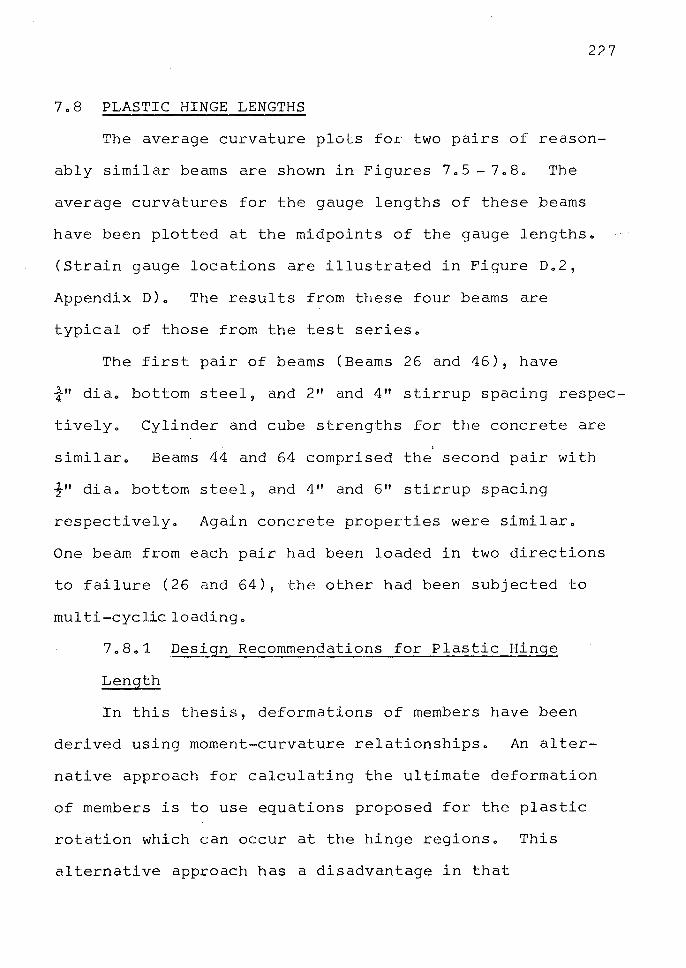
22 7
7.8 PLASTIC HINGE LENGTHS
The average curvature plots for two pairs of reason
ably similar beams are shown in Figures 7.5 - 7.8. The
average curvatures for the gauge lengths of these beams
have been plotted at the midpoints of the gauge lengths.
(Strain gauge locations are illustrated in Figure D.2,
Appendix D). The results from these four beams are
typical of those from the test series.
The first pair of beams (Beams 26 and 46), have
¾" dia. bottom steel, and 2 11 and 4 11 stirrup spacing respec
tively. Cylinder and cube strengths for the concrete are .
similar. Beams 44 and 64 comprised the second pair with
½" dia. bottom steel, and 4" and 6" stirrup spacing
respectively. Again concrete properties were similar.
One beam from each pair had been loaded in two directions
to failure (26 and 64), the other had been subjected to
multi-cyclic loading.
7.8.1 Design Recommendations for Plastic Hinge
Length
In this thesis, deformations of members have been
derived using moment-curvature relationships. An alter
native approach for calculating the ultimate deformation
of members is to use equations proposed for the plastic
rotation which can occur at the hinge regions. This
alternative approach has a disadvantage in that
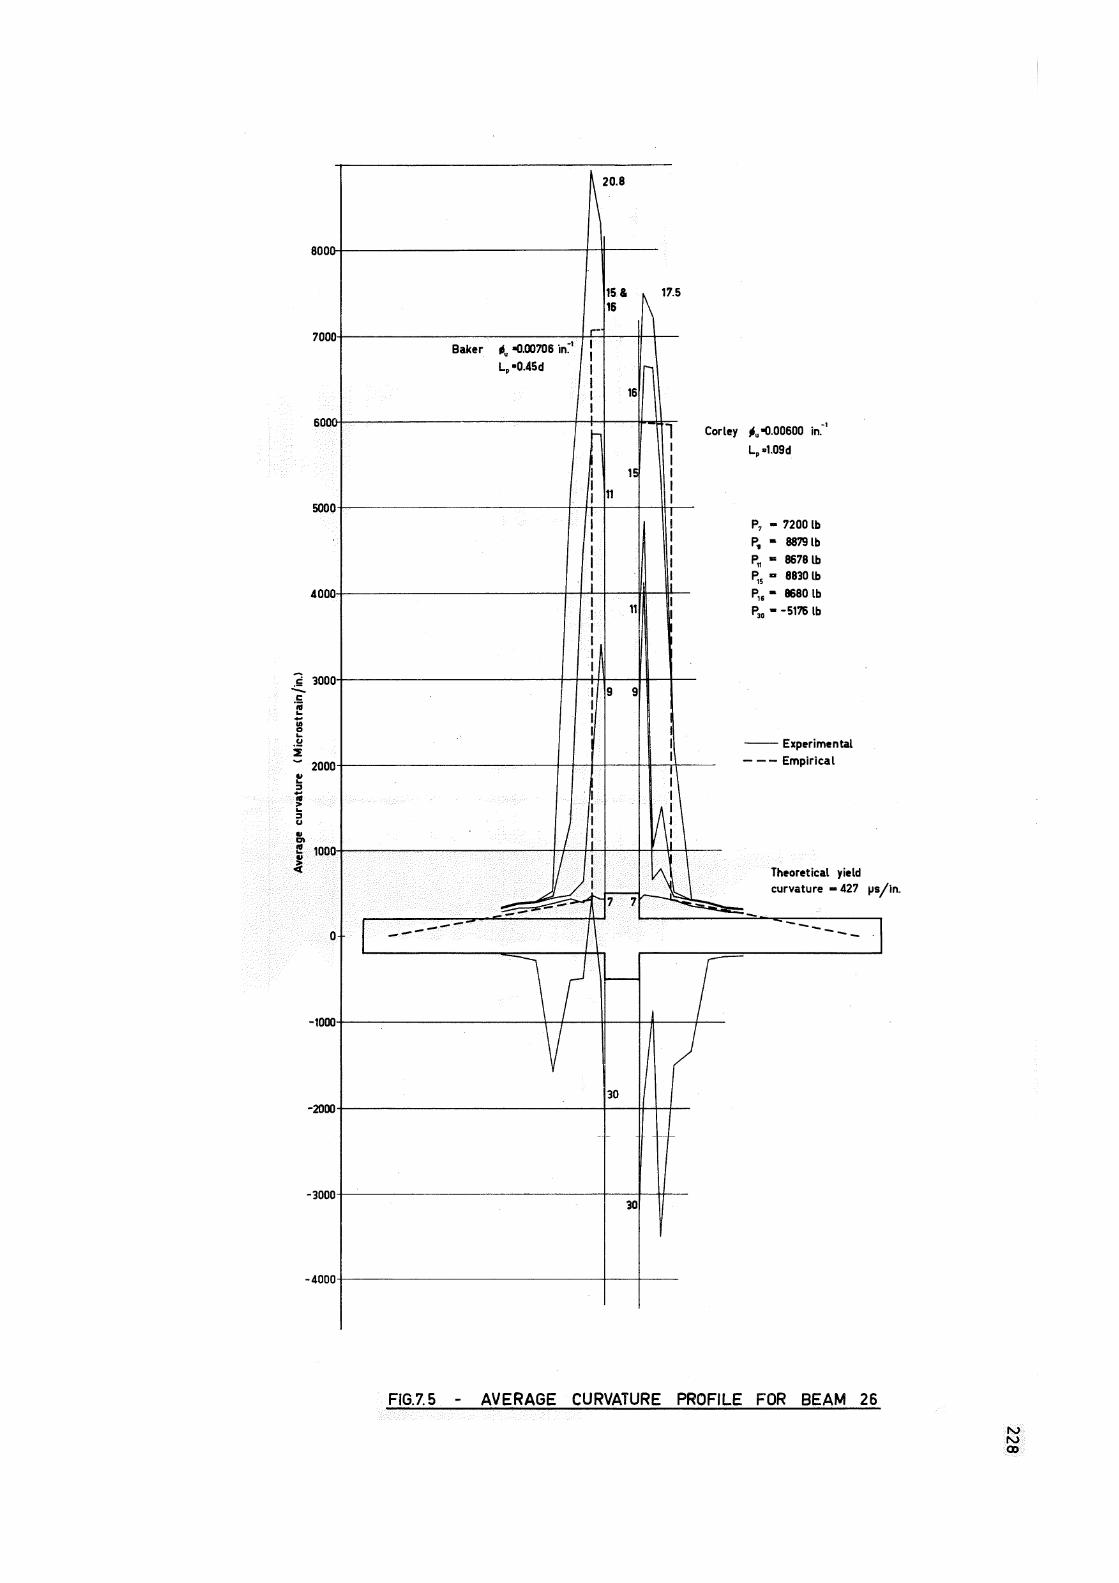
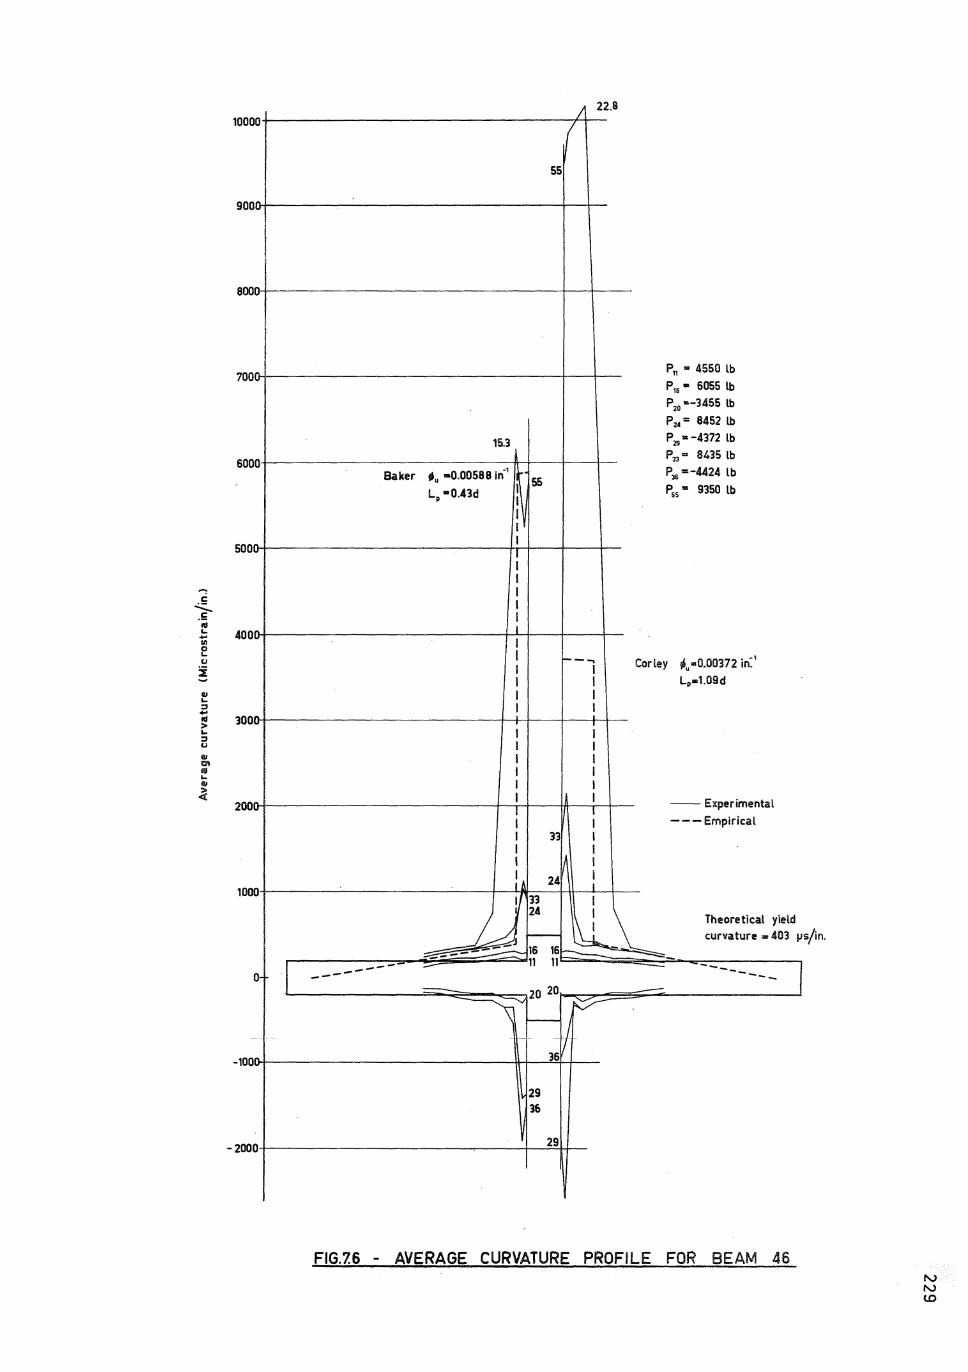
-, C
i--tO ... .... Ul 0 ... u :i GI ... ::, ...
1000 0
900 ·-,.,
800 0
700 'W
600 0
500 V
400 ,,. •w
l! 300 -,., ... ::, u GI Cl fil ... GI
~ 200 ...
1000
0
!!: -100
-200 0
I
I 22 8
( 55
P11 • 4550 lb
P,6 • 6055 lb
P20 •-3455 lb
P24 = 8452 lb
15.3 P 29 • -4372 lb
P33 ... 8435 lb
Baker liu •0.00588 in-1
55 P35 =-4424 lb
LP •0.43d I PSS• 9350 lb I
: ~ I I I I I I I I I I
,_ ___ Corley lilu'•0.00372 in:' I I
I I Lp•1.09d I I I I
I I
I I I I I I I I I i I I -- Experimental I I I I --- Empirical I 33 I I I I A I
: l 24 I I )Jn I
24 I \ Theoretical yield 1 j- I ----_-::,:::_ 16 16~-
curvature .. 403 µ
~ 11 11~ --.c:_ ---- - --- I --- ----- ---- 20 20 -_\-----..,,,_ v---
- -- -1-36
y 29 36
29
FIG.7.6 - AVERAGE CURVATURE PROFILE FOR BEAM 46
s/in.
"' "' lO
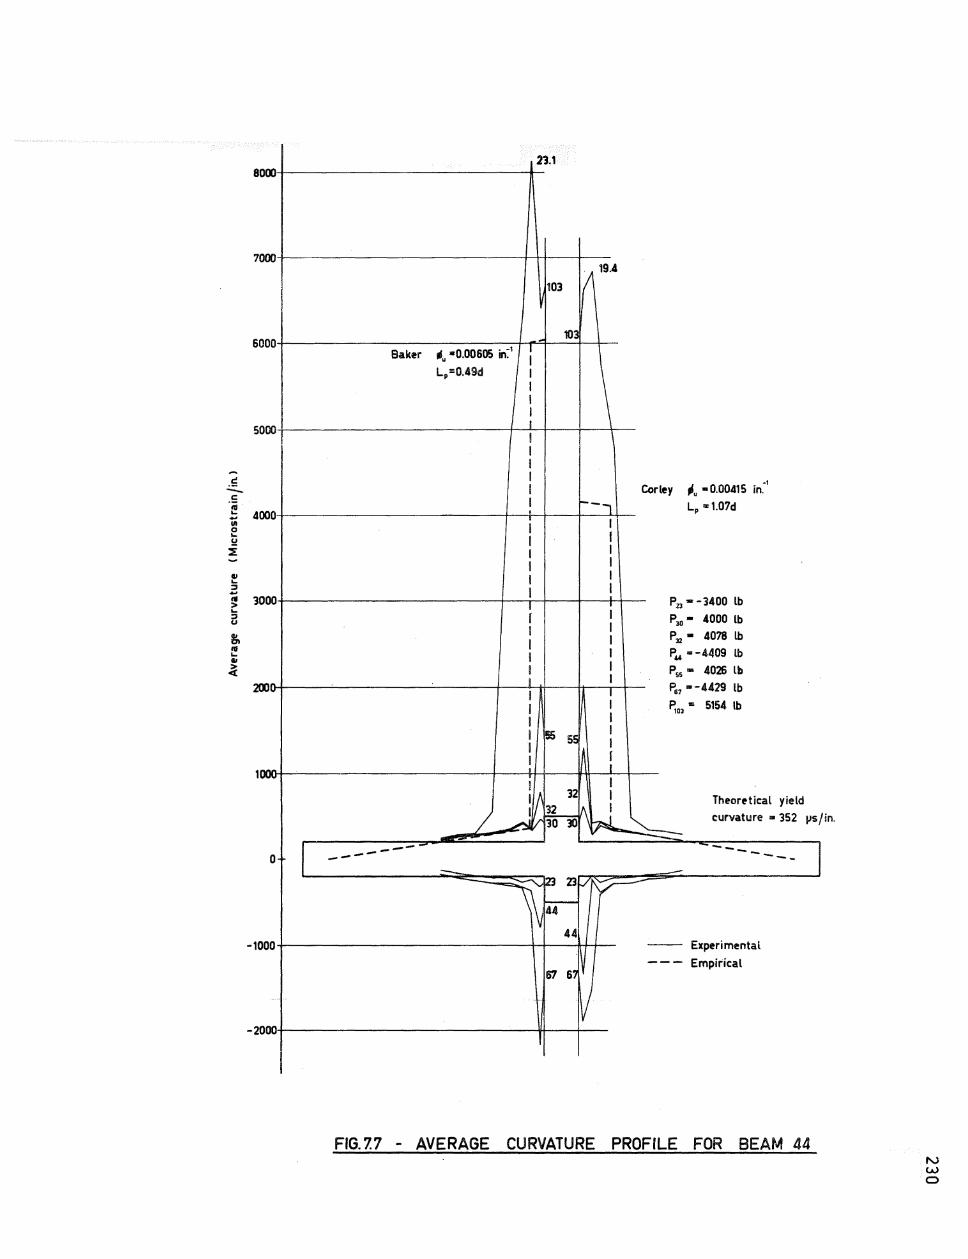
2'3.1 80001-+---------------
7000+---------------t-Nf---t--
103 ;119.4
1Qj 6000+---------------f'---=i----+--+-~
'" •0.00605 in~1 : Baker
L,=0.4~ i \ SOOO+--------------t---"---11 r----t---+--
I I I
~ I - I £ I --~
-1 Corley lu •0.00415 in.
f! I ti 4000-+--------------t-+--t----,f-----'-1 +---o I ~ I I ~ I I
I I f'. I I ~ I !
->.. 3000+--------------.,......,------~ I ' B I 1
I I I I I I I I I I 200:u+--------------+----tt--+t---ir-t--l I I I I I i ~ 55 I I I I r ' I
LP .., 1.07d
P30 • 4000 lb
P32 • 4078 lb
P44 • -4409 lb
P55 "' 4026 lb P67 • - 4429 lb
P,0, = 5154 lb
I '32 : :(~2 _/\ I
/ _.d/30 '30 f-hl. Theoretical yield
curvature • 352 µs/in. v-.;::::::::::
0 I _.-.------- -
-1000+---------------+-t-----ft-t--+-
67 s, ~
✓ -2000+-------------------lH----+--
-------
-- Experimental
- - - Empirical
--
FIG. 7.7 - AVERAGE CURVATURE PROFILE FOR BEAM 44
i
N w 0
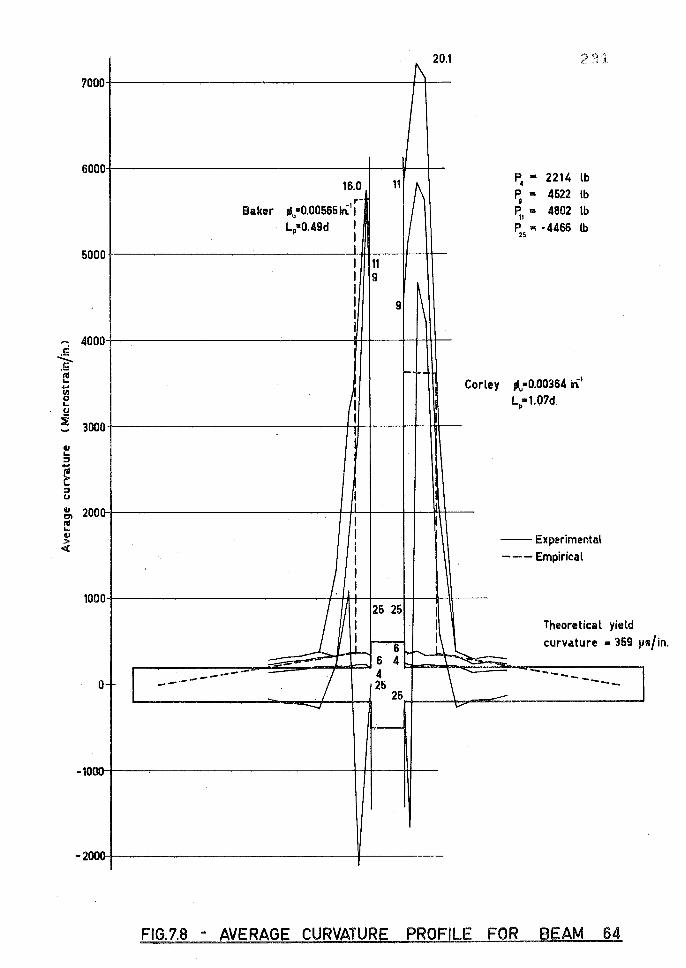
20.1 ,, f'"J ,...,
(\ 1- _,_') J.
7000
6000 16.0 11
r p - 2214 lb
4 p .. 4522 lb ~- 9
Baker .i:0.00565 in:11 ~1"' 4802 lb Lp•0.49d I ~s • ·4466 lb
I 5000
I
I 11 I 9 I I 9 \ I I
4000
- ~
Corley i'u•0.00364 in1
I I Lt1.07d
3000 I I
I 200:
'1
I I --Experimental I I - - - Empirical
l I I
1000 '
J I
I 25 25 I I I Theoretical yield I ,...._.,.... I curvature • 369 µ LL 6 .~ I\ '---- I 6 4 I ~
s/in.
I .... ----- - I 4 \ ...... ___
I 0- --- 25 -----25 ~
--.J .....
~
10~
""""" -- -
FIG. 7.8 - AVERAGE CURVATURE PROFILE FOR BEAM 64

2 32
deformations between yield and ultimate cannot be deter
minedo A number of investigators have made design recom
mendations for equivalent plastic hinge lengtho The
equivalent plastic hinge length may be defined as that
length which when multiplied by the difference between
ultimate and yield curvature, results in the same plastic
rotation as actually occurs in the member, ioeo the actual
distribution of plastic curvature is replaced by a rec
tangle of identical area and maximum curvature.
Only two of these proposals will be discussed here:
43 the first is that presented by Baker and Amarakone , since
this is representative of recent European work; the second,
by Corley55 , is representative of research at the Portland
Cement Association Laboratories.
In both cases, these recommendations are based on
experiments with monotonically-loaded beams, and it is of
interest to compare them with plastic hinge lengths of beams
subjected to cyclic load.
(a) 43 Baker and Amarakone
The necessary equations advanced by Baker and
Amarakone for computing plastic hinge lengths and rotations
are: (The notation has been changed to avoid confusion with
other well-known parameters)
•••• (7.1)
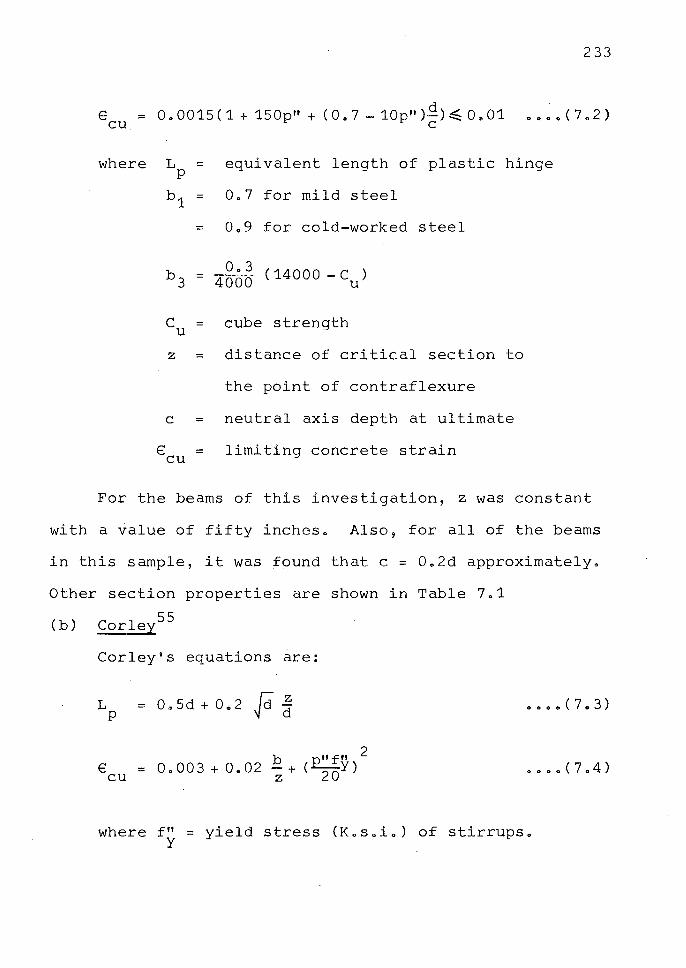
2 33
€ = 0o0015(1+150p"+ (Oo7-10p")d)~Oo01 0000(702) CU C
where L = equivalent length of plastic hinge p
b1 = 0o7 for mild steel
= 0o9 for cold-worked steel
b3 0o3 ( 14000 - C u) = 4000
C = cube strength u
z = distance of critical section to
the point of contraflexure
C = neutral axis depth at ultimate
€ = limiting concrete strain cu
For the beams of this investigation, z was constant
with a value of fifty incheso Also, for all of the beams
in this sample, it was found that c = 0o2d approximately.
Other section properties are shown in Table 7.1
(b) 55 Corley
Corley's equations are:
L p
€ cu
=0~5d+o .. 2fct~
where f" = yield stress (K.s.i.) of stirrups. y
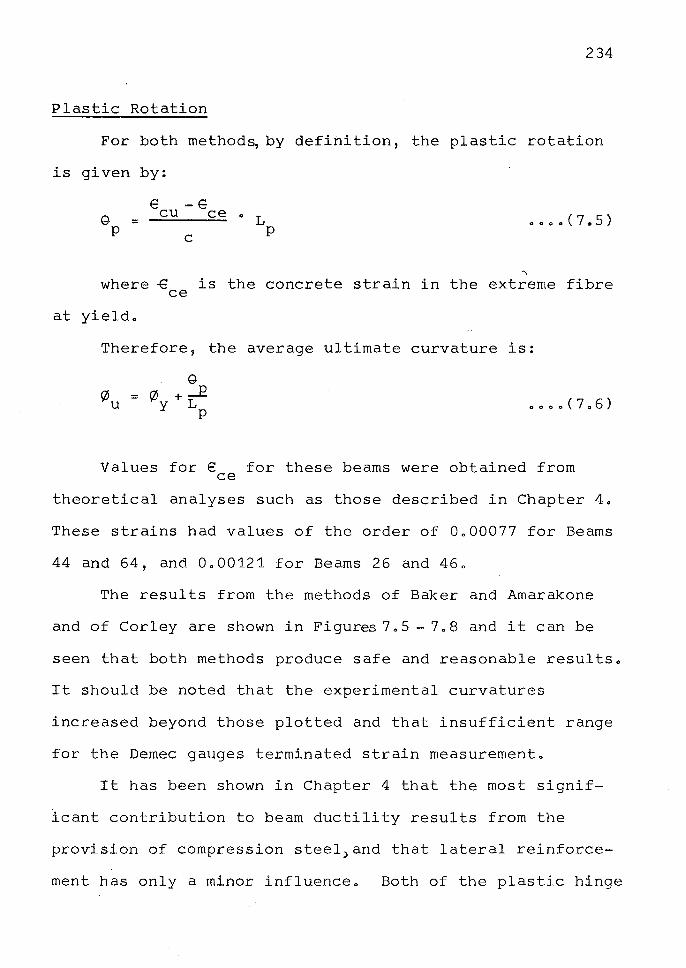
234
Plastic Rotation
For both methods, by definition, the plastic rotation
is given by:
9 p :::
€ -E cu ce
C
o L p
0000(7.5)
' where t is the concrete strain in the extreme fibre ce
at yieldo
Therefore, the average ultimate curvature is:
0000(7.6)
Values for€ for these beams were obtained from ce
theoretical analyses such as those described in Chapter 4o
These strains had values of the order of 0000077 for Beams
44 and 64, and 0000121 for Beams 26 and 460
The results from the methods of Baker and Amarakone
and of Corley are shown in Figures 7. 5 - 7 o 8 and it can be
seen that both methods produce safe and reasonable results.
It should be noted that the experimental curvatures
increased beyond those plotted and that insufficient range
for the Demec gauges terminated strain measurement.
It has been shown in Chapter 4 that the most signif
icant contribution to beam ductility results from the
provision of compression steel)and that lateral reinforce
ment has only a minor influence. Both of the plastic hinge
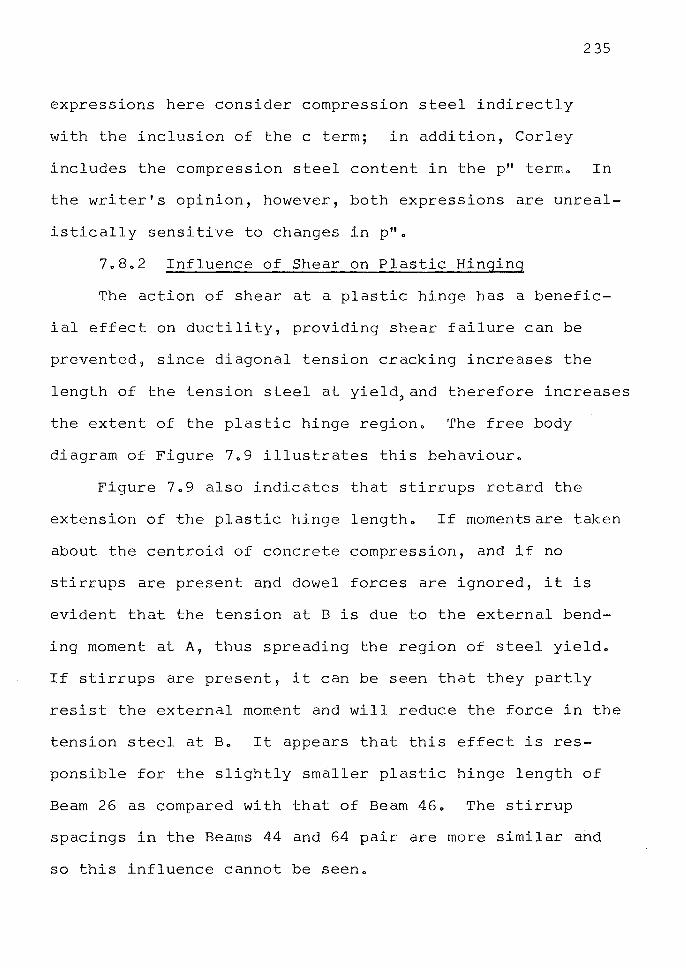
235
expressions here consider compression steel indirectly
with the inclusion of the c term; in addition, Corley
includes the compression steel content in the p" term" In
the writer's opinion, however, both expressions are unreal
istically sensitive to changes in p""
7a8o2 Influence of Shear on Plastic Hinging
The action of shear at a plastic hinge has a benefic
ial effect on ductility, providing shear failure can be
prevented, since diagonal tension cracking increases the
length of the tension steel at yield~and therefore increases
the extent of the plastic hinge region" The free body
diagram of Figure 7o9 illustrates this behaviouro
Figure 7a9 also indicates that stirrups retard the
extension of the plastic hinge lengtho If moments are taken
about the centroid of concrete compression, and if no
stirrups are present and dowel forces are ignored, it is
evident that the tension at Bis due to the external bend
ing moment at A, thus spreading the region of steel yieldo
If stirrups are present, it can be seen that they partly
resist the external moment and will reduce the force in the
tension steel at Bo It appears that this effect is res
ponsible for the slightly smaller plastic hinge length of
Beam 26 as compared with that of Beam 460 The stirrup
spacings in the Beams 44 and 64 pair are more similar and
so this influence cannot be seeno
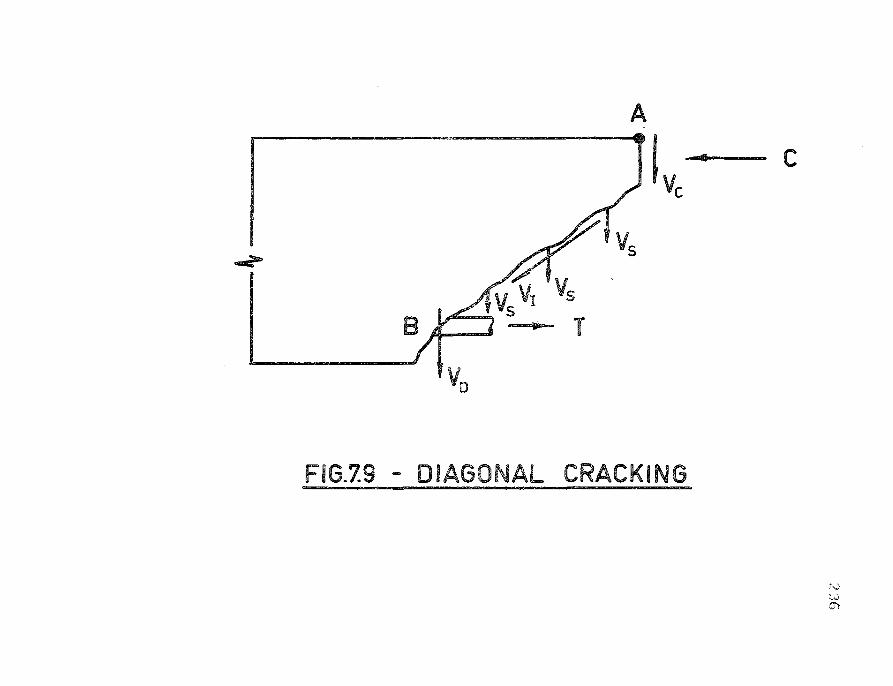
A
'Ve- C
~
_ __:__Vs Vr Vs • .-.- T
Vo
FIG.7.9 - DIAGONAL CRACKING
!""-..)
237
A b f . . 1 . 69 f 1 t. h' num er o empirica expressions or pas ic inge
length include a term to allow for the spread of plasticity
due to diagonal tension cracks. The analyses of Chapters
4, 5 and 6 take no account of this behaviour and should
therefore be conservative.
Nominal shear stresses in these beams at ultimate load
were in the range 120 p.s.i. for beams with½" dia. tension
steel to 350 p.s.i. for beams with ¾" dia. tension steeL
Dowel stresses (shear stress in reinforcing bars) were of
the order of 2,600 p.s.i. during intervals of purely steel
couple moment resistance in cyclically-loaded beams.
Plates 7. 1 - 7. 3 illustrate the crack patterns for
Beams 26, 44 and 64. It is evident that diagonal cracking
was not extensive in these test beams.
7.8.3 Influence of Cyclic Loading on Plastic Hinge
Length
A study of the average curvature plots of Figures 7.5-7o8
for the beam pairs 26 and 46, and 44 and 64, indicates no
increase or decrease in plastic hinge length at ultimate
for the cyclically-loaded beams (44 and 46). In these
beams, the cycles resulting from upward loading have smal
ler plastic hinge lengths than do Beams 26 and 64 because
unloading had been initiated at comparatively low ductility
factors and therefore the plastic hinge had not developed
to its full extent. Beams 44 and 46 were yielded twice in
each direction before the final failure cycle and concrete
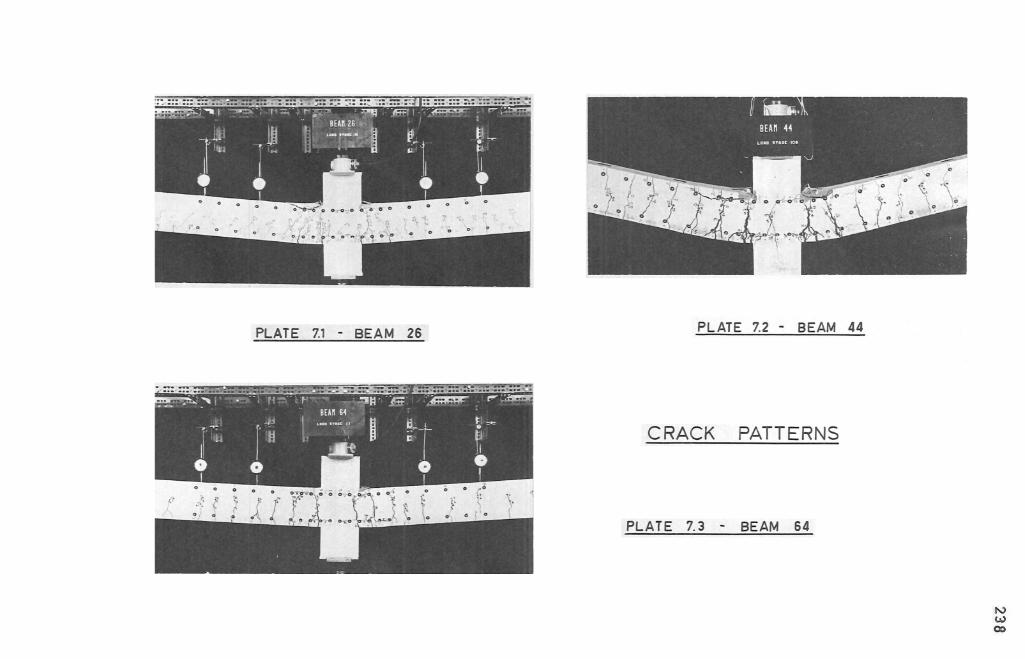
PLATE 7.1 - BEAM 26 PLATE 7.2 - BEAM 44
CRACK PATTERNS
PLATE 7.3 BEAM 64
N w 00
spalling did not occur in either beam during the cyclic
loading phaseo
7o9 COMPUTER PROGRAMS
2 39
As there were on average twelve thousand readings and
measurements for each of the beams in this series, computer
programs were written to reduce this data to the required
formo
The purpose of the principal program (Program 7o2 -
11 BEAMTEST11) was to accept loads~ Demec and dial gauge
readings, and temperature corrections, and to produce
bending moments, strain~ curvatures and deflections for
each load stage¢ Also, the "zero" readings were measured
when the beam was subjected to self weight and by provid
ing the concrete density and beam weight, the zero readings
could be redefined and computed as those at which the beam
was under no loado Provision was also made for including
shrinkage effects when re-defining the zeros, but as some
difficulty was encountered in measuring shrinkage strain
(qoVo Appendix D) this feature was not used and was event-
_ually removed from the programo
The order in which the beam data was collected and
punched on to cards was not immediately suitable for
processing with "BEAMTEST" and so the cards were each
punched with reference numbers and then resortedo As some
240
40 minutes was required to process the data with the main
program, a smaller program (Program 7o1 - "DATATEST") was
used to check the new data sequenceo This program also
indicated omissions from the punched datao
A third program (Program 7o3 - "INCLINO") was written
to output angles, both in radians and degrees, from the
inclinometer readingso
The final program (Program 7o4 - "DATALIST") simply
listed the input data and provided a convenient means of
checking for obvious errors in the measurement or record
ing of resultso
Listings of these programs appear in Appendix Bo
241
CHAPTER 8
CONCLUSIONS AND SUGGESTED FUTURE RESEARCH
801 GENERAL
A theory has been developed to predict the flexural
response of reinforced concrete Tor rectangular members
when subjected to monotonic or cyclic load, and either
with or without axial compressiono
The conclusions reached have already appeared at the
end of the relevant chapters or as discussion in the texto
These are summarised below and are followed by suggestions
for future research in this fieldo
802 SUMMARY OF CONCLUSIONS
An investigation into the influence of conventional
rectangular binding steel on concrete stress-strain prop
erties was carried outo A theory was evolved for predict
ing moment-curvature response. to monotonic load in beams
and columns and compared with published experimental
evidenceo Using this theory, the effect of lateral
reinforcement on the ductility and load carrying capacity
of monotonically-loaded beam and column sections
242
was studied. It is concluded that the most significant
contribution to the ductility of under reinforced beams
arises from increased p'/p ratios and reduced tension steel
content, and that lateral binding of compression concrete
has only a negligible effect on ductility. However, it was
found that lateral reinforcement has a very beneficial
effect on the energy absorbing capacity for columns. The
theory indicates negligible enhancement in load-carrying
capacity due to confinement for both beams and columns.
The Bauschinger Effect in structural grade reinforcing
steel was investigated experimentally and using the method
of least squares; a mathematical model for this behaviour
is advanced. The model is compared with, and shown to be
generally more accurate than, the only other known model -
that postulated by Singh, Gerstle and Tulin49 • The expres
sion described herein takes account of the three variables
that most influence the Bauschinger property, viz., the
virgin properties of the steel, the plastic strain in the
previous cycle, and the number of prior cycles. The prop
osed expression is therefore more complex than that
advanced by Singh et al. but it is felt that this is
justified in view of the complicated nature of the
Bauschinger Effect.
By combining the above theories, moment-curvature
responses of cyclically-loaded reinforced concrete sections
are obtained theoretically and compared with test responses
243
from beamso The theoretical predictions are shown to
compare very well with experiment and consider such
features as opening and closing of concrete crackso The
large reaches of the theoretical moment-curvature plots
for these beams indicate that after load reversal from
initial yield, moment resistance is provided by purely
steel couple actiono It is concluded that the primary
role of concrete during cyclic loading is to prevent
buckling of the reinforcing steelo
Further comparison is made between experimental
moment-curvature behaviour and theory by using an elastic
perfectly plastic reinforcing steel responseo These
comparisons are plotted and show the elasto-plastic
idealisation to predict more energy-absorption than is
availableo
Extension of the moment-curvature theory enables the
prediction of load-deflection response to be madeo Again,
experimental and theoretical comparisons are drawn for
load versus equivalent central deflection for two of the
beams tested in this seriesc As considerable computer
time is required for the prediction of load-deflection
responses, a study was made of two idealised load
deflection modelso The first, and most commonly used, the
elasto-plastic model, over-estimates the available energy
absorption even more than when used as a moment-curvature
244
responseo This model does not allow for purely steel
couple moment-resistance and large inaccuracies are incur
red because of this. The second model, which is shown to
be generally conservative, is that proposed by Clough58 and
takes into account the stiffness degradation that results
from cyclic loadingo
The influence of cyclic loading, shear, and stirrup
spacing on plastic hinge length is discussedo Design
recommendations for plastic hinge lengths as propo~ed by
43 55 . Baker and Amarakone and by Corley , are compared with
experimental results from four beams in this investigation,
and shown to predict safe and reasonable valueso Also, it
was found that cyclic loading had a negligible influence on
the length of the plastic hinge at failure for these beamso
803 SUGGESTED FUTURE RESEARCH
On the basis of the analysis presented in this thesis,
it may be possible to avoid the considerable computer time
required to predict moment-curvature and load-deflection
behaviour, by evolving envelope curves for these responseso
This would enable immediate assessment of energy absorption
potential to be made for different sections and would not
require computer accesso In view of the complex nature of
steel and concrete response to cyclic load, the feasibility
of this may be doubtful, but it would prove of considerable
use in design.
245
The most obvious need for further research is for a
more accurate Bauschinger Effect modelo In Chapter 5 it
was shown that an elasto-plastic steel stress-strain
response produced, with the exception of the closing of
concrete cracks, an elasto-plastic moment-curvature
propertyo Further, in Chapter 6 an elasto-plastic moment
curvature idealisation resulted in elasto-plastic load
deflection behaviouro This sequence of behaviour pattern
from steel stress-strain to load-deflection is extremely
significant and implies that, given an accurate model for
the steel cyclic stress-strain curve, then a realistic
load-deflection idealisation can be derivedo This would
remove the need for the lengthy calculations at present
required to obtain moment-curvature relationships from
essentially steel stress-strain expressions and load
deflection responses from moment-curvature behaviouro
Therefore, although the stress-strain expression for
Bauschinger Effect described in this thesis is reasonably
accurate, and has a stress standard deviation of Oo05f to y
Oo10f for the specimens tested, it is felt that a more y
thorough and systematic study is required to evolve load-
deflection idealisationso
The difficulty of obtaining a suitable idealisation
for moment-curvature responses under cyclic load suggests
that sensitivity studies similar to the comparison
246
58 performed by Clough , could be carried out using different
idealisations to determine the effect of seismic motions on
the response of reinforced concrete structures.
The order of enhanced bond strength available when
bars are subjected to lateral compression stress is not
well known. It can be shown that, using current Code of
Practice formulae, practically all columns are of insuffic
ient width to transfer the steel stress in the beam from
negative yield at one column face, to positive yield at
the other. : The deterioration of such bond strength under
repeated cyclic loading may have a considerable influence
on the ductility and strength of the beam adjacent to the
joint.
A1
APPENDIX A
BIBLIOGRAPHY
1o RICHART, FoEo, BRANDTZAEG, Ao, and BROWN, R.Lo,
"A Study of the Failure of Concrete under Combined
Compressive Stresses"o University of Illinois Engin
eering Experiment Station, Bulletin Noo 185, Novo 19280
"The Failure of
Plain and Spirally Reinforced Concrete in Comparison"o
University of Illinois Engineering Experiment Station,
Bulletin No. 190, Apro 19290
3o WHITNEY, CoSo, "Design of Reinforced Concrete Members
Under Flexure or Combined Flexure and Direct Compres
sion". Proceedings AoC.Io Journal, Volo 33, Maro -
Apr o 19 37 o
4o WHITNEY, CoSo, "Plastic Theory of Reinforced Concrete
Design" o Proceedings Ao So Co E o Journal, VoL 66,
Noo 10, Deco 1940, ppo 1749-17800
So JENSEN, V.Po, "The Plasticity Ratio of Concrete and
its Effect on the Ultimate Strength of Beams"o
Proceedings AoCoio Journal, Volo 39, June 1943.
A2
6. BLANKS, R.F., and McHENRY, D., "Plastic Flow of Con
crete Relieves High-Load Stress Concentrations". Civil
Engineering>Vol. 19, No. 5, May 1949, pp. 320-322.
7. BALMER, G.G., "Shearing Strength of Concrete Under
High Triaxial Stress - Computation of Mohr's Envelope
as a Curve". U.S. Bureau of Reclamation, Structural
Research Laboratory, Report No. SP-23, Oct. 1949.
8. HERR, L.A., and VANDEGRIFT, L.E., "Studies of Compres
sive Stress Distribution in Simply Reinforced Concrete
Near the Point of Failure". Proceedings, Highway
Research Board, Vol. 30, 1950, pp. 114-125.
9. BAKER, A.L.L., "Recent Research in Reinforced Concrete
and its Application to Design". Journal of the
Institute of Civil Engineers, Vol. 35, No. 4, Feb. 1951,
pp. 262-298.
10. HOGNESTAD, E., "A Study of Combined Bending and Axial
load in Reinforced Concrete Members". The Reinforced
Concrete 'Research Council of the Engineers Foundation,
Bulletin No. 1, June 1951.
11. PARME, A.L., A discussion of "Review of Research of
Ultimate Strength of Reinforced Concrete Members" by
C.P. Seiss. Proceedings A.C.I. Journal, Vol. 48, No. 10,
June 1952.
12. HOGNESTAD, E., "Inelastic Behaviour in Tests of
Eccentrically-Loaded Short Reinforced Concrete Columns".
The Reinforced Concrete Research Council of the
A3
Engineers Foundation, Bulletin Noo 2, Octo 19520
130 BAKER, AoLoLo, "Further Research in Reinforced Con
crete and its Application to Ultimate Load Design"o
Proceedings of the Institution of Civil Engineers,
Part III, Volo 2, Augo 1953, PPo 269-3100
14 o MORICE, Po Bo, and BASE, Go Do , "The Design and Use of
a Demountable Mechanical Strain Gauge for Concrete
Structures"o Magazine of Concrete Research, Volo 5,
Noo 13, Augo 1953, pp. 37-420
150 LEE, LoHoNo, "Inelastic Behaviour of Reinforced
Concrete Members Subjected to Short-time Static Loads".
Proceedings A.S.CoEo Journal, Vol. 79, Separate No. 286,
Sept. 1953.
16. SMITH, GoMo, and YOUNG, LoEo, "Ultimate Theory in
Flexure by Exponential Function"a Proceedings AoC.I.
Journal, Vol. 52, Noe 3, Novo 1955, PPo 349-3600
17. CHAN, WoWoL., "The Ultimate Strength and Deformation
of Plastic Hinges in Reinforced Concrete Frameworks".
Magazine of Concrete Research, Volo 7 7 No. 21, Nov.
1955.
18. HOGNESTAD, E., HANSON, NoWo, and McHENRY, D., "Con-
crete Stress Distribution in Ultimate Strength Design".
Proceedings A.C.I. Journal, Vol. 53, No. 4, Dec. 1955,
PP• 455-479"
19. BAKER, AoL.L., "The Ultimate Load Theory Applied to
A4
the Design of Reinforced and Prestressed Concrete
Frames". Concrete Publications Limited, London, 1956.
20. McHENRY, D., and SHIDELER, J.J. "Review of Data on
Effect of Speed of Testing of Concrete". Portland
Cement Association, Research and Development Laborator
ies, Bulletin D9, 1956.
21. MATTOCK, A.H., "The Strength of Singly-Reinforced
Beams in Bending". Cement and Concrete Association.
Proceedings of a symposium on "The Strength of Concrete
Structures". London, 1956.
22. KHAN, N .. M., and MATTOCK, A.H., "An Experimental
Investigation of the Influence of a Plastic Hinge on
the Shear Strength of a Singly Reinforced Concrete Beam11•
Magazine of Concrete Research, Vol. 8, No. 24, Nov. 1956.
23. SMITH, G.M., and YOUNG, L.E., "Ultimate Flexural
Analysis Based on Stress-Strain Curves of Cylinders".
Proceedings A.C.I. Journal, Vol. 53, No. 6, Dec. 1956,
pp. 597-610.
24. HOGNESTAD, E., "Confirmation of Inelastic Stress
Distribution in Concrete". Proceedings A.S.C.E. Journa~
Vol. 83, No. ST2, Mar. 1957.
25. ERNST, G.C., "Plastic Hinging at the Intersection of
Beams and Columns". Proceedings A.C.I. Journal,· Vol.
53, No. 12, June 1957, pp. 1119-1144.
26. VELETOS, A.S., and NEWMARK, N.M., "Effect of Inelastic
Behaviour on the Response of Simple Systems to
AS
Earthquake Motions"o Proceedings Second International
Conference of Earthquake Engineering, Tokyo, Volo II,
19600
2 7 o KRIZ, Lo B. and LEE, So L. , "Ultimate Strength of Over
Reinforced Beams 11o Proceedings A.S.C.Eo, Vol. 86,
Noo EM3, June 1960.
" 28. RUSCH, Ho, "Researches Towards a General Flexural
Theory for Structural Concrete"o Proceedings A.C.Io
Journal, Vol. 57, Noa 1, July 1960.
29. BLUME, JoA., NEWMARK, NoM., and CORNING, LoHo "Design
of Multistorey Reinforced Concrete Buildings for
Earthquake Motions". Portland Cement Association,
1961.
30. BRESLER, Bo, and GILBERT, PoH., "Tie Requirements for
Reinforced Concrete Columns". Proceedings A"C"I"
Journal, Vol. 58, No. 5, Nov. 1961, pp" 555-570.
31. Seismology Committee, Structural Engineers Association
of California, "Recommended Lateral Force Requirements
and Commentary". 1967, 90 pp.
"Load-Deformation
Characteristics of Beam-Column Connections in Rein
forced Concrete". Civil Engineering Studies, Struc
tural Research Series No. 234, University of Illinois,
Jan. 1962.
3 3 • BROCK , Go , "Concrete: Complete Stress-Strain Curves""
Engineering, Volo 193, May 1962, pp. 606-607.
A6
34.. LIEBENBERG, A .. Co, "A Stress-strain Function for
Concrete Subjected to Short-Term Loading" .. Magazine of
Concrete Research, Vol .. 14, Noo 41, July 19620
350 CHAN, WoWoLo, "The Rotation of Reinforced Concrete
Plastic Hinges at Ultimate Load"o Magazine of Concrete
Research, Volo 14, Noo 41, July 19620
360 YAMASHIRO, Ro, and SEISS, CoPo, "Moment-Rotation
Characteristics of Reinforced Concrete Members Sub
jected to Bending, Shear and Axial Load". Civil
Engineering Studies, Structural Research Series No. 260,
University of Illinois, Dec. 1962. II II
370 RUSCH, Ho, and STOCKL, So, "Der Einflub von BUgeln und
Druckst~ben auf das Verhalten der Biegedruckzone von
Stahlbetonbalken". Hefto 1480 Berlin, 1963"
380 AoCoio Standard Building Code Requirements for Rein
forced Concrete, (A.Colo 318-63).
39. SINHA, B .. Po, GERSTLE, Ko Ho, and TULIN, L.G", "Stress
Strain Relations for Concrete Under Cyclic Loading".
Proceedings A .. C .. I .. Journal, Vol. 61, No .. 2, Feb. 1964.
40. DESAYI, P .. , and KRISHNAN, So, "Equation for the
Stress-Strain Curve of Concrete" .. Proceedings A.C.I.
Journal, Vol. 61, No. 3, Maro 1964, ppo 345-350.
41 .. SINHA, BoPo, GERSTLE, KoHo, and TULIN, L .. Go,
of Singly Reinforced Beams to Cyclic Loading".
"Response
Proceedings AoCoio Journal, Vol. 61, Noo 8, Aug. 1964.
42. MATTOCK, AoH., "Rotational Capacity of Hinging Regions
A7
in Reinforced Concrete Beams"o Flexural Mechanics of
Reinforced Concrete, Proceedings of the International
Symposium, Miami, Flao, 19640
430 BAKER, AoLoL", and AMARAKONE, A.MoN., "Inelastic
Hyperstatic Frames Analysis 11 o Flexural Mechanics of
Reinforced Concrete, Proceedings of the International
Symposium, Miami, Flao, 19640
44 o AOYAMA, Ho , "Moment-Curvature Characteristics of
Reinforced Concrete Members Subjected to Axial Load
and Reversal of Bending"o Flexural Mechanics of Rein
forced Concreteo Proceedings of the International
Symposium, Miami, Fla., 1964.
450 ROY, HoE.H., and SOZEN, Mo A., "Ductility of Concrete" o
Flexural Mechanics of Reinforced Concrete. Proceedings
of the International Symposium, Miami, Fla., 1964.
46. BERTERO, VoV., and FELIPPA, C., Discussion to refer
ence 45.
470 BARNARD, PoR., "Researches into the Complete Stress
Strain Curve for Concrete". Magazine of Concrete
Research, Volo 16, No" 49, Dec. 1964.
480 FOX, L., "An Introduction to Numerical Linear Algebra".
Oxford University Press, 1965.
49. SINGH, A., GERSTLE, K. Ho, and TULIN, L. G. , "The
Behaviour of Reinforcing Steel Under Reversed Loading".
Journal A.S.T.M., Matierals Research and Standards,
Vol. 5, No. 1, Jano 1965.
A8
50" AGRAWAL, GaLa, TULIN, LoGa, and GERSTLE, KoHo,
"Response of Doubly-Reinforced Concrete Beams to Cyclic
Loading"" Proceedings AaCoio Journal, Volo 62, Noa 7,
July 1965a ppo 823-8360
SL STURMAN, GaMo, SHAH, So Po, and WINTER, Ga, "Effects of
Flexural Strain Gradients on Microcracking and Stress
Strain Behaviour of Concrete"" Proceedings AoCaio
Journal, Volo 62, Noa 7, July 19650
520 BASE, G.D., and READ, J.B., "Effectiveness of Helical
Binding in the Compression Zone of Concrete Beams""
Proceedings AaCoI • Journal, Volo 62, No. 7, July 1965"
530 PRIESTLEY, MoJoNo, "Moment Redistribution in Pre
stressed Concrete Continuous Beams". Ph. D. Thesis,
University of Canterbury, Christchurch, New Zealand,
19660
54a AaC.Ia COMMITTEE 435, "Deflections of Reinforced Con
crete Flexural Members"" Proceedings AaCaI. Journal,
Volo 63, Noa 6, June 1966, pp" 637-6740
550 CORLEY, WoGo, "Rotational Capacity of Reinforced
Concrete Beams"" Journal of the Structural Division,
AaSaCaEa, Vol. 92, No. STS, Oct. 1966a
560 BURNS, NaH., and SEISS, CaPo, "Repeated and Reversed
Loading in Reinforced Concrete"" Journal of the
Structural Division, AaSaCaEo, Volo 92, No. STS, Oct.
19660
------, and 0 '
"Plastic Hinging in
A9
Reinforced Concrete", Journal of the Structural Divis
ion, AoSoCoEo, Volo 92, Noo STS, Octo 19660
580 CLOUGH, RoWo, "Effect of Stiffness Degradation on
Earthquake Ductility Requirements"o Report No. 66-16,
Structural Engineering Laboratory, University of
Californiao Octo 19660
590 WARWARUK, Jo, "Strength in Flexure of Bonded and
Unbonded Prestressed Concrete Beams 11 o Civil Engineer
ing Studies, Structural Research Series Noo 138,
University of Illinois, Augo 1967.
600 BENNETT, WoBo, PARME, A.Lo, HANSON, NoW., and
SBAROUNIS, JoAo, "Laboratory Investigation of Rein
forced Concrete Beam-Column Connections under Lateral
Loads".. Adaptation of a film script - detailed report
still being preparedo 19670
610 KALDJIAN, M.J., "Moment-Curvature of Beams as Ramberg
Osgood Function"o Journal of the Structural Division,
A.S.CoEo Vol. 93, Noo ~TS, Octo 19670
62. HANSON, N.W., and CONNER, HoWo, "Seismic Resistance
of Reinforced Concrete Beam-Column Joints"o Journal
of the Structural Division, A.S.CoEo, Volo 93, No. STS,
Oct. 19670 pp. 533-560.
6 3. ATCHLEY, W. L. , and FURR, H. L. , 11 Strength and Energy
Absorption Capabilities of Plain Concrete under Dynamic
and Static Loadings". Proceedings A. C. I. Journal, Vol.
64, No. 11, Nov. 1967.
A10
"The Flexural Stress-
Strain Relationship of Concrete Confined by Rectangular
Transverse Reinforcement"o Magazine of Concrete
Research, Volo 19, Noo 61, Deco 19670 ppa 223-2380
(Also, Private Communication)o
65a SHERBOURNE, AaNo, and PARAMESWAR, HoCo, "Limit Analysis
of Continuous Prestressed Beams"o Journal of the
Structural Division, AaSaCaE., Volo 94, Noa ST1, Jana
19680 pp. 19-400
660 NAWY, EoGo, DANESI, RoFo, and GROSKO, JoJo, "Rectang
ular Spiral Binders Effect on Plastic Hinge Rotation
Capacity in Reinforced Concrete Beams"a Proceedings
ACI Journal, Volo 65, Noa 12, Deco 1968, ppo 1001-10100
670 BERTERO, Vo, and BRESLER, Bo, "Seismic Behaviour of
Reinforced Concrete Framed Structures"o Paper presented
at the Fourth World Conference on Earthquake Engineering,
Chile, 19690
680 AoCoio COMMITTEE 439, "Effect of Steel Strength and of
Reinforcement Ratio on the Mode of Failure and Strain
Energy Capacity of Reinforced Concrete Beams"o Proc
eedings AoCoio Journal, Volo 66, Noa 3, March 1969, ppa
165-1730
69a AoCoio - AoSoCoEo Committee 428, "Progress Report on
Code Clauses for Limit Design"o Proceedings AoCoio
Journal, Volo 65, Noo 9, Sept. 1968, ppo 713-7190
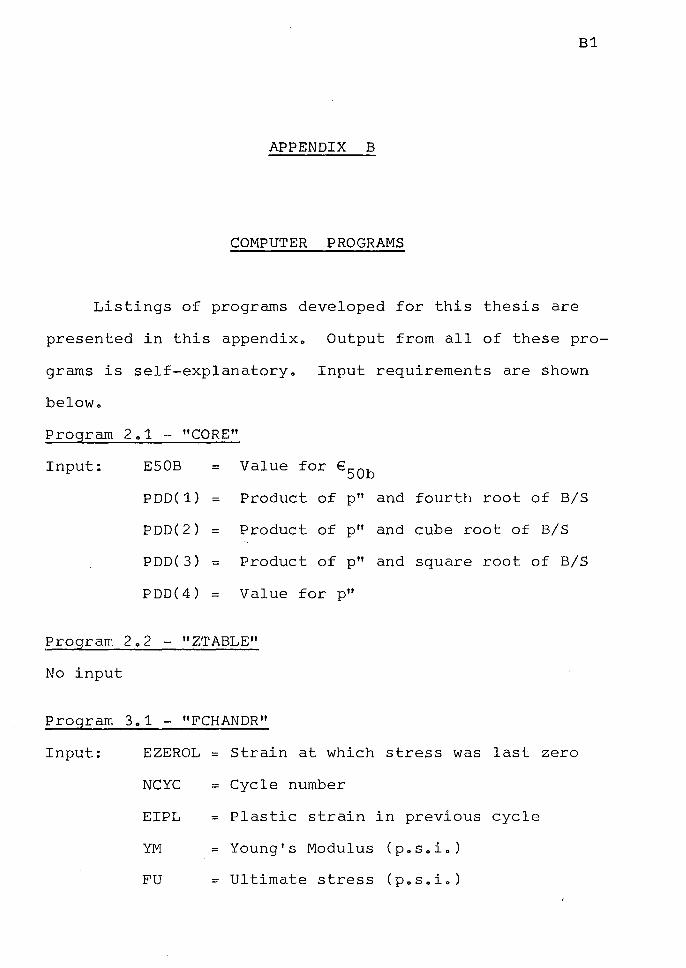
B1
APPENDIX B
COMPUTER PROGRAMS
Listings of programs developed for this thesis are
presented in this appendixo Output from all of these pro
grams is self-explanatoryo Input requirements are shown
belowo
Program 2o1 - "CORE"
Input: E50B = Value for ESOb
PDD(1) = Product of p"
PDD(2) = Product of p"
PDD(3) = Product of p"
PDD(4) = Value for p"
Program 2 o 2 - "ZTABLE"
No input
Program 3o1 - "FCHANDR 11
Input: EZEROL = Strain at which
NCYC = Cycle number
EIPL = Plastic strain
YM = Young's Modulus
FU = Ultimate stress
and fourth root of B/S
and cube root of B/S
and square root of B/S
stress was last zero
in previous cycle
(poSoio)
(poSoio)
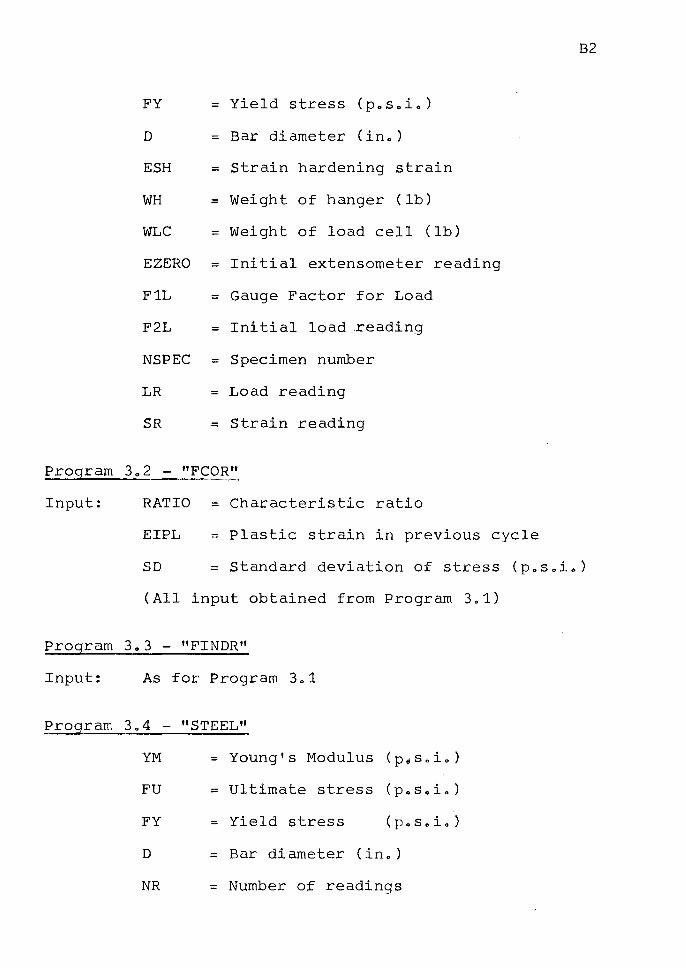
B2
FY = Yield stress (posoio)
D = Bar diameter (in.)
ESH = Strain hardening strain
WH = Weight of hanger (lb)
WLC = Weight of load cell (lb)
EZERO = Initial extensometer reading
F1L = Gauge Factor for Load
F2L = Initial load .reading
NSPEC = Specimen number
LR = Load reading
SR = Strain reading
Program 3o2 - "FCOR"
Input: RATIO = Characteristic ratio
= Plastic strain in previous cycle EIPL
SD ~ Standard deviation of stress (posoi~)
(All input obtained from Program 3.1)
Program 3o3 - "FINDR"
Input: As for Program 3.1
Program 3.4 - "STEEL"
YM = Young's Modulus (p~s.io)
FU = Ultimate stress (p.soio)
FY = Yield stress (p.s.i.)
D = Bar diameter (in. )
NR = Number of readings
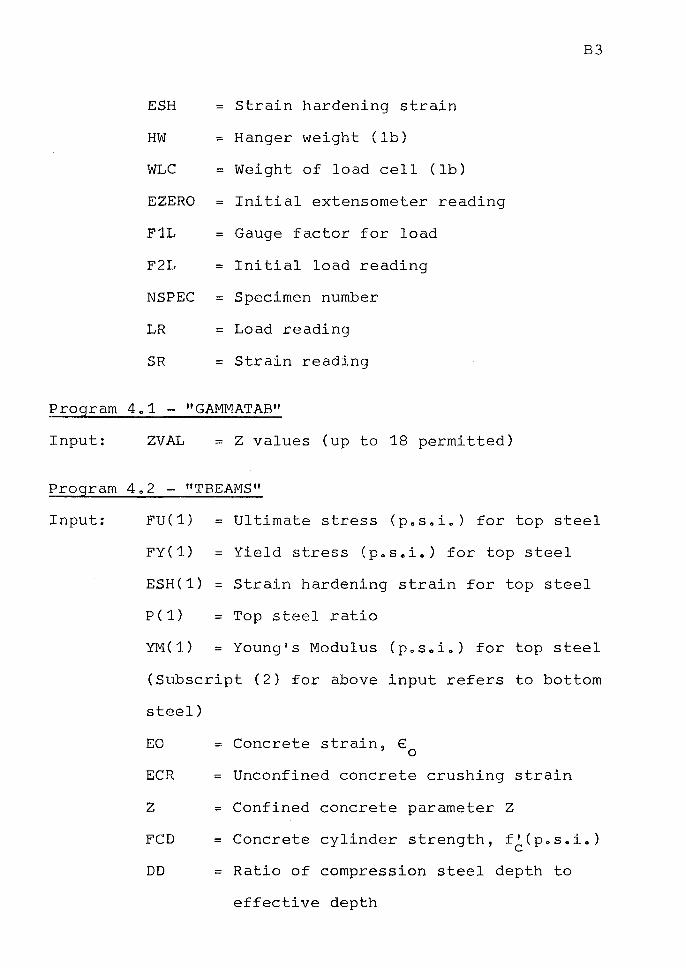
B3
ESH = Strain hardening strain
HW = Hanger weight (lb)
WLC = Weight of load cell (lb)
EZERO = Initial extensometer reading
F1L = Gauge factor for load
F2L = Initial load reading
NSPEC = Specimen number
LR = Load reading
SR = Strain reading
Program 4o1 - "GAMMATAB"
Input: ZVAL = Z values (up to 18 permitted)
Program 4o2 - "TBEAMS"
Input: FU(1) = Ultimate stress (posoio) for top steel
FY(1) = Yield stress (posoio) for top steel
ESH(1) = Strain hardening strain for top steel
P(1) = Top steel ratio
YM(1) = Young's Modulus (pos.io) for top steel
(Subscript (2) for above input refers to bottom
steel)
EO = Concrete strain, € 0
ECR = Unconfined concrete crushing strain
z = Confined concrete parameter z
FCD = Concrete cylinder strength, f' (p.s.i.) C
DD = Ratio of compression steel depth to
effective depth
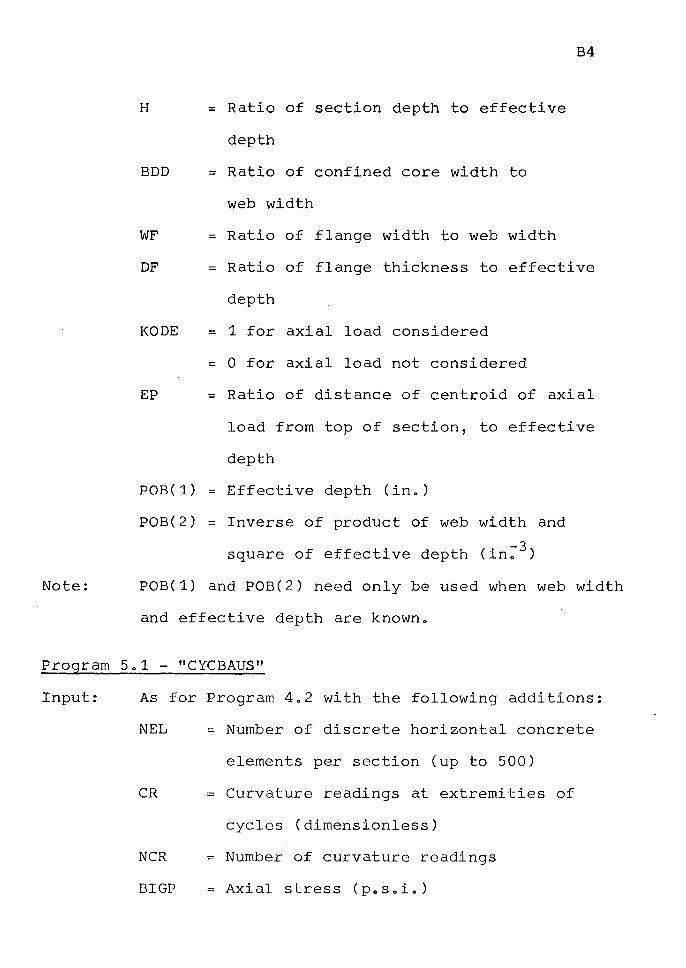
Note:
B4
H = Ratio of section depth to effective
depth
BDD = Ratio of confined core width to
web width
= Ratio of flange width to web width WF
DF = Ratio of flange thickness to effective
depth
KODE = 1 for axial load considered
= 0 for axial load not considered
EP = Ratio of distance of centroid of axial
load from top of section, to effective
depth
POB(1) = Effective depth (in.)
POB(2) = Inverse of product of web width and
square of effective depth (in; 3 )
POB(1) and POB(2) need only be used when web width
and effective depth are known.
Program 5.1 - "CYCBAUS"
Input: As for Program 4.2 with the following additions:
NEL = Number of discrete horizontal concrete
elements per section (up to 500)
CR = Curvature readings at extremities of
NCR
BIGP
cycles (dimensionless)
= Number of curvature readings
= Axial stress (posaio)
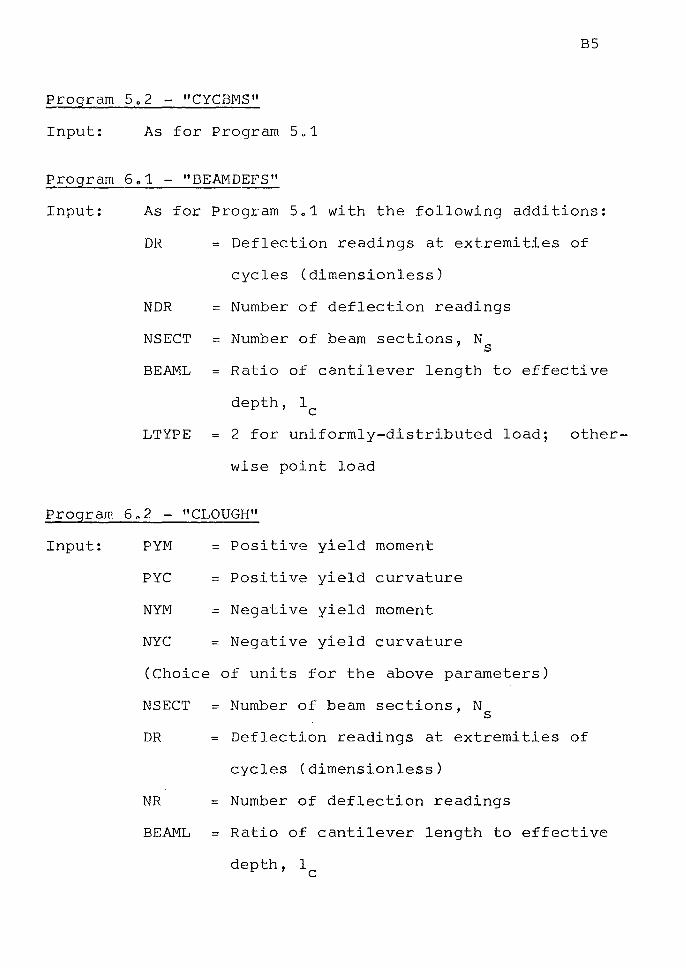
BS
Program 5o2 - "CYCBMS"
Input: As for Program 5o1
Program 601 - "BEAMDEFS"
Input: As for Program 5o1 with the following additions:
DR = Deflection readings at extremities of
cycles (dimensionless)
NDR = Number of deflection readings
NSECT = Number of beam sections, N s
BEAML = Ratio of cantilever length to effective
depth, 1 C
LTYPE = 2 for uniformly-distributed load; other-
wise point load
Program 6a2 - "CLOUGH"
Input: PYM
PYC
NYM
NYC
=
=
=
==
Positive
Positive
Negative
Negative
yield moment
yield curvature
yield moment
yield curvature
(Choice of units for the above parameters)
NSECT = Number of beam sections, N s
DR = Deflection readings at extremities of
cycles (dimensionless)
NR = Number of deflection readings
BEAML = Ratio of cantilever length to effective
depth, 1 C

B6
Program 7o1 - "DATATEST"
Program 7o2 - "BEAMTEST"
Program 7.3 - "INCLINO"
Program 7.4 - "DATALIST"
As these programs were written for the test beams of the
experimental programme, instructions for their use have
not been includedo
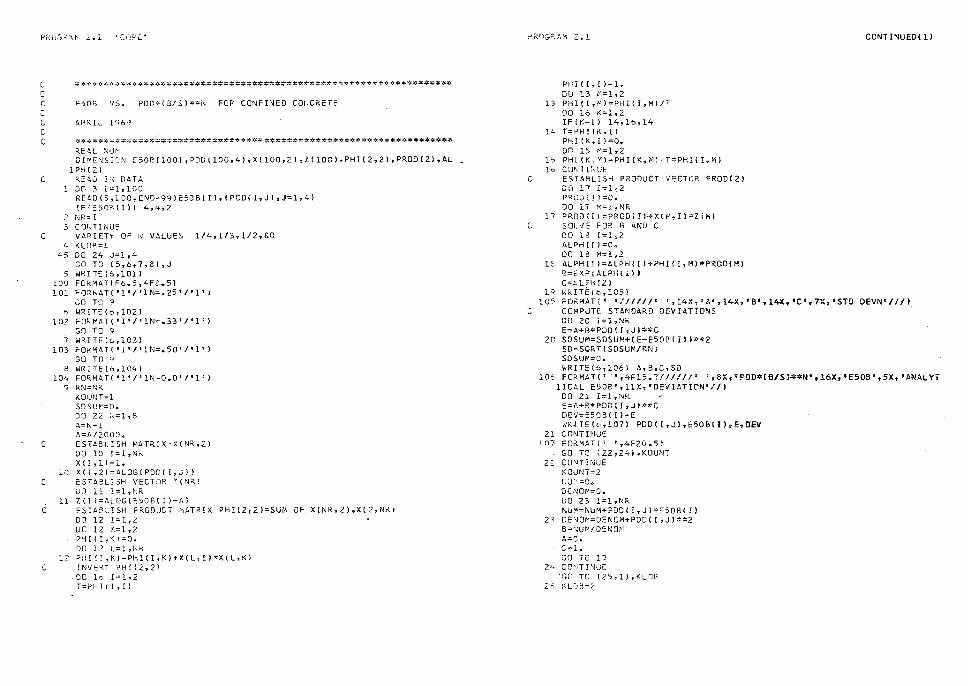
PROG~~M ~.l 'CGP~~
C ******~****************************************~****************** C C E50B VS. PDD*(B/Sl••N FOR CONFINED CO~CRETE C C APRIL l'ng C C *************************~****************************************
RE ~L flU~ DIMEN~l"N E50~11001 ,PDDl100,4),X(l00,2l,Zll0Cl,PHI(2,2l,PRODl2l,AL
1PHl2l C READ I~ DATA
2 3
C 4
45
5 100 101
h
102
7 103
e 104
9
DO 3 I=l,100 RE40(5,100,END=99)E508(Il,!PCD!I,Jl,J=l,4l IFl~508(lll 4,4,2 NR=l C • r, TI i,U" VAPIETY OF N VALUES 1/4,1/3,1/2,&0 KLOP=l DO 24 J=l,4 GO TO (5,6,7,8!,J WR I TE ( 6, l 01 l FORMAT(Fo.5,4F8.5) FORl•iATl'l'/'lN=.25'/'l' l GO TC 9 WRITEl6,102) FORMAT( 'l'/'lN=.33'/'l'l GO TO 9 WRITi'(b,103) FOKM~T! 'l'/'lN=.50'/'1' l GO TO q
WRITE(o,104) FOD..MAT{ •1•I 1 1N=0.0 1
/ 1 l 1}
RN=NR KOUtJT=l sosur=o. DO 22 ;,=1,8 A=f\/-l A=A/2000.
C ESTABLISH MATRIX·X(NR,2) 00 10 !=1,NK X(I ,ll=l.
1n X(l,2l=ALOG(PDD!I,Jll C ESTABLISH VECTOR Z!NRl
DO 11 1=1,NR 11 Z( I l=ALOG(ESOE,! I )-Id
C ESTABLISH PRODUCT MATRIX PH!(2 1 2l=SUM OF XINR,2l.X12,NRI DO 12 I=l,2 . DO 12 K=l,Z PHIII,K!=O. DD 12 L=l,Nl-l
12 PHI !I,Kl=PHIII,Kl+X(L,ll*X(L,K) C !NVEqT PH!(2,21
DO lo I=l,Z T=PHl!l,11
P~ClG=!.A/"1 2 .. l CONTINUED Ill
C
C.
C
13
l '-
1 'o lo
17
lS
l C/
10:o
PHI( l, I )=l. DD 13 '1=1,2 PH!(l,Ml=PHI(l,M)/T DO 16 K=l,2 IF (K-1 l 14,16,14 T=PHI(K,IJ PH I [ K, l l =O. DO 15 M=l,2 PHI (K, n=PHI (K, Ml-T*PHI ( I, Ml COf\!TI'.>JUE ESTABLISH PRODUCT VECTOR PROD(Zl DO 17 I=l,2 PROD(l)=O. 00 17 '."i=l ,NR PROD(il=PROD(Il~X(M,Il•Z!Ml SOL1E FOR BAND C 00 18 I=l,2 ALPrl(! !=C. 00 18 M=l,2 ALDH{!l=ALPH(Il+PHil!,Ml*PROO(Mj 9=CXPtALPH(l}) C=ALPrH Z l 1;RITE,o,105l .-ORMAT f' '/ / / /// • ', l4X, •A', 14X, '8', 1',.J(, •c•. 7X, 'STD DEVN' ///I COMPUTE STANDARD DEVI~TIONS DO 20 1=1,NR E=A+B*POD!l,Jl**C
20 SDSUM=SOSUM+{E-E50B(lll**Z SD=SQRT(SDSUM/RNl SDSU~=O. WRITE(&,106) A,B,C,SO
10~ FORMAT(' ·•,4Fl5.7//////' ',8X,'PDD*(B/Sl**N",l6X,•ESOB 1 ,SX,'ANALYT l!CAL ESOB',llX,'OEVIATION'//J
00 21 1=1,Nft E=A+B*PDO(I,Jl*•C DEV=E50B(Il-E lvRlTE(b,107) PDOCI,Jl,E50B1Il,E,OEV
21 CONTI"liJE 107- FORMAT(' ',4F2u.5l
GO TO (22,241,KDUNT 2: C0'1TINUE
KOUNT=2 l•lUi=O. DENO"=O. DO 23 I=l ,NR NUP=N~M+PDDII,Jl•ESOBl!I
2~ DE~D"=DENOM+PDD(!,Jl**2 B=•~Uit' / DEN OM A=O. C=l. GO TO 19
Z'- co>nr:,uE ·GO TC (25,ll,KLOG
z.:; KLC•B=Z
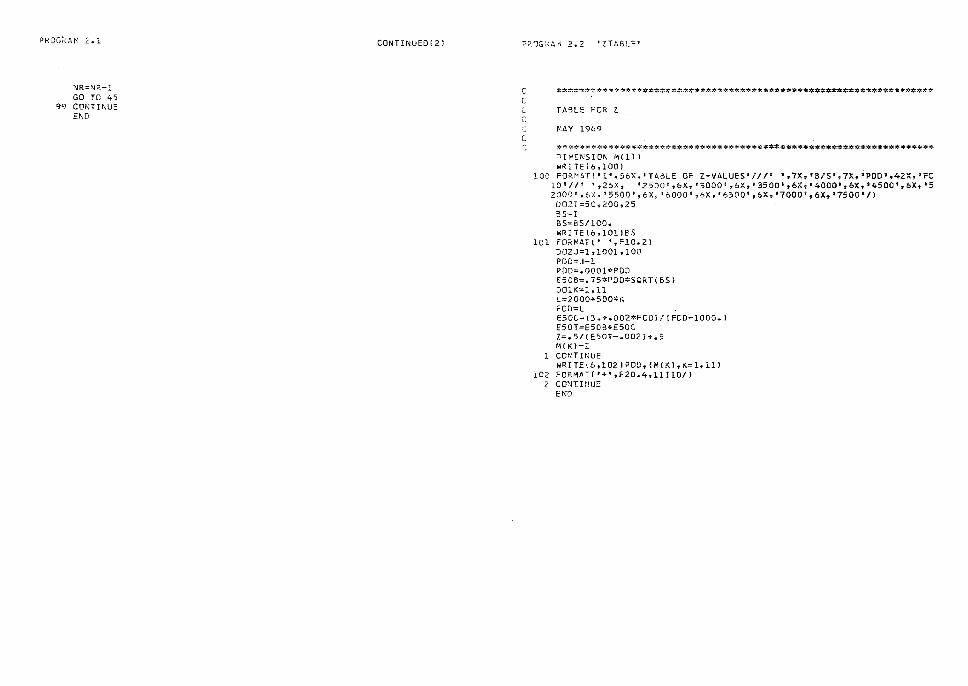
PROG"AM 2.1
NR=NR-1 GO TO 45
99 CONTINUE HJD
CONTINUED ( 2 l P~~G~AM 2.2 'ZTABLE'
C
****~*************************************##*~*******************
TABLE FOR Z
~.AY 1969
: ********************~***~*************#--$"*******~*~*********** DIMENSION M(ll)
wRITEl6,100l 100 FORM"T('l',56X,•TA8LE OF Z-VALUES'///' ',7X,•B/S',7X,'PDD 1 ,42X,•FC
10 1 //~ 1 ,26X, '2500' ,6X-, '3000 1 ,.6X,' 3500',6X., 0 4000 11 ,6X1' 1 4500',6X, '5 200/J', 6>(, '5500', 6X, '6000' ,6X, '6500', 6X, '7000', 6X, '7500' /) 002!=50,200,25 BS=T BS=BS/100. WRITE(6,l0118S
101 f'Oi<MAT(' ',Fl0.2) OOZJ=l,1001,100 PDD=J-1 POO=.OOOl*POO E50B=.75*POD*SORTCBSI DOlK=l,11 l=2000+500"'1, FCO=L E50C=(3,+.002*FCDl/(FCD-lOOO.J E50T=E50B+E50C Z=.5/(ESOT-.002)+.5 M(Kl=Z co,JTINUE WRITEl6,102lPOD,(M(Kl,K=l,lll
102 FORMAT('+',F20.4,llll0/l Z CONTINUE
END
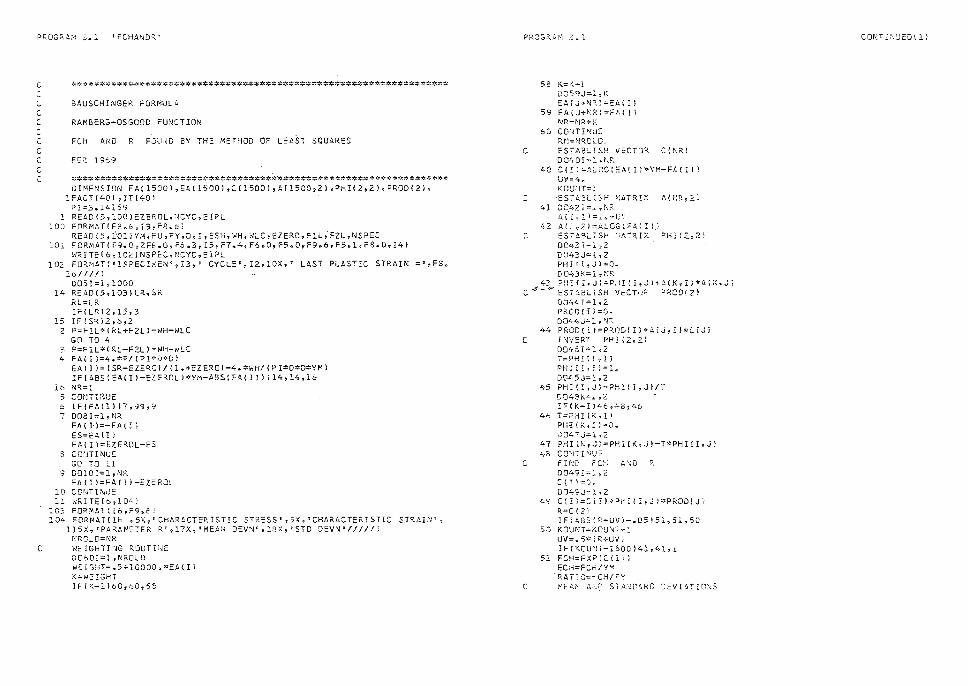
P~OGRA~1 3~1 1 FCHANDR"
C ~
C ~
C C C C
C
******************************~***************************~**#**
BAUSCHINGER FORMULA
RAMBERG-OSGOOD FUNCTION
FCH AND R FOUND BY THE METHOD OF LEA~T SQUARES
FEo 19~9
~:*********#***~;*~':*************************;,)::*********************~ DIMENSION FA(l500l,EA11500l,C11500l,All500,2J,PHI!2,21,PROOl2l,
lFACT{40J ,;T(40l P!;3.14l59 READl5,l00JEZEROL,~CYC,EIPL
100 F•RMAT(F8.6,I3,F8.6l RE.40 i5, i''Ol i YM, FU 7 FY vD, I, ESH, WH, WLC, EZERO, Fll,.FZL, NSPEC
101 FORMAT(F9.0,2F8.0,F6~3,I5~F7~4,F6.0,F5 .. 0rF9.6,F5el,F8.0,I41 WR!TElb,l02JNSPEC,NCYC,EIPL
102 Fo::,MAT( 1 lS?ECI,"lENt,J3,~ CYCLE;,I2,10X, 1 LAST PLAST:c STRAIN :t,-FS.., lb/I/!) 0051;1,1000
14 READ(5,103JLK,SR RL=LR IFlLRIZ,15,3
15 IF {SR)2,6,2 2 P=Fll*IR~+FZLJ-WH-WLC
GO TO 4 3 P=FlL*(RL-F2L)-WH-WLC 4 FA1!)=4.•PIIPI*D*Dl
EAIJ);(SR-EZERO)/(l.+EZEROl-4.•nH/(Pl*D*D*YMl IF(ABSIEA(IJ-EZERDLl*YM-A9S(FA(l)lll4,l4 1 l6
it- NR=I s corirrNuE 6 !F(FA(ll l7,J9,9 7 D08I=l,11R
FA(l);-FA(I) ES;EAII) EAIIJ=EZEROL-ES
0 crnHINUE GO TO 11
9 0010!=1,NF. EA(Il=EAl!i-EZcROL
10 CONTINUE ll WRITEl6,l04)
103 FORMAT(l6,F9~6! 104 FORMAT[lH ,sx,•CHARACTERISTIC STRESS',5~,•CHARACTERISTIC
11sx~•PARAMETER R:,17X,'MEAN DEVN',18X,'STD DEVN~/////) MROLO=NR WEIGHTING ROUTINE D0':>0l=l,NROLO WEIGHT=.5+10000 • *EA{II K=WE!GHT !F(K-l)b0,60,5!;
STRAINr1
PR:JG?..MM 3 .. 1
58 K=K-1 D05qJ=-l,K EAi J+NRl=EA( I l
59 FAIJ+N~l=FAl!I f\JR=NR+K
60 COfffINUE RrJ;f-!RDi..0.
C ESTABLISH VECTOR CINR! 084QI::::.:_ ,r-,:r-.
40 C{~)=~LCG~~A{I)*VM-FA{I)} UV=4, KO:J:".J\=l ESTAGL!S~ ~:ATRIX A(NR~2;
41 DQ42l=l .,NS A\ I~ l I =l.,,-t;t·
42 A(I ,2)==AL.0G{FA~ ! ! I ESTABLISH ~1ATRIX PHI(2,21 DC43i:=l,2 D0L,3J=l, 2 PHI{I-:J1-=0.,..
·D0~-3~=1 rt-1~ 43 ?Hill,Jl=PH!ti,J)+AiK,Il*A(K!Jl
:, -d----,? ES1~ . .'3LISH VECTOR PRC:)\ 2~
C
~
0044.I=l,2 PRCO(IJ=G, D044J=l ~ r~r:_
44 PROD( 1 J=PP.OD( I )+A{J 11 I }*C{JJ
INVERT PHI \2,21 0048I=l,2 T=PH!tr~r, PHil!sil=L. DOL15J=l'.12
45 PHI!I,JJ=PHI(I,J}/T D04BK==..1.. ~z !i=(K-iJ461143,4b
46 T=?Hll~,11 PH! {K-, 1 )=Ci .. D047J=lv2
47 ?Hl(K,JJ;pHI(K,J)-T*PHitI,J; ~~ crn\1; ! r\1u E
FIN~ FC~: AND R D049I;l,2 C ( I J ::::8 ~ DD49J=l,2
49 C[IJ=Ci!)+?HI(I9J)=PROO{J~ R=C(2) IF[A5S{R-UV)-.0515l 11 5l,50
50 KOUNT=KOUN~+: UV=.S*lR+UVl !F[~OUNT-1500}4lf4171
51 FCH=EXP(C(lll ECH=FCri/V~ RATTO=+-CH/-fY MF4N AND STA!~D~RG OEVIATIO~S
CONT: ~·:UED ( l:
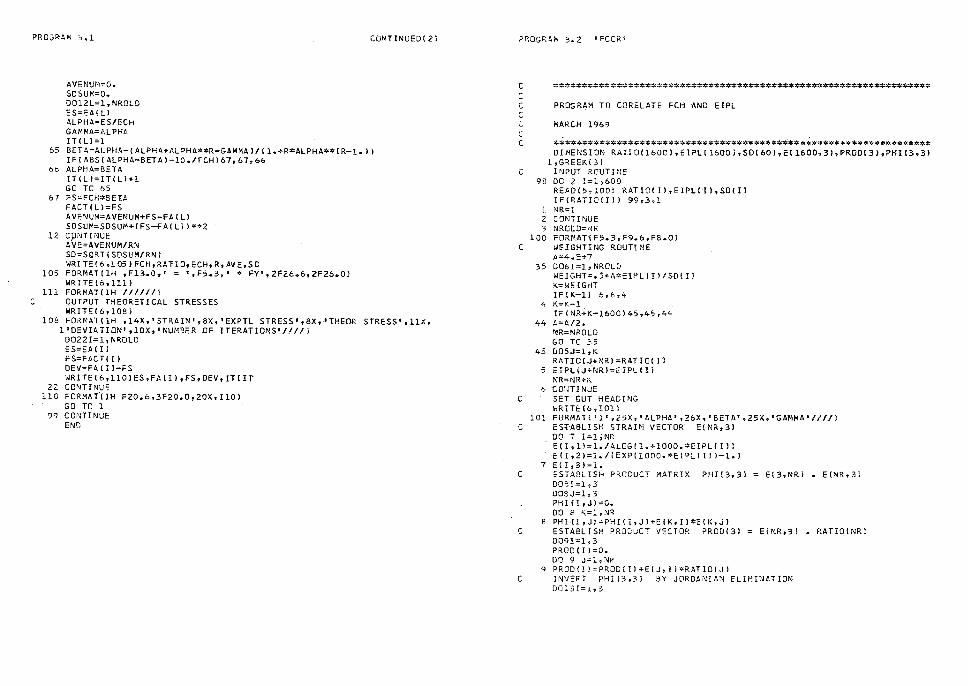
PRO.,RAM :;.1
AVENUM=O. SOSU~=O. D012L=l,NROLO ES=EA(L) ALPHA=ES/ECH GAMMA=ALPHA ITI Ll=l
CONTINUE0(2l
65 BETA=ALPHA-(ALPHA+AlPHA**R-GAMMAl/11.+R*ALPHA**IR-l.l) IF!ABS(ALPHA-BETA)-lO./FCHl67,67,66
66 ALPHA=BETA ITILl=ITILl+l GO TO 65
67 FS=FCH*SETA FACT I Ll=FS AVENUM=AVENUM+FS-FA!Ll SDSUM=SDSUM+IFS-FA1Lll**2
l2 cpNTINUE AVE=AVENUM/RN SD=SQRTISDSUM/RNl WRITE I 6,105 J FCH, RAT! D, ECH, R, AV E,SD
105 FORMAT(lH ,F13.o,• = •,FS.3,' * FY',2F26.6,2F26.0l WR I TE ( 6, 111 l
111 FORMATllH /Ill/I) C OUTPUT THEORETICAL STRESSES
WRITEl6,108l 108 FORMAT(lH ,14X,'STRAIN',8X,'EXPTL STRESS•,ax,~THEOR STRESS',llX,
1 1 DEVIATION',10X, 1 NUMBER OF ITERATIONS'////) D0221= 1, NROLO ES=EAIII FS=FACT(Il DEV=FA ( I l-FS WRITEl6,llOJES,FAIIl,FS,DEV,ITCif
22 CONTINUE 110 FORMAT-(lH F20.6,3F20.0,20X, IlOl
GO TC 1 9g CONTINUE
END
PROGRAM l.2 •FCOR•
C C
***************************************:COC:*****:i~~*************~***
C PROGRA1-1 TO CORELATE FCH AND EIPL C
MARCH 1%9 C
C ****#.:c:.*******************~*************:ICc"********:~*********~***** DI~ENSION RATIO(l600l,EIPL!l600l,S0[60l,Ell600,3l,PRODl3l,PHil3,3l
l,GREEK(3l C INPUT ROUTINE
98 DO 2 I=l,600 READl5,100l RATIO! ll,EIPLCil,SD(ll IF(RATIO(lll 99,3,l
i _NR=! 2 CONTINUE 3 NROtD=NF.
100 FORMATIF5.3,F9.6,F8.0J C WEIGHTING ROUTINE
A=4.E+7 :.;5 D061=1,NROLD
WEIGHT=.S•A*EIPL{Il/SO(Il K=WEJ:GrlT IF!K-ll c,6,4
<... K=K-1 IF{NR+K-1600)45,45,44
44 A=A/2_. NR=NROLD GO TO .o5
45 D05J=l,K RATIOIJ+NRl=RATIOlll
5 EIPLIJ+NRl=EIPLlll NR=NR+K
6 -CO'HINUE C SET OUT HEADING
WRITEl6,10ll 101 FORMATl'l',25X, 1 ALPHA 1
1 26X,'BETA 1 ,25X,'GAMMA 1 ////I C ES'f·ABL!SH STRAIN VECTOR" E(NR,3)
00 7 I:ljNR E(I,ll=l./ALOGll.+1000.*EIPL(Ill E II ,2)=1,/(EXP(lOOO.*ElPL( Il l-1.J
7 Et !,31=1. C ESTABLISH PRODUCT MATRIX PHI13,3l = E(3,NRI • ECNR,31
D08!=1,3 DOSJ=l, 3 PH I {II J) =O. DO 8 K=l,NR
8 PHIII,Ji=PHI(I,Jl+E(K,ll*E(K,Jl C ESTABLISH PRODUCT VECTOR PRODl3l = EINR,31 • RATlO(NR!
0091=1,3 PROD(I)=O. DO 9 J=l,NP.
q PRODl!l=PROD{ll+E!J,ll*RATIO(Jl C INVERT PH!(3,3J SY JORDANIAN ELIMINATION
D0131=1,3
PROGF:Ati: .:So2
T=PHI{l,I) PHI!I,ll=l. DOlOJ=:,3
10 PHIII,JJ=DHI!I,JJ/T D013K=l-~3 IF[K-ll 11,13,l!
11 T:::;PHI{K']ij PHI(K.,I)=O .. D~l2-1=1,3
l2 PHl(K,Jl=PHl!K,Jl-T*PHl(I,Jl 13 C0i\'.T:iNUE
C SOLVE FOR ALPHA, BETA ANO GAMMt 00141=1-,3 GRE~K(Il=O~ D014J=l,3
lL GREEK(Il=G~EEK{IJ+?H:(l,Jl~PROCtJJ ALPHA=GP.!:EK l l l 3':'TA=GREEK(2) Ga.MMA=GREEK(3) l·iRiTC{6,l02J {GREEK{ I), I=l?31
102 FO>,;>AT(lH ~4F30.6/l//l C OUTPUT FOR CURijE
WR!TE(o,103) 103 FORMATflH ,9X,~STRAIN',10X, 1 RAT!Og///l
DCl5I=lt23 J=l-1 X=J/1000. IF(I-1)99,141,142
141 x=. 0001 142 Y=.t.LPHt\/ ALOG( 1 .. +1000 "*X) +BETA/ { CXP ( l 000 4l*X }-1 o) +G.AMMA
WRITE{b~l04) X.,Y 15 c• -~TlNUE
10~ FORMAT!lH ,2Fl5.6l \•WI TE ( o,105 J
-105 ror1.MATC'l'} GO TO 98
99 CONTINUE ENLJ
CONTINUED{!} P%0GRAM ·3.3 ~FINJ~r
,,;:;,;_,_* A....,****::::V*~;;-:~ -~::=**~;(< -;..!c:.';.:::;,. :'· ~ :::::-:.~·**~~::;.,,J• . ***:-'.'¼ :<::~;*__.,.::'~:...:~::,,\:· ,:·7· ::;.;:7•··.-.::;:··· ✓-:,: ••
~
C ~AUSC~1I~GER FO~MULA
KNG\tJii,IG FCH -FIND R
C Mt~C~. 1969 C C, ..¢..,";:.;_.::,:::;:.=.:.:::_*~".r-:..',..4*::;:.-,::.;;:.,.;:. •-~';!;.~c!.,.~:.';:.:C,:"';':.:';:,;:-:;:,-:., .• ~-:.;',.:¢.~.-+ •. ~~ S·~~-;_., -.,...,,,."<':;~~::,":#,';;•,._#*:¢Y'*~-:,;_-:t:~,:;:!.;.::.:: -j .:~-:
D!MENS!ON FA[l?50!,EAt195Q;~FEll930J~STRZ1~501,?ACTf5QJ PI:;:3..,J.~-179
l KE,.\~(5;-lOOJ'.:ZEl<OL .. f,lC"YC::::I?L lGO FO~NAT{FS~6,I3,F~~&~
RE~D!3~lO!~Y~~FU~FY O,: S ~H;~L:~EZERO,Fl~7F2~,NS?EC 101 ~•~~jT{F9oO 2F3QO,F o3~ 7~~,~6~G~F5¥0,F9o67F5~l~FSo0,!43
~RITE(65~02 NS~EC,N YC, 102 FO~MATC'lSP CI~2N~, 3~~ ~E~~!ZJ10~,~LA5! ?L~Sr!: ST~LlN =~ 7 F8ab
1/l//) DC5I=l,2.GOO
1-~ READi5,l03~LRY;R C.:.i..--=i....q_ r:={L~,2"'l'1s~2
15 1;::rs~)21,o,2 2 P=Fll*{RL~FZLI-WK-NL~
GO TC 4 ~ P=Fll~{RL-F2~)-WH-~LC 4 FAll)=~.•?/(PJ•D•Dl
E~!Il=lSR-ElEROJ/[:~ • ~ZE~Ol-~s~WH/(?!*D~D~YN) IF C :l!:5 t EA{ I )-ElEROL i '~YV:-,6.P,S \FA! 1J;;,141 1~ 11 .:-,5
45 NF.=I 5 C0NT!:\JUC.
IF{FA~lJ )7, '.99,-S 7 DD.31 =11' :\;R.
F4{11=-FA{!} ES=i::Al!J EA[l)=EZ:CROL-ES
s co::.rrrr,iuE GO TO 11
~ 001 O:=l,f,IR EACI>=El~Il-EZEROL
10 CONlI!\iU=. j_ l ~•J?,TTC ~ o? 104 ~
l03 FO~~AT[I6~F9eb) 104 FGRN~T{lH ,5x,~cH~~~=T=-~I3T:: STR~ss~,sx~ 9 CHAR!CTE~:STIC S7R~=~f:
.:15x,a?t1KAf,1f:TER R~,,l7X 11 !v1~.2.:--,: o::vNr :;_s;::,i,STD Di::\'N"/////~·
S F!TT!N: ROUTINE (,lRQ!_.:)=1•);.
'iHt=NRCJLt FCH=FY*f~744/ALOG(1.+lOOO-~~=~L)~~a?l/'.~~?i!CCOw*~!?L)-:~)+~2~1; IF{FCH-?Y)57,57,56
5A FCH=FY 57 .P.A7IC=FS /FY
ECH=FC,,/ r,, C WEIGHT!~ ~OUTINE
PR.OGRAM 3.3
D0601=1,NROLD WElGHT=,5+10000.*EA!Il K='WEIGHT IF{K-1)60,60,5-S
58 K=K-1 D059J=l,K EA(J+NRl=EA{Il
59 FA(J+NRl=FA(Il NR=NR+K
60 CONTINUE C ESTABLISH STRESS VECTOR
D06iI=l,NR 61 STR(ll=ALDG!FA(I)/FCHl
CONTINUED! U
STR.(NRl
C ESTABLISH PRODUCT SCALAR PHl SUM OF STR(NRI • STRINRI PHi=O. 0062!=1,NR
6: PHI=PHI+STRIIl**Z C ESTABLISH STRESS AND STRAIN VECTOR FEINR)
00631=1,NR 6i FE(Il=ALOG(!EAlll*YM-FAIIll/FCHI
C FI ND R. R=O. 0064!=1,NR
6~ R=R+FE(IJ•STR{ll R=R/PHl
C FIND MEAN Al4D STANDARD DEVIATIONS AVENUM=O. SDSUl'=O. D012L=l, NROLD ES=EA[Ll ALPHA=ES/ECH GAr-<MA=ALPHA
65 BETA=ALPHA-f.ALPHA+ALPHA**R-GA~MAl/(l,+R*ALPHA*~(R-1.J l TF(ABS!ALPHA-BETA)-10./FCHl67,67,66
66 ALPHA=BETA GO TC 65
67 FS=FCH*BETA FACT( ll=FS AVENUM=AVENUM+FS~FA!Ll SDSUM=SDSUM+{FS-FA(Lll**2
12 CONTINUE A\'E=AVENUM/RN SD=SQRTISD~UM/RNi WRITE(6,105JFCH,RA•l0,ECH,R,AVE,SD
105 FORMAT(lH ,F:3.0,' =•,F6.3~• * FY',2F26.6,2F26.0I WRITE!6,llll
111 FORMAT(lH /ll!J/1 C OUTPU'T
vJRITE(o,1081 103 FORM,T(lH 1 l4X, 1 STRAIN' 1 8X,'EXPTL STRESS',BX,'THEOR STRESS',llX,
l'DEVIATION',////1 D0221=1,NROi..D ES=EA(l I
.FS=F~CT !Ii
PROGRld,,1 3,, 3
DEV=FA[l)-FS WRfTEl.6,llOJES,FAlI}?FS1DEV
22 CONTINUE 110 FORMAT[lH ,F20~6t3F20.0)
GO TC" 99 CONTINUE
END
CONTINUED( 2l
P~OG~4~1 3o4 ~STEEL~
C
C C C C C C C C
***************************************************~~**************
BAUSCHINGER EFFECT
MAR.CH 1969
A COMPARISOM EXPERIMENTAL SINGH, TULIN & GERSTLE MODIFIED RAMSBERG-OSGOOO
************~*************************************=**************** DI~ENS!ONFS !2l ,EZEK0N{2l ,EZEROU2l,SENSE!Zl,KBAUSI 21 ,EDIFFl2l,EIPL
li21,FA(600l,EA(600),AVENUM(2J,SDSUM[2l,FSL{2),ESL(2l,FT{ZJ 2,NCYC[Zl,RVAL(40)
pJ;3.l4159 1 RE~0{5,10llYM,FU,FY,O,NR,ESH,HW,WLC,EZERO,FlL,F2L,NSPEC
101 FO~MAT{F9.0,2FB.O,F6.3,I5,F7.4~F6.0~F5.0,F9o6,F541 7 F8.0~I4) WRITE(6,l021NS?EC
102 FORMAT{'lSPECIMEN',I3//////) WRITE (6,103}
1C3 F• q_MAT(' ',24X,'STRAIN',18X,'EXPTL STRESS',16X,'S,T & G STRESS 1 ,7X l'. ~,OD IFIE D RAMB ER;;-csGOOO. / / //)
DO 6 I;l,NR REA0(5,104) LR,SR ><L=LR IF(LRI 2,3;4
2 P=FlL*[RL+F2LJ-HW-WLC GO TC 5
3 P=-HW GO TO 5
4 p;FlL*(RL-F2Ll-HW-WLC 5 FA(I);4.*P/(PI*D*Dl
EAIIl=[SR-EZEROl/(l.+EZEROl-4.*HWi(Pl*D*O*YMl t, COIHI NUE
104 FORMAT(I6,F9~6l C INITIALISE
C
DO 7 I;l,2 ESL( I I ;Q.
FSL { I J;O. ElERON [ I);Q.
EZC:ROL( l );Q.
KBAUS(I);O NCYC(J)=O SEHSE(I)=C. EO!FFi I )=O. E!DL{I}::: ~
e.v r-fUMfI ;Q.
7 SD U~(ll O. ON =l. ll.N NP SE UP R VALUES ARRAY DO 5I=l-r39,2 G=
75 RVALl!);4.483/ALDGl1.+Gl-6.026/(EXP(Gl-l.l+.297 0076!;2,40,~
P?.OG'.".:..Atw' 3 • .:::
G;l 7b RVAL([1;2.197/ALDGl1.+G)-.46q/[EXP(GJ-l.J+3.043
TRANSITION STR~SS FOR A,G&T EXPRESSION ET=.0001 G;.0001
R LHS;YM*ET RHS=64500.-S2700.*.838**(1000.~ETl IF{LHS-RHSl9,11,10
q ET;ET+-~ GD TO S
li"J ET:::l:T-G G;,l*G IF(G-1.E-Bill,ll.9
11 FT.il J =ET*YM C TRANSITION STRESS FOR MODIFIED RAMBERG-OSGOOD
FT(2}=.15~q::y
CONTINUED ( l l
C MODIFIED BU~NS & SEISS PARAMETERS FOR STRAIN HARDENING WC=FU/FY 1,S=.14 WH;(NC•(30.*W8+l.l**2-60.•WB-l.l/115.*WB**2) ESU;ESH+l<B WA;(MH•WB+2.l/(60,*W8+2.I
C CO~PUTE THEORETICAL STRESSES 00 60 I=l ,Nt< ES=B!I) D0405J=l,2 FS(Jl=YM•[ES-EZERON(J}l KAD=KBAUS[Jl GO TC 112,27),KAD
C ELASTO PLASTIC SYSTEM l? IF(FS!Jl*SENSE(Jll19,13,13 13 IF(ABStFSIJJ)-FY)40,40,14 14 IF!ABS(ES)-ESHJ15,15,16 15-FS(JJ=SIGN(FY,ESi-
GO TC 40 16 TEMP;l.
l F <ES l l 7, 99, 18 17 TEMP=-1. 18 DElf1;ABS!ESH-ABS(ESll
FS(Jl=TE~PQFY*( (NH•DELTA+2.J/(6D.•DELTA+2.)+0ELTA•INC-WAJ/WBI GO TC 40
19 !F(AES(FS(,l) l-FTCJl )40,40,20 C !TEqAT!ON ROUTINE
20 DELTA=A8S(EZERON(JI-ESI GD TO (2111221 ir...:
21 FSIJ);-SE~SE(J1•164500.-52700.•.8gBe•llOOO • *DELTAII GO TC .;o
27 PL4ST=~BS(EZERONIJI-EZEROLfJII R=RVAL{NCYC{J)+ii FCH=Fv=f~744fALOG{l.+lOOO.*PLASTJ+~07l/~EXP(lOOO~*PLAST}-l.J+o241, lF(FCH-FYl225,225,Z2~
224 f-CH=FY 225 .ECh=FCH/Yi'i
ALPHU:::[,EL Tg/ECH
?ROGKAM 3.4 CONTINUED( 2l
C
C
C
GAl<MA=ALPHA 23 BETA=ALPHA-!ALPHA+ALPHA**R-GAMMAl/(l.+R*ALP~A**(R-1.))
IF(ABS(ALPHA-BETAJ-10./FCH) 25,25,24 24 ALPHA=BETA
25 26
27 28 29
30 3l
315
32 325
33
34
35
36
37
374 375
38
39 40
404 405
105
41
42 43
GD TO 23 GO TC(26,38,39),KAO FS(Jl=-FCH*8ETA*SENSE(J) GO TC 40 BAUSCHINGER SYSTEM IF{ABS{FS{Jll-FT{J}l40,40,28 IF(FS{Jl*FSL(Jll29,99,30 KAD=3 IF(ABS(FSL<Jll-FT{Jll32,32,315 !F{ABS(FSL(JJJ-FT{Jll 31,31,32 IF {ABS {ESU Jl-EZEROL{ Jl I-ABS{ EZERON{ J l-EZEROLIJ l l l 315, 99,32 DELTA=ABS!EZERON(Jl-ESl GO TO (34,221,J IF{ABS{EZEROL(Jl-ESJ-EDIFF(Jll325,325,33 IF((EZERON(JI-EZEROL(Jll*IES-EZERON(Jlll315,40,40 DELTA=ABS(EZEROL{JI-ESJ GO TO (34,371,J FS(Jl=64500.-52700.*.83B**ClOOO.*DELTAJ GO TC (99,35 7 3ol;KAO FS(Jl=FS(Jl*SIGN(ONE,FSLIJ)J GO TO 40 FS(Jl=-FS(Jl*SIGNIONE,FSL!Jll GD TO 40 R=RVAL(NCYC(J) I FCH=FY*l.744/ALOG(l.+lOOO.*EIPL(JlJ+.071/(EXP!lOOO.*EIPL(Jl)-l.l+.
1241) IF(FCH-FY)375,375,374 FCH=FY ECH=FCH/YM ALPHA=DEL TA/ECH GAMMA=ALPHA GO TO 23 FS(J)=FCH*BETA*SIGN(ONE,FSL(Jll GO TO 40 FS(Jl=-FCH*BETA*SIGN(ONE,FSL(JI) IFIABS(FS!Jl)-FUJ405,405,404 FS(Jl=SIGN(FU,~S!Jll CONTINUE WRITE!6,l05)ES,FA!Tl,FS(1J,FSl2l FORMAT(lH ,F30.6,3F30.0l DO 41 J=l,2 AVENUM(Jl=AVENUM{Jl+FA(Il-FS(Jl sosu,1JJ=SDSUM(J)+{F•IIJ-FSIJ))**2 UPDATE ROUTINE DO 59 J=l,2 KAD=KBAUS{J) GO TC(42,48l ,KAO EL~STO-PLASTIC SYSTE~ IFISENSE(Jl) 45,43,45 !F(A~S{ES)-FY/YM)59,58,44
PROGi<L\M 3.4
C
44
45 46 47
48 49 50 51
515 52
53
SENSE[Jl=SIGN(ONE,ESI GO TC ·57 IF(SEMSE(Jl•FSIJll 46,57,57 IF(ABS(FS(Jl l-FT(j l )57, 57,47 KBAUS{Jl=2 GO TO 5::> BAUSHINCER SYSTEM IF.(ABS!FS(Jl l-FT[Jl 158,58,49 IFIFS{Jl*FSL(J)l50,99,54 IF CABS(FSU J) )-FT/ J) )51,51,53 IF(ABSIEZEROL!Jl-ESl-EOIFF(Jll515,515,52 IFl(EZERCN!Jl-EZEROL(Jll•!ES-EZERON!Jlll53,57,57 EDlFF(Jl=A~S(EZEF-OLlJI-ESl GQ TC! 57 EDfFF(Jl=ABS(EZERON(Jl-ESl GO TC '.5&
54 IF{ASS(FSL(Jll-FT(Jll 55,55,51
CDNTIIIIUED!3l
55 IF[~BSlESL(Jl-ElEROL!Jll-ABS!EZERONIJI-EZEROL{Jlll53,99,5l 56 EIPL(Jl=ABSIEZERON(Jl-EZEROL(Jll
EZEROL(Jl=EZERON(JI NCYC!JJ=NCYC(J)+l
57 EZERON(Jl=ES-FS(Jl/TM 58 ESL{Jl=ES 59 FSUJl=FS(J) 60 CONTINUE
C MEAN AND STANDARD DEVIATIONS DO 61 I=l,2 AVE~UMII)=AVENUM(Il/RN
61 SOSUM(Il=SQRTISDSUMlll/RNl WRITE!6,106)!AVENUM(Il,I=l,21
106 FORMATllH //////' MEAN DEVIATIONS',45X,2F30.0//J WRITE(6,107J iSDSUM( I l, I=l,21
107 FORMAT(' STANDARD DEV1ATIONS',41X,2F30.0//J WRITEl6,108l(FT!rl,I=l,2l
108 FORMAT(' TRANSITION STRESSES•~41X,2F30.0I WRITElo,1091
109 FORMATl'l'I GO TO l
99 CONTINUE . EN:J
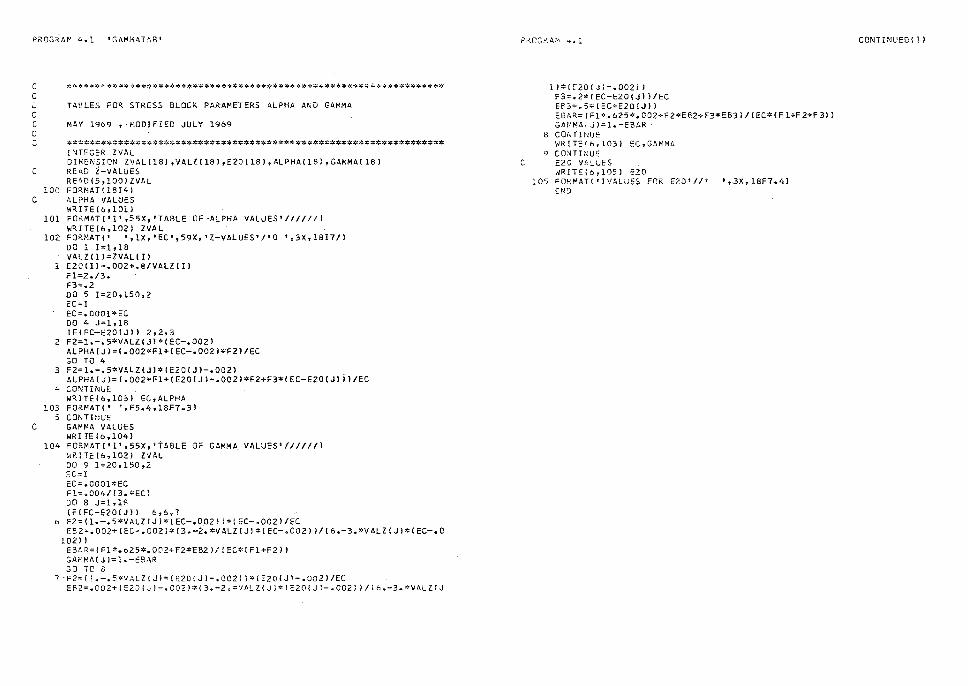
PKOG~AM 4,1 'GAMMATAB'
C *********~l!;:*********************~*********.l';:*****~**¥********~:,';:.1,r:* C ;; TABLES FOR STRESS BLOCK PARAMETERS ALPHA AND GAMMl\ C C MAY 1969, MODIFIED JULY 1969 C C **~~***********4*******************#**~******~********************
l"ITEGER ZVAL DI~ENSION ZVAL(l8l,VALZ(l8l,E20(18l,ALPHA(l8l,GAMMA(l8l
C READ i-VALUES RE~D(5,100JZVAL
100 FORMAT(l814l C ALPHA VALUES
WRITE ( 6, lOll 101 FORMAT('l',55X,'TABLE OF -ALPHA VALUES'//////}
wR!TE(6,102l ZVAL 102 FORMAT(' ',lX,'EC',59X,•Z-VALUES'/ 1 0 ',3X,18!7/l
DO 1 I=l,18 VALZ(I l=ZVALCil
l E20[IJ=.002+.8/VALZ{Il Fl=Z./3. F3=.2 00 5 1=20,150,2 EC=I EC=.OOOl*EC DO 4 J=l,18 IFCEC-E20(Jll 2,2,3
2 F2=1.-.5*VALZCJl*(EC-.002l ALPHA{J)=(.002«Fl+(EC-.002l«F2l/EC GO TO 4
3 F2=1.-.5*VALZ(Jl*!E20(Jl-.002J ALPHA(JJ=(.002«Fl+(EZO(Jl-.002l*F2+F3*(EC-E20(Jlil/EC
4 COJ\lTINUt -WR!TE(6,l03l EC,ALPHA
103 FORMAT(' ',FS.4,1Sf7.31 5 CONTINUE
C GAMMA VALUES WRITE (6,104)
104 FORMAT('l',55X,'tABLE OF GAMMA VALUES'//////) WR!TEC6,102J ZVAL DO 9 !=20,150,2 EC=! EC=.OOOl*EC Fl=.004/!3.*ECJ DO 8 J=l,18 iFCEC-E20(Jll 6,6,7
D FZ=(l.-.S*VALZIJJ•lEC-.OOZl)*{EC-.002)/EC EE2=.002+(EC-.002l*13,-2. • VALZ(JJ«(EC-.002Jl/{6.-3."VALZ(Jl*(EC-.C
102) l EBAR=(Fl*.625 • .00Z+FZ*EBZl/{EC*lFl+F2ll GAMMA(Jl•l.-EBAR GO TC a
7·FZ=ll.-.5 • VALZ1Jl•(E20!Jl-.002l l•!E20(JI-.002l/EC EB2=.002+1EZOIJ)-.0021•13.-Z.•VALZ(Jl*IE201Jl-.00211/l6.-3.•VALZ[J
2~,0G>'. AM -.. l
ll*(EZOIJ)-.OOZ)l F3=.2#(EC-E20(Jll/EC EB3=.5•CEC•E201Jll E84R=IF1*.625«.00Z+F2«EB2+F3*EB3l/CEC*(Fl+FZ+F3ll GAMMA(Jl=l.-EBAR -
8 CONTINUE WRITEl6,l03l EC,GAMMA
9 CONTINUE C E20 VA~UES
WRITEl6,l05l EZO 105 FORMATl•lVALUES FOR E20'//' 1
1 3X,18F7.4l END
CONT !NUED ( lJ
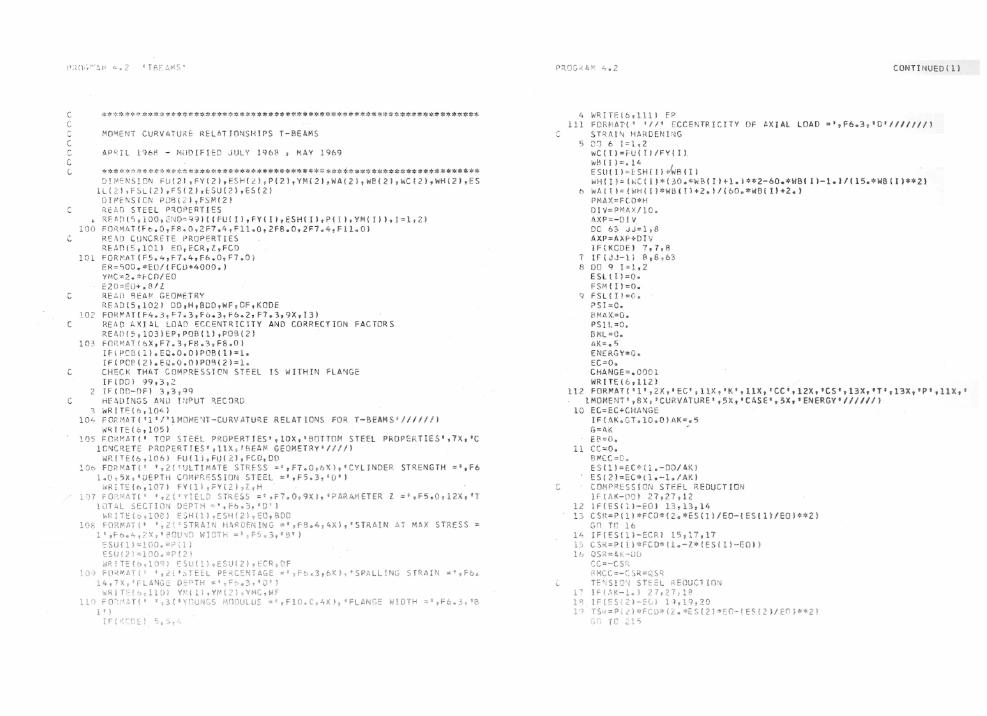
C C
C C (,
l
C
C
C
C
************* ********* ***** *************~*~*****************•*~•··
MO~EN T CURV AT UR E RELI TJO NSH!PS T-BEAM S
AP qIL 1968 - Mi lDIFIE O JULY 1968 , MA'f 1 9 6 9
*** ***~ **** *******************************~*********************** D ! i'E NS ! ON FU I 21 , FY ( 2), ESH ( L) , P ( 2) 1 YM ( 2), WA ( 2 l, WB { 2 ), we I 2 l, WH I 2 l , ES
i Li 2 l ,F SLl 2 l ,F Sl2l ,E:SU( tl ,ES( 2 ) Dl~ ENSI CN P08 ( 2 1, FSM l2! READ STEEL pq• PERT I ES
• RF. A[)( 5 1 l 00, :: :·w= 99 l I ( FU I I l , FY I I I, ESH I I I, P { I l, YM ( l l l, I = 1 , Z l 100 FO~~A T(Fb,0, FA,O , ZF7, 4 1 Fll.0,2F8,0 1 2F7 .4, F l l ,O l
RE , • CUNCRE TE PROPERTIES RE: D01 5 ,1 011 ED ,ECR,Z,FCD
1 01 FOR MAT (F5 . 4,F7.4,F6.0,F7.0 ) F.R=50 0 ,*E O/(FCU+4000.l YMC= 2. ''FCfJ/EO E2 0=EU+. 8 /l RE Afl BEA V GEOMETR Y RF. AD(5,1021 DD, H,BDD,WF,DF , KODE
! 0 2 F• R,AT IF 4, 3 , • 7.3,F 6 , 3,F6,2,F7,1,9X,13) RE AD AXIIL LOA D ECCENTRICI TY AND CORRECTION FACTORS READ 15 ,103lEP,POB(ll,PO B( 2 l
10 3 F0 f~MA T( 6X,F7 . 3,F8.3 , F8 .0) l FI ~CB ( l l . EQ. 0. 0 I POB ( 1 I= 1. IF(PC P l 2 l,E Q. O,O l P09(2l = l . CH ECK TH AT COM PRE SS ION ST EEL IS WITHIN FLAN GE IF !OD l 99 1 3, 2
c IF( DD - DF) 3,3 , ~9 HE ADIN GS AN O I NPUT RE CORD
1 nRITE1 6, l04l 104 FOPMI Tl ' l '/ 'lMOMEN T- CURVATURE RELATIONS FOR T- BEAMS '/ /// // 1
w~!TE( 6 ,1 05 l 105 FOKl~A T(' TO P SEE L PRO PERTIES• , lOX, 'BOT TO M STEEL PROPE RTIES',7 X, ' C
lC~CRE TE PROPE RT I ES' , 11 x,,e EA M GE OMET RY'// / /) WRI TEl6,106 l FU( l l, FU (2l,FC D, DD
lOb FORM AT ( ' ' ,2l'ULTIMAT E ST RESS = 1 , F7 .0 1 6Xl,'CY LINDER ST REN GTH = ' , Fb l.0,5X,'D EP TH CfJIWR•S SION ST EE L =',F S.3,'D'l
\, RifE( t, 1 107) fYtll,FY (21,Z,H 1)7 FO P.M.\Ttr ',2{'YIELD STRE S S = :, F7.0 , 9Xl, 'P llRAMETER l =f., F5 .0,12X. , 'T
lOTAL SECTION DEPTH :; ' , Fb.3 , '!J '} 1..RlT i: (t.,1()8) ESH (l l ,E SH(2l,E D,6DD
l'l8 FOR l' AT(' ',21.'S TRA !N HARDEN IN G ~•,FB,4,4Xl,'STRA!N AT MAX STRESS l', F6 .4,?Xt 1 2,0U\!r'I WIDTh = 1 ,FS. 3,'B')
ESU (ll =lOO.a?•ll ESUIZl~lOO.•Pl21 WR 1 TE (6 , l09i l:SlJl l i , ESU l21,1:C R,D F
10-"; FO•-U"lATt 1 ',2..( ' :::>TEEL PE-,:{C~r<nAGE =' 7 Ft..,.3,6~C) -. esPA LLING S TRAI N ;; ",Fb:, 14,7X~'FLANG~ O~ PTH =•p~j~3,•0 1
hR i r:-:: ( 0 ill O t y~ { l l, Yt•1 { "Z ~ 'vr.iic' ~ 11n Fo-: nA T{' 1 t3{ ' YDUNGS M:lDUl.US = ,flO.C~4X} , ' FLANGE W!OTH :',F6 .. 39'B
1 I j
IF(1<CD~) 5f..J}"Y
C
CONTI NU EO 11 l
4 WRITE(6,ll l l f P 111 FORHA TI ' 'I I ' ECCE NTR IC I TY OF AXIAL LOAD = ' , F6,3 , 'D'///////)
S TRA tr'J HAi<D EN P JG 5 DO 6 !=1, 2
WC( I l=r UI I 1/ FY( I I wflll)= . 14 ESU(ll =c SH( ! i ✓wB(ll WH ( ! I= I r.Cl i l * I 30. '-W 8 ( I I+ 1, I ** 2-60,*WB ( I l-1, I/ ( 15, *WB ( I l** 2 l
h ,;A{! l=( wH( l l* WB(l l +2,l/( 60 , *WBl!l+2.) PMAX=FC D*H DIV=Pi-i AX/10. AXP=-DIV DO 63 J J= l, 8 AXP=A XH·DI V l F{K CDEl 7,7,8
7 lF\JJ-l i 8,8 16 3 /J DO 9 != 1 , 2
ESL\Il=O• FSM(l) =O.
9 FSL(ll= O• PSI = O. BM ,\ X.=O, PS!L=O. BML=C. AK =, 5 ENERGY =O, EC=O, CHANGE=, 0001 WR!T E( 6 ,ll2l
112 FOR MAT ( • l ' , 2 X, ' EC ' , l lX , 'K' , l lX, 'cc' , l 2X, ' CS ' , 13 X, 'T 1 , 13X, • P • , 11 X, • 1MOME NT' ,BX , 'CU RV ATUR E',5X,'CA SE ',5X,' ENER GY 1 //////l
10 EC= EC+CHANGE IF ( AK ,GT, 10, 0) AK=,5 G=~K -El' =O,
1 1 CC "=O• BM( C=G. ES( l) =EC *(l,-DD/A K) ES1 2 1=EC* ( l . -l ./AK) COMPRESSION STE EL REDU CTION iF(AK- 001 27,27, 12
12 l F( ES(l J- EO l 13,13 ,14 13 CSN =P( ll *FCD• l2, *E S(ll /EO- (ES (l ) /EOl ** 2 l
Gn TC 16 16 IF I ESlll - ECR I 15,17,17 15 CSR =P(ll*FCD*!l.-Z*!ES{ ll -E Ol l lb QSK =A r-..-JU
,:c =-CS R
L, rc~~S!Q '~ STEEL EDUCTION J. 7 I F(f~K-l e) 27,2 rl8 19 IF(E5 (2}-EL> 1 ,19,20 1~ TS~= P\ L)*FCO*( .~ESC21*EO-{ES!2)/E0)**2 '
c;r; re 215
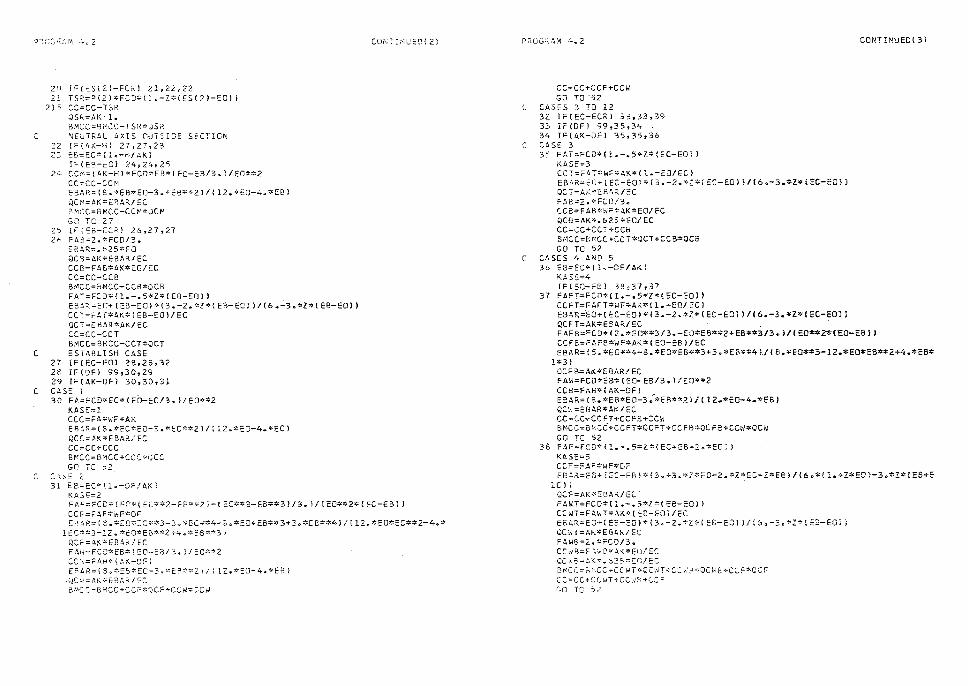
p~~;7C:,f(,r:,rv1 .·,., 2
n IF{~S(2}-ECKl 21,22y22 l TS~=P(21•FCD*(l.-Z*(ES[2)-EO))
2 S CC=CC-T~R QSR=AK-1. BMCC=BMCC-TSR•JS~
C ~EUTRAL AXIS GUTS!DE SECTICN 22 IF{iK-•1; 27~27,23 23 EB=EC*ll.-~/~KI
IF(E9-=0} 24,24,2~ 24 CCM=(AK-Hl*FCD•EB•IEC-EB/3.J/EO••Z
CC=CC-CCM EBAR=(S.•EB•E0-3.*EB**Zl/(12.*E0-4.•EBJ QO•=AK*EP-AR/EC BMCC=BMCC-CCM•JC~ GO TC 27
2? IF { =a-ECR! 26,27,27 Zh FA:1=2.*FCD/3 ..
Ee.AR=. ~ZS*EO QC'3=AK*EBAR/EC CCB=FAC*AK*EO/EC CC=CC-CCB BMCC=BMCC-CCB*QCB FAT=FCO*!l.-.5*Z*(E8-EOll EaA~=EO+(EB-E0)*(3.-2.*Z*(Eo-EOlJ/(6.-3.•Z*!EB-EO)I CCT=FAT*AK*[EB-EOJ/EC QCT=ERAR*AK/EC CC=CC-CCT BMCC=BMCC-CCT•QCT
C ESTABLISH CASE 27 IFIEC-E• l 28,26,32 28 !F(rJF) 99,30,29 29 !F(AK-DFl 30,30,31
C CASE l 30 FA=FCD*EC*(EO-EC/3. l/EO**Z
KASE=l CCC=FA*WF*AK EB4R={8.*EC*E0-3.*EC**2l/~l2.*E0-4.*EC) QCC=AK*EBAR/ EC CC=CC+CCC BMCC=BMCC+CCC*OCC GO TO 52
C C~:)!: 2 31 EB=EC•ll • -DF/AKl
KASc=2
CONTI.-~U~D{ Zi
FAF=FCD•(EO•IEC**2-f~••zi-lEC*•3-ES•*31/3.)/IED**2*1EC-EBll CCF=FAF~iriF*DF ERdR=(8.*EO~~C**3-3a*EC~*4-ao~ED*EB*$3+3o*E8**4)/(l2.*ED*EC**2-4e*
1EC~~3-lZ~#EO*Eil**2~½.*ES**3l Q'CF=~K*EBAF</EC FAW=FCD•EB•IEO-EB/J.l/E0••2 CC'.-.'=F AH* I~ A K-!JF) EPLR=[S~~E9*E0-3~=ER~*2J/[12.=E0-4.*EBJ
-QC-'= AK''EBAR/ EC BMCC=BMCC+CCF*OCF+CCW~~cw
P~OG-:.!..M 4 .. 2
CC=CC+CCF+CCW GD TO 52
C CASES 3 TO 12 3Z IF(EC-ECR) 33,33,3q 33 !F(DFJ 99,35,34 34 !F(AK-DFl 35,35,36 CASE 3 35 FAT=FCO*Cl.-.S*Z*(EC-EO)l
KASE=3 CCT=FAT*kF*AK*{l.-EO/EC) El3AC:= EO+ ( EC-EO l * (3 .-2. *Z *[ EC-EO i J / I 6 .-,l.*Z* i EC-f.0 l l QC T=Al(~EB·~~/EC !=AC=Z .. *FCD/3_. CCB=FAB*WF*AK*EO/EC QC8=AK*.&25*EO/EC CC=CC+CCT+CCB SMCC=BMCC•CCT*CCT+CCB•oca GO TO 52
C CASES 4 AND 5 3b EB=EC*{l~-DF/AK)
KAS:;~4 IFlEO-EBJ 38,37,3?
37 FAFT=FCO*(l.-.s~z•{EC-EOl) CCFT=FAFT*WF*AK*ll.-EO/ECJ
CONTINUED! 3 l
EBAR=EO+( EC-ED l * ! 3. -2, *Z* ! EC-ED J l I( 6.-3.*Z*I EC-EO) l QCFT=AK*ESAR/EC FAFB~FCD*(Z.•E0**3/3,-EO*EB**Z+EB**3/3.,l/(E0*•2•CEO-EB!l CCFB=FAFB*WF*AK*(EO-EB)/EC EBA R= ( 5. *E0**4-6. *EO*EB**3+ 3. *EP.**4 l/ ( a.•E0**3-12.*EO*EB**2+4 .•EB•
1*3) QCFB=AK*EtlAR/ EC FAW=FCD*EB*IEO-EB/3.l/E0**2 CCt,=FAe/* i AK-OF l EilAR= ! e. *EB*E0-3 ;*E B**Z l; ( 12.•E•-4.•EB l QCW=E8AR*AK/EC CC=CC~CCFT+CCFB+CCW BMCC=B~C(•CCFT•QCFT+CCFB•QCFB+CCW•OCW GO TC 52
3~ FAF=FCD*(l.-.5*Z*(EC+EB-2~*EO~) KASE=5 CCF=FAF*WF*DF E8~R=EC+fEC-E8l*f3.+3.~Z*E0-2,*Z*EC-Z*EBl/!6,*(l.+Z*EDl-3.*Z*IEB+E
lC l l QCF=AK<<EBAR/EC FA•T=FCD*(l.-.5*Z*!EB-~Oll CCWT=FAWT*AK*{ES-EO)/EC EBAR=EO+[EB-E0)*{3~-2.~Z*CE8-EOJJ/{6~-3~*Z~tE8-EOJ~ QCWT=AK*E8Ak/ EC FAW8=Z.<-FCD/3. CCwB=F~~C*AK*EU/EC QC~B=A~~-625=~n/EC 8MCC=8~,CC+CCWT~QCWT+CCW~~Qche+CCF*QCF CC=CC+CCwT+CCWH+CCF GO TG :>2
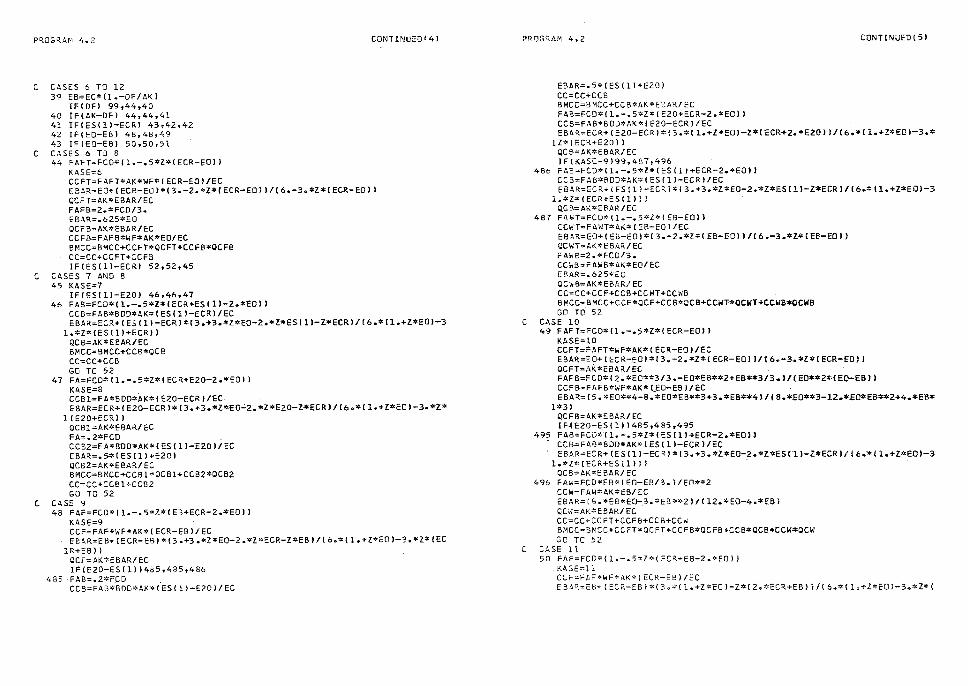
PR.OGRAM 4.2
C CASES 6 TO 12 39 EB=EC*ll.-DF/AK)
fF!DFl 99,44,40 40 IFIAK-OF) 44 7 44 7 41 41 IFIESlll-ECRl 43,42,42 42 IF!EO-EBl 48,48,49 43 IFlEO-EBl 50,50,51
C CASES 6 TO 8 44 FAFT=FCD*ll.-.5*Z*IECR-E0l l
KASE=6
CONT INUl:D ( 4 l
CCFT=FAFT*AK*WF*IECR-EOl/EC EBAR=EO+(ECR-EOl*l3.-2.*Z*IECR-EOJl/(6.-3.*Z*IECR-EOll QCFT=AK*EBAR/EC FAFB=2.*FC0/3. EBAR=.625*EO QCFB=AK*EBAR/EC CCFB=FAFB*WF*AK*EO/EC BMCC=BMCC+CCFT*QCFT+CCFB*QCFB CC=CC+CCFT+CCFB IF!ESllJ-ECRl 52,52,45
C CASES 7 AND 8 45 KASE=7
!F(ES!ll-E20I 46,46,47 46 FAB=FCD*ll.-.5*Z*IECR+ES!l)-2.*EOII
CCB=FAB*BDO*AK*IESlll-ECRI/EC EBAR=ECR+IES(ll-ECRl*!3.+3.*Z*E0-2.*Z*ES(ll-Z*ECRl/(6.*ll.+Z*EOJ-3
l.*Z*!ES!ll+ECR)) QCB=AK«EBAR/EC BMCC=BMCC+CCB*QCS CC=CC+CCB GO TO 52
47 FA=FCO*!l.-.5*Z*IECR+E20-2.*EOJl KASE=8 CCBl=FA*BDD*AK*IE20-ECRJ/ECEBAR=ECR+!E20-ECRl*(3.+3.*Z*E0~2.*Z*E20-Z*ECRl/16•*11.+Z*EOl-3.*Z*
l(E20+ECRll QC Bl =AK*EBAR/ EC FA=.2'"FCO CCB2=FA*BDD*AK'"IES!ll-E201/EC EBAR=.5"'fES(ll+E201 QCB2=AK*EBAR/EC BMCC=BMCC+CCBl*OCBl+CCB2'"0CB2 CC=CC+CCBl+CCB2 . GO TO 52
C CASE 9 48 FAF=FCD*fl.-.5*Z*CEB+ECR-2.*EOII
KASE=9 CCF=FAF*WF*AK'"(ECR-EBI/EC EB~R=EB+(ECR-EBl*(3.+3.*Z*E0-2.*Z*ECR-Z*EBl/(6.*ll.+Z*cOl-3.*Z'"IEC
lR+EBJ) OCF=AK*EBAR/E:C !F(E20-ESflll4d5,485,486
485 -FAB=.2*FCD CCB=FAB'"BDD*AK*(ES(l)-E20)/EC
PRr:JGRAM 4.2 CONTINUED ( 51
EBAR=.5*1ES(ll+E20) CC=CC+CCB BMCC=BMCC+CCB*AK*EBAR/EC FAB=FCD*!l.-.5*Z*(E20+ECR-2.*EOII CCS=FAB*BDD*AK*fEZO-ECR)/EC EB4R=ECR+IE20-ECRl•!3.*!l.+Z*EOI-Z*CECR+Z.*E20ll/!6.*ll.+Z*EOJ-3.*
1Z*(ECR+E20l l QCB=AK*EBAR/EC IF(KASE-9)99,487,496
486 FAB=FCD*!l.-.S*Z*(ES(l)+ECR-2.*EO)l CCB=FAB•BDD*AK*(ES!l)-ECRI/EC EBAR=ECR+!ES(ll-ECR)*!3.+3.'"Z*E0-2.*Z*ES1ll-Z*ECRJ/(6.*(l.+Z•EDl-3
l.•z•tECR+ESllll l Q.GB=AK*EBM/EC
487 FA~T=FCD*!l.-.5*Z*CE8-EOJJ CCWT=FAWT*AK*IEB-EO)/EC EBAR=EO+IEB-EOl*f3.-2.*Z*IEB-EOJJ/16.-3.•Z*IEB-EOII QCWT=AK*EBAR/ EC FAWB=2.*FCD/3. CCWB=FAWB*AK*EO/EC EE\AR=.625*EO QCWB=AK*EBAR/ EC CC=CC+CCF+CCB+CCWT+CCWB BMCC=BMCC+CCF*QCF+CCB'"QCB+CCWT•QCWT+CC&IB*QCWB GD TO. 52
C CASE 10 49 FAFT=FCO*(l.-.5*Z'"IECR-E01l
KASE=lO CCFT=FAFT*WF*AK*IECR-EOJ/EC EBAR=EO+!ECR-EOl*13.-2.*Z*!ECR-E0ll/16.-3.•Z*IECR-EO)l QCFT=AK *EBA R/ EC FAFB=FCD'" ( 2. *E0**3/3.-EO*EB*'"2+EB**3/3. l / ( E0*'"2•'f EO-EB t l CCFB=FAFB*WF*AK'"(EO-EBJ/EC EBAR= I 5. *E0**4-B;*EO*EB**3+3. *EB**4 l/ I tl.*E0**3-.l2.•EO*EB**2+4.•EB'"
1*31 QCFB=AK*EBAR/EC IF~E20-ES(l11485,485,495
495 FAB=FCD~(l.-.5*Z*IES(ll+ECR-2.•E• IJ CCB=FAB*BDD*AK*CES!ll-ECRI/EC EBAR=ECR+ (ES I 1 I-EC RI '"13.+3. *Z*E0-2.*Z*ESCl l-Z*ECRI/ 16•* ! l.+Z*EOl-3
l.*Z*!ECR+ES(llll QCB=AK*EBAR/EC
496 FA~=FCD*EB*(EO-EB/3.l/E0'"*2 CCW=FAW•AK*EB/EC EBAR=(8.*EB'"E0-3.*EB**21/112.*E0-4.*EB) QCW=AK*EBAR/EC CC=CC+CCFT+CCFB+CCB+CC~ BMCC=BMCC+CCFT*OCFT+CCFB*OCFB+CCB*QCB+CCW'"QCW GO TC 52
C CASE 11 50 FAF=FCD*!l.-.S*Z*(ECR+EB-2.*EO)l
. KASE=ll CCF=FAF*wF*AK*(ECR-EBI/EC EBA~=EB+(ECR-EBl*(3.~(l.+Z*EO)-Z*(2.•ECR+E8ll/(6.•!1.+Z*EOl-3.*Z*(
PRD~;;·c.11 Li.2
1EC;,+E8)) QCF=AK*EBAR/EC FAWT=FC •• 11.-.S•Z IEB-EOII CC~T=FAwT•AK*IEB- Jl/EC ~R&R=EO+(~B-E• l •( .-z.•z•!EB-EOl)/(6.-3.•Z•[EB-EOil QC.✓ T=AK*EBAR./EC F AWB=2. *FC0/3., E50R=.&25*[0 CCwB=fAWB*QK•EO/EC CC\l\!3=AK*EBA~/EC CC=CC+CCF+CCWT+CCWH 8MCC=BMCC+CCFOJCF+CCWT•QCWT+CCWB*QCW8 Gn TC 52
C. Ci.SE 12 51 FA~T=FCD*Cl.-.5*Z*IECR-EOII
KASf:=12
CC.l\J fI~:JEC ( 6 j
CCFT=FAFT*WF•A~•IECR-EOI/EC ERAR=ED+IECR-En1 • 13.-2.*Z*IECR-E• l)/(6.-3.•Z•IECR-E• ll QCFT=AK*EBAR/EC F~fP=FCC • (2.•E ••• 3/3.-E• •EB**2+EB**3/3.J/!E0**2*1EO-EB)) CCFB=FAFB*WF*AK•(EO-EB)/EC EbAR=(~.•E•*•4-B.•EO*EB**3+3.*EB**4)/(6.*E0••3-12.•E• •EB**2+4.*EB*
1*3) QC F B=AK*E BAR/EC FAw=FCD•EB*(EO-EB/3.)/ED••z CC W=FAW*AK*EB/ EC EnAR=(3.•Ee*ED-3.*EB**2)/{12.•E0-4.*EB) QC\l=AK*EBAR/EC CC:CC+CCFT+CCFe+CCW BMCC=BMCC+CCFT•QCFT+CCFB•QCFB+CCW•QCW
C STEEL 52 DO 58 I=l.2
FSCIJ=FSL(ll-YM(Il*lESL(Il-ES!Ill lF(AESIES(l)).GT.ESU(Ill GO TO 55 ! F: F S ( I l *FS~, (I). GT. 0. O. ANO. ABS ( FS ( I l I.LT. ABS ( FSM( r l l .OR. F S ( I J *F SM (
lIJ.LT.O.O)GO TO 58 IF(/\3S(FS!lll-FY(ll) 58,58,53
53 IFIAESCES(!ll-ESHl!ll 54,54,55 5& FSlll=SIGNIFYIIJ;FSII))
GO TO 58 55 Ttr~P=l.,
IF{t:S(il~ 56,9g,57 56 TE1-1P=-l.
ES(!J;-E:${:) ~7 DELTA=ABSIESHIII-ESIIII
FS(l)=TEMP•FY(ll*I (WH!ll*DELTA+2.)/(60.•DELTA+2.l+DELTA*iWCIIl-WA! 1Il11we.u 11
ESl!l=ES(ll*TEMP ,o CO.JTI1,Ut CS=P(ll*FSfll T=i:i ,[ 2} ;.,.':f$ ! 2} E:HC'S=CS*~ t..t<-flO) GMf=T<-(AK-J.)
C t,,XIAL LCtl.)
pi:i.ns~-~r-. 4 .. z
~NlXP=AXP*[EP-AKJ ~ E,JU!L!B~Ii:11"
!F(T+CC+CS-AXPl59,6l,60 5-1 A K=AK+G
!F(AK-2000.) il,11,10 60 At<a=.!.!.:<-S
3:=:.l:.:G !F(G-. 000011 61,59,59
61 BMTOT=3MCC+BMCS+BMT+BMAXP PSI=EC-ESl2) E~ES~Y=ENERGY+.5*!BMTOT+BMLl*(PSI-PSILI PSI=PSI/POB!ll BMTOT=BMTOT/POB(21 wqJTE!6,ll3JEC,AK,CC,CS,T,AXP,BMTOT,PSI,KASE,ENERGV
113 FO~MAT{e '~F6.4,fl2~3,4Fl4.0 7 Fl6.3,Fl5.6~!8,Fl2a4J PSI=PSI*POBll) IFIR~TOT-BMAXl615,616,614
614 BMAX=BMT0T GO TO t>l6
6iS !FIEC.LT.4.•ECRIGO TO 616 IF!B~TOT-.B•BMAX?63 1 63,616
61", DOoZI=l,2 ESLlI)=ES(I l !F(ABS(FS(l)).GT.ABSiFSM(!J)lFSM(Il=FSIIJ
62 F5Llll=FS{Il PSIL=PSI 8ML=BMTOT IFIEC,GE.ECR) CHANGE=.001 IF!ES12l+ESU(2l.GE.O.Ol GO TD 10
63 c• ,JTTNUE GO TC 1
99 CONTI,,!UE END
CONTINUED ( 7)
PROG~A~ 5.1 'CYCBiUS'
::. C C ~
r r
C C ,:;
C
*~*==*~***~***********•*=***3**************~***~*********=b~***~~~
M• ~ENT-CURVATU~E QELATl • NS FO~ REINFC~C50 : •NCRETE T-GE~MS SUBJECTED TO CYCLIC FLEXURAL LOADING
JULY 1%8
MODIFIED MARCH 1969
RAMBERG-OSGOOD FUNCTION FOR BAUSCHJNGER EFFECT.
**=:;:;;;;:::-******:,:,:=***************"*,;:**********#************************ Dl~ENSIJN WH(21,WA[2l,~8(21,WC!21,ED!FF121,EIPLl2l o;:,'ENSION ELAST,5001 ,FMAX(50Dl,FCRACK(500l DI;~:E~S IOf\; EMAX { 500) 9 EZ ERO( 500 i ~CR [ -50) ,E{ 5001 ,F { 500 J 7F W{SCO), ESL [2 J
l ,FSL [2 l ,EZERON(2), EZEROL (2) ,SHISEI. 2) ,KS AUS ( 21, FU! 2 l, FY( 2) ,ESH l2l ,P 2 ( 2 J, YM{ 2), E5U( 2) ,SR (Zl ,OSR (2), FS( 2!, ES( 2 J ,NCiCC2), RVAU 40 !
OIMENSIO~ FT{2) C RE"D STEEL P~OPERTiES
ONE=l. ~E ',D (5,100, E N0=99) ( ( FU ( I ! , FY ( I l, ESH( l l, P ( I l, YM (Ii l, I =i, 2 l
10• FO~MAT(F6.0,F8.0,ZF7.4,Fll.0,2F8.0 1 2F7.4,Fll.Ol REAn C• NC~ETE PROPERTIES ~E1D15,1011 EO,ECR,Z,FCO
101 FO~MAT(FS.~,F7.4,F6.0,F7.0} ER=500~*EO/(FCD+4000.l Yf01 C;2o :~ F-CD/ EO !F(Z) 2,2,3
2 E20=!. GO TC 4 E20=E0+.8/Z
C RE~D BEAM EOMETRY AND NUMBERS OF ELEMENTS AND READINGS 4 REA0(5,102 DO,H,BOO,WF,OF,NEL9~CR
102 FO~~AT(F4 •• F7.37F003,F6c2~F7o3v!5~J4l ·c ~E~O AXIAL LOAD AND ECCENTRICITY
REAn(5,103l BIGP,EP 1G3 Fr,MAT(Fo.O,F7.3l
~EAO!NGS ANO LIST OF INPUT DATA
1H::Il (6 1 41' l04 !=0':;.i~ T{l '.,lOX,iREir\JFORCEO CONCRETE T-6EAM5 SUBJE::TC:D TO CYCLIC
llil.'.:.D "'lG TH CONSIDERATICt< OF THE BAUSC~:.INGER 7:.FFE.C1~///////J///// 2/1}
~,JP,TTl={i::.,105; 105 FO~~AT lh rcT• P ST~EL PROPERTIES~,1ox,~BOTTOM STEEL PROPERTIES~,
17X, 1 CQ CRETE PROPERTIES';llX: 'BEAN GEOMETRY ETC4 1 /////}
WRIT~l :106) ~U(l1,~U[2! 1 FCD,DO l0A FO~~AT lH ,2inULTIM~TE STRESS= ',F6G0,6~),'CYLiNDER STRENGTH =0 ,
1Fb~~=5 ,~DEPTH COMPRESSION STEEL= ',F4o3 9 1 J~}
\..tRITE•:.,,lC,7~ FY(l},,fV,'.2i tZ,H ~07 FO~~~Tl~ (,,YIELD ST~ESS = ',F6~0~9Xl,~?~RA~~TER l ~, r=5G0.,.llX
l,YT7TA~ E ra~ oErrH = t,Fs¢3~:o,, ½QIT~{~! 0 E~K(1!,~SHC2]yECrBDD
D::>,iJG?,i.1..'!\ 5#,l CONTI:,uED( ll
10~ FO~~A (!H ~2!'STRAI~ HARDENING= 1 ,F7.4,4X)7'$TRAIN AT MAX STRESS l= s,F 04~2x,~R•UNO w:DTH = r,f4~3,"B 0
)
POl'i(l :.oo<:..::P(l) ?100=1 GO ... ;;:p { 2} WRITE\6~109} PDlOC~PlJO~EC~,DF
109 FORMAT~lH 1 2{tS"fECL PERCENTAGE= ',F5~3,6X),.tiCRUSHING STRAIN= 11 ?
lF:::;.4,7'-<,~FLAr..iG~ DEPT;-,:= "-1f5"'33r"0t2 WRITE(n,1101 YM(l,,YM{2),YMCrWF
110 1'-0R.M:H(lH ,.;('•YOUNGS MODULUS= ',F9.0,4Xl,'FLANGE i<lDTH l r 3 ~ r
i= T ( 1t=.::.5 1~·1= Yr 1 } F7(2l=.15*FY(2) WRITE;o,lli)FT{l) 1 FT[21,NEL,NCR
",F5~3r
111 FO~MAT(lH ,~l"TR4NSITION ST~ESS = •,F6.0,4Xl,'NUMBER OF ELEMENTS l z,I3 9 ~XTt~UMBER OF REACZNGS = ~,!2!1///I/Jlflll/lJ i~i~~io~l:2; BiGP,EP
112 F0°~AT(lH ,'AXIAL ST~ESS IS c~~5o0r 1 PSI AT a~Fs.2,so ECCENTRICITY 1,,//lf//J/III///I)
~\•Rr-:--c(o,,113} 113 F00Jt.t,T{lri 72X, V EC' ;9):;.., °K' ,-9X-;, ~cc•1l0X7 DES0',10X,, 'CS 1 ,lOX, 'ES;,llXr
1 ~r~ ~7,<7 ~ ~,o;.·,t:-~T' 'l'7X"! ~CURVATURE' ,5X,. 7 K00i='-,9X,. e-ENERGY 1 ////) llL. f-Qi.{r<:;t.T: ~ ~ ,f7.,5,F9.,3,2(Fl2e0 7 Fl2-c6J~2F12.0,Fl4.6,18,Fl5 .. 6l
½IDTH FACTORS INITIALISATION D!J 5 1=1-,i'Si::L
5 FW( I J=l., EL=NEL TEf•1P;;J;=:..."'~L/H J=TE~ P DO b l=l,J
6 Fl·d I i=hF C STEE=L 1 CCUNTERS 11 iNITI!:.LlSATICN
on , 1=1,2 ESL\Il=CJ., FSl{I)=:) .. EZi:RCN( l l=O, EZERCL{! f=O. i\JC¥ClJl J=G 1,C[Il=FU{l)/FY(Il l.tB ( I j :;;• 14 ,1H ! f; = {HC( I l * (30 •*•JB ! l l+l. 1 **2-60.*WB! l l-1. l /( 15,.*>JB I I l**2l i,,J,:\ ( Y }= t t·fri ( I }*WB! I H-2 .. ) I { 60 .. *WB{ I j+2 .. ) EDlFFi, l=O. fl?!_{l)=O~ E SU ( I I =ESH , l J + ,, B ( l ; SE,~~SE {I) =G .. 1-;-.B ,.\ :JS i I}::= l.
7 CD 1\J-; :1._i'J[ I:.'G700I=l 139~2 G=[
70~ ~VAL(IJ=4&439/~LCG(l.+Gj-6.026/(EXP{GJ-l.J+.297 o-::7Cll=2s40,2 r~:::. t
70! R~~L(!!=2gl97/~~ • G(lo+Gl-.46Q/(EXP[Gl-1~1+3~043 DETERMI~JAT!GN ~F ~TEE_ RESIDENT E~E~Er~rs
D.::.zo,.;~:.u..,, s.1
C
TE1-~P=::;L.:!:0D/H I T=T.Er-iP TEi·iP=EL/H IO=TEMP C.Q<·lC.RETE ti\!0 BEt-\;-• "~C\.FiTERS~ INITIALISATION PS =C. KO L=l 8M =O. PS L=O. EN ?.G'!=O .. DO P !=J.,-1\!EL FCsACK( I l=l. E:.t;;.X(l l=Q.,
~ EZ=~O(I!=O., C READ CURV•TURE REQUIREMENTS
DO 'I l=l,NCR g REID(5 1 115l CR[Il
ll~ FCR~AT(f9.6i C C co~.PUTATION PHASE BEGINS C
CH.~NGE=.,,C0005 00 ~8 I=l,~!CR DIV=O. KDIV=O ff(T-ll 1,lJ,11
10 ~C=O. IF{CRtI)) 12~98,i3
11 IF(CR{1)-CRfl-1!1 12~98Tl3 ,o KGDE=Z
EC=EC-CHANGC !F{PSI-CR:I 1 l 98~98,l~
13 KODE=l EC==c..-,..:.HAN.;C: IF[PSI-CRfI}i 14,98,96
11,,. ~r..~-20100 .. C!....AG~r...;=1000,. KI NG=!.) KRJG=l i<FV=l c:::2oou2- .. t~\EC*~S-a00000000l' 97,15,15
l5 ~S:l~=EC~tl~-~~/AK~ ES£2l=~C*Clo-L~/A~S !?~4K~GT~C~J.AN8~Gc~TolOl~O]G=lODe sr-J=EL;"';:f~~/H 1,s=s:,: SR(l'=C''{l QSX{ll=O.., SR~2)=0 ... OS/\(2;:::.o., c.:.:::=0 ..
·RMCC=O~ J~IEC-~00020! l55vl55,1SL
COt~T :r'0UEC !: 2; P?:';,,..,~t,\ ::" ... l
154 Ci-lAf·IGE=. OOQ L C EVALLtT!ON OF ELENENTAL CONCRETE STRESSES
155 DO 24 J=l?~~L ~H=J E(Jl:EC*CSTJ-03+~5~/SN IF{~!J)-ENAX{J)) 16,16?18
16 !FfE{J:-fZERO{JJJ 20120,17 17 IF{E{Jt-ELAST{Jl J 172,172yl71
171 F{J,=o25=i3o~FHAX(J}+YMC*(E(J!-EZERO[JII) GO TC 24
lf~ F{Jl=~25*Y~C*(E(Jl-E!ERO(Jl: GC T·;: 24
~3 IF!Et~!-EC) 19?19~21 lq F(J!=~CC*12~~E!J~/EG-E(Jl*2!Jl/[EO*EOJl
JFtF~.J; ;20,2..:....,24 20 IF(FCqiCK(Jl-~51 201,201,202
201 ~{Jj=G., GO TC 24
2oz IF(E~Jl-EZERC{JJ~ER1 201~2037203 203 F{J)=Yi1C*(EtJ)-EZERO{JJl
GO ~C 24 2: 1Ff~;J)-E2D) 22,22123 22 F(JJ=FCD*{l~-L~\EiJi-ED);
GO :c 24 23 F { J; =FCD/5.,, 2 4 CONTP·~;JE
C STEEL AREA REDUCTION SP(l)=?(l'•FIITI QSR{l!=1~K-DD SRl2l=?t2}~F[I3J CS>U 2 J =AK-i. CC=CC-S~l!I-SR(2! BNCC=BMCC-SR!l}~JSR(lJ-SR[21*CSR{ZJ WI GTH Ft.C;QR. CDR?E:CT IONS f, T!:i.,lP:JRAR.Y} OG 31 K=l-:r~E::L AB=~ I~-[Ef~I-ECR1 25,25 1 2~
25 F(k~=F{K]*FW{K) . GG Tr 30
26 JF(K-!T) 27~28,22 27 F-{K ='Co
GD C 30 22, IF\ -l~,; 2:S1=27,27 2S i::{r( =Ff,<.;:::~E.OD 3,::, CC= •:-:-r r:~]/;;L ~t B~~ =BMCC F{K)~AK*{S~-AB+~S)/~~L*S~i~
C ST~ L ~~~ ES 005 5J=:; FS( '=vrr ~*(E5(Jl-EZE~ON~J1J K~:1=KP,C,,IJ (P . " ' GC TC ( 2~~s 5lrK~D
::: EL~STO- ~~ T SYSTE1J 3: I~IFStJ ~s ~ (J51 3·) 1 33,33 3) IF(l8S'. S{ -FY(J1l 56r56~3~
CONT IhtUEG ( 3 t
C
C
34 3'5
3b
37 3f:)
3 1J
40 41
1+14 415
42
4:l
44 445
45 46
464
4bo 466
47 4 75
48
485 49
:",r
IF(ABS!ES(Jl)-ESH(J!) 3'>,35,36 FS(J)=SJGN{FY(Jl,ES(J)l GO TO 56 TEMP=l. IF{ESiJJI 37,99,38 TEMP:-1. DELTA:ABS(ESH(Jl-•BS!ES(Jll)
CCNTINUED!,,,
FS( J)=TEl'P*FY(Jl*( (WH(J) *DELTA+2. l/( 60.*DELTA+2. l+DEL TA*IWC( Jl-WA! lJ! 1/WB(JI l
GO TC 56 , lf(ABS(FS(J)I-PT(JI) 56,56,40 ITERATION ROUTfNE FOR BAUSCHINGER STRESS DELTA=ABS(ElERON(Jl-ES(JJI PLAST=ABS{ElERON(JI-EZERCL(J)) FCH=FY(Jl*(.744/ALOG(l.+lOOO.*PLASTl+.071/(EXP(lOOO.*PLASTl-l.)+.2
141 l If!FCH-FY(Jll415,415,414 FCH=FY(Jl R=~VAL(NCYC(J)+ll ECH=FCH/YM(Jl ALPHA=OELTA/ECH GAMMA=ALPHA BETA=ALPHA-(ALPHA+ALPHA**R-GAMMAl/(l.+R*AlPHA**(R-1.)) IF(ABS(ALPHA-BETA)-10./FCH) 44,44,43 ALPHA=BEH GO TC 42 GO TC (445,50,55),KAD FS(J)=-FCH*BETA*SENSE(J) GO TO 56 BAUSCHINGER SYSTEM IF(ABS(FS(Jll-FT(JI) 56,56,46 If(FS(Jl*FSL(Jll 464,99,465 KA0=3 IFCABSIFSl!J) 1-FT(Jll 47,47,40 lF(A8S!fSLCJI l-FHJI l 466,466,47 !FtABS(ESLtJl-EZEROL(Jll-ABStEZERON(Jl-EZEROL(Jlll 40,99,47 IF(ABS{EZEROL{J)-ES(Jll-ED!FF(Jll475,475,48 !F(IEZERCN(Jl-cZERGL(Jll*IES(JI-EZER•N(Jlll40,56,56 :{=RVAL(NCYC!Jl I FCH=FY (JI* (. 744/ ALOG (l. +1000.*E IPL! J l l +.07l/ ( EXP ( 1000.*E IPL! JI 1-1.
11+. 24).) IF(FCH-FY(J)l49,49,485 FCli=FY(JI ECti=FCH/YM(Jl ALPHA=ABS(EZEROL(Jl-ES(Jll/ECH GAMMA=ALPHA GO TC 42 FSIJl=FCH*BtTA•~iGN(CNE,FSLtJll r;O TC 50
55 FS{Jl•-FCH•BETi*Sl~N(ONE,FSL(jl) s~ JF( \BS(F5(Jl i-fl.J(J) 1565,565,564
o 1,4 F S ( J l =SJ G N {FU! J) , FS ( J l l Sb~ co;nf,UE
CS=P(ll*.FS(ll
BMCS= S*iAK-DDl T=P(Z *FS(Zl Br,,T=T IAK-1.I AXIAL LOAD MOMENT BMP=BIGP*EP
~ EQUiLIBR!UM CHECK. CL~G=i+CC+CS-BlGP !F(KROG.EQ.2)GO TO 61 IF(CLAG~~.LE.ABSICLAGllGO TO 566 CLAGr,N=A8S(CLAGI AKBEST~A~
566 K H,~G=K 1 NG • 1, JF!KFV.EQ.2)GO TO 58 Kf\1=2 IFIEC•CLAGl59,bl,57
57 Al<=lOO. GO TC 15
5R IF(ABS(CLAGl.LT,0,33) GO TO 61 IF(EC*CLAGl59,61,60
59 AK=AK+-G !F(AK.GT,20000.0) GO TD 97 !F(~BSIA~l-0.00001)60,60,15
60 AK=AK-G G=.S*G IF(KING.GT.l50IGO rn· 61 IF(G.GT.O.OOOOOliGO TO 59
61 BMTOT=BMCC+BMCS+BMTtBMP IF(KROG.EQ,2.0R.ABS(CLAGI.LT.l.OIGO TO 62 AK=AKBEST KROG=2 GO TC 15
b2 !F(ES(ll**2.LE.ESU(ll**21GQ TO 63 WRITE!6,116l
116 FORMAT(lH ,'TOP STEEL FRACTURED'/////) GO TO 1
63 IF(ES12l*ES(2l-ESU(2l*ESUl2ll 65,65,6~ 64 WR-I TE ( 6, 11 7)
117 FORMATllH ,'BOTTOM STEEL FRACTURED~/////) GO TO 1
60 IF(KDIV)70,66,70 66 GO TC i67,68),KOD£ 1:,7 IF!EC-ES(ZJ-CR(lll 70,69,69 6A IFIEC-5S(2l-CR(Ilr 69,69,70 69 DIV=CHANGE*iEC-fS(Zl-CR(Ill/(EC-ES(21-PSII
TE MP=KODE DIV=OIV*(4.-3.*TEMPI/TEMP KDIV=l EC=EC-DIV GO TC 14
70 PST=EC-ES(Zl ENERGY=fNFRGY+,5•CBML+BMTOTl•(PSI-PSil}
CONTINUED( 51
nRITE(6,ll4) EC,AK,CC,ES(li,CS,ES(2l,T,BMTDT,PSl,KODE,ENERGV AKL=AK !F(ABStCLAG).Gf,l.OIWRlTE(6,ll55l
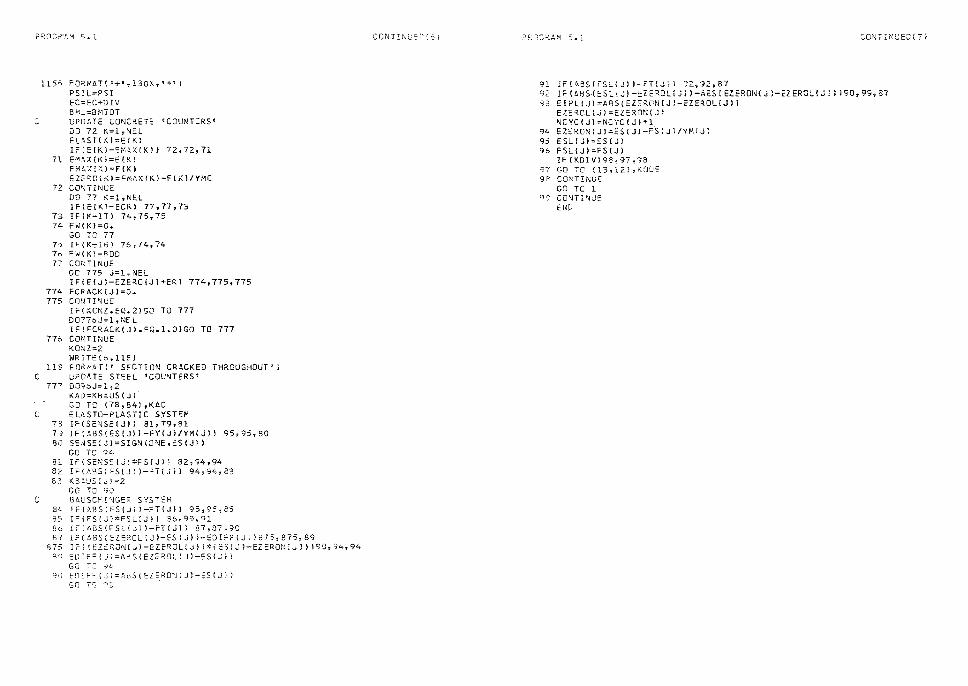
P~OG~·Ar,,, 5nl
C
1155 FO"MAT('+',130X,'*') PS!L=PSI
71
72
73 74
7'> 7b 77
774 775
776
118
777
EC=EC+DIV Bf<L=8MTOT UPDATE CONCRETE 'COUNTERS' DO 72 K=l,NEL EL,~ST(Kl=ECK) IF(E{K)-cMAX(Kll 72,72,71 EM~X(Ki=E(Kl FM!.X("-l=F(Kl EZc~C(KJ=~MAX{Kl-F(Kl/YMC co~~TINUE DO 77 K=l,NEL IF{EIKl-ECRl 77,77 1 73 !F(K-!TJ 74,75,75 FW(Kl=O. GO TC 77 IF{K~!Bl 76,74,74 FW(Kl=RDD cor,TINUE DO 775 J=l,NEL IF(E(J)-EZERO[Jl+ERl 774,775,775 FCR.ACK ( J l =O. CONTINUE IF(~CNZ.EQ.ZIGO TO 777 D0776J=l,NfL !F(FCRACK(Jl.EQ.l.OJGO TO 777 CONTINUE KONZ=Z WRITElt>,1181 FO~MAT[' SECTtON CRACKED THROUGHOUT' I uPnATE STEEL 'COUNTERS' D01oJ=l,2 KAD=KB~US ( J 1 · GD TC (78,84),KAD
C ELASTO-PLASTIC SYSTEM 73 JF[SENSE(J)l 81,79,81 7~ IF(ABSIES(Jll-FY[Jl/YM(J)l ~5,95,80 80 SE~SEIJl=SIGN(• NE,ES(J)l
GO TO 94. 8 l IF ( SE 'IS E [ J l *F S ( J l l 8 2 , 94, 94 32 !F{ASS[~S(JJ)-FT(Jll 94,9k,83 83 KBO,US,JJ=Z
GO TO go C 84USCH!NGER SYSTEM
84 If!ABS(FS(J;J-:'T(Jll 95,95,85 85 IFIFS(Jl*FSLIJ)) Bb,99,91 Sb 1,::{1\BS(rs;.~(j})-FT(J)) 27,S7~90 87 lr(A8S(EZERCL(Jl-ES(J)l-EOI:-F(JJl875,875,89
S75 1;-t ltZt:RiJNtJ)-EZEROL:J} )*i ES(J }-EZERON[J J) 190, 94,94 Bg ~OIFFIJJ=ABSIEZEROL(JI-ESIJll
GO T==:' ~.!.: ~0 EnIFF(Ji=A5S(EZERO~IJ)-ES(Jll
,:;f'} T') ,..i-:i
CON1INUEC'''. 6 'f r,c:n:;:-~AtJi 5.1. CO['>lTINUED{7)
9 IF(.\BS( SLL!l ,-FT{JI} 92~92,87 9 IF(ABS{ SLIJI-EZEROLIJll-AESIEZERONIJI-EZEROLIJll!90,99,87 9 EIPL[Jl ABS!EZ"RQN(Jl-EZEROL(Jll
EZEROLIJJ=EZERON(JI NCYCIJ)=NCYC(J)+l
94 EZERONIJl=ES(J)-FS(JI/YMIJI 9S ESLIJl=!:S!Jl 9& FSLIJl=FS(Jl
IFIKOIVl98,97,98 97 GO TO (13,12!,KOO~ 9,-:: CO'."JTINUE
GO TC l Qlj CONTlNUf
END
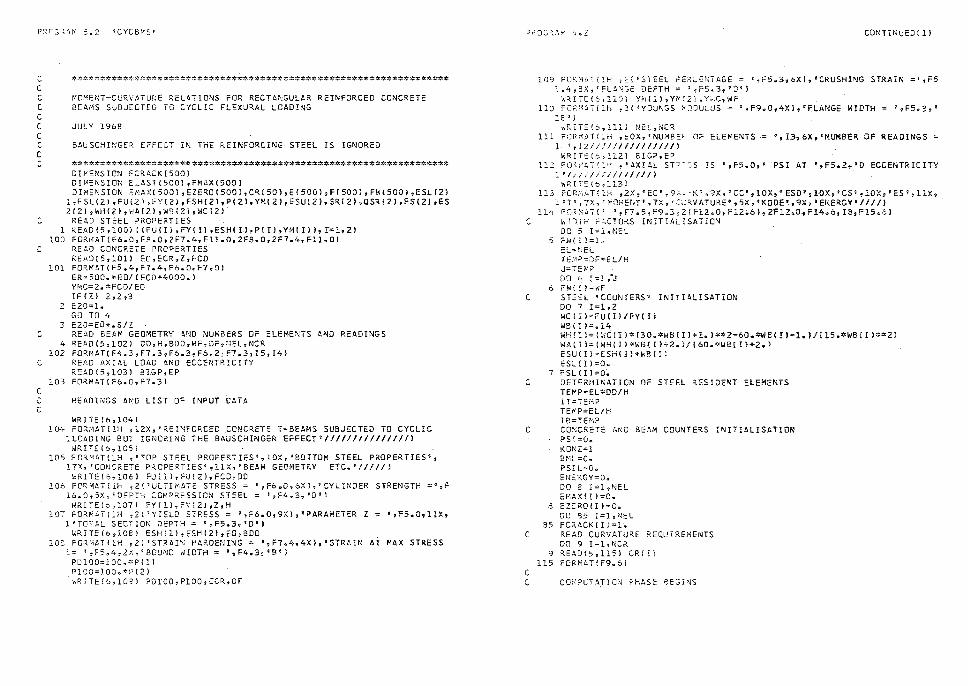
PRD~~~M 5~2 icYCB~Sw
C C C C C C C C C C
C
C
C
C
C -C. C
1 100
101
2
3
4 102
103
**;:,::*******:.!::.i::*******:t:***.:¢:**************~***#****************:.:i:::r.,:C****
MOMENT-CURVATURE RELATIONS FOR RECTANGULAR REINFORCED CONCRETE BEAMS SUBJECTED TO CYCLIC FLEXURAL LOADING
JULY 1968
BAUSCH!NGER EFFECT IN THE REINFORCING STEEL IS IGNORED
*****#*******.:¢:********************~***********~****************** DIVENSION FCRACKl500) DIMENSION ELASTl500J,FMAXC500l DIMENSION EMAX(500l,EZER0!500l,CRl50J,El500J,F(5001,FW(500l,ESL(2)
1,FSUZl ,FUCZ i ,FY(2l ,ESH(2!,P( 2l ,YM( 2) ,ESU(21, SR( 2) ,QSR(2l ,FS(2l ,ES Z(Zl,WH(Z),Wl(2] ,we121,wcc21·
READ STEEL PROPERTIES RE,40 [ 5, lOOi ( ( FU [ I J , FY! I J , ESH ( I l ,P ( I l, YM ! I l l, r=l, 2 l FORMAT(F6.0 1 F8.0,2F7.4 1 Fll.0,2F8.0,2F7.4,Fll.Ol READ CONCRETE PROPERTIES READ(S,1011 EO,ECP.,l,FCO FOP.MAT(F5.4,F7.4 1 F6.0,F7.0l ER=500.*EO/[FCD+4000.J YMC=Z.*FCD/EO IF!Zl Z,2,3 EZO=l. GO TO 4 E20=EO+. 8/Z READ BEAM GEOMETRY ~NO NUMBERS OF ELEMENTS AND READINGS READ!S,102) CD,H,BDD,WF,DF,~El,NCR FOP.MAT(F4.3,F7.3,F6.3 1 F6.2,F7.3,!5,!4l READ AXIAL LOAD ANO ECCENTRICITY READ(5,103J BlGP,EP FORMAT(F6.0,F7.3)
HEADINGS AND LIST OF INPUT bATA
WRITE !6,1041 104 FORMAT<lH .12X,'REIMFORCED CONCRET:: T-BEAMS SUBJECTED TD CYCLIC
llOADING BUT IGNO?-!NG THE BAUSCHINGER EFFECT'///////////////) WRITE,6,1051
105 FORMAT!lH ,•TOP STEEL PROPERTIES',IOX,'BOTTOM STEEL PROPERTIES', 17X, 1 C011JC:RETE PROPERTIESq 1 llX-, 1 BEAM GEOMETRY ET-C.'/////)
WRITE{6,l06} FU\llt~U{Zl,FCD,DD 106 FO'!MAT(rH ,2('ULTIMATE STRESS= • ,F6.0,-6Xl,'CYLINOER STRENGTH =',F
l6.0 1 5X,~DEPTH COMPRESSION STEEL= 1 ,F4~3~ 0 0'} WRITE!o,1071 FY(ll,FY121,Z,H
107 FO~MtT[lH ,21'YIELD STRESS= 1 ,F6.0 1 9Xl,'PARAMETER Z = •,F5.0,11X, l'TOTAL SECTION DEPTH= •,F5.3,'0'1
WR!TE(o,108) ESH(ll,ESH{2l,EO,BOO 102 FORMAT f lH ,2! 'STRAIN HAKOENING = •,F7.4,4Xl, 1 STRA!N AT MAX STRESS
l= t~F5~4~2X 1 'BOUND WIDTH= ',F4.3~'8') PDlfJO 100,*P(li PlOO= OO.*P(2)
·wR!TE '>,1091 PDlOO,PlOO,ECR,OF
P~ci:;K1\~, '.).,2 CONTINUED! ll
r v
C
::
109 FO~MAT(lH, l.4,BX, 1 FLAN
~RITEl6 1 110 110 FORM~T!lH
lB'l
{'STEEL PE?.CENTAGE = ' 1 F5~3,6X},'CRUSHil\!G STRAIN =;,F5 E DEPTH= ',F5,3,'0' i
Yf•i{l} ,yr,,,:21 .,Y!-:C,WF ('YOUNGS ~C •ULUS = ',F9.0,4Xl,'FLANGE WIDTH= ',F5.3,'
WKITE(6 9 lll) NEL,NCR 111 FcJRMAT(;.H ,oOX,'NUM8EC OF ELEl'ENTS = ',I3,6X,'NUMBER OF READINGS=
1 ',!2///l///////////1 WRITf(c,ll2) BIGP.,EP
112 fc),{,'-'t~'>' ,'AXIAL STR-,S IS •,Fs.o,• PSI AT ',Fs.z.•o ECCENTRICITY i '!11///!l/l//f/f)
WRliE{o,113) 113 FORMAT(!~ ,2X~'EC'~9~~ Kt.9x.~cC 1
9 lOX~eESD'slOX,tCS 2 ?10X~'ES 0 ,11Xs l • T', 7X, 'i"OMENT', 7X, 'C:..:RVATURE', 5X, 'KODE•, 9X, 'ENERGY'// I /l
l 1'1- FD1~ :-rnT l ~ ~ 1 F7 415 'F9.., 312 ( F12.o., Fl2•6}" 2F12 .. 09 fl-406, IS, Fl5.a6] ~T')TH f~CTORS INITIALISATION OG 5 l=l.NEL
5 F.Wt I 1 =l ... EL=d~EI_ TEt,1"=DF"'EL/H J=TE\VP DO A :=1 y"J
6 FW(f)=WF ST[El •COUNTERS• INITIALISATION DO 7 I=l,Z WC(Il=FU[Il/FY(Il WB(Il=,14 WH !I!= { WC (II* (30,*WS ( I l+l. l**2-60.*W21 I l-1. l /i 15.'>WB{ I l**Zl WA(ll=(WH(ll*WB(Il+Z.)/!60.*WB!IJ+Z.l ESU(Il=ESH(ll+~B(ll ESL! I J =O.
7 FSL!I l=O. DEH,:MINAT10N OF STEEL RESIDENT ELEMENTS TEMP=EL*DD/H IT=TEHP TEMP=EL/H I8=THiP
C CONCRETS AND SEAM COUNTERS INITIALISATION PSt=O. KONZ=l BML=O .. PSIL=O. ENERGY=O. DO 8 l=LNEL EMAX(Il=O.
8 EZERO{I )=O. DO B5 I=l,NEL
85 FCRACK(I)=l. C READ CURVATURE REQUIREMENTS
DO 9 I=l,NCR
C
9 READ(5,1151 CRf!i 115 FORMl,T ( F9. 6 l
C COMPUTAT!O~ PHASE BE;INS
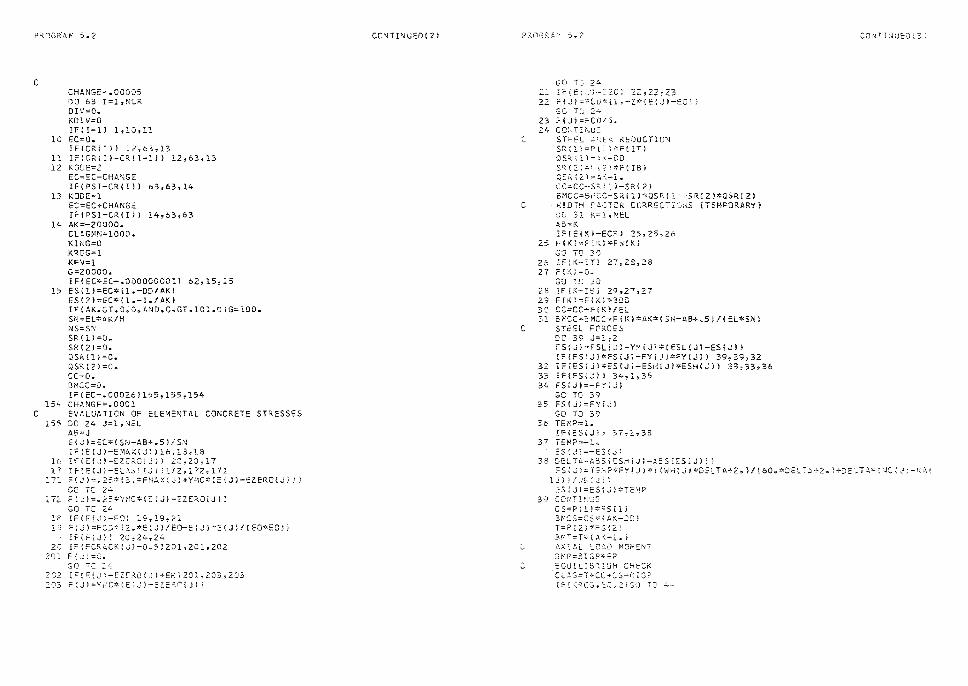
P~ OGR,H' 5. 2
C CHANGE=.00005 110 63 I =l , NCR DIV=O. KDlV=O IF(I-ll 1,10,11
10 EC=O. !F!CR(Ill 12,63,13
11 !F{CR(Il-C~(l-cll 12,63,13 12 KODE=2
EC=EC-CHA"IGE IFIPSI-CR(I)l 63,63,14
13 KODE=l EC=EC+CHANGE IF(PSI-CR(I)) i4,63,63
14 AK=-20000. CUGMN=lOOO. KHIG=O KROG=l KFV=l G=20000. IF(EC*EC-.0000000011 62,15,15
15 ES(ll=EC*(l.-DD/AKJ ESl2l=EC*ll.-l./AK) IFIAK.GT.O.O.AND.G.GT.101.0lG=lOO. SN=EL*O K/H NS=SN SR(l)=O. SRl2)=0. QSR (l l =O. QSR(2l=O. CC-=O. 8MCC=0., IF(EC-.00026il55,155,154
15<. CHANGE=.0001 C EVALUATICN OF ELEME~TAL CONCRETE STRESSES
155 DO 24 J=l,NEL AR=J E{J)=EC*(Sf~-AB+o5)/SN JF{E(Jl-EMAXCJ}}l6113~18
lt If{EfJl-EZCROlJ)) 2Gt20 1 17 17 If(E{J}-Ei.AST(J) ~172,172tl71
l?l F(J)=~25~(3~*FM~¼(JJ+YMC*CEIJJ-EZER• {J; )) GO TO 24
.i. rL F ( J}= .. 25*YMC*(E ( J}-EZER.O\J P} GO T z,:,.
lP If{E J!-EO} 19,19,21 19 F(J) FCD~i2~*E(Jl/EO-E(-JJ*E[Jl/[EO*EO!l
!FlF J)) 20,24,24 20 IF{F RACK(J}-0.53201,201,202
2G l F-: J / C•,. GO T ;4
2G2 IF[~ J~-EZ~RO[J!+ER)201 7 203,203 2·J3 F(Jl Yi-1C:::t{E(J}-EZ~RIi{J?!
CO,~ T !'WED ( 2 l ?R.\7:~:.::~61· :;, ,,. i
GO TC 2'-21 Ir 1.ELn-::2.0; 22,22!23 22 F(Jl=FCD~(i.-Z*(E{Jl-EO!J
GO TC 2.:... 23 HJl=fC0/3. 24 cc:<nisuc
C STFEL ~~EA REDUCTION SR(l:=Pl, :>-F( IT) OS~~ 1 }-:::_,:,-GO S'< ( 2: =' , , , *F [ lB i QSI~ {Z 1 =~(·~-i. CC:CC-5R!1J-SR(2J 6MCC=61·iCC-SKllJ'":::QSP.{ 1 -SR.~2)*QSR(2}
C ,;!DTH '°'CTQR CGRRECTI•j,,S (TEMPORARY) CG 3-1 K=l-,NEl
C
t,S=K IF<EIK)-ECRJ 25125,26
25 FIKi=F'~l•F-IKJ
26 27
28 29 30 31
32 33 3,,
35
36
37
G:J T•J 30 IF{K-:tT] 27 7 28,28 F(\/=0-GG TC 30 !F(K-!5) 29,27,27 F{K~-::;f{K}-t:;30D CC=CC •--F{K)/':L c;~1cc=e r-lCC+F { K} *A:<:6:1 Sr-J-AB+ ... 5 i I { EL*SN ~ STEEL FORCES D2 39 J=lf2 FS(Jl=FSLIJI-YM[Jle(fSLIJl-ES{Jll IF(FS(JJ*FS!Jl-FY[Jj*~Y(JJJ 39,39 1 32 IF(ES(Jl*EStJl-ESHIJl•ESHIJll 33 1 33,36 !FIFS(~: l 34,1,35 FS{J)=-FY{J} GO TC 39 FS(J}=FY{Ji GD TO 39 TE~P=l. IF{ES,J1i 37~:~36 TE:M?=-1,:, ESSJ}=-ES{Jd
CQ1\i\ INUEJ ~ 3:
38 DELTA=ABS{ESHiJI-A5S[ESfJ)!' ~S[J~=T~~.?*FY(J)~(!WH!J)*D~LTA+2.l/[60a~JE~TA+2~l+DELT!='.!~C:J:-~~!
lJ/J/1~;3fJJ/ ES[JJ=ES{Jl*TEMP
3-J CCNTI~l\..:E CS P{lf*'.=Slll BM S=cs::, r Ai<-;j~) T= 12l*FS(2J pr-.1 =T::~{AK-i. ~
AX AL LCAD MOMCN7 5M =BIGP*'.:?
~ EO IlI5~lUM CHECK CL G=T+CC+C~-BIG? IF Z~OG.tJ~2)S0 T~
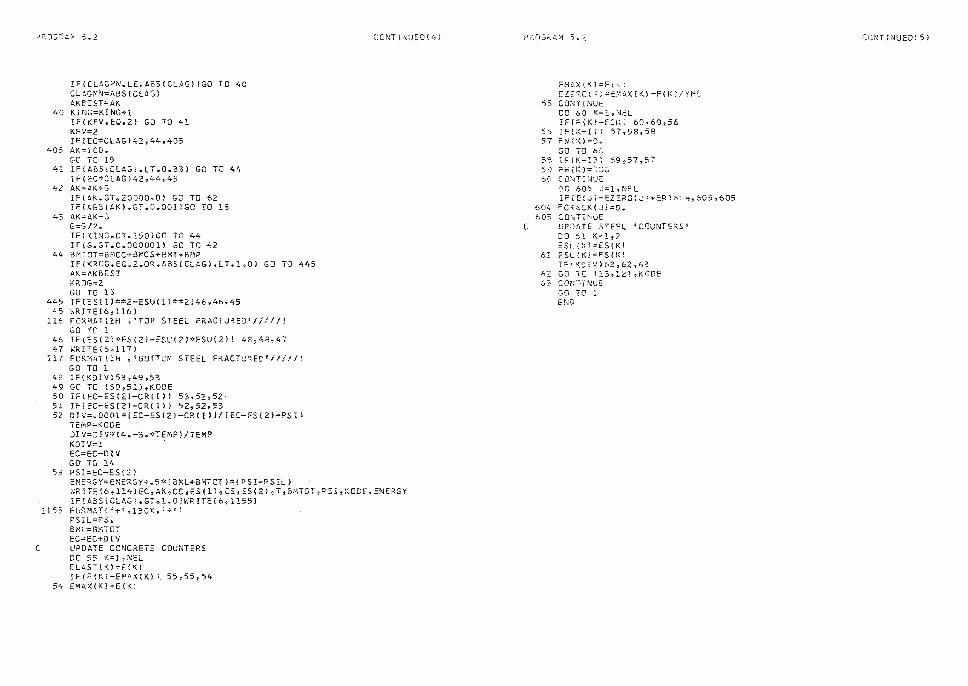
pRc_:i::;;:'.~iv- 5~2
IFICLACrN.LE.ABS(CLAG) IGO TO 40 CLAGMN=ABS(CLAGI AKBEST=AK
40 KING=K!NG+l If{KFV.EQ.2) GO TO 41 KFV=2 IFIEC*CLAGJ42 1 44,405
405 AK=lOO. GO TC 15
41 IFIABSICLAG).LT.0.331 GO TO 44 !F(EC*CLAGl42 7 44~43
42 AK.:.AK+G IF!AK.GT.20000,0l GO TO 62 IF{ABS{AKJ.GT.O.OOllGO TO 15
43 AK=AK-G G=G l2~ IFIKING.GT.l50JGO TO 44 !F{G.GT.0.000001) GO TG 42
44 BMTOT=BMCC+BMCS+BMT+BMP TF{KRDG.EQ.2.0R.A85(CLAGl.LT.l.Ol GD TO 445 AK=AKBEST KRrJG=Z GO TO 15
445 IF{ES!ll**Z-ESUlll**2)46,4o,45 45 •RITEl6,116J
116 F• RMAT{lH ,'TOP STEEL FRACTURED'/////) GO TC 1
46 IFIES{2l•ES12l-ESUC2l•ESUl21l 48,48,47 4 7 ~RI TE ( 6 ~ 11 7}
117 FCRMQT{lH ,'BOTTOM STEEL FRAC~URED'/////1 GO TO 1
42 IF{KDIVl53,49,53 49 GO TO !50,51),KODE 50 IF!EC-ES!ZJ-CRC!Jl 53,52,52 51 IF1EC-ES{Zl-CR(Il) 52,52,53 52 DIV=.OODl•[EC-ESIZl-CR!Il)/[EC-ES(ZJ-PSil
TEMP=KOOE :JI V=:J IV* (4o -3 .. *T EMP} /TEMP KDIV=l EC=EC-DIV GO TG 14
53 PS1=EC-ESt.2I ENERGY=ENE?-G Y+. 5 * ! a/il+BMTOT J *!PS !-PS lL J
CONTINUE0(4J
l<JR :I TE {6 7 114) EC~ ~K 1 CC ,ES ( l l 1 CS, ES { 2) ~ 7 r BM TOT .,::-sx ,KODE, ENERGY !FIABS(CLAGI.GT • l.OlWRITE16,1155J
1155 FG:-"tMAT( ~+i: ,-130Y., ~*t)
PS!L=PS! BML=BM,OT EC=EC+D!V
C UPDATE CONCRETE COUNTERS DO 55 K=l, NEL ElASTlK) =El Kl
·IFl~IKI-E~AX(K) I 55 1 55 1 54 54 EMAX(Kl=E(KJ
p;:~0;;~4:--1 5 .. 2.
f=MC.XtK)=f-lKl EZE~C{.K!=~VAX{KJ-F{Kl/Y~~
55 co:nINUE DO 60 1(=1, NEL iF{E(K?-ECI~} 60-60,56
5b IF(K-ITI 57 1 58,58 57 F~J( !() =O,
GO TO bG SB lFiK-1R} 59,57,57 5'0 ~v; ( l<.)=,·::;z; 60 c o:\i-i rr~uc:
DO 605 J=l 1 M!:L !F( EiJi-EZEROC.: H·ER)6: 'f-,605.,605
60L;· "C~~CK I J) =O. 605 ::,Q,-~Tl~IU(
C UPO~TE STEEL 'COUNTERS~ DO 61 K=l,2 ESL'.:O=ES!K!
61 FSL !K)=FS(I\) 1 := f KD I'./) 63,621 63
62 GO 10 ll3rll) 1 KODE 6:C, CGNHNUE
GO TC l END
<'.:::J:~TINUED c 5 l
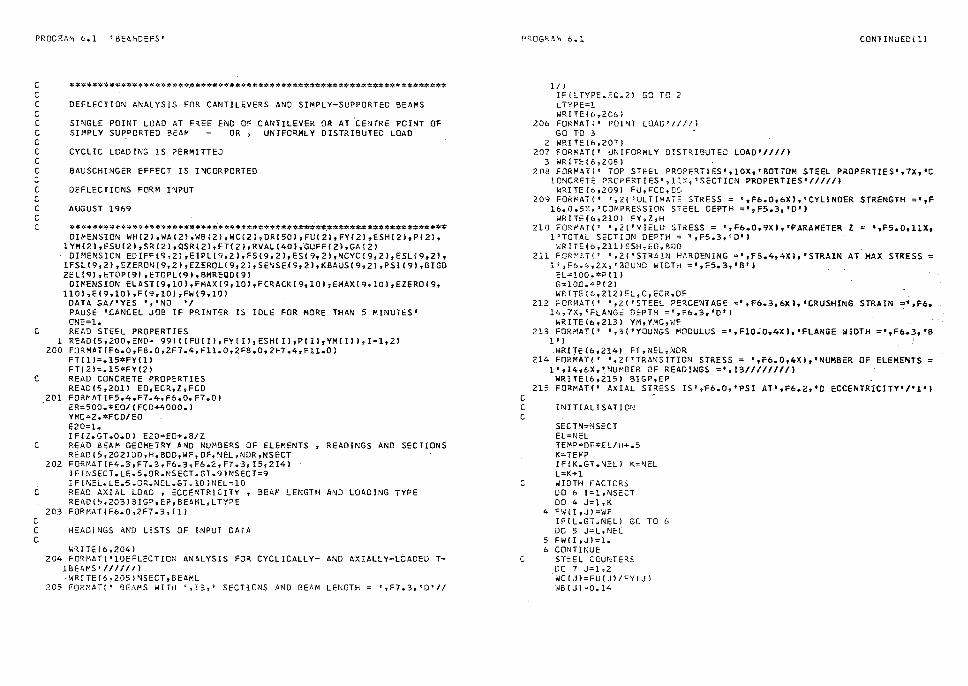
PROGRAM 6.1 'BEAMDEFS'
C C C C C C C C C C C C C C C C
C
C
C
C
C C C
1 200
201
202
203
~*******************·*************************::(,I:************~***** DEFLECTION ANALYSIS FOR CANTILEVERS AND SIMPLY-SUPPORTED BEAMS
SINGLE POINT LOAD AT FREE ENO OF CANTILEVER OR AT ,CENTRE POINT OF SIMPLY SUPPORTED BEAM - OR, UNIFORMLY DISTRIBUTED LOAD
CYCLIC LOADING IS PERMITTED
BAUSCHINGER EFFECT IS lNCORPORTED
DEFLECTIONS FORM INPUT
AUGUST 1969
*********.:e:********************:O'********~*~·********************* DIMENSION WH(2l,WA(2l,WB(2l,WC{21,DR(50l,FU(2l,FYl2l,ESH(2l,P(2J,
1YM{2l,ESU(2J,SR!2l,QSR(2J,FT(2J,RVAL(40l,GUFF(2l,GA12J DIMENSION EDIFF!9,2J,EIPL(9,2l,FS(9,2l,ESl9,2l,NCYC19,2l,ESLl9,2l,
1FSLl9,2l,EZERON!9,2l,EZEROLC9,2l,SENSEl9,2l,KBAUSl9,2J,PSIC9l,BIGO 2EL(9J,ETOP(9J ,ETOPL(9l,BMREQ0(9J
DIMENSION ELAST(9,lOl,FMAX(9,101,FCRACK(9,lOl,EMAXl9,lOl,EZER0(9, 110l,E(9,lOJ,F(9,lOJ,FW(9,101
DATA GA/'YES ','NO 'I PAUSE 'CANCEL JOB IF PRINTER IS IDLE FOR MORE THAN 5 MINUTES' ONE=l•
READ STEEL PROPERTIES READ(5,200,END= 99l((FU(ll,FY!Il,ESH(IJ,P(Il,YM(lll,I=l,21 FORMAT(F6.0,F8.0,2F7.4,Fll.0,2F8.0,2F7.4,Fll.Ol FTlll=.l5*FYlll FT(2l=.15*FY(2l READ CONCRETE PROPERTIES READ(S,2011' EO,ECR,Z,FCD FORMATIF5.4,~7.4,F6.0,F7.0), ER=500 • *EO/(FCD+4000.I YMC=2.*FCO/EO E20=1. IF(Z.GT.0.01 E20=E0+.8/Z READ BEAM GEOMETRY AND NUMBERS OF ELEMENTS, READINGS AND SECTIONS READ ( 5, 2021 DD, H, BDD,WF, OF, NEL ,NOR ,NSECT FORMAT(F4.3,F7.3,F6.3,F6.2,F7.3,I5,2I4l IF{NSECT.LE.5.0R.NSECT.GT.9lNSECT=9 IF(NEL.LE.5.0R.NEL.GT.lOINEL=lO READ AXI1\l LOAD , ECCENTRICITY , BEAM LENGTH AND LOADING TYPE READ15,203JB1GP,EP,BEAML,LTYPE FORMAT(F6.0,2F7.3,Ill
HEAOI NGS ANO LISTS OF iNPUT DATA
WRITE {6 1 204) 204 FORMAT( 'lDEFLECTION AN.4LYSIS FOR CYCLICALLY- AND AXIALLY-LOADED T
lBEAMS • /// // /J ,WR[TEl6,205JNSECT,BEAML
205 FO~MoT(' BEAMS WITH ',13,' SECTIONS AND BEtM LENGTH ',F7.3-, '0 1 //
DR,OGC:A~, 6. l CONTINUED(ll
C C C
C
C
1/j IF!LTYPE.EQ.21 GO TO 2 LTYPE=l WRITE{6,2C6 l
206 FORMAT(' POINT LOAD'////) GO TO 3
2 WRITE{b,207) 207 FORMAT{' UNIFORMLY DISTRIBUTED LOAD•////)
3 WRITEH,,208) 208 FORl'AT!' TOP STEEL PROPERTIES',lOX,'BOTTOM STEEL PROPERTIES•,7x,•c
lONCRETE PROPERTIES',l~X,'SECTICN PROPERTIES'/////) WRITE!6,209l FU,FCD,CD
209 FORMAT{' ',Z( 'ULTIMATE STRESS= ',F6.01 6XJ,•CYLINDER STRENGTH =•,F 16.D,5X,"COMPRESSION STEEL DEPTH =',F5.3,'D'I
WRITE(6,210l FY,Z,H 210 FOC:l'AT(• ',2('YIELD STRESS= ',F6.0,9Xl,'PARAMETER Z = •,F5.D,11X,
l'TOTAL SECTION DEPTH= ',F5.3,'D'I WRITEl6,2lllESH,EG,BDD
211 FORMAT!' ',2('STRAIN HARDENING =',F8.47 4Xl, 'STRAIN AT MAX STRESS l',F&,4,2X,'30U~O WIDTH = 1 ,F5 • 3,'B'I
EL=lOO.*P(ll G=lO.O.*P!2l WRITE(6,212lEL,G,ECR,OF
212 FORMAT(' ',2{'5TEEL P~RCENTAGE =',F6.3,6Xl, 'CRUSHING STRAIN =•,Fo. l4 1 7X,'FLANGE DEPTH =~,F6 • 3,'D'l
WRITE(6,213l YM,YMC,WF 213 FORMAT(' ',3('Y0UNGS MODULUS = 1 ,Fl0~0,4Xl,•FLANGE WIDTH :•,Ft..3,'8
l') I
WRITE(6,2141 FT,NEL,NDR 214 FORMAT(' ',21'TRANSITION STRESS= ',F6.0,4Xl,'NUMBER Of ELEMENTS=
1',14,oX,'NUMBER OF READINGS =',13////////J WRITE(6,2151 BIGP,EP
215 FORMAT{' AXIAL STRESS IS',F6.0,'PSI AT',Fo.2,•o ECCENTRICITY'/'l')
INITIALISIITICr,
SECTN=NSECT EL=NEL TEMP=DF*EL/H+.S K=TEt'P IF!K.GT.NEll K=NEL L=K+l WIDTH FACTORS DO 6 1=1,NSECT DO 4 J=l,K
4 FW(I,Jl=WF IF(L.GT.NELl GD TO 6 DO 5 J=L,NEL
5 FW(I,JJ=l. 6 CONTHIUE
STEEL COUNTERS DO 7 ,1=1,2
'wc(JJ=FU(Jl/FY(J) WB(Jl=0.14
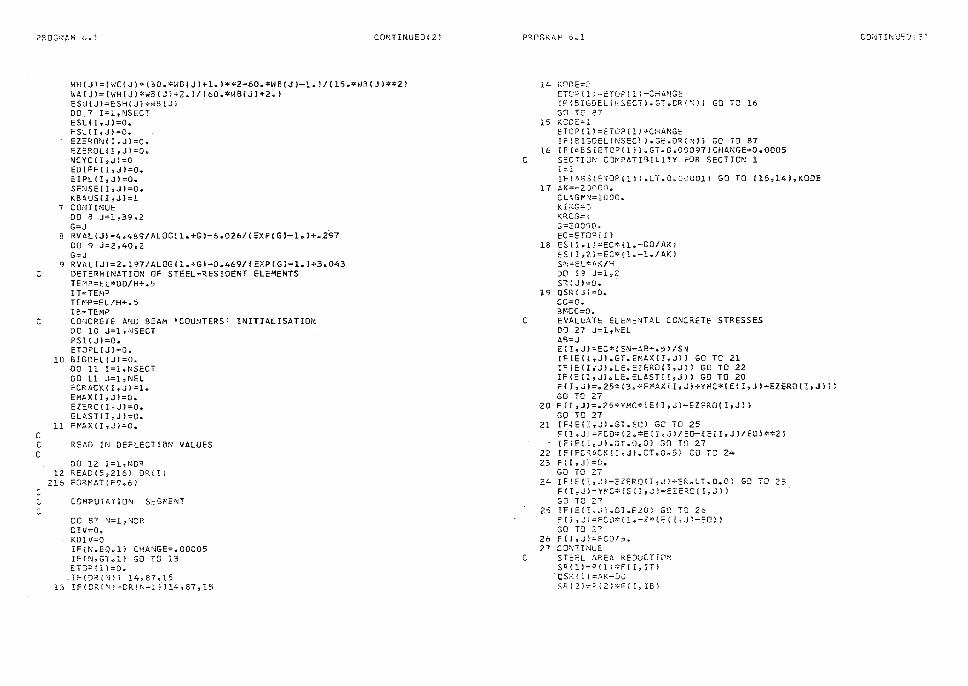
PP,OGR"t.M v .. i C0NTINUE0{2;,
WH(J)=[WC(J)*(3D.*WB!Jl+l.1**2-60.*WB!Jl-l.l/(15.*WB(Jl**2l WA(Jl=CWH(Jl*W5(Jl+Z.l/(60.*WB(Jl+2.l ESUIJl=ESH(Jl+WB!Ji DO 7 I=l,MSECT ESL( I ,J )=O. FSLII,Jl=O. EZERONII,Jl=O. EZEROUI,Jl=O. NCYCII,Jl=O EDIFFII,Jl=O. EIPLII,Jl=O. SENSE(I,Jl=O. KBAUSII,Jl=l
7 cmJTINUE DO 8 J=l,39,2 G=J
8 RV.AL ( J l =4 .489/ ALOG( l .+G l-6.021>/ I EXP I G l-1. J+. i97 DO 9 J=Z,40,2 G=J
9 RVALIJl=2.197/AL0Gll.+Gl-0.469/!EXP(GJ-l.l+3.043 C DETERMINATION OF STEEL-RESIDENT ELEMENTS
TEMP=EL*DD/H+.5 IT=TEMP TEMP=EL/H+.5 IB=TEMP
C CONCRETE AND BEAM 'COUNTERS' INITIALISATION DO 10 J=l,NSECT
C
PSICJJ=O. ETOPLC J l =O.
10 BIGDELC Jl =O. DO 11 I=l, NSECT DO 11 J=l,NEL FCRACK(I,Jl=l. EMAX(I ,Jl=O.· EZERCII,Jl=O. ELASTII,Jl=O.
li FMAXII ,Jl=O.
C READ IN DEFLECTION VALUES C
DO 12 I=l,NOR 12 READ(S,216) DR(Il
216 FORMAT!F9.6J C C COMPUTATION SEGMENT C
DO 87 N=l,NDR DIV=O. KDJ V=O IF{N.EQ.11 CHANGE=.00005 IffN.GT.ll GO TO 13 ETOP!ll=O.
-IF(DRINII 14,87,15 13 !f(DR(~I-DR{N-11114 1 87,15
pq,QGRL.t-I 6~ 1
14 KOOE= ETOP(l~=ETUP[lJ-CHANGE IF(BIGDEL(~SECTl • GT.CR1~ll GO TO 16 GO TC 87
15 KCDE=l ETOP(ll=ETLlP(li+CHANGE JFIBIGDELINSECT).GE.DRIN)J'GO TO 87
16 IFIABSCET•P(lll.GT.0.0• 097lCHANGE=0.0005 C SECTIJN COMPATIBILITY FOR SECTION l
1~1 IF(ABS!ETOP(lll • LT.O.GOOOll GO TO !15,14),KODE
17 AK=-20000. CUGJ\'N=lOOO. KHG=O KROG=l G=20000. EC=ETOP(ll
18 ESCI,ll=EC*ll.-DD/AKi ES(!,2J=EC*(l~-l~/AK) S>,=EL''~.l</H DO B J=l,2 SR(JJ=G. .
19 QSR{Jf=O. CC=O. BMCC=O.
C EVALUATE ELEMENTAL CONCRETE STRESSES DO 27 J=l,NEL AB=J El!,JJ=EC*(SN-AB~.5)/SN IF(E(l,Jl.GT.EMAX!!,JJ) GO TC 21 IFIEIIiJl.LE • EZERO(l,Jll GO TO 22 IF(E{I,Jl.LE.ELASTII,Jll GO TO 20 FII,JJ=.25*13.•FMAXII,Jl+YMC•CEII,Jl-EZEROII,Jlll GO TC 27
20 F(I,JJ=.25*YMC•IE!I,Jl-EZEROII,Jll GO TC 27
21 IFHII,JJ.GT.ECJ GO TO 25 F(I,J)=FCD•(2.•EII,JI/EO-IE(I,JI/EOJ••21 IF(F(1 1 J).GT.O.Ol GO TO 27
22 IF(FCRACK!I,J).GT.0.5) GO TC 24 23 F(l,Ji=.O.
GO TO 27 24 IF(E{X,J~-CZERO\I1J}+ERelTeO.O} GO TO 23
Fll,Jl=YMC*IEll,JI-EZEROII,JII GO TO 27
25 IF{E(I,J1.GT.E20J GO TO 26 F(I,J•=FCD*(l.-Z*(E(I,Jt-EO)J GO TO 27
26 F(I,J)=FCDl5. 27 CC'JTINUE
C STEEL AREA REDUCTION SRlll=PllJ*F(l,ITl
·qs?s(ll=AK-Du SR ( 2 > = P.; ~) ~q:: ( I, I 8 i
COhlTif\l.;ED '. 3 r
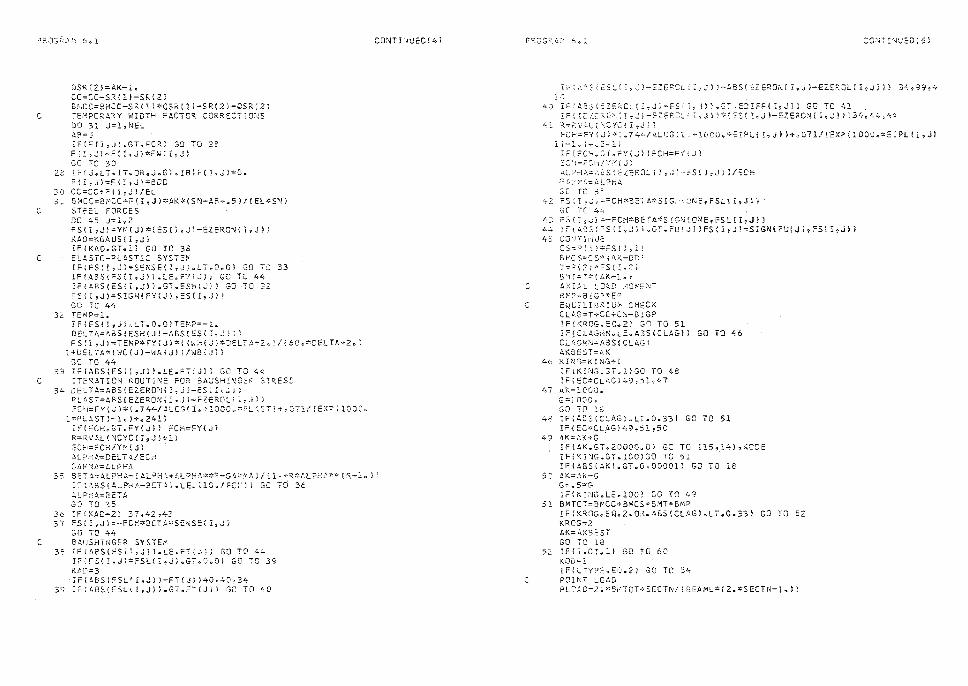
P?,O:;~•.~;v, b., l
C
QSR,(2.J=AK-1. CC=CC-SR!ll-SRIZ) BMCC=BMCC-SRl1)8QSRl11-SRl21-QSRl21 TEMPORARY WIDTH FACTOR CORRECT!ONS DO 31 J=l,NEL Al\=J IF{E{i,J~.GT~ECRJ GO TO 28 F(!a;-J}=Ff1,J}*Fl,dI 1 J)
GO TC 30 23 lF'.J~LToIT~ORQJ~GT~IB)F[I 1 J)=O.
FfI,JJ=F[!,J}~BDD 30 CC=CC+~{i 1 J)/EL 3~ 5~CC=B~cc~Ft!,J)*AK~{SN-AB+~5)/IEL*SN)
C ST~~L FORCES DO -45 J::1 1 2 FS{I,JJ=YM[J)~(ES(ivJl-EZERONCirJ'l KAO=KBA US (1 , J l IFIKAD.GT • ll GO TO 3S
C ELASTO-PLASTI: SYSTEM IF{FS{i,J)*SENSE{I~J,~L rO~O} GO TQ 33 IF!ABS(FS{I,Jl1.LE~FY[~ GO TO 44 IF-{ABS{ES-~I1'J)) .. GT,,.!:Sl-i\ it GO ·T:J 32 ~S(i,JJ=S!GN{FY(Jl,ES[I,Jl] GC TC 44
32 TE~P=l. 1F{fS{I 1 J,tLT.O~O}TEMP=-l~ D~LTA=,,ilS(ESH(Jl-ABS!ES, I,J); I FS(l ,JJ;TEMP~FY{J1*( (~✓ l-:(.Ji*D2LTA+2.-. )/{60~:'!':DELTA ❖2e}
l+DEL.fA*lWC!JJ-WA!Jl l/WB;,!)) :;o TC 44
33 IFLlBS{FSCI,J}} .. LE,.FT~J)J GO O L;-4 C ITfRATION ROUTINE FOR 3AUSH!N :: 1
: STi:zESS 3~ JELTA=ABS{EZERON(l,J)-ES(!~~!
PLAST=ABS(EZERON(l!J)-EZEROl( ~JJ) FC~=FY~J)*[~74~/ALCGCl~ ❖ lOOO~ PL~ST] • a071/[EXP(l002o
l~PLlST~-l~)+.2411 l~IFCH.GT.FY(Jll FCH=FY(Jl R=RVjL(~CYC(I,JJ+l) cCH=FCH/YM(Jl L',L;':--'A=DELT,,~/ECH
CONTli,UE0{4l
3~ GA/v'.:.~A-=t..LPH!... 5ETA~ALPH~-(ALPH~+ALPHA~»R-SA~~A)/~l,4R*ALPHA**[R-l@lt I?t,'.\SS[AI_Pl--lA-BETAi.LE.,lC,/FCHll GQ TO 36
3b -., ~-C
3~
3q
ALPKA=2E"TA G(i TO 25 IF!t<AD-2) 37,,42,43 FS!!,Jl=-FCH•BETA•SENSE(l,JI GO TQ '>4 BAUSH!NGER SYSTE~ IF fAeS(FS( ~,Jl l,!.E.FT(J) J GO TO -'e-'t IFtFS{I~J}~FSLrI,J!.~ToO~DJ GO 70 39 Ki,[•=3 IF(!l.6S{TSL~ r~J) }.-FT{J! }40~!..0t34 IF{ABSCFSLC!:J}l~GToFT(J)} GC TD 40
J'~OGS·c.f': 6.,:. CQi·JT~r~uED{ 5}
IF (;:.;:',S(CS:..t I'.. J)-!::ZERCL~ 2 i-.5) J-A6S{ E:ZERON{ I 1 J)--EZ.ERG!..{ l 11 Ji J) 3L1 1 99 11 4 1.'"')
.:+-J IF/A.BS{:: E?.. t..{1 1 ~-ES,'.l,J)},..-:T~E0!FF{1,J}) GO TO ~l . .IF 'i ft:iE~ ·,!: ;-.Ji- z:;:i:;J=::_·' I,J i ~:-;c~_ '.:S( I.,J }-EZERONt I 1 J}) }3L.~:s,4~~44
41 R=~VAL(\ YC I,Jl FC~=~Y(J * .• 744/ LOG:l.+lOOO~*EIPL£I,J}l+~071/(EXP(l000o*EIPL[I,JJ
i l-1 .. h--.2 l) IFiFC1,,,.G "'!=Y(J} }FCH=F·f1 . ..l} ECH=F~-1-i/ ?l(J1 .iL.r"HA=,:u: fEZEROL(I:r~;)-~Siiz,J)}/~CH r;r;.;'V.'~=.1lL h4 GC TL' .:,r.:
42 FS~ I -,J;=cCH*CCiA*SIG: ·.ONE1'FSL( I,J ~ 't GD TC"~ .
/.,.:: F5{I , .... :J =-FCl-l*BETA*SYCN{QilJE,FSltI,J} l L..4 Ji={t:.8:.(,-:S{I 1 J)1_,GT~FU~-.J~)FS{1,J)=SIGN!FU{J~ 9 FS{I"JJD} 4:: C:J'-!TinJE:
CS-:: 0 fi?*FS{I,;!) BMC '3=-C S.,:: r: /~K-DC: T~P\2;*i=S(I,2} fjqT::::T 1;-( AK-l ... t
C AXT~L ~CAD M• ~~NT dt--1P::-ca 1GP~EP EQLILI~R!U~ CHfCK CL~G=T+CC+C~-B1GP !F(K~OG.EQ.21 :;o TO 51 IF!CLAGMN.LE • ASS(CLAG!l GO TO 46 CLAS~N=ABS{CLAG' AKBEST=AK
4b KI~JG=KINGY-1 !FCKING~GTol)GO TO 48 !F[EC*CLAG149 1 5l,47
t.~7 AK=l000 ... G=lOOO~ GO TC lS
4~ 1F{ABS(C~AGL.LT .. 0 .. 33l GO TO 51 IF{EC*CLAG]49TS1150
it";} O.K=Ai<+G IF{AK .. GT.20000 .. 01 GO TO (15,14),~00E IF[Xi~G~GT .. lOOJGO TC 51 . IF(A5SO:AK).GT.0.00001l GO TD le
5:J AK==A~-G C=""'S~G IF{KI:'~G.LE .. 100~ GO TO '~?
51 BMTOT=BMCC+BMCS+SMT+SMP IF{KQOG~EQc2~0~oASS!CLAGJoLT .. Oo33t GO TO 52 KROG=2 AK=A~BEST GO TC 18
52 If{I,.GT .. l} GO TO 60 KOJ=l IF{LTYPEeEQ.2; GO TC 34
C POINT LOAD PLrAD=2.*91;TOT*SECTN/(6EAML~[2 .. *SECTN-l.J]
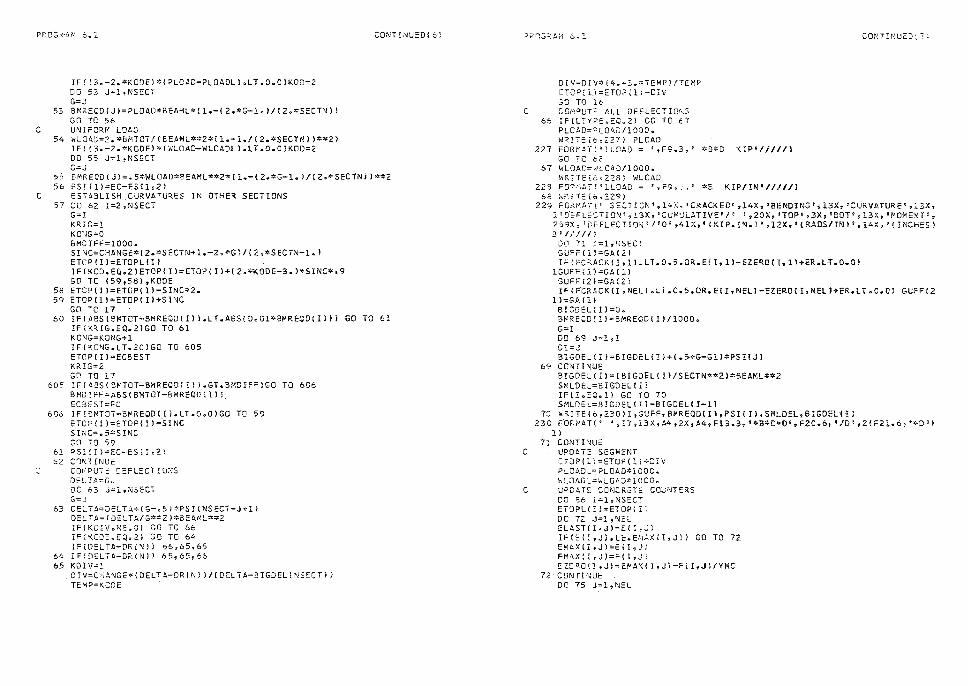
PROGk·A~ 6 .. 1
IF([3.-2.*KODEl*(PLOAD-PLOADLJ.LT.O.CJKOD=2 DO 53 J=l,NSECT G=J
53 BMREQD ( J l=PLOAD*BEAML* ( 1.-( 2.*G-1. l / { 2.*SECTN l) GO TO 56
C UNIFORM LOAD 54 ~LOA0=2.*BMTOT/[EEAML*•2•11.-l,/12 • *SECTNll**21
IF[[3.-2,*KODEl*(WLOAD-WLDAOLl.LT.O.OlKOD=2 DO 55 J=l,NSECT G=J
CONT!l-.!UED( 6~
55 6MREQD(JJ=,5*WLDAD*8EAML**2*ll,-(2,*G-l.l/(2.*SECTNll**Z 56 PS!lll=EC-ESll,21
C EST~BLISH CURVATURES IN OTHER SECTIONS 57 DO 62 I=2,NSECT
G=l KRIG=l K01JG=O BMDIFF=lOOO. S!NC=CHANGE•(2,*SECTN+l.-2.•Gl/(2.*SECTN-l.l ETOP(IJ=ETDPL(Il IF(KCD.EQ.2JETOP(Il=ETOP(Il+l2 • *KOOE-3.J•SINC*•9 GO TO (59,58),KOOE
58 ETOP[IJ=ETOP(Il-SINC•~. 5q ETOP[ll=ETOP(IJ+SINC
GO TC 17 60 IF(ABS(B~TCT-SMREQD(!Jl,LT.ASS(D.Ol*BMREQDtllll GO TO 61
IF(KRIG,EQ.2lGO TO 61 KCMG=KONG+l IF(KQMG.LT • 20lGO TO 605 ETOP( I l=ECBEST KRIG=2 GQ TC 17
605 IF[~GS(B!<TOT-BMREQD[Ill • GT.BMDIFFlGO TO 606 BMDIFF=ABS(BMTOT-6MREQD(Ill_ ECBEST=EC
606 IF(BMTOT-BMREQDIIJ.LT • O.OJGO TO 59 ETCP(Il=ETOP(Il-SINC SINC=.5*S!NC GO TO 59
61 PSI!IJ=EC-ES~I12) b2 C!ll\lTINU~
CO~PUTE ~EFLECT!O~S DELTA=G .. DD 63 J=l,N5EC G=J
63 DELTA=DELTA+(G-.5l*PSI(NSECT-J+l) DELTA=(DELiA/G*~ZJ*DEA~L*~2 IF!KDIV.NE,Ol GO TG 66 IFiKODE,EQ.2l GO TC 64 IF[DELTA-OR{NJl 66,65765
64 iF(DELTA-OR!Nll 65,65,66 65 KDiV=l
.DIV=CH~NGE•IDELTI-DR(Nll/(DELTA-BIGOELINSECTII TEMP=KCDE
P~Q-'.;?AM 6.,. 3. CONTINUED11:
C 66
227
67
22S 68
229
DIV=OIV•(4.-3.•TEMPJ/TEMP ETOP!lJ=ETOPil)-C[V GO TQ lt-CGMP~TE ALL DEFLECTIO~S IF(LTY?E.EQ.2i GO TO 67 PLOAD=PL0\~/1000. WRITEl6,227i PLOAD FORMITl'lLDAD = ',F9.3,' *S*C KIP'/////} GO TC 62 WLOAD=MLD•D/1000. ~R;TE[&9228J WLOAD FQ~r:AT! 1 lLOAD; ',F9o:,' *E KIP/IN•/////} ~•;:u T= i0,229) FO~MLTt~ SEC7IGN 1 ~14X~;CRACKEDt 7 14X,'BENDINGt113X,-~cuRVATUREe~:3X 7
1 ~ o·:::~u:c TI ON 1 , l 3X ?' t CUM~i..ATIVE-- / 1 '.,2ox, ,, TO-P 11 , 3X, ;BOT", 13X ti 1 MOfo'.ENT'' 259X; 'C.E FL EC T IO!-.J 'I' 0 • ,.41 X, 1 { KI Po IN. l • 1 12X, ' (RADS/IN}', 14X, ~ ( INCHES l 3'111/11
DO 71 I=l,NSECT GUFF(i.l=GA12l IFIFCRACKII,ll.LT.0.5.0R.EII,ll-EZERO(I•ll+ER.LT.O.Ol
lGUFF,J.l=GA( ll SUFFf2l=GA(2i IF(FCRACK(I ,NEU .u .o.s. •R.ElI,NELl-EZl:R0! I,N.EU+ER.LT.C.Cl GUFF(Z
ll=GA { ll BIGDEL!Il=O. B~RE~D(Il=BMREQ0(Il/1000 •
G=I DO 6<? J=l,1 G1:J BIGDELIIl=5IGDEL(!)+l.5+G-Gll•PSIIJl
69 CONTINUE BIGDEL!Il=!BIGDELIII/SECTN**2l•BEAML••2 SMLDEL=EIGDEL!Il IF(I.EQ.ll GO TO 70 SMLDEL=BlGDEL(Il-BIGDELII-ll
70 hR!TE 16,230 l l ,GUFF, B~REQD( I l ,PSH I l, SMLOEL, 6 IGO EU I; 230 F-•1'-f"AT{' • ,I7,13X,A4,2X,A4 9 Fl3.3, ••B*D•>D',F2C,6,, 'ID' ,2!F2l.c, '*D'i
1 l 7l CONTINUE
C UPDATE SEGMENT ETOP(li=ETOP(ll+DIV PLCADL=PLOAD*lOOC. WLOAOL=WLGAD*lOOO.
C UPDAT= CONCRETE COUNTERS DO 66 I=l,NSEC"":" ETOPL(Il=ETOP(i' DC 72 J=l ,NEL ELAST(l,J)=E(!,Ji IF(Ell,J).LE • EM~Xll,Jll GO TC 72 EMAX(l,Jl=Ell,Ji FM4X{I 1 J)=F(I 7 JJ EZE~O(I ,Jl=El'A'<( I ,Jl-F( I,Jl/VMC
72- CONTil~UE DO 75 J=l,NEL
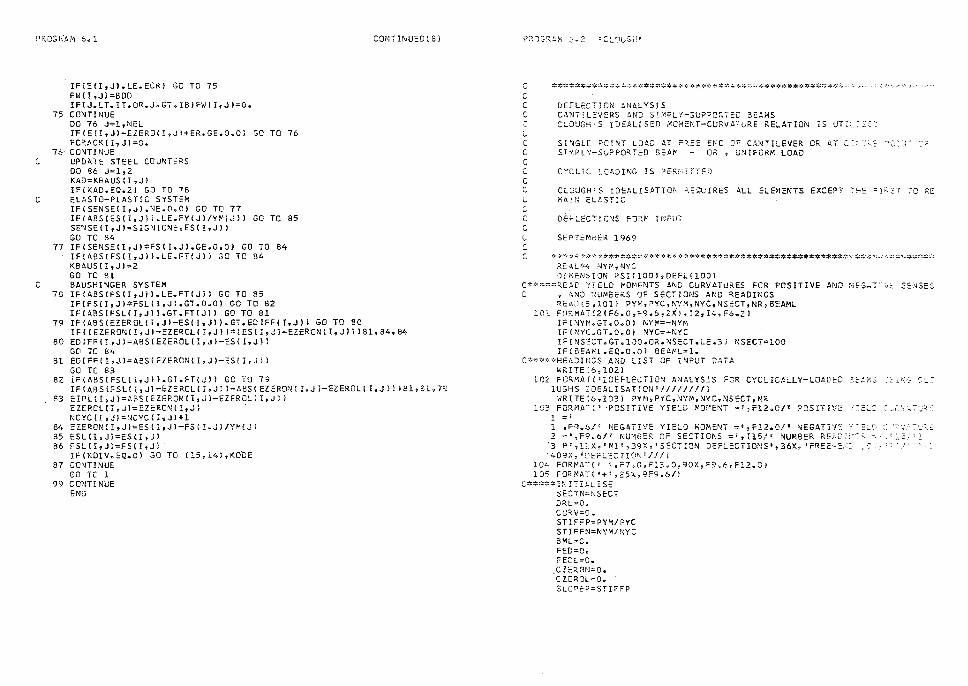
PROGP:AM b. l CONTINUED I 8 J
75
76 C
C
77
C 78
79
80
Bl
82
83
84 85 86
87
99
IF(E!I,JI.LE.ECRJ GC TO 75 FWII,Jl=BDO IF(J.LT.IT.OR.J.GT.IBJFWII,Jl=O. CONTINUE DO 76 J=l,NEL IF!E!!,Jl-EZERO(l,Jl+ER,GE.O.Ol GO TO 76 FCRACKl!,Jl=O. CONTINUE UPDATE STEEL COUNTERS DO 86 J=l,2 KAD=KBAUS(I,Jl IF(KAD,EQ.2) GO TO 78 ELASTO-PLAST!C SYSTEM IFISENSE!I,J).NE.O.Ol GO TO 77 IFIABSCESII,JJl.LE.FY(Jl/YM(J)l GO TO 85 SENSEII,Jl=SIGNIONE,ESll,Jl l GO TO 84 IFISENSE(l,J)*FSCI,Jl.GE.o.ol GO TO 84 IFIABS(FSCI,Jll.LE.FT(Jli GO TO 84 KBAUS!!,J)=2 GO TO 81 BAUSHINGER SYSTEM IFCABSCFS(I,Jll.LE.FT(JIJ GC TO 85 IF{FS!I,Jl*FSLCI,J).GT.O.Ol GO TO 82 IFCABSCFSLCI,Jll.GT.FT(Jll GO TO 81 IF(ABSCEZEROLII,Jl-ESII,JlJ.GT.EDIFFCI,Jll GO TO 80 IFICEZERONCI,Jl-EZERCLCI,Jll*IESII,Jl-EZERONII,Jlll81 1 84,84 EDIFF(I,J);ABS[EZER•Lll,Jl-ES{l,Jli GO TC 84 EDIFF(l,Jl=ABS[EZERONCI,JJ-ES!!,Jll GO TC 83 IF(ABSIFSLII,Jll.GT.FT(Jll GC TO 79 IFIABS{ESUI.,JJ-EZEROUI,Ji )-ABS( EZERON( I,J )-'EZEROLI I,J l l lSl,81,79 EIPL(I,J)=ABS!EZERONII,Jl-EZERCL(l,JJj EZER OU I, J l=EZERON ( J ,J) NCYCII,JJ;NCYCll,Jl+l EZERON!l,J);ES(I,Jl-FS(I,JJ/YM{Jl ESL!l,Jl=ESCI,Jl FSLCI,Jl=FSCI,Jl. IF{KDIV.EQ.Ol ,:;a TO (15,14),KO·oE CONTINUE GO TG 1 CONTINUE END
P20S~AM ~-2 'CL00GH~
C ******~*~***~~=********=~~***~~~~~~=**************~~ C C OEFLEC ION ANALYSIS : CANTIL VERS AND STMPLV-SUPPCRTED SEAMS
CLOUGH s IDEil.LISEfl .~CMEMT-CURVATURE RE!.ATION E u,;_:.:c·: C C SI~GLE PCI~T LOAD AT FREE ENC OF CANTILEVER OR AT c~·.7~~ ~c~~-c SIMPLY-SUPPO~TED BEAM - OR, UNIFORM LOAD C C CYCLIC ~OADING IS PEq~,!TTED C ;: CLGUGH' s IDEALISATIO<c C:EQUIRES ALL ELEMENTS EXCEPT :,iE =nsT -'.J RE C MAIN EltSTIC C C DEfLECT!ONS FORM INPU7 C C SEPTEMBER 1969 C C ,;:.::._"?:'::*'1.···;:-:.r*:-::********,:,:-***~*****************~:************";;:**·';:.':. -::;:.:,::.1-c*~~:=-·-·
RE C~L'.'F4 NYM., NYC DIMENSION PSillOOJ,DEFlllOOI
C**•••~EA~ 1IELO MOMENTS IND CURVATURES FOR POSITIVE AND NEG~1•v~ SENSES C , .O,ND 1W,.BER.S OF SECT r• MS AND 'tEADINGS
P.EAD (5'J1101) PYr~, PYC, NYM., NYC., NSECT, NR, BE:A-ML lOl FOhMAT{2(F6.0,~9e6,2i)~I2,i4~F6~2l
1F(NYH.GT.o~o, NY~=-NYM IFCNYC.GT.O.Ol NYC=-NYC IF { NSECT. GT .100 • OR. NSECT. LE .3; NSECT=lCIO IFIBEAML.EQ.O.OI BEAML•l.
C***D*HEAD!NGS ANO LIST OF INPUT CATA WR!TE16,l02J
102 FO'<MAT!'l::JEFLEdION ANALYSIS FCR CYCUC.ALLY-LOA.DED 2=;,,~~ ~''!,:•~ lUGHS JDEALIS•TIDN'////////l
WRITE! 6 • 103) PYM, PYC, NYM, NYC, NSECT, NR 103 FORMAT(' POSITIVE YIELD MOMENT = 1
1 Fl2.0/ 1 POSITIVE •:E~C :_,~~-u=: 1 =' l ,Fq.6/' NEG•TIVE YIELD MOMENT = 1
1 Fl2.0/ 1 NEGATlV~ ~'ElS 2 =',F9.6/' NUMBER OF SECTIONS = 1 ,Il5/' NUMBER REAC;~3S
·3 P',llX~'Mle 1 3gx,esECTION DEFLECTIONS 1 t36X, iFREE-~~ 409X~~DEFLECTION 1 ///J
104 FORMAT{~ u,F7oO,Fl3~0?90X,F9~6tF12.0J 105 FORMAT!'+',25X,9F9.6/)
C*****INIT!ALISE SECTN=NSECT DRL=O. CU~V=O. STIFFP=PYM/PYC STIFFN=NYM/NYC BML=C. FED=O. FEOL;O.
.CZERGN;O •
CZEROL=O. SLODEP=STIFFP
1•_:r,::_
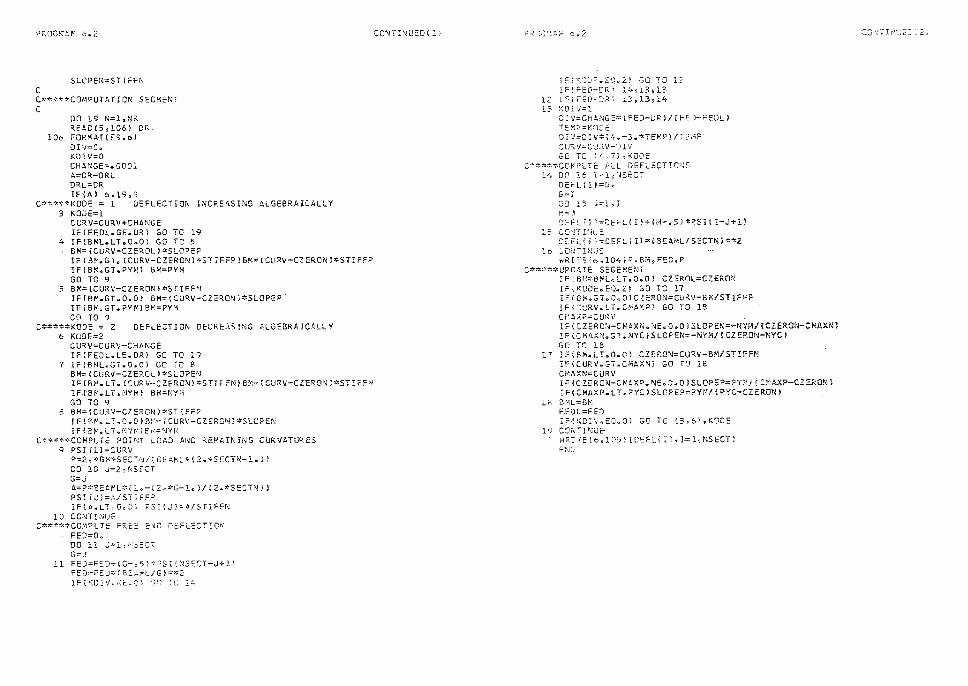
PROGRAM 6.2
SLCPEN=ST If Hi C C*****COMPUTATlON SEGMENT C
DO 19 N=l,NR READ(5,l06) DR
lOt- FORMAT ( F9. 6 l DIV=C. KDIV=O CHANGE=.0001 -~=DR-DRL DRL=DR IF(Ai 6,19,3
C*****KOOE = 1 DEFLECTION INCRE4SING ALGEBRAlCALLY 3 KDDE=l
CURV=CURV+CHANGE Ir(FEDL.GE.ORi GO TC 19
4 IF!BML.LT.O.Ol GG TC 5 BM=!CURV-CZEROLl*SLCPEP iF ( Bl<. GT. ( CURV-CZERON l *STIFFP l BM= ( CU RV-CZ ERON l*STI FFP IF(B~.GT.PYMl l>M=PYM GO TC 9
5 BM={C-URV-CZERON l «STIFFN IF!BM.GT.0.01 BM=(CURV-CZERONi*SLOPEP IF[B~.GT.PYM)BM=PYM GO TO 9
C*****KODE = 2 DEF LE CTI ON DECRE-iS !!•JG ALGEBRA IC.~LL V 6 KODE=Z
CURV=CURV-CHANGE !F(FEOL.LE.DRi GO TO 19
7 IFIBML.GT.O.Ol GO TO 8 BM= ( CURV-CZEROL l *SLOPE,,J I,= ( 81". LT. ( CURV-CZERON l *STIF i"N l BM= ( SURV-CLERON l*STH'FN IF(B~~LT • NYMI BM=NYM GO TO 9
8 BM=ICURV-CZERONl•STIFFP IFl8~.LT.D.O)Br~iCURV-CZERCNl*SLCPEN IF(B~.LT .. NYMJBM=NYJ!
C"**''*COMPUTE POl 11T LOAD AND REMA IN HiG CURVATURES 9 PSI il}=CURV
P::;:;2<; *61>-,";;S CC T•~ / { BE Al'-',L:,,: t 2 .. *SECTN- lo) i' DO 10 J=2,NSfCT G=J A=P*BEtPL*~lo-(2~*G-l.}/{2a*'SECTN)) PS! {J)=P./ST IFFP IF\ta ... LT,,o~o; ?S1{J}:;:-ll/ST1FFN
10 CONTINUE C*****COMPUTE FREE E~C DEFLEC~!C~
FED=O. DO 11 Jc=l.,!lSECT G=J
11 FED=F D+IG-. l=PS !~SECT-J+ll _fED=F U~fREA L/G1 *2 IF(KC v"~E-C ;o 0 14
CONTINUED{l; P.'.\'],:;r-:_t;•i b.,2
I~i~JDE.EQ~2! GO IF(~ED-0R~ 14,13,
12 IFiFED-DRI ~3vl3,
12
13 KDIV=l O!V=CHANGE*tFEJ-URt/(FEO-FEOLJ T~M?=KODE DIV=O:V*l4.-3.*TEMPl/~~~P SUR V=CU~V-D IV GO TC '. i.1 , 7} 1 KOOE
C*••=•CO~PUTE ALL DEFLECTIONS 14 on 16 l=l,NSEC~
OEFL t I J=Q.,, G=; 00 1-5 -5=1!! ~=.,'< OfFl'l'=DE~LIIJ+IH-,5)•PSIII-J+ll
15 (.ONT lTlU E ~=~l(i,=CEFL(Il•{BEAML/SECTNl**2
10 :,,or~Til'~U£ ~RI1-~~b~l04JF,BM,FEC,P
C**~**UPO~TE SEGENENT IF[B~*BML.LT.O.Ol CZEROL=CZERDN IF\KODE.EQ.Zl ~OTO 17 IFIB~.GT.O.OICZERON=CURV-BM/STIFFP IFl:cRV.LT.CMAXP) GO.TO 18 cr~AXP=CU~ZV ff ( CZER01-J-CMAX;"• NE. O. 0) Sl.OPEN=-NYM/ [CZIERON-CMAXNl ! F (C MAXN.G T .NYC) S LOPEN=-NYM/ ! CZ ERON-NY Cl GO TO lB
17 IF!SM.LT.0.01 CZERON=CURV-BM/STIFFN IFICURV.GT.CMAXNI GO TO 18 CMAXN=CURV IF {CZERON-CMAXP. NE .. J., 0 }SLO?EP=PY~/ ( CMAX?-C.ZCRON l IF(CMAXP.LT.PYClSLGPEP=PYM/,PYC-~ZERDNl
le BML=Bel FEDL=FED IF"n~O!V .... EQ.,Q] GO T·J {3,6],KODE
19 cor,n'iuE· l•j~ITE(0:1105~ {CEFL{ l ) 1 l=l'JNSECT2 E-:"JC:·
.._,.j1\' '_'.;'((Jj:_ - ;::; .,
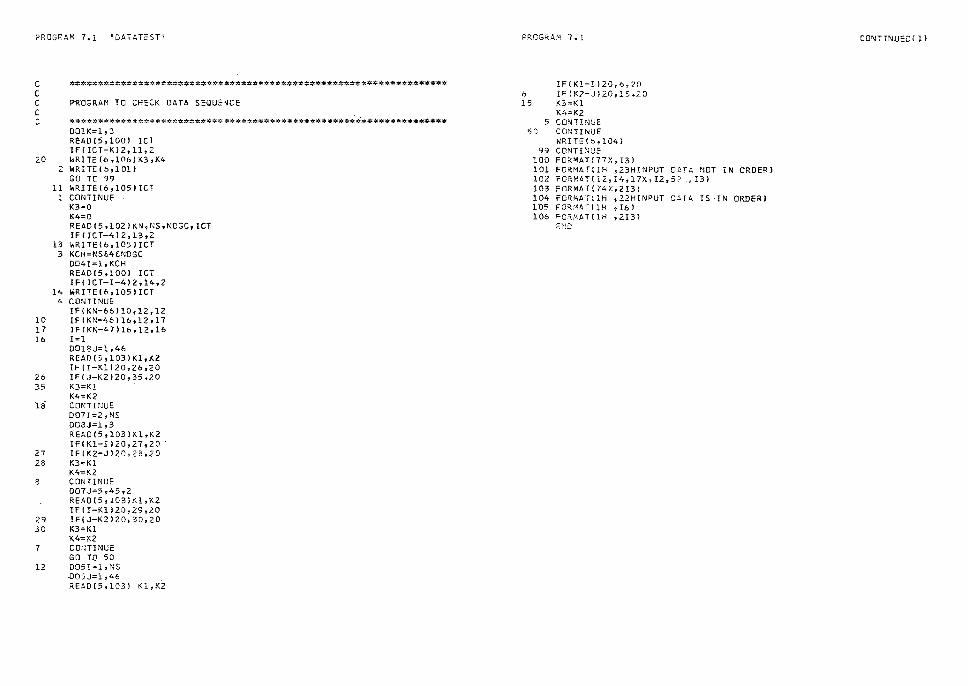
PROGRAM 7.1 'DATATEST 1
C C C C C
20 2
11 1
13 3
14 4
10 17 16
26 35
18
27 28
8
29 30
7
12
***********~************************~************************ti:~*
PROGRAM TO CHECK DATA SEQUENCE
****~************"~*********************:.O:************************* DOlK=l,3 READC5,10Dl ICT IF[ICT-Kl2,ll,2 WRITE[o,106JK3,K4 WRITE(o,1011 GO TC 99 WRITEC6,105>ICT CONTINUE K3=0 K4=0 READC5,102JKN,NS,NDGC,ICT IFCICT-4)2,13,2 I.RITE(o,lOSJICT KCH=NS&4&NDGC 0041=1,KCH READ15,100J ICT IF(ICT-I-4l2,14,2 WRITEC6,l05JICT CONTINUE IF(KN-66)10,12,12 IFCKN-46116,12,17 IF(KN-47)16,12,16 I=l D018J=l,46 REAOC5,103)Kl,K2 IF[!-Kll20,26,ZO IFCJ-K2)20,35,20 K3=Kl K4=K2 CONTINUE 007!=2,~IS DOSJ=l,3 READC5,103lKl,K2 If(Kl-IlZ0,27,20 -IFlK2-Jl20,28,20 K3=Kl K4=K2 CONTINUE D07J=5,45,2 READ(5,103lKl,K2 IF(I-Kll20,29,20 IF(J-K2)20,30,20 K3=Kl K4=K2 COrHINUE GO TO 50 DOSI=l,NS -DOSJ=l ,46 RE!ID[5,103l Kl,K2
PROGKAM 7.1
IF(Kl-Il20,6,20 6 IF(K?-J}20,15.ZO 15 K3=Kl
K<,=K2 5 CONTINUE
50 CONTINUE WP.ITE[6,l04l
99 CONTINUE 100 FORMAT{77X,I3l 101 FORMAT!lH 1 23HINPUT OlfA NOT IN ORDER) 102 FORMAT{I2~14 1 17X,I2~57 , I3) 103 FGRMAT(74X,2I3l 104 FCRMATllH ,22HINPUT C>rA IS-IN ORDER) 105 FORMIT(lH ,I6l 106 FO.".HAT(lH ,213)
Ei,lD
CONTINUED ( l l
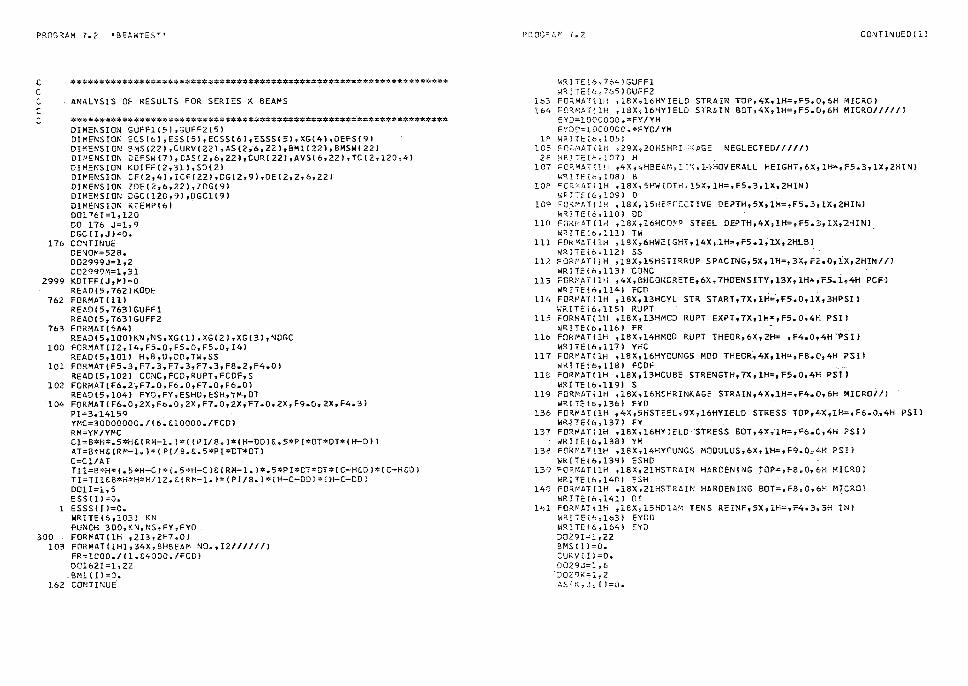
PROGRAM 7 • 2 •BEAMTEST'
C ****~****************************~******************************* C C ANALYSIS OF RESULTS FOR SERIES K BEAMS C C *-:«*************************************************::x**************
DIMENSION GUFF1(5l,GUFF2(5l DIMENSION ECS I bl, ESS ( 5l, ECSSC6 l, ESSS ( 51, XG(4l ,DEFSI 9 l DI~ENSION BMSl22l,CURVl22l,AS12ib,22l,BM1(22l,BMSWC22l DI~ENSION DEFSWl7l,CAS!2,6,22l,CUR(22l,AVS(6,22l,TC(2,120,4l DIMENSION KDIFF(2,3ll,SD12l DIMENSION CFC2,4l,ICFC22l,DG(2,9l,DE12,2,6,22l DIMENSION ZOE12,6,22l,ZDG(9l DIMENSION DGC1120,9l,DGC1C9l DIMENSION KTEMP16l 00176!=1,120 00 17& J=l,9 OGCCI,Jl=O.
176 CONTINUE DENOt-:=528. D02999J=l,2 D02999M=l,31
2999 KOIFFtJ,Ml=O REA015,762lK0DE
762 FORMAT(lll READl5,763lGUFF1 READ15,763lGUFF2
763 FORMAT(5A4l READ(5,100lKN,NS,XGlll,XGC2l,XGC3l,NOGC
100 FORMAT(I2,14,F5.0,F5.0,F5.0,I4l READ(5,101) H,B,D,DD,TW,SS
101 FORMATIF5 • 3,F7.3,F7.3,F7.3,F8.Z,F4 • 0l READ(5,102l CONC,FCD,RUPT,FCDF,S
102 FORMAT(F6.Z~F7.0,F6.0,F7.0,F6.0l REA0(~,1041 FYO,FY,ESHO,ESH,YM,DT
·10~ FORMAT(F6.0,2X,F6.0,2X,F7.0,2X;F7.0,2X,F9.0,2X,F4 • 3l PI=3.14159 YMC=30000000./C6.&lOOOO./FCOl RM=YM/YMC Cl=B*H* • S*H&( RM-1. l •"( I PI/8. l*(H-00)&.S*P l*OT*OT*CH-D I l AT=B*H&(RM-l.l*(P!/8.&.5*PI*CT~DTl C=Cl/AT Til=B"'H*(. 5*H-C) * (. 5*H-C )E [ RM-1. l*• 5*P!*CT"DT*{ C-HW l* [ C-H&D l TI=TI1E8*H*H*H/12 • £(RM-l.l*(PI/8.l*(H-C-OD)*(H-C-D0l 0011=1,5 ESS I I l=O •
l ESSSIIJ=O. WR1TE(6,103l KN PUNCH 300,KN,NS,FY,FYO
300 FORMAT(lH ,213,2F7.0) 103 FORMAT{lH1,34X,8HBEAM N• .,12//////)
FR=lOOO./(l.&4000./FCDl 001621=1,22
. 8Ml(Il=O. 162 CONTINUE.
Pr.OGP.:..r,: 7 o2
WRIT£'.6,764lGUFFl WR!TE(6,7651GUFF2
CONTINUED ( l)
11:>3 FO;l,MATl lH , 18X,16HYIELD STRAIN TDP,4X,IH=,F5.0,6H MICRO) 164 FORMATllH ,18X,16HYIELD STRAIN 80T,4X,1H=,F5.0,6H MICRO/////)
EYD=lOOOOOD.*FY/YM EYDD=lOOOOOO.*FYO/YM
lB I-IR!TEto,1051 105 FO~MATllH ,29X,20HSHRI~~AGE NEGLECTED/////)
28 WR!rEC~,1071 H 107 FOC;MAT(lH ,4X,4H8EAM,FX,14HOVERALL HEIGHT,6X,1H=,F5.3,1X,2HINl
WR lT E i o , l 08 l B 102 FGR~ATllH ,18X 1 5HWIDTH,l5X,1H=,F5.3,1X12HIN)
WRI7E!6 1 109l D . 109 FO~~AT(lH ,18X,l5HEFFECTIVE DEPTH,5X,lH=,F5.3,1X,2HINl
wR.!TE(6,llOl DO llO FORi>U(lH ,18X,l6HCOn STEEL OEPTH,4X,1H=,F5.3,lX,2HINl
WRITECb,llll TW -111 FORMAT{lH ,18X,6HWEJGHT,14X.1H=,F5.1,1X,2HLBI
\1RITE{6,ll2) SS 112 FORC:4T(lH ,18X,15HSTIRRUP SPACING,5X,1Fi=,3X,F2.0,iX,2HIN/il
WRITE(6,ll3l CONC 113 FOR:-1AT<1H ,4X,8HCONCRETE,6X, 7HOENSITY,13X, 1H=,F.5.l,4H PCFI
WRITE{6,ll4) FCD 114 FORMAT (lH , lBX, l3HCYL STR START. 7X, lH-,,;·,Fs. 0, lX, 3HPSI l
riRJTEC6,115) RUPT 115 FORMAT(lH ,18X,13HMOD RUPT EXPT,7X,1H=~F5.0,4H PSIJ
WRITEU,,116) FR 116 FOkMATllH ,18X,14HMOD RUPT THEOR,6X,ZH" ,F4 • 0,"4H--PSI)
WRJTEC6,117l YnC 117 FOR~AHI!-i ,18X,16HYOUNGS MOO THEOR,4X,1H=,F8.0,4H PSII
WRlTE(b,1181 FCOF 118 FORMATtlH ,18X,13HCUBE STRENGTH,7X,1H=,F5.0,41-I PSI)
1"RITE(6,119l S 119 FORMAT{lH ,16X,16H$HRINKAGE STRAIN,4X,1H=,F4.0,6H MICRO//)
WRITE(b,136) FYO 136 FORMAT(lH ,4X,5HSTEEL,9X,l6HYI.ELO STRESS TOP,4X,,1H=,F6.0,4H PSil
WR~TE( 6,137) FY 137 FORMATClH ,18X,16HYIELO STRESS BOT,4X,llH=,F6~0,'iH PSI l
WRlTE(&,138) YM 138 FOR1'AT(ll-l ,18X,14HYOUNGS MODULUS,6X,1H,,,F9.0,4H PSIJ
WRITE(b,139) ESHD 139 FQRMAT(lH ,18X,21HSTRAIN HARDENING TOP-,FB.0,6M MICRO)
WRiTE(6,l401 ESH 14Q FORMAT(lH ,18X,21HSTRAIN HARDENING BOT•,F8.0,6H MICRO)
WRITE(6,14ll OT . 141 FORMAT!lH ,1BX,l5HDIAM TENS REINF,5X,1H=,F4.3,3H lNl
WR!rf(6,163l EYOD ~,RI TE (6,164) EYu 0029I=l,22 BMS(ll=O. CURV (l l =O •
DD29J=l,6 ·o• 29K=l, 2
A~ ( K 1 J '., I J =O •
PR0G~AM 7.2 CONTINUED( 21
C
29
36
142
143
14<,
145
146
147
148
37
CONTINUE D0361=1,9 DEFS!Il=0. COlflINUE WRITEC6,l42J FORMAT(lH ,4X,25HP0SIT!VE SIGN CONVENTIONS///) WRITE!6,143l F0RMATClH ,4X,4HLOAD,21X,8HD0WNWARDl WRITE Co, 144) F0RMAT(lH ,4X,10HDEFLECTIDN,15X,8HDDWNWARDl WRITEC6,l45l F0RMAT(lH ,4X,6HSTRAIN,20X,7HTENSIONJ WRITE[6,146l FO'tMAT!lH ,4X,6HMDMENT,13X,14HTENSIDN BOTTOM) WRITE!o,1471 FORMAT (lH ,4X, 9HCURVATURE, l0X, 14HTENS ION BOTTOM l WRITE!6,148) FDRMAT(lH ,4X,21HL0NGITU0INAL MOVEMENT,6X,6HINWARD////l SELF WEIGHT CONSIDERATIONS VT=l2.*B*H VS=IPI/64.l*ClS.5&9.•P!/8.)*!12 • /SSJEPI•Cl.5£6.•DT*DTl VC=(VT-VSl/1728 • .
WC=VC*CONC WS=VS•.28333 UDL= (WC&WS l /12. UDLS=TW/8.-14.*UDL 00701=1,10 GD TO !71,72,73,74,75,76,77,78,79,80!,I
71 XSW=32 •
69 IF(XSW-56.168,68,67 c8 TEMl=0
GO TD 66 67 TEMl=.S•!UDLS-UDLJ•!XSW-56.l*(XSW-56.l 66 8MSWII)=(-U0L•.s•xsw•xsw&.5•TW•IXS~-6.)-TEMil/l000.
BMSW!21-l)=BMSW(ll GO TO 70
72 XSW=36. GO TC 69
73 XS,1=40. GC TO 69
74 XSW=44. GO TO b9
7'5 XSW=l~S ... ~.J TC 69
7o xs,,=51. GO TC 69
77 XSW=53. GO TO 69
78 XSW=55 .. GO TO 6S
79 XS\..J=57. GO TC 69
ao ·xsw=5s. GO TC c·J
PROGRAr-1 7., 2
70 CONTil\l_UE 8MSW(2ll=l-~DL• • S•56.•56.E.S•Tw~so.111000. 8MSWl2Zl=B~SW(211 XG{4)=6G: REA=56.•UDL&4.•UDLS
CONTINUED ( 3 l
TI S=Tl &2. *l 6. •c;* (. 5 * I 1-:U,. l i '"( .5•! H&6.) I & B*l8. l TER~C=CUDLS-UDLl•32./3.&UDL•36000.-27. • 54 • *REA TERMA=ITI/TISJ•l.5•RE~•zsoo.-uoL•56.•56.•56.l6.&TERMCl&U0L*56.
1*56.*56./6.-.S•REA*250D. TERMB=54.•UDL-6 • •TERMn TERMD=ITIS/Tll*l!REA/6.1*125000 • -UDL•56 • *56.•56.•56./24 • &56.•
lTERMA&TfR~BlEUDL•5b.636. • 56.•56 • /24 • -REA•l25000./6.-56.•TERMC 0081 I=l ,t+
1FlXG(!l-56.Jl70,170,171 170 Off SW ( l l=-( REA:> ( XG! I )-6. J•( XG [ I J-6. l* {XG( I J-6. l/6.-UDL•XG I I l *XG {
lll•XGlll*XG{IJ/24.ETERMA*XG{Il&TERMBl/lYMC•TII GO TO 1 72
171 DE~Sw(Il=-CREA*(XG( I l-6. l*!XG! !l-6. l*(XG( Il-60 l/6.-UDL•XG(Il"XG(Il l•XG{Il•XG(Il/24.-(U0LS-UDLl*(XG!Il-56.l*(XG!Il-56.l*IXGl!)-56.)• Z[XG{Ii-56.l/24.&TERMC*XG(Il&TERMDl/(YMC•TISl
172 DErSW!B-I)=0EFSW{li 81 CONTINUE
0082I=l,20 FCT=l00. G=l00.
Sc FCC=FCT•IH-Cl/C ECC=FCC/YMC ESC=ECC• (H-C-DDJ/[H-Cl FSC=ESC•YM ECT=FCT/YMC EST=ECT•{C-H&Dl/C FST=i:ST'"YM TSTMl=(PI/8.)*FSC*(H-C-DCl&B•FCC*IH-Cl•IH-Cl/3. TSTM=(TSTMl&(PI/2.J*DT•DT•FST*IC-H&Dl&FCT*B•C*C/3.J/1000. IF(TSTl'-BMSW! I l )83,84,85
83 FCT=FCT&G GO-TO 80
85. FCT=FCT-G G=.l*G IF[G-1.)84,83,83
84 0067J=l,2 OAS{J 1 1 1 !J=-ESC*lOOOOOO~*{H-C-CD&~75]/lH-C-OC} DAS(J,2,ll=-ESC•l000000. OAS!J,3 1 IJ=-ESC~lOOOOOO~*<H-C-CD-~75jJ(H-C-DOt DAS[J 1 4 1 ll=EST*l000000.•IC-H&D-.751/IC-H&DI DAS(J,5,Ii=EST• l000000. DASIJ,6,!l=EST•l000000.•IC-H&D&.75)/(C-H&01
87 COCHiNUE CUR(IJ={DAS(l,5, ! )-Di>S(l,2, ll )/(l0'J0000,"<fD-DDI)
82 CD'<TI NUE D0165J=l ,6 -D0165K=l,2 DAS(~,J,211;.5*(0ASCK~J,8>&CAS{K,J,?) 1
OAS[K,J;2Zl=~5*[0CS(K,J,12l&CAStK,J,l~?)
i .. 2
16:.i COUTINUE CUR(21)=(0AS(l~5~ 1 -DASil,2121) /llCCCOOO • -DDl) CUR 22)=(DAS!lr5, 2t-OASC112,22,l/(1COOOOO~*{D-OD)J SELF WEIGHT OUfPU HRITE(6~l 1:9)
149 FORMAT(lH ,63X,-161iSELF WEIGHT ONLY/////) WR! TE ! 6 ,i 21 ) ~-JRI TE(6,l2?-l re R l TE ! 6 ,, 12 3; DD3'H=l ,22 DO'i002K=l ,6
5002 KTEMP(KJ=CAS!l1K,J) WRITE(h,124}l 1 (KTENPCKl,K~l,61
39 cmn I NUE ,JR!Tt{6,125} WR!TE{6,126l D052!=1,7 WRITE t~,127) l,8MS.,( I l ,CUR( J l ,1,DEFS~! I J
5Z COr-TINuE D053I;:;:1~3 17=IC7 WRITE(6,12Rl I7,6MS\,;!l?leCUR(J7l
53 CONT 1 IIUE J=ll \·/R.ITE{b,129) 1 BMS,d I),,C.UR( I) l =12 ~RJTE(b 1 l281 l,B~SW{I ),CURI!) 1=13 YECHT=O. WRITE(6wl30l lsBMSW( IJ,CURl I~ 7 YECHT
WR!TE16, 13! l l ,Bc'>SH ! l ,CUH! ! ) ,YECHT 00571;1 .. 3 Il4=I£.14 WF:lTE(6Jl22} I1.4,8MSW{Il4}~CURt114!
57 CONTINUE ~13
~~lPITf:(b 1 12SJ I ~.zo.) l,a1 f~ l i'E ! {__,'/I :L;:
L_Q:'.i,C: STi:.GE l l)CL>H=l.-;,(2. 2.v1s i r )c:.: { 1 i i.Dr-·1S¥J 1 rt DOC:·~ J"::.,,
{Jl·~YEC.HT
CCINT INt!EDt
6U CONTI
D0•)} .J:::1 1 1, 61 '~.vs J,.I;.:,.:;\S{l'}J,Ii
LSc .l F A-,-0 ~ F ~,=o~ PF•i, plJ:c~fl ,,
246 ~RlTEfb,l~Ol LS
1,~ l)}/ OOOOCO.* 0-00))
150 ;:0~1~ez~1H ,66)'.1llHLGAD STAGE ~13///J/i PU"~CH 301,,PJ..,,.b,VS,:21 l:'.-f ,~~VS.t5s l3} 'rlLS
301 1~CRMAT[!H 1 F7~0 8 2FlO.O,I3) ~1RI1!:(6vl21 I 1,JRITE(o., 12.2) :✓ R1TE(f:,,l5l:
151 FC~Mlrr1H ,6HCOLUMi~,21X,1Hl,35X,lH3//' l-JRI fEib,152}
•,~I
:.. 5Z F 0°.tH,1 T ~ lH I" l 3 X 1 5HMORTH f 7X '5 HS-OUTH' ax u 3HAVE ii 8}{ j 5HNOR TH f 1X11 5HSOLTH t 18X,3HAVE//i, D0b2/=l,2Z KTEMPlll=ASll,1,ll KT~MP(2)=A5(2,1,1) KT~MPl31•AVSll,ll KTCNP{4}~~Sll,~,I) K TE MP ( '> I • AS , 2 d , ! I KTEMP(6J=AVS(3,1} 1,RITE{6,l24)i 1 {KTEMPCKJ 1 K"l,6i
62 CO•'JT!'!UE li>iRITE(6~l'J3}
153 FOf{MJ.\T~lH v///31-:,X}}OhRO~! NUMBER//}
154 FORMAT!lH 1 oHCOLUHN 9 2lX 1 lH2,~
f~.1:~ f])-:.::,:•1S(1.,2 1.I; KT~MP(2)=~S(2 1 2 1 l) ~-:_ T :-:: 1·; I=-' ·, ~; ; -_;;
I', TrJ-i~ (LJ / c.':
1rl~ITE.= vlSJ\ l-9R.}TC ,155)
n
?KOGr":AM 7., 2
C
KTEMP!2l=AS(Z,4,Il KTEMP(3l=AVS(4,I! KTEMPC4-l=AS(l,6,ll KTEMP{5l=AS(2,b,I) KTEMP(61=AVS!6,Il l,RITE 16,124) I, (·KTE,-.P(Kl ,K=l, 6 J
64 co;,n NUE WRITE(6,125J WRITE\6,126) 00881=1,7 WRITE(b,1271 I,BMS{ll,CURV(ll,l,OEFS(ll
88 CONTINUE 00891=1,3 I7=!&7 WRTTE(6,128l I7,BMS(I71,CURV!I7l
89 CONTINUE I=ll 1;RJTEl6,129J I,BMS( Il ,CURVI I l 1=12 WRITEl6,1281 I,BMSIIJ,CURV(Il 1=13 WRITE(6,130) I,BMS(ll,CURV( l),OEFS(Sl I=l4 WRITE {6,131 J I, SMS (I), CURV (I), DEFS ! 9 l 00901=1,3 114=1&14 WRITE(6,12BJ ll4,BMSII14l,CURVill4l
90 CONTINUE 1=18
244
701 700
91 156
157 156
92
WRITEl6,132l i,BMSlll,CURV(Il I=19 WRITElb,128) 1,BMS(Il,CURV(ll !=20 WRITE(6,133J r,eMS(Il,CURV(I),?S 1=21 WRITE(6,134l I,BMSI IJ,CURVI r-l,PF !=22 WRITE(6,135l I,BMS{Il,CUR,'(IJ,PO GO 10 {244y2452 ,KLUB KLUB=2 READ IN DATA SUBROUTINE !CONSTANT DATA) D091:!=1,NS :0:.~AD::5,150} LS~TC(l, !,2}! TC( 2-r I,.2),TC (1, I;,L..),-TC{2., I,4! IFII-100)700,701,701 LS=LS!:lOO IF(I-LS)~57,91,157 CQ!\ITINUE FOR~AT{!2,4(4X,F4o0)J GO TO 92 \-!RITE 1 ,..,, 158} FORM~T[!H ,33HTEM? CCR~ECT!ON D~TA OUT OF ORDER? GO TC 99 DO'l3 i=l -, NS TC t l, I, l; zQ ..
CONTINUED{6; ;::;e;,nG::::.r:j 7-.2
TCt2 1 I, }=,) ..
TC{l,Ir }=O~ 95 TC{Z,~!' tc:::0.,.
C:Fll.,J..)=O~ CF { 2., 1) =Q,. CF!l,3l=O. CF(2,3)=0. READ(5,l5?l {CF[J,2),J=l92],(CF{J,41vJ=l,2J
15':) Frl0..t'iAT(;-:5,i,3,3(L~X,.F5 .. 3~} DG205I~l,22 ,~II-0)206,207,208
206 !CF(i!=4 GO TC 205
207 ICF:It=2 GO TO 205
20? iFi.I-16~207t206,206 205 CO•-./TINUt
IFINDGCl177,178,177 177 LSZ=O
00i79I=l,.NDGC KE~D(S,l801LSl,OGCl!Sl,!DGCl{Jl,J=1,7l,OGC1(9l IFILSl-LS2l702,703,703
702 LSl=LSl&lOO 70~ LSZ=LSl
DO 17" K=l,NS IF(K-LSlll79,lcl,181
181 OD 182 L=l,9 DGC!K,Ll=DGC(K,Ll&DGCl(Ll
182 COI-H!NUE 1 79 CO'JTINUE 180 FORMAT[I2,1X,9F7.0) 178 0098N=l,NS
RcAO(S,249) LS,PS,DG!l,Bl,(OG!l,Jl,J=l,7l,DG!l,9l READ(5,249J ICHT,PF,DG(2 1 8J~{OG{2 9 Ji,J=l,7),0G{2~9}
z4cJ .FO~_MAT(I2,1X,F6.0,9F7.0) lflN-100)704,705,705
705 LS=LS&l 00 704 IF(N-1199,251,254
254 IFIKN-661250,2~1,251 250 (F(KN-46)252,251,253 253 l~IKN-471252,251,252 252 D0255J=i,5 2~5 R~;.:..~(5~250) ( !DE( l,~,!v-,;J JtL;i,2~.,M=:!'c !
D0256J-=21,22 25~ RElD[5~160l l!DEtl~LyM,J),L=l,2l~K=~,~)
J02~7J.=l6,20 257 ~~t....D~5 ~l60l { (OE ~l,L~'°19JJ .,L=l,2~ ,M=l<)::}
0(")258J=o:15 25R RE10~5,1SO) {[D~(l,LYM?J) ,L=l~2),~=l.S)
iF(N-2}202,259,203 .zc: c;:
208
DO t,QJ:=lt22 DO 60L=l~2 DiJ ,':,Ci•1=l,6 D~ 2,,L1IV,J/=O.,.
C0i\17If--J',JC: '. "7:,
PR,JSP-41"'.· 7 o 2
DECJ0~'=352. GO TO 203
251 D094J=l,5 D094K=l,2 READ(5,160l I (DE(K,L,M,Jl,L=l,2i,M=l,6)
94 co:~,INUE 160 FORMAT(l2F6.0l
J=Zl D095K=l,2 RE!.0{5,160) ( (DECK,L,M,Jl,l=l,2),M=l,6)
95 CO'Hil'JUE J=22 DQ96K=l,2 READ(5,160 i I (DE!l<,l,M,JJ,L=l, ZJ ,M=l,6)
96 CONTINUE 0097J=l,5 Jl5=J&l5 D097K=l,2 READ(5,160J ( IDECK,L,M,Jl5l,L=l,2l,~=1,6l
97 CO'HIMUE DOZOlJ=l,10 J5=J£5 DOZOlK=l,2 READl5,l60l ((OE!K,L,M,J5l,L=l,2l,M=l,6l
201 C• ;HI NUE IF{N-1)99,202,203
202 D0204J=l,22 D0204K=l,6
CONT U~UED ( S j
D0204~1=1,2 ZDEIH,K,J)=.5•1DE11,M,K,Jl&DE(2,M,K,J)J-ASIM,K,JI/CFIM,ICF(Jll KX=DE(l,M,K,JJ-DEIZ,M,K,Jl IF(KXJ3000,3001,3002
3000 KX=-KX GO TO 3002
3001 KDIFFIM,KX&ll=KD!~FIM,KX£11£1 GO TO 204
3002 IFIKX-30)3001,30G4,3004 3004 KOIFF{M,31J=KD~FF{M,31)&1
204 CONTINUE D0209J=l,9 ZDGIJJ=.S•IDG11,Jl&DG12,JI l&lOOOO.•DEFSIJI
20? co~:TINUE C PROGRAM CKECK C P~OGRAM CHECK : PRJS;:c.Ai·I CHECK
IF TH1S CAR~ U,!SERTE:J NO CHECK ON ZERO READit\!$S GO TG 93 DEFLECTIC>JS
20;, D0211J=l .,9 If!OG( lyJ i) 212,Zl.3~212
212 IF(DG~2,Ji )214,2:5,2:l. 214 DEFS{J,=:ZJS:J:-~5::,;(DGfl,Ji,~CG!2rJ})-DGC{f\l J} //1'.JOOO.
GS TC 211 21 ') D El= S (,.; } = t ZJC. ~Ji -;JG.::. ~ .J '.· - DGC C ~ J ~ J ) ; / 2.0 '.JOO.,
PF.rJG.:i,.:irv 7.,2 CCN7::·r:c::~-c ,; 1'
C
~
GO TC 21 213 IF'0Gf2,~) 216,217,216 216 8~F~CJ•=~lC~(J>-DG(2,Ji-DG:t~,JJJ/1OOOOo
GO TC 21 21 7 DEF S [ J) = 211 co~~TH·JUE
IF(PS,173,174,173 l 74 ?D:=O.
GO TO 175 173 PD=l00.•11.-PF/PSI 175 DG 218J=l:-22
242 221
220
219 228
222 224
223 225
22b
227 ZlR
166 167
168 220
232 242
233
234
23~
D02:i.BK=l ,6 D0228L=L 2 IF{DE[l=L,K,J)J248,219r248 IF(~El2,L,K,Jl1221,22J,221 !l. S [ L , K, .J J =Cr ! L , ! CF I J i lo, ! • 5* (Ct ( l , !. , K, J l l DE ( 2, L, K, J l l-Z DE I l, K, J 1 -
J.TC{L,I~lCFl'.J) }) Gorr 22s AS(L,K,Jl=Cf[L, !CF(Jl )*(OE( 1,L,!'.,Jl-ZDl:(L,K,J 1-TC{l.,!,ICF-IJJ) i GO re 22s AS\ L,K,J);:;Q., CONT1~,JUE IF(AS(l,K,Jll222,223,222 IFIAS12,K,Jll224 1 225,224 AVS(K,JJ=.S*lAS(l,K,Jl&ASl2,K,Jll GO TC ZiB IF IAS!2,i<,JI l22t>,227,226 AVSIK,Jl=ASll,K,Jl G[1 TC 218 AVS!K,J)=AS(2,K,J) GO TC 218 AVSIK,JJ=O. CONTINUE CU'tVATURES DIJ229J=l,22 l~(A~5(5,Jlll66,167,166 IF{AVS(Z,J) )168,167,168 CUR\!( J) ='J~ GO TO 229 CURVCJ)=iAVS[5,JJ-AVS(2,J)J/{1000000&=t0-DO)) co:nI'ILJE Pl\=.5'-"(PScPri 6E~JDI[~G r"'C1'-'Cr~rs DD2.3lJ=l~lG GO TO (232,233,234-:2351236,23:c1z38i,139: 1,2--40-.-2~li-~•J XS't1=20 .. B~S{Jl=S~llJ,&SMSW(Jlt~S*~~*XSW/!OOOo 2-MS (2~-J '.•=CMS{ J) CG TO 231 ;~S('IJ-=3iJ .. GC' TO 2.;.2 XS .-.!=3.c-~ GC TC 242 YS.i·'--=3':,,.
?~'JGO·AM 7.2
GO TQ 242 23b XSW=42.
GO TO 242 231 xs;•,=45.
GD TO 242 238 XSW=47.
GO TO 242 239 XSW=49.
GO TC 242 240 XSW=51.
GO TC 242 241 XSW=53.
GO TC 242 231 cornriwc
BM$(2l)=BM1(21)£BMSW(21)£25.*PA/10DO. BMS(22l=BMS{2ll GD TO 246
245 ~ONTINLIE 98 CO'lTI NU E 99 CONTINUE
764 FOR~AT(lH 1 21H~ORTH READER SIDE l 1 5A4) 765 FORMAT(lH ,21HS•UTH READER SIDE 2 ,5A4//////)
WRITl:(6,3100) 3100 FORMAT(1Hl,64X,16HREAD!NGS CUALITY//////l
WRITE(6,310l)GUFF1,GUFF2 3101 FOR~AT(lH ,i1HDIFFERENCES,6X,5A4,6X,5A4///)
003102N=l ,30 MM 1=1"-i wRITE(6,3105!MMl,(KDIFF(J,Ml,J=l,2)
3102 CONTINUE 3105 FORMAT(lH ,4X,!3,14X,l4,21X,I4)
WRITE(6,310ol (KOIFF(J,3ll,J=l,2l 3106 FORMAT(lH ,4X,10H30 OR MORE,7X,l4,2lX,I4l
D03200J=l,2 KFACT=O D03201M=l,31 KFACT=~FDCT&(M-ll*KDIFFIJ,M)*KOIFF(J,MI
3201 CONTINUE FACT=KFACT SD(Jl=S~RT(FACT/DENCM)
3200 CONT!f..JUE WRITE{6,3202) (SO{Jl,,J=iv2~
3202 FORMAT{1Hl,7HSTD OEV,13X,F6~3,19X,F6.3) 121 FORMOT(l~ ,33X,12P~ICR•STRA1NS///I 122 FOR~AT!lH 1 34X:10HROW NUMBER//J
CONTINUED ( 10 :,
123 FORMATtlH t6HCOLUMN,9X,1Hl,11X,lH2~11~,l~3,llX,lH4,11X,lH5,llX,lHb 1//1 .
,14-,3Xv6Il2) 124 FORMAT(lH 125 FO~MATIIH 12b FORMAT(lH 127 FOR~AT(l~; 12B FD~~AT(lH 12~ FD~~AT[lH , 130 F!JP.iA!!,T{lH
,/////34X,1OHOTHER CATA///) HCOLUM~,5Xi6H~CMENTT9X,LHCURV 7 17Xy4HPOSN,7X,5HDEFLN//l X,12t6X,F8~3,6X,F9~6,16X:I2,6X1~9~6l X,I2,0X,FE~3;6XtF9~6l X,I2,6X,F2~3,6X,F9~6,15X,15HL0tJGIT MOVEMENT) X,!2,6X,FS.3 1 6X,F9.6,l3X,4HWEST?5X,F9~6]
i-:,::;:.nG~·:,~ .... , 7. 2
131 FQq~1AT{lh ,2~~!2,6X,F8.3~6X,F9~6,15X~4HEAST~5X?F9.6l 132 F•R~AT[!H ,2X,I2,6X,FS.3,6Y,F9.6,21X,4HLOADJ
CONTINUED ( 11 l
133 ~•R~AT(lH ,2X,I2,6X,FR.3,61,F9.6 1 15X,5HSTART,7X 1 F6.0l 134 F• ~MATllH .zX,12 1 6X,FS.3,6X,F9.6 1 l5X,6HFINISH 1 6X,F6.0) 135 FORMATIIH 1 2X,12,6X,FS.3,6X,F9.61 15X,9H(AGE DROP,4X,F5.2//////l
ENn
PROGRAM 7.3 'INCLIN0 1
C C C C C
*****:,~*!l'.'.-'************~***;e**~*-::n..-.--,'p;,,******~'.:*:l;c*:';:*~-i:;:<:i:t:,'.l::;,'.t:;'.;*****:t-.Z-:f!:-*~(**:;,tn~
INCLINOMETER READINGS REDUCTION
*****'i:~*'**~*****::'**:/:::0~:,_,"l;~~:(:::J?#:(::*='.'-$:;'.'t~t****-f.~'(c:::O:-:{J:*#:f.:*:{:!".!****l~*********::!!$::;t~ • DIMENSION RDG~4,,!~DG[4i,CIFF(4!,RAC(41,Kl14} 7 K2[4) 7 K3(41 P! =3<> 14•15927 REAn(5,100J ~N,NR
!00 FO~MA~{I2~I31 WRITEf.6,lOU KN
101 FORHATl1Hl,43X 1 30HINCLINCMETER READINGS FOR BEAM,131 WRITE(6,102l
l 02 FORM~ T [ lHl, 2HLS, lOX, UHlOCATION 1, l 8X, ll:-H .. OCA T!ON 2, l 8X, llH LO CAT llON 3,18X,llHLOCATION 4i///1
t,JR!TE(6,103l DOZOI=l,NR RE~.0(5~104-l LS, (RDGtN? ~N=1g4} !F(I-1!20,1,2
l 0012N=l,4 ZROG(N!=RDG!Nl RAOINJ=O. Kl(Nl=O KZ(Nl=O
12 K3(Nl=O GO TO 13
2 D03N=l,4 IF(ROG(Nl )6,7,6
7 RAD{Nl=9999999. Kl(Nf=99999 K2(N)=99999 K3 ( •ll =99999 GO TO 3
6 DIFF(Nl=RDG1Nl-ZRDGINI RAO(Nj=DIFFCN)/3o DEG=RAD(Nl*lSO./PI Kl( Nl =DEG TEM?=Kl ( ~~) AMIN=!DEG-TEMPl*60. IF (A~I NJ 4 ,5 ,5
4 AMIN=-AMIN 5 K2(N)=AnN
TEMl'=K2(N} SEC= ( A/J, IN-TEMP l "60. K3(Nl=SEC
.:, CONTINUE 13 20
103
\•lRITEi6,105) LS,'. (RcJGCNl ,RAD!Nl,KHNl ,K2tf\il,K3!NI l,N=l,4! CONTINUE -
104 105
FORMAT ( lH ~4 {SX t3HRDG~6Xi 3HRAD$ 7)( ~ SHANGL.E) I Ii, FORMATII2,~F6.4) FOR~ATllH ~I2~4(F7~4,3X,F7~4,2X~I3,I3,I3,2X' t ENO
P~OG~4M-7.4 ~CATAL£ST~
C C C C C
*~~=*~*~+*~~·****=*=~¢_y;~~~>.-*~~--~~~~~~-~*~~-*~*~~~ :, - _, :.._ ... _.-,.;
PROGRAM FOR DATA P~INT-CU7
~*~****· !4*~-~-~~*~***"#~:-·~-~~~*~~~ • ~~~=~;~*~~;*~~-~~~~·•.~i: ·--~-> .. - .. X~$.
OI~ENS!O~ GU~F (5J,GU~F2(S1,GC~F3i4i,GUFF~201 REA0(5,1COJ KO E,ICHTl
100 FORMAT(Il 1 78X, ll READ\51'10li ..:;u Fl,.fCHT2 RE~D(5i101~ GU F2,ICH13
lOl FQ~~tT(5A4,~9X,Ilt RE~D!5,102fK~?~S 1 SU~F3rNDGCiIC~T~
102 FCRMAT[I2,I4,4~4vl3,52X,13! i1RlTEC6?l03~ KN
103 F6R~AT{lH1,29X121HINPUT DkTA ~er BEA~ ,13, l-.1~IT~(6'1104i
104 ~•R~AT{l~l,12HGENERAL D~T6!!1? WRITE(6,1051 KJOE,ICHTl
lCS FO~~~T(lh 9r1,1sx~11? WRITE(6tlG61 GUFFl~ICHT2 (.JR.ITE{6ial06) GUi=F2, ICHT3 i<JRI 1'E ( 6-; 120 l K t\J._ J\!S-. :;u FF3 ~ NGGC,, I CHl .::.,~
120 FDR~AT(lH 1 I2,I4,4~4,13~53X,i2l 106 FORMAT(lH ,5A4~5SX,Ill
DOlI=l ,3 RE:.C,(5,107} Gu1=F WR!TE(6,10Bl GUFF
1 CONTINUE 107 FORMAT(ZOA"-l 1oe FORMaT{lH ,20A41
WR!Ti:'[6,409) 409 FORMAT{1Hl,23HTE~PERATURE CORRECTIONS///)
002!=1, NS READ(S,107! GUFF~ WRITE (6,106) GUFF CQ1\:TINUE ,JRITE(6,109l
10~ FCRMATClHl~lgHCAll~RlTIO~ ~ACTORS///? READ t 51110/'l Gurr WR~ TE { 6? lVR] Gur-=F IF ( NCGC ~ 4, .i:r '? 3 t-JR!TE(6,ll0l
l!O FORMAT(1Hl,22HCEaL G~UGf CGRRECT:ONS!! OOC.I=l~NDGC RCAO(S,107? Gu;::;= WRITE[6 11 108] Gu;=~
5 C01\lTI 1\!UE 4 l'>JR I TE t. ::- 9 l 11 ;,
l~l t::c;;,_~t,.T[lHl,2"!..HLOACS STAI_ :;:.,.u(;ES/,'/ N=2:¢:NS DOA.I~l<:N RE6-D(5,1C7} su:=r ~si~ITE{b,10~'! G'.J:=:-
6 co~~TINUE
PC(nG,Al~ 7. 4 CONTINUED f 1)
IF(KN-66 l ll, 2, 2 11 IF(KN-t.6Jl6, 2' 7 17 IF(Ki~-47) 16, 2, 6 16 N=l&NS 12 DO 7I=l,5
WR!TE(6,il2l DO 7J=l,N READ(5,107l GUFF WR I TE C 6,108 ) GUFF
7 CO"JTINUE 112 FORMAT(lHl,oHCOLUMN,!4///l
008!=1,2 I20=I&20 WRITE(6,ll2l 120 DO 8J=l,N READ(5,107) GUFF WRITE(6,108J GUFF
8 CONTINUE 009I=l,5 ll5=I&15 WRITEC6,112l 115 DO 9J=l,N READ(5,107l GUFF WR!TE(6,10811 GUFF
9 CONTINUE 00101=1,10 15=!&5 WR !TE ( 6, 112 l I'> OOlOJ=l,N READ(5,107l GUFF WRITE (6,108 J GUFF
10 CONTINUE END
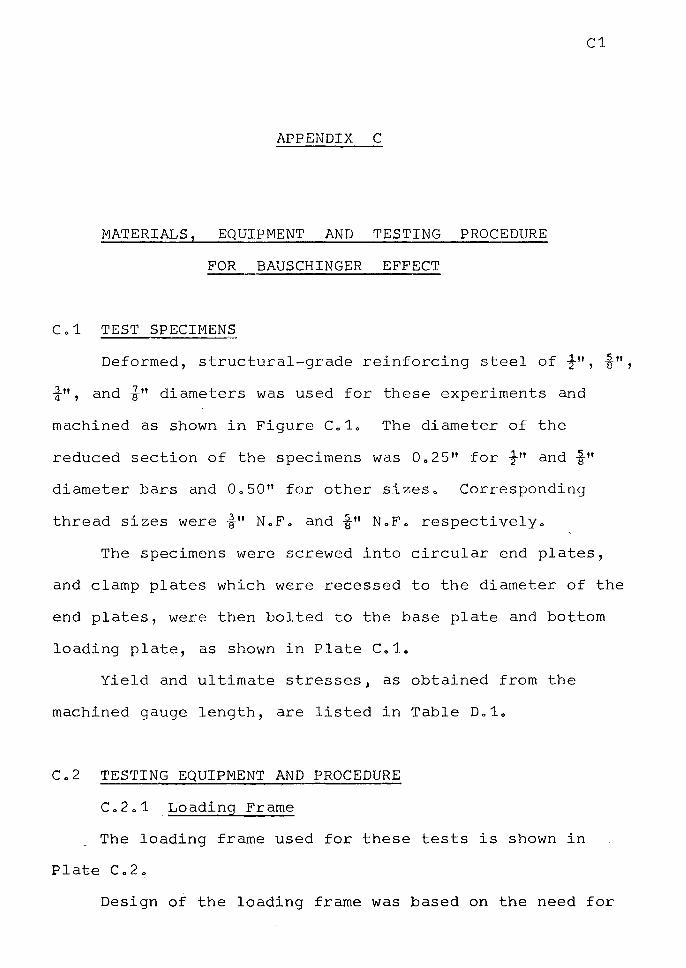
C1
APPENDIX C
MATERIALS, EQUIPMENT AND TESTING PROCEDURE
FOR BAUSCHINGER EFFECT
Co1 TEST SPECIMENS
Deformed, structural-grade reinforcing steel of½",
¾", and i" diameters was used for these experiments and
machined as shown in Figure Co1o The diameter of the
reduced section of the specimens was 0o25" for½" and i" diameter bars and 0.50 11 for other sizes. Corresponding
thread sizes were¾" N.F9 and i" N.F. respectively.
The specimens were screwed into circular end plates,
211 8 '
and clamp plates which were recessed to the diameter of the
end plates, were then bolted to the base plate and bottom
loading plate, as shown in Plate C.1o
Yield and ultimate stresses, as obtained from the
machined gauge length, are listed in Table D.1.
C.2 TESTING EQUIPMENT AND PROCEDURE
C.2.1 Loading Frame
The loading frame used for these tests is shown in
Plate C.2.
Design of the loading frame was based on the need for
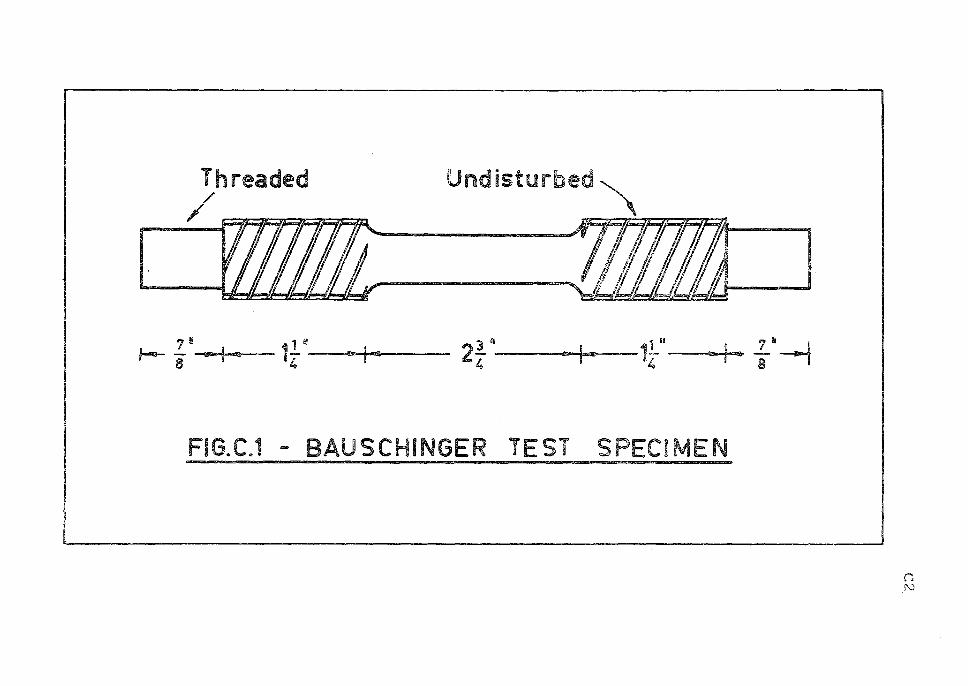
Threaded /
/ Undisturbed"\
......!H_,,,,. H""""ll':Ht:=H;ic;;;,i;H~* A
7 Ii! 1 SI 3 11 1 11 7 li---t ~ - ~ I <& 1----- 2- --~-1- • I • -8 I /,, 4 4 8
FIG.CJ - BAUSCHINGER TEST SPECIMEN
n N
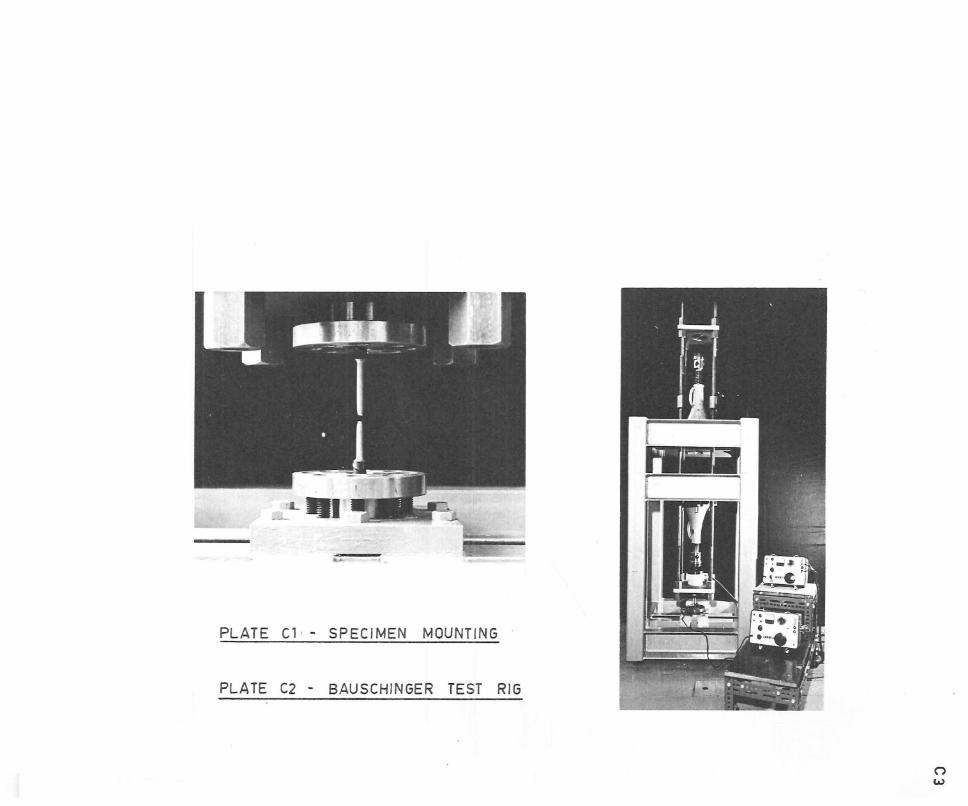
PLATE C1 · - SPECIMEN MOUNT ING
PLATE C2 - BAUSCHINGER TEST RIG
n w
C4
rigidity, and stresses in the components during load
application were very lowo Considerable care was taken
with the construction of the frame to ensure that friction
between hanger rods and the frame, and eccentricity of
loading did not become significant during loading of the
specimenso Despite this, difficulties were experienced
with eccentricity during compression loading of some early
specimenso
Ca2o2 Load Application and Measurement
Load was applied by means of screw jacks as their use
afforded strain control when loading into the plastic
rangeo Compression load was applied directly to the
specimen using the bottom jack, and tension was applied by
activating the top jack and so transferring the stress
through the four hanger rodso
The load was measured with Type PR9226, Philips 5-ton
or 2-ton load cells, depending on the specimen sizeo The
cells were calibrated on an Avery 25,000 lb Universal
Testing Machine through a Budd Strain Bridgea The gauge
factor on the bridge was selected as that which gave 1
microstrain reading for each 1 lbo load applied to the
cello Repeatable results were obtained from several
tr~als. Recesses were provided in the top and bottom load
ing plates to maintain concentricity of loadingo
A thrust bearing between the screw jack and load cell
took up the rotation in the jacko
cs
Co2o3 Loading Sequence
No fixed loading sequence was observed, the aim being
to study as many factors as possible (eogo unloading and
reloading from compression and tension stresses after the
Bauschinger Effect had been initiated)o Also a large
range of initial plastic strains was required for the
analyses described in Chapter 3o
From the initial tests, it was noted that the machine
behaved more accurately if the hanger system was aligned
by yielding the specimen in tension firsto Consequently,
very few specimens were studied in which compression caused
first yieldo Also the behaviour of the machine was such
that unloading characteristics could not be observedo This
was probably due to friction in the frame and satisfactory
results were obtained only when an increasing stress was
being applied to the specimeno Indications were, however
(Chapter 3), that the unloading behaviour of the steel was
elastic with a modulus approximately equal to the initial
elastic slopeo
Co2o4 Specimen Yield Stresses
It wa$ observed that yield stresses obtained using
mechanical jacks were consistently 3,000 -5,000 PoSoio
lower than those obtained on machined specimens from the
same reinforcing bar but using an Avery hydraulic testing
machine (Table Do1)o The ultimate stresses, by comparison,
were almost identicalo That the yield points were not
C6
distinct indicates that this may have been due to eccen
tricity of loadingc
Cc3 STRAIN MEASUREMENT
Strain was measured with an Instron G-51-14 strain
gauge extensometer which has a 2" gauge length and 50 per
cent maximum strain. This extensometer was calibrated to
a Budd Strain Bridge using a micrometer device. A very
low gauge factor on the bridge enabled strain measurements
of 1 microstrain to be obtained. However, the accuacy of
these measurements was reflected in standard deviations
which ranged between 31 and 167 microstrains.
As provision for compression strain was necessary,
the extensometer was mounted on the specimen such that the
initial gauge length was greater than 2". Coupled with
this, the extensometer was mounted when an initial strain
of €1 was imposed in the specimen by the hanger weight.
Therefore the extensometer readings obtained directly from
the bridge had to be corrected for these factors. The
correction procedure was as follows:
The extensometer was mounted on the specimen with a
distance between points of (2 + x) inches. The initial
strain reading, €0
, will be x/2 corresponding to an initial
c1c:tual. strain of € 1 , the strain induced by the weight of
the hanger.
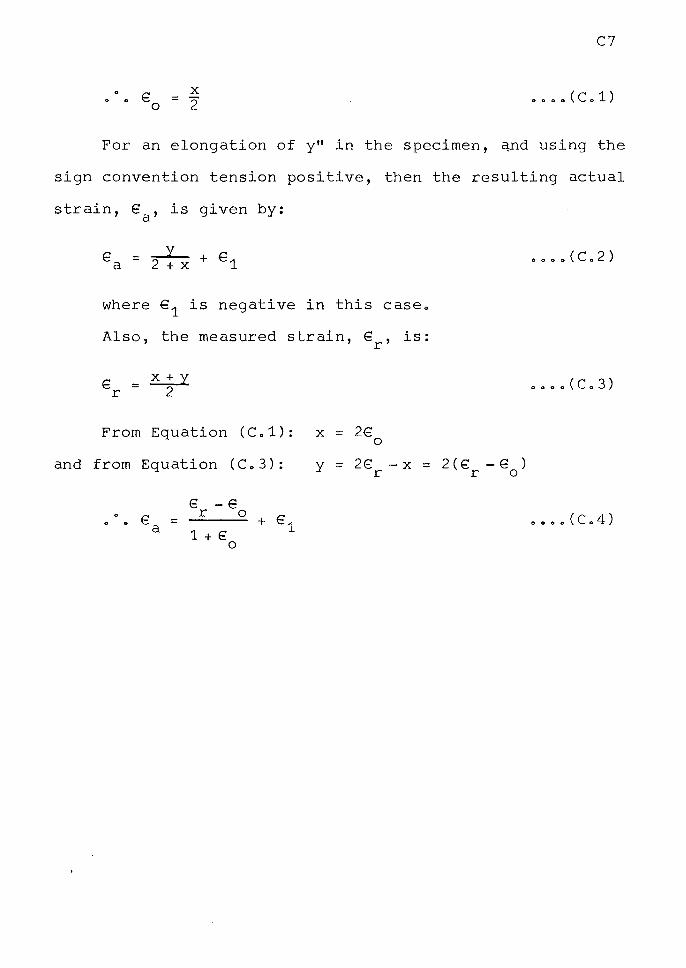
E 0
X = 2
C7
oooo(Co1)
For an elongation of y" in the specimen, c1nd using the
sign convention tension positive, then the resulting actual
strain, E , is given by: a
where E1 is negative in this caseo
Also, the measured strain,€ , is: r
e = ~ r 2
From Equation (Co1):
and from Equation (Co3):
€ = a
€ - e r o
1+€ 0
X = 2€ 0
y = 2€ - X = 2 ( E'. - € ) r r o
oooo(C.4)
APPENDIX D
MATERIALS, EQUIPMENT AND TESTING PROCEDURE
FOR REINFORCED CONCRETE BEAMS
Do1 MATERIALS
Do 1.1 Concrete
D1
A commercially-prepared mix with 3 per cent air
entrainment was supplied by Certified Concrete Limited,
Christchurch, and was used for all beams of this serieso
The aggregate used was Waimakariri River gravel which is
a well-rounded greywacke stoneo The maximum aggregate
size was½" and ordinary Portland Cement wa~ used. The mix
proportions by weight were:
Water: cement : aggregate= .53:100:5.8
It was anticipated that ~his mix would produce a 4,000
p.s.i. concrete at 28 days and would therefore be a typical
construction concrete. In fact, cylinder tests carried out
at the time of beam experiments (age 33-251 days), showed
the mix to produce cylinder strengths ranging between
4,645 p~s.i., and 7,485 p.s.i.
Placing
Beams were poured in pairs and compacted on an "Allam"
D2
vibrating table working at 3,000 Copomo Only one beam mould
was mounted on the table at any one time and placement of
concrete was usually completed within five minuteso Control
specimens for each beam were also mounted on the table,
therefore receiving vibration identical to that of the beamo
Thus two beams and associated control specimens were
poured with the same mixo
Control Specimens
For each beam, three 6" cubes, three 6" diameter x 12 11
cylinders, and three 12 11 x 311 x 311 modulus of rupture prisms
were cast in machined steel formso These were tested
immediately prior to the start of the beam experimento The
cylinders were capped at both ends with dental-quality
plaster and loaded at 2,000 posoio/minute to failurea The
cubes were uncapped and were loaded at the same ratea
Modulus of rupture specimens were tested very slowly and
were simply-supported over 9", point loads being applied 3"
from the supportso Despite this, the variation in modulus
of rupture values in any one batch was comparatively high.
For some beam pairs, a shrinkage control block, 24 11 x
8½" x 5", was cast. Stainless steel discs for Demountable
Mechanical (Demec) gauges 18 were inserted into these blocks
as the concrete set and zero readings taken as soon as the
concrete was sufficiently hardened~ A 60" x 8 11 x 5" section
of a test beam was used to provide temperature compensation
for th~ shrinkage readings. Shrinkage control blocks were
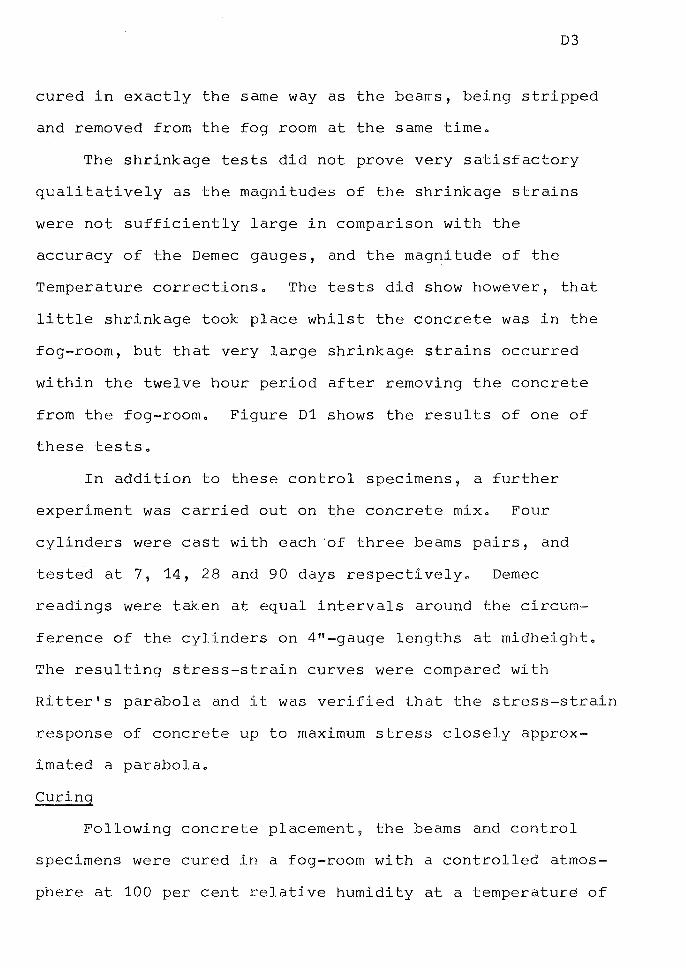
D3
cured in exactly the same way as the beams, being stripped
and removed from the fog room at the same time.
The shrinkage tests did not prove very satisfactory
qualitatively as the magnitudes of the shrinkage strains
were not sufficiently large in comparison with the
accuracy of the Demec gauges, and the magnitude of the
Temperature corrections. The tests did show however, that
little shrinkage took place whilst the concrete was in the
fog-room, but that very large shrinkage strains occurred
within the twelve hour period after removing the concrete
from the fog-room. Figure D1 shows the results of one of
these tests.
In addition to these control specimens, a further
experiment was carried out on the concrete mix. Four
cylinders were cast with each ·of three beams pairs, and
tested at 7, 14, 28 and 90 days respectivelyo Demec
readings were taken at equal intervals around the circum
ference of the cylinders on 4 11 -gauge lengths at midheight.
The resulting stress-strain curves were compared with
Ritter's parabola and it was verified that the stress-strain
response of concrete up to maximum stress closely approx
imated a parabola.
Curing
Following concrete placement, the beams and control
specimens were cured in a fog-room with a controlled atmos
phere at 100 per cent relative humidity at a temperature of
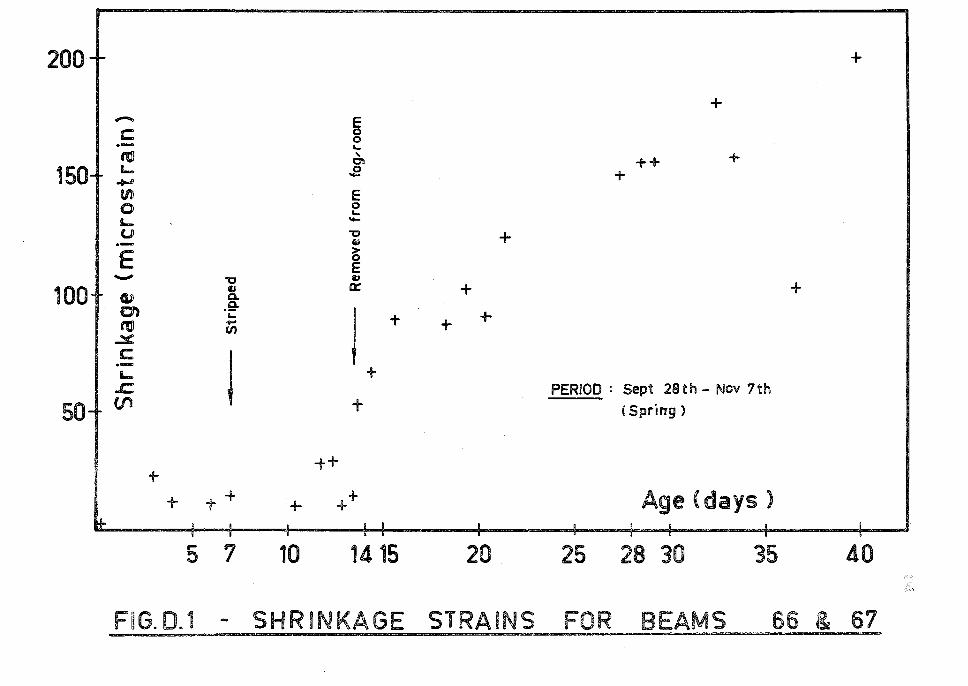
2001 +
+ - ~ C 0 ·- '-~ ' + Cl ++
150+ !: 0 - + en E 0 0
'-L. -u ,:, + ·- GI
E > 0 E - ,:, .,
100+ Cl)
., 0:: + + c.. .e-Cl') '- I + + ~ - + V, ~ C
l ·-L. + .c, PERIOD : Sept 28th - Nov 7th 501 (/l
+ (Spring)
++ +
+ -t+ + ++ Age (days)
5 7 10 1415 20 25 28 30 35 40
FIG.D.1 - SHRINKAGE STRAINS FOR BEAMS fi6 & 67
D5
Beams and specimens were stripped of their moulds
seven days after pouring and remained in the fog-room for a
further seven days. In the interval between fog curing and
testing, the beams and control specimens were allowed to
dry in the laboratory.
D.1.2 Steel
(i) Longitudinal beam steel
Deformed reinforcing steel of ..111 211 2 , 8 ? ¾" and i" diam-
eters was used for longitudinal beam steel. The steel
complies with A.S.T.M. A305-56T, NZSS 1963:1962, and C.P.114.
Within all size groups, bars were from the same batch.
Nevertheless, preliminary tests showed the variation of
properties between bars within these groups to be too great
to use this common feature with reliability. Each bar was
cut into two 9' - 10" lengths for use in the beams and the
remainder was used for control specimens and for Bausch
inger tests.
½" diameter bars: From each½" diameter bar, three
10 11 specimens were tested undisturbed, using a Baty mech
anical extensometer with a 2" gauge length. These tension
tests gave yield and ultimate strengths for each bar,
together with Young's Modulus, the strain hardening strain,
and fracture strain. The average values of these parameters
were used to describe the bar. Of all parameters, the
ultimate stress showed the least variation from coupon to
coupon.
211 8 ¾" and l" diameter bars:
D6
Each of the larger bars
was subjected to two tests. Three specimens from each bar
were tested undisturbed in tension to obtain the yield and
ultimate forces. A further three specimens were machined
and tested in tension according to ASTM A370-61T and
extensometer readings recorded. These tests revealed
slightly lower yield stresses for machined specimens than
for undisturbed specimens and ultimate stresses that were
rather higher.
The higher yield stresses observed in the undisturbed
samples and the less distinct yield point, was attributed
to the case hardening associated with forming the deform-
ations. By assuming that this effect became negligible at
ultimate load, it was possible to obtain the "effective"
areas of the deformed bars by comparing ultimate loads for
undisturbed and machined specimens. These effective areas
were found to be 94 per cent~ 95 per cent, 93½ per cent,
and 95½ per cent, respectively, of the nominal areas of
the _1_ 11 2 II 2 , 8 ? ¾" and ¾" diameter bars. More precise measure-
ments of similar deformed bars have been made at this
University and produce areas that agree within 2 per cent
to those above, thus confirming to some extent anyway,
the case-hardening assumption. Yield and ultimate stresses
for the beam steel were computed from undisturbed yield and
ultimate loads and effective areas. Table D1 summarises
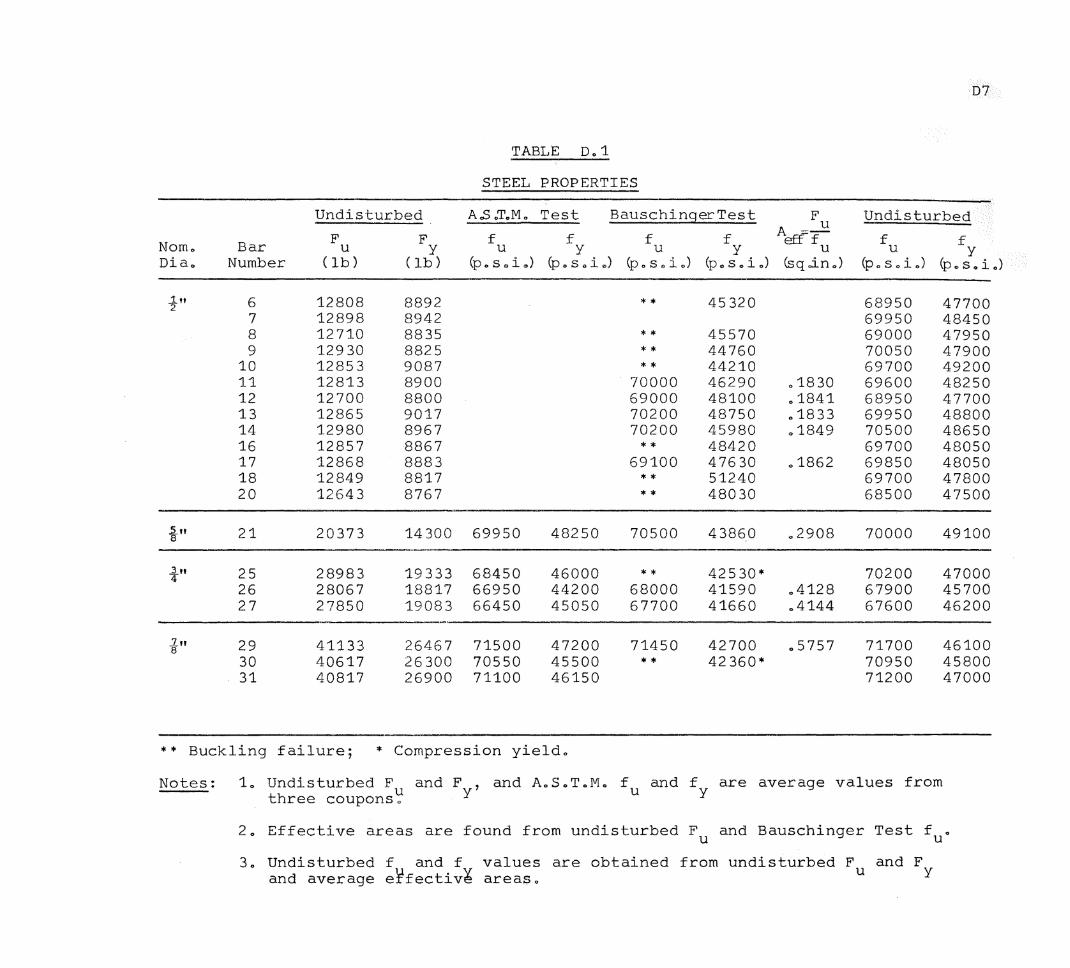
D7
TABLE Do1
STEEL PROPERTIES
Undisturbed A.S oToM O Test BauschingerTest F Undisturbed A=~
Nomo Bar F F f f f f eff f f f u y u y u y u u y Dia. Number (lb) (lb) (p. s .. L.) (po s O i .,) (p.soi.) (p.s.i.) (sq .,in.) (p.s.io) (p Os O i .)
1 " 2- 6 12808 0892 * * 45320 68950 47700 7 12898 8942 69950 48450 8 12710 8835 ** 45570 69000 47950 9 12930 8825 * * 44760 70050 47900
10 12853 9087 * * 44210 69700 49200 11 12813 8900 70000 46290 01830 69600 48250 12 12700 8800 69000 48100 .1841 68950 47700 13 12865 9017 70200 48750 .1833 69950 48800 14 12980 8967 70200 45980 ,,1849 70500 48650 16 12857 8867 ** 48420 69700 48050 17 12868 8883 69100 47630 .1862 69850 48050 18 12849 8817 * * 51240 69700 47800 20 12643 8767 * * 48030 68500 47500
211 8 21 20373 14300 69950 48250 70500 43860 .2908 70000 49100
~" 25 28983 19333 68450 4 46000 * * 42530* 70200 47000 26 28067 18817 66950 44200 68000 41590 .4128 67900 45700 27 27850 19083 66450 45050 67700 41660 .4144 67600 46200
2-n 29 41133 26467 71500 47200 71450 42700 .5757 71700 46100 8
30 40617 26300 70550 45500 ** 42 360 * 70950 45800 31 40817 26900 71100 46150 71200 47000
** Buckling failure; * Compression yield.
Notes: 1. Undisturbed Fu and F , and A.S.T.M. f and f are average values from y u y three coupons"
2. Effective areas are found from undisturbed Fu and Bauschinger Test fu.
3. Undisturbed f and f values are obtained from undisturbed F and F and average effectiv¥ area$" u Y
D8
the properties of the longitudinal reinforcing steels used
in these experimentso
(ii) Stirrup Steel
Plain¾" diameter reinforcing steel was used for all
stirrups in this investigationo From each length of steel,
three 10" specimens were cut and tension-tested for yield
and ultimate stresseso The remainder of each bar was made
into about 16 stirrups, bundled and numberedo All stirrups
were manufactured and coupons tested before any beams were
made so that, for beams requiring more than one bundle of
stirrups, yield stresses of bundles could be matchedo How
ever, this was proved an unnecessary precaution as the first
8 stirrups on each side of the column stub were from the
same bundle, and it was in this region that uniformity was
most importanto
Do2 BEAM MANUFACTURE
Do2o1 Manufacture of Reinforcing Cages
As mentioned in Chapter 7, it was very important that
reliable steel strains be obtained from the experiments and
to facilitate this, metal lugs were spot-welded to all long
itudinal reinforcing bars so that strain measurements could
be madeo The lugs were of¾" diameter mild steel cut to 1 11
lengths and twenty-one were required for each baro As the
lugs were difficult to handle and as they had to be welded
in place accurately, a jig was manufactured to simplify
D9
this operation.
The jig consisted of a length of angle section welded
to a steel base plate, such that a cradle for the longitud
inal bars was formed. A top plate had-¼" diameter holes
drilled corresponding to the required lug positions and
each hole was provided with a screw so that the lugs could
be held firmly in the top plate. The top and bottom plates
were then clamped together and the lugs spot-welded to the
reinforcing bar rib as illustrated in Plate D1.
The beam having a comparatively small cross-section,
necessitated accurately-made stirrups, and since a large
number were required, a special stirrup-bender was made for
the purpose (Plate D2). Five adjustable levers on a cross
bar proved very satisfactory for determining bending points
and after a few trials and minor adjustments to the position
of these levers, stirrups could be quickly and accurately
produced. The bending radius was only¾" since it was
desired that-½" diameter longitudinal bars fit snugly into
the corners. Despite this, no stirrup distress resulted
from the small radius in any beam sections at failure.
Internal stirrup dimensions were 3" x 6", giving 1 11 cover
to all longitudinal steel.
The stirrups and longitudinal steel were then tied
together, rather than welded, as this is the more common
procedure in practice. Metal straps that fitted over the
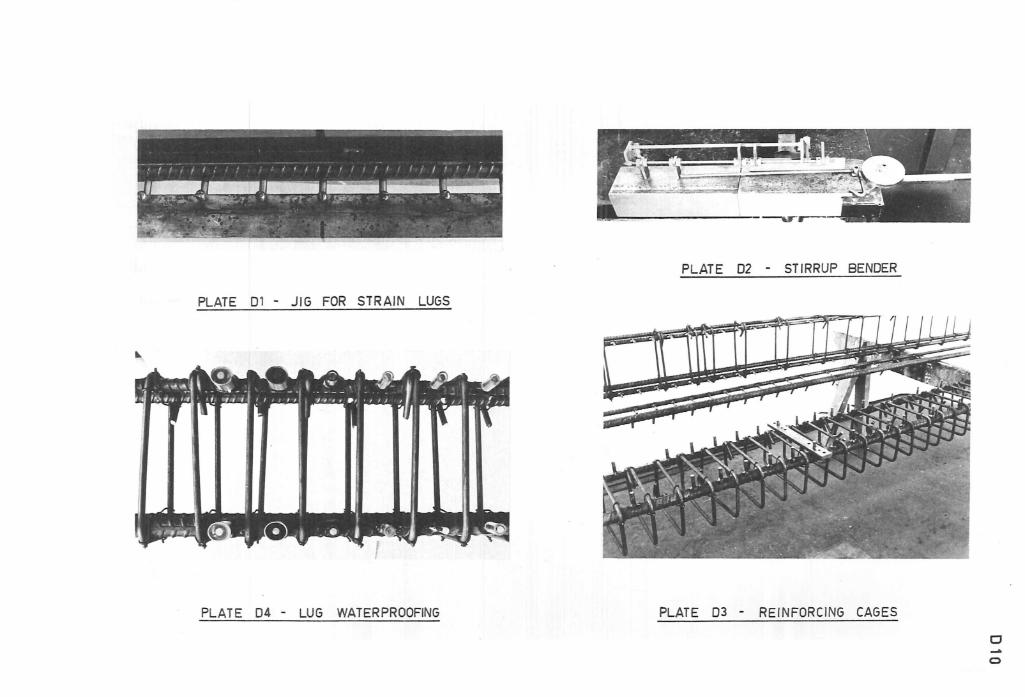
PLATE 0 1 - JIG FOR STRAIN LUGS
PLATE 04 - LUG WATERPROOFING
PLATE 02 - STIRRUP BENDER
PLATE 03 - REINFORCING CAGES
CJ
0
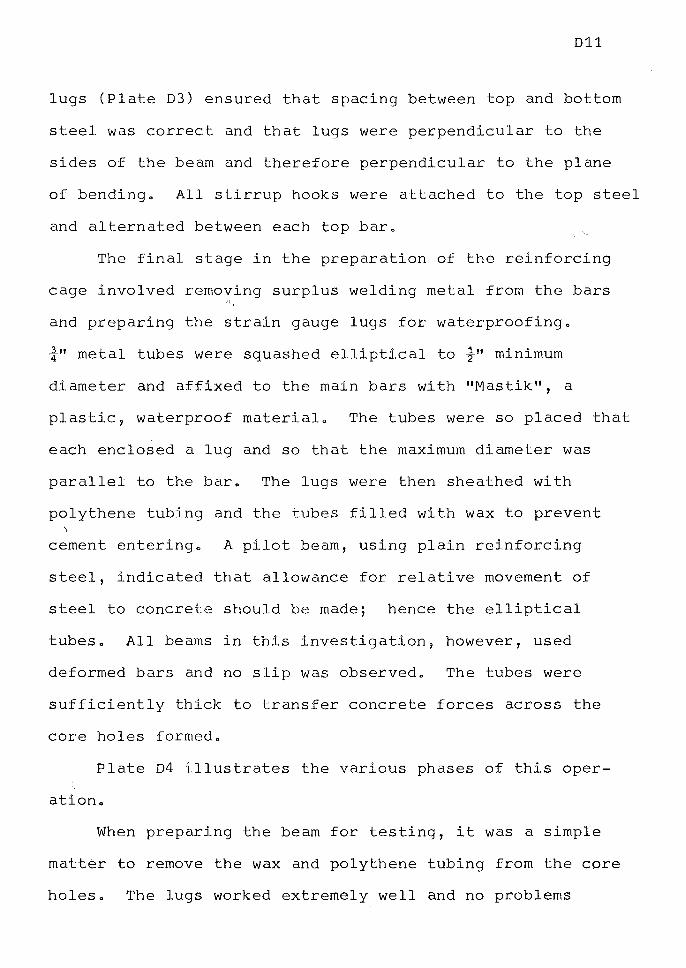
D11
lugs (Plate D3) ensured that spacing between top and bottom
steel was correct and that lugs were perpendicular to the
sides of the beam and therefore perpendicular to the plane
of bending. All stirrup hooks were attached to the top steel
and alternated between each top bar.
The final stage in the preparation of the reinforcing
cage involved remo~ing surplus welding metal from the bars
and preparing the strain gauge lugs for waterproofing.
¾" metal tubes were squashed elliptical to½" minimum
diameter and affixed to the main bars with "Mastik", a
plastic, waterproof material. The tubes were so placed that
each enclosed a lug and so that the maximum diameter was
parallel to the bar. The lugs were then sheathed with
polythene tubing and the tubes filled with wax to prevent
cement entering. A pilot beam, using plain reinforcing
steel, indicated that allowance for relative movement of
steel to concrete should be made; hence the elliptical
tubes. All beams in this investigation, however, used
deformed bars and no slip was observed. The tubes were
sufficiently thick to transfer concrete forces across the
core holes formed.
Plate D4 illustrates the various phases of this oper
ation.
When preparing the beam for testing, it was a simple
matter to remove the wax and polythene tubing from the core
holes. The lugs worked extremely well and no problems
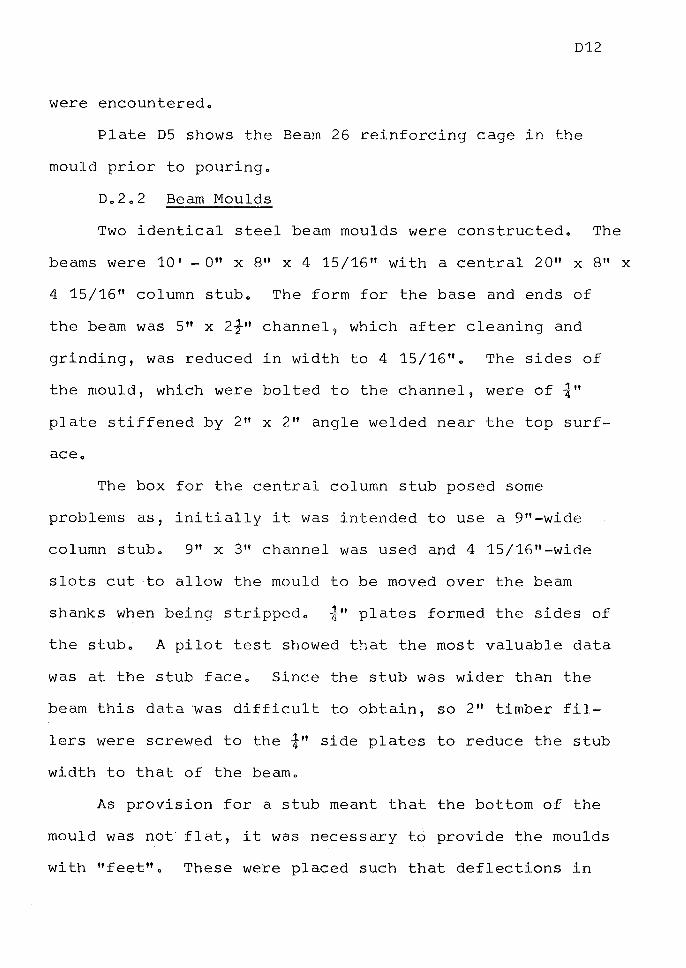
D12
were encounteredo
Plate D5 shows the Beam 26 reinforcing cage in the
mould prior to pouring"
Do2o2 Beam Moulds
Two identical steel beam moulds were constructedo The
beams were 10' - 0" x 8 11 x 4 15/16" with a central 20" x 8 11 x
4 15/16" column stubo The form for the base and ends of
the beam was 5 11 x 2-f" channel 9 which after cleaning and
grinding, was reduced in width to 4 15/16 110 The sides of
the mould, which were bolted to the channel, were of¾"
plate stiffened by 2 11 x 2" angle welded near the top surf-
aceo
The box for the central column stub posed some
problems as, initially it was intended to use a 9 11 -wide
column stubo 9" x 311 channel was used and 4 15/16"-wide
slots cut to allow the mould to be moved over the beam
shanks when being stripped" ¾" plates formed the sides of
the stubo A pilot test showed that the most valuable data
was at the stub faceo Since the stub was wider than the
beam this data was difficult to obtain, so 2 11 timber fil
lers were screwed to the¾" side plates to reduce the stub
width to that of the beamo
As provision for a stub meant that the bottom of the
mould was not flat, it was necessary to provide the moulds
with "feet"o These we:re placed such that deflections in
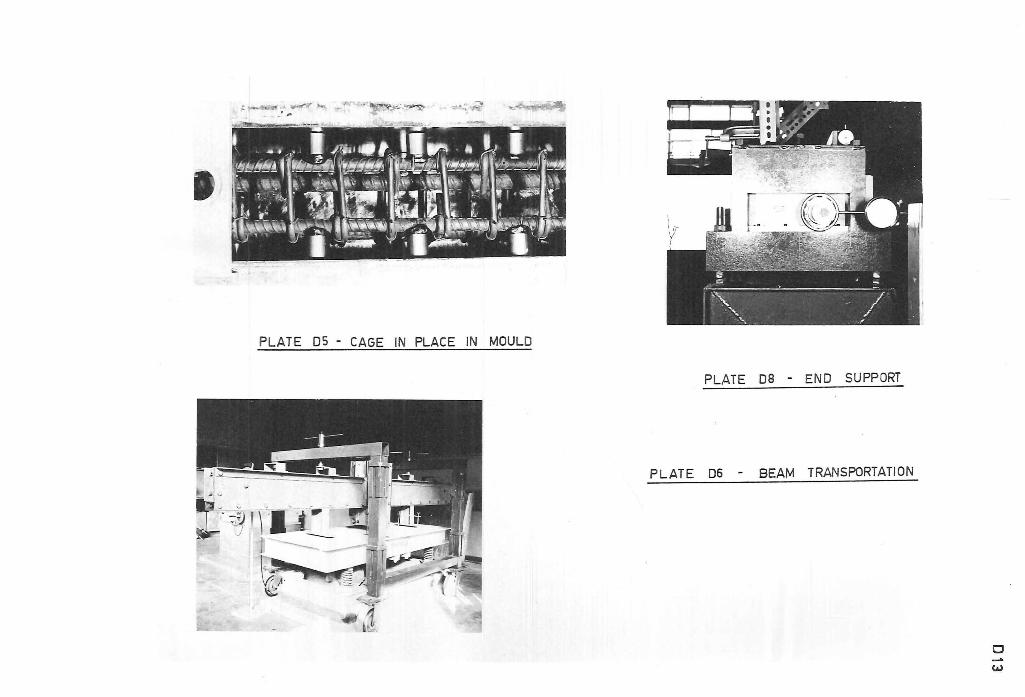
• PLATE OS - CAGE IN PLACE IN MOULD
PLATE D8 - END SUPPORT
PLATE 06 - BEAM TRANSPORTATION
• w
D14
the mould would be minimal when filled with wet concreteo
Again, this was probably an unnecessary precaution as
deformations of the order of only 000001" were involvedo
The feet were drilled with holes so that the moulds co'uld
be bolted to the vibrating tableo
Before assembling the moulds, the concrete-forming
surfaces were given two thin coats of clear varnisho
Following mould assembly, all joints were taped with PVC
electrical tape and the surfaces given a light coat of mould
oil using a soft clotho This procedure prevented leakage
and provided a very good finish to beam surfaceso
Do2o3 Transporting the Beams
The usual practice of moving beams and beam moulds
with rollers could not be applied to these beams owing to
the protruding column stubo A special gantry trolley was
made for the purpose of moving the beams either with or
without moulds, in places where other means were not
availableo
The trolley is illustrated in Plate D6o
Do3 TESTING EQUIPMENT AND PROCEDURE
Do3o1 Loading Frame
The design of the loading frame was based on minimum
deformations and most components were subjected to stresses
of less than 5,000 posoio under the worst conditions of
loadingo Deflection measurements performed during a
preliminary test showed the frame to be very rigid.
The loading frame is shown in Plate D7o
D.3.2 Load Application and Measurement
D15
Load was applied to the top and bottom of the column
stub by means of screw jacks. These were considered more
suitable than hydraulic jacks as deflection control was
possible when loading into the plastic range. Further, by
applying constant deflections instead of constant load,
the creep occurred mainly in the magnitude of load, rather
than in all the strain and deflection readings.
The load was measured with a Philips 5-ton load cell,
type PR9226, which was situated between the screw jack and
the column stub. ½" steel plates were plastered to the top
and bottom of the column stub and these were provided with
i" deep seats for the load cell.
The load cell was calibrated on an Avery 25,000 lb
Universal Testing Machine with a Budd Strain Bridge. The
gauge factor on the bridge was selected as that which gave
1 microstrain reading for each 1 lb load applied to the
cell. Repeatable results were obtained from several trials.
A thrust bearing between the screw jack and the load
cell took up the rotation in the screw jack.
D.3.3 Support Conditions
As the beams were to be loaded cyclically, it was
necessary to provide for both upward and downward reaction
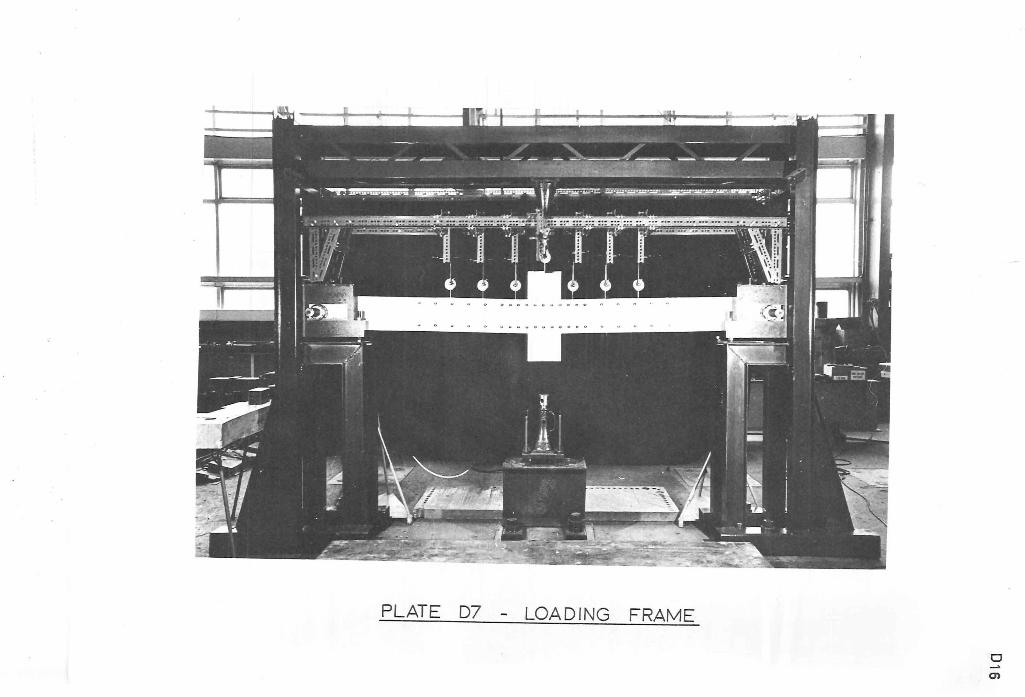
PLATE D7 LOADING FRAME
D 0,
D17
at the end supports, and to allow iongitudinal movement of
the beamo To facilitate this, rather complex end supports
were requiredo
The beams were cast with steel tubes at beam mid-depth
and centred 6" from the ends of the beamo These tubes were
machined to 2" diameter inside and were carefully sealed and
waterproofed to prevent concrete intrusion during and sub-
sequent to pouringo .1. fl 2 x 2" diameter steel plates were
placed at the open ends of the tubes, and these and the
mould sides were drilled so that a bolt located the tubes
correctly in the beam mouldo Each tube was spot-welded to
stirrups on each sideo
During testing, axles were inserted into the tubes and
grubber screws locked these in placeo The axle diameter
was reduced to 1½" at 2" from the beam sides, and roller
bearings fitted on to the ends of these axleso The bearings
fitted neatly into a milled groove in the rigid support box.
Although the locating bolts kept the tubes placed in the
beam during pouring, it was found necessary to alter
slightly the relative position of the support boxes for each
beam in order to avoid torsion at testing, and the position
of these boxes was made adjustable. Plate DB illustrates one
of the end supports.
D.3.4 Crack Detection
Prior to testing, each beam was white-washed to simplify
crack-detectiono At each load increment cracks were observed
D18
with x5 magnification hand microscopes, and marked with a
felt-tipped pen to give better definition on the photographso
Cracks were marked on only one side of each beam, the other
being left unmarked so that visual assessment of damage was
not impairedo
Do3o5 Steel and Concrete Strain Readings
Steel and concrete strains were measured on each side
of the beam by means of Demountable Mechanical (Demec)
gaugeso These gauges have a large strain range and are
known to work reliably under cyclic straining (cofo
EoRoS.G.)o For all beams, columns of 2" gauge length
covered the central 20'' of the beam and outside these were
five 4"-gauge lengths.
The strains were measured between stainless steel
discs drilled with a No. 60 hole and fixed to the steel
lugs and concrete with sealing waxo In the first few beams
tested, each column of gauge lengths had 6 rows; concrete
gauge points being placed¾" above and below each of the
steel gauge points. These concrete gauges were later found
to be of little value following cyclic loading 1 and only the
rows near the top and bottom of the beam were retainedo
Concrete strains were read only when that face was in
compression.
As two of the 2" gauge lengths had their common disc
right at the beam-stub joint, measurements with a 4'' Demec
D19
gauge were made over the pair since it was felt that these
common discs would drop off soon after cracking and valuable
readings would be losto In most cases, however, this did
not eventuate and, as mentioned above, the concrete gauges
did not provide any useful data anyway.
A beam shank from a test beam was supported on rollers
and used to provide temperature compensation readings for
the Demec gaugeso Corrections as high as 215 microstrains
were recorded.
Strains were measured on both sides of the beam and
temperature corrected readings averaged to obtain
curvatures. Variations in strain reading from one side of
the beam to the other were very low until steel yield
occurred. At this stage, steel in one side of the beam would
usually deform more than that on the othero However, at
yield the stresses were independent of strain and on reversal,
the difference in strain from the unloading point was more
important than absolute strain, and so it can be assumed that
steel stresses were approximately equal.
The gauge positions and all other instrumentation is
illustrated schematically in Figure D2.
Da3o6 Deflection
Nine 2 11 -travel, 0.001 11 dial gauges were mounted to obtain
deflection readings. Two of these were used to measure the
longitudinal movement of the beam and were mounted off heavy
steel stands; the foot of each gauge being in contact with
D20
the axle. The remaining seven dial gauges provided actual
beam deflections and were affixed to a rigid "Dexion''
frame which was securely attached to the end support boxes,
thus giving deflections relative to the pinned end supportso
A calculation showed the deformation in the box to be neg
ligible and the neat fit of the roller bearings in their
boxes provided continuity of deflection readings for both
upward and downward loading. Of these seven dial gauges,
one was seated on the loading plate at the top of the
column stub and the others were seated on aluminium strips
glued to the top surface of the beam. Therefore deflections
were obtained at three points on each beam shank. The
placing of these six dial gauges varied from beam to beam
and the exact positions are shown in Table D2 and Figure D2.
D.3.7 Rotations
In addition to the nine dial gauges, four inclinometer
stations were provided to give rotations at selected points.
Two of these were at the top and bottom loading plates on
the stub while the others were centred 18" from the free
ends of the beam. The beam inclinometer readings could be
used to provide additional deflection values as, being
situated 12" from the support, the beams were still exhibit
ing elastic behaviour at these stations.
As mentioned in Chapter 7, the asymmetrical behaviour
of these beams resulted in rotation of the column stub.
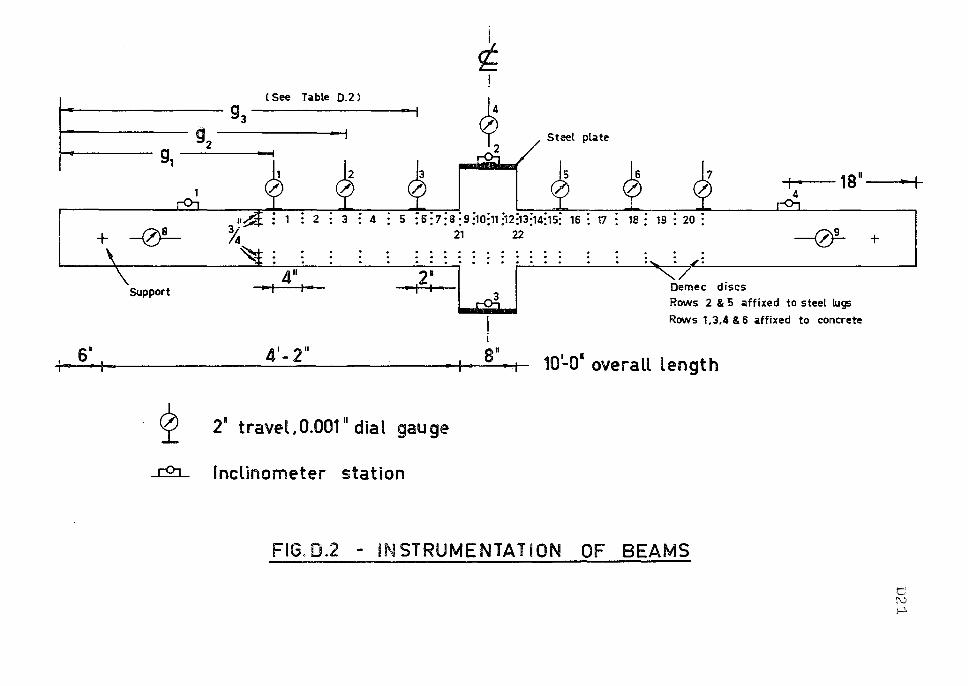
~
s·
t ( See Table D.2)
93
9, g2 Steel plate ~ 2
18 11 ---•_JI 4
: 2 : 4 5 : 6 :7: 8: 9 :10:11 ;12:13;14;15: 16 : 17 18 ; 19 : 20 :
+ -eJ- 21 22 -eJ- +
Support
4 1-2 11
2· -+;;:::+
:£ 21 travel.0.001 u dial gauge
..r:2L. Inclinometer station
3
I i au
. . .
Demec discs Rows 2 & 5 affixed to steel lugs
Rows 1,3.4 & 6 affixed to concrete
10'-o• overall length
FIG. 0.2 - INSTRUMENTATION OF BEAMS
..... , '-' '.'-)
I-'>
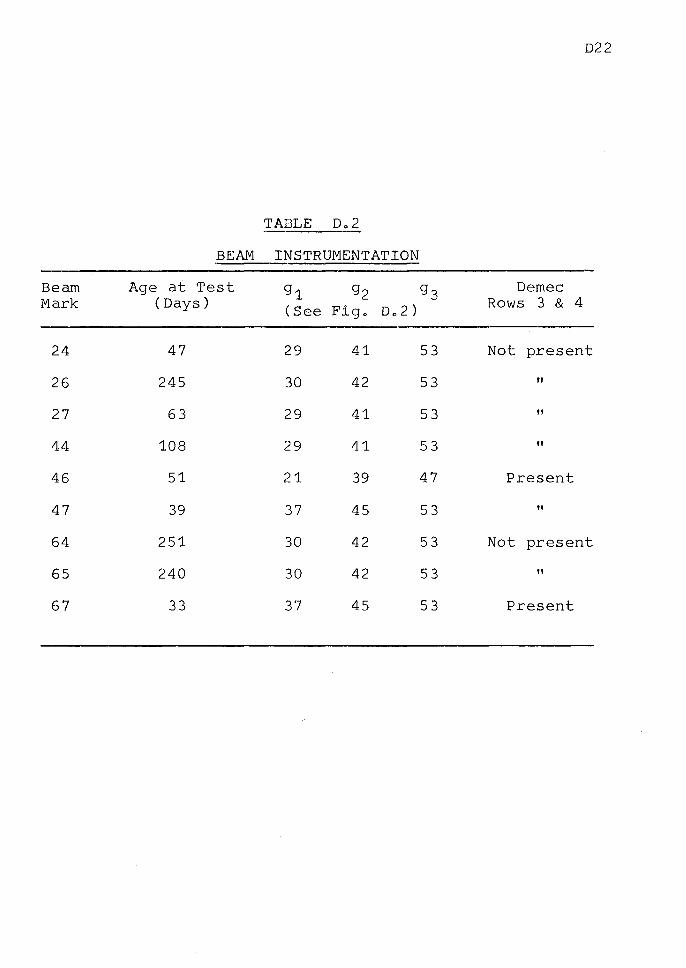
D22
TABLE D.2
BEAM INSTRUMENTATION
Beam Age at Test 91 92 93 Demec Mark (Days) (See Fig. Do2) Rows 3 & 4
24 47 29 41 53 Not present
26 245 30 42 53 ti
27 63 29 41 53 II
44 108 29 41 53 II
46 51 21 39 47 Present
47 39 37 45 53 II
64 251 30 42 53 Not present
65 240 30 42 53 II
67 33 37 45 53 Present
D23
The column stub inclinometer readings provided rotations that
could be averaged and used to correct the deflections for
symmetrical behaviouro
Do3o8 Age of Beams at Test
The tests were up to 5 days in duration and beam ages
at testing varied from 33 to 251 days as shown in Table D2o
Do3o9 Sequence of Operations
For the initial "zero" readings, when the uncracked
beam was subjected only to self-weight loading, the follow
ing sequence of operations was observed:-
1. Temperature compensation readings,
2 0 Dial gauges,
3o Demec gauges, column by column,
4. Temperature compensation readings,
5. Inclinometer stations,
6. Demec gauges, column by column,
7o Dial gauges,
8. Temperature compensation readings.
Demec gauges were read twice for two reasons: firstly,
to ensure that important initial readings were accurate;
secondly, as a means of determning the accuracy (i.e.
repeatability) that could be expected from the Demec gauges.
The standard deviations so obtained were of the order of 7
microstrains for all beams and for all Demec gauge operatorso
For all other load stages, the procedure was:-
1. Increase or decrease deflection and read
initial load,
2o Record load at 30 second intervals for
2 minutes and mark cracks,
3. Inclinometer readings and complete crack
detection,
4. Record load,
5. Dial gauges,
6. Demec gauges, column by column,
7. Dial gauges,
8. Record loado
D24
Temperature compensation readings were taken at
approximately half-hourly intervals and interpolation pro
vided values for each load increment.
The quantity of Demec readings varied from increment
to increment. At the end or beginning of a day's testing,
or at any other time when the beam was subjected only to
self-weight loading, all Demec positions were read. During
yield, when the applied load was changing very little, only
the 2" gauge lengths were measured; the deformations in
the 4" gauge lengths, and in fact in many of the 2" gauge
lengths, changing very little during such plastic deform
ation. As mentioned earlier, concrete gauges were read
only when the loading imposed compression at that gauge 1
and then only at selected gauges: on average every second
increment.
D25
Inclinometer readings were also taken at selected load
stages but all stations were read when the beam was in the
plastic range, i0e@ when large deflections were taking place.
Of the creep that occurred in the load value, most
occurred within¾ min~ of application. Change in magnitude
of loading before and after dial and Demec gauge readings
was less than 2 per cent in the worst case. It is interest
ing to note that during unloadingj creep resulted in a small
increase in load in every case.
Recommended


