
Im
AEa
b
a
ARR2AA
KMSIMO
1
NdbfmvvsmluTi[e
0d
Journal of Membrane Science 371 (2011) 28–36
Contents lists available at ScienceDirect
Journal of Membrane Science
journa l homepage: www.e lsev ier .com/ locate /memsci
nvestigation on the effects of a mechanical shear-stress modificationethod during cross-flow membrane emulsification
ndras Korisa,b,1, Emma Piacentinia, Gyula Vataib,1, Erika Bekassy-Molnarb,1,nrico Drioli a, Lidietta Giornoa,∗
Istituto per la Tecnologia delle Membrane, Consiglio Nazionale delle Ricerche, ITM-CNR, Via P. Bucci 17/C, 87030 Rende (CS), ItalyCorvinus University of Budapest, Faculty of Food Science, Department of Food Engineering, Ménesi út 44, Budapest, 1118, Hungary
r t i c l e i n f o
rticle history:eceived 29 September 2010eceived in revised form8 December 2010ccepted 8 January 2011vailable online 19 January 2011
eywords:embrane emulsification
a b s t r a c t
This study deals with an alternative method for increasing the shear-stress at the membrane surfacewhile maintaining a low value along the circuit out of the membrane during emulsification process. Witha simple mechanical method, by using turbulence static promoters, it was possible to obtain very goodemulsion quality in terms of droplet size distribution and stability, even operating at high dispersed phaseflux values. Soybean oil was emulsified in aqueous Tween 80 solution with a simple cross-flow apparatusequipped with SPG membrane having 3.1 �m pore size. Two kinds of cross-section reducer elements(a smooth cylindrical and a helix-shaped) were installed within the lumen side of the tube membrane.Results were compared with the conventional cross-flow membrane emulsification method. During the
hear-stressntensification
odellingil-in-water emulsion
tests the rotation of the recirculation pump was kept at low level to minimize mechanical stress andenergy consumption. After the investigation of the effect of the driving force and shear-stress on the qual-ity of the o/w emulsion, a model was established. To verify the durability of the novel method, long termemulsification, was carried out as well. Emulsions up to 38% of oil concentration were obtained. Resultsdemonstrated that, with this simple modification, it was possible to prepare o/w emulsion with narrowdroplet size distribution using low aqueous-phase flow rate compared to other cross-flow membrane
ity co
emulsification. Productiv. Introduction
Membrane emulsification (ME) is a technique introduced byakashima and Shimizu in the late 1980s. In this process, theispersed phase is forced through the pores of a microporous mem-rane directly into the continuous phase. Emulsified droplets areormed and detached at the end of the pores with a drop-by-drop
echanism. The advantages of membrane emulsification over con-entional emulsification processes are that it enables to obtainery fine emulsions of controlled droplet sizes and narrow dropletize distributions. Successful emulsification can be carried out withuch less consumption of emulsifier and energy, and because of the
owered shear-stress effect, membrane emulsification allows these of shear-sensitive ingredients, such as starch and proteins [1].
he method of membrane emulsification has already been appliedn some areas of food-, chemical-, electronic and medical industry2–6]. For membrane emulsification, several types of membranes,.g. ceramic, polymeric and glass are tested. The Shirasu porous-∗ Corresponding author. Tel.: +39 0984 492050; fax: +39 0984 402103.E-mail address: [email protected] (L. Giorno).
1 Tel.: +36 1 4826112.
376-7388/$ – see front matter © 2011 Elsevier B.V. All rights reserved.oi:10.1016/j.memsci.2011.01.005
uld also be increased obtaining high emulsion quality.© 2011 Elsevier B.V. All rights reserved.
glass (SPG) membrane was developed by Nakashima and Shimizu[7] in Japan. This type of membrane has uniform pores and narrowpore size distribution compared to, for example, ceramic mem-branes. The SPG membranes are also available in wide range ofpore sizes.
In literature it is reported that, to ensure good emulsion quality,relatively high axial cross-flow velocity (0.5–1.4 m/s) for contin-uous phase and transmembrane pressure–critical pressure ratioof approximately 1.1–1.2 for disperse phase are needed [8,9]. Theproblems with these operating mode setups are to obtain highshear-stress near the membrane surface associated with high axialflow rate and low productivity (low disperse phase flux). There aremany publications about the understanding of the effect of operat-ing parameters involved in membrane emulsification [10–14]. Oneof the innovative methods to improve the process is the applica-tion of vibrating membrane [15,16]. According to these researches,membrane emulsification could be enhanced by mechanicallyexciting the membrane, thereby enabling the formation of smaller
droplets of a narrower size distribution, combined with higher spe-cific production rate. The present paper deals with a simple, staticmethod, which is cost-effective and is able to increase the pro-ductivity of cross-flow membrane emulsification with satisfyingquality.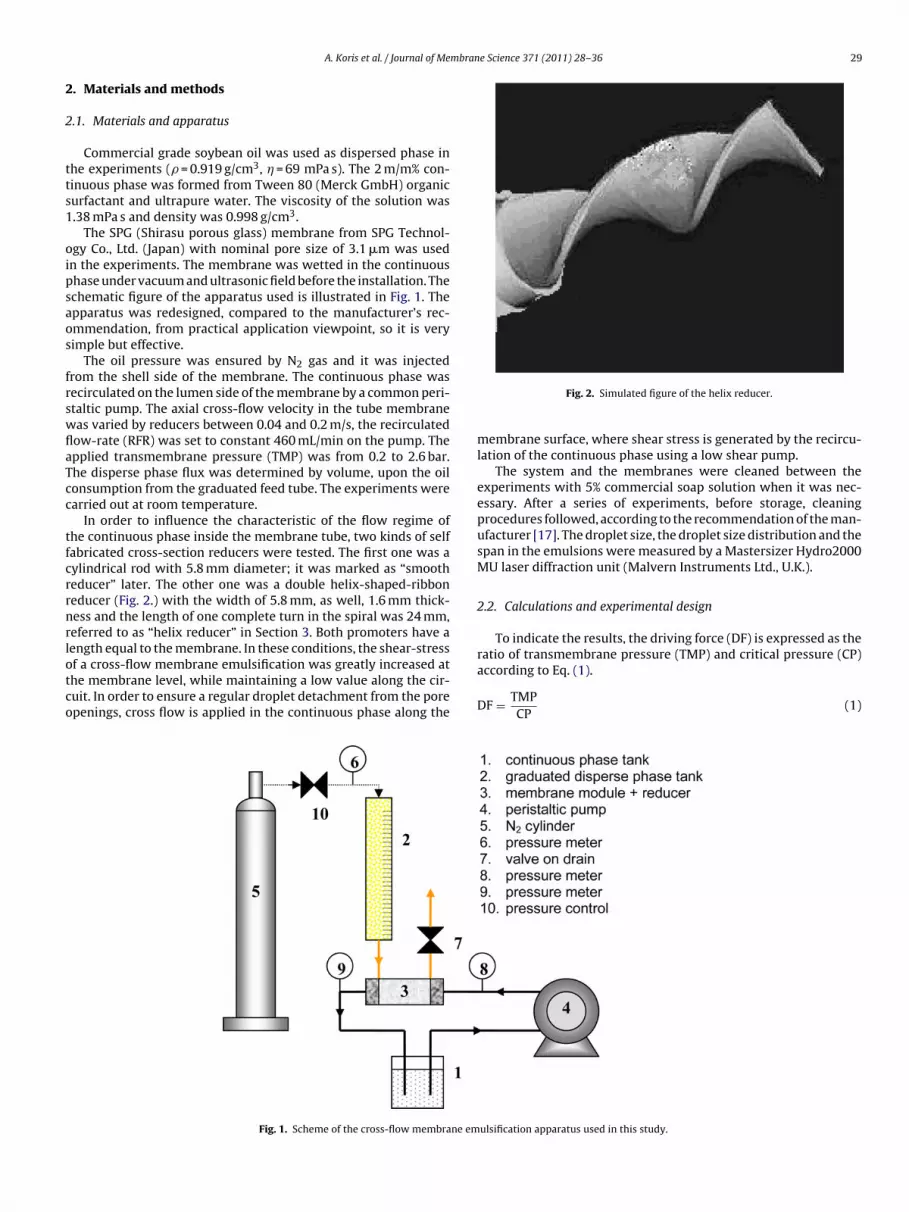
mbrane Science 371 (2011) 28–36 29
2
2
tts1
oipsaos
frswflaTcc
tfcrrnrlotco
A. Koris et al. / Journal of Me
. Materials and methods
.1. Materials and apparatus
Commercial grade soybean oil was used as dispersed phase inhe experiments (� = 0.919 g/cm3, � = 69 mPa s). The 2 m/m% con-inuous phase was formed from Tween 80 (Merck GmbH) organicurfactant and ultrapure water. The viscosity of the solution was.38 mPa s and density was 0.998 g/cm3.
The SPG (Shirasu porous glass) membrane from SPG Technol-gy Co., Ltd. (Japan) with nominal pore size of 3.1 �m was usedn the experiments. The membrane was wetted in the continuoushase under vacuum and ultrasonic field before the installation. Thechematic figure of the apparatus used is illustrated in Fig. 1. Thepparatus was redesigned, compared to the manufacturer’s rec-mmendation, from practical application viewpoint, so it is veryimple but effective.
The oil pressure was ensured by N2 gas and it was injectedrom the shell side of the membrane. The continuous phase wasecirculated on the lumen side of the membrane by a common peri-taltic pump. The axial cross-flow velocity in the tube membraneas varied by reducers between 0.04 and 0.2 m/s, the recirculatedow-rate (RFR) was set to constant 460 mL/min on the pump. Thepplied transmembrane pressure (TMP) was from 0.2 to 2.6 bar.he disperse phase flux was determined by volume, upon the oilonsumption from the graduated feed tube. The experiments werearried out at room temperature.
In order to influence the characteristic of the flow regime ofhe continuous phase inside the membrane tube, two kinds of selfabricated cross-section reducers were tested. The first one was aylindrical rod with 5.8 mm diameter; it was marked as “smootheducer” later. The other one was a double helix-shaped-ribboneducer (Fig. 2.) with the width of 5.8 mm, as well, 1.6 mm thick-ess and the length of one complete turn in the spiral was 24 mm,eferred to as “helix reducer” in Section 3. Both promoters have a
ength equal to the membrane. In these conditions, the shear-stressf a cross-flow membrane emulsification was greatly increased athe membrane level, while maintaining a low value along the cir-uit. In order to ensure a regular droplet detachment from the porepenings, cross flow is applied in the continuous phase along theFig. 1. Scheme of the cross-flow membrane em
Fig. 2. Simulated figure of the helix reducer.
membrane surface, where shear stress is generated by the recircu-lation of the continuous phase using a low shear pump.
The system and the membranes were cleaned between theexperiments with 5% commercial soap solution when it was nec-essary. After a series of experiments, before storage, cleaningprocedures followed, according to the recommendation of the man-ufacturer [17]. The droplet size, the droplet size distribution and thespan in the emulsions were measured by a Mastersizer Hydro2000MU laser diffraction unit (Malvern Instruments Ltd., U.K.).
2.2. Calculations and experimental design
To indicate the results, the driving force (DF) is expressed as the
ratio of transmembrane pressure (TMP) and critical pressure (CP)according to Eq. (1).DF = TMPCP
(1)
ulsification apparatus used in this study.

30 A. Koris et al. / Journal of Membrane Science 371 (2011) 28–36
Table 1Design variables and their ranges.
Independent factors Code Min. value(−1)
Centerpoint (0)
Max. value(+1)
Trp
P
TtwdtsE
�
wdvfitttbreA
wastamesae
TT
(3.1 SPG, DF=1.1, RFR=460 mL/min )
7
8
9
10
11
0.80.60.40.20
(no reducer helix reducer smooth reducer)
D,μ
m
0.2
0.3
0.4
0.5
0.6
0.7
0.8
0.9
Sp
an
D[3,2]
D[4,3]
SPAN
sible to prepare stable emulsion with satisfactory low span. Thisis indicated in Fig. 5. With the careful influence of transmembranepressure it was possible to reach driving force 7.8 but above thisvalue increase in droplet size (also in span) was observed. In con-
Driving force X1 1.1 7.8 14.4Shear-stress (Pa) X2 0.048 0.323 0.598
he critical pressure is equivalent to the minimum pressureequired to obtain dispersed phase permeation that is the capillaryressure, Pc:
c = 4�ow cos �
dp(2)
he critical pressure depends on O/W interfacial tension (�ow), con-act angle (�) of the dispersed phase against the membrane surfaceetted with the continuous phase and average membrane poreiameter (dp). In the present work CP was determined experimen-ally, following the instructions of the producer [17]. The sheartress (�) near lumen side membrane surface is calculated fromq. (3).
= k · � · � · v2
2[Pa] (3)
here � is the friction factor (in laminar case � = 16/Re), � is theensity of the continuous phase (kg/m3), v is the axial cross-flowelocity (m/s). Constant k is a geometry dependent correction coef-cient for the system with non cylindrical insert. The k value forhe helix turbulence promoter which was previously described inhis work is 0.912. In case of empty, cylindrical tube and tube withhe smooth reducer the value of k equals to 1. The Reynolds num-er was calculated with equivalent diameter when a cross-sectioneducer was present. The detailed background of the shear-stressstimations for the non-cylindrical cases can be found in Appendixsession.3P type full factorial designs were applied to built up a model
hich can describe the effect of the two operating parameters (DFnd �) on disperse phase flux (DPF), droplet size and span. Responseurface methodology is a collection of mathematical and statisticalechniques that can be used for studying the effect of several factorst different level and their influence on each other. The experi-ents were designed to allow an estimation of interactions and
ven quadratic effects, and therefore, to give an idea of the (local)
hape of the response surface investigated [18–20]. The design vari-bles and their ranges can be found in Table 1 and the factorialxperimental design and responses in Table 2.able 2he values of independent factors and responses.
No. Independent factors Responses
DF � (Pa) D[2,3] (mm) Span DPF (L/m2/h)
1 1.1 0.048 8.3 0.82 0.282 1.1 0.323 8 0.81 0.733 1.1 0.598 8.2 0.82 0.694 7.8 0.048 8.6 0.84 4.715 7.8 0.323 8.2 0.82 8.486 7.8 0.598 8.4 0.81 12.167 14.4 0.048 10.5 1.8 12.428 14.4 0.323 10.1 2 29.649 14.4 0.598 8.7 0.83 31.39
10 7.8 0.323 8.17 0.81 8.3311 7.8 0.323 8.22 0.81 8.4012 7.8 0.323 8.12 0.80 8.3213 7.8 0.323 8.15 0.81 8.51
Shear-stress, Pa
Fig. 3. Droplet size and span versus shear-stress in case of 3.1 �m SPG membrane.
3. Results and discussion
3.1. Determination of critical pressure and experiments withdifferent shear-stress, driving force and pore size
The critical pressure (CP) of soybean oil for 3.1 �m membranewas successfully measured according to the recommendation ofthe membrane producer [17]. The CP was found to be 18 kPa. Withthe help of this data, driving forces could be calculated for eachexperiment by Eq. (1). In the experiments, the results of whichare introduced in this part, the final concentration of oil in theemulsions was between 3 and 10 w/w%.
The shear-stress had no significant effect on the droplet sizewhen driving force 1.1 was used (Fig. 3). This is because the lowdispersed phase flux allowed axial shear stress in the used rangevalues at removing droplets of similar size. In these conditions, thepermeate flux mainly governs the droplets formation.
In Fig. 4 droplet size versus the reducer increased shear stress fordriving force 14.4 is shown. The sizes of the droplets are decreas-ing significantly when the shear-stress at the membrane level ishigher, however, the recirculated flow-rate is constant in the rest ofthe system. Without the cross-section reducer, using driving force14.4 and relatively low continuous phase flow-rate, it was not pos-
trast to this with the modification of the cross-section, due to the
(3.1 SPG, DF=14.4, RFR=460 mL/min )
8
10
12
14
16
18
20
22
0.80.60.40.20
(no reducer helix reducer smooth reducer)
D, μ
m
0
0.4
0.8
1.2
1.6
2
Sp
an
D[3,2]
D[4,3]
SPAN
Shear-stress, Pa
Fig. 4. Reduce of droplet sizes at driving force 14.4 with the increase of shear-stress(Pa).
A. Koris et al. / Journal of Membrane Science 371 (2011) 28–36 31
(3.1 SPG, RFR=460 mL/min)
6
8
10
12
14
16
18
20
22
1612840
DF
D, μ
m
0
0.2
0.4
0.6
0.8
1
1.2
1.4
1.6
1.8
2
Sp
an
D3,2 no red.
D3,2 smooth red.
D4,3 no red.
D4,3 smooth red.
span no red.
span red.
Fig. 5. Comparison of droplet sizes in the absence and presen
(3,1 SPG, RFR=460 mL/min)
0
5
10
15
20
25
30
35
1612840
Flu
x,
L/m
2/h
Fr
hapibb(
oiiraba
DF
ig. 6. Dispersed phase flux values in the presence of the smooth cross-sectioneducer on different driving forces.
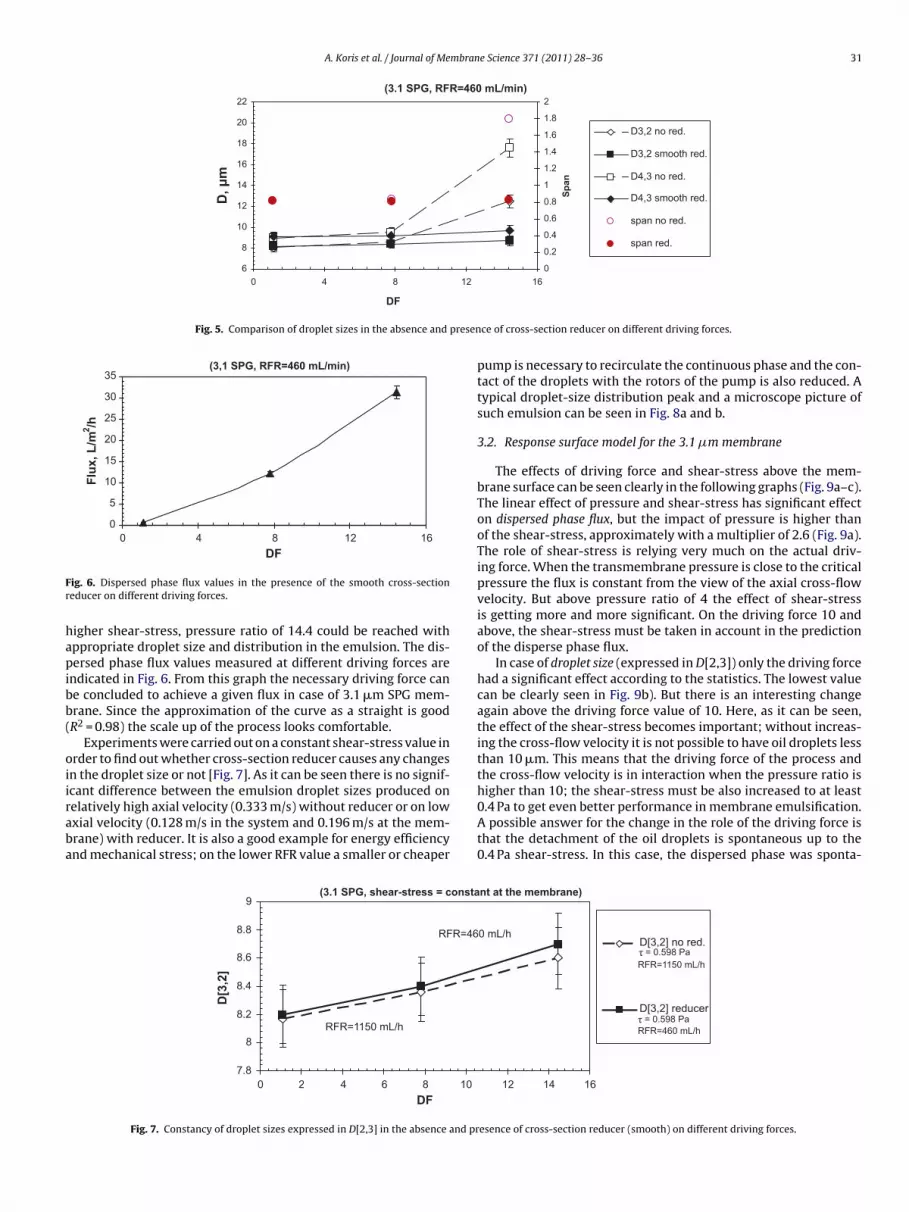
igher shear-stress, pressure ratio of 14.4 could be reached withppropriate droplet size and distribution in the emulsion. The dis-ersed phase flux values measured at different driving forces are
ndicated in Fig. 6. From this graph the necessary driving force cane concluded to achieve a given flux in case of 3.1 �m SPG mem-rane. Since the approximation of the curve as a straight is goodR2 = 0.98) the scale up of the process looks comfortable.
Experiments were carried out on a constant shear-stress value inrder to find out whether cross-section reducer causes any changesn the droplet size or not [Fig. 7]. As it can be seen there is no signif-
cant difference between the emulsion droplet sizes produced onelatively high axial velocity (0.333 m/s) without reducer or on lowxial velocity (0.128 m/s in the system and 0.196 m/s at the mem-rane) with reducer. It is also a good example for energy efficiencynd mechanical stress; on the lower RFR value a smaller or cheaper(3.1 SPG, shear-stress = consta
7.8
8
8.2
8.4
8.6
8.8
9
1086420
DF
D[3
,2]
RFR=1150 mL/h
RFR=46
Fig. 7. Constancy of droplet sizes expressed in D[2,3] in the absence and pr
ce of cross-section reducer on different driving forces.
pump is necessary to recirculate the continuous phase and the con-tact of the droplets with the rotors of the pump is also reduced. Atypical droplet-size distribution peak and a microscope picture ofsuch emulsion can be seen in Fig. 8a and b.
3.2. Response surface model for the 3.1 �m membrane
The effects of driving force and shear-stress above the mem-brane surface can be seen clearly in the following graphs (Fig. 9a–c).The linear effect of pressure and shear-stress has significant effecton dispersed phase flux, but the impact of pressure is higher thanof the shear-stress, approximately with a multiplier of 2.6 (Fig. 9a).The role of shear-stress is relying very much on the actual driv-ing force. When the transmembrane pressure is close to the criticalpressure the flux is constant from the view of the axial cross-flowvelocity. But above pressure ratio of 4 the effect of shear-stressis getting more and more significant. On the driving force 10 andabove, the shear-stress must be taken in account in the predictionof the disperse phase flux.
In case of droplet size (expressed in D[2,3]) only the driving forcehad a significant effect according to the statistics. The lowest valuecan be clearly seen in Fig. 9b). But there is an interesting changeagain above the driving force value of 10. Here, as it can be seen,the effect of the shear-stress becomes important; without increas-ing the cross-flow velocity it is not possible to have oil droplets lessthan 10 �m. This means that the driving force of the process andthe cross-flow velocity is in interaction when the pressure ratio is
higher than 10; the shear-stress must be also increased to at least0.4 Pa to get even better performance in membrane emulsification.A possible answer for the change in the role of the driving force isthat the detachment of the oil droplets is spontaneous up to the0.4 Pa shear-stress. In this case, the dispersed phase was sponta-nt at the membrane)
161412
D[3,2] no red.
D[3,2] reducer
0 mL/h
τ = 0.598 Pa
τ = 0.598 Pa
RFR=1150 mL/h
RFR=460 mL/h
esence of cross-section reducer (smooth) on different driving forces.

32 A. Koris et al. / Journal of Membran
Fig. 8. (a) A typical droplet-size distribution peak (3.1 �m, smooth reducer,DF = 14.4, 460 mL/min). (b) O/W emulsion prepared with 3.1 �m membrane undermicroscope (20×, 10%, DF = 2.2, 460 mL/min, smooth reducer).
2
6
10
14
Driving force
0.1
0.3
0.5
Shear-stress (
Pa)
0
10
20
30
40
DPF (L/m2/h)a
46
810
1214
Driving force
0.4
0.8
1.2
1.6
2.0
Span
Fig. 9. Fitted 3D surfaces for the effect of DF and she
e Science 371 (2011) 28–36
neously transformed into spherical droplets by interfacial tension.The phenomenon mentioned previously was also observed whenspan was analysed (Fig. 9c); its effect was quite constant even onhigh pressure ratio but it could be significantly decreased by theincrease of the shear-stress. These results are in good consistencywith the statement of other researchers; the higher is the pres-sure and disperse phase flux, the higher is the droplet size andalso span. With a large degree increase of shear-stress the dropletsize and span could be controlled, but this kind of method is lead-ing to higher mechanical stress for the raw material and also tohigher energy consumption due to the increased speed of the recir-culation pump in conventional (no reducer) mode. The operatingparameters for long term emulsification were chosen upon the con-sideration of droplet size, low shear-stress and satisfactory flux. Inorder to get a precise and complete optimisation it would be neces-sary to further extend the investigated parameters and their range.Nevertheless, the established and introduced model is appropri-ate for predicting the performance and the quality of membraneemulsification within the investigated range. The effect estimatesincluding the effects, errors, standard errors, probability values aredetailed in Table 3.
3.3. Process stability and productivity
In these experiments the dispersed phase flux, the droplet sizeand its span, and also oil concentration in the continuous phasewere observed together with time to get more information about
the stability of the novel mechanically modified cross-flow mem-brane emulsification method. For operating parameters the valueof shear-stress was chosen as 0.4 Pa, which equals to the cross-flow velocity of 0.13 m/s, and for the driving force 0.8 was set andthe above mentioned parameter were followed in time (Fig. 10).2
6
10
14
Driving force
0.1
0.3
0.5
Shear-stress (
Pa)
7.5
8.5
9.5
10.5
D[3,2]b
2
0.1
0.3
0.5
Shear-stre
ss (Pa)
c
ar-stress on (a) flux, (b) droplet size, (c) span.
A. Koris et al. / Journal of Membrane Science 371 (2011) 28–36 33
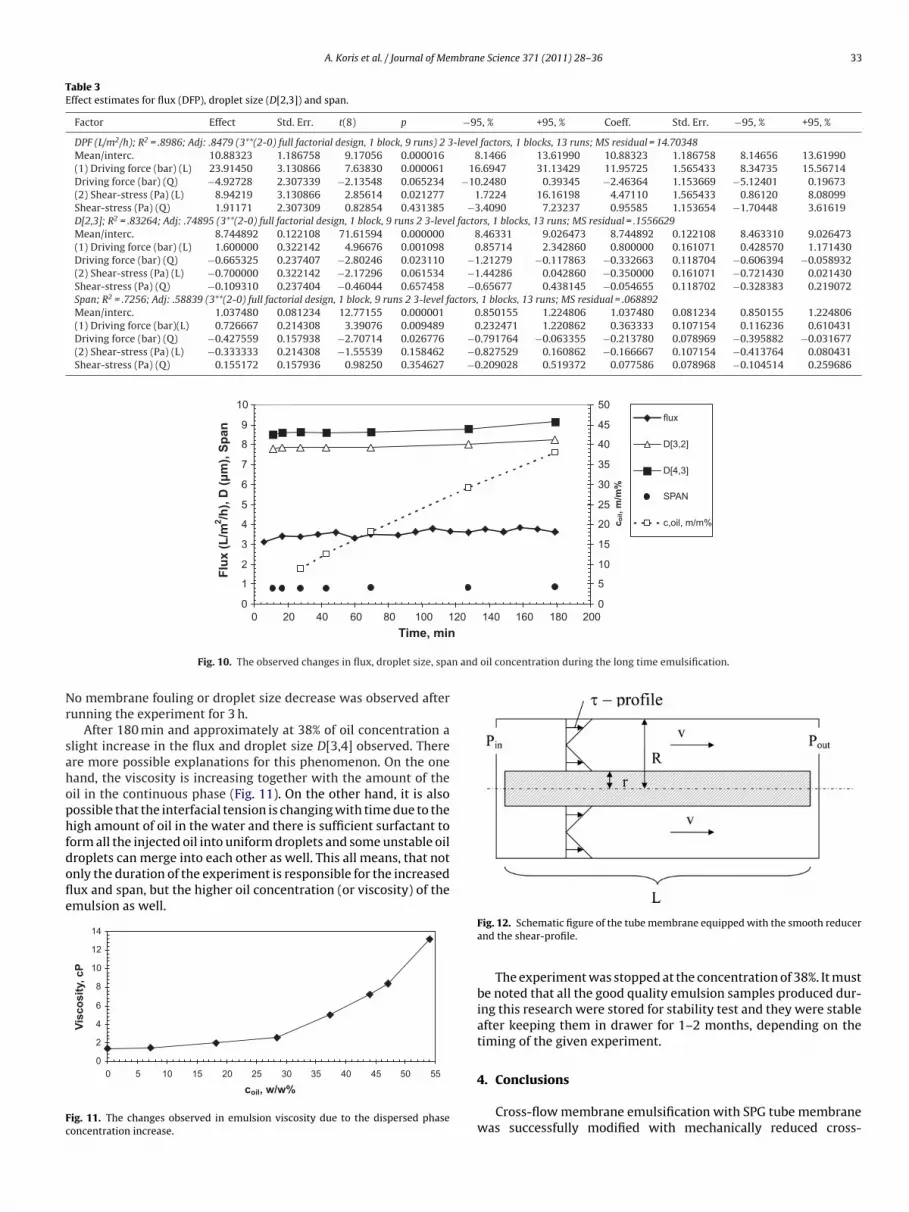
Table 3Effect estimates for flux (DFP), droplet size (D[2,3]) and span.
Factor Effect Std. Err. t(8) p −95, % +95, % Coeff. Std. Err. −95, % +95, %
DPF (L/m2/h); R2 = .8986; Adj: .8479 (3**(2-0) full factorial design, 1 block, 9 runs) 2 3-level factors, 1 blocks, 13 runs; MS residual = 14.70348Mean/interc. 10.88323 1.186758 9.17056 0.000016 8.1466 13.61990 10.88323 1.186758 8.14656 13.61990(1) Driving force (bar) (L) 23.91450 3.130866 7.63830 0.000061 16.6947 31.13429 11.95725 1.565433 8.34735 15.56714Driving force (bar) (Q) −4.92728 2.307339 −2.13548 0.065234 −10.2480 0.39345 −2.46364 1.153669 −5.12401 0.19673(2) Shear-stress (Pa) (L) 8.94219 3.130866 2.85614 0.021277 1.7224 16.16198 4.47110 1.565433 0.86120 8.08099Shear-stress (Pa) (Q) 1.91171 2.307309 0.82854 0.431385 −3.4090 7.23237 0.95585 1.153654 −1.70448 3.61619D[2,3]; R2 = .83264; Adj: .74895 (3**(2-0) full factorial design, 1 block, 9 runs 2 3-level factors, 1 blocks, 13 runs; MS residual = .1556629Mean/interc. 8.744892 0.122108 71.61594 0.000000 8.46331 9.026473 8.744892 0.122108 8.463310 9.026473(1) Driving force (bar) (L) 1.600000 0.322142 4.96676 0.001098 0.85714 2.342860 0.800000 0.161071 0.428570 1.171430Driving force (bar) (Q) −0.665325 0.237407 −2.80246 0.023110 −1.21279 −0.117863 −0.332663 0.118704 −0.606394 −0.058932(2) Shear-stress (Pa) (L) −0.700000 0.322142 −2.17296 0.061534 −1.44286 0.042860 −0.350000 0.161071 −0.721430 0.021430Shear-stress (Pa) (Q) −0.109310 0.237404 −0.46044 0.657458 −0.65677 0.438145 −0.054655 0.118702 −0.328383 0.219072Span; R2 = .7256; Adj: .58839 (3**(2-0) full factorial design, 1 block, 9 runs 2 3-level factors, 1 blocks, 13 runs; MS residual = .068892Mean/interc. 1.037480 0.081234 12.77155 0.000001 0.850155 1.224806 1.037480 0.081234 0.850155 1.224806(1) Driving force (bar)(L) 0.726667 0.214308 3.39076 0.009489 0.232471 1.220862 0.363333 0.107154 0.116236 0.610431Driving force (bar) (Q) −0.427559 0.157938 −2.70714 0.026776 −0.791764 −0.063355 −0.213780 0.078969 −0.395882 −0.031677(2) Shear-stress (Pa) (L) −0.333333 0.214308 −1.55539 0.158462 −0.827529 0.160862 −0.166667 0.107154 −0.413764 0.080431Shear-stress (Pa) (Q) 0.155172 0.157936 0.98250 0.354627 −0.209028 0.519372 0.077586 0.078968 −0.104514 0.259686
0
1
2
3
4
5
6
7
8
9
10
200180160140120100806040200
Flu
x (
L/m
2/h
), D
(μ
m),
Sp
an
0
5
10
15
20
25
30
35
40
45
50
co
il, m
/m%
flux
D[3,2]
D[4,3]
SPAN
c,oil, m/m%
n and oil concentration during the long time emulsification.
Nr
sahophfdofle
Fc
Time, min
Fig. 10. The observed changes in flux, droplet size, spa
o membrane fouling or droplet size decrease was observed afterunning the experiment for 3 h.
After 180 min and approximately at 38% of oil concentration alight increase in the flux and droplet size D[3,4] observed. Therere more possible explanations for this phenomenon. On the oneand, the viscosity is increasing together with the amount of theil in the continuous phase (Fig. 11). On the other hand, it is alsoossible that the interfacial tension is changing with time due to theigh amount of oil in the water and there is sufficient surfactant to
orm all the injected oil into uniform droplets and some unstable oilroplets can merge into each other as well. This all means, that notnly the duration of the experiment is responsible for the increasedux and span, but the higher oil concentration (or viscosity) of themulsion as well.
0
2
4
6
8
10
12
14
5550454035302520151050
coil, w/w%
Vis
co
sit
y, cP
ig. 11. The changes observed in emulsion viscosity due to the dispersed phaseoncentration increase.
Fig. 12. Schematic figure of the tube membrane equipped with the smooth reducerand the shear-profile.
The experiment was stopped at the concentration of 38%. It mustbe noted that all the good quality emulsion samples produced dur-ing this research were stored for stability test and they were stableafter keeping them in drawer for 1–2 months, depending on thetiming of the given experiment.
4. Conclusions
Cross-flow membrane emulsification with SPG tube membranewas successfully modified with mechanically reduced cross-

3 mbran
silaobciomsoeoepdseafa
A
Rg(2
A
s(dtw
aN
F
w
gfl
�
tt
F
Id
F
4 A. Koris et al. / Journal of Me
ection. Compared to other researches, with our described setupt was possible to prepare good quality oil-in-water emulsion atow shear-stress in the system (outside the membrane) due to thepplied lower recirculated flow-rate values. Furthermore, becausef the applied higher driving force, the disperse-phase flux coulde raised, therefore the necessary time to produce stable high con-entrated emulsion can be reduced. The novel method introducedn this study does not need difficult modification in the apparatusr high investment, so it can be applied in new but also in existingembrane emulsification applications. The process is particularly
uitable when shear-sensitive materials are processed. The benefitsf the reduction of the cross-section area at cross-flow membranemulsification proved durability as well; no negative effect wasbserved because of the reduction during 3 h of emulsification, notven when the oil concentration reached 38% in the continuoushase. The effect of transmembrane pressure and shear-stress onisperse-phase flux, droplet size and span was investigated anduccessfully modelled with Surface response methodology. Thestablished models were useful to understand the behaviour ofcross-flow membrane emulsification system equipped with dif-
erent inserts but also to optimise the process from the differentspects.
cknowledgements
This work was carried out within the frame of “Calabriaegion contract APQ OLIO” and the “Corvinus Visiting Scholar Pro-ram 2010”. This work was partially financed by the BKTE FundHungary). Acknowledgements also to TÁMOP-4.2.1/B-09/1/KMR-010-0005 and OTKA-68596 programme.
ppendix A.
In this work a conservative method was used to estimate thehear-stress in cases where the cross-section area was non-circularsmooth reducer and helix reducer). The calculation which isescribed below was developed from practical engineering aspectso give a useful stronghold for membrane scientists who are dealingith shear-stress handling.
Newton’s law of viscosity (4) is a constitutive equation. It is notfundamental law of nature but an approximation that holds inewtonian fluids.
f = � · A · ıvır
(4)
here Ff is the Frictional force expressed in Pa dimension.The shear stress between layers is proportional to the velocity
radient in the direction perpendicular to the layers in the fluidow (5).
= � · ıvır
(5)
The Pressure force (Fp expressed in Pa) can be calculated by mul-iplying the pressure-drop along the tube due to the friction andhe tube’s cross-section area (6).
p = p · Acrosssect (6)
n steady-state circumstances it was assumed that the pressure-rop along the membrane tube well approximates the shear-stress:
p = Ff (7)
e Science 371 (2011) 28–36
A.1. Case of the “smooth” reducer (Fig. 12)
In this setup the pressure force, the frictional force and the pres-sure drop is:
Fp = p · · (R2 − r2)
Ff = � · 2 · · (R · L + r · L) · ıvır
p = f · L
De· v2 · �
2
Fp = Ff
f · L
De· v2 · �
2· · (R2 − r2) = � · 2 · · (R · L + r · L) · ıv
ır
f
2 · (R − r)· v2 · �
2· · (R + r) · (R − r) = � · 2 · · (R + r) · ıv
ır
f · v2 · � = 8 · � · ıvır
= 8 · �
� = f · v2 · �
8
if
f = 64/Re and � = 16/Re (f = 4�)
then
� = � · v2 · �
2
where � = 16/Re and
Re = De · v · �
�
In this case it was found that the shear-stress in the pipe (or shell-side) can be calculated in the same way to the empty tube, butequivalent diameter must be used.
A.2. Case of the “helix” reducer (Fig. 13)
To describe the behaviour of the shear stress in the membranetube with helical insert, the same model (Eq. (2)) was applied, as inthe case of empty tube and smooth tube insert.
From the aspect of shear-stress in the helical system thecalculation of the helix surface was done using the geomet-rical data. The cross section of the spiral was rectangular:a × b = 5.8 × 1.6 mm, the length of the spiral was 27% longer than themembrane tube, z = c/H = 1.27 (Fig. 14a). The fluid flow’s Re num-ber and the shear stress were calculated according to the earliermethod.
The equivalent diameter, the pressure force, the pressure dropand the frictional force in the “helix” system:
De = 4 · A
C= 4 · R2 − a · b
2R + 2(a + b)
Fp = p · (R2 − a · b)
p = f · L
De· v2 · �
2= f
L
4 ·[(R2 − a · b)/(2R + 2(a + b))
] · v2�
2

A. Koris et al. / Journal of Membrane Science 371 (2011) 28–36 35
embrane with helix reducer installed inside.
F
F
F
F
f
f
�
�
w
k
a
�
(wfll
Nomenclature
R inner radius of the tube, mr external radius of reducer, mFp pressure force, PaFf frictional force, PaDe equivalent diameter, mL length, mp pressure drop along the tube (pin − pout), Paf, � different interpretations of the friction factor, f = 4�� density, kg/m3
� viscosity, Pa sn rev, 1/sRe Reynolds numberz the absolute length ratio of the promoter� shear-stress, Paıvır
velocity gradientv mean axial velocity, m/sa, b, c, H geometrical parameters of the helix promoter, mA cross-section area, m2
Fig. 13. Schematic figure of the tube m
p = fL [2R + 2(a + b)]
4(R2 − a · b)· v2�
2· (R2 − a · b)
p = fL(R + a + b)
2· v2�
2
f = � · [2 · · R · L + 2(a + b) · z · L] · ıvır
p = Ff
L(R + a + b)2
· v2�
2= � · [2 · · R · L + 2(a + b) · z · L] · ıv
ır
L(R + a + b)2
· v2�
2= 2 · L · �h · [ · R + (a + b) · z]
h = � · v2 · �
2· R · + a + b
[R · + z · (a + b)]
h = k · � · v2 · �
2
here
= R · + a + b
[R · + z · (a + b)]
nd
= 16/Re, Re = De · v · �
�
Remark: the helix indicates an additional rotation in the fluid,hich influences the velocity vectors, but does not influence theuid flow’s Reynolds number, calculated with the proper equiva-
ent diameter and linear velocity).
2rπ
H (pitch)
α
c
Fig. 14. Interpretation of the absolute length ratio (z).
K moistured perimeter, mk geometry dependent constant
References
[1] G.T. Vladisavljevic, S. Brösel, H. Schubert, Preparation of water-in-oil emul-sions using microporous polypropylene hollow fibres: conditions for producingsmall uniform droplets, Chemical Papers 54 (6a) (2000) 383–388.
[2] C. Charcosset, Preparation of emulsions and particles by membrane emulsifica-tion for the food processing industry, Journal of Food Engineering 92 (3 (June))(2009) 241–249.
[3] T. Nakashima, M. Shimizu, M. Kukizaki, Particle control of emulsion by mem-brane emulsification and its application, Advanced Drug Delivery Reviews 45(2000) 47–56.
[4] K. Kandori, K. Kishi, T. Ishikawa, Preparation of uniform silica hydrogel par-ticles by SPG filter emulsification method, Colloids Surface 62 (1992) 259–262.
[5] L. Giorno, E. Piacentini, R. Mazzei, E. Drioli, Membrane emulsification as a novelmethod to distribute phase-transfer biocatalysts at the oil/water interface inbioorganic reactions, Journal of Membrane Science 317 (1–2 (June)) (2008)19–25.
[6] R. Katoh, Y. Asano, A. Furuya, K. Sotoyama, M. Tomita, Preparation of food emul-sions using a membrane emulsification system, Journal of Membrane Science113 (1996) 131–135.
[7] T. Nakashima, M. Shimizu, Porous glass from calcium alumino boro-silicateglass, Ceramics 21 (1986) 408.
[8] G.T. Vladisavljevic, H. Schubert, Preparation and analysis of oil-in-water emul-sions with a narrow droplet size distribution using Shirasu-porous-glass (SPG)membranes, Desalination 144 (1–3 (September)) (2002) 167–172.
[9] G.T. Vladisavljevic, U. Lambrich, M. Nakajima, H. Schubert, Production of O/Wemulsions using SPG membranes, ceramic �-aluminium oxide membranes,microfluidizer and a silicon microchannel plate—a comparative study, Colloids

3 mbran
[
[
[
[
[
[
[
[
[
6 A. Koris et al. / Journal of Me
and Surfaces A: Physicochemical and Engineering Aspects 232 (2–3 (January))(2004) 199–207.
10] M. Yasuno, M. Nakajima, S. Iwamoto, T. Maruyama, S. Sugiura, I. Kobayashi, A.Shono, K. Satoh, Visualization and characterization of SPG membrane emulsi-fication, Journal of Membrane Science 210 (1 (December)) (2002) 29–37.
11] E. Egidi, G. Gasparini, R.G. Holdich, G.T. Vladisavljevic, S.R. Kosvintsev, Mem-brane emulsification using membranes of regular pore spacing: droplet sizeand uniformity in the presence of surface shear, Journal of Membrane Science323 (2 (October)) (2008) 414–420.
12] M.M. Dragosavac, M.N. Sovilj, S.R. Kosvintsev, R.G. Holdich, G.T. Vladisavljevic,Controlled production of oil-in-water emulsions containing unrefined pump-kin seed oil using stirred cell membrane emulsification, Journal of MembraneScience 322 (1 (September)) (2008) 178–188.
13] L. Giorno, R. Mazzei, M. Oriolo, G. De Luca, M. Davoli, E. Drioli, Effects of organic
solvents on ultrafiltration polyamide membranes. For the preparation of oil-in-water emulsions, Journal of Colloid and Interface Science 287 (2005) 612–623.14] M. Kukizaki, Shirasu porous glass (SPG) membrane emulsification in theabsence of shear flow at the membrane surface: influence of surfactant typeand concentration, viscosities of dispersed and continuous phases, and trans-membrane pressure, Journal of Membrane Science 327 (2009) 234–243.
[
[
e Science 371 (2011) 28–36
15] J. Zhu, D. Barrow, Analysis of droplet size during crossflow membraneemulsification using stationary and vibrating micromachined silicon nitridemembranes, Journal of Membrane Science 261 (1–2 (September)) (2005)136–144.
16] J.D.H. Kelder, J.J.M. Janssen, R.M. Boom, Membrane emulsification with vibrat-ing membranes: a numerical study, Journal of Membrane Science 304 (1–2(November)) (2007) 50–59.
17] T. Nakashima, M. Shimizu, M. Kukizaki, Membrane Emulsification, OperationManual, lndustrial Research Institute of Miyazaki Prefecture, Miyazaki, Japan,1991.
18] I. Xiarchos, A. Jaworska, G. Zakrzewska-Trznadel, Response surface method-ology for the modelling of copper removal from aqueous solutions usingmicellar-enhanced ultrafiltration, Journal of Membrane Science 321 (2(August)) (2008) 222–231.
19] A. Jokic, Z. Zavargo, Z. Seres, M. Tekic, The effect of turbulence promoter oncross-flow microfiltration of yeast suspensions: a response surface methodol-ogy approach, Journal of Membrane Science 350 (1–2 (March)) (2010) 269–278.
20] NIST/SEMATECH e-Handbook of Statistical Methods, 2010. Available from:http://www.itl.nist.gov/div898/handbook/pri/section3/pri339.htm.
Recommended


