9-1
IRON & STEEL AND SCRAP
Indian Minerals Yearbook 2014
(Part- II : Metals & Alloys)
53rd
Edition
IRON & STEEL AND SCRAP
(ADVANCE RELEASE)
GOVERNMENT OF INDIA MINISTRY OF MINES
INDIAN BUREAU OF MINES
Indira Bhavan, Civil Lines,
NAGPUR – 440 001
PHONE/FAX NO. (0712) 2565471
PBX : (0712) 2562649, 2560544, 2560648
E-MAIL : [email protected] Website: www.ibm.gov.in
November, 2015
9-2
IRON & STEEL AND SCRAP
9 Iron & Steel and Scrap
S teel is decidedly the vital component of a
count ry ' s economy and i s cons idered
amongst the driving force of modernisation. The
level of per capita consumption of steel is treated
as one of the important indicators of socio-
economic development and living standards in
any country. Steel continues to be the foremost
engineer ing mater ia l , environment-fr iendly
and recyclable.
The finished steel production in India has
grown from a mere 1.1 million tonnes in 1951 to
87.68 million tonnes in 2013-14. The growth in the
s tee l sec tor in the ea r ly decades a f te r
independence was mainly in the public sector
uni t s . However, fo l lowing the adopt ion of
new economic po l icy and subsequent
deregulation and decontrol of Indian Iron &
Steel Sector, the 1990s witnessed accelerated
growth in the private sector, catapulting its
share of finished steel production from 45% in
1992-93 to 84.7% in 2013-14.
Steel exports from India began in 1964. Exports
in the first five years were mainly the result of
low demand in the domestic Iron and Steel market.
Exports subsequently declined due to revival of
domestic demand. India once again started
exporting steel in 1975 only to witness slump due
to rising domestic demand. Post liberalisation, a
rejuvenation in the steel sector resulted in large-
scale exports of iron and steel. In 1991-92, the
main producers exported 3.87 lakh tonnes iron &
steel as against 11.96 million tonnes in 2013-14,
including finished steel exports of 5.12 million
tonnes. Though the country's production of iron
& steel is sufficient to meet the domestic demand,
it imports mainly finished/semi- finished steel and
iron & steel (scrap) to meet requirement and supply
of essential grades.
Liberalisation of the Indian Steel Sector
The Government's new economic policies
have opened up opportunities for expansion of
the Steel Industry. With a view to accelerating
growth in the steel sector, the Government since
1991 has been initiating and implementing a
number of policy measures. These measures have
impacted the Indian steel sector to achieve a
positive growth.
NATIONAL STEEL POLICY-2005The Nat iona l S tee l Po l icy (NSP) was
announced in 2005 and is presently under review
and Ministry of Steel has formulated a Committee
in May, 2012 to review the existing National Steel
Policy 2005.
Further, the new National Steel Policy-2012 is
being framed and some of the major objectives of
the draft National Steel Policy 2012 are enumerated
below:
a) To attract investments in Indian steel sector
from both domestic and foreign sources and
facili tate speedy implementation of
investment intentions on board so far, so
as to attain crude steel capacity level of
300 million tonnes by 2025-26 to meet
the domestic demand fully.
b) To ensure easy availability of vital inputs
and necessary infrastructure to achieve a
projected production level of 275 million
tonnes by 2025-26.
c) To provide greater focus on Research and
Development (R&D) for developing
indigenous technologies, especially for
finding solutions for optimum utilisation
of indigenous resources and mitigating
9-3
IRON & STEEL AND SCRAP
the concerns of environment and climate
change.
d) To develop indigenous capabilities of
design, engineering and manufacturing of
critical capital equipment required for
steel production.
e) To encourage production and consump-
tion of value added steel by providing
necessary focus on avai labi l i ty and
product development, especial ly for
(a) meeting the special requirements of
rura l Ind ia ; b ) mee t ing the spec ia l
requirement of auto, power, construction
and shipping sectors; and c) producing
lighter but stronger steel which helps in
achieving higher energy efficiency in end
applications and also helps in mitigating
the concerns on environment, climate
change and human health.
f) To foster competition at the market place,
discourage cartelisation and encourage
produc t ion of qua l i ty s tee l fo r
maximisation of consumer welfare and for
protecting the interests of common man
and the p roducers aga ins t unfa i r
prac t ices of domes t ic and overseas
competitors.
g) To ensure sustainable development of the
indus t ry wi th min imum poss ib le
displacement of local people and loss to
their l ivel ihoods and with minimum
damage to the environment by adopting
best practices in the production processes
and ensuring adoption of environment
friendly practices by the investors.
h) To become global ly compet i t ive by
achieving efficiency levels at par with the
global standards, especially in areas such
as energy consumpt ion , mate r ia l
e ff ic iency, qua l i ty o f s tee l , wa te r
consumption, productivity of major iron/
steel making equipment, pollution levels
and CO2
emissions.
Steel Sports Policy – July, 2014
The ‘Steel Sports Policy’ aims at consolidating
the progress made so far, formulating new initiatives
and for making periodic adjustments that shall enable
the Ministry of Steel and its ten Public Sector
Undertakings – Steel Authority of India Limited (SAIL),
NMDC Limited, Rashtriya Ispat Nigam Limited (RINL),
MOIL Limited, MSTC Limited, Ferro Scrap Nigam
Limited (FSNL), Hindustan Steelworks Construction
Limited (HSCL), MECON Limited, KIOCL Limited and
the Bird Group of Companies to promote sports with
resolve and vigour, as well as provide excellent
opportunities to promising sportspersons.
The objectives of the Policy are:
i. Promoting excellence in sports and allied activities
ii. Encouraging promising sportspersons
iii. Promoting existing performers
iv. Setting up and managing sports complexes and
infrastructure by the Steel PSUs, efficiently and
effectively at different locations
v. Encouraging sportspersons to ensure increased
participation in national and international
championships
vi. Recognising talent in sports and rewarding young
women and men, who have achieved excellence in
sports as also their coaches/mentors who have been
9-4
IRON & STEEL AND SCRAP
instrumental in grooming such sportspersons and to
felicitate them appropriately
vii. Having a focus on encouraging sports that do not
fall in the category of conventional sports
viii. Be a part of the endeavour to raise national and
international level teams in identified games through
scientific coaching, providing state of the art equipment
and infrastructure
ix. Promoting rural sports
x. Providing opportunity to employees of the Ministry
of Steel and the Steel PSUs / organisations and their
families to participate in games and sports to promote
good health, physical fitness and sports consciousness
xi. To generate corporate goodwill and brand equity
by sponsoring / co-sponsoring various sports / games
events at State, National and International level
STRUCTURE AND ROLE OFINDIAN STEEL INDUSTRY
Ind ia has r i sen to the 4 th pos i t ion as
largest crude steel producing country in the
world in 2013-14. The Indian Steel Industry
comprises integrated steel plants in the primary
sector using BF-BOF route of i ron & steel
production. In the primary sector, there are 13
integrated steel plants in the public and private
sectors. In 2013-14, the reported production of hot
metal was 14.45 million tonnes; crude steel 13.6
million tonnes; saleable steel 12.9 million tonnes
respectively by SAIL, a Public Sector Company.
The secondary sector constitutes Electric Arc
Furnace/Induction Furnace, pig iron/sponge iron
units, re-rolling units, HR units, CR units,
galvanised/colour coated units, tin plate units,
wire-drawing units, etc. for producing either semi-
finished or finished steel.
Traditionally, Indian steel industry was
classified into Main Producers and Secondary
Producers. However, with the coming up of
larger capacity steel making units of different
process routes , the c lass i f ica t ion has been
character ised as Main Producers & Other
Producers. Other Producers comprise Major
Producers in Private Sector namely, Tata Steel,
Essar Steel, JSW Steel, Jindal Steel & Power Ltd,
Bhushan Steel Ltd and Bhushan Power & Steel
Ltd as well as large number of Mini Steel Plants
based on Electric Furnaces & Energy Optimising
Furnaces (EOF). Besides the steel producing
units, there are a large number of Sponge Iron
Plants, Mini Blast Furnace units, Hot & Cold
Rolling Mills & Galvanising/Colour Coating units
which are spread across the country. India's
crude steel capacity and production in 2013-14
was 99.57 million tonnes, and 81.54 million tonnes
respectively while the capacity utilisation was
82%.
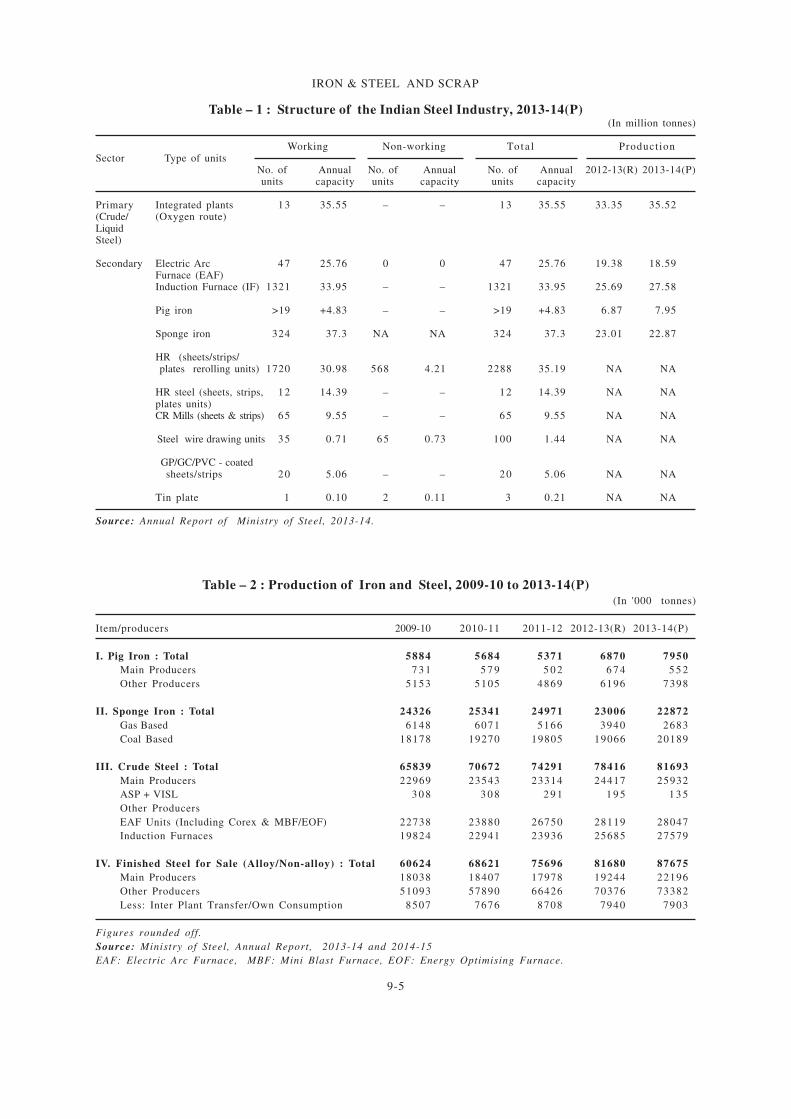
The structure of the Indian Steel Industry in
2013-14 is given in Table-1. Production of
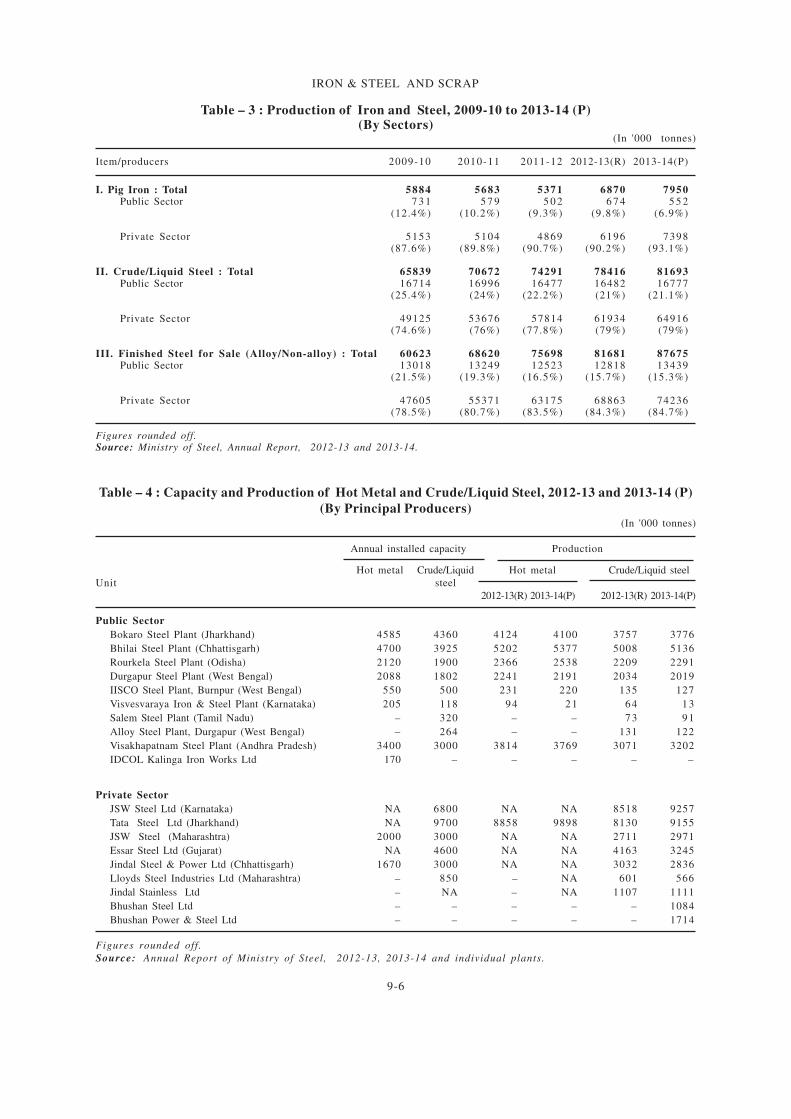
i ron & steel by main producers and others
dur ing 2009-10 to 2013-14 is furnished in
Table-2 and by public/private sector in Table-3.
The details on plant-wise capacity and production
of hot metal and crude/liquid steel are given in
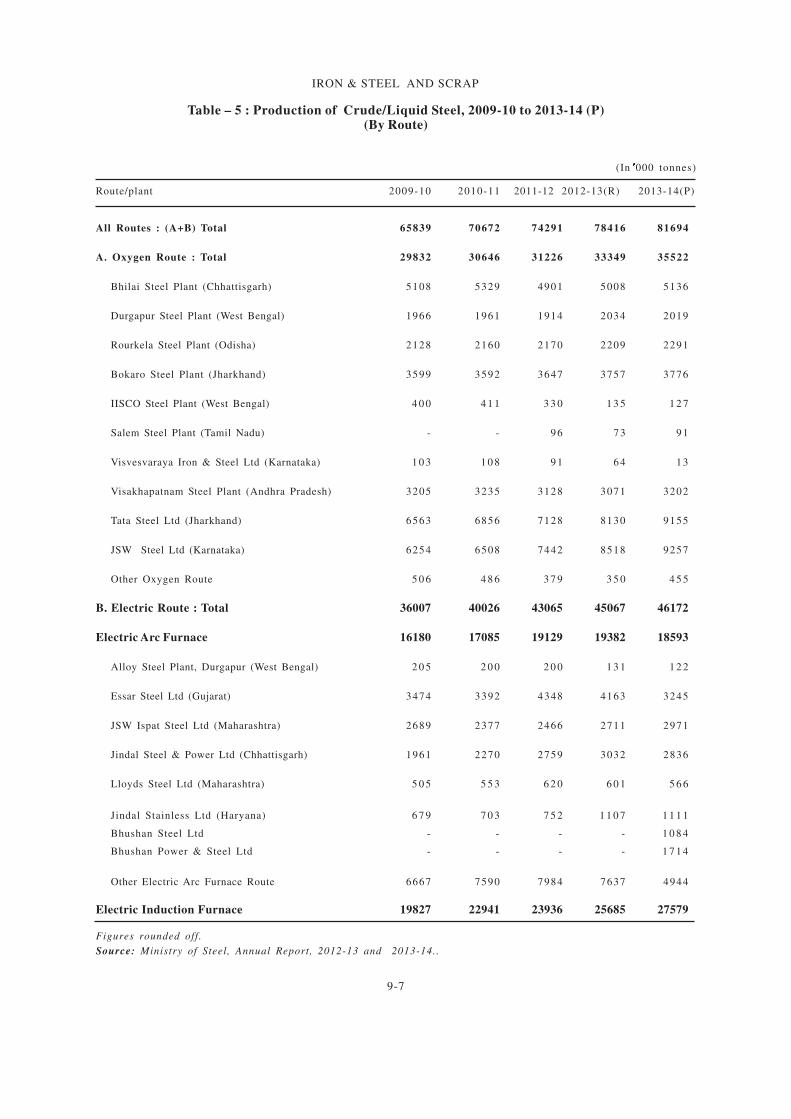
Table-4. Table-5 elucidates the production of
crude/liquid steel by BOF and EAF/IF routes.
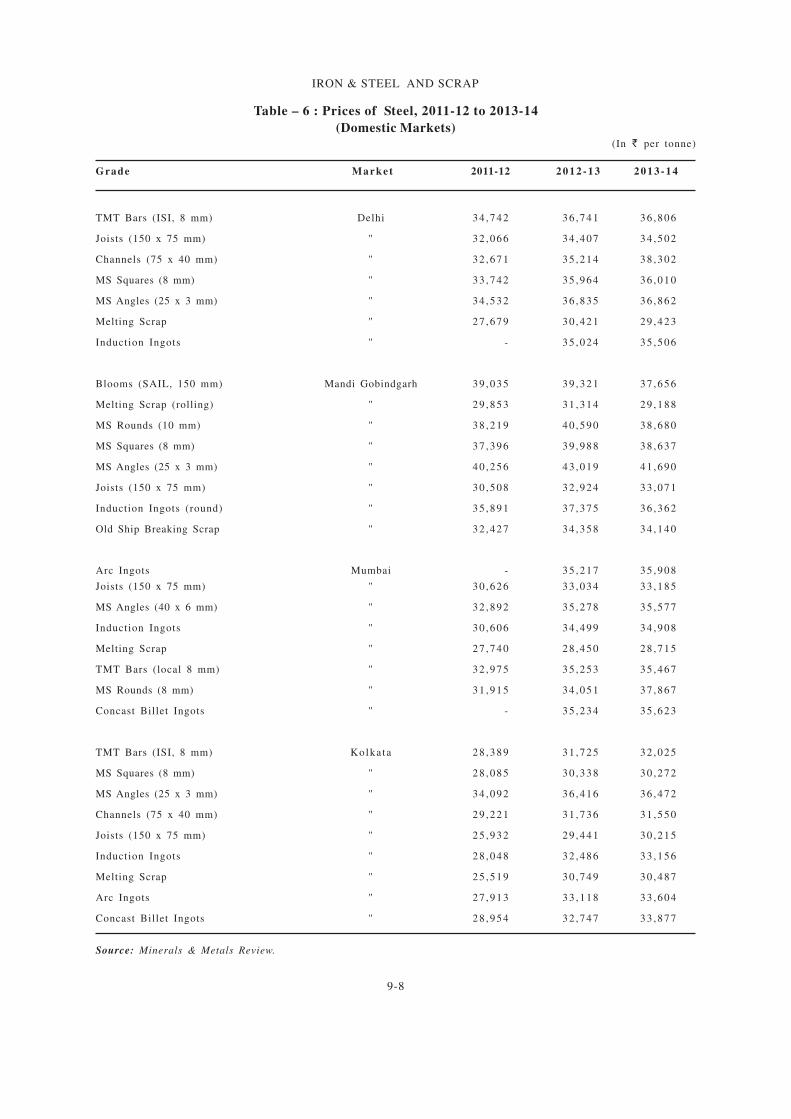
Prices of steel are provided in Table-6.
9-5
IRON & STEEL AND SCRAP
Table – 1 : Structure of the Indian Steel Industry, 2013-14(P)(In million tonnes)
Working Non-working To ta l ProductionSector Type of units
No. of Annual No. of Annual No. of Annual 2012-13(R) 2013-14(P)units capacity units capacity units capacity
Primary Integrated plants 13 35.55 – – 13 35.55 33.35 35.52(Crude/ (Oxygen route)LiquidSteel)
Secondary Electric Arc 47 25.76 0 0 47 25.76 19.38 18.59Furnace (EAF)Induction Furnace (IF) 1321 33.95 – – 1321 33.95 25.69 27.58
Pig iron >19 +4.83 – – >19 +4.83 6.87 7.95
Sponge iron 324 37.3 NA NA 324 37.3 23.01 22.87
HR (sheets/strips/ plates rerolling units) 1720 30.98 568 4.21 2288 35.19 NA NA
HR steel (sheets, strips, 12 14.39 – – 12 14.39 NA NAplates units)CR Mills (sheets & strips) 65 9.55 – – 65 9.55 NA NA
Steel wire drawing units 35 0.71 65 0.73 100 1.44 NA NA
GP/GC/PVC - coatedsheets/strips 20 5.06 – – 20 5.06 NA NA
Tin plate 1 0.10 2 0.11 3 0.21 NA NA
Source: Annual Report of Ministry of Steel, 2013-14.
Table – 2 : Production of Iron and Steel, 2009-10 to 2013-14(P)
(In '000 tonnes)
Item/producers 2009-10 2010-11 2011-12 2012-13(R) 2013-14(P)
I. Pig Iron : Total 5884 5684 5371 6870 7950
Main Producers 7 3 1 5 7 9 5 0 2 6 7 4 5 5 2
Other Producers 5153 5105 4869 6196 7398
II. Sponge Iron : Total 24326 25341 24971 23006 22872
Gas Based 6148 6071 5166 3940 2683
Coal Based 18178 19270 19805 19066 20189
III. Crude Steel : Total 65839 70672 74291 78416 81693
Main Producers 22969 23543 23314 24417 25932
ASP + VISL 3 0 8 3 0 8 2 9 1 1 9 5 1 3 5
Other Producers
EAF Units (Including Corex & MBF/EOF) 22738 23880 26750 28119 28047
Induction Furnaces 19824 22941 23936 25685 27579
IV. Finished Steel for Sale (Alloy/Non-alloy) : Total 60624 68621 75696 81680 87675
Main Producers 18038 18407 17978 19244 22196
Other Producers 51093 57890 66426 70376 73382
Less: Inter Plant Transfer/Own Consumption 8507 7676 8708 7940 7903
Figures rounded off.
Source: Ministry of Steel, Annual Report, 2013-14 and 2014-15
EAF: Electric Arc Furnace, MBF: Mini Blast Furnace, EOF: Energy Optimising Furnace.
9-6
IRON & STEEL AND SCRAP
Table – 3 : Production of Iron and Steel, 2009-10 to 2013-14 (P)(By Sectors)
(In '000 tonnes)
Item/producers 2009-10 2010-11 2011-12 2012-13(R) 2013-14(P)
I. Pig Iron : Total 5884 5683 5371 6870 7950Public Sector 7 3 1 5 7 9 5 0 2 6 7 4 5 5 2
(12.4%) (10.2%) (9.3%) (9.8%) (6.9%)
Private Sector 5153 5104 4869 6196 7398(87.6%) (89.8%) (90.7%) (90.2%) (93.1%)
II. Crude/Liquid Steel : Total 65839 70672 74291 78416 81693Public Sector 16714 16996 16477 16482 16777
(25.4%) (24%) (22.2%) (21%) (21.1%)
Private Sector 49125 53676 57814 61934 64916(74.6%) (76%) (77.8%) (79%) (79%)
III. Finished Steel for Sale (Alloy/Non-alloy) : Total 60623 68620 75698 81681 87675Public Sector 13018 13249 12523 12818 13439
(21.5%) (19.3%) (16.5%) (15.7%) (15.3%)
Private Sector 47605 55371 63175 68863 74236(78.5%) (80.7%) (83.5%) (84.3%) (84.7%)
Figures rounded off.Source: Ministry of Steel, Annual Report, 2012-13 and 2013-14.
Table – 4 : Capacity and Production of Hot Metal and Crude/Liquid Steel, 2012-13 and 2013-14 (P)
(By Principal Producers)(In '000 tonnes)
Annual installed capacity Production
Hot metal Crude/Liquid Hot metal Crude/Liquid steel
Unit steel
2012-13(R) 2013-14(P) 2012-13(R) 2013-14(P)
Public Sector
Bokaro Steel Plant (Jharkhand) 4585 4360 4124 4100 3757 3776
Bhilai Steel Plant (Chhattisgarh) 4700 3925 5202 5377 5008 5136
Rourkela Steel Plant (Odisha) 2120 1900 2366 2538 2209 2291
Durgapur Steel Plant (West Bengal) 2088 1802 2241 2191 2034 2019
IISCO Steel Plant, Burnpur (West Bengal) 550 500 231 220 135 127
Visvesvaraya Iron & Steel Plant (Karnataka) 205 118 94 21 64 13
Salem Steel Plant (Tamil Nadu) – 320 – – 73 91
Alloy Steel Plant, Durgapur (West Bengal) – 264 – – 131 122
Visakhapatnam Steel Plant (Andhra Pradesh) 3400 3000 3814 3769 3071 3202
IDCOL Kalinga Iron Works Ltd 170 – – – – –
Private Sector
JSW Steel Ltd (Karnataka) NA 6800 NA NA 8518 9257
Tata Steel Ltd (Jharkhand) NA 9700 8858 9898 8130 9155
JSW Steel (Maharashtra) 2000 3000 NA NA 2711 2971
Essar Steel Ltd (Gujarat) NA 4600 NA NA 4163 3245
Jindal Steel & Power Ltd (Chhattisgarh) 1670 3000 NA NA 3032 2836
Lloyds Steel Industries Ltd (Maharashtra) – 850 – NA 601 566
Jindal Stainless Ltd – NA – NA 1107 1111
Bhushan Steel Ltd – – – – – 1084
Bhushan Power & Steel Ltd – – – – – 1714
Figures rounded off.
Source: Annual Report of Ministry of Steel, 2012-13, 2013-14 and individual plants.
9-7
IRON & STEEL AND SCRAP
Table – 5 : Production of Crude/Liquid Steel, 2009-10 to 2013-14 (P)(By Route)
(In ’’’’’000 tonnes)
Route/plant 2009-10 2010-11 2011-12 2012-13(R) 2013-14(P)
All Routes : (A+B) Total 65839 70672 74291 78416 81694
A. Oxygen Route : Total 29832 30646 31226 33349 35522
Bhilai Steel Plant (Chhattisgarh) 5108 5329 4901 5008 5136
Durgapur Steel Plant (West Bengal) 1966 1961 1914 2034 2019
Rourkela Steel Plant (Odisha) 2128 2160 2170 2209 2291
Bokaro Steel Plant (Jharkhand) 3599 3592 3647 3757 3776
IISCO Steel Plant (West Bengal) 4 0 0 4 1 1 3 3 0 1 3 5 1 2 7
Salem Steel Plant (Tamil Nadu) - - 96 73 91
Visvesvaraya Iron & Steel Ltd (Karnataka) 1 0 3 1 0 8 91 64 13
Visakhapatnam Steel Plant (Andhra Pradesh) 3205 3235 3128 3071 3202
Tata Steel Ltd (Jharkhand) 6563 6856 7128 8130 9155
JSW Steel Ltd (Karnataka) 6254 6508 7442 8518 9257
Other Oxygen Route 5 0 6 4 8 6 3 7 9 3 5 0 4 5 5
B. Electric Route : Total 36007 40026 43065 45067 46172
Electric Arc Furnace 16180 17085 19129 19382 18593
Alloy Steel Plant, Durgapur (West Bengal) 2 0 5 2 0 0 2 0 0 1 3 1 1 2 2
Essar Steel Ltd (Gujarat) 3474 3392 4348 4163 3245
JSW Ispat Steel Ltd (Maharashtra) 2689 2377 2466 2711 2971
Jindal Steel & Power Ltd (Chhattisgarh) 1961 2270 2759 3032 2836
Lloyds Steel Ltd (Maharashtra) 5 0 5 5 5 3 6 2 0 6 0 1 5 6 6
Jindal Stainless Ltd (Haryana) 6 7 9 7 0 3 7 5 2 1 1 0 7 1 1 1 1
Bhushan Steel Ltd - - - - 1 0 8 4
Bhushan Power & Steel Ltd - - - - 1 7 1 4
Other Electric Arc Furnace Route 6667 7590 7984 7637 4944
Electric Induction Furnace 19827 22941 23936 25685 27579
Figures rounded off.
Source: Ministry of Steel, Annual Report, 2012-13 and 2013-14..
9-8
IRON & STEEL AND SCRAP
Table – 6 : Prices of Steel, 2011-12 to 2013-14
(Domestic Markets)
(In L per tonne)
Grade Market 2011-12 2 0 1 2 - 1 3 2 0 1 3 - 1 4
TMT Bars (ISI, 8 mm) Delhi 34 ,742 36 ,741 36 ,806
Joists (150 x 75 mm) " 32 ,066 34 ,407 34 ,502
Channels (75 x 40 mm) " 32 ,671 35 ,214 38 ,302
MS Squares (8 mm) " 33 ,742 35 ,964 36 ,010
MS Angles (25 x 3 mm) " 34 ,532 36 ,835 36 ,862
Melting Scrap " 27 ,679 30 ,421 29 ,423
Induction Ingots " - 35 ,024 35 ,506
Blooms (SAIL, 150 mm) Mandi Gobindgarh 39 ,035 39 ,321 37 ,656
Melting Scrap (rolling) " 29 ,853 31 ,314 29 ,188
MS Rounds (10 mm) " 38 ,219 40 ,590 38 ,680
MS Squares (8 mm) " 37 ,396 39 ,988 38 ,637
MS Angles (25 x 3 mm) " 40 ,256 43 ,019 41 ,690
Joists (150 x 75 mm) " 30 ,508 32 ,924 33 ,071
Induction Ingots (round) " 35 ,891 37 ,375 36 ,362
Old Ship Breaking Scrap " 32 ,427 34 ,358 34 ,140
Arc Ingots Mumbai - 35 ,217 35 ,908
Joists (150 x 75 mm) " 30 ,626 33 ,034 33 ,185
MS Angles (40 x 6 mm) " 32 ,892 35 ,278 35 ,577
Induction Ingots " 30 ,606 34 ,499 34 ,908
Melting Scrap " 27 ,740 28 ,450 28 ,715
TMT Bars (local 8 mm) " 32 ,975 35 ,253 35 ,467
MS Rounds (8 mm) " 31 ,915 34 ,051 37 ,867
Concast Billet Ingots " - 35 ,234 35 ,623
TMT Bars (ISI, 8 mm) Kolka ta 28 ,389 31 ,725 32 ,025
MS Squares (8 mm) " 28 ,085 30 ,338 30 ,272
MS Angles (25 x 3 mm) " 34 ,092 36 ,416 36 ,472
Channels (75 x 40 mm) " 29 ,221 31 ,736 31 ,550
Joists (150 x 75 mm) " 25 ,932 29 ,441 30 ,215
Induction Ingots " 28 ,048 32 ,486 33 ,156
Melting Scrap " 25 ,519 30 ,749 30 ,487
Arc Ingots " 27 ,913 33 ,118 33 ,604
Concast Billet Ingots " 28 ,954 32 ,747 33 ,877
Source: Minerals & Metals Review.
9-9
IRON & STEEL AND SCRAP
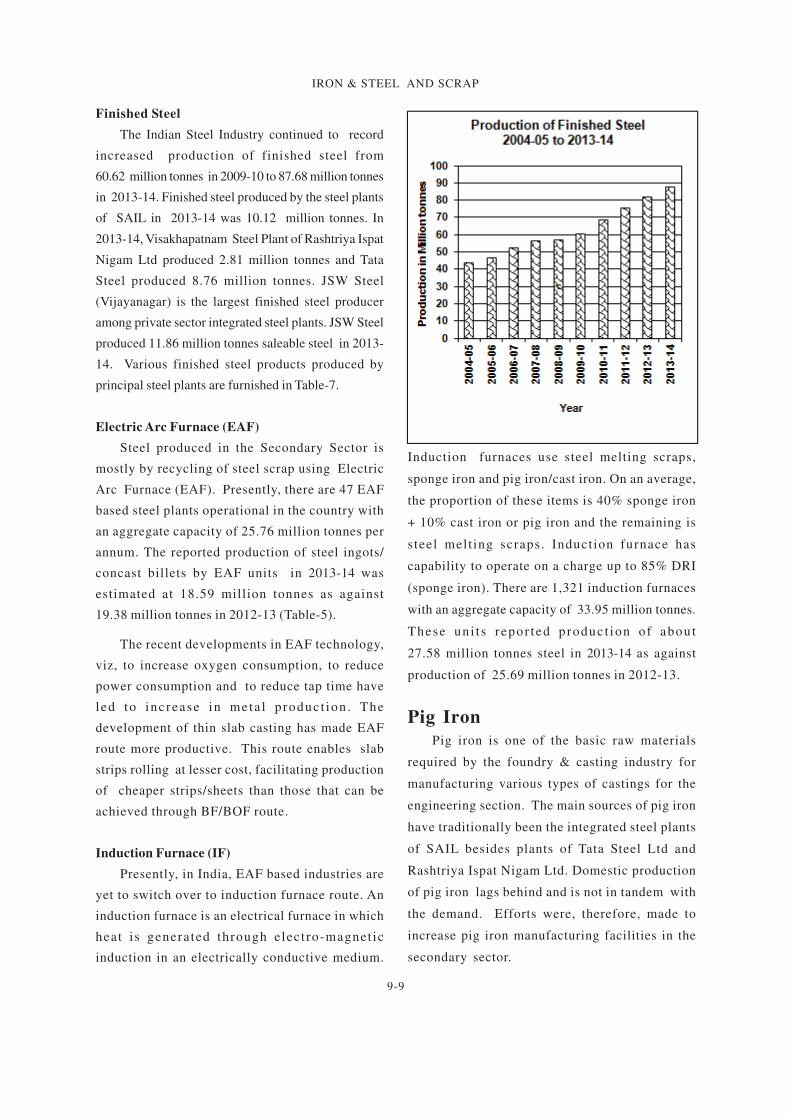
Finished Steel
The Indian Steel Industry continued to record
increased production of finished steel from
60.62 million tonnes in 2009-10 to 87.68 million tonnes
in 2013-14. Finished steel produced by the steel plants
of SAIL in 2013-14 was 10.12 million tonnes. In
2013-14, Visakhapatnam Steel Plant of Rashtriya Ispat
Nigam Ltd produced 2.81 million tonnes and Tata
Steel produced 8.76 million tonnes. JSW Steel
(Vijayanagar) is the largest finished steel producer
among private sector integrated steel plants. JSW Steel
produced 11.86 million tonnes saleable steel in 2013-
14. Various finished steel products produced by
principal steel plants are furnished in Table-7.
Electric Arc Furnace (EAF)
Steel produced in the Secondary Sector is
mostly by recycling of steel scrap using Electric
Arc Furnace (EAF). Presently, there are 47 EAF
based steel plants operational in the country with
an aggregate capacity of 25.76 million tonnes per
annum. The reported production of steel ingots/
concast billets by EAF units in 2013-14 was
estimated at 18.59 million tonnes as against
19.38 million tonnes in 2012-13 (Table-5).
The recent developments in EAF technology,
viz, to increase oxygen consumption, to reduce
power consumption and to reduce tap time have
led to increase in meta l p roduc t ion . The
development of thin slab casting has made EAF
route more productive. This route enables slab
strips rolling at lesser cost, facilitating production
of cheaper strips/sheets than those that can be
achieved through BF/BOF route.
Induction Furnace (IF)
Presently, in India, EAF based industries are
yet to switch over to induction furnace route. An
induction furnace is an electrical furnace in which
heat is generated through electro-magnet ic
induction in an electrically conductive medium.
Induction furnaces use steel melting scraps,
sponge iron and pig iron/cast iron. On an average,
the proportion of these items is 40% sponge iron
+ 10% cast iron or pig iron and the remaining is
steel melt ing scraps. Induction furnace has
capability to operate on a charge up to 85% DRI
(sponge iron). There are 1,321 induction furnaces
with an aggregate capacity of 33.95 million tonnes.
These un i t s repor ted produc t ion of about
27.58 million tonnes steel in 2013-14 as against
production of 25.69 million tonnes in 2012-13.
Pig Iron
Pig iron is one of the basic raw materials
required by the foundry & casting industry for
manufacturing various types of castings for the
engineering section. The main sources of pig iron
have traditionally been the integrated steel plants
of SAIL besides plants of Tata Steel Ltd and
Rashtriya Ispat Nigam Ltd. Domestic production
of pig iron lags behind and is not in tandem with
the demand. Efforts were, therefore, made to
increase pig iron manufacturing facilities in the
secondary sector.
9-10
IRON & STEEL AND SCRAP
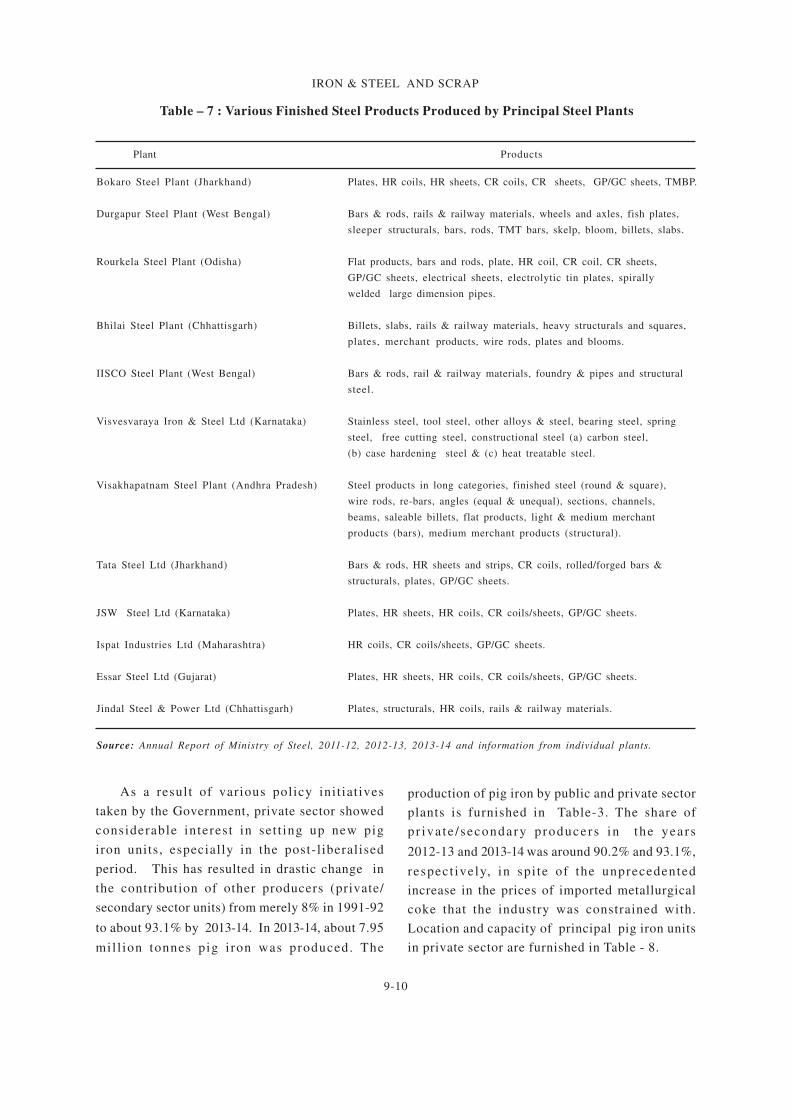
Table – 7 : Various Finished Steel Products Produced by Principal Steel Plants
Plant Products
Bokaro Steel Plant (Jharkhand) Plates, HR coils, HR sheets, CR coils, CR sheets, GP/GC sheets, TMBP.
Durgapur Steel Plant (West Bengal) Bars & rods, rails & railway materials, wheels and axles, fish plates,
sleeper structurals, bars, rods, TMT bars, skelp, bloom, billets, slabs.
Rourkela Steel Plant (Odisha) Flat products, bars and rods, plate, HR coil, CR coil, CR sheets,
GP/GC sheets, electrical sheets, electrolytic tin plates, spirally
welded large dimension pipes.
Bhilai Steel Plant (Chhattisgarh) Billets, slabs, rails & railway materials, heavy structurals and squares,
plates, merchant products, wire rods, plates and blooms.
IISCO Steel Plant (West Bengal) Bars & rods, rail & railway materials, foundry & pipes and structural
steel.
Visvesvaraya Iron & Steel Ltd (Karnataka) Stainless steel, tool steel, other alloys & steel, bearing steel, spring
steel, free cutting steel, constructional steel (a) carbon steel,
(b) case hardening steel & (c) heat treatable steel.
Visakhapatnam Steel Plant (Andhra Pradesh) Steel products in long categories, finished steel (round & square),
wire rods, re-bars, angles (equal & unequal), sections, channels,
beams, saleable billets, flat products, light & medium merchant
products (bars), medium merchant products (structural).
Tata Steel Ltd (Jharkhand) Bars & rods, HR sheets and strips, CR coils, rolled/forged bars &
structurals, plates, GP/GC sheets.
JSW Steel Ltd (Karnataka) Plates, HR sheets, HR coils, CR coils/sheets, GP/GC sheets.
Ispat Industries Ltd (Maharashtra) HR coils, CR coils/sheets, GP/GC sheets.
Essar Steel Ltd (Gujarat) Plates, HR sheets, HR coils, CR coils/sheets, GP/GC sheets.
Jindal Steel & Power Ltd (Chhattisgarh) Plates, structurals, HR coils, rails & railway materials.
Source: Annual Report of Ministry of Steel, 2011-12, 2012-13, 2013-14 and information from individual plants.
As a result of various policy init iatives
taken by the Government, private sector showed
considerable interest in set t ing up new pig
iron units, especially in the post-liberalised
period. This has resulted in drastic change in
the contribution of other producers (private/
secondary sector units) from merely 8% in 1991-92
to about 93.1% by 2013-14. In 2013-14, about 7.95
mil l ion tonnes pig i ron was produced. The
production of pig iron by public and private sector
plants is furnished in Table-3. The share of
pr iva te / secondary producers in the years
2012-13 and 2013-14 was around 90.2% and 93.1%,
respect ively, in spi te of the unprecedented
increase in the prices of imported metallurgical
coke that the industry was constrained with.
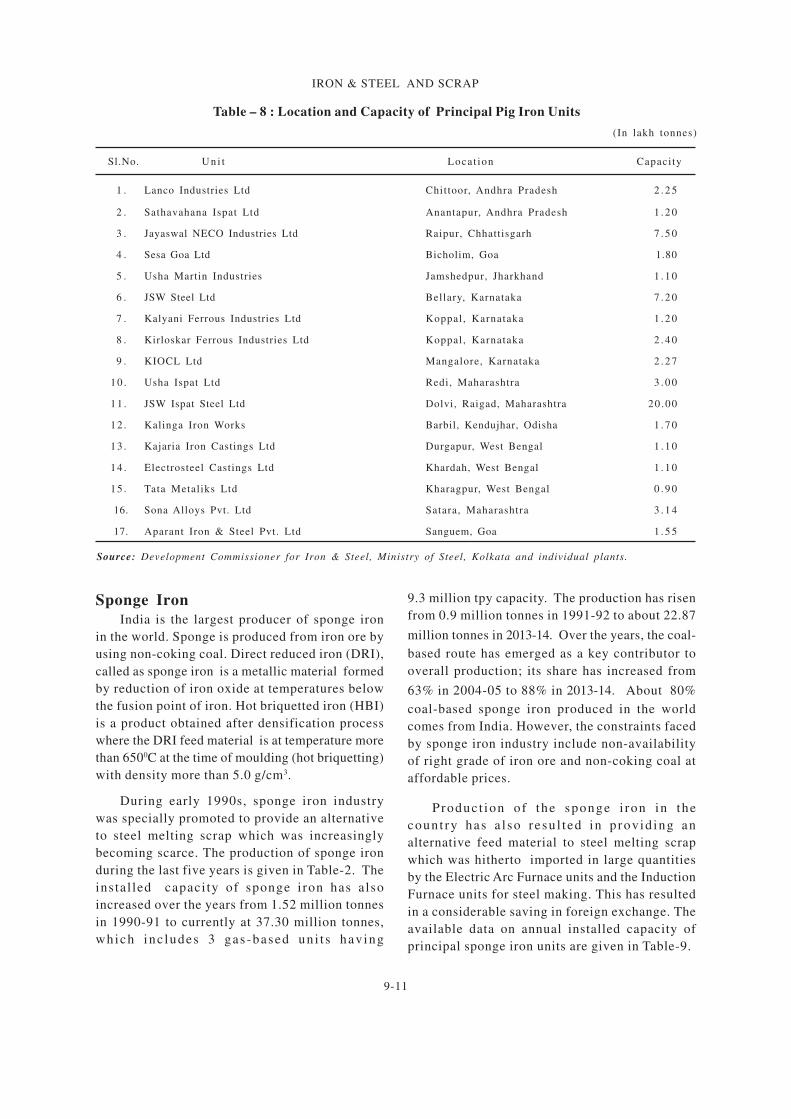
Location and capacity of principal pig iron units
in private sector are furnished in Table - 8.
9-11
IRON & STEEL AND SCRAP
Table – 8 : Location and Capacity of Principal Pig Iron Units
(In lakh tonnes)
Sl.No. U n i t Locat ion Capacity
1 . Lanco Industries Ltd Chittoor, Andhra Pradesh 2 . 2 5
2 . Sathavahana Ispat Ltd Anantapur, Andhra Pradesh 1 . 2 0
3 . Jayaswal NECO Industries Ltd Raipur, Chhattisgarh 7 . 5 0
4 . Sesa Goa Ltd Bicholim, Goa 1.80
5 . Usha Martin Industries Jamshedpur, Jharkhand 1 . 1 0
6 . JSW Steel Ltd Bellary, Karnataka 7 . 2 0
7 . Kalyani Ferrous Industries Ltd Koppal, Karnataka 1 . 2 0
8 . Kirloskar Ferrous Industries Ltd Koppal, Karnataka 2 . 4 0
9 . KIOCL Ltd Mangalore, Karnataka 2 . 2 7
10 . Usha Ispat Ltd Redi, Maharashtra 3 . 0 0
11 . JSW Ispat Steel Ltd Dolvi, Raigad, Maharashtra 20 .00
12 . Kalinga Iron Works Barbil, Kendujhar, Odisha 1 . 7 0
13 . Kajaria Iron Castings Ltd Durgapur, West Bengal 1 . 1 0
14 . Electrosteel Castings Ltd Khardah, West Bengal 1 . 1 0
15 . Tata Metaliks Ltd Kharagpur, West Bengal 0 . 9 0
16. Sona Alloys Pvt. Ltd Satara, Maharashtra 3 . 1 4
17. Aparant Iron & Steel Pvt. Ltd Sanguem, Goa 1 . 5 5
Source: Development Commissioner for Iron & Steel, Ministry of Steel, Kolkata and individual plants.
Sponge Iron
India is the largest producer of sponge iron
in the world. Sponge is produced from iron ore by
using non-coking coal. Direct reduced iron (DRI),
called as sponge iron is a metallic material formed
by reduction of iron oxide at temperatures below
the fusion point of iron. Hot briquetted iron (HBI)
is a product obtained after densification process
where the DRI feed material is at temperature more
than 6500C at the time of moulding (hot briquetting)
with density more than 5.0 g/cm3.
During early 1990s, sponge iron industry
was specially promoted to provide an alternative
to steel melting scrap which was increasingly
becoming scarce. The production of sponge iron
during the last five years is given in Table-2. The
instal led capaci ty of sponge iron has also
increased over the years from 1.52 million tonnes
in 1990-91 to currently at 37.30 million tonnes,
which inc ludes 3 gas -based un i t s hav ing
9.3 million tpy capacity. The production has risen
from 0.9 million tonnes in 1991-92 to about 22.87
million tonnes in 2013-14. Over the years, the coal-
based route has emerged as a key contributor to
overall production; its share has increased from
63% in 2004-05 to 88% in 2013-14. About 80%
coal-based sponge iron produced in the world
comes from India. However, the constraints faced
by sponge iron industry include non-availability
of right grade of iron ore and non-coking coal at
affordable prices.
Produc t ion of the sponge i ron in the
count ry has a l so resu l ted in p rov id ing an
alternative feed material to steel melting scrap
which was hitherto imported in large quantities
by the Electric Arc Furnace units and the Induction
Furnace units for steel making. This has resulted
in a considerable saving in foreign exchange. The
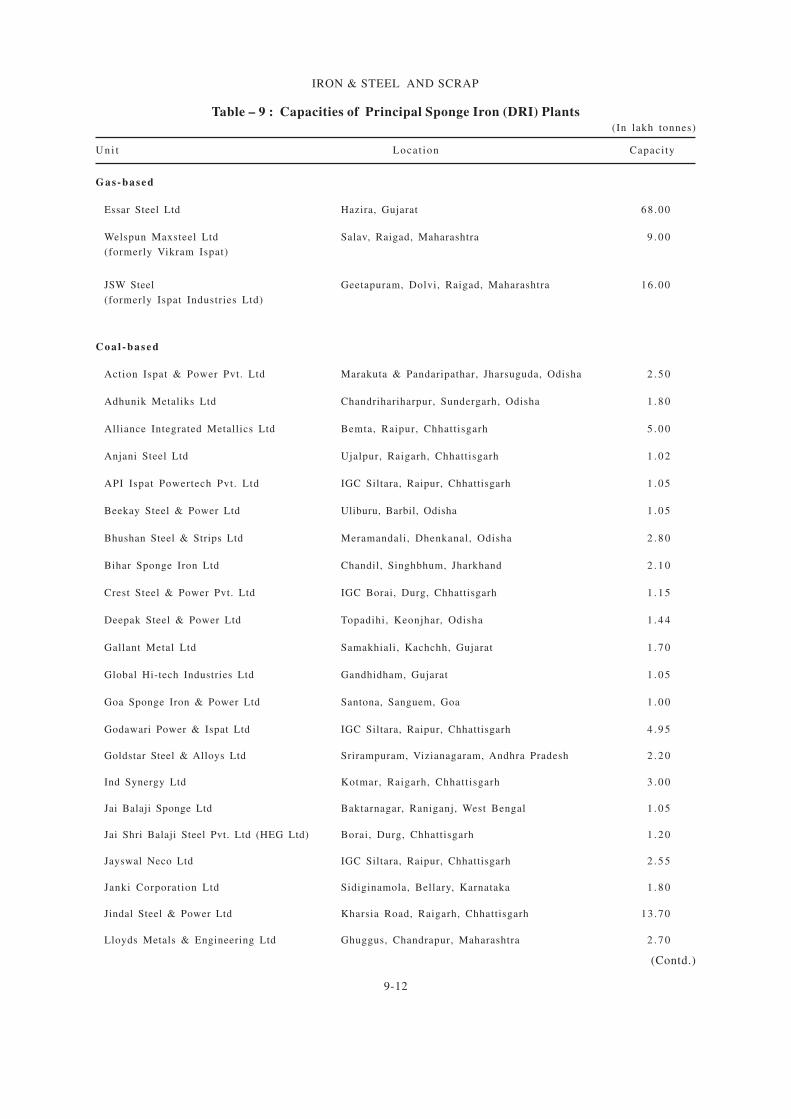
available data on annual installed capacity of
principal sponge iron units are given in Table-9.
9-12
IRON & STEEL AND SCRAP
Table – 9 : Capacities of Principal Sponge Iron (DRI) Plants
(In lakh tonnes)
U n i t Locat ion Capacity
Gas-based
Essar Steel Ltd Hazira, Gujarat 68 .00
Welspun Maxsteel Ltd Salav, Raigad, Maharashtra 9 . 0 0
(formerly Vikram Ispat)
JSW Steel Geetapuram, Dolvi, Raigad, Maharashtra 16 .00
(formerly Ispat Industries Ltd)
C o a l - b a s e d
Action Ispat & Power Pvt. Ltd Marakuta & Pandaripathar, Jharsuguda, Odisha 2 . 5 0
Adhunik Metaliks Ltd Chandrihariharpur, Sundergarh, Odisha 1 . 8 0
Alliance Integrated Metallics Ltd Bemta, Raipur, Chhattisgarh 5 . 0 0
Anjani Steel Ltd Ujalpur, Raigarh, Chhattisgarh 1 . 0 2
API Ispat Powertech Pvt. Ltd IGC Siltara, Raipur, Chhattisgarh 1 . 0 5
Beekay Steel & Power Ltd Uliburu, Barbil, Odisha 1 . 0 5
Bhushan Steel & Strips Ltd Meramandali, Dhenkanal, Odisha 2 . 8 0
Bihar Sponge Iron Ltd Chandil, Singhbhum, Jharkhand 2 . 1 0
Crest Steel & Power Pvt. Ltd IGC Borai, Durg, Chhattisgarh 1 . 1 5
Deepak Steel & Power Ltd Topadihi, Keonjhar, Odisha 1 . 4 4
Gallant Metal Ltd Samakhiali, Kachchh, Gujarat 1 . 7 0
Global Hi-tech Industries Ltd Gandhidham, Gujarat 1 . 0 5
Goa Sponge Iron & Power Ltd Santona, Sanguem, Goa 1 . 0 0
Godawari Power & Ispat Ltd IGC Siltara, Raipur, Chhattisgarh 4 . 9 5
Goldstar Steel & Alloys Ltd Srirampuram, Vizianagaram, Andhra Pradesh 2 . 2 0
Ind Synergy Ltd Kotmar, Raigarh, Chhattisgarh 3 . 0 0
Jai Balaji Sponge Ltd Baktarnagar, Raniganj, West Bengal 1 . 0 5
Jai Shri Balaji Steel Pvt. Ltd (HEG Ltd) Borai, Durg, Chhattisgarh 1 . 2 0
Jayswal Neco Ltd IGC Siltara, Raipur, Chhattisgarh 2 . 5 5
Janki Corporation Ltd Sidiginamola, Bellary, Karnataka 1 . 8 0
Jindal Steel & Power Ltd Kharsia Road, Raigarh, Chhattisgarh 13 .70
Lloyds Metals & Engineering Ltd Ghuggus, Chandrapur, Maharashtra 2 . 7 0
(Contd.)
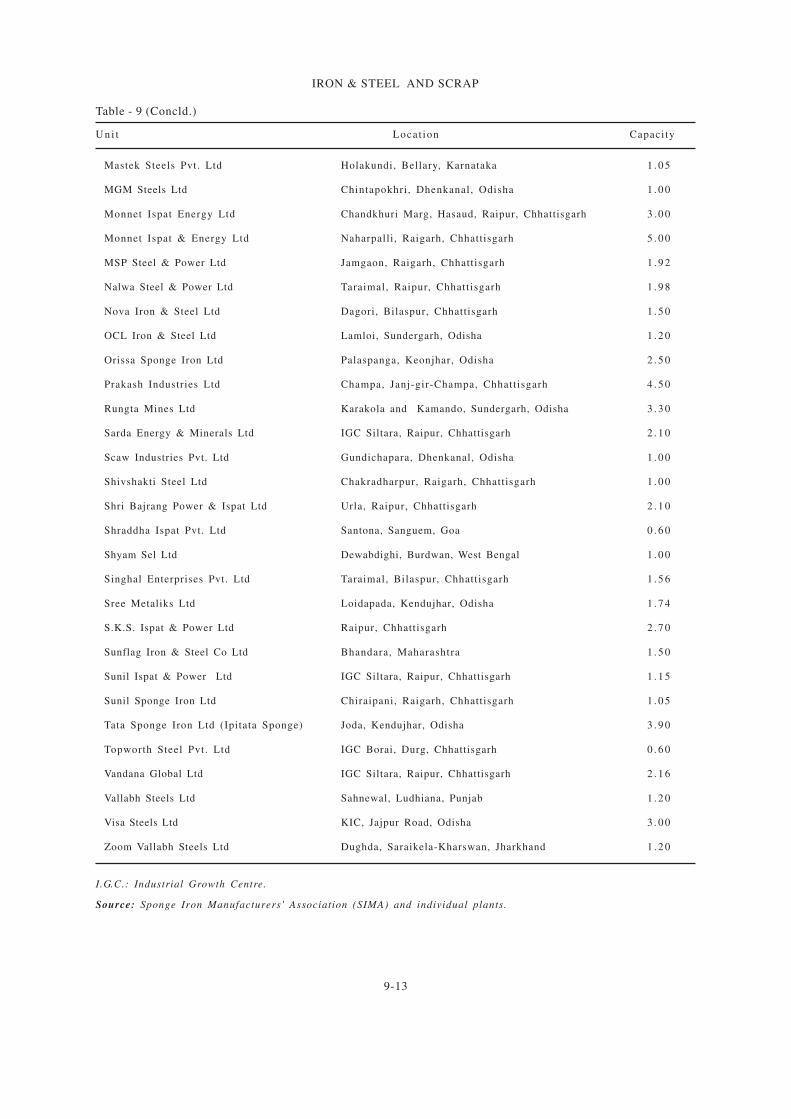
9-13
IRON & STEEL AND SCRAP
Mastek Steels Pvt. Ltd Holakundi, Bellary, Karnataka 1 . 0 5
MGM Steels Ltd Chintapokhri, Dhenkanal, Odisha 1 . 0 0
Monnet Ispat Energy Ltd Chandkhuri Marg, Hasaud, Raipur, Chhattisgarh 3 . 0 0
Monnet Ispat & Energy Ltd Naharpalli, Raigarh, Chhattisgarh 5 . 0 0
MSP Steel & Power Ltd Jamgaon, Raigarh, Chhattisgarh 1 . 9 2
Nalwa Steel & Power Ltd Taraimal, Raipur, Chhattisgarh 1 . 9 8
Nova Iron & Steel Ltd Dagori, Bilaspur, Chhattisgarh 1 . 5 0
OCL Iron & Steel Ltd Lamloi, Sundergarh, Odisha 1 . 2 0
Orissa Sponge Iron Ltd Palaspanga, Keonjhar, Odisha 2 . 5 0
Prakash Industries Ltd Champa, Janj-gir-Champa, Chhattisgarh 4 . 5 0
Rungta Mines Ltd Karakola and Kamando, Sundergarh, Odisha 3 . 3 0
Sarda Energy & Minerals Ltd IGC Siltara, Raipur, Chhattisgarh 2 . 1 0
Scaw Industries Pvt. Ltd Gundichapara, Dhenkanal, Odisha 1 . 0 0
Shivshakti Steel Ltd Chakradharpur, Raigarh, Chhattisgarh 1 . 0 0
Shri Bajrang Power & Ispat Ltd Urla, Raipur, Chhattisgarh 2 . 1 0
Shraddha Ispat Pvt. Ltd Santona, Sanguem, Goa 0 . 6 0
Shyam Sel Ltd Dewabdighi, Burdwan, West Bengal 1 . 0 0
Singhal Enterprises Pvt. Ltd Taraimal, Bilaspur, Chhattisgarh 1 . 5 6
Sree Metaliks Ltd Loidapada, Kendujhar, Odisha 1 . 7 4
S.K.S. Ispat & Power Ltd Raipur, Chhattisgarh 2 . 7 0
Sunflag Iron & Steel Co Ltd Bhandara, Maharashtra 1 . 5 0
Sunil Ispat & Power Ltd IGC Siltara, Raipur, Chhattisgarh 1 . 1 5
Sunil Sponge Iron Ltd Chiraipani, Raigarh, Chhattisgarh 1 . 0 5
Tata Sponge Iron Ltd (Ipitata Sponge) Joda, Kendujhar, Odisha 3 . 9 0
Topworth Steel Pvt. Ltd IGC Borai, Durg, Chhattisgarh 0 . 6 0
Vandana Global Ltd IGC Siltara, Raipur, Chhattisgarh 2 . 1 6
Vallabh Steels Ltd Sahnewal, Ludhiana, Punjab 1 . 2 0
Visa Steels Ltd KIC, Jajpur Road, Odisha 3 . 0 0
Zoom Vallabh Steels Ltd Dughda, Saraikela-Kharswan, Jharkhand 1 . 2 0
I.G.C.: Industrial Growth Centre.
Source: Sponge Iron Manufacturers' Association (SIMA) and individual plants.
Table - 9 (Concld.)
U n i t Locat ion Capacity
9-14
IRON & STEEL AND SCRAP
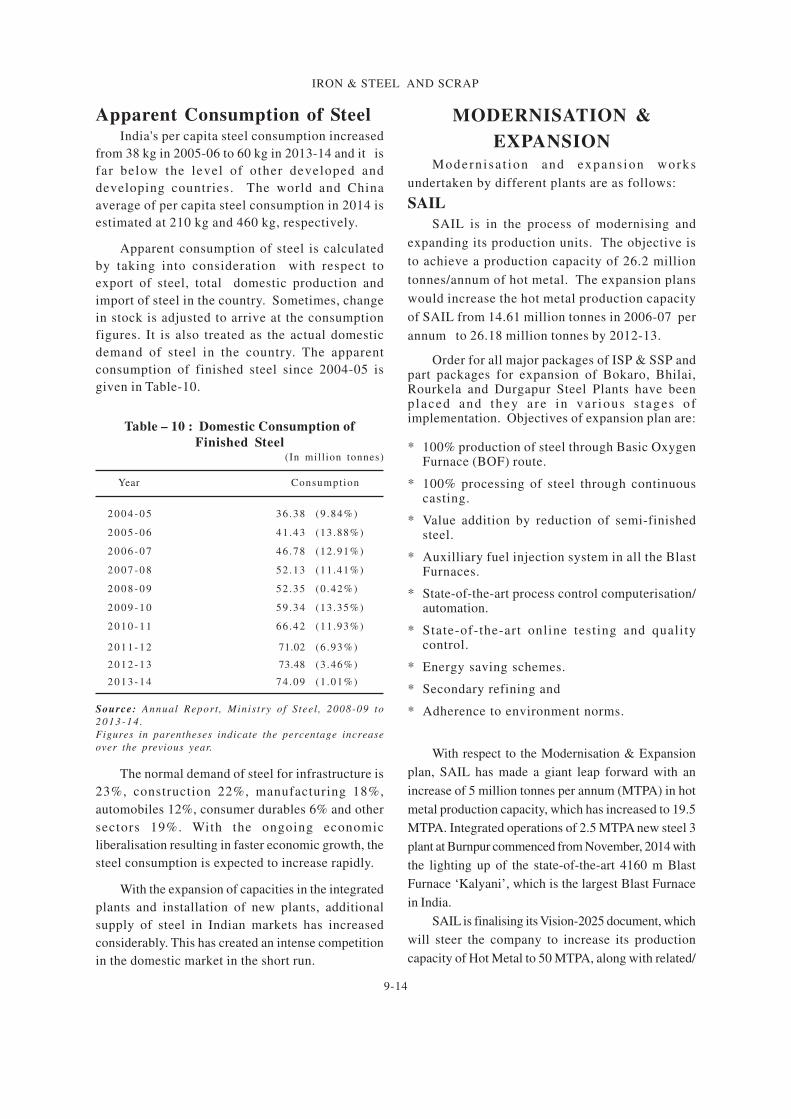
Apparent Consumption of SteelIndia's per capita steel consumption increased
from 38 kg in 2005-06 to 60 kg in 2013-14 and it is
far below the level of other developed and
developing countries. The world and China
average of per capita steel consumption in 2014 is
estimated at 210 kg and 460 kg, respectively.
Apparent consumption of steel is calculated
by taking into consideration with respect to
export of steel, total domestic production and
import of steel in the country. Sometimes, change
in stock is adjusted to arrive at the consumption
figures. It is also treated as the actual domestic
demand of steel in the country. The apparent
consumption of finished steel since 2004-05 is
given in Table-10.
Table – 10 : Domestic Consumption of
Finished Steel(In million tonnes)
Year Consumption
2 0 0 4 - 0 5 36 .38 (9 .84%)
2 0 0 5 - 0 6 41 .43 (13.88%)
2 0 0 6 - 0 7 46 .78 (12.91%)
2 0 0 7 - 0 8 52 .13 (11.41%)
2 0 0 8 - 0 9 52 .35 (0 .42%)
2 0 0 9 - 1 0 59 .34 (13.35%)
2 0 1 0 - 1 1 66 .42 (11.93%)
2 0 1 1 - 1 2 71.02 (6 .93%)
2 0 1 2 - 1 3 73.48 (3 .46%)
2 0 1 3 - 1 4 74 .09 (1 .01%)
Source: Annual Report , Ministry of Steel , 2008-09 to
2013-14 .
Figures in parentheses indicate the percentage increase
over the previous year.
The normal demand of steel for infrastructure is
23%, construction 22%, manufacturing 18%,
automobiles 12%, consumer durables 6% and other
sectors 19%. With the ongoing economic
liberalisation resulting in faster economic growth, the
steel consumption is expected to increase rapidly.
With the expansion of capacities in the integrated
plants and installation of new plants, additional
supply of steel in Indian markets has increased
considerably. This has created an intense competition
in the domestic market in the short run.
MODERNISATION &
EXPANSION
Modern isa t ion and expans ion works
undertaken by different plants are as follows:
SAIL
SAIL is in the process of modernising and
expanding its production units. The objective is
to achieve a production capacity of 26.2 million
tonnes/annum of hot metal. The expansion plans
would increase the hot metal production capacity
of SAIL from 14.61 million tonnes in 2006-07 per
annum to 26.18 million tonnes by 2012-13.
Order for all major packages of ISP & SSP andpart packages for expansion of Bokaro, Bhilai,Rourkela and Durgapur Steel Plants have beenplaced and they a re in var ious s tages o fimplementation. Objectives of expansion plan are:
* 100% production of steel through Basic OxygenFurnace (BOF) route.
* 100% processing of steel through continuouscasting.
* Value addition by reduction of semi-finishedsteel.
* Auxilliary fuel injection system in all the BlastFurnaces.
* State-of-the-art process control computerisation/automation.
* State-of-the-art online testing and qualitycontrol.
* Energy saving schemes.
* Secondary refining and
* Adherence to environment norms.
With respect to the Modernisation & Expansion
plan, SAIL has made a giant leap forward with an
increase of 5 million tonnes per annum (MTPA) in hot
metal production capacity, which has increased to 19.5
MTPA. Integrated operations of 2.5 MTPA new steel 3
plant at Burnpur commenced from November, 2014 with
the lighting up of the state-of-the-art 4160 m Blast
Furnace ‘Kalyani’, which is the largest Blast Furnace
in India.
SAIL is finalising its Vision-2025 document, which
will steer the company to increase its production
capacity of Hot Metal to 50 MTPA, along with related/
9-15
IRON & STEEL AND SCRAP
enabling business activities, in line with growing
demand of steel in the country. This will not only
enhance SAIL’s contribution to nation building
but will also place SAIL amongst the top steel
companies globally.
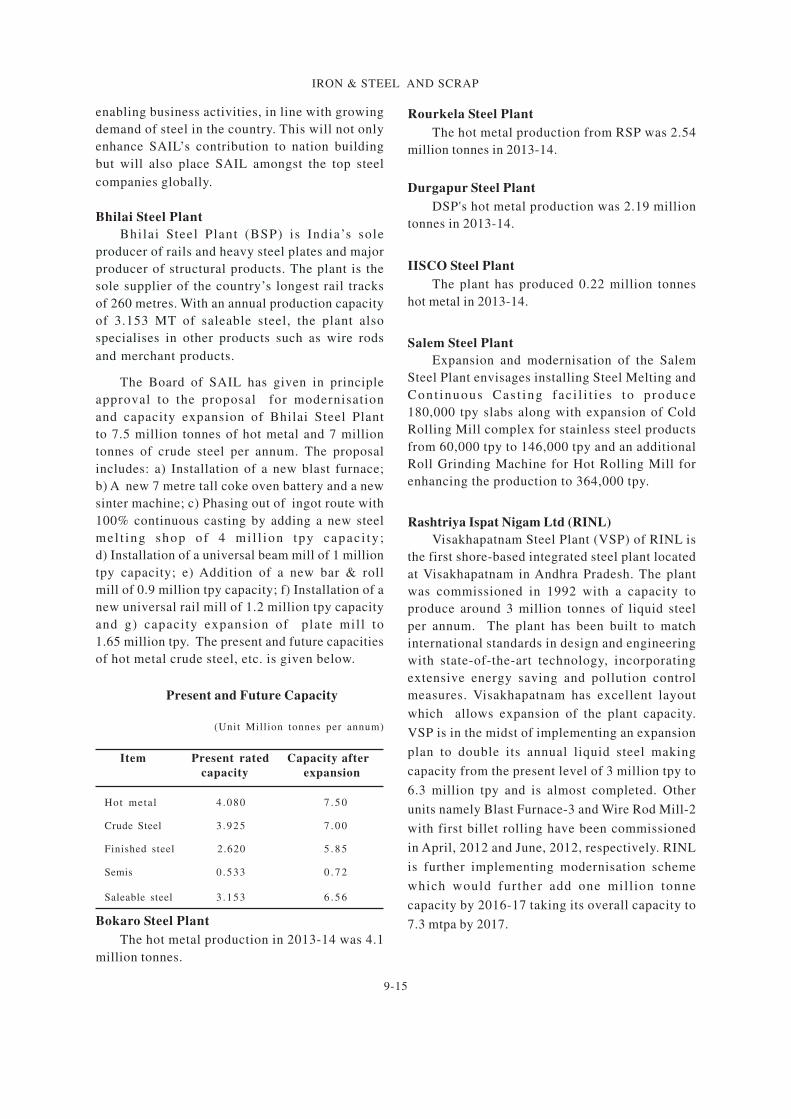
Bhilai Steel Plant
Bhilai Steel Plant (BSP) is India’s sole
producer of rails and heavy steel plates and major
producer of structural products. The plant is the
sole supplier of the country’s longest rail tracks
of 260 metres. With an annual production capacity
of 3.153 MT of saleable steel, the plant also
specialises in other products such as wire rods
and merchant products.
The Board of SAIL has given in principle
approval to the proposal for modernisation
and capacity expansion of Bhilai Steel Plant
to 7.5 million tonnes of hot metal and 7 million
tonnes of crude steel per annum. The proposal
includes: a) Installation of a new blast furnace;
b) A new 7 metre tall coke oven battery and a new
sinter machine; c) Phasing out of ingot route with
100% continuous casting by adding a new steel
mel t ing shop of 4 mi l l ion tpy capac i ty ;
d) Installation of a universal beam mill of 1 million
tpy capacity; e) Addition of a new bar & roll
mill of 0.9 million tpy capacity; f) Installation of a
new universal rail mill of 1.2 million tpy capacity
and g) capacity expansion of plate mill to
1.65 million tpy. The present and future capacities
of hot metal crude steel, etc. is given below.
Present and Future Capacity
(Unit Million tonnes per annum)
Item Present rated Capacity after
capacity expansion
Hot metal 4 .080 7 . 5 0
Crude Steel 3 .925 7 . 0 0
Finished steel 2.620 5 . 8 5
Semis 0 .533 0 . 7 2
Saleable steel 3 .153 6 . 5 6
Bokaro Steel Plant
The hot metal production in 2013-14 was 4.1
million tonnes.
Rourkela Steel Plant
The hot metal production from RSP was 2.54
million tonnes in 2013-14.
Durgapur Steel Plant
DSP's hot metal production was 2.19 million
tonnes in 2013-14.
IISCO Steel Plant
The plant has produced 0.22 million tonnes
hot metal in 2013-14.
Salem Steel Plant
Expansion and modernisation of the Salem
Steel Plant envisages installing Steel Melting and
Cont inuous Cas t ing fac i l i t i e s to p roduce
180,000 tpy slabs along with expansion of Cold
Rolling Mill complex for stainless steel products
from 60,000 tpy to 146,000 tpy and an additional
Roll Grinding Machine for Hot Rolling Mill for
enhancing the production to 364,000 tpy.
Rashtriya Ispat Nigam Ltd (RINL)
Visakhapatnam Steel Plant (VSP) of RINL is
the first shore-based integrated steel plant located
at Visakhapatnam in Andhra Pradesh. The plant
was commissioned in 1992 with a capacity to
produce around 3 million tonnes of liquid steel
per annum. The plant has been built to match
international standards in design and engineering
with state-of-the-art technology, incorporating
extensive energy saving and pollution control
measures. Visakhapatnam has excellent layout
which allows expansion of the plant capacity.
VSP is in the midst of implementing an expansion
plan to double its annual liquid steel making
capacity from the present level of 3 million tpy to
6.3 million tpy and is almost completed. Other
units namely Blast Furnace-3 and Wire Rod Mill-2
with first billet rolling have been commissioned
in April, 2012 and June, 2012, respectively. RINL
is further implementing modernisation scheme
which would further add one mill ion tonne
capacity by 2016-17 taking its overall capacity to
7.3 mtpa by 2017.
9-16
IRON & STEEL AND SCRAP
Tata Steel Ltd (formerly TISCO)
The company has been rechristened as Tata
Steel Ltd (TSL). The company has an integrated
steel plant located at Jamshedpur, Jharkhand, with
annual crude steel making capacity of 9.7 million
tonnes and variety of finishing mills. TSL has
produced 8.76 million tonnes of finished steel in
2013-14 as compared to 6.43 million tonnes in
2012-13. The production of crude steel in 2013-14
was 9.16 million tonnes as against 8.13 million
tonnes in 2012-13.
Setting up of a new integrated steel plant with
12.5 million tonnes capacity in Kalinganagar,
Jajpur, Odisha by TSL is currently underway,
which the company plans to complete in phases.
It is set to augment production capacity by 3 mtpa
in the first phase. Government of Odisha has
allotted 2000 acres of land for the plant at
Kalinganagar. The company has further plans to
set up a 7.0 million tpy capacity integrated steel
p lan t a t Jagda lpur in Bas ta r reg ion of
Chhattisgarh. In the first phase, installation of a
2 million tpy capacity plant is likely to be taken
up and it is expected to be completed in 3 to 5
years. Capacity expansion to 5 million tpy will be
under taken subsequent ly. The process o f
acquiring of land is under progress. The company
also signed an MoU with the Government of
Jharkhand for setting up of a 12 million tonnes
per year integrated steel plant at Saraikela in
phases . The above pro jec t s a re , however,
subjected to raw material linkages and requisite
approvals.
JSW Steel Ltd
JSW Steel Ltd's installed combined capacity
at (Karnataka, Tamil Nadu and Maharashtra
plants) of crude steels was of 14.3 million tpy with
value added products constituting 1.8 million tpy
spread ac ross four loca t ions ; Toranaga l lu
(Vijayanagar Works), Salem (Salem Works), Vasind
and Tarapur (downstream units). Vijayanagar
Works existing operations produce flat and long
steel products, Salem Works focus only in long
products and the downstream units produce CR/
Galvanised, colour coated, value added flat
products. All the existing operating facilities
have been accredited with OHSAS-18001, ISO-
9001: 2000 and ISO - 14001. Vijayanagar Works
has integrated operations from beneficiation plant
to 1 million tpy Cold Rolling Mill Complex. The
Salem Works has an integrated manufacturing
facility with an overall crude steel capacity of 1
million tpy, comprising sinter plant, blast furnace,
EOF, b i l l e t cas te r, b loom cas te r
and rolling with associated facilities such as
coke oven, power plant, oxygen plant, etc. The
slabs and HR coil produced at Vijaynagar Works
are further processed in downstream units at
Vas ind and Tarapur in to va lue added HR
plates, CR, galvanised, galvalume and colour
coated products.
The Company has enhanced the total capacity
to 10 million tpy at Vijayanagar Works. Two
subsidiaries of the company - M/s JSW Bengal
Steel Ltd and M/s JSW Jharkhand Steel Ltd are
incorporated to set up greenfield steel plants with
10 million tpy capacity each in West Bengal and
Jharkhand, respectively. The company is in
possession of required land in West Bengal, while
in Jharkhand, it has obtained a mining lease for
iron ore.
In January 2011, company acquired the assets
of Integrated Steel Plant division of Bellary Steel
& Alloys Ltd. In February 2011, the company
commissioned the Sinter plant 3 (5.75 mtpa
capacity) at Vijayanagar Works, the largest of
such facili ty in India. In October 2011, the
company signed a joint venture agreement with
Marubeni-Itochu Steel Inc. Tokyo, (MISI) to set-
up a steel processing center in North India, under
the name of JSW MI Steel Service Centre Pvt Ltd.
The company has decided to set up a new cold
rolling mill complex of 2.3 mtpa in two phases at
its Vijayanagar Works, considering the growing
demand from consumer durables and automobile
segment for CRCA products . By 2020, the
9-17
IRON & STEEL AND SCRAP
company aims to produce 34 million tonnes of steel
annually with Greenfield integrated steel plants
coming up in West Bengal and Jharkhand.
Jindal Steel & Power Ltd (JSPL)
JSPL has set up a rail & universal beam plant
with capabilities to produce 121 m long, the world's
longest rails and is the first in the country to
manufacture large-size parallel flange beams. The
company has captive coal mines at Dongamahua
in Raigarh district, Chhattisgarh and coal washing
unit with capacity of 6 million tonnes per year to
wash 47-48% coal ash to 26%. The sponge iron
plant at Raigarh, Chhattisgarh has capacity of
1.37 million tpy. Facilities at Raigarh also include
following capacities - steel 3 million tonnes (Rail
and s t ructurals 0 .75 mil l ion tonnes , p la tes
1.00 million tonnes and slabs, rounds, blooms and
billets 1.25 million tonnes), hot metal 1.67 million
tonnes and captive power plant 623 MW.
As part of expansion projects, JSPL is setting
up a 6 million tpy integrated steel plant at Angul
in Odisha. Other plants being set up are: 6 million
tpy integrated steel plant at Patratu, Jharkhand
and 7 mi l l ion tpy s tee l p lan t a t Ra igarh ,
Chhattisgarh. It has planned to implement these
projects in phases. The present plant at Raigarh
is also under expansion to 7 million tpy (3 million
tpy through EF route and 4 million tpy through
BOF route) comprising 3 million tpy flat products
and 4 million tpy long products. It will also have
6 million tpy gas-based DRI plant with matching
coal gasification unit and 4 million tpy hot metal
capacity.
Essar Steel Limited (ESL)
A state-of-the-art hot rolled coil steel plant
was set up at Hazira, Gujarat with 4.6 million tpy
capacity and is expanded to 10 million tonnes per
annum. I t i s the l a rges t fu l ly - in tegra ted
manufacturer of high-quality flat steel products
in western India. Company's operations include 8
million tpy and 12 million tpy beneficiation plants
at Bailadila in Chhattisgarh and Dabuna in Odisha.
Essar has the world 's second largest s lurry
pipeline of 267 km and also 253 km to transport
beneficiated iron ore slurry to the pellet plants
namely, 8 mi l l ion tpy pe l le t complex a t
Visakhapa tnam, Andhra Pradesh and
6 million tpy plant at Paradip, Odisha. The Essar
Steel Complex at Hazira in Surat district, Gujarat
houses the world 's largest gas-based single
location sponge iron plant with a capacity of
6.8 million tpy. The complex also houses 1.4 million
tpy cold rolling plant, 4.6 million tpy electric arc
furnace, 4.6 million tpy continuous caster and
3.6 million tpy hot strip mill . Outstanding
performance has been observed in the 3 DRI-HBI
modules of the company.
The company has plans to set up a steel plant
of 6 million tonnes per annum capacity at Paradip,
Odisha. The scheme also includes installation of
pellet plant and iron ore beneficiation plant. The
company has plans to set up a steel plant of
3.2 million tonnes per annum capacity at Bastar,
Chhattisgarh, (In first phase, a 1.6 million tpy steel
plant with a captive power plant is to be set up),
3 million tonnes per annum in Jharkhand and
6 million tonnes per annum in Karnataka.
JSW Ispat Steel Ltd (formerly, Ispat Industries
Ltd)
JSW Steel has aquired a 45.53% majority stake
in JSW Ispat Steel w.e.f. 21.12.2010. It has set up
one of the largest integrated steel plants in the
private sector in India at Dolvi in Raigad district,
Maharashtra. The plant has a capacity to produce
3 million tpy of hot rolled coils (HRC). The
company also manufactures sponge iron and pig
iron at their Dolvi complex. The company has a
gas-based DRI plant of 1.6 million tpy capacity
and an ultra-modern blast furnace of 2 million tpy
capacity to produce hot metal/pig iron. It also
has a 2.24 million tpy sinter plant at Dolvi. The
integrated steel plant functions on the Converter-
cum-Electr ic Arc Furnace route (CONARC
process) to produce steel through modern Twin
Shell Electric Arc Furnace.
JSW Ispat Steel Ltd has plans to expand its
HR coils capacity at Dolvi to 3.6 million tonnes
per year. A new 2 million tonnes sinter plant, a
1,260 tonnes/day oxygen plant and a new electric
arc furnace have also been commissioned at IIL
Dolvi. The company is considering to scale up
the plant capacity to 5 million tpy and also has
plans to set up 5 million tpy integrated steel plant
at Paradip, Odisha.
9-18
IRON & STEEL AND SCRAP
Neelachal Ispat Nigam Limited (NINL)
NINL has a 1.1 million tonnes per annum
capac i ty i ron & s tee l p lan t loca ted a t
Kalinganagar, Duburi, Jajpur districts, Odisha.
The NINL and Odisha Government will be setting
up one million tonne steel plant at Kalinganagar,
Jajpur, Odisha. The other product of the company
that is sold in the domestic market is granulated
slag which is consumed by several cement plants.
NEW STEEL PROJECTSIn the context of long-term demand projection
of steel, the Government adopted a two-pronged
strategy for increasing steel production in the
country. First ly, through modernisation and
expansion of existing public sector steel plants in
the country and secondly, by offering initiatives
to private sector to install new steel capacities.
After the announcement of the Industrial Policy
in 1991 and encouraged by the various other
policy initiatives of the Government, substantial
interest by several entrepreneurs to set up new
steel plants has been witnessed. Besides the steel
PSUs, massive capacity addition is in the pipeline
by private steel producers including foreign direct
investors. As per the latest information, 301 MoUs
have been signed in various states with intended
capacity of around 488.66 million tonnes with an
investment of over RRRRR 5-10 lakh crore by 2020. Some
projects were at various stages of implementation.
POSCO has planned to set up 12 million tpy
capacity steel plant in Odisha by using "Finex"
process with direct utilisation of sinter feed iron
ore (-8 mm) besides utilising the advantages of
"Corex" technology. Similar expansion is also
coming up in secondary steel sector consisting
of sponge iron, EAF, induction furnace, rolling
mill, etc. With these new steel plants, contribution
of private sector units is gradually increasing and
this trend is expected to continue.
National Mineral Development Corporation Ltd
NMDC is now d i rec t ing i t s resources
to diversify into steel making. An integrated steel
plant with a capacity of three million tonnes will
be set up in Chhattisgarh near Nagarnar, Bastar
district. NMDC is in the process of expanding its
business through forward integration in both
greenfield and brownfield projects by setting up
(a) 2.0 million tpy pellet plant in Chhattisgarh
(b) 1.2 million tpy pellet plant at Donimalai in
Karnataka and (c) 0.36 million tpy BHJ ore
beneficiation plant at Donimalai.
Further, NMDC has acquired 50% equity in
Legacy Iron Ore Ltd Australia and has signed an
MoU with RINL for laying a slurry pipeline from
Bailadila Complex (Chhattisgarh) to Vizag (Andhra
Pradesh) via Jagdalpur to facilitate evacuation of
iron ore concentrate.
NMDC sold 28.21 million tonnes in domestic
market during 2013-14 as against 24.67 million
tonnes during corresponding period last year
(CPLY). The company exported 2.30 million tonnes
of iron ore to Japan, South Korea and China
valued at approximately RRRRR1,600 crores during
current year compared to 1.60 million tonnes
valued at R R R R R 956 crore in the CPLY. Total sales
during the year was 30.51 million tonnes as against
26.27 mill ion tonnes during CPLY. NMDC
produced 30.18 million tonnes of iron ore during
2013-14 compared to 27.18 million tonnes in CPLY.
KIOCL LtdThe company is operating 350 cu m capacity
blast furnace at Panambur, New Mangalore
Port for production of pig iron with 2.27 lakh tpy
capacity and a Ductile Iron Spun Pipe (DISP)
plant of 100,000 tonnes per year capacity. The
hot metal from blast furnace will be the main
feed stock for the DISP plant. The company
is a l so in the process o f se lec t ing a jo in t
venture equity partner for an integrated steel plant
to be set up in Karnataka with initial capacity of
1.5 mpta and expandable to 5 mtpa with equity
part icipation. The company also operates a
3.5 million tpy pellets plant at Mangalore with
hematite ore purchased from NMDC. It has signed
an MoU with Kerala State Industrial Development
Corporation Ltd (KSIDL) for setting up of iron ore
mining, beneficiation and pelletisation plant in
Kerala.
Government of Andhra Pradesh has approved the
draft MoU to be entered between Andhra Pradesh
Mineral Development Corporation (APMDC) and
KIOCL for joint exploration of iron ore deposits
loca ted in Nemkal in Anan tapur Dis t t . , AP.
9-19
IRON & STEEL AND SCRAP
KIOCL produced 1.71 million tonnes and sold 1.62
million tonnes of pellets during 2013-14.
VISA Steel Ltd
VISA Steel is a leading player in the Special
Steel, Ferro Chrome and Metallurgical Coke
Business in India. The Company is setting up an
integrated 1 million TPA Special Steel Plant at
Kalinganagar Industrial Complex in Odisha. The
first phase of 0.5 million TPA Special Steel Long
Product Plant is fully operational. The facilities
include a 2,25,000 TPA Pig Iron Plant, 3,00,000 TPA
Sponge Iron Plant, 5,00,000 TPA Steel Melt Shop
(with EAF, LRF and VD) & 500,000 TPA Rolling
Mill (Bar & Wire Rod Mill). VISA Steel is also
operating 180,000 TPA Ferro Chrome Plant and a
75 MW Captive Power Plant. VISA Sun Coke
Limited, a joint venture company between VISA
Steel Limited and Sun Coke Energy, USA, is
operating a 400,000 MT per annum heat recovery
coke plant and associated steam generation units
at Kalinganagar in Odisha.
IRON & STEEL SCRAP
Iron & Steel Scrap is one of the essential
requirements for manufacture of steel in mini-steel
industry. It is also consumed by some major steel
plants. Scrap, especially from the ship breaking
industry supplies substantial quantity of re-
rollable steel and steel scrap for the iron & steel
industry. Iron scrap is available in the country in
the form of pressed bundles, a mixture of used
steel components (called as a commercial scrap),
turnings and borings and heavy melting scrap.
These are generated by industries of all sectors
l ike automobiles , rai lways and engineering
workshops.
The collection and processing of scrap in
an organised manner is undertaken by a few
units in the country. In the local market, scrap
is supplied by dealers who in turn arrange to
have scrap collected manually or through sub-
dealers.
The consumption of scrap is mainly reported
by Induction Furnace and Electric Arc Furnace
units, integrated steel plants and alloy steel &
foundry industries. Scraps are used in the steel
sector after recycling. Recycling scrap helps in
conservation of energy as remelting of scrap
requires much less energy than production of iron
or steel from iron ore. Also, the consumption of
iron and scrap by remelting reduces the burden
on land fill disposal facilities and prevents the
accumulation of abandoned steel products in the
environment. It increases the availability of semi-
finished material, which otherwise would have to
be produced using the ore. Thus, it helps in
conservation of natural resources.
Ship breaking
Ship breaking has been a major source of
scrap generation. Ship breaking activities are
carried out at various places on the Indian Coast,
the largest concentration being in the West Coast.
Private entrepreneurs handle the task of ship
breaking in India. It is a labour-intensive job, and
in India, it is cost efficient activity. Locations of
present ship breaking activities are:
i) Alang and Sosiya yards in Bhavnagar district,
Gujarat,
(ii) Sachana district, Gujarat
(iii) Mumbai and
(iv) Kolkata
Alang & Sosiya yards account for 90%
concentration of the ship breaking industry in
India. During 2011-12, 2012-13 and 2013-14 a
total of 291, 394 and 298 ships were beached by
the industry accounting for 3.1 million tonnes,
3.8 million tonnes and 3.06 million tonnes,
respectively, in terms of LDT ( Light Displacement
Tonnage, viz, physical weight of a ship). Today,
Alang possibly represents the single largest
concentration of ship breaking industry in the
world. The life of an average ocean-going ship is
about 20 years. About 40% of the ships broken
are dry cargo ships, while the remaining 40% of
the ships broken are wet cargo, tanker and
specialised ships. These recyclable steels mainly
as steel scrap provide feed to steel and foundry
industry in India. The steel generated from ship
recycling contributes to around 1% to 2% of the
domestic steel demand.
9-20
IRON & STEEL AND SCRAP
The recommendations of a committee of
Technical Experts on Ship Breaking set up by the
Government of India on the directions of the
Hon'ble Supreme Court have been accepted by the
Hon'ble Supreme Court on 6.9.2007, on the issue
of handling & management of the hazardous
industrial waste generated during ship breaking.
The Court has also directed the Government to
formulate a comprehensive Code incorporating the
recommendations which are operative till the
s ta tu tes a re amended . The Code i s under
formulation in the Ministry of Steel.
MSTC Ltd
(Formerly Metal Scrap Trade Corp. Ltd)
Presently, the company undertakes trading
activities, e-commerce, disposal of ferrous and
non-ferrous scrap, surplus s tores and other
secondary arising mostly from Public Sector
Undertakings and Government Departments,
including Ministry of Defence. The Company also
undertakes import of raw materials in bulk required
by large industrial houses on back-to-back basis.
The items of import include petroleum products,
Low Ash Metallurgical Coke, Coking Coal, Steam
Coal, DR Pellets, HR Coils and Heavy Melting
Scrap, etc. It also undertakes trading in items
within the country in competition with any other
private trader.
Ferro Scrap Nigam Ltd (FSNL)
FSNL is a wholly owned subsidiary of MSTC
Ltd under the Ministry of Steel. The company
undertakes the recovery and processing of scrap
from slag and refuse dumps in the nine steel plants
at Bhilai, Bokaro, Burnpur, Durgapur, Rourkela,
Visakhapatnam, Dolvi, Duburi and Haridwar and
Rail wheel factory Bengaluru. The scrap so
recovered is returned to the steel plants for
recycling disposal and the company is paid
processing charges on the quantity recovered at
varying rates depending on the category of scrap.
Scrap is generated during iron & steel making and
also in the Rolling Mills. In addition, the company
provides steel mill services, such as scarfing of
slabs, handling of BOF slag, etc.
The recovery of scrap by FSNL in 2013-14
was 2 .52 mi l l ion tonnes in compar i son to
2.33 million tonnes in 2012-13.
TRADE POLICY
As per the modified Export-Import Policy
incorporated under the Foreign Trade Policy
(FTP) for 2009-14, the imports of primary forms
of pig iron, spiegeleisen, sponge iron, ferro-alloys,
stainless steel , remelt ing scrap, as also the
semi- f in i shed produc ts o f i ron , non-a l loy
steel or s ta inless s teel (such as f la t - rol led
products, bars, rods, coils and wires), primary
and semi-finished forms of other alloy-steels, etc.
are unrestricted. Similarly, the exports are also
allowed freely. In order to preserve iron ore
resources for domestic use on cheaper rates,
export duty on iron ore has been increased to
30% ad valorem on all varieties of iron ore
(except pellets) from December, 2011. The export
duty on pellets has been imposed to 5% ad
valorem vide notification No.3/2014-customs
dated 27th January, 2014.
WORLD REVIEW
The world production of pig iron in 2013 was
about 1,239 million tonnes as against 1,183 million
tonnes in 2012. China, Japan, India, Russia, Rep.
of Korea, Brazil, USA, Ukraine and Germany were
the principal producers (Table-11).
The world crude steel production in 2013
increased marginally to 1,607 million tonnes from
1,546 million tonnes in 2012. China was the top
producer accounting for 48% of world's crude steel
production, followed by Japan (7%), USA and
India (5% each). Other important producers were
Russia, Korea, Republic of, Germany, Turkey,
Brazil, Ukraine and Italy (Table-12).
9-21
IRON & STEEL AND SCRAP
Table – 11 : World Production of Pig Iron
(By Principal Countries)
(In '000 tonnes)
Count ry 2 0 1 1 2 0 1 2 2 0 1 3
World : Total 11 6 0 0 0 0 11 8 3 0 0 0 1 2 3 9 0 0 0
Brazil 33416 e 32448 e 31552
China 6 2 9 6 9 3 6 5 7 9 0 5 7 0 8 9 7 0
France 9 6 9 7 9 5 3 2 10300
Germany 27943 27046 27177
India* 66460 62057 64893
I ran 12670 13725 16465
Japan 81028 81405 83849
Korea, Rep. of 42213 41718 41045
Mexico 10463 10198 11011
Russia 48200 50500 50000
Taiwan 12940 11748 12122
Ukraine 28878 28487 29089
USA 30233 32062 30381
Other countries 1 2 6 1 6 6 1 2 4 1 3 3 1 2 2 1 4 6
Source: World Mineral Production, 2009-2013
* India's production of pig iron in 2011-12, 2012-13 and
2013-14 was 5,371 thousand tonnes, 6,870 thousand tonnes &
7,950 thousand tonnes, respectively.
Table – 12 : World Production of Crude Steel
(By Principal Countries)
(In '000 tonnes)
Count ry 2 0 1 1 2 0 1 2 2 0 1 3
World : Total 1 5 1 7 0 0 0 1 5 4 6 0 0 0 1 6 0 7 0 0 0
Brazil 35220 34524 34163
Canada 12891 13507 12415
China 6 8 3 8 8 3 7 1 6 5 4 2 7 7 9 0 4 1
France 15781 15607 15685
Germany 44284 42661 42645
India * 72200 76715 81213
I ran 13040 14463 15422
I ta ly 28735 27257 24079
Japan 1 0 7 6 0 1 1 0 7 2 3 2 1 1 0 5 9 5
Korea, Rep. of 68519 69073 66061
Mexico 18110 18073 18208
Russia 68400 70400 68800
Spain 15504 13639 14130
Taiwan 22879 19927 21466
Turkey 30562 35885 34658
Ukraine 35512 33509 33199
U K 9 4 7 8 9 5 7 9 11857
USA 86000 88695 86955
Other countries 1 4 8 4 0 1 1 3 8 7 1 2 1 3 6 4 0 8
Source: World Mineral Production, 2009-2013.
* India's production of crude steel in 2011-12, 2012-13 and
2013-14 was 74,291 thousand tonnes, 78,416 thousand tonnes
& 81,694 thousand tonnes, respectively.
FOREIGN TRADE
Exports
Exports of iron and steel (total) increased
by 15% in 2013-14 to 11.96 million tonnes from
10.38 million tonnes in the previous year. Steel
exports in 2013-14 comprised finished steel
(including cold rolled sheets) 5.12 million tonnes
(43%) and semi- f in i shed s tee l ( inc lud ing
steel ingots) 4.68 million tonnes (39%). Other
items together accounted for remaining 18%
exports. Exports in 2013-14 were mainly to USA
(10%), UAE (9%), Nepal (6% ), Vietnam & Saudi
Arabia (5% each) and Italy (4%). Exports of pig
and cast iron including spiegeleisen increased
sharply to 11.13 lakh tonnes in 2013-14 from 4.34
lakh tonnes in the previous year. Exports were
mainly to Korea, Rep. of (30%) , Thailand (20%),
Malaysia (17%), and Chinese Taipei/Taiwan
(15%) (Tables - 13 to 22).
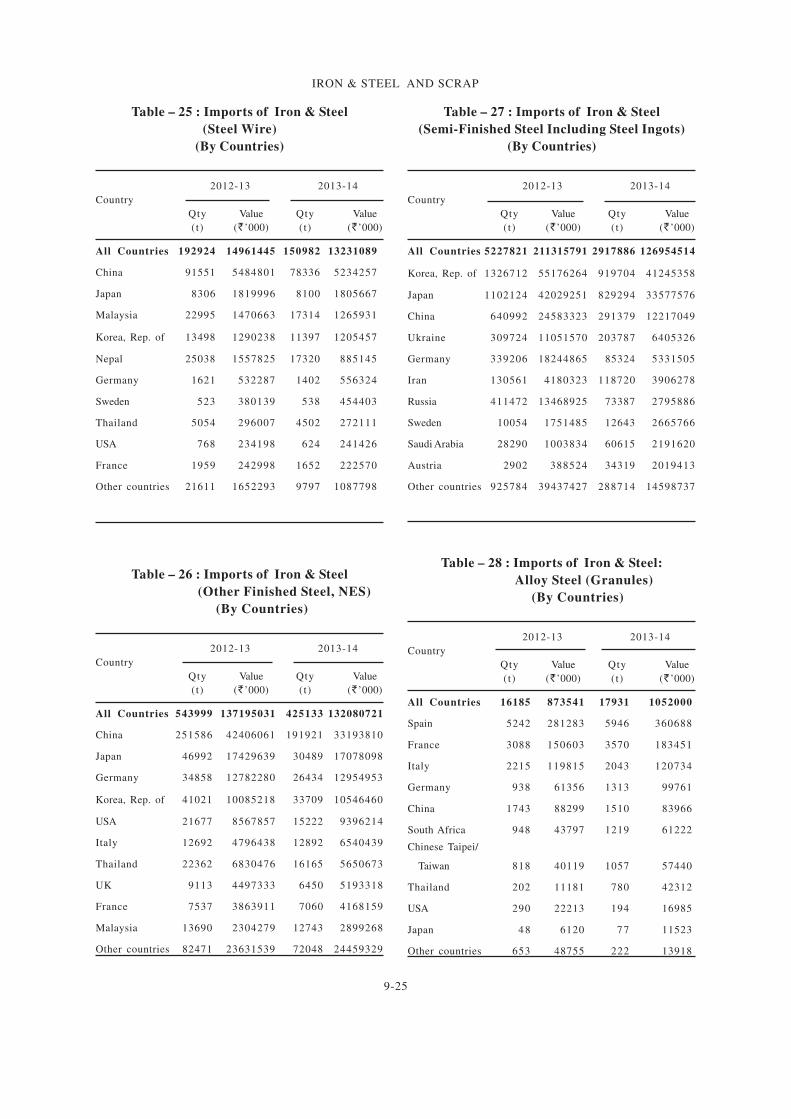
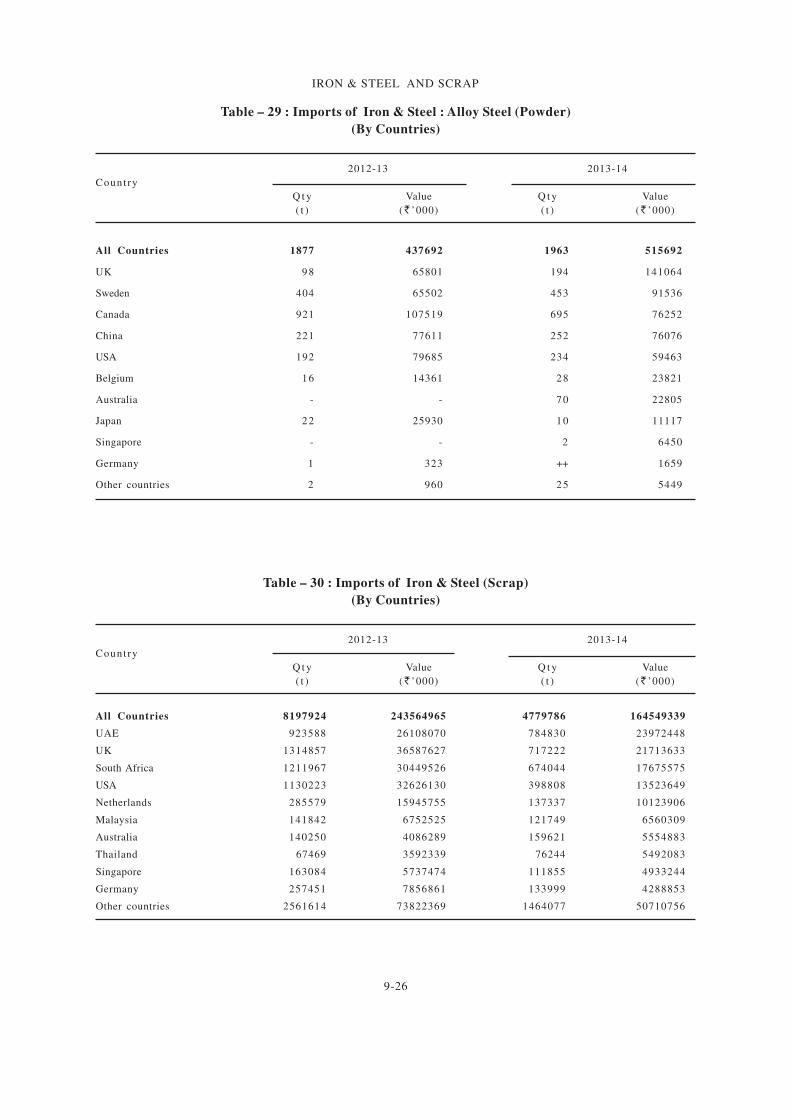
Imports
Imports of iron and steel (total) in 2013-14
decreased sharply to 12.26 million tonnes from 19.3
million tonnes in the previous year. Imports in
2013-14 comprised semi-finished steel, including
ingots 2.92 million tonnes (24%) iron and steel
scrap 4.78 million tonnes (39%) and finished steel,
including cold rolled sheets 3.04 million tonnes
(25%). Imports in 2013-14 were mainly from China
and Korea, Republic of (13% each), Japan (12%),
UAE (8%), UK and South Africa (6% each). The
impor t s o f p ig and cas t i ron ( inc lud ing
spiegeleisen) increased considerably to 69
thousand tonnes in 2013-14 from 54 thousand
tonnes in the previous year. Imports were mainly
from South Africa (24%), Indonesia (21%), Italy &
Spain (8% each) and Sweden (7%) (Tables-23
to 32).
9-22
IRON & STEEL AND SCRAP
Table – 13 : Exports of Iron & Steel (Total)
(By Countries)
2012-13 2013-14
Country
Qty Value Qty Value
(t) (L’000) (t) (L’000)
All Countries 10377748 723047018 11959782 833731286
U S A 1076200 115811007 1137353 113240135
UAE 1069868 66604717 1019247 77068137
Germany 242751 35063007 202716 34071975
Italy 355957 26643706 512345 33485294
Saudi Arabia 518607 28693842 539674 31671486
UK 168634 18424371 365468 29466143
Belgium 411123 24410599 436608 26433566
Nepal 638271 21747942 769363 25959169
Vietnam 227401 9478840 623855 23178189
Thailand 574137 21954809 442876 18470097
Other countries 5094799 354214178 5910277 420687095
Table – 14 : Exports of Iron & Steel
(Finished Steel Including CR
Sheet) (By Countries)
2012-13 2013-14
Country
Qty Value Qty Value
(t) (L’000) (t) (L’000)
All Countries 4756319 299617400 5123998 322641749
USA 601795 48467486 612770 45131642
UAE 532079 31265024 485583 29863184
Belgium 121535 9878250 187368 12815587
Italy 147812 10350499 155762 11279209
Nepal 353199 11242435 347286 11115163
Iran 88256 4624898 135197 9805194
Mexico 33812 2424818 126991 8690628
UK 40702 3239712 135606 8343508
Indonesia 146599 11264119 104210 7705542
Bangladesh 111038 5584060 208866 7613391
Other countries 2579492 161276099 2624359 170278701
Table –15 : Exports of Iron & Steel (Steel wire)
(By Countries)
2012-13 2013-14
Country
Qty Value Qty Value
(t) (L’000) (t) (L’000)
All Countries 115175 17682899 127627 18235819
USA 19130 3305466 18619 3549065
Netherlands 1863 341635 10710 1729106
Turkey 3829 640149 6015 972945
Nepal 6892 281925 20416 911955
Belgium 6496 1215861 4684 906298
Italy 7825 1329121 4975 856050
Germany 10590 2090701 3482 712614
Iran 1133 190845 3666 655368
UAE 8995 648313 8202 650968
UK 3288 633015 3182 578415
Other countries 45134 7005868 43676 6713035
Table – 16 : Exports of Iron & Steel
(Other Finished Steel, NES)
(By Countries)
2012-13 2013-14
Country
Qty Value Qty Value
(t) (L’000) (t) (L’000)
All Countries 1837420 241606755 1763329 275039552
USA 350375 53359669 295416 50294006
UAE 133549 19139446 142678 31319029
Germany 159442 22360708 137404 23228961
UK 104555 13522624 106951 15946171
Saudi Arabia 91972 9154169 84805 11710787
Canada 83816 9393344 70825 8751573
Italy 44958 7810442 38802 8054874
France 28695 4446596 28161 5901933
Brazil 30050 3827587 38817 5194847
Netherlands 25696 3970418 29767 5141313
Other countries 784312 94621752 789703 109496058
9-23
IRON & STEEL AND SCRAP
Table – 17 : Exports of Iron & Steel
(Semi-Finished Steel Including Steel Ingot)
(By Countries)
2012-13 2013-14
Country
Qty Value Qty Value
(t) (L’000) (t) (L’000)
All Countries 3448184 150846587 4677636 203432087
Vietnam 203842 7466644 605948 20867655
UAE 390753 14982348 380419 14941724
Saudi Arabia 326786 12131124 395393 14892986
Italy 153584 6534821 310952 12834185
Thailand 405351 14002585 344431 11868879
Nepal 208911 7436832 335293 11104189
Belgium 258756 9817975 225243 9759102
USA 50329 6046304 151602 9539577
Kenya 105294 3678199 168472 6041693
Netherlands 9607 1527228 21873 5905850
Other countries 1334971 67222527 1738010 85676247
Table – 18 : Exports of Iron & Steel : Alloy Steel
(Granules)
(By Countries)
2012-13 2013-14
Country
Qty Value Qty Value
(t) (L’000) (t) (L’000)
All Countries 3975 96583 456 40456
China 42 2832 92 11039
Germany - - 33 8955
USA 5 2694 52 6234
UAE 4 211 84 4804
Romania - - 72 3166
Saudi Arabia 104 5816 25 1378
Chinese Taipei/Taiwan - - 25 1246
Sudan 49 2333 15 721
Israel ++ ++ 16 716
Morocco - - 12 624
Other countries 3771 82697 30 1573
Table – 19 : Exports of Iron & Steel: Alloy Steel
(Powder)
(By Countries)
2012-13 2013-14
Country
Qty Value Qty Value
(t) (L’000) (t) (L’000)
All Countries 37 6120 13 603
Bangladesh - - 10 251
Nepal 3 345 3 164
UAE - - ++ 89
Korea, Rep. of - - ++ 79
Saudi Arabia - - ++ 18
Germany 3 538 ++ 2
Other countries 31 5237 - -
Table – 20 : Exports of Iron & Steel (Scrap)
(By Countries)
2012-13 2013-14
Country
Qty Value Qty Value
(t) (L’000) (t) (L’000)
All Countries 4226 438100 6960 540925
Sweden 1894 286251 2456 385788
Bhutan - - 2815 46110
Germany 286 36757 114 29541
Netherlands - - 214 23673
China 533 35954 113 14625
Oman 388 11484 386 12089
Bangladesh 210 3994 360 7359
UAE 150 4779 102 4214
Belarus - - 3 3860
Japan 192 8255 83 3589
Other countries 573 50626 314 10077
9-24
IRON & STEEL AND SCRAP
Table–21: Exports of Iron & Steel(Sponge iron)
(By Countries)
2012-13 2013-14
Country
Qty Value Qty Value
(t) (L’000) (t) (L’000)
All Countries 116916 2796923 166616 4138487
Bangladesh 50432 1202797 67807 1502312
Bhutan 12278 250708 18886 905368
Nepal 31667 714874 40708 794286
Malaysia 9255 229315 11823 280076
Egypt - - 11000 228149
Kuwait 5624 150368 8798 201840
Sri Lanka 3658 81740 3610 80282
Indonesia - - 2094 48232
USA 613 68423 358 39030
Ethiopia 516 13676 829 20244
Other countries 2873 85022 703 38668
Table – 22 : Exports of Pig & Cast Iron
(Including Spiegeleisen)
(By Countries)
2012-13 2013-14
Country
Qty Value Qty Value
(t) (L’000) (t) (L’000)
All Countries 433884 10218710 1113219 26350078
Korea, Rep. of 178538 4003092 330402 7668352
Thailand 31844 743634 219990 5069654
Malaysia 97174 2258556 194059 4459978
Chinese Taipei/ 10520 265235 168690 4012327
Taiwan
Saudi Arabia 349 18140 59138 1487315
UAE 2399 79724 36355 890908
China 27114 509575 32735 795891
Japan 5514 191491 27367 723533
Indonesia 33134 875704 13434 325432
Nepal 17098 403110 12370 249612
Other countries 30200 870449 18679 667076
Table - 23 : Imports of Iron & Steel (Total)
(By Countries)
2012-13 2013-14
Country
Qty Value Qty Value
(t) (L’000) (t) (L’000)
All Countries 19300675 920848863 12257822 721849461
China 2319214 155064154 1618714 127694257
Korea, Rep. of 1909881 107327331 1578448 98341244
Japan 1782715 108012517 1424333 97173228
Germany 903122 60692191 381711 39482946
USA 1330321 56659781 539317 36097798
UAE 1093790 34661478 940572 31028107
UK 1410302 47113919 761144 30727243
South Africa 1259986 33210319 705477 19713118
Italy 129722 16785293 66613 15607557
Thailand 116787 12768963 123604 13445807
Other countries 7044835 288552917 4117889 212538156
Table – 24: Imports of Iron & Steel
(Finished Steel Including CR
Sheet) (By Countries)
2012-13 2013-14
Country
Qty Value Qty Value
(t) (L’000) (t) (L’000)
All Countries 3634316 262406713 3035485 241891701
China 1190742 71688833 935955 66056358
Japan 600115 44387178 537364 41206828
Korea, Rep. of 427099 34808024 518127 39556112
Germany 198550 16553228 100152 13337134
USA 144714 13260346 107710 11407813
Italy 46498 7868372 31129 6636975
France 54927 6769009 28819 6554945
Belgium 93639 6095904 81304 6192838
Russia 171751 10133069 68041 5572405
Ukraine 85061 3123018 154738 5333592
Other countries 621220 47719732 472146 40036701
9-25
IRON & STEEL AND SCRAP
Table – 25 : Imports of Iron & Steel
(Steel Wire)
(By Countries)
2012-13 2013-14
Country
Qty Value Qty Value
(t) (L’000) (t) (L’000)
All Countries 192924 14961445 150982 13231089
China 91551 5484801 78336 5234257
Japan 8306 1819996 8100 1805667
Malaysia 22995 1470663 17314 1265931
Korea, Rep. of 13498 1290238 11397 1205457
Nepal 25038 1557825 17320 885145
Germany 1621 532287 1402 556324
Sweden 523 380139 538 454403
Thailand 5054 296007 4502 272111
USA 768 234198 624 241426
France 1959 242998 1652 222570
Other countries 21611 1652293 9797 1087798
Table – 26 : Imports of Iron & Steel
(Other Finished Steel, NES)
(By Countries)
2012-13 2013-14
Country
Qty Value Qty Value
(t) (L’000) (t) (L’000)
All Countries 543999 137195031 425133 132080721
China 251586 42406061 191921 33193810
Japan 46992 17429639 30489 17078098
Germany 34858 12782280 26434 12954953
Korea, Rep. of 41021 10085218 33709 10546460
USA 21677 8567857 15222 9396214
Italy 12692 4796438 12892 6540439
Thailand 22362 6830476 16165 5650673
UK 9113 4497333 6450 5193318
France 7537 3863911 7060 4168159
Malaysia 13690 2304279 12743 2899268
Other countries 82471 23631539 72048 24459329
Table – 27 : Imports of Iron & Steel
(Semi-Finished Steel Including Steel Ingots)
(By Countries)
2012-13 2013-14
Country
Qty Value Qty Value
(t) (L’000) (t) (L’000)
All Countries 5227821 211315791 2917886 126954514
Korea, Rep. of 1326712 55176264 919704 41245358
Japan 1102124 42029251 829294 33577576
China 640992 24583323 291379 12217049
Ukraine 309724 11051570 203787 6405326
Germany 339206 18244865 85324 5331505
Iran 130561 4180323 118720 3906278
Russia 411472 13468925 73387 2795886
Sweden 10054 1751485 12643 2665766
Saudi Arabia 28290 1003834 60615 2191620
Austria 2902 388524 34319 2019413
Other countries 925784 39437427 288714 14598737
Table – 28 : Imports of Iron & Steel:
Alloy Steel (Granules)
(By Countries)
2012-13 2013-14
Country
Qty Value Qty Value
(t) (L’000) (t) (L’000)
All Countries 16185 873541 17931 1052000
Spain 5242 281283 5946 360688
France 3088 150603 3570 183451
Italy 2215 119815 2043 120734
Germany 938 61356 1313 99761
China 1743 88299 1510 83966
South Africa 948 43797 1219 61222
Chinese Taipei/
Taiwan 818 40119 1057 57440
Thailand 202 11181 780 42312
USA 290 22213 194 16985
Japan 48 6120 77 11523
Other countries 653 48755 222 13918
9-26
IRON & STEEL AND SCRAP
Table – 29 : Imports of Iron & Steel : Alloy Steel (Powder)
(By Countries)
2012-13 2013-14
Country
Q t y Value Q t y Value
( t ) (L’000) ( t ) (L’000)
All Countries 1877 437692 1963 515692
UK 98 65801 194 141064
Sweden 404 65502 453 91536
Canada 921 107519 695 76252
China 221 77611 252 76076
USA 192 79685 234 59463
Belgium 16 14361 28 23821
Australia - - 70 22805
Japan 22 25930 10 11117
Singapore - - 2 6450
Germany 1 323 ++ 1659
Other countries 2 960 25 5449
Table – 30 : Imports of Iron & Steel (Scrap)
(By Countries)
2012-13 2013-14
Country
Q t y Value Q t y Value
( t ) (L’000) ( t ) (L’000)
All Countries 8197924 243564965 4779786 164549339
UAE 923588 26108070 784830 23972448
UK 1314857 36587627 717222 21713633
South Africa 1211967 30449526 674044 17675575
USA 1130223 32626130 398808 13523649
Netherlands 285579 15945755 137337 10123906
Malaysia 141842 6752525 121749 6560309
Australia 140250 4086289 159621 5554883
Thailand 67469 3592339 76244 5492083
Singapore 163084 5737474 111855 4933244
Germany 257451 7856861 133999 4288853
Other countries 2561614 73822369 1464077 50710756
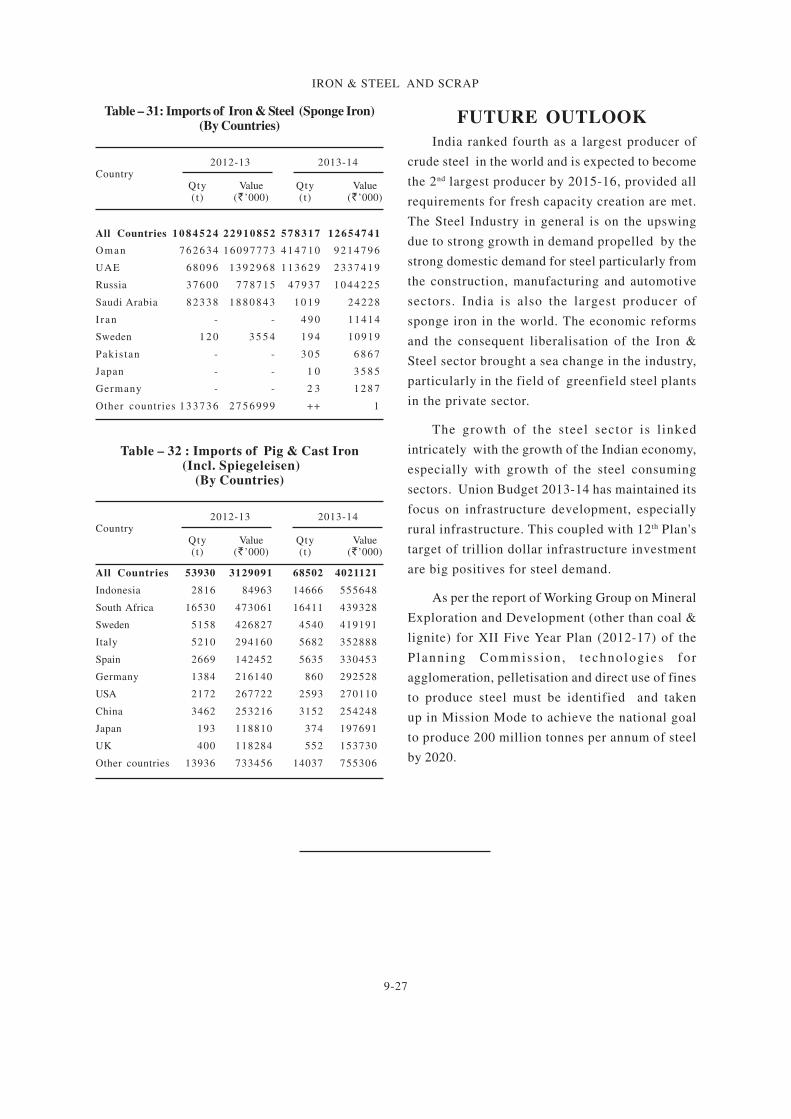
9-27
IRON & STEEL AND SCRAP
Table – 31: Imports of Iron & Steel (Sponge Iron)(By Countries)
2012-13 2013-14Country
Qty Value Qty Value(t) (L’000) (t) (L’000)
All Countries 1 0 8 4 5 2 4 22910852 5 7 8 3 1 7 12654741
Oman 7 6 2 6 3 4 16097773 4 1 4 7 1 0 9 2 1 4 7 9 6
UAE 68096 1 3 9 2 9 6 8 1 1 3 6 2 9 2 3 3 7 4 1 9
Russia 37600 7 7 8 7 1 5 47937 1 0 4 4 2 2 5
Saudi Arabia 82338 1 8 8 0 8 4 3 1 0 1 9 24228
I ran - - 4 9 0 11414
Sweden 1 2 0 3 5 5 4 1 9 4 10919
Pakis tan - - 3 0 5 6 8 6 7
Japan - - 1 0 3 5 8 5
Germany - - 2 3 1 2 8 7
Other countries 1 3 3 7 3 6 2 7 5 6 9 9 9 ++ 1
Table – 32 : Imports of Pig & Cast Iron (Incl. Spiegeleisen)
(By Countries)
2012-13 2013-14Country
Qty Value Qty Value(t) (L’000) (t) (L’000)
All Countries 53930 3129091 68502 4021121
Indonesia 2816 84963 14666 555648
South Africa 16530 473061 16411 439328
Sweden 5158 426827 4540 419191
Italy 5210 294160 5682 352888
Spain 2669 142452 5635 330453
Germany 1384 216140 860 292528
USA 2172 267722 2593 270110
China 3462 253216 3152 254248
Japan 193 118810 374 197691
UK 400 118284 552 153730
Other countries 13936 733456 14037 755306
FUTURE OUTLOOK
India ranked fourth as a largest producer of
crude steel in the world and is expected to become
the 2nd largest producer by 2015-16, provided all
requirements for fresh capacity creation are met.
The Steel Industry in general is on the upswing
due to strong growth in demand propelled by the
strong domestic demand for steel particularly from
the construction, manufacturing and automotive
sectors. India is also the largest producer of
sponge iron in the world. The economic reforms
and the consequent liberalisation of the Iron &
Steel sector brought a sea change in the industry,
particularly in the field of greenfield steel plants
in the private sector.
The growth of the steel sector is l inked
intricately with the growth of the Indian economy,
especially with growth of the steel consuming
sectors. Union Budget 2013-14 has maintained its
focus on infrastructure development, especially
rural infrastructure. This coupled with 12th Plan's
target of trillion dollar infrastructure investment
are big positives for steel demand.
As per the report of Working Group on Mineral
Exploration and Development (other than coal &
lignite) for XII Five Year Plan (2012-17) of the
Planning Commiss ion , t echnolog ies fo r
agglomeration, pelletisation and direct use of fines
to produce steel must be identified and taken
up in Mission Mode to achieve the national goal
to produce 200 million tonnes per annum of steel
by 2020.
Recommended