This thesis has been submitted in fulfilment of the requirements for a postgraduate degree
(e.g. PhD, MPhil, DClinPsychol) at the University of Edinburgh. Please note the following
terms and conditions of use:
This work is protected by copyright and other intellectual property rights, which are
retained by the thesis author, unless otherwise stated.
A copy can be downloaded for personal non-commercial research or study, without
prior permission or charge.
This thesis cannot be reproduced or quoted extensively from without first obtaining
permission in writing from the author.
The content must not be changed in any way or sold commercially in any format or
medium without the formal permission of the author.
When referring to this work, full bibliographic details including the author, title,
awarding institution and date of the thesis must be given.
Student-generated content:
Investigating student use of PeerWise
Alison Elizabeth Kay
A thesis submitted in fulfilment of the requirements
for the degree of Doctor of Philosophy
to the
University of Edinburgh
June 2016

i
Abstract
In recent years an increasing focus has been placed on the development of students’
skills of critical thinking, problem solving and independent learning, throughout their time at
university. There is an increasing shift towards incorporating activities which promote
students’ active engagement with course materials – with the intention of promoting a deeper
understanding of their chosen subject. Many tools and techniques are available that facilitate
students’ transition from the passive recipient of knowledge, to a central, active actor in the
learning process.
One such tool, PeerWise, is an online, free to use application where students are
encouraged to write multiple choice questions for their peers to answer, resulting in a bank
of questions for students to test their knowledge and understanding. Students are given
opportunities to give feedback to question authors on the quality of the question, in the form
of a numerical rating or a qualitative comment, which provides further scope for students to
engage in discussion about the question. It is hypothesised that actively engaging with course
material will promote a deeper understanding of its content and will develop students’ skills
of problem solving and critical thinking.
The research in this thesis explores the relationship between engagement with
PeerWise and performance in end of course examinations in six courses (physics, chemistry
and biology), across three academic years within three research intensive UK universities.
This work aims to unpick the nature of student interactions on PeerWise, and the extent to
which engagement with each activity on the system is associated with attainment, when
controlling for a student’s prior ability and other relevant factors such as their gender.
Student views on engaging with the system have also been gathered to understand the degree
to which students find PeerWise useful to their learning, and the ways in which they interact
with the platform.
Although the results paint a complex picture of the relationship between PeerWise
use and attainment, in most courses, and for most ability levels, students who engage to a
higher level with PeerWise achieve a higher exam score than their lower engaging peers.
There is also often a significant, positive correlation between engaging with PeerWise and
end of course exam score which persists, even when controlling for a student’s prior ability.

ii
Although it would seem to be that answering questions and writing high quality feedback is
more often associated with attainment than writing questions and receiving feedback, the
results suggest that engagement across all activities is most beneficial to students –
indicating that overall engagement with the task is key to student learning.
iii
Lay Summary
On graduation, students are expected to have gained not only subject specific skills
and knowledge, but also skills necessary to succeed in the modern workplace, such as the
ability to think critically; to solve problems; and to work independently. It is generally
accepted that students learn most effectively when they are actively engaged in learning
activities, as opposed to being passive recipients of knowledge.
PeerWise is an online, free to use application which seeks to promote active
engagement with course materials. Students are encouraged to write multiple choice
questions for their peers to answer. Writing multiple choice questions is cognitively
demanding – students need to truly understand a concept in order to write a question about it.
Writing a question will therefore encourage students to revise course materials and will
require them to think about possible errors other students may make in answering the
problem, in order to construct plausible distractors and write clear explanations for why their
proposed solution is correct. Contributed questions then form a bank of multiple choice
questions for students to answer and to test their knowledge. Once a question has been
answered, students then have the opportunity to comment on the quality of the question and
explanation. This requires students to think critically about the question and perhaps make
suggestions for improvement – a demanding task for the commenter. The question author
then gains feedback which they can apply to their future work. Each aspect of the system,
writing questions, answering questions, providing and receiving feedback has potential to
increase the knowledge and understanding of students and to develop their skills of problem
solving and critical thinking.
The research in this thesis explores the relationship between engagement with
PeerWise and performance in end of course examinations in six courses (physics, chemistry
and biology), across three academic years within three research intensive UK universities.
This work aims to unpick the relationship between engaging in each of the activities in
PeerWise and student attainment and to investigate the nature of the student exchanges on
the system. Finally, student views on PeerWise will be examined to determine how students
use PeerWise and the degree to which they believe PeerWise benefits them.
iv
Students have a mixed view of PeerWise. Some students feel that it does not benefit
their learning – they cannot understand the point of the exercise and they would rather
engage in non-collaborative exercises. Other students are extremely positive about the
system, recognising that whilst question authoring is challenging, it forces them to think
more deeply about their understanding. Despite the mixed student views as to the benefits of
PeerWise, overall, across all courses, there is a positive association between engaging in
each of the four PeerWise activities and end of course exam performance. Students who
display a greater level of engagement tend to have higher exam scores than students with
lower engagement levels. For each individual course, the relationships are more complicated,
however, in most years of most courses, this positive relationship exists. Furthermore, the
relationship often remains, even when accounting for other factors that influence exam score
such as prior ability and a student’s gender. When aggregating engagement levels into an
overall measure of PeerWise activity, the associations between exam score and PeerWise
activity are in general stronger, indicating that benefits from PeerWise are realised through
engaging with the system as a whole.
v
Declaration
Except where otherwise stated, the research undertaken in this thesis was the
unaided work of the author. Where the work was done in collaboration with others, a
significant contribution was made by the author. The candidate confirms the appropriate
credit has been given within the thesis where reference has been made to the work of others.
Parts of this work, discussed in Chapter 4, have been written up for publication in
the International Journal of Science Education:
Hardy J, Bates S P, Casey M M, Galloway K W, Galloway R K, Kay A E, Kirsop P and
McQueen H A 2014 Student-Generated Content: Enhancing learning through sharing
multiple-choice questions Int. J. Sci. Educ. 1–15
The work contained in this thesis extends the published work with the inclusion of
additional data and minor modification of the method of analysis.
Alison Elizabeth Kay
June 2016

vi
vii
Acknowledgements
First and foremost I would like to thank Professor Judy Hardy for her invaluable
advice and generosity with her time, in (often very lengthy) face-to-face meetings; in
numerous late night e-mail conversations; and in reading and commenting on many drafts of
this work. I am most grateful for her encouragement to develop and purse my own ideas; and
for reminding me not to lose sight of the bigger picture. Special thanks must also be given to
Dr. Ross Galloway for his constant positivity and his willingness to engage in somewhat off-
tangent debate and discussion (often over a whisky or two!). I am also grateful to past and
present members of the Edinburgh Physics Education Research Group – especially Robyn
Donnelly, Marsali Wallace, Kate Slaughter and Karon McBride for impromptu physics
lessons, chocolatey snacks and jogs around Blackford Hill.
This research could not have been undertaken without the collaboration of a number
of people. I would like to thank everyone with whom I have had the pleasure to work with
over the past four years: Paul Denny at the University of Auckland who provided all the
PeerWise metrics and developed the system; Dr Ross Galloway, Dr Peter Kirsop, Dr Heather
McQueen, Dr Cathy Shields, Dr Kyle Galloway and Dr Morag Casey for giving me access to
course and student data and for answering many questions about the structure of their
courses; and to all the students whose data I have analysed. A special thank you must also be
extended to Professor Lindsay Paterson and Dr Paul Norris whose statistical advice and
interest in the project has been much appreciated, and without whom the multilevel
modelling would not have been undertaken. I am also extremely grateful to the Higher
Education Academy, without whose funding this work would not have taken place, and to
Professor Simon Bates for giving a social scientist the opportunity to join EdPer.
Thank you to my wonderful friends for their unconditional support – even when I
have gone off the radar; for their willingness to proofread; talk through my thoughts; or be
complicit in procrastination. Special thanks go to Kate Macleod for all the little (and not so
little) things that have made the thesis writing process much easier. Thank you also to
Philippa Smith for checking-in regularly to make sure I am still alive. Once again, many
thanks must go to Robyn Donnelly for being a great office-mate and friend, and for always
ensuring I make the last train home! Huge thanks are also due to Ross Whittaker who has

viii
helped me burn off my stresses at the gym by making me lift heavy objects and run the ring
of doom! Writing this thesis would have been a far more protracted process without my
regular visits to Pret A Manger, St Andrews (AKA ‘the office’), so big thanks to Becca,
Steph and Siobhan for the freebie coffees and good chat during the final months of writing
up.
My most heartfelt love and thanks go to my family – my mother Elizabeth, my
brother Gordon, and my grandma Vena – who have always been at the end of the phone,
giving me moral support and ensuring I maintain a sense of perspective. I would also like to
thank my late father Ronnie, for all of the opportunities he and my mother afforded me
whilst growing up, and for the sacrifices they made to enable me to pursue my interests. My
parents’ love for, and commitment to, education has been one of the greatest gifts they have
given me.
Finally, thank you to Euan, for all your love and support, both practical and
emotional. I am so very grateful for the huge amount of time you have spent listening to me
practise talks; editing drafts of this thesis; and taking on my battles with Microsoft Word!
Thank you for your insights and suggestions, your willingness to discuss my findings and
help me work through my problems; and for encouraging me to aim high and embark upon
this journey in the first instance. Your faith in me is unfailing, even when my faith in myself
falters, and for that I am truly grateful.
ix
Contents
Abstract i
Lay Summary iii
Declaration v
Acknowledgements vii
Contents ix
List of Tables xiii
List of Figures xxiii
Chapter 1 Introduction and motivation 1
1.1 Introducing PeerWise ..................................................................................................... 4
1.2 Asking questions ............................................................................................................ 5
1.2.1 Student-generated questions ................................................................................... 6
1.2.2 The question writing process .................................................................................. 7
1.2.3 The benefits and student perceptions of student-generated questions .................... 9
1.3 Answering questions .................................................................................................... 11
1.3.1 Question answering as a diagnostic tool ............................................................... 11
1.3.2 Student perceptions of the benefit of question answering .................................... 12
1.4 Peer assessment and feedback...................................................................................... 13
1.4.1 The benefits of giving feedback ............................................................................ 15
1.4.2 The benefits of receiving feedback ....................................................................... 17
1.4.3 Student views on peer feedback ............................................................................ 19
1.5 Combined effect of question posing, answering and feedback provision .................... 20
1.6 The impact of technology on student question generation and feedback .................... 21
1.7 The PeerWise system ................................................................................................... 24
1.7.1 PeerWise implementation and usage .................................................................... 24
1.7.2 Characteristics of student submissions ................................................................. 25
1.7.3 PeerWise activity and student achievement .......................................................... 28
1.7.4 Student perceptions of the PeerWise system ........................................................ 30
1.8 Thesis structure ............................................................................................................ 33
Chapter 2 Educational context 35
2.1 The PeerWise environment .......................................................................................... 35
2.1.1 Student interface ................................................................................................... 35
x
2.1.2 Administrative staff view ...................................................................................... 44
2.2 Integration of PeerWise ................................................................................................ 48
2.3 Courses under study ..................................................................................................... 51
2.3.1 Physics 1A ............................................................................................................. 51
2.3.2 Physics 1B ............................................................................................................. 52
2.3.3 Chemistry 1B ......................................................................................................... 53
2.3.4 Genes and Gene Action ......................................................................................... 53
2.3.5 Glasgow Physics (Physics 2) ................................................................................. 54
2.3.6 Nottingham Chemistry (Foundations of Chemistry) ............................................. 55
Chapter 3 Student data and statistical tests 57
3.1 Student data .................................................................................................................. 57
3.1.1 Quantitative data.................................................................................................... 57
3.1.2 Qualitative data...................................................................................................... 59
3.2 Data cleaning ................................................................................................................ 59
3.2.1 Dataset construction for the analysis of student attainment .................................. 60
3.2.2 Network analysis ................................................................................................... 62
3.3 Variable description ..................................................................................................... 62
3.3.1 Exam score ............................................................................................................ 62
3.3.2. Prior ability ........................................................................................................... 63
3.3.3 Scottish-schooled................................................................................................... 63
3.3.4 Subject major ......................................................................................................... 65
3.3.5 Gender ................................................................................................................... 65
3.4 Statistical tests .............................................................................................................. 66
3.4.1 Pearson’s product moment correlation .................................................................. 68
3.4.2 t-Tests .................................................................................................................... 68
3.4.3 Regression ............................................................................................................. 70
3.4.4 Moderation analysis .............................................................................................. 71
3.4.5 Multilevel modelling ............................................................................................. 71
3.4.6 Network analysis ................................................................................................... 74
Chapter 4 Initial exploration of student use of the PeerWise system 77
4.1 Initial exploration of student learning networks ........................................................... 77
4.1.1 Nature of the PeerWise network............................................................................ 79
4.1.2 Networks and social capital ................................................................................... 81
4.1.3 Data Collection and methods ................................................................................ 82
4.1.4 Results and discussion ........................................................................................... 84
4.2 Preliminary exploration of the relationship between PeerWise engagement and exam
performance ........................................................................................................................ 88
4.2.1 Method and descriptive statistics........................................................................... 89
xi
4.2.2 Results and discussion .......................................................................................... 94
4.2.3 Limitations of the analysis .................................................................................... 99
Chapter 5 Associations between question authoring, answering and student performance101
5.1 Structure of regression analyses ................................................................................. 101
5.1.1 Model construction ............................................................................................. 102
5.1.2 Assumption checking .......................................................................................... 104
5.1.3 Interaction analyses ............................................................................................. 106
5.1.4 Multilevel modelling ........................................................................................... 107
5.2 Model interpretation ................................................................................................... 111
5.3 Relationship between number of questions authored and exam score ....................... 114
5.3.1 Multilevel modelling results ............................................................................... 119
5.3.2 Summary of relationship between question authoring and exam score .............. 121
5.4. Relationship between number of questions answered and exam score ..................... 125
5.4.1 Multilevel modelling results ............................................................................... 130
5.4.2 Summary of relationship between question answering and exam score ............. 131
Chapter 6 Associations between commenting and student performance 135
6.1 Comment coding ........................................................................................................ 135
6.1.1 Coding scheme .................................................................................................... 136
6.1.2 Creating measures ............................................................................................... 139
6.2 Comments given ........................................................................................................ 140
6.2.1 Multilevel modelling results ............................................................................... 146
6.2.2 Summary of relationship between giving comments and exam score ................ 148
6.3 Comments received .................................................................................................... 151
6.3.1 Multilevel modelling results ............................................................................... 158
6.3.2 Summary of relationship between comments received and exam score ............. 160
Chapter 7 Associations between overall PeerWise engagement and student performance 165
7.1 Multiple measure of PeerWise engagement ............................................................... 165
7.2 Relationship between the multiple measure and exam score ..................................... 169
7.2.1 Multilevel modelling results ............................................................................... 174
7.3 Summary of relationship between the multiple measure and exam score ................. 176
7.4 Summary and discussion of regression analyses ....................................................... 179
Chapter 8 Student views of PeerWise 183
8.1 Rationale and methods ............................................................................................... 183
8.2 End of course questionnaires: closed responses......................................................... 188
8.3 Themes from open responses questions ..................................................................... 191
8.3.1 Community development .................................................................................... 191
8.3.2 Compulsory nature .............................................................................................. 193
8.3.3 Emotional response ............................................................................................. 195
xii
8.3.4 Quality ................................................................................................................. 197
8.3.5 Skills and learning ............................................................................................... 200
8.3.6 Usefulness ........................................................................................................... 205
8.4 Discussion .................................................................................................................. 207
Chapter 9 Conclusions and outlook 211
9.1 Summary of results ..................................................................................................... 212
9.2 Implications for teaching staff .................................................................................... 217
9.3 Implications for future research ................................................................................. 219
9.4 Conclusion .................................................................................................................. 220
Bibliography 223
Appendix A Descriptive statistics of quantitative variables 235
Appendix B Comparison of the attainment of students in school level mathematics and
physics 243
Physics 1A 2011–12 ......................................................................................................... 245
Obtaining an A or A* at school vs. obtaining other grades .......................................... 245
Obtaining an A at Advanced Higher vs. obtaining an A or A* at A-Level .................. 245
Physics 1A 2012–13 ......................................................................................................... 246
Obtaining an A or A* at school vs. obtaining other grades .......................................... 246
Obtaining an A at Advanced Higher vs. obtaining an A or A* at A-Level .................. 246
Appendix C t-Tests comparing the differences in exam performance between high and low
PeerWise activity groups 247
Appendix D Multiple regression models examining the relationship between question
authoring and exam score 255
Appendix E Multiple regression models examining the relationship between question
answering and exam score 275
Appendix F Multiple regression models examining the relationship between comment
authoring and exam score 295
Appendix G Multiple regression models examining the relationship between comments
received and exam score 315
Appendix H Multiple regression models examining the relationship between the multiple
measure of PeerWise activity and exam score 335
Appendix I Themes and codes emerging from student responses 355
Publications 363
xiii
List of Tables
Table 1: PeerWise requirements and marking scheme by course in each academic
year studied. ........................................................................................................ 50 Table 2: Physics 1A student demographics ...................................................................... 52 Table 3: Physics 1B student demographics ...................................................................... 53 Table 4: Chemistry 1B student demographics .................................................................. 53 Table 5: Genes and Gene Action student demographics .................................................. 54 Table 6: Glasgow Physics student demographics ............................................................. 54 Table 7: Nottingham Chemistry student demographics ................................................... 55 Table 8: Proportion of students, questions, answers and comments included in
student attainment datasets. ................................................................................ 61 Table 9: Summary network level metrics and paired t-test results comparing
differences between levels of participation in the answer and comment
networks ............................................................................................................. 86 Table 10: Correlations between students’ normalised degrees from the answer
network and their personal characteristics.......................................................... 87 Table 11: Physics 1A PeerWise engagement measures...................................................... 90 Table 12: Physics 1B PeerWise engagement measures ...................................................... 91 Table 13: Chemistry 1B PeerWise engagement measures ................................................. 91 Table 14: Genes and Gene Action PeerWise engagement measures .................................. 91 Table 15: Glasgow Physics PeerWise engagement measures ............................................ 92 Table 16: Nottingham Chemistry PeerWise engagement measures ................................... 92 Table 17: Comparison of PeerWise activity to expected levels based on course
requirement ......................................................................................................... 93 Table 18: Quartiles in which a significant difference in exam score exists between
HPA and LPA students for each PeerWise measure of activity ......................... 95 Table 19: Distribution of significant differences in exam score across quartiles and
activities.............................................................................................................. 96 Table 20: Correlation between pre-score and PeerWise engagement levels .................... 104 Table 21: Rank order of exam score residuals from overall mean exam score ................ 109 Table 22: Example table outlining regression results for the relationship between
number of questions authored and exam score ................................................. 112 Table 23: Question authoring: significant results from simple and multiple regression
analysis ............................................................................................................. 115 Table 24: Chemistry 1B 2012–13 interactions ................................................................. 117 Table 25: Chemistry 1B 2013–14 interactions ................................................................. 117 Table 26: Regression analysis of multiple choice mark on number of questions
authored 2011–12 ............................................................................................. 118 Table 27: Regression analysis of multiple choice score on number of questions
authored 2012–13 ............................................................................................. 118 Table 28: Regression analysis of multiple choice score on number of questions
authored 2013–14 ............................................................................................. 118 Table 29: Rank order of questions authored slope residuals ............................................ 120 Table 30: Rank order of pre-score slope residuals ........................................................... 121
xiv
Table 31: Multilevel models demonstrating course effects on the relationship
between question authoring and exam score ................................................... 124 Table 32: Question answering: significant results from simple regressions, multiple
regressions and moderation analyses ............................................................... 125 Table 33: Regression analysis of multiple choice score on number of questions
answered 2011–12 ........................................................................................... 127 Table 34: Regression analysis of multiple choice score on number of questions
answered 2012–13 ........................................................................................... 128 Table 35: Regression analysis of multiple choice score on number of questions
answered 2013–14 ........................................................................................... 128 Table 36: Glasgow Physics 2013–14 interactions ........................................................... 129 Table 37: Nottingham Chemistry 2013–14 interactions .................................................. 129 Table 38: Rank order of pre-score slope residuals ........................................................... 131 Table 39: Multilevel models demonstrating course effects on the relationship
between question answering and exam score .................................................. 133 Table 40: Original seven-point comment coding scheme ................................................ 137 Table 41: Three-point comment coding scheme .............................................................. 139 Table 42: Frequencies of codes at each cognitive level for each course .......................... 140 Table 43: Relationship between number of comments at each cognitive level given
and exam performance ..................................................................................... 141 Table 44: Giving quality comments: significant results from simple regressions,
multiple regressions and moderation analyses ................................................. 142 Table 45: Physics 1A 2012–13 interactions ..................................................................... 143 Table 46: Regression analysis of multiple choice score on number of comments
authored 2011–12 ............................................................................................ 144 Table 47: Regression analysis of multiple choice score on number of comments
authored 2012–13 ............................................................................................ 144 Table 48: Regression analysis of multiple choice score on number of comments
authored 2013–14 ............................................................................................ 145 Table 49: Nottingham Chemistry 2013–14 interactions .................................................. 146 Table 50: Rank order of comments out slope residuals ................................................... 147 Table 51: Rank order of pre-score slope residuals ........................................................... 148 Table 52: Multilevel models demonstrating course effects on the relationship
between giving comments and exam score ...................................................... 150 Table 53: Relationship between number of comments at each cognitive level received
and exam performance ..................................................................................... 152 Table 54: Receiving quality comments: significant results from simple regressions,
multiple regressions and moderation analyses ................................................. 153 Table 55: Chemistry 1B 2011–12 interactions................................................................. 155 Table 56: Chemistry 1B 2013–14 interactions................................................................. 155 Table 57: Regression analysis of multiple choice score on number of comments
received 2011–12 ............................................................................................. 156 Table 58: Regression analysis of multiple choice score on number of comments
received 2012–13 ............................................................................................. 156 Table 59: Regression analysis of multiple choice score on number of comments
received 2013–14 ............................................................................................. 157 Table 60: Nottingham Chemistry 2013–14 interactions .................................................. 158 Table 61: Rank order of comments in slope residuals ..................................................... 159 Table 62: Rank order of pre-score slope residuals ........................................................... 160 Table 63: Multilevel models demonstrating course effects on the relationship
between receiving comments and exam score ................................................. 163 Table 64: Principal component analysis results ............................................................... 168 Table 65: Scale reliability results ..................................................................................... 168
xv
Table 66: Multiple measure: significant results from simple regressions, multiple
regressions and moderation analyses ................................................................ 169 Table 67: Physics 1A 2012–13 interactions ..................................................................... 170 Table 68: Chemistry 1B 2012–13 interactions ................................................................. 171 Table 69: Regression analysis of multiple choice score on the multiple measure score
2011–12 ............................................................................................................ 172 Table 70: Regression analysis of multiple choice score on the multiple measure score
2012–13 ............................................................................................................ 172 Table 71: Regression analysis of multiple choice score on the multiple measure score
2013–14 ............................................................................................................ 173 Table 72: Nottingham 2013–14 interactions .................................................................... 174 Table 73: Rank order of MM slope residuals ................................................................... 175 Table 74: Rank order of pre-score slope residuals ........................................................... 176 Table 75: Multilevel models demonstrating course effects on the relationship
between the multiple measure and exam score ................................................ 178 Table 76: Summary of multiple regression partial correlation coefficients measuring
the unique contribution of PeerWise activity to exam score ............................ 180 Table 77: Summary of key results from Chapters 5, 6 and 7 ........................................... 181 Table 78: Number of times PeerWise is mentioned as the best or worst aspect of the
course................................................................................................................ 191 Table 79: Physics 1A 2011–12 – Descriptive statistics for quantitative variables ........... 237 Table 80: Physics 1A 2012–13 – Descriptive statistics for quantitative variables ........... 237 Table 81: Physics 1A 2013–14 – Descriptive statistics for quantitative variables ........... 237 Table 82: Physics 1B 2011–12 – Descriptive statistics for quantitative variables ........... 238 Table 83: Physics 1B 2012–13 – Descriptive statistics for quantitative variables ........... 238 Table 84: Physics 1B 2013–14 – Descriptive statistics for quantitative variables ........... 238 Table 85: GGA 2011–12 – Descriptive statistics for quantitative variables. ................... 239 Table 86: GGA 2012–13 – Descriptive statistics for quantitative variables. ................... 239 Table 87: GGA 2013–14 – Descriptive statistics for quantitative variables. ................... 239 Table 88: Chemistry 1B 2011–12 – Descriptive statistics for quantitative variables. ...... 240 Table 89: Chemistry 1B 2012–13 – Descriptive statistics for quantitative variables. ...... 240 Table 90: Chemistry 1B 2013–14 – Descriptive statistics for quantitative variables. ...... 240 Table 91: Glasgow Physics 2011–12 – Descriptive statistics for quantitative
variables............................................................................................................ 241 Table 92: Glasgow Physics 2012–13 – Descriptive statistics for quantitative
variables............................................................................................................ 241 Table 93: Glasgow Physics 2013–14 – Descriptive statistics for quantitative
variables............................................................................................................ 241 Table 94: Nottingham Chemistry 2011–12 – Descriptive statistics for quantitative
variables............................................................................................................ 242 Table 95: Nottingham Chemistry 2012–13 – Descriptive statistics for quantitative
variables............................................................................................................ 242 Table 96: Nottingham Chemistry 2013–14 – Descriptive statistics for quantitative
variables............................................................................................................ 242 Table 97: Analysis of the differences in exam performance between high and low
PeerWise activity groups in Physics 1A. .......................................................... 249 Table 98: Analysis of the differences in exam performance between high and low
PeerWise activity groups in Physics 1B. .......................................................... 250 Table 99: Analysis of the differences in exam performance between high and low
PeerWise activity groups in Chemistry 1B. ..................................................... 251 Table 100: Analysis of the differences in exam performance between high and low
PeerWise activity groups in Genes and Gene Action. ...................................... 252
xvi
Table 101: Analysis of the differences in exam performance between high and low
PeerWise activity groups in Glasgow Physics. ................................................ 253 Table 102: Analysis of the differences in exam performance between high and low
PeerWise activity groups in Nottingham Chemistry. ...................................... 254 Table 103: Physics 1A 2011–12. Linear model of predictors of exam score, with 95%
bias corrected and accelerated confidence intervals. Confidence intervals
and standard errors based on 1000 bootstrap samples. .................................... 257 Table 104: Physics 1A 2012–13. Linear model of predictors of exam score, with 95%
bias corrected and accelerated confidence intervals. Confidence intervals
and standard errors based on 1000 bootstrap samples. .................................... 258 Table 105: Physics 1A 2013–14. Linear model of predictors of exam score, with 95%
bias corrected and accelerated confidence intervals. Confidence intervals
and standard errors based on 1000 bootstrap samples. .................................... 259 Table 106: Physics 1B 2011–12. Linear model of predictors of exam score, with 95%
bias corrected and accelerated confidence intervals. Confidence intervals
and standard errors based on 1000 bootstrap samples. .................................... 260 Table 107: Physics 1B 2012–13. Linear model of predictors of exam score, with 95%
bias corrected and accelerated confidence intervals. Confidence intervals
and standard errors based on 1000 bootstrap samples. .................................... 261 Table 108: Physics 1B 2013–14. Linear model of predictors of exam score, with 95%
bias corrected and accelerated confidence intervals. Confidence intervals
and standard errors based on 1000 bootstrap samples. .................................... 262 Table 109: Genes and Gene Action 2011–12. Linear model of predictors of exam
score, with 95% bias corrected and accelerated confidence intervals.
Confidence intervals and standard errors based on 1000 bootstrap samples. .. 263 Table 110: Genes and Gene Action 2012–13. Linear model of predictors of exam
score, with 95% bias corrected and accelerated confidence intervals.
Confidence intervals and standard errors based on 1000 bootstrap samples. .. 264 Table 111: Genes and Gene Action 2013–14. Linear model of predictors of exam
score, with 95% bias corrected and accelerated confidence intervals.
Confidence intervals and standard errors based on 1000 bootstrap samples. .. 265 Table 112: Chemistry 1B 2011–12. Linear model of predictors of exam score, with
95% bias corrected and accelerated confidence intervals. Confidence
intervals and standard errors based on 1000 bootstrap samples. ..................... 266 Table 113: Chemistry 1B 2012–13. Linear model of predictors of exam score, with
95% bias corrected and accelerated confidence intervals. Confidence
intervals and standard errors based on 1000 bootstrap samples. ..................... 267 Table 114: Chemistry 1B 2013–14. Linear model of predictors of exam score, with
95% bias corrected and accelerated confidence intervals. Confidence
intervals and standard errors based on 1000 bootstrap samples. ..................... 268 Table 115: Glasgow Physics 2011–12. Linear model of predictors of exam score, with
95% bias corrected and accelerated confidence intervals. Confidence
intervals and standard errors based on 1000 bootstrap samples. ..................... 269 Table 116: Glasgow Physics 2012–13. Linear model of predictors of exam score, with
95% bias corrected and accelerated confidence intervals. Confidence
intervals and standard errors based on 1000 bootstrap samples. ..................... 270 Table 117: Glasgow Physics 2013–14. Linear model of predictors of exam score, with
95% bias corrected and accelerated confidence intervals. Confidence
intervals and standard errors based on 1000 bootstrap samples. ..................... 271 Table 118: Nottingham Chemistry 2011–12. Linear model of predictors of exam score,
with 95% bias corrected and accelerated confidence intervals. Confidence
intervals and standard errors based on 1000 bootstrap samples. ..................... 272
xvii
Table 119: Nottingham Chemistry 2012–13. Linear model of predictors of exam score,
with 95% bias corrected and accelerated confidence intervals. Confidence
intervals and standard errors based on 1000 bootstrap samples. ...................... 273 Table 120: Nottingham Chemistry 2013–14. Linear model of predictors of exam score,
with 95% bias corrected and accelerated confidence intervals. Confidence
intervals and standard errors based on 1000 bootstrap samples. ...................... 274 Table 121: Physics 1A 2011–12. Linear model of predictors of exam score, with 95%
bias corrected and accelerated confidence intervals. Confidence intervals
and standard errors based on 1000 bootstrap samples. ..................................... 277 Table 122: Physics 1A 2012–13. Linear model of predictors of exam score, with 95%
bias corrected and accelerated confidence intervals. Confidence intervals
and standard errors based on 1000 bootstrap samples ...................................... 278 Table 123: Physics 1A 2013–14. Linear model of predictors of exam score, with 95%
bias corrected and accelerated confidence intervals. Confidence intervals
and standard errors based on 1000 bootstrap samples. ..................................... 279 Table 124: Physics 1B 2011–12. Linear model of predictors of exam score, with 95%
bias corrected and accelerated confidence intervals. Confidence intervals
and standard errors based on 1000 bootstrap samples. ..................................... 280 Table 125: Physics 1B 2012–13. Linear model of predictors of exam score, with 95%
bias corrected and accelerated confidence intervals. Confidence intervals
and standard errors based on 1000 bootstrap samples. ..................................... 281 Table 126: Physics 1B 2013–14. Linear model of predictors of exam score, with 95%
bias corrected and accelerated confidence intervals. Confidence intervals
and standard errors based on 1000 bootstrap samples. ..................................... 282 Table 127: Genes and Gene Action 2011–12. Linear model of predictors of exam
score, with 95% bias corrected and accelerated confidence intervals.
Confidence intervals and standard errors based on 1000 bootstrap samples. ... 283 Table 128: Genes and Gene Action 2012–13. Linear model of predictors of exam
score, with 95% bias corrected and accelerated confidence intervals.
Confidence intervals and standard errors based on 1000 bootstrap samples. ... 284 Table 129: Genes and Gene Action 2013–14. Linear model of predictors of exam
score, with 95% bias corrected and accelerated confidence intervals.
Confidence intervals and standard errors based on 1000 bootstrap samples. ... 285 Table 130: Chemistry 1B 2011–12. Linear model of predictors of exam score, with
95% bias corrected and accelerated confidence intervals. Confidence
intervals and standard errors based on 1000 bootstrap samples. ...................... 286 Table 131: Chemistry 1B 2012–13. Linear model of predictors of exam score, with
95% bias corrected and accelerated confidence intervals. Confidence
intervals and standard errors based on 1000 bootstrap samples. ...................... 287 Table 132: Chemistry 1B 2013–14. Linear model of predictors of exam score, with
95% bias corrected and accelerated confidence intervals. Confidence
intervals and standard errors based on 1000 bootstrap samples. ...................... 288 Table 133: Glasgow Physics 2011–12. Linear model of predictors of exam score, with
95% bias corrected and accelerated confidence intervals. Confidence
intervals and standard errors based on 1000 bootstrap samples. ...................... 289 Table 134: Glasgow Physics 2012–13. Linear model of predictors of exam score, with
95% bias corrected and accelerated confidence intervals. Confidence
intervals and standard errors based on 1000 bootstrap samples. ...................... 290 Table 135: Glasgow Physics 2013–14. Linear model of predictors of exam score, with
95% bias corrected and accelerated confidence intervals. Confidence
intervals and standard errors based on 1000 bootstrap samples. ...................... 291
xviii
Table 136: Nottingham Chemistry 2011–12. Linear model of predictors of exam score,
with 95% bias corrected and accelerated confidence intervals. Confidence
intervals and standard errors based on 1000 bootstrap samples. ..................... 292 Table 137: Nottingham Chemistry 2012–13. Linear model of predictors of exam score,
with 95% bias corrected and accelerated confidence intervals. Confidence
intervals and standard errors based on 1000 bootstrap samples. ..................... 293 Table 138: Nottingham Chemistry 2013–14. Linear model of predictors of exam score,
with 95% bias corrected and accelerated confidence intervals. Confidence
intervals and standard errors based on 1000 bootstrap samples. ..................... 294 Table 139: Physics 1A 2011–12. Linear model of predictors of exam score, with 95%
bias corrected and accelerated confidence intervals. Confidence intervals
and standard errors based on 1000 bootstrap samples. .................................... 297 Table 140: Physics 1A 2012–13. Linear model of predictors of exam score, with 95%
bias corrected and accelerated confidence intervals. Confidence intervals
and standard errors based on 1000 bootstrap samples. .................................... 298 Table 141: Physics 1A 2013–14. Linear model of predictors of exam score, with 95%
bias corrected and accelerated confidence intervals. Confidence intervals
and standard errors based on 1000 bootstrap samples. .................................... 299 Table 142: Physics 1B 2011–12. Linear model of predictors of exam score, with 95%
bias corrected and accelerated confidence intervals. Confidence intervals
and standard errors based on 1000 bootstrap samples. .................................... 300 Table 143: Physics 1B 2012–13. Linear model of predictors of exam score, with 95%
bias corrected and accelerated confidence intervals. Confidence intervals
and standard errors based on 1000 bootstrap samples. .................................... 301 Table 144: Physics 1B 2013–14. Linear model of predictors of exam score, with 95%
bias corrected and accelerated confidence intervals. Confidence intervals
and standard errors based on 1000 bootstrap samples. .................................... 302 Table 145: Genes and Gene Action 2011–12. Linear model of predictors of exam
score, with 95% bias corrected and accelerated confidence intervals.
Confidence intervals and standard errors based on 1000 bootstrap samples. .. 303 Table 146: Genes and Gene Action 2012–13. Linear model of predictors of exam
score, with 95% bias corrected and accelerated confidence intervals.
Confidence intervals and standard errors based on 1000 bootstrap samples. .. 304 Table 147: Genes and Gene Action 2013–14. Linear model of predictors of exam
score, with 95% bias corrected and accelerated confidence intervals.
Confidence intervals and standard errors based on 1000 bootstrap samples. .. 305 Table 148: Chemistry 1B 2011–12. Linear model of predictors of exam score, with
95% bias corrected and accelerated confidence intervals. Confidence
intervals and standard errors based on 1000 bootstrap samples. ..................... 306 Table 149: Chemistry 1B 2012–13. Linear model of predictors of exam score, with
95% bias corrected and accelerated confidence intervals. Confidence
intervals and standard errors based on 1000 bootstrap samples. ..................... 307 Table 150: Chemistry 1B 2013–14. Linear model of predictors of exam score, with
95% bias corrected and accelerated confidence intervals. Confidence
intervals and standard errors based on 1000 bootstrap samples. ..................... 308 Table 151: Glasgow Physics 2011–12. Linear model of predictors of exam score, with
95% bias corrected and accelerated confidence intervals. Confidence
intervals and standard errors based on 1000 bootstrap samples. ..................... 309 Table 152: Glasgow Physics 2012–13. Linear model of predictors of exam score, with
95% bias corrected and accelerated confidence intervals. Confidence
intervals and standard errors based on 1000 bootstrap samples. ..................... 310
xix
Table 153: Glasgow Physics 2013–14. Linear model of predictors of exam score, with
95% bias corrected and accelerated confidence intervals. Confidence
intervals and standard errors based on 1000 bootstrap samples. ...................... 311 Table 154: Nottingham Chemistry 2011–12. Linear model of predictors of exam score,
with 95% bias corrected and accelerated confidence intervals. Confidence
intervals and standard errors based on 1000 bootstrap samples. ...................... 312 Table 155: Nottingham Chemistry 2012–13. Linear model of predictors of exam score,
with 95% bias corrected and accelerated confidence intervals. Confidence
intervals and standard errors based on 1000 bootstrap samples. ...................... 313 Table 156: Nottingham Chemistry 2013–14. Linear model of predictors of exam score,
with 95% bias corrected and accelerated confidence intervals. Confidence
intervals and standard errors based on 1000 bootstrap samples. ...................... 314 Table 157: Physics 1A 2011–12. Linear model of predictors of exam score, with 95%
bias corrected and accelerated confidence intervals. Confidence intervals
and standard errors based on 1000 bootstrap samples. ..................................... 317 Table 158: Physics 1A 2012–13. Linear model of predictors of exam score, with 95%
bias corrected and accelerated confidence intervals. Confidence intervals
and standard errors based on 1000 bootstrap samples. ..................................... 318 Table 159: Physics 1A 2013–14. Linear model of predictors of exam score, with 95%
bias corrected and accelerated confidence intervals. Confidence intervals
and standard errors based on 1000 bootstrap samples. ..................................... 319 Table 160: Physics 1B 2011–12. Linear model of predictors of exam score, with 95%
bias corrected and accelerated confidence intervals. Confidence intervals
and standard errors based on 1000 bootstrap samples. ..................................... 320 Table 161: Physics 1B 2012–13. Linear model of predictors of exam score, with 95%
bias corrected and accelerated confidence intervals. Confidence intervals
and standard errors based on 1000 bootstrap samples. ..................................... 321 Table 162: Physics 1B 2013–14. Linear model of predictors of exam score, with 95%
bias corrected and accelerated confidence intervals. Confidence intervals
and standard errors based on 1000 bootstrap samples. ..................................... 322 Table 163: Genes and Gene Action 2011–12. Linear model of predictors of exam
score, with 95% bias corrected and accelerated confidence intervals.
Confidence intervals and standard errors based on 1000 bootstrap samples. ... 323 Table 164: Genes and Gene Action 2012–13. Linear model of predictors of exam
score, with 95% bias corrected and accelerated confidence intervals.
Confidence intervals and standard errors based on 1000 bootstrap samples. ... 324 Table 165: Genes and Gene Action 2013–14. Linear model of predictors of exam
score, with 95% bias corrected and accelerated confidence intervals.
Confidence intervals and standard errors based on 1000 bootstrap samples. ... 325 Table 166: Chemistry 1B 2011–12. Linear model of predictors of exam score, with
95% bias corrected and accelerated confidence intervals. Confidence
intervals and standard errors based on 1000 bootstrap samples. ...................... 326 Table 167: Chemistry 1B 2012–13. Linear model of predictors of exam score, with
95% bias corrected and accelerated confidence intervals. Confidence
intervals and standard errors based on 1000 bootstrap samples. ...................... 327 Table 168: Chemistry 1B 2013–14. Linear model of predictors of exam score, with
95% bias corrected and accelerated confidence intervals. Confidence
intervals and standard errors based on 1000 bootstrap samples. ...................... 328 Table 169: Glasgow Physics 2011–12. Linear model of predictors of exam score, with
95% bias corrected and accelerated confidence intervals. Confidence
intervals and standard errors based on 1000 bootstrap samples. ...................... 329
xx
Table 170: Glasgow Physics 2012–13. Linear model of predictors of exam score, with
95% bias corrected and accelerated confidence intervals. Confidence
intervals and standard errors based on 1000 bootstrap samples. ..................... 330 Table 171: Glasgow Physics 2013–14. Linear model of predictors of exam score, with
95% bias corrected and accelerated confidence intervals. Confidence
intervals and standard errors based on 1000 bootstrap samples. ..................... 331 Table 172: Nottingham Chemistry 2011–12. Linear model of predictors of exam score,
with 95% bias corrected and accelerated confidence intervals. Confidence
intervals and standard errors based on 1000 bootstrap samples. ..................... 332 Table 173: Nottingham Chemistry 2012–13. Linear model of predictors of exam score,
with 95% bias corrected and accelerated confidence intervals. Confidence
intervals and standard errors based on 1000 bootstrap samples. ..................... 333 Table 174: Nottingham Chemistry 2013–14. Linear model of predictors of exam score,
with 95% bias corrected and accelerated confidence intervals. Confidence
intervals and standard errors based on 1000 bootstrap samples. ..................... 334 Table 175: Physics 1A 2011–12. Linear model of predictors of exam score, with 95%
bias corrected and accelerated confidence intervals. Confidence intervals
and standard errors based on 1000 bootstrap samples. .................................... 337 Table 176: Physics 1A 2012–13. Linear model of predictors of exam score, with 95%
bias corrected and accelerated confidence intervals. Confidence intervals
and standard errors based on 1000 bootstrap samples. .................................... 338 Table 177: Physics 1A 2013–14. Linear model of predictors of exam score, with 95%
bias corrected and accelerated confidence intervals. Confidence intervals
and standard errors based on 1000 bootstrap samples. .................................... 339 Table 178: Physics 1B 2011–12. Linear model of predictors of exam score, with 95%
bias corrected and accelerated confidence intervals. Confidence intervals
and standard errors based on 1000 bootstrap samples. .................................... 340 Table 179: Physics 1B 2012–13. Linear model of predictors of exam score, with 95%
bias corrected and accelerated confidence intervals. Confidence intervals
and standard errors based on 1000 bootstrap samples. .................................... 341 Table 180: Physics 1B 2013–14. Linear model of predictors of exam score, with 95%
bias corrected and accelerated confidence intervals. Confidence intervals
and standard errors based on 1000 bootstrap samples. .................................... 342 Table 181: Genes and Gene Action 2011–12. Linear model of predictors of exam
score, with 95% bias corrected and accelerated confidence intervals.
Confidence intervals and standard errors based on 1000 bootstrap samples. .. 343 Table 182: Genes and Gene Action 2012–13. Linear model of predictors of exam
score, with 95% bias corrected and accelerated confidence intervals.
Confidence intervals and standard errors based on 1000 bootstrap samples. .. 344 Table 183: Genes and Gene Action 2013–14. Linear model of predictors of exam
score, with 95% bias corrected and accelerated confidence intervals.
Confidence intervals and standard errors based on 1000 bootstrap samples. .. 345 Table 184: Chemistry 1B 2011–12. Linear model of predictors of exam score, with
95% bias corrected and accelerated confidence intervals. Confidence
intervals and standard errors based on 1000 bootstrap samples. ..................... 346 Table 185: Chemistry 1B 2012–13. Linear model of predictors of exam score, with
95% bias corrected and accelerated confidence intervals. Confidence
intervals and standard errors based on 1000 bootstrap samples. ..................... 347 Table 186: Chemistry 1B 2013–14. Linear model of predictors of exam score, with
95% bias corrected and accelerated confidence intervals. Confidence
intervals and standard errors based on 1000 bootstrap samples. ..................... 348
xxi
Table 187: Glasgow Physics 2011–12. Linear model of predictors of exam score, with
95% bias corrected and accelerated confidence intervals. Confidence
intervals and standard errors based on 1000 bootstrap samples. ...................... 349 Table 188: Glasgow Physics 2012–13. Linear model of predictors of exam score, with
95% bias corrected and accelerated confidence intervals. Confidence
intervals and standard errors based on 1000 bootstrap samples. ...................... 350 Table 189: Glasgow Physics 2013–14. Linear model of predictors of exam score, with
95% bias corrected and accelerated confidence intervals. Confidence
intervals and standard errors based on 1000 bootstrap samples. ...................... 351 Table 190: Nottingham Chemistry 2011–12. Linear model of predictors of exam score,
with 95% bias corrected and accelerated confidence intervals. Confidence
intervals and standard errors based on 1000 bootstrap samples. ...................... 352 Table 191: Nottingham Chemistry 2012–13. Linear model of predictors of exam score,
with 95% bias corrected and accelerated confidence intervals. Confidence
intervals and standard errors based on 1000 bootstrap samples. ...................... 353 Table 192: Nottingham Chemistry 2013–14. Linear model of predictors of exam score,
with 95% bias corrected and accelerated confidence intervals. Confidence
intervals and standard errors based on 1000 bootstrap samples. ...................... 354 Table 193: Community development theme....................................................................... 357 Table 194: Compulsory nature theme................................................................................. 357 Table 195: Emotional response theme ................................................................................ 358 Table 196: Quality theme ................................................................................................... 359 Table 197: Skills and learning theme ................................................................................. 360 Table 198: Usefulness theme .............................................................................................. 361

xxii
xxiii
List of Figures
Figure 1: PeerWise student home screen. .......................................................................... 36 Figure 2: Question authoring template............................................................................... 37 Figure 3: Summary list of all previously answered questions. .......................................... 38 Figure 4: Detail screen for a previously answered question. ............................................. 39 Figure 5: Summary list of unanswered questions. ............................................................. 40 Figure 6: Unanswered question example. .......................................................................... 41 Figure 7: Confirmation and commenting screen available after selecting an initial
answer. ................................................................................................................ 42 Figure 8: Badges and leader boards. .................................................................................. 43 Figure 9: PeerWise administrator home screen. ................................................................ 44 Figure 10: Administrator question view. ............................................................................. 45 Figure 11: Administrator view of badges earned. ................................................................ 46 Figure 12: PeerWise participation statistics for Physics 1A, University of Edinburgh
2011–12. ............................................................................................................. 47 Figure 13: Example regression lines of a random intercept multilevel model..................... 73 Figure 14: Example regression lines of a random slope multilevel model .......................... 73 Figure 15: Residual plot for Nottingham Chemistry 2013-14 from the regression of
exam score on MM and prior ability ................................................................ 105 Figure 16: Course level residuals from overall mean exam score ..................................... 108 Figure 17: Scree plot of components of MM in Physics 1A 2011–12 ............................... 166 Figure 18: Scree plot of components of MM in GGA 2013–14 ........................................ 166 Figure 19: Using PeerWise helped my understanding of the physics in this course.
End of course evaluation closed responses Physics 1A and 1B 2011–12 and
2012–13 ............................................................................................................ 189 Figure 20: Using PeerWise to develop, answer and discuss questions with other
students on course topics improved my understanding of the course. End of
course evaluation closed responses Genes and Gene Action ........................... 190

xxiv
1
Chapter 1
Introduction and motivation
The production of skilled, confident graduates with the ability to make an impact in
society is integral to the success of a university and is, to a large extent, the primary role of
higher education within the wider economy. The increasing consumerisation of higher
education has made employability a key issue for universities, with institutions becoming
increasingly invested in graduates’ successful transition to the workplace. Indeed,
employability and the production of graduates who are suitably equipped to meet the
demands of the modern workplace have both been identified as key themes in Scottish
higher education [1], and indeed also across England and Wales [2]. In recent years,
institutions have explicitly outlined their vision of the skills they aim to instil in graduates –
both in terms of subject-specific skills, but also more widely in terms of transferable
competencies. The University of Edinburgh, for example, has published a Graduate
Attributes Framework [3], comprising four skillsets: research and enquiry; personal and
intellectual autonomy; communication; and personal effectiveness. These are developed
through participation in both academic and non-academic aspects of student life, ensuring
that graduates are able to engage with the research process, construct new knowledge and
work in an independent, sustainable manner. It is therefore clear that in order to ensure
graduates are confident contributors to, and leaders of, society, higher education institutions
must foster these capabilities.
Enabling students to become creative, critical problem-solvers, able to assess the
quality of their own work and that of others and to operate within interdisciplinary teams is
essential if they are to successfully face the demands of 21st century working life [4,5]. The
ability to judge one’s performance against set criteria and to take steps to address
weaknesses are desirable skills in the modern workplace, where graduates will be expected
to evaluate and improve their own (and potentially others’) performance, often without
constant supervision. There should therefore be opportunities for students to develop their
skills of self-reflection within the university curriculum [6]. Indeed, conceptions of teaching
2
and learning in higher education are shifting towards a model placing the student at the heart
of the process, working in partnership with teaching staff, developing their own knowledge
and transferable skills to facilitate life-long learning [7,8], in preparation for “jobs that have
not yet been created, technologies that have not been invented and problems that we don’t
know yet will arise” [9].
Problem solving, thinking critically, synthesising information from a variety of
sources across a range of disciplines, and evaluating the extent to which a task has been
completed successfully, are examples of “higher-order” cognitive skills, demanding more
than just knowledge of fact, or a surface-level of understanding [10]. Having the
metacognitive skill of being able to accurately evaluate one’s ability and understanding is
crucial in the development of study skills and the ability to learn independently. Moreover,
knowing what one already knows and identifying the gaps in one’s knowledge is vital to
access the most appropriate solution to a given problem [11]. Educators often state that one
of the learning outcomes of their courses is to promote these skills, so students get a deeper
understanding of course materials and engage at a higher cognitive level with concepts.
Hattie suggests that whilst this is laudable, many initiatives fail in practice to engage students
at a deeper level [12] for example, in a study of biology courses that explicitly stated aims of
promoting deep learning, 93% of assessment tasks focused on lower-level skills [13]. This
could perhaps be ascribed to the challenging task of operationalising learning outcomes and
having the knowledge to know how to assess them [14]. It has been suggested that defining
the level of performance in assessment tasks is important in achieving clear learning
outcomes for a particular course, so students know what is expected of them [15]. Statements
such as “students will understand …”, cannot be measured directly. Specifying the
development of skills that evidence understanding such as being able to apply or describe a
concept, or to argue a case are more specific outcomes, aligned more explicitly with higher-
order skills [15].
Although there should be an alignment between the skills intended to be developed
and the skills that are being assessed in each academic course, in practice there can be a
disjuncture between the desire to engage students in deeper cognitive processes and the
degree to which appropriate learning activities are adopted [13]. This is important because
the skills and learning outcomes that are assessed imply that these are the skills and
outcomes which are most valued by teaching staff [6]. Assessment is a statement of the
expectations and standards held by staff – these should be high (but clearly also at an
appropriate level) as students should aspire to reach the highest standards they are able to
[13]. When assessment tasks target lower-order skills, students will tend to develop
3
proficiency in lower-order tasks [14]. It has been suggested that the curriculum should be
aligned to promote higher-order thinking, with assessment tasks reflecting this [14]. There
must therefore be a balance between students having adequate subject knowledge, and the
development of their higher-order transferable skills. Students need to develop into expert-
like thinkers – tackling tasks that are “challenging but doable” [16].
It is sometimes thought that learning is linear, where students have to master
knowledge and lower-level skills before they can attempt to work at a higher level or engage
in more complex cognitive processes [13]. Whilst it is true that students do need a base of
knowledge, research is providing an increasing body of evidence that all students can benefit
from engaging with higher-order tasks – not just students with higher academic ability or
those who have mastered preceding challenges of learning or memorisation of facts
[12,13,17]. Students of all ability levels can make performance gains and enhance their
scientific literacy by engaging in more sophisticated learning activities. Weaker students
may not close the attainment gap between themselves and their more able counterparts, but
they may be able to improve on their own performance and somewhat narrow the gap [17].
Tasks that engage students in active learning are crucial in enhancing scientific
understanding. There are many definitions of what active learning is and many conceptions
of the types of activities that seek to promote active engagement, but they all centre on the
idea that the student needs to be the key player in their own learning experience and engage
meaningfully with course materials [18,19]. One definition widely used in physics is that
“interactive engagement methods [are] those designed at least in part to promote conceptual
understanding through interactive engagement of students in heads-on (always) and hands-
on (usually) activities which yield immediate feedback through discussion with peers and/or
instructors.” [20] Providing opportunities for students to work together, in collaboration with
their peers, can enhance the development of student understanding and higher-order
cognitive skills [21]. The idea that knowledge is constructed by students, with their existing
knowledge framework, assumptions, and attitudes [14] being modified by the integration of
new knowledge [22], is a key aspect of modern educational thinking. The social
constructivist approach to learning development, pioneered by Vygotsky, acknowledges that
social context has a major effect on learning – knowledge is constructed through shared
interactions and students can achieve more through collaboration with an instructor or more
experienced peer, than they can working on their own. Deeper, more advanced
understanding occurs in the Zone of Proximal Development (ZPD) [23,24] – when a learner
is making meaning with the support of more knowledgeable peers beyond what they can
achieve or understand by themselves. As a learner becomes more certain of their knowledge,
4
the support or scaffolding required is reduced and the ZPD is reframed. There is a growing
body of literature attesting to the educational benefit of student engagement in active and
collaborative learning activities [18,19].
1.1 Introducing PeerWise
One tool that aims to develop higher-order skills through collaboration and peer
discussion is PeerWise [25]. PeerWise (described in more detail in Chapter 2) is an online
application where students are encouraged to generate a bank of multiple choice questions
for their classmates to answer. After answering the questions, students are encouraged to
provide feedback to the question author about the quality of the question in the form of either
a numeric rating or as a free-response comment. PeerWise highlights the value of students’
input “beyond reading… and listening” [26] and towards the creation of new resources to
enhance the learning of both the individual student, and the peer group as a whole [26–30].
PeerWise is built upon constructivist principles, but the underpinning theory of learning has
been described as a contributing student pedagogy – further extending constructivist theories
[27,31]. By providing opportunities for students to make a tangible contribution, question
generation activities give students ownership and control of their learning. Students are also
able to create materials emphasising what they view as important and valuable, rather than
simply responding to the priorities of teaching staff [32]. Giving students ownership is an
important factor in developing independent thinkers and fosters deeper engagement with,
and motivation for the learning process [33,34]. Contributing student pedagogies highlight
the “fluid” nature of the “roles and responsibility of teacher and student” [29,30].
In using PeerWise, the roles of student and teacher are significantly blurred: not only
do students generate a large question-bank for the benefit of the entire cohort, but they also
engage in peer assessment and feedback exercises. These aspects of the system enable
PeerWise to be further categorised within the contributing student framework as being
grounded in a “constructive evaluation” approach [35]. The functionality of PeerWise
enables students to evaluate the quality of contributed questions, to give and receive peer-
feedback and to improve self-assessment skills. This gives multiple opportunities for
students to take ownership of their learning and actively engage with the assessment process,
thus promoting deeper understanding of course materials and developing skills of self- and
peer-assessment, reflection and self-regulation [36,37]. These are all key skills necessary to
succeed in scientific endeavour, and indeed, more generally within the modern workplace
[38].
5
The variety of tasks embedded in PeerWise, clearly has potential to promote the
development of both knowledge and understanding, as well as the higher-order skills of
problem solving and evaluation, which are necessary for modern graduates. Asking
questions and providing explanations necessitates that students to engage in “generative
thinking” [39] – engaging with concepts and information beyond what has already been
made explicit in texts and lectures, to synthesize information in the creation of questions and
explanations. In answering and commenting upon questions students develop skills of
evaluation – not just in relation to the subject area, but also in relation to assessing their own
learning – thus increasing their metacognitive awareness.
The remainder of this chapter seeks to examine whether engagement with the types
of tasks carried out by students in PeerWise has been shown to have any association with
improved knowledge and understanding and/or the development of higher-order learning
skills. Each activity – asking questions; answering questions; providing and receiving
comments – shall be examined in turn, from both an educator and student viewpoint. It is
important to consider the perceived value of tasks to students, as the greater the perceived
benefits of engaging with a task, the greater student self-motivation will be, and the greater
the increase in self-efficacy – the motivation and ability to set, work towards, and achieve
learning goals [38,40]. The chapter will conclude with an outline and discussion of the
literature investigating the benefits of engaging with online question generation systems – in
particular PeerWise.
1.2 Asking questions
Questioning occurs at all stages of the learning process. For the most part, teachers
ask questions, whilst students demonstrate their knowledge by providing answers [41]. This
traditional approach to questioning allows academic staff to ascertain the level of knowledge
of their students; allows them to respond to gaps in students’ knowledge and understanding;
and forms the basis of traditional tests and examinations, with the purpose of assigning a
grade to the student [42,43]. Whilst this approach to questioning clearly serves a valuable
purpose, it does not fully exploit the potential benefits that questioning can have for students
and educators alike. “Problem formulating is an important companion to problem solving” –
outside formal education setting, students must identify the problems to be solved and
reformulate them in light of their own knowledge and previous experiences [44]. In day-to-
day living, situations are complicated, data confusing, and decisions that must be taken are
more nuanced than the clear, unambiguous, well-structured problems that may be found at
the end of a textbook chapter. By implementing question creation activities which are
6
underpinned by social constructivist principles, educators can develop students’ higher-order
skills of enquiry, and promote a deeper understanding of course materials and concepts –
competencies valued in modern graduates [2].
1.2.1 Student-generated questions
It has been recognised for some time that asking students to create questions
enhances their understanding and retention of course materials. Particularly in the early years
setting, teachers have long been encouraging students to develop higher-order questions in
order to improve their comprehension of texts. (For a comprehensive, if somewhat dated
review of the research see reference [45]) Creating questions is a task embedded in the
philosophy of active learning – students must create their own meanings from course
material – thus promoting deeper understanding and more solid retention of concepts
[42,46]. Questions generated can be classified in two main ways: by the purpose served by
asking students to write questions, and by the cognitive level of the question.
Classifying questions according to Bloom’s taxonomy is a common method of
assessing the cognitive challenge of a particular question [34,41,47,48]. Created in 1956 to
classify levels of learning, this nomenclature has been revised to acknowledge the active
nature of learning. The revised taxonomy comprises six categories (from least to most
demanding): remembering, understanding, applying, analysing, evaluating and creating [10].
Although it is clear that there is a hierarchy of categories, it is perhaps prudent to consider
this as indicative, especially at the more sophisticated levels where the relationship between
the classifications becomes somewhat ambiguous. It is not necessarily evident that
evaluating should be “higher” than applying or analysing.
The quality of questions may also be assessed by examining how many subject areas
the author synthesises to create the problem – by making connections across topics, students
are demonstrating more sophisticated problem solving skills and an appreciation of the
linkages present within the subject. This may be evidence of deeper learning on the part of
the student and serves to enhance the quality of the questions being posed [49]. The quality
of distractors in multiple choice questions may also be indicative of the question author’s
level of understanding [50]. Distractors need to discriminate between question answerers
who understand the concepts being tested and those who do not – sophisticated distractors
will highlight subtly problematic areas and probe common misconceptions [32]. In
identifying these misunderstandings and exploiting them, the question author demonstrates a
high level of understanding and metacognitive awareness.
7
Question creation activities may fulfil many purposes: as a tool for developing
comprehension [51] and recall [52,53]; to develop students’ reasoning and problem solving
skills [54,55]; or as a combination of any, or all of these purposes [42]. When a student
engages in questioning to clarify something they do not understand, or to explore course
materials further, they demonstrate a number of the skills and attitudes that teachers seek to
foster: self-motivation, a willingness to engage in enquiry and an awareness of the
deficiencies and gaps in their knowledge [43,56]. Given that physics and cognate scientific
disciplines are by nature inquiry-based, question creation activities would seem to be
particularly appropriate in such fields [42,43,47,57,58], where problem-solving and critical
thinking are key components of the scientific process. It may be suggested that the different
types of question writing activities foster different levels of cognition and inquiry by
promoting a greater or lesser level of higher-order thinking.
Question-generation activities can take many guises. There are questions that are
generated to aid recall and understanding – the student writes questions for themselves as
prompts to foster engagement with a text or another medium. Alternatively, a student may
devise a problem for another student to answer. The cognitive load of this level of
questioning is increased when the student is required to construct an answer to the question,
and further extended when an explanation is to \be provided. When the student is required to
write a multiple choice question where appropriate distractors have to be devised, the task
becomes more demanding. The requirement of providing explanations for why the
distractors are incorrect and why the solution is correct is an additional cognitive burden.
Each of these activities are discussed in turn in the following sections.
1.2.2 The question writing process
In order to write any type of question, a student must have some level of knowledge
or understanding about the subject [59]. Question asking has always been incorporated
within traditional tutorial activities, however here the questions are nearly always for
knowledge acquisition, or for clarification and extension. Moreover, not all students will
choose make use of these opportunities – a problem that may be exacerbated on high-
enrolment courses, where class-sizes may be larger. Writing questions may be a vehicle to
encourage students to read course materials and to engage more deeply in order to aid
understanding and recall [53,55,60]. Students must then be able to synthesise the information
learnt with their existing knowledge framework [39,46,61]. When a student poses a question,
they are demonstrating the state of their knowledge, and may expose gaps in their
understanding and where there has been a failure to accurately assimilate new knowledge
8
into their existing framework or deal with any conflicts which may have arisen between
older understandings and newly gained knowledge [42,56].
When the purpose of question writing is extended beyond simply knowledge
acquisition and recall of a text, and is directed towards writing questions to test the
knowledge and understanding of fellow students, the cognitive load, and therefore the
potential benefits of the task, become far greater as students are expected to be actively
participating in their own and others’ learning [28,41,62]. As well as understanding the
materials upon which they are going to base their questions, students then must identify
potential misconceptions or conceptual problems to incorporate and test in their question
[59]. This requires a high level of metacognition – ideally, students should be aware of the
possible places where their peers may struggle or misunderstand the materials, particularly
when multiple choice questions are to be created. Question authors must be able to “point
out critically distinctive features and differences among closely related categories” [63].
They must then be able, not only to apply their new-found knowledge in a novel situation,
but also to develop their problem identification skills to devise an appropriate context in
which to situate their questions [33,44]. Without the deep level of understanding gained by
successfully assimilating new knowledge within the existing knowledge framework [39],
questions generated will tend to be more simplistic in nature, testing recall of facts or
requiring a ‘plug and chug’ approach to applying a formula.
It is well established that teaching or explaining a concept to others is an effective
method of determining whether a concept is truly understood [34], and is also a way of
developing understanding in the first instance by articulating and resolving conflicts between
the originally held knowledge framework and the new information to be assimilated into it
[12,61]. In writing a question students must work through the process of revising materials,
exploring linkages between concepts and drawing distinctions between different scenarios
and contexts in which to situate the problem [32]. Asking students to explain their reasoning
where question generation activities are situated in a scientific discipline is particularly
valuable because the understanding and explanation of phenomena are “major aims of
science as a whole” [39]. After posing a question to test their peers, students will often have
to state the correct answer (assuming that they know the content) and provide an explanation
for why the answer is correct. Where a question covers a subject area that the author has only
engaged with at a surface level, the resulting explanations may be less evaluative in nature
[39] and may fail to adequately explain the subtleties of the distractors (in multiple choice
questions).
9
When writing multiple choice questions, an additional level of cognitive challenge is
added to the process with the necessity to write distractors. This transforms the multiple
choice question from a method of summative assessment that is often criticised for merely
testing recall [64–66], for promoting a “one right answer mentality” [67], and for failing to
assess the reasoning process [66–68], into a pedagogical tool, that requires many skills [69].
Creating plausible alternative answers that are able to distinguish between students who
understand the material and those who do not [32] and then explaining why the distractors
are incorrect, enhances problem-solving skills and deepens understanding as students have to
understand why the alternatives are wrong [70]. The quality of the distractors will therefore
be determined by the depth of knowledge and understanding that the student holds, in
addition to an awareness of common misconceptions and misunderstandings [71].
Distractors can vary in terms of their quality, however a significant positive correlation has
been reported between the cognitive level of the question posed, and the quality of the
distractors [41]. Some distractors can just be variations of the correct answer e.g. a wrong
figure or misplaced decimal point [71]. Other distractors may be more complex, for example,
where the option is the correct answer to an incorrectly applied formula [71].
The process of writing multiple choice questions – constructing question stems,
working out the correct answers and distractors, and writing explanations – necessitates
question authors to actually work through the “process of question solving” and engage in
“deep mental processes” [40]. From an information processing theory view, students must
engage in the processes of information retrieval, elaboration and organisation of their
knowledge and understanding [40]. They must also deploy metacognitive skills such as
monitoring their own understanding, evaluating the level of their skills and planning how to
approach the task of question writing [32].
1.2.3 The benefits and student perceptions of student-generated questions
Given the multitude of ways question generation tasks are implemented and assessed
in the classroom, it is challenging to unpick the measured benefits of such activities. In some
courses, question generation activities are used on a voluntary basis [72]; some tasks require
students to write questions on a specific topic and then assess the learning benefits in that
area [60,57]; others allow freedom over the subject matter of the questions to be generated,
but assess more generally the benefits of learning across the whole range of course materials
[34]. In some courses, students have a large number of questions to write, in others a lower
requirement. It is not a surprise therefore to find that findings can be mixed. However, in a
meta-analysis of 26 studies, it was concluded that generating questions results in a better
10
understanding of course material, so such activities are worth incorporating into curricula
[45]. Furthermore, it has been demonstrated in several studies that when students are
required to write questions, it is not the volume of questions that has a positive correlation
with test or exam performance, but the quality of the questions – the cognitive level required
to both ask and answer them [41,46,48,74]. This demonstrates that encouraging students to
produce more complex, conceptual questions can deepen levels of engagement and
understanding of course materials, thus improving student attainment [69]. It has also been
suggested that the benefits of writing questions may only become apparent when students
answer questions on the subject matter that relates to their authored question [60,74] The
deeper understanding and increased retention is hypothesised to occur with the “generation”
of materials about specific topics or subject areas [60].
Students themselves find writing questions an extremely demanding task. When
evaluating the effects of question generation activities, students are often asked to comment
on the activities, and rate the degree to which writing questions has benefitted (or otherwise)
their learning. In the vast majority of these studies, students find question writing an onerous
task which was more difficult than originally anticipated [34,46,64]. Students believe that
writing questions encourages the development of higher-order thinking skills [75], however
they lack confidence in their ability to construct quality questions [32]. This highlights an
appreciation that question writing taps into sophisticated skills of reasoning and synthesis
and that students when engaged in these tasks, are often working in their ZPD, constantly
testing the boundaries of their knowledge and skills. This is a mentally uncomfortable
position to be in, however it has been demonstrated that students who perceive writing
questions to be of academic value tend to adopt a deeper approach to learning [40].
Despite (or perhaps because of) the challenge of question writing tasks, 90% of
students on a pharmacy course thought the tasks were meaningful and 94% said it fostered
engagement with course materials [64]. First year medical students had similar feelings
about question writing – 26% felt writing questions was more difficult and time consuming
than they expected it to be, but 77% felt that repeating the task with future cohorts would be
beneficial [76]. Second year physics students were also supportive of question generation
activities being extended to other year groups [77]. Similarly, 74% of students on a
programming design course agreed or strongly agreed that question posing increased their
cognitive ability, but 69% also believed it to be a challenging activity [46].
Having an authentic audience to answer the questions posed, rather than just writing
material for teaching staff to mark adds purpose and an authenticity to the process – students
11
have ownership over the resources they create and use. It could therefore be hypothesised
that having an audience to answer one’s questions will enhance motivation to write questions
and engage with the process, and ultimately maximise the potential cognitive effects of the
question writing assignment [62]. Similarly, for both the peer group answering submitted
questions, and for question authors themselves, the inclusion of relevant cultural and social
references or “human interest” aspects within questions has been thought to promote
engagement and the retention of information [62].
1.3 Answering questions
While students have limited opportunities to pose many questions throughout their
educational career, their role as question answerers is well established at all levels of the
educational process. There are several motivations for including question answering tasks in
a curriculum. Instructors may pose questions as a gauge of their students’ knowledge and
understanding, as a strategy for either formative or summative assessment to assign a grade
or to provide information about where there may be deficiencies in knowledge and
understanding.
1.3.1 Question answering as a diagnostic tool
By setting tests where students have to answer questions on previously learned
material, teachers are encouraging regular revision of coursework in order to secure
understanding and enhance retention [78]. Students may additionally choose to answer
questions set by teachers or found in textbooks or past papers as a means of self-assessment
to determine where they need to direct future study efforts. These motivations are based in
the philosophy that the act of answering questions is a means of assessing understanding, and
any benefits result from increased exposure to course materials, rather than the act of testing
itself being considered a learning activity in its own right.
Although the act of testing has often been regarded as “neutral” [78], there have
been many laboratory based studies that demonstrate a “testing effect” – where the act of
testing aids retention of materials by forcing students to retrieve information, practicing the
skills of retrieval they will need in future assessments [79]. The testing effect is not just a
function of additional exposure to information through increased revision (encoding
information so it can be stored in one’s long-term memory), but rather is a result of the
practice of accessing or retrieving information. Repeated testing, triggering the retrieval of
information, has been demonstrated to be superior to engaging in additional studying of
materials – where encoding processes are invoked [80]. The direct benefits of testing have
been demonstrated to be not just restricted to laboratory experiments, but have also been
12
translated into the classroom environment [81]. Retention is further enhanced when students
complete more frequent short tests rather than less frequent longer tests [82]. Applications
such as PeerWise provide opportunities for students to frequently practice answering
questions because of their unrestricted availability to students. This allows students to
maximise both the direct benefit from practising information recall, as well as the indirect
benefits of enhanced revision and reflection upon questions answered incorrectly or that
posed more of a challenge.
1.3.2 Student perceptions of the benefit of question answering
Given that the direct benefits of testing are still not widely recognised in the
mainstream educational process, it is perhaps not surprising that students themselves are
often unaware of its benefits. 177 students were surveyed to ascertain their perceptions of
self-testing and their study techniques [83]. 84% cited that they would study by repeated
reading, and 55% of these students stated that reading was their favoured technique. Only
11% of students stated that they would self-test, and only 1% chose this as their favoured
strategy. Despite research that consistently demonstrates that testing is a superior strategy for
memorisation, compared to simply re-reading, it seems as if students like the comfort blanket
of reading. It may be that reading is easier for students – they feel more “fluent” in reading
than in answering questions. Students may believe if they find a task easy that it
demonstrates mastery. However this fluency may give a false sense of security [83,84].
When students were offered a chance of re-reading after self-testing, 42% said they would
then practice answering questions. Of the students who said they would self-test, their
reasons for self-testing also indicated a lack of awareness of the additional benefits of testing
as most students said they would self-test to obtain feedback on the state of their knowledge
to plan their future revision [83].
In a 2010 study, students were asked whether they believed that reading a text,
answering questions on the text or generating questions on the text would best help them
learn the materials. Interestingly, all students thought that generating questions would
provide more benefit than answering questions or re-reading [75]. Clearly there is an
awareness amongst students that learning is enhanced when they are actively engaging with
course materials (which may be increasing, given the promotion of active learning at all
stages in the education process) However this seems to be at odds with the fact that students
do not tend to choose to answer questions as a means of revision unless explicitly asked to as
part of a task. Interestingly, and perhaps pertinent to research described in this thesis, there
were no significant differences in the performance of students who had generated questions
13
and those who answered questions – although both groups outperformed the group who
simply re-read the text, indicating that active engagement may indeed be the key to learning
[75].
1.4 Peer assessment and feedback
Providing feedback by commenting on student questions encourages reviewers to
engage critically with the subject matter to identify problem areas and to provide advice or
guidance as to possible solutions and improvements that could be made [85]. It is well
established that teaching or explaining a concept to others is an effective method of
determining whether a concept is truly understood [34]. When students need to go beyond
their immediate initial understanding in order to critically engage with another student’s
work and provide explanations and justifications for their critique, they may have to extend
their knowledge to be able to articulate their point of view [61], and to resolve conflicts
between their originally held knowledge framework and the new information to be
assimilated into it [61]. Asking students to explain their reasoning or to give critical feedback
also necessitates that students reflect on their own learning, encouraging them to be aware of
their own learning and highlighting areas of strength and weakness for further development.
After having given feedback, students may be encouraged to reflect on and improve
their own performance in light of their exposure to the standards set by their peers, and
perhaps having developed a deeper understanding and internalization of assessment criteria
[86–89]. Given the variety of ways feedback may be delivered and the myriad reasons for its
implementation, it is perhaps not surprising that there is a huge body of research
investigating student attitudes towards giving and receiving peer feedback and the
characteristics of effective feedback and evaluation. That said, there is a relatively limited
amount of published work which aims to quantify how engaging with peer feedback impacts
upon academic performance [88].
A common theme of dissatisfaction amongst students, as highlighted in student
satisfaction surveys, is the quantity and quality of feedback given to them throughout their
studies. In the 2015 National Student Survey, 60% of Scottish full-time students definitely or
mostly agreed that feedback was received promptly; 64% that comments were detailed; and
62% that feedback helped with clarification of things that were not understood. This is in
comparison to feelings about other issues such as the quality of teaching, the level of
academic support or resource and IT provision, where between 80% and 90% of students
responded favourably [90]. Students often feel that they do not understand feedback that has
been given – it may be couched in academic jargon, or it may simply be illegible [91].
14
Feedback may also be given to students too late for it to make a difference to their learning
in a particular course – a side effect of increasing modularisation in education, where content
is compartmentalised [92]. As a result, academic staff report that students do not even
collect feedback that has been provided [93]. This leads to a failure by students to apply
feedback from one particular course to a different academic context – they often do not
recognise how to transfer advice from one subject area to the next [93]. There has been a
large body of literature examining good practice in giving effective feedback and how to
encourage students to make use of the feedback they do receive [21,94,95]. In-depth
discussion of this is beyond the scope of the current review – however it would seem that an
online mechanism by which peers could provide immediate feedback might enable a larger
volume of feedback to be generated. Moreover, students would gain the benefit of engaging
with the viewpoints of a wider range of people than just their tutor or one or two peer
assessors – creating opportunities for rich discussion and the transfer of knowledge and
deepening of understanding [96].
If students are assessing their peers formatively, the process of giving feedback is
more likely to foster co-operation and honest discussion than when they are assessing their
peers summatively, as students do not experience a conflict between initially working
together and subsequently ‘competing’ for assessment marks [97]. When feedback is given
anonymously, students will feel comfortable in engaging authentically with the system –
allowing them to capitalise on the range of activities that promote deeper learning [98]. It has
been suggested that a positive, supportive social context can encourage the development of
shared meanings and understandings [99]. By encouraging the sharing of formative peer
feedback, the task of answering questions is transformed from a ‘drill and practice’ type
exercise, promoting a ‘one right answer mentality’ to a more considered, reflective activity
[55].
The provision of feedback plays a key role in the learning process for both the
assessor and the assessee, as the focus is on developing shared meanings and negotiating
shared understandings through student interactions. Students may provide feedback and
support to their peers in the form of questions, to encourage others to consider a different
perspective, aiding in their arrival at a solution to a problem, or more generally, to their
understanding. By asking probing questions when giving feedback (or in the case of
PeerWise when writing comments – see Section 2.1) students can inspire each other, co-
constructing knowledge and understanding [100]. Peer assessment encourages students to
spend more time on task, paying attention to the quality of their own and their peers’ work,
15
which promotes a greater sense of accountability and responsibility towards not just their
own learning, but also that of their peers [101].
By giving students responsibility for sourcing their own feedback and critiquing the
work of others – and by extension their own progress, through following a similar evaluation
of their own work – they are able to maintain their ability to learn effectively beyond the
university environment [102]. Student learning environments need to have opportunities for
students to actively seek knowledge and feedback in a safe manner – where mechanisms to
share views can be developed between students themselves, and also between students and
teaching staff, to aid the development of understanding in a formative, non-threatening, low-
stakes situation [102].
As with all learning activities, regardless of the structure of peer assessment tasks,
the environment in which they are carried out, or whether they are summative or formative
in nature, students should understand the relevance and importance of the exercise. Feedback
and assessment tasks should not be considered simply a hoop to jump through, or a tick-box
exercise to be completed, otherwise students will quickly lose motivation and will engage in
a surface learning approach to get the task over and done with as quickly as possible [7]. By
failing to recognise the potential opportunities for enhancing their understanding, students
will not gain as much benefit from the exercise as they should – further perpetuating their
belief that peer assessment is not a worthwhile task, and perhaps more concerning, missing
out on opportunities to develop their skills of self-regulation [4].
1.4.1 The benefits of giving feedback
Engaging with questions for the purposes of providing feedback in the form of a
rating, a comment, or to ascertain the cognitive level of the question, is a cognitively
demanding task. It forces students to think critically about the question and further develop
their evaluation skills [34,37,103]. Most of the studies that look at the benefit of reviewing to
the reviewers examine how reviewing can improve writing skills [85,104,105] – reviewers
are engaging in cognitively demanding tasks of critical evaluation of and providing
justifications for their conclusions [88].
When comparing assessments written by students who had either reviewed, read or
not engaged with their peers’ papers, Cho and McArthur [105] found that those who
participated in reviewing wrote the highest quality of papers themselves. The active nature of
evaluating and responding to the texts gave a benefit that reading alone did not. In this study,
all students were given practice in using an evaluation rubric to review a sample text,
therefore engagement with and knowledge of the assessment criteria was not in itself enough
16
to foster improvements in quality. It was necessary to engage with the texts at a deeper level
in order provide an effective critique. This in turn leads to an improved understanding of
how to develop their own work.
Cho and Cho [88] analysed the peer reviews of physics laboratory reports to explore
the types of comments generated, how the types of written and received comments affect
writing improvement, and whether the type of comments written by reviewers is associated
with their own initial writing skills. Upon receipt of feedback generated by the peer-review
process, report writers revised their drafts in light of the comments, and resubmitted them for
a second review. They also provided comment on the usefulness of the reviews, which was
passed to the reviewers. Reviewers then commented on the quality of the redrafts. Students
with high initial ability could identify more weaknesses in answers, but students of all
abilities could identify strengths. The higher the reviewer’s own writing skill, the more
weaknesses which could be identified.
In a similar study, examining whether being an assessor or assessee was more
beneficial to performance, Li, Liu and Steckelberg found that there was a positive
relationship between the quality of feedback students provided to their peers on a first draft
of a project and the quality of their own final project drafts [89]. Moreover, the higher the
quality of feedback provided by the reviewer, the better the reviewer’s subsequent
performance on their own project.
These findings also highlight a confidence issue – students with a high level of
confidence in their own ability might feel more able to critique the work of another student
than a student who has little faith in their own ability. Students’ lack of confidence is often
cited as a barrier to engaging with peer assessment tasks (for more detail see Section 1.4.3).
Students are uncomfortable with others critiquing their work and they in turn are
uncomfortable in assessing their peers [36]. This is not surprising – peer assessment is as
difficult task, students lack experience in critiquing others’ work, and they will have little or
no experience of marking or applying standards – a task that can be considered as a
significant responsibility [106].
In an investigation aiming to determine whether cognitive or affective feedback was
associated with performance, researchers categorised feedback given by secondary school
pupils on an online General Studies course as cognitive (identifying a problem, giving a
suggestion, an explanation of the feedback, or commenting upon the language used) or
affective (either positive or negative comments). When controlling for previous attainment,
giving suggestions, identifying problems, and receiving positive feedback were the only
17
activities significantly predicting end of course exam score [87]. This seems to be consistent
with previous work where the number of ‘challenges’ or queries written in response to
questions was positively correlated with exam grade [73,88,105]. Identifying problems in
other students’ work may therefore enable assessors to more readily identify (and address)
problems in their own work, and provide them with a better idea of how their own work will
be interpreted [107]. Exposure to all standards of work helps calibrate students to more
effectively assess the quality of their own performance [108].
1.4.2 The benefits of receiving feedback
Although both the studies by Cho and Cho, and Li et al. [88,89] demonstrated a
positive relationship between giving comments and performance, both studies also revealed
that receiving comments was not so beneficial. Cho and Cho found that the only type of
received comment to have any effect on a reviewer’s draft was “strength comments” (such as
praise) on the surface features of the writing. This however had a negative effect on the
quality of the revised draft – maybe because students become complacent and think they are
performing at a higher level than they really are, so fail to try to improve the next draft [88].
This seems somewhat counter-intuitive. It would be reasonable to assume that
receiving quality feedback would increase the quality of subsequent work. However it is
possible that students may perform well regardless of the quality of feedback received. Li et
al. reported that students were instructed to reflect upon the received feedback to evaluate its
quality before revising their drafts. Additionally, all the students had had an opportunity to
reflect upon and engage with the assessment criteria during the feedback-giving process, so
these activities, which promote active engagement, might counter any poor quality feedback
that was received [89].
As a follow-up to the Li et al. 2010 study [89], the data were recoded to investigate
how the ability of the feedback receiver to critically judge and incorporate feedback affected
their project scores, to ascertain how well students can incorporate high quality feedback and
discount poor quality, or misleading feedback. When controlling for the quality of a
student’s initial project draft and the quality of peer-review they provided for others, there
was a significant positive relationship between the quality of final projects and a student’s
ability to judge the quality of feedback received. Incorporating more good comments and
fewer misleading comments is associated with greater improvement in project marks [101].
An implication for adoption of the PeerWise system therefore is that the abundance of
comments submitted, and the inevitable variability in quality, means that students need to be
able to distinguish between comments that will enhance their future performance and those
18
that provide misleading information. Of course, acting upon and actively engaging with
feedback is essential if performance is to be improved. Students need to be encouraged to
actually use feedback – to close the feedback loop [109].
Receiving positive, reinforcing feedback has been shown in other studies to be
associated with increased performance [87,110]. The evidence for this does conflict with the
studies discussed above [88], and this could be down to a number of reasons. Praise may
increase intrinsic motivation and feelings of self-efficacy, which in turn encourages
engagement with tasks, thus enhancing performance. Receiving praise along with cognitive
feedback may encourage students to approach the feedback positively, thus increasing the
likelihood of acting upon recommendations [87].
In a study examining how different types of peer feedback affected undergraduate
writing performance, Nelson and Schunn [85] focussed on two “mediating factors”: the
cognitive factor of understanding the feedback and the affective factor of agreeing with it.
They hypothesised that if a student understands the feedback provided they will be more
likely to implement it, and similarly, if the assessor’s view of their performance matched
their self-assessment there would also be an increased chance of implementation. The study
found that of four mediators – understanding the problem identified; understanding the
solution posed; agreement with the problem identified; and agreement with the solution
posed – only understanding of the problem was significantly related to implementing the
feedback. Students were 23% more likely to implement feedback if they understood what the
problem was. Similarly, it has been demonstrated that weaker students benefitted from
receiving feedback if comments were justified and explained to them – regardless of the
actual quality of the feedback [111].
Justifications and extended explanations may enable students to understand where
problems lie, as otherwise they might lack the awareness required to identify problems in
their own work. Being aware of the justifications for giving the feedback perhaps enables
students to more readily decide whether the feedback is of good quality with the potential to
enhance their work, or whether it is of poorer quality, and therefore should be disregarded.
Weaker students, or those lacking in confidence, may also be more influenced by any
feedback. They may be aware of their own weaknesses and therefore be more inclined to
accept feedback from anyone who provides it, regardless of its quality. These students would
therefore be more likely to implement poor quality feedback without evaluating it. That said,
receiving justifications for feedback comments might not only be of benefit to weaker
students. 75% of students in one study also said that they wanted comments that not only
19
corrected mistakes and indicate areas of improvement, but which also explained why their
answers were wrong – to enable them to develop their skills and understanding [112].
Regardless of the format, quantity or quality of the feedback given, in order for any feedback
to be effective, it must be acted upon rather than just left as “dangling data” [113], which is
ineffectual at bridging the gap between the actual and desired levels of performance.
1.4.3 Student views on peer feedback
Although many studies report that students appreciate the feedback given to them by
their peers, students often do not respond to peer feedback in the same way as they do to
instructor provided feedback [101]. Students often lack confidence in the quality of the
comments that are given to them by fellow students [36]. However, feedback does not have
to be of the same standard as tutor feedback for it to be of use. Not only is there often a lack
of trust in the feedback they receive, but in a similar way to their insecurities towards writing
questions, students often also lack confidence in their ability to provide feedback – feeling
that they are not experts and that it is the tutor’s role to critique their peers [114,115].
Providing feedback can be a very stressful, time-consuming process, but most students do
recognise the benefits of receiving potentially a larger quantity of feedback from multiple
peers with multiple viewpoints than perhaps may be given by course teaching staff
[104,107,114]. If students believe peer feedback to be helpful then they will be more likely
to act upon it, despite it not originating from a teacher [104]. It could perhaps be argued that
students need scaffolding and guidance when engaging in feedback tasks to ensure they feel
confident in providing reviews. In a study evaluating a feedback activity where guidance had
been provided, 86% of students reported a positive experience of peer review, and 93% of
students felt they had learnt from the process and made changes to their own work in light of
it. In follow-up focus groups, students stated they had learned to think more critically and
view their own work from the point of view of the assessor. Students generally felt that
giving feedback made them develop more skills of self-regulation and reflection than just
receiving feedback in a knowledge transmission manner [107].
In a study comparing the type of feedback given by undergraduate and graduate
students, students were asked to evaluate their classmates’ draft submissions to a research
methods course [104]. Expert academics also reviewed submissions – the process of review
and redraft similar that of Cho and Cho [88] discussed in Sections 1.4.1 and 1.4.2 above.
After the final submission, students evaluated the helpfulness of the comments they had
received. There was no difference in the helpfulness rating of the feedback from peer and
expert reviewers; however, although undergraduates did sometimes give “directive”
20
feedback, they gave far less directive feedback than experts, instead highlighting where
changes should be made without suggesting a specific improvement. This is perhaps
unsurprising, given the higher level of knowledge and experience needed to identify and
specify how something could be improved [85,88]. Nevertheless, this is consistent with the
fact that students find giving feedback a challenging task and that they are sometimes
sceptical about the validity of peer feedback [104]. As with all learning activities and
assessment tasks, the purpose of engaging with peer review should be made explicit to
students. If they understand that that giving feedback is important as a learning task in itself,
and any useful feedback obtained is a bonus [116], they might be more willing to engage
critically and begin to develop their confidence in assessing their peers’ work. The quality of
the feedback given does not have to be of the same standard as would be expected from
tutors – the value of the feedback comes from providing the review [116].
Although it is thought that the primary benefit of peer assessment activities is
thinking about, and providing the feedback, regardless of quality, students should be given
appropriate scaffolding to enable them to feel confident in carrying out peer review and
therefore feel more comfortable with, and find more benefit from, the process. In an
evaluation of a peer assessment activity where students had carried out a review process with
guiding questions to help them through the process, over 85% of students felt their
experience with peer review had been positive and that they had made improvements to their
own work as a result [107]. Receiving feedback was deemed beneficial as it provided an
insight into how others perceived their work and helped highlight deficiencies. However,
giving comments was also thought to be a worthwhile exercise as it encouraged critical
thinking and reflection. 63% of comments about the benefits of receiving feedback focused
on improved content understanding, whilst nearly all of the comments about the benefits of
giving feedback focused on the development higher-order skills such as critical thinking,
transfer of learning, and taking the perspective of an assessor.
1.5 Combined effect of question posing, answering and feedback
provision
Whilst each individual activity associated with question generation assessment tasks
has potential to enhance academic achievement, it could reasonably be argued that it is
through engaging across the range of activities that students can best improve their
understanding and academic performance [117]. There is currently a lack of research
examining how the individual components of question generation tasks combine as a whole
to influence student performance. This is perhaps not surprising as many of the assessment
21
tasks reviewed in the preceding sections are based upon one activity – mainly writing
questions or providing feedback. However, even amongst the literature evaluating online
tools such as PeerWise which comprise a range of activities, evaluation of performance
seems to focus mainly on individual aspects of the application.
Each of the tasks outlined above seeks to challenge learners in slightly different
ways, targeting different aspects of the learning process at different cognitive levels. There is
built-in differentiation within the question-generation and answering tasks, so students can
participate at a level that is most appropriate for their current level of performance and
understanding. Students can write a question that is more or less complex; they can choose to
answer simpler or more challenging questions. This has the potential to make engagement
with question generation tasks beneficial in some way to all students, regardless of their
abilities. It also ensures that opportunities to engage with tasks requiring higher-order skills
such as evaluation are not limited to students of higher abilities – they can engage with tasks
at different levels at different periods in their revision in order to best develop their
weaknesses and stretch their understanding. Students with a strong understanding of the
material may find themselves able to write challenging questions, synthesising a range of
topics; or may further their knowledge by providing an explanation for a fellow student who
does not understand a concept; or perhaps by developing a more elegant solution to a
question. Students who perhaps are struggling to understand a topic or who need a stronger
foundation of knowledge may find it most useful to practice answering questions to aid
retention of concepts, to test their knowledge and to provide feedback on their performance.
Depending on the topic in question, students with a strong understanding and ability to
problem solve and engage with more complex tasks in one curricular area, might find they
need more support in another. In relation to the PeerWise system which is the topic of this
thesis (see Section 1.7 for details), one of the clear strengths is that it allows students to self-
sort their mode of engagement in this way without any additional input from the course
instructor.
1.6 The impact of technology on student question generation and
feedback
Universal access to the internet and the development of sophisticated computing
applications with the functionality of question bank creation has hugely enhanced the
potential benefit to students of question writing and peer feedback exercises in recent years.
Applications such as PeerWise clearly “[develop] reciprocity and co-operation among
students”; “[encourage] active learning”; “[give] prompt feedback”; and “[respect] diverse
22
talents and ways of learning” – fulfilling at least four of seven identified principles of good
practice to adopt in undergraduate education [21].
From the perspective of the course organiser, s/he has all submitted questions and
answers ready to hand. The class has access to all submissions with no requirement for the
instructor to deal with collating and distributing the submissions to the rest of the class.
Large-scale question generation activities are more feasible when conducted online as
opposed to on paper [41]. The benefits of these applications enable instructors, especially
those teaching large-enrolment classes, to more easily engage in constructivist practice in
situations where usually the traditional lecture format is the most manageable way to deliver
the curriculum. Large classes are not usually conducive for question asking – there are
limited opportunities for students to ask questions in a ‘safe’ environment. Moreover,
although it has been established that posing “wonderment” questions, such as “prediction”
“anomaly detection”; or “application” type questions, is associated with engagement in
deeper conceptual discussion and learning gains, students do not tend to pose these types of
questions spontaneously [100]. Incorporating specific question generation activities into the
curriculum highlights the value placed on student-generated questions and the impact
engaging with such activities can have on student learning [118]. Using online question
posing software to enable students to generate questions and interact with each other’s
submissions could be a way of making larger classes seem ‘smaller’ [47]. Through the use of
asynchronous message boards, questions can be asked of the whole cohort – there will
always be someone who can offer help or advice [119].
From a student perspective, online applications enable students to engage with
course activity at any place, at any time – from a desktop computer in a computer lab to a
mobile phone or tablet on the commute into university. The current generation of students
have grown up in the internet age – Web 2.0 is the medium through which they live their
daily lives – from social interactions to online shopping and gaming. Tapping into the
expectations of students, and the norms of their daily experiences, can perhaps increase
motivation to participate in question generation activities – especially when applications
allow for the collection of badges or awards for participation. This gamification can increase
motivation and enhance overall learning, giving students pride in their achievements and a
mechanism by which to challenge themselves to get as many followers as possible or the
best ratings [119,120].
When students pose and answer questions online they may get instant feedback on
the quality of their authored question, or feedback as to the accuracy of their responses to
23
others’ submissions. Prompt feedback is a feature of good assessment practice [21,94] –
when students receive feedback promptly they may be more motivated to use it to improve
their work as its immediate relevance is apparent. Comments and rating functionality allows
every student the opportunity to comment and feedback on every question, exposing students
to a wide range of ideas and viewpoints from people with whom they may not choose to, or
have the opportunity to, engage with offline. As highlighted earlier, and further discussed in
Chapter 4, this builds social capital and also an online community of learning – making the
classroom seem smaller by connecting a greater proportion of the class. This real-time peer-
assessment and collaboration therefore benefits both the reviewer and the question author,
who can use the feedback to either edit the existing question, or can use the comments to
improve the quality of subsequent submissions [94].
The variety of online question posing platforms presents a wide diversity of
functionality. For example: in the types of questions that can be posed – from multiple
choice to essay or long answer questions [34,63,121]; whether posts are anonymous or an
identity visible to other users [63]; and the degree to which students can engage in dialogue
about the submissions. Some systems allow teaching staff to set the level of exchanges that
can occur over the application – they may allow students to comment on an author’s
submission, but not allow a right of reply by the author; they may allow dialogue to occur
between a student commenter and question author (a “one-way mode” of communication),
but not between other student commenters (a “two-way mode” of communication);
alternatively they may allow “multi-way modes” of communication [106], whereby students
have no restrictions over whom they may reply to. The author’s lack of opportunity to
respond to criticism in the one-way mode may be deemed unfair [106], and may in fact stifle
learning as it prohibits discussion, and sharing of knowledge and opinions. Students, when
asked which replying arrangement they preferred, felt that the multi-way mode had more
potential for learning with nearly 70% of them choosing it as the most supportive structure
for learning, although they did comment that the sheer volume of posts and information
could at times be overwhelming. Where students interacted on a two-way mode application,
assessor-to-author interactions were present for about 56% of questions, however for
interaction on a multi-mode application, 67% of all questions had assessor-to-author
comments, but 64% also had assessor-to-assessor interactions [106]. The multi-way mode,
where all communications about a particular question are accessible to every student
currently engaging with that question, more readily enables the social construction of
knowledge and the development of a forum for peer evaluation and learning.
24
1.7 The PeerWise system
PeerWise is an online, free to use application where students are encouraged to write
multiple choice questions for their peers to answer, resulting in a bank of questions for
students to test their knowledge and understanding. Students are given opportunities to give
feedback to question authors on the quality of the question, in the form of a numerical rating
or a qualitative comment, which provides further scope for students to engage in discussion
about the question. It is hypothesised that actively engaging with course material will
promote a deeper understanding of its content and will develop students’ skills of problem
solving and critical thinking (further detail is given in Chapter 2).
Despite being implemented in over 700 institutions across the world [25], there has
been relatively little published work on the implementation of PeerWise and the benefits of
engagement with the system on student learning. Published studies of PeerWise
implementation have largely been in the fields of computer science [122]; physics [123];
chemistry [124]; and biology [117]. Studies generally also focus on introductory level, large
enrolment classes, but some research has been undertaken on students in the later years of
education [125–127].
Until academic year 2012–13, the PeerWise system operated a two-way system of
communication – where dialogue could only occur between the commenter and the question
author. Since 2013, however, PeerWise has adopted a multi-way approach [106], whereby
any student can engage with another student’s comments. This realises more fully, the
cognitive benefits of students engaging in meaningful interactions – challenging their
understanding by discussing their point of view with those who hold alternative perspectives
to achieve a consensus or shared understanding [96].
Studies of PeerWise can be grouped into four broad categories: those that describe
how students use the system; those that try to measure the relationship between engagement
with the system and attainment; those that assess the nature of the question repository that
has been created; and those analysing the attitudes of staff and students towards the system.
Within these groupings there is naturally some element of overlap, but the main findings of
studies focussing on each of these areas are outlined below.
1.7.1 PeerWise implementation and usage
PeerWise has been incorporated into course curricula in a variety of ways. Some
courses have a number of PeerWise assignments spread throughout the course, where, in
each assignment, students must write, answer and comment on a minimum number of
25
questions. In other courses there is a minimum requirement to be completed by a single
course deadline, or a minimum score to be attained on the PeerWise system. Regardless of
the structure of the assignment, studies have found that where participation is voluntary,
contributions – especially of authored questions – are lower. Rhind and Pettigrew [125]
found that out of three courses, the two which had a compulsory PeerWise component had
100% participation rates, but in the third course where participation was optional, only 53%
of students engaged with the system. This is despite the final exam having a multiple choice
question (MCQ) element. Similar findings have been shown across other studies where
higher participation rates are observed when the task contributes towards the student’s final
mark [119,127–130]. Many studies report that most students submit only the minimum
number of questions required; however the number of answers submitted tends to exceed any
formal requirements [50,126,128,129,131]. Thus, although students may answer more
questions (over and above any set minimum requirements) than authoring questions, it has
been suggested that external motivation may be necessary to encourage authoring [119,131].
This is not surprising as writing questions is very challenging and answering questions is a
quick way to feel like a task has been accomplished, and to boost their PeerWise reputation
score (a score calculated by the system as a measure of participation and which can be
compared across users). Since the incorporation of the scoreboard into the system,
engagement with PeerWise has increased [132].
In many courses where PeerWise is implemented, instructors assign a nominal
proportion of course marks to PeerWise to encourage a minimum level of engagement with
the system. The marks awarded for PeerWise participation vary between courses, but
generally range from 2% [49,125,126,129] to 10% [127] of the total course mark. As the
assigned marks vary, so too do the levels of activity required for course credit. Writing
questions is an onerous task for students. Setting a minimum requirement that is too high
may make students feel like the task is too much of a burden, especially if they believe the
level of course credit associated with participation is too low [129]. This potentially leads to
a decrease in overall quality [31] with students becoming tactical about their participation in
order to achieve the marks [48].
1.7.2 Characteristics of student submissions
In many courses scaffolding is implemented to demonstrate to students what makes
a good quality question, in some cases with reference to the cognitive levels of questioning
described in Bloom’s taxonomy [48,117,123,127,130,133]. It is evident however, that the
quality of student submissions varies across disciplines and courses. Where the Bloom’s
26
taxonomy level was studied in the biochemical context, most questions submitted tended to
fall within the first three levels of Bloom’s taxonomy [10] testing recall, understanding and
application of knowledge [134]. Conversely, in a study of a second year genetics course,
whilst around one third of questions fell under the lowest quality category – testing recall –
one quarter of questions were consistently (across three years) classified at the increasingly
sophisticated levels 4, 5, and 6 (create) [117]. In a study aggregating two years of data in
Chemistry, whilst most questions did fall under the “apply” (level 3) classification, a large
proportion were also at levels 4 and 5 – “analyse and evaluate” [124]. These results are
similar to findings from an introductory Physics course, where around 15% of questions fell
under the “remember” and “understand” classifications [48]. In this study, across two
consecutive academic years, about 75% of questions were classified as testing application
and analysis.
A concern that may arise when a course organiser takes a hands-off approach to
moderating a student-generated repository is how to deal with questions or answers that are
incorrect. There may be concern that misconceptions can become ingrained if incorrect
information is being published and students often get nervous when they feel that there are
errors, especially when there is reliance on an activity to both earn academic credit and as a
tool to develop their knowledge. In practice however, most students write accurate, clear
questions and explanations – with three studies demonstrating that between 90% and 95% of
submissions were of good quality [48,134,135]. In most instances where there are errors,
they are identified and corrected by other students on the course [49,134,135]. In one study,
86% of questions were deemed to be of a high quality level based on their coherence,
correctness, sophistication and solutions [124]. Bates et al. [48] found that 67% of questions
analysed were deemed to have a good or excellent quality of explanation – the highest two
categories on a five point scale. Erroneous questions tend to be given a much lower quality
rating by students [135] and a significant positive correlation between quality rating and the
number of answers to a questions has also been reported [136]. Quality ratings therefore
have the effect of promoting accuracy and provides a rough filter for students to determine
the usefulness of a particular question [135].
The coverage of topics sometimes mirrors the coverage of questions asked by staff
on exam papers, indicating the perceived priority of different aspects of the course [49].
Questions that synthesise more than one subject area however tend to be created by more
able students [137], however even the highest performing students write a high number of
‘easy’ questions [135]. Perhaps counter-intuitively, the questions asked by lower ability
students tended to be clearer than the average question, but this could be down to higher
27
ability students creating more complex questions [137]. A positive correlation between the
number of topics covered in a particular question and the difficulty rating assigned to the
question on the PeerWise system has been demonstrated [137]. Questions that synthesise a
greater number of subject areas are more likely to be classified as more difficult.
One aspect of the system that has not been widely evaluated is the quality of student
explanations of their answers. Students may not be required, for formal course credit, to
provide explanations for why a particular answer is correct or why the distractors are wrong,
but, as demonstrated by the research described above (Section 1.2), this is considered a
valuable part of the question writing process [128]. Where the quality of explanations has
been evaluated, there have been mixed results. In a biochemistry course, 95% of questions
were deemed to be of high quality [134] and in chemistry, most (around 70%) questions had
good or excellent solutions with full explanations [124]. Conversely in a computer science
course, 43% of questions rated were judged to have poor explanations and only 25% of all
the explanations addressed why the distractors were incorrect [135].
One of the key features of PeerWise is the ability to comment and give feedback on
questions. As discussed above, evaluating others’ questions is a higher-order skill [10] and
has potential to promote deeper learning and understanding of course material. Students
engaged in forming opinions and generating feedback will also develop the ability to think
critically about their own work and judge its quality against that of their peers [116]. The
ability to interact with peers also builds a community of learning. Students who may struggle
with the material will benefit from the expertise of more able students; higher ability
students will be able to test their understanding by providing explanations; and both groups
will be able to develop their skills in evaluating their own work, their peers’ work, and
advice and critique given to them. Thus far there has been little research on the qualitative
nature of student comments submitted through PeerWise, despite the rich opportunities for
learning that this activity may bring, and despite recognition that the commenting facility
could be the most important part of the PeerWise process [116] – transforming the provision
of feedback from a monologue by the feedback provider into a dialogue between both
students, and indeed encouraging others to participate [94].
In a software engineering class, a comparison between peer feedback and tutor
feedback was undertaken in order to determine how seriously student reviewers took the
responsibility and any differences in the quality of peer and tutor reviews [116]. Feedback
comments from a sample of students were coded as to whether they were general or specific
and whether they were positive, negative or neutral. Although tutors wrote longer reviews
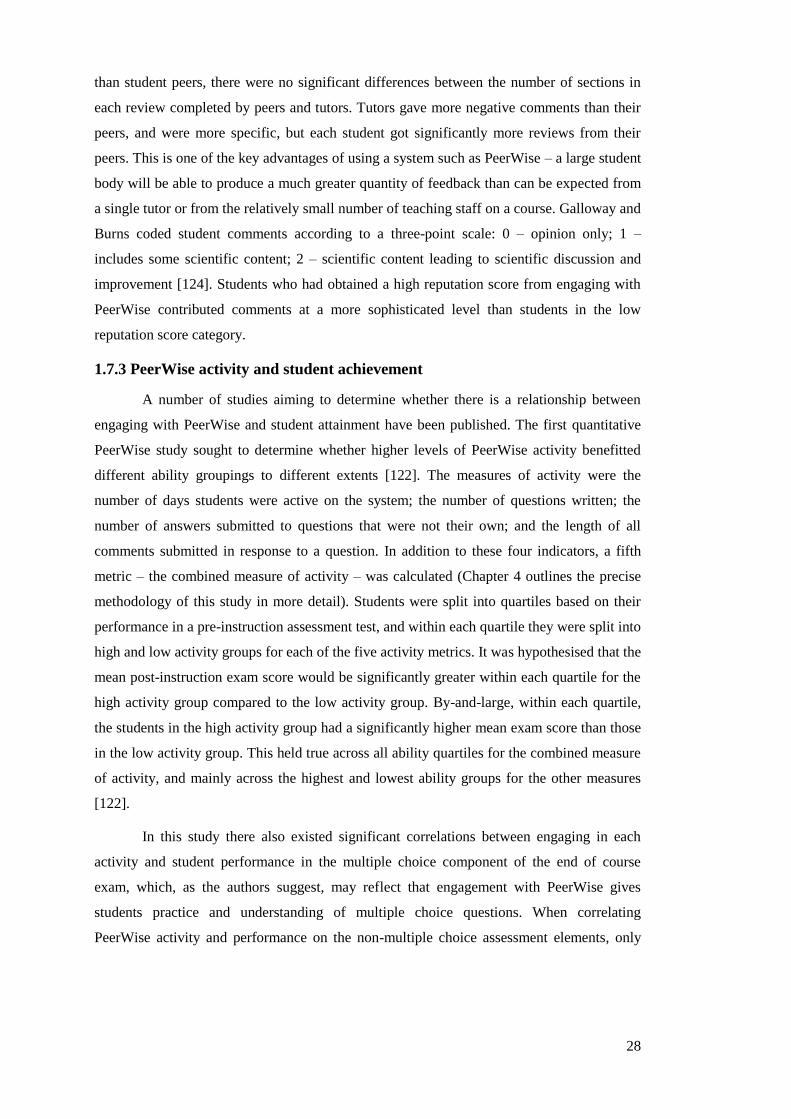
28
than student peers, there were no significant differences between the number of sections in
each review completed by peers and tutors. Tutors gave more negative comments than their
peers, and were more specific, but each student got significantly more reviews from their
peers. This is one of the key advantages of using a system such as PeerWise – a large student
body will be able to produce a much greater quantity of feedback than can be expected from
a single tutor or from the relatively small number of teaching staff on a course. Galloway and
Burns coded student comments according to a three-point scale: 0 – opinion only; 1 –
includes some scientific content; 2 – scientific content leading to scientific discussion and
improvement [124]. Students who had obtained a high reputation score from engaging with
PeerWise contributed comments at a more sophisticated level than students in the low
reputation score category.
1.7.3 PeerWise activity and student achievement
A number of studies aiming to determine whether there is a relationship between
engaging with PeerWise and student attainment have been published. The first quantitative
PeerWise study sought to determine whether higher levels of PeerWise activity benefitted
different ability groupings to different extents [122]. The measures of activity were the
number of days students were active on the system; the number of questions written; the
number of answers submitted to questions that were not their own; and the length of all
comments submitted in response to a question. In addition to these four indicators, a fifth
metric – the combined measure of activity – was calculated (Chapter 4 outlines the precise
methodology of this study in more detail). Students were split into quartiles based on their
performance in a pre-instruction assessment test, and within each quartile they were split into
high and low activity groups for each of the five activity metrics. It was hypothesised that the
mean post-instruction exam score would be significantly greater within each quartile for the
high activity group compared to the low activity group. By-and-large, within each quartile,
the students in the high activity group had a significantly higher mean exam score than those
in the low activity group. This held true across all ability quartiles for the combined measure
of activity, and mainly across the highest and lowest ability groups for the other measures
[122].
In this study there also existed significant correlations between engaging in each
activity and student performance in the multiple choice component of the end of course
exam, which, as the authors suggest, may reflect that engagement with PeerWise gives
students practice and understanding of multiple choice questions. When correlating
PeerWise activity and performance on the non-multiple choice assessment elements, only
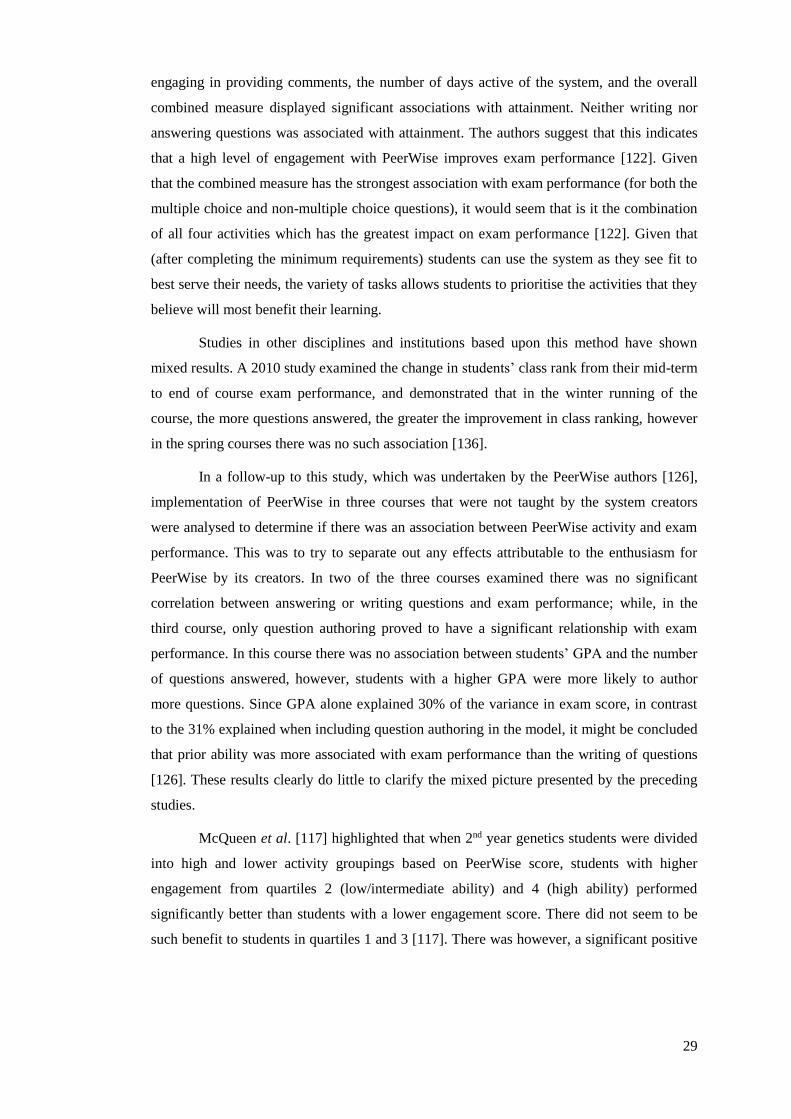
29
engaging in providing comments, the number of days active of the system, and the overall
combined measure displayed significant associations with attainment. Neither writing nor
answering questions was associated with attainment. The authors suggest that this indicates
that a high level of engagement with PeerWise improves exam performance [122]. Given
that the combined measure has the strongest association with exam performance (for both the
multiple choice and non-multiple choice questions), it would seem that is it the combination
of all four activities which has the greatest impact on exam performance [122]. Given that
(after completing the minimum requirements) students can use the system as they see fit to
best serve their needs, the variety of tasks allows students to prioritise the activities that they
believe will most benefit their learning.
Studies in other disciplines and institutions based upon this method have shown
mixed results. A 2010 study examined the change in students’ class rank from their mid-term
to end of course exam performance, and demonstrated that in the winter running of the
course, the more questions answered, the greater the improvement in class ranking, however
in the spring courses there was no such association [136].
In a follow-up to this study, which was undertaken by the PeerWise authors [126],
implementation of PeerWise in three courses that were not taught by the system creators
were analysed to determine if there was an association between PeerWise activity and exam
performance. This was to try to separate out any effects attributable to the enthusiasm for
PeerWise by its creators. In two of the three courses examined there was no significant
correlation between answering or writing questions and exam performance; while, in the
third course, only question authoring proved to have a significant relationship with exam
performance. In this course there was no association between students’ GPA and the number
of questions answered, however, students with a higher GPA were more likely to author
more questions. Since GPA alone explained 30% of the variance in exam score, in contrast
to the 31% explained when including question authoring in the model, it might be concluded
that prior ability was more associated with exam performance than the writing of questions
[126]. These results clearly do little to clarify the mixed picture presented by the preceding
studies.
McQueen et al. [117] highlighted that when 2nd year genetics students were divided
into high and lower activity groupings based on PeerWise score, students with higher
engagement from quartiles 2 (low/intermediate ability) and 4 (high ability) performed
significantly better than students with a lower engagement score. There did not seem to be
such benefit to students in quartiles 1 and 3 [117]. There was however, a significant positive
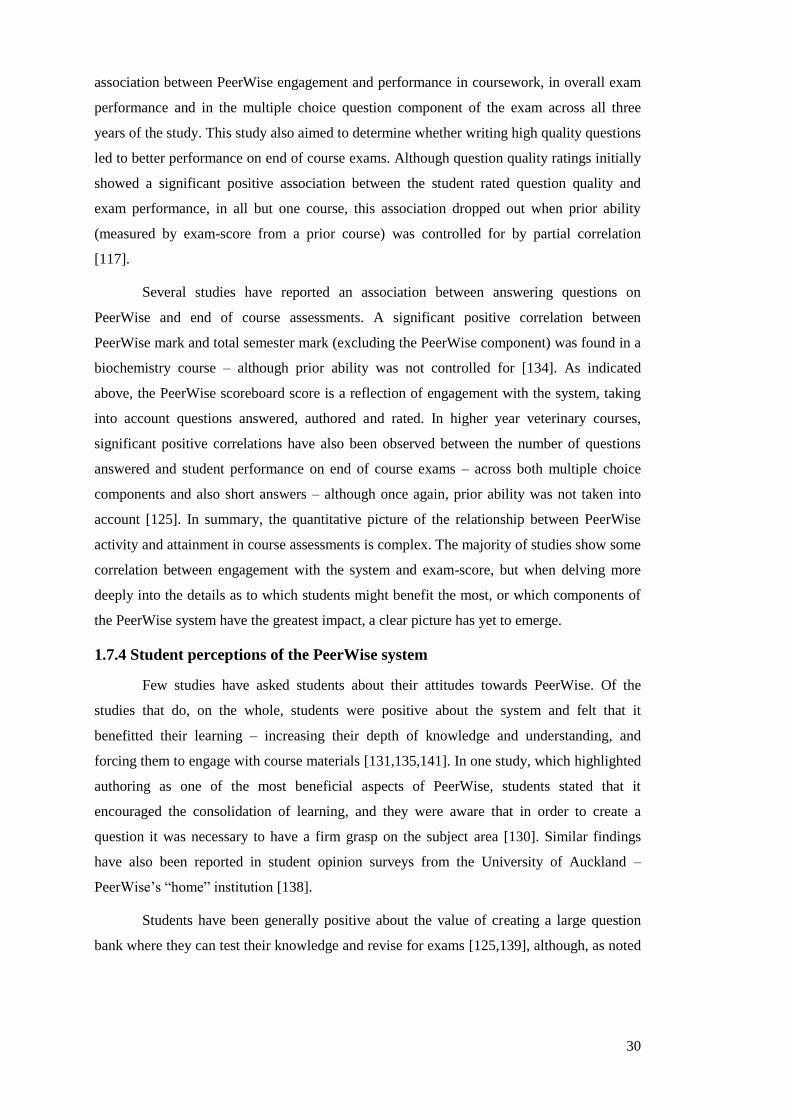
30
association between PeerWise engagement and performance in coursework, in overall exam
performance and in the multiple choice question component of the exam across all three
years of the study. This study also aimed to determine whether writing high quality questions
led to better performance on end of course exams. Although question quality ratings initially
showed a significant positive association between the student rated question quality and
exam performance, in all but one course, this association dropped out when prior ability
(measured by exam-score from a prior course) was controlled for by partial correlation
[117].
Several studies have reported an association between answering questions on
PeerWise and end of course assessments. A significant positive correlation between
PeerWise mark and total semester mark (excluding the PeerWise component) was found in a
biochemistry course – although prior ability was not controlled for [134]. As indicated
above, the PeerWise scoreboard score is a reflection of engagement with the system, taking
into account questions answered, authored and rated. In higher year veterinary courses,
significant positive correlations have also been observed between the number of questions
answered and student performance on end of course exams – across both multiple choice
components and also short answers – although once again, prior ability was not taken into
account [125]. In summary, the quantitative picture of the relationship between PeerWise
activity and attainment in course assessments is complex. The majority of studies show some
correlation between engagement with the system and exam-score, but when delving more
deeply into the details as to which students might benefit the most, or which components of
the PeerWise system have the greatest impact, a clear picture has yet to emerge.
1.7.4 Student perceptions of the PeerWise system
Few studies have asked students about their attitudes towards PeerWise. Of the
studies that do, on the whole, students were positive about the system and felt that it
benefitted their learning – increasing their depth of knowledge and understanding, and
forcing them to engage with course materials [131,135,141]. In one study, which highlighted
authoring as one of the most beneficial aspects of PeerWise, students stated that it
encouraged the consolidation of learning, and they were aware that in order to create a
question it was necessary to have a firm grasp on the subject area [130]. Similar findings
have also been reported in student opinion surveys from the University of Auckland –
PeerWise’s “home” institution [138].
Students have been generally positive about the value of creating a large question
bank where they can test their knowledge and revise for exams [125,139], although, as noted
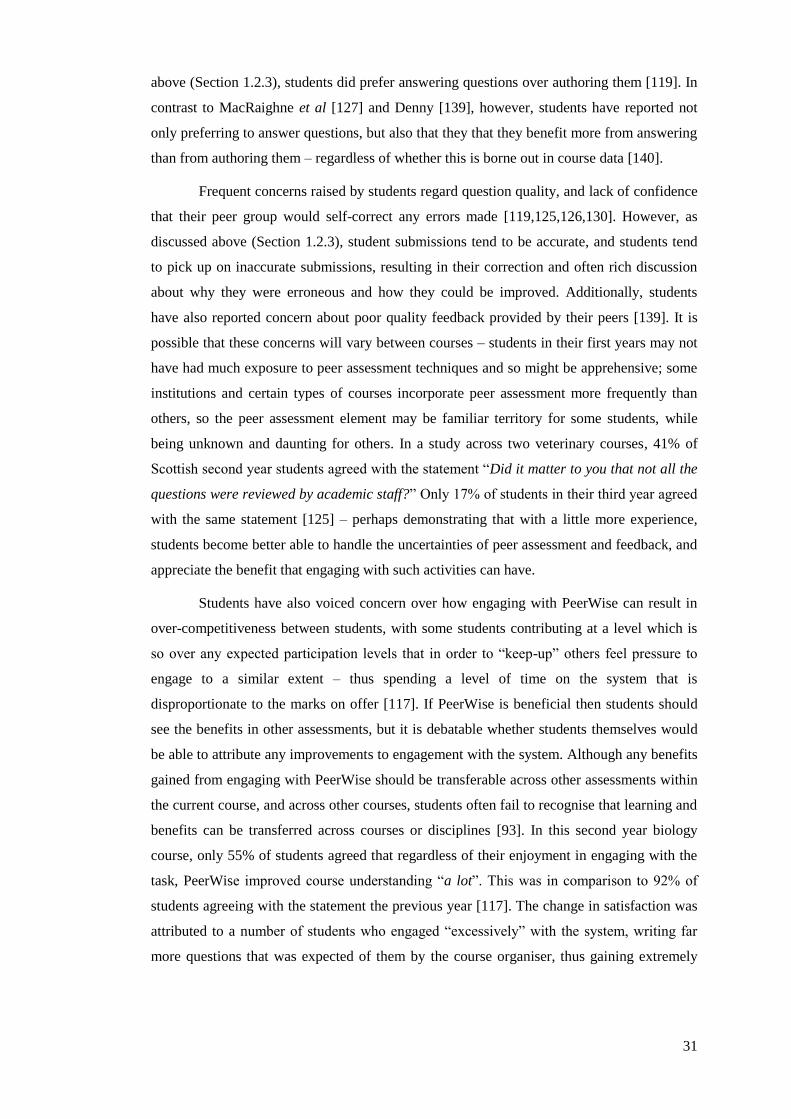
31
above (Section 1.2.3), students did prefer answering questions over authoring them [119]. In
contrast to MacRaighne et al [127] and Denny [139], however, students have reported not
only preferring to answer questions, but also that they that they benefit more from answering
than from authoring them – regardless of whether this is borne out in course data [140].
Frequent concerns raised by students regard question quality, and lack of confidence
that their peer group would self-correct any errors made [119,125,126,130]. However, as
discussed above (Section 1.2.3), student submissions tend to be accurate, and students tend
to pick up on inaccurate submissions, resulting in their correction and often rich discussion
about why they were erroneous and how they could be improved. Additionally, students
have also reported concern about poor quality feedback provided by their peers [139]. It is
possible that these concerns will vary between courses – students in their first years may not
have had much exposure to peer assessment techniques and so might be apprehensive; some
institutions and certain types of courses incorporate peer assessment more frequently than
others, so the peer assessment element may be familiar territory for some students, while
being unknown and daunting for others. In a study across two veterinary courses, 41% of
Scottish second year students agreed with the statement “Did it matter to you that not all the
questions were reviewed by academic staff?” Only 17% of students in their third year agreed
with the same statement [125] – perhaps demonstrating that with a little more experience,
students become better able to handle the uncertainties of peer assessment and feedback, and
appreciate the benefit that engaging with such activities can have.
Students have also voiced concern over how engaging with PeerWise can result in
over-competitiveness between students, with some students contributing at a level which is
so over any expected participation levels that in order to “keep-up” others feel pressure to
engage to a similar extent – thus spending a level of time on the system that is
disproportionate to the marks on offer [117]. If PeerWise is beneficial then students should
see the benefits in other assessments, but it is debatable whether students themselves would
be able to attribute any improvements to engagement with the system. Although any benefits
gained from engaging with PeerWise should be transferable across other assessments within
the current course, and across other courses, students often fail to recognise that learning and
benefits can be transferred across courses or disciplines [93]. In this second year biology
course, only 55% of students agreed that regardless of their enjoyment in engaging with the
task, PeerWise improved course understanding “a lot”. This was in comparison to 92% of
students agreeing with the statement the previous year [117]. The change in satisfaction was
attributed to a number of students who engaged “excessively” with the system, writing far
more questions that was expected of them by the course organiser, thus gaining extremely
32
high PeerWise reputation scores. In this particular course, PeerWise assignment mark is
dependent on the PeerWise reputation score, so other students felt under pressure to engage
to a similar extent. This has forced course organisers to place a limit on the number of
questions a student can author.
In a qualitative study evaluating the benefits of StudySieve (an online application
very similar to PeerWise but which focuses on the construction of free-response questions),
Luxton-Reilly et al. highlight themes raised by students from the open ended question “What
was most helpful to your learning?” included in an end of course survey [141]. Themes
raised from this question demonstrate that students are involved in both “comprehension
fostering activities” such as reviewing course content to write questions; and
“comprehension monitoring activities” – answering questions, evaluating their own
questions and answers and “comparing themselves with others” to assess their own progress.
They engaged in peer assessment by interacting with their peers’ submissions – answering
questions; and reflecting on provided answers to questions and also by receiving feedback
from their peers and evaluating their peers’ performance. As outlined above, the learning
benefits of receiving feedback are limited by the extent to which students incorporate the
feedback into their future performance. There is, however, a lack of research examining the
extent to which students actively engage with peer feedback and how beneficial they find
this aspect of the system.
Activities of question authoring, answering and providing feedback are underpinned
by a body of research that highlights benefits to learning and the development of students’
higher-order skills. Although there has been some work to date evaluating PeerWise itself,
individual studies have been limited to single disciplines, often focussing on one or two
courses or modules, usually across only one or two academic years. In contrast, this thesis
aims to examine student use of PeerWise over three academic years, across six
undergraduate courses which are based in three research intensive UK institutions. This
should enable comparisons to be made more easily across courses, years and even
institutions. Examining the impact of PeerWise across three academic years should also
allow patterns in the relationships between PeerWise use and attainment to be more readily
identifiable.
This work aims to take a holistic approach to the analysis of students’ use of
PeerWise, focusing on each activity undertaken within the system. Unlike prior works,
which have tended to focus on individual PeerWise activities, this research focuses on the
33
relationship between each activity within PeerWise and its association with attainment,
before discussing the relationship between overall engagement and exam performance.
1.8 Thesis structure
Following from this introduction, Chapter 2 describes the PeerWise system in detail,
and sets out the educational context of this study – outlining the nature of each course under
study in terms of its subject area, the demographic make-up of the student body and, of
course, the PeerWise assessment requirements. Chapter 3 discusses the data collected and
statistical tests performed. Chapters 4 to 8 contain the results of both the quantitative and
qualitative data analysis: Chapter 4 builds upon prior research to determine whether there is
consistency in findings between the current work and past research in terms of whether
student levels of ‘connectedness’ within an online network are associated with attainment,
and whether findings from previous PeerWise studies are repeated in the current courses
under study; Chapter 5 explores the relationships between authoring questions and
attainment, and answering questions and attainment; Chapter 6, the relationships between
giving and receiving comments and attainment; Chapter 7 investigates overall engagement
and attainment; and Chapter 8 examines student views of participating in PeerWise. A
discussion of the results and the wider implications of this work is provided in Chapter 9.

34
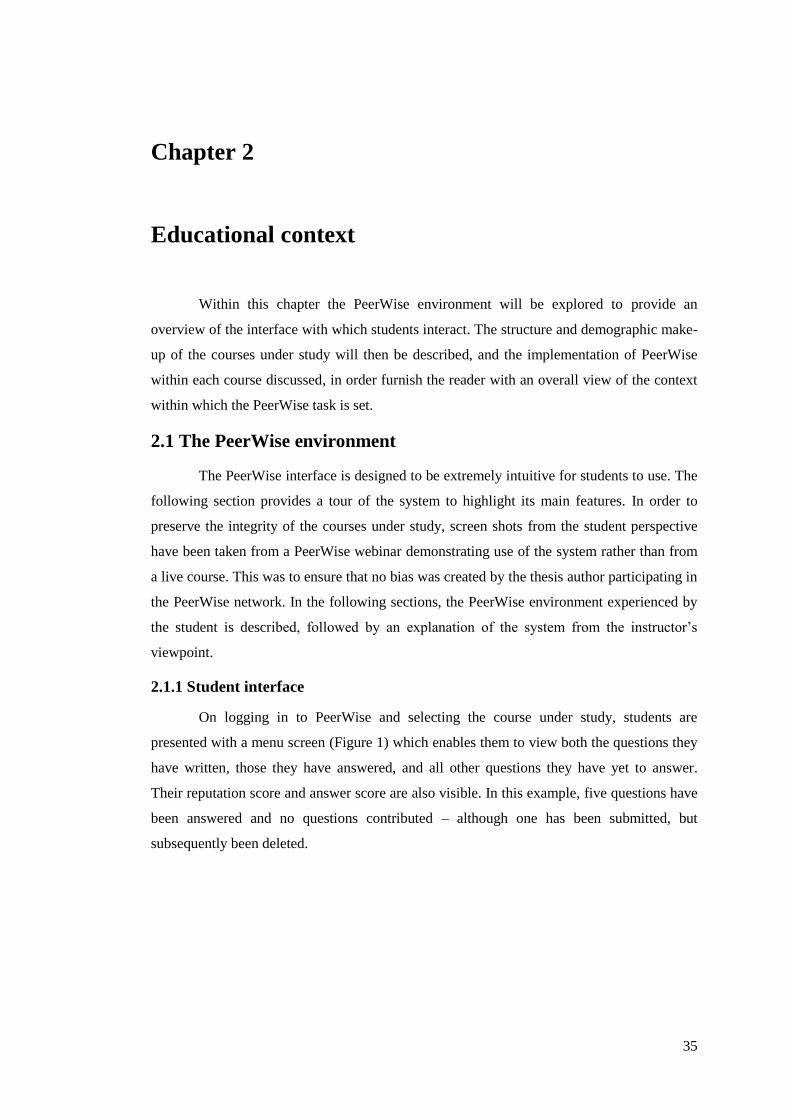
35
Chapter 2
Educational context
Within this chapter the PeerWise environment will be explored to provide an
overview of the interface with which students interact. The structure and demographic make-
up of the courses under study will then be described, and the implementation of PeerWise
within each course discussed, in order furnish the reader with an overall view of the context
within which the PeerWise task is set.
2.1 The PeerWise environment
The PeerWise interface is designed to be extremely intuitive for students to use. The
following section provides a tour of the system to highlight its main features. In order to
preserve the integrity of the courses under study, screen shots from the student perspective
have been taken from a PeerWise webinar demonstrating use of the system rather than from
a live course. This was to ensure that no bias was created by the thesis author participating in
the PeerWise network. In the following sections, the PeerWise environment experienced by
the student is described, followed by an explanation of the system from the instructor’s
viewpoint.
2.1.1 Student interface
On logging in to PeerWise and selecting the course under study, students are
presented with a menu screen (Figure 1) which enables them to view both the questions they
have written, those they have answered, and all other questions they have yet to answer.
Their reputation score and answer score are also visible. In this example, five questions have
been answered and no questions contributed – although one has been submitted, but
subsequently been deleted.
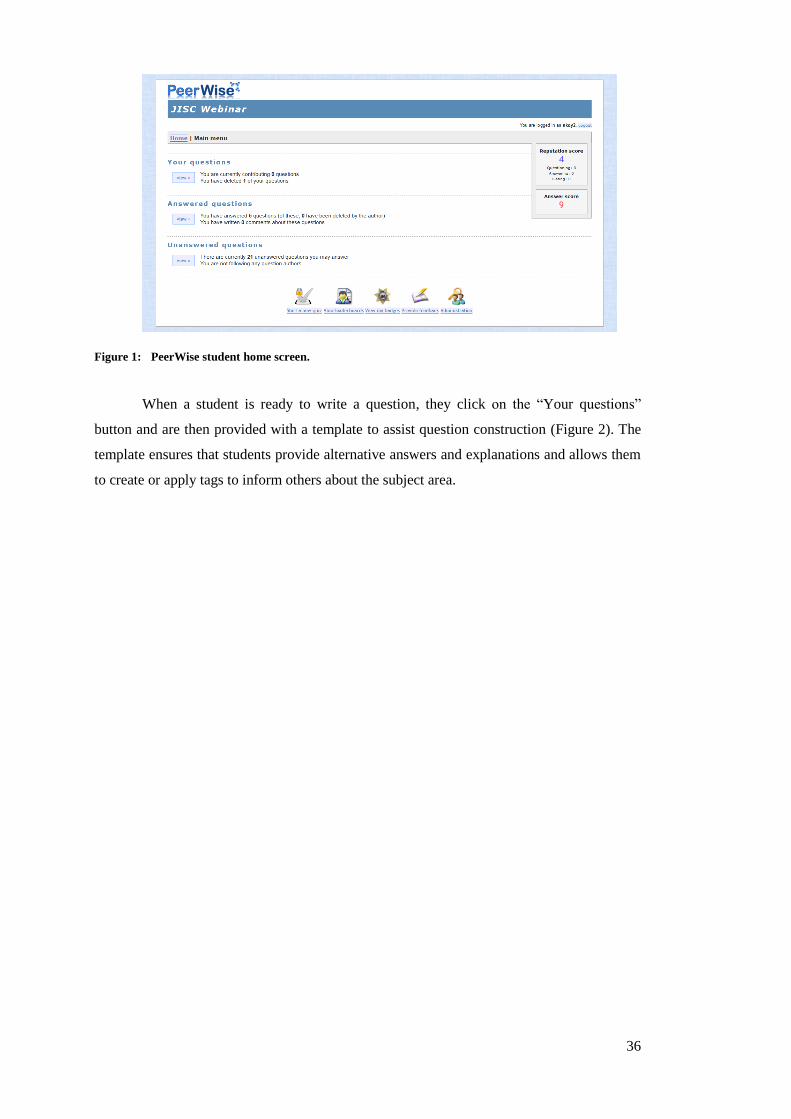
36
Figure 1: PeerWise student home screen.
When a student is ready to write a question, they click on the “Your questions”
button and are then provided with a template to assist question construction (Figure 2). The
template ensures that students provide alternative answers and explanations and allows them
to create or apply tags to inform others about the subject area.
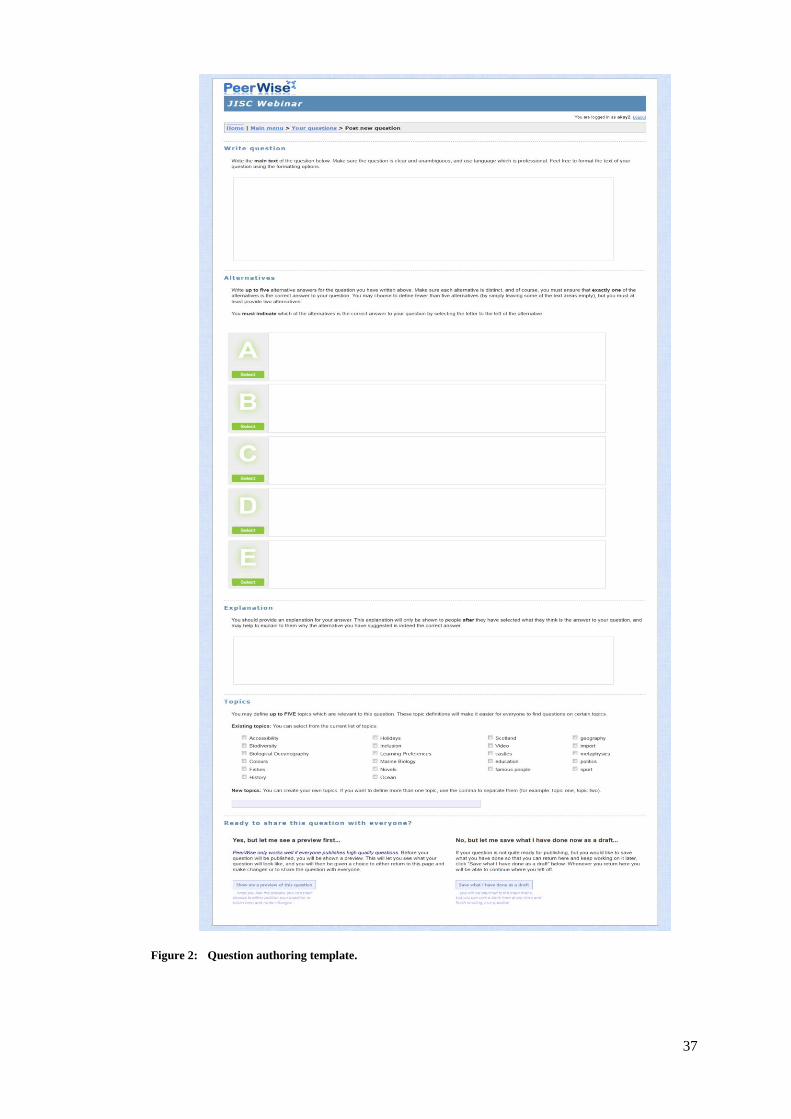
37
Figure 2: Question authoring template.
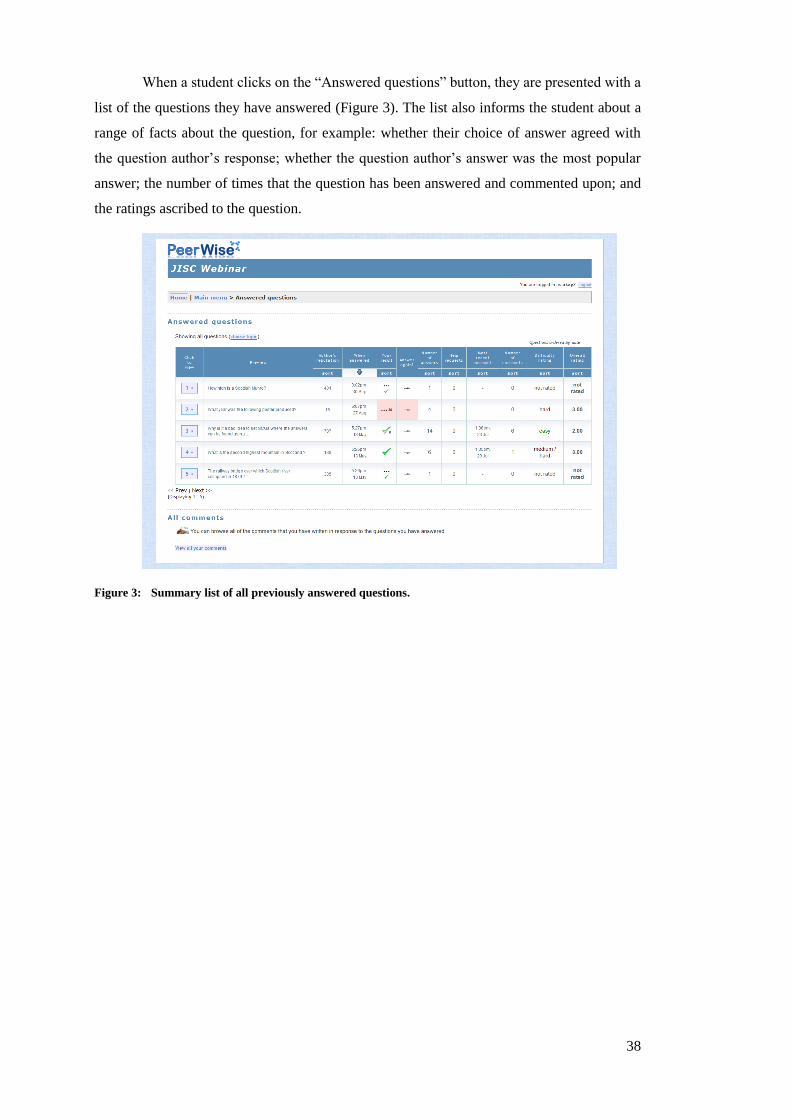
38
When a student clicks on the “Answered questions” button, they are presented with a
list of the questions they have answered (Figure 3). The list also informs the student about a
range of facts about the question, for example: whether their choice of answer agreed with
the question author’s response; whether the question author’s answer was the most popular
answer; the number of times that the question has been answered and commented upon; and
the ratings ascribed to the question.
Figure 3: Summary list of all previously answered questions.
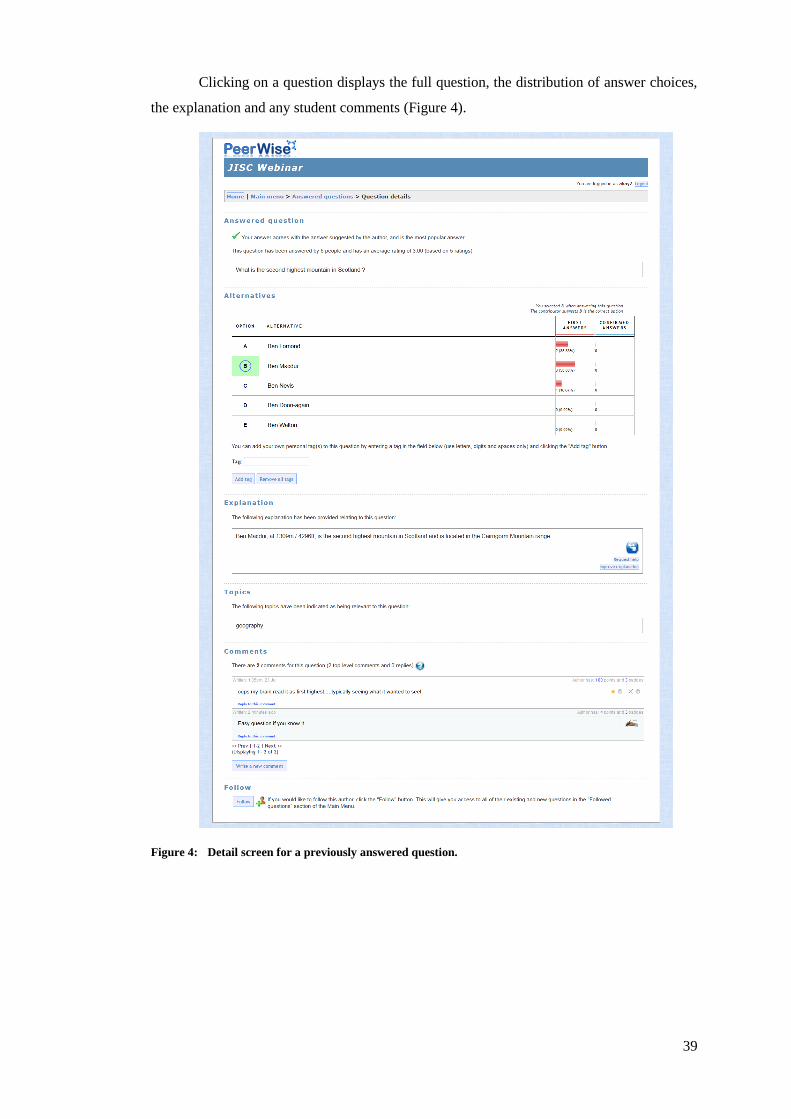
39
Clicking on a question displays the full question, the distribution of answer choices,
the explanation and any student comments (Figure 4).
Figure 4: Detail screen for a previously answered question.
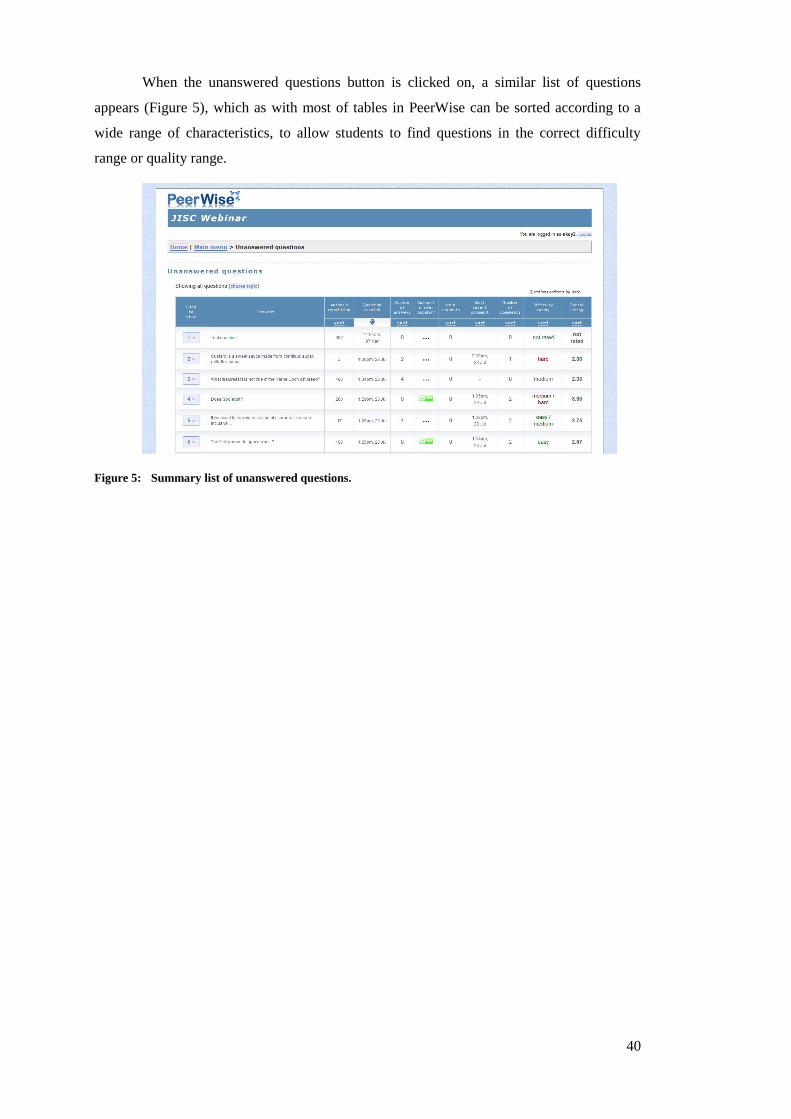
40
When the unanswered questions button is clicked on, a similar list of questions
appears (Figure 5), which as with most of tables in PeerWise can be sorted according to a
wide range of characteristics, to allow students to find questions in the correct difficulty
range or quality range.
Figure 5: Summary list of unanswered questions.
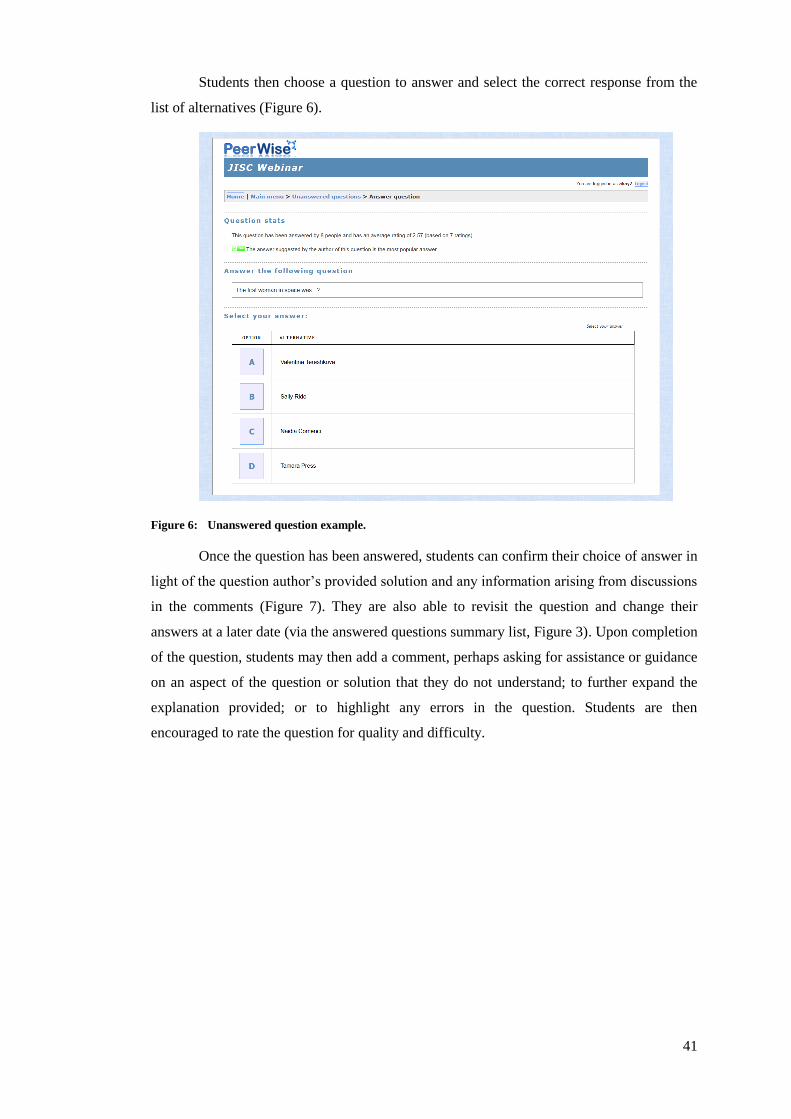
41
Students then choose a question to answer and select the correct response from the
list of alternatives (Figure 6).
Figure 6: Unanswered question example.
Once the question has been answered, students can confirm their choice of answer in
light of the question author’s provided solution and any information arising from discussions
in the comments (Figure 7). They are also able to revisit the question and change their
answers at a later date (via the answered questions summary list, Figure 3). Upon completion
of the question, students may then add a comment, perhaps asking for assistance or guidance
on an aspect of the question or solution that they do not understand; to further expand the
explanation provided; or to highlight any errors in the question. Students are then
encouraged to rate the question for quality and difficulty.
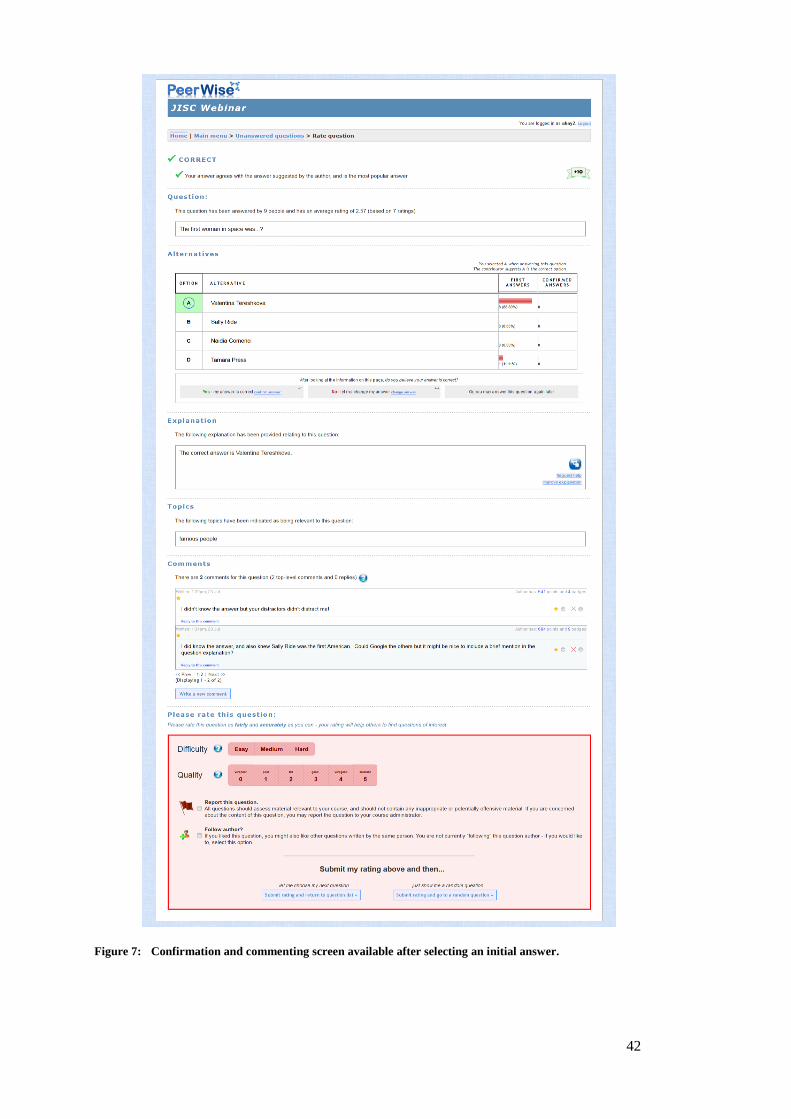
42
Figure 7: Confirmation and commenting screen available after selecting an initial answer.
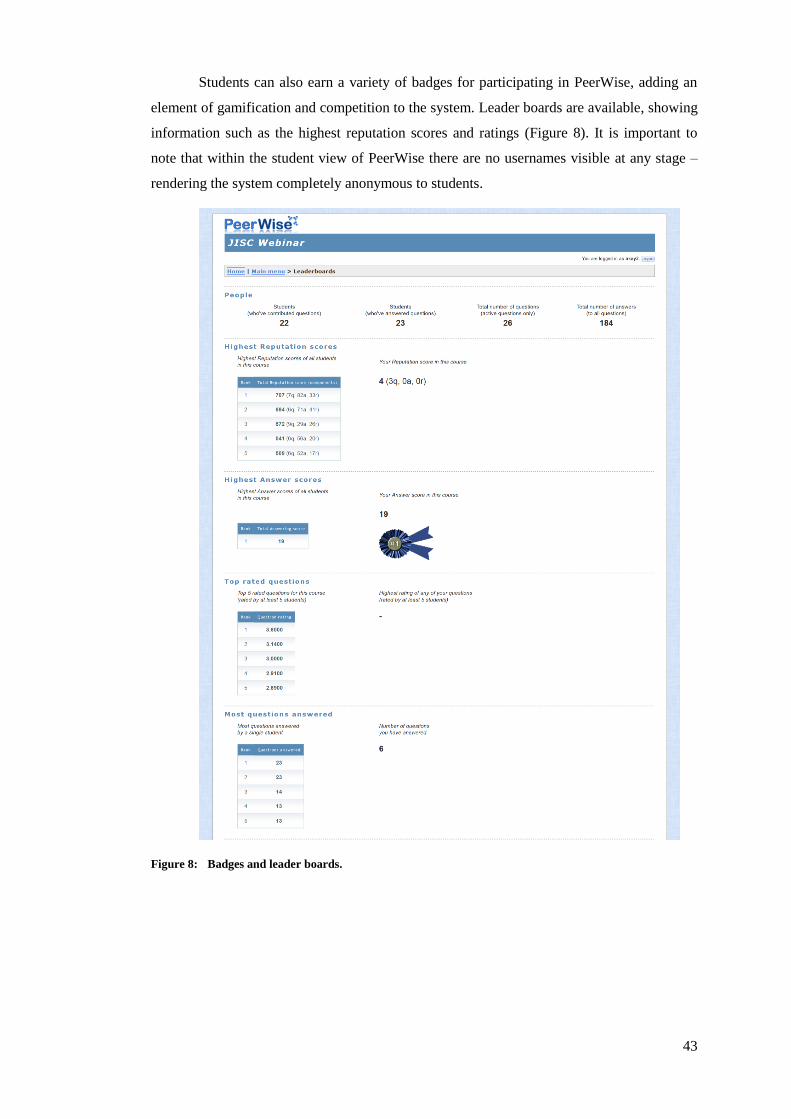
43
Students can also earn a variety of badges for participating in PeerWise, adding an
element of gamification and competition to the system. Leader boards are available, showing
information such as the highest reputation scores and ratings (Figure 8). It is important to
note that within the student view of PeerWise there are no usernames visible at any stage –
rendering the system completely anonymous to students.
Figure 8: Badges and leader boards.
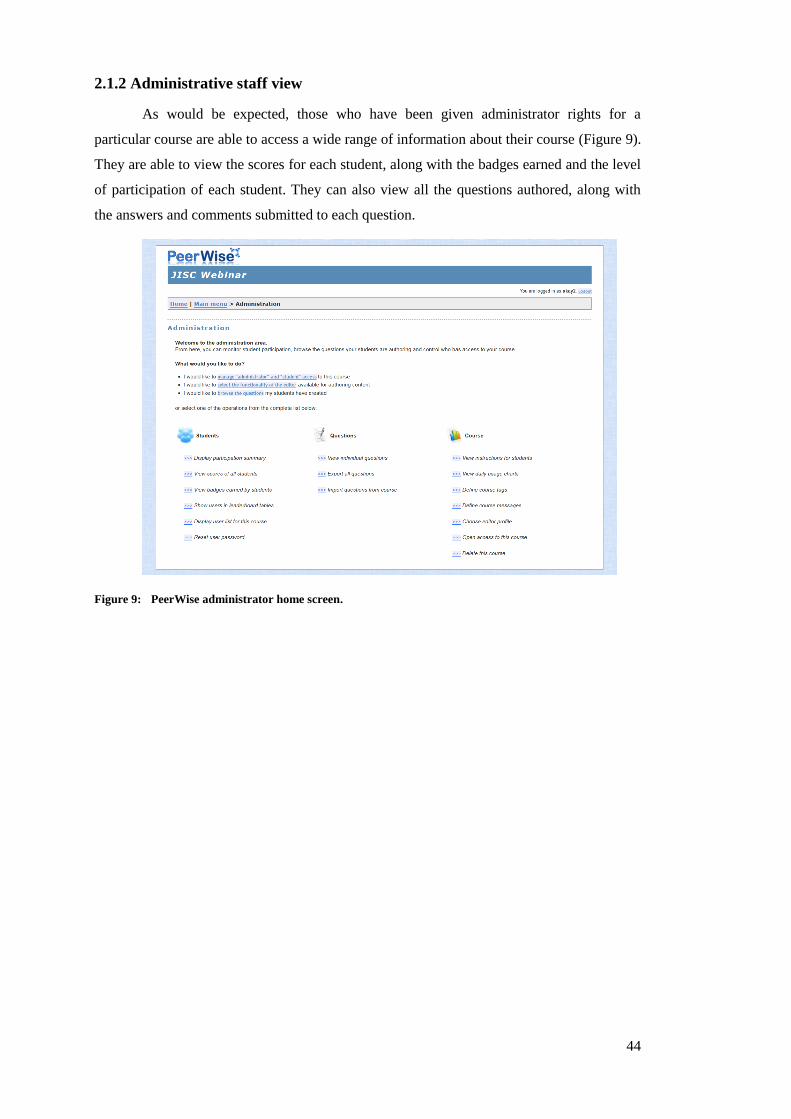
44
2.1.2 Administrative staff view
As would be expected, those who have been given administrator rights for a
particular course are able to access a wide range of information about their course (Figure 9).
They are able to view the scores for each student, along with the badges earned and the level
of participation of each student. They can also view all the questions authored, along with
the answers and comments submitted to each question.
Figure 9: PeerWise administrator home screen.
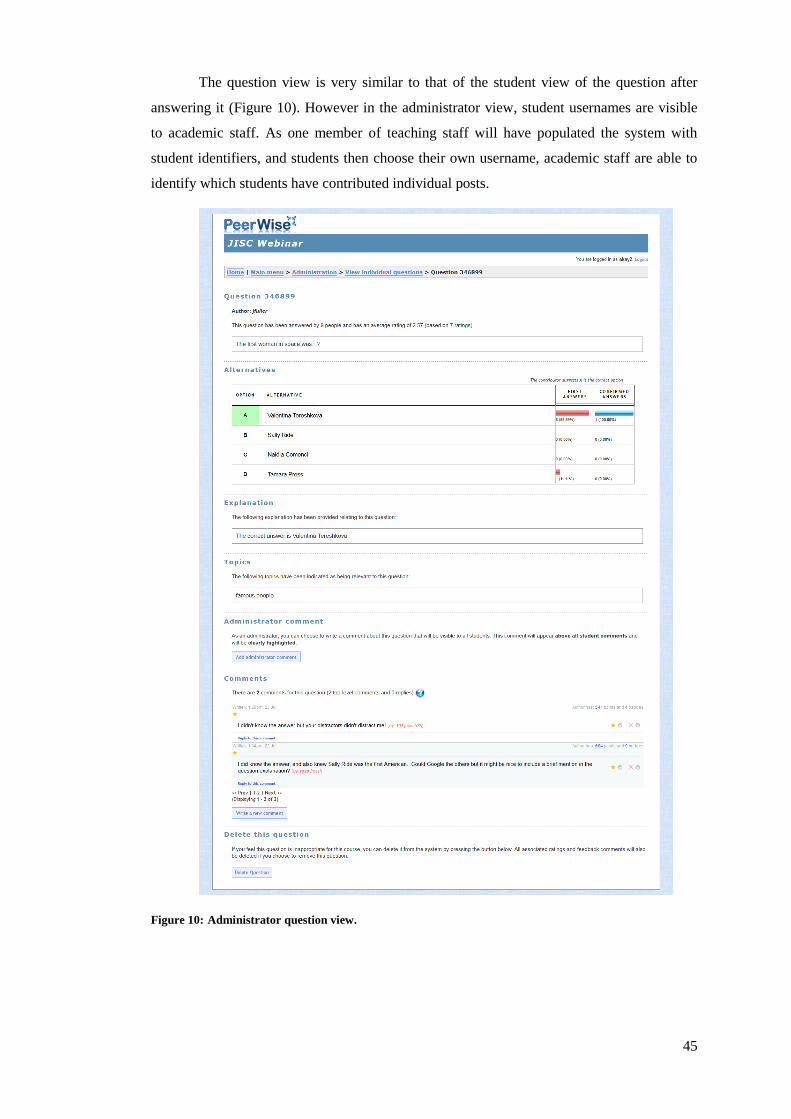
45
The question view is very similar to that of the student view of the question after
answering it (Figure 10). However in the administrator view, student usernames are visible
to academic staff. As one member of teaching staff will have populated the system with
student identifiers, and students then choose their own username, academic staff are able to
identify which students have contributed individual posts.
Figure 10: Administrator question view.
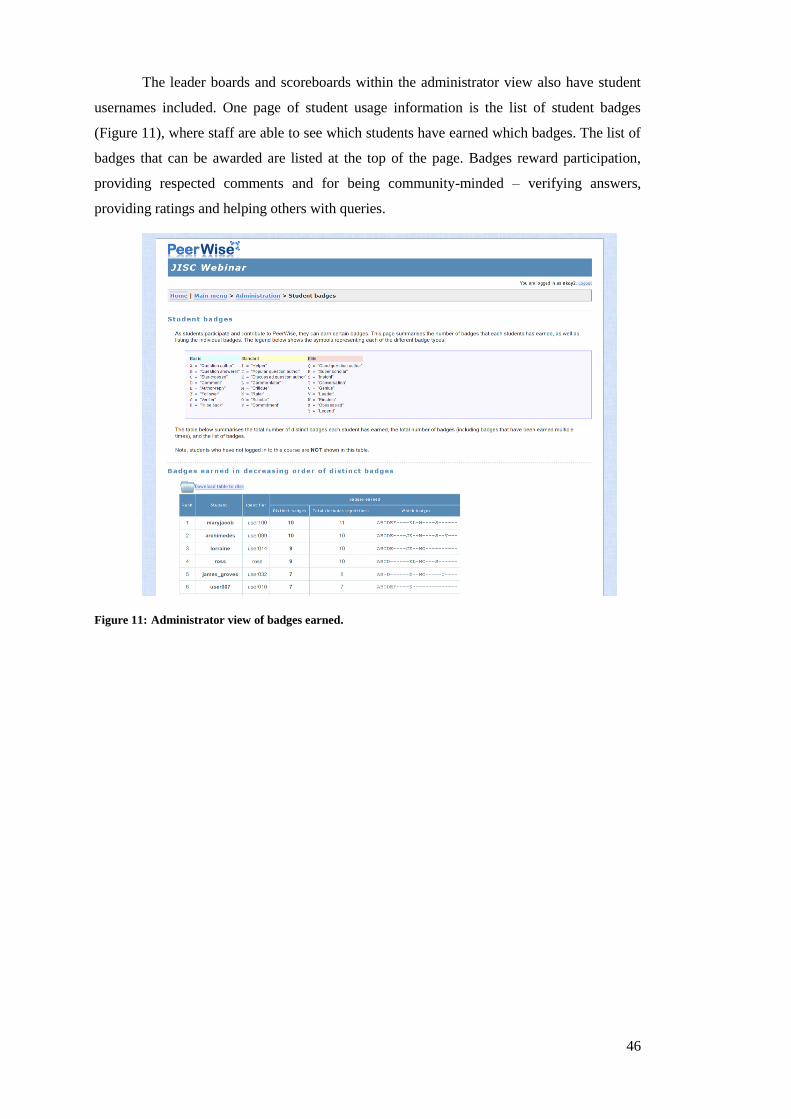
46
The leader boards and scoreboards within the administrator view also have student
usernames included. One page of student usage information is the list of student badges
(Figure 11), where staff are able to see which students have earned which badges. The list of
badges that can be awarded are listed at the top of the page. Badges reward participation,
providing respected comments and for being community-minded – verifying answers,
providing ratings and helping others with queries.
Figure 11: Administrator view of badges earned.
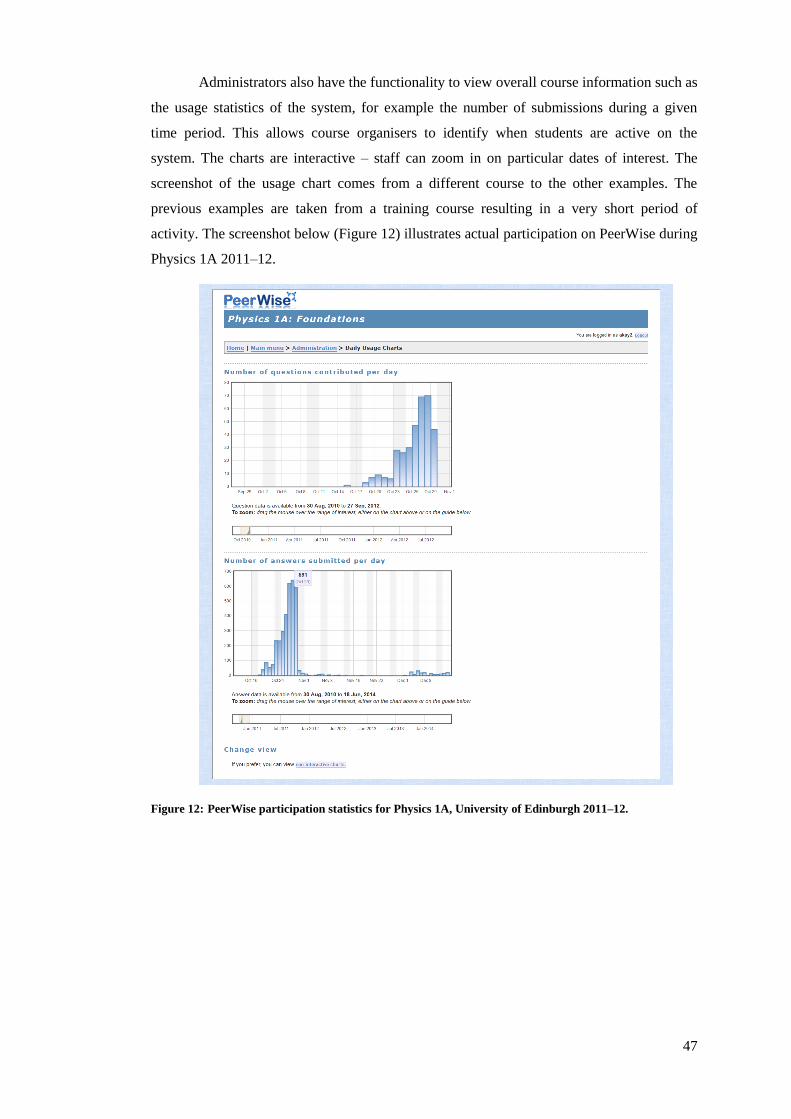
47
Administrators also have the functionality to view overall course information such as
the usage statistics of the system, for example the number of submissions during a given
time period. This allows course organisers to identify when students are active on the
system. The charts are interactive – staff can zoom in on particular dates of interest. The
screenshot of the usage chart comes from a different course to the other examples. The
previous examples are taken from a training course resulting in a very short period of
activity. The screenshot below (Figure 12) illustrates actual participation on PeerWise during
Physics 1A 2011–12.
Figure 12: PeerWise participation statistics for Physics 1A, University of Edinburgh 2011–12.
48
2.2 Integration of PeerWise
The courses under study in this work are based in three research intensive UK
institutions – The University of Edinburgh; The University of Glasgow; and The University
of Nottingham. Four of the courses are based in The University of Edinburgh. The
Universities of Glasgow and Nottingham host one course each. The Universities of
Edinburgh and Glasgow are Scottish institutions where undergraduate honours degrees are
typically four years in duration (although within the sciences there are five year integrated
masters courses on offer) whereas English institutions such as The University of Nottingham
have an honours degree duration of three years (or four years for the integrated masters
degree). Whilst course requirements vary, there is high competition for entry on all of these
undergraduate programmes – student applications outweigh available places – therefore
students enrolling on these courses will all have a high level of entry qualification – often
with the highest possible marks in their school-leaving qualifications [142,143].
Instructors in all six courses were motivated to use PeerWise by a desire to promote
deeper engagement with course materials, with a realization that traditional didactic methods
of teaching may not be the most effective ways to promote deep understanding and to
develop key skills of problem solving, critical thinking and reflection. The incorporation of
PeerWise was part of wider curriculum changes to promote active learning, such as the
adoption of electronic voting through the use of ‘clickers’; Peer Instruction episodes; and the
flipped classroom approach. Such curriculum changes may place great demands on the
instructor. They may be altering many years of practice and will be potentially faced with a
reluctance to change from both colleagues and students. Teaching staff on the courses in
question are highly motivated to use research findings to inform their practice – a key factor
in making the transition from a traditional directive approach to teaching towards
encouraging active learning [144]. Meetings and discussions between the participating
instructors occurred regularly during the years under study. This is an important
consideration, as it has been shown that whilst many instructors believe they implement
active learning activities, or seek to promote higher-order skills, higher-order skills are in
fact, less frequently tested than reported [13], and in fact research based active learning
strategies are often not implemented as the developer of the method intended [145]. This can
result in active learning strategies appearing to make no significant improvement on learning
[146]. As a consequence, previously enthusiastic instructors may become demotivated to
implement innovative strategies, and also in increased scepticism amongst staff who may
prefer more “traditional” approaches to learning. Since the courses in question are not taught
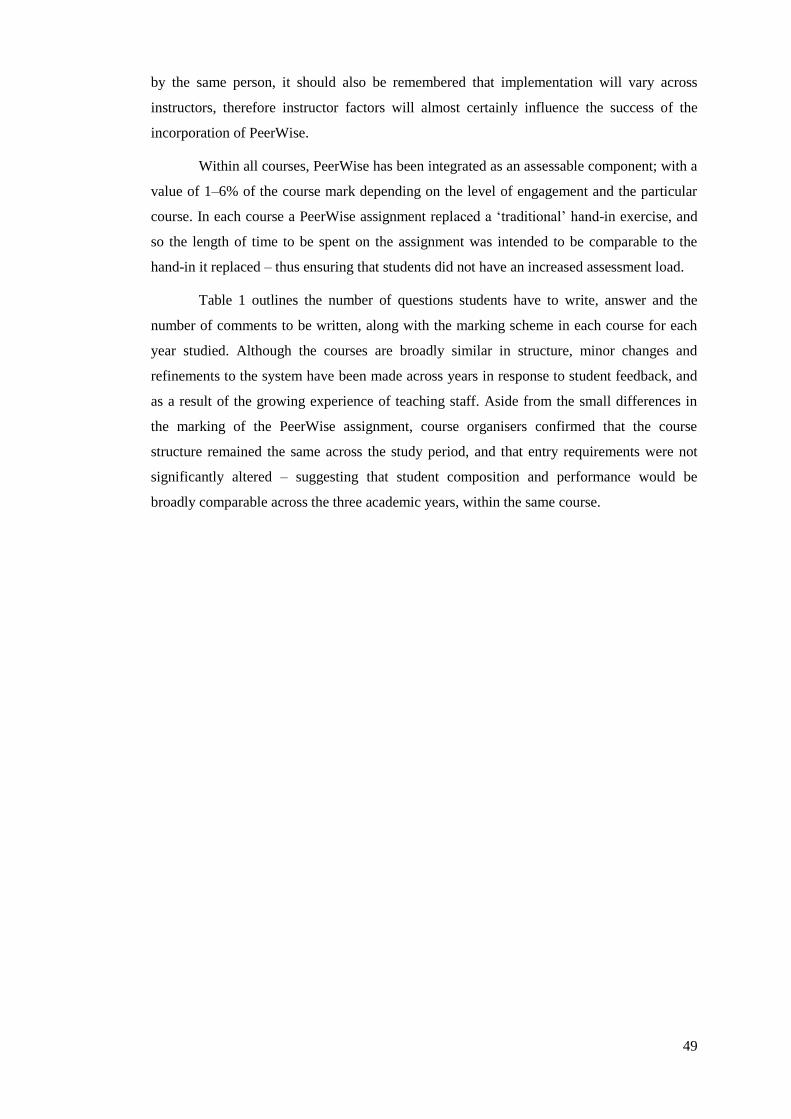
49
by the same person, it should also be remembered that implementation will vary across
instructors, therefore instructor factors will almost certainly influence the success of the
incorporation of PeerWise.
Within all courses, PeerWise has been integrated as an assessable component; with a
value of 1–6% of the course mark depending on the level of engagement and the particular
course. In each course a PeerWise assignment replaced a ‘traditional’ hand-in exercise, and
so the length of time to be spent on the assignment was intended to be comparable to the
hand-in it replaced – thus ensuring that students did not have an increased assessment load.
Table 1 outlines the number of questions students have to write, answer and the
number of comments to be written, along with the marking scheme in each course for each
year studied. Although the courses are broadly similar in structure, minor changes and
refinements to the system have been made across years in response to student feedback, and
as a result of the growing experience of teaching staff. Aside from the small differences in
the marking of the PeerWise assignment, course organisers confirmed that the course
structure remained the same across the study period, and that entry requirements were not
significantly altered – suggesting that student composition and performance would be
broadly comparable across the three academic years, within the same course.
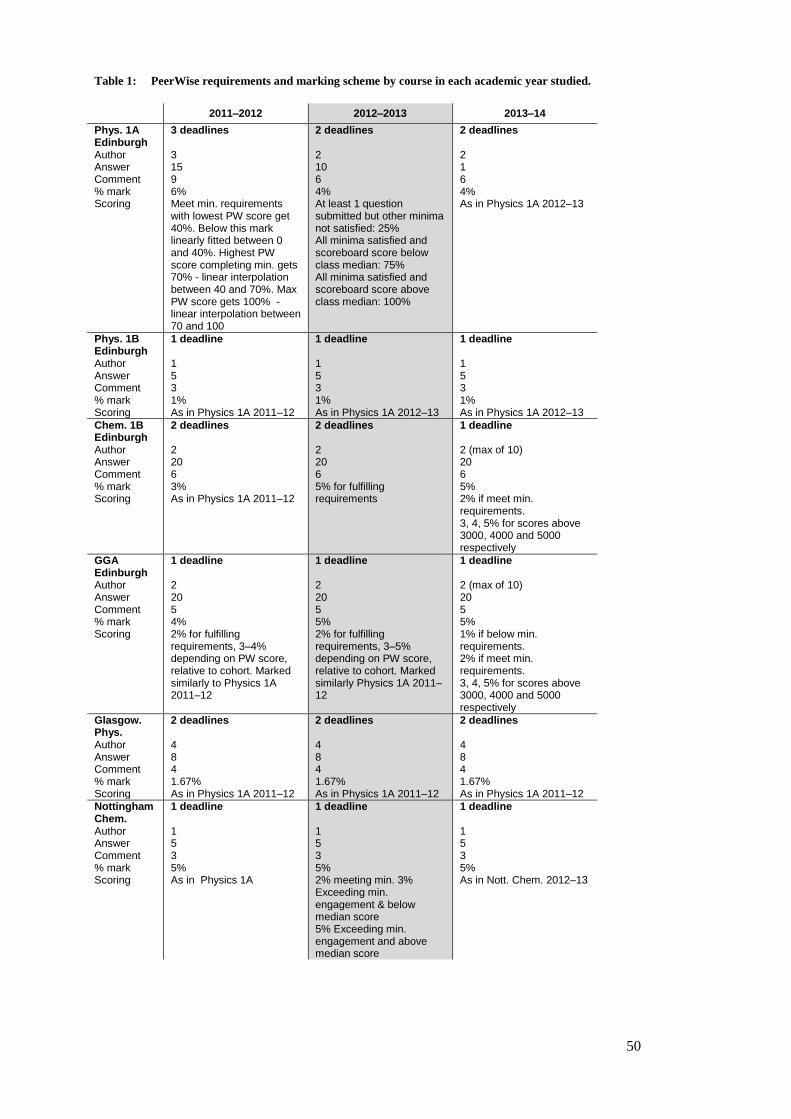
50
Table 1: PeerWise requirements and marking scheme by course in each academic year studied.
2011–2012 2012–2013 2013–14
Phys. 1A Edinburgh Author Answer Comment % mark Scoring
3 deadlines 3 15 9 6% Meet min. requirements with lowest PW score get 40%. Below this mark linearly fitted between 0 and 40%. Highest PW score completing min. gets 70% - linear interpolation between 40 and 70%. Max PW score gets 100% - linear interpolation between 70 and 100
2 deadlines 2 10 6 4% At least 1 question submitted but other minima not satisfied: 25% All minima satisfied and scoreboard score below class median: 75% All minima satisfied and scoreboard score above class median: 100%
2 deadlines 2 1 6 4% As in Physics 1A 2012–13
Phys. 1B Edinburgh Author Answer Comment % mark Scoring
1 deadline 1 5 3 1% As in Physics 1A 2011–12
1 deadline 1 5 3 1% As in Physics 1A 2012–13
1 deadline 1 5 3 1% As in Physics 1A 2012–13
Chem. 1B Edinburgh Author Answer Comment % mark Scoring
2 deadlines 2 20 6 3% As in Physics 1A 2011–12
2 deadlines 2 20 6 5% for fulfilling requirements
1 deadline 2 (max of 10) 20 6 5% 2% if meet min. requirements. 3, 4, 5% for scores above 3000, 4000 and 5000 respectively
GGA Edinburgh Author Answer Comment % mark Scoring
1 deadline 2 20 5 4% 2% for fulfilling requirements, 3–4% depending on PW score, relative to cohort. Marked similarly to Physics 1A 2011–12
1 deadline 2 20 5 5% 2% for fulfilling requirements, 3–5% depending on PW score, relative to cohort. Marked similarly Physics 1A 2011–12
1 deadline 2 (max of 10) 20 5 5% 1% if below min. requirements. 2% if meet min. requirements. 3, 4, 5% for scores above 3000, 4000 and 5000 respectively
Glasgow. Phys. Author Answer Comment % mark Scoring
2 deadlines 4 8 4 1.67% As in Physics 1A 2011–12
2 deadlines 4 8 4 1.67% As in Physics 1A 2011–12
2 deadlines 4 8 4 1.67% As in Physics 1A 2011–12
Nottingham Chem. Author Answer Comment % mark Scoring
1 deadline 1 5 3 5% As in Physics 1A
1 deadline 1 5 3 5% 2% meeting min. 3% Exceeding min. engagement & below median score 5% Exceeding min. engagement and above median score
1 deadline 1 5 3 5% As in Nott. Chem. 2012–13
51
One of the key differences in the implementation of PeerWise between these courses
is the way marks are assigned to the task. Although the details of the assessment criteria vary
according to year and course, in essence all courses use the PeerWise scoreboard score as
part of the criteria. The precise algorithm used for calculating scoreboard score is not made
publically available. However, the score depends both on the performance of an individual in
setting and answering questions, and also on the feedback obtained from their peers – e.g. a
student’s score will increase if other students choose the suggested answer to one of his or
her questions. Where the assignment of marks depends on reaching a particular score, or
having a high enough rank within the class, a student’s grade is no longer in their sole
control; instead it depends on the actions of other people in the class. Although PeerWise is
in effect a very small portion of each course – this normative-style of marking may be
thought to be at odds with the criteria-referenced assessment normally adopted in UK
universities.
2.3 Courses under study
The remainder of this chapter outlines the PeerWise assessment requirements and
the demographic breakdown for each of the eighteen courses under examination in this
thesis.
2.3.1 Physics 1A
Physics 1A is a Scottish first year, first semester introductory physics course at the
University of Edinburgh focusing on concepts of classical physics such as Newtonian
mechanics. Although all enrolled students should have a performed well in physics at school
level, there is a wide range of physics (and mathematical) backgrounds. Students having
undertaken A-levels and Advanced Highers are all likely to have already encountered many
concepts in their previous studies; however there are differences in the content of the syllabi
between the different school qualifications. Additionally, Students from Scottish schools can
enter with only Higher Level physics – a lower level qualification, with less overlap in the
material covered. A key aspect of the course is to ensure all students attain the same level of
knowledge and understanding to prepare them for their future studies. Moreover, each year
there are a number of students who have been educated outwith the UK – from the EU and
further afield, further increasing the diversity in entry levels of physics knowledge and
understanding.
Innovative teaching practices such as the flipped classroom; the use of clickers and
peer instruction; the use of open book exams; and of course PeerWise, have been introduced
to ensure students have a solid understanding of the material and to identify and overcome
52
conceptual misunderstandings. The end of course exam follows an open book format. All
students tackle a section of short answer questions and they then choose one question from
two in each of two other sections to answer. There is no multiple choice component in this
exam.
Table 2 shows that the demographic breakdown in Physics 1A is very similar across
all years studied. Scottish students comprise about half, and non-majors just over half of the
number of students. The gender balance is more uneven, with male students commanding a
large majority – around 70% of students enrolled in the course.
Table 2: Physics 1A student demographics
n dataset
(% of class list)
n Scottish-schooled
(%)
n non-Scottish-schooled
(%)
n male (%)
n female (%)
n major (%)
n non-major (%)
2011–12 172 (83.1) 98 (57.0) 74 (43.0) 122 (70.9) 50 (29.1) 69 (40.1) 103 (59.1)
2012–13 245 (84.2) 137 (55.9) 108 (44.1) 199 (81.2) 46 (18.8) 91 (37.1) 153 (62.9)
2013–14 269 (88.2) 101 (43.0) 168 (57.0) 190 (70.6) 79 (29.4) 129 (48.0) 140 (52.0)
2.3.2 Physics 1B
Physics 1B is a second semester course at the University of Edinburgh introducing
concepts of quantum physics and matter at large and small scales. The class is taught in a
more traditional style than Physics 1A, however, the exam remains in open book format.
Similarly to Physics 1A, there are no multiple choice questions to answer – students must
attempt all short answer questions in the first section and then choose a further three
extended answer questions for the remainder of the paper.
As in Physics 1A, the composition of the class remains relatively stable across years;
however, as detailed in Table 3, over half of the students enrolled are excluded from the
dataset each year due to not having a pre-score or due to not enrolling on PeerWise (more
detail in Chapter 3). Despite this, there is still an acceptable number of students in the dataset
to conduct statistical analysis and given that the demographic proportions of students in this
subset are similar to the proportions in the course as it whole, it is reasonable to assume that
the analysed subset is representative of the course. The proportions of Scottish and non-
Scottish students remain roughly equal and stable over the three years, as do the proportion
of majors and non-majors. The gender balance also remains stable, with male students in the
majority.
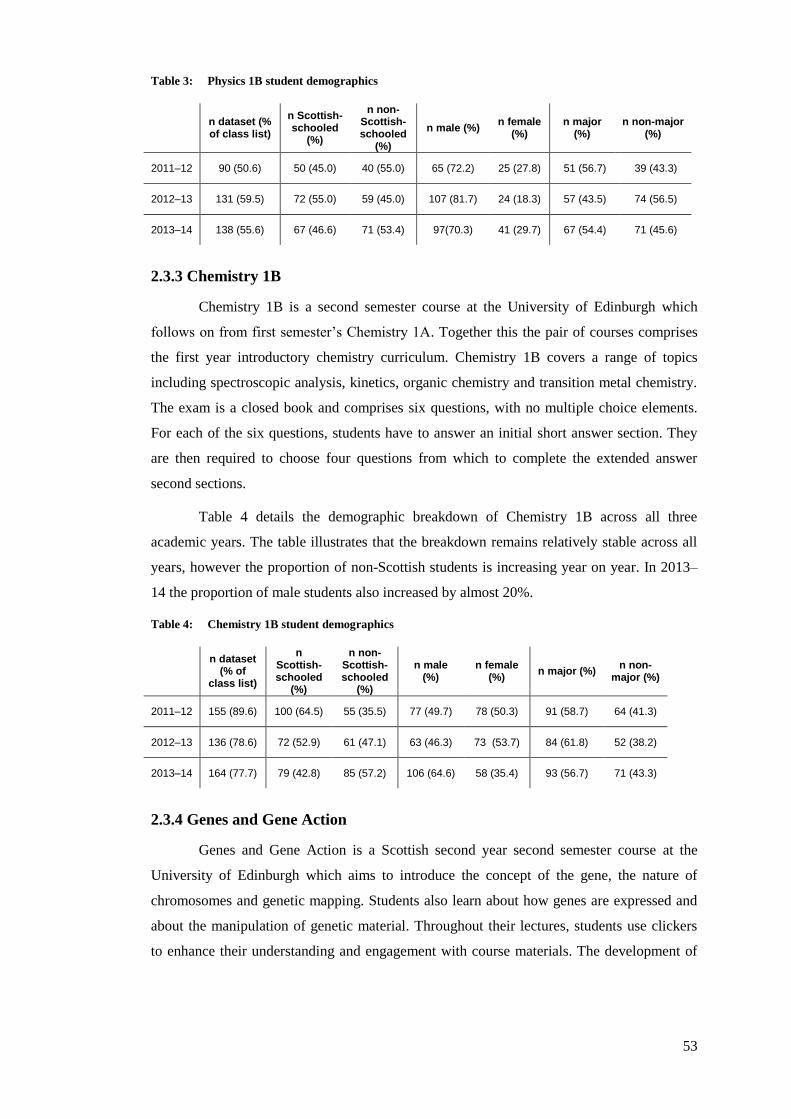
53
Table 3: Physics 1B student demographics
n dataset (% of class list)
n Scottish-schooled
(%)
n non-Scottish-schooled
(%)
n male (%) n female
(%) n major
(%) n non-major
(%)
2011–12 90 (50.6) 50 (45.0) 40 (55.0) 65 (72.2) 25 (27.8) 51 (56.7) 39 (43.3)
2012–13 131 (59.5) 72 (55.0) 59 (45.0) 107 (81.7) 24 (18.3) 57 (43.5) 74 (56.5)
2013–14 138 (55.6) 67 (46.6) 71 (53.4) 97(70.3) 41 (29.7) 67 (54.4) 71 (45.6)
2.3.3 Chemistry 1B
Chemistry 1B is a second semester course at the University of Edinburgh which
follows on from first semester’s Chemistry 1A. Together this the pair of courses comprises
the first year introductory chemistry curriculum. Chemistry 1B covers a range of topics
including spectroscopic analysis, kinetics, organic chemistry and transition metal chemistry.
The exam is a closed book and comprises six questions, with no multiple choice elements.
For each of the six questions, students have to answer an initial short answer section. They
are then required to choose four questions from which to complete the extended answer
second sections.
Table 4 details the demographic breakdown of Chemistry 1B across all three
academic years. The table illustrates that the breakdown remains relatively stable across all
years, however the proportion of non-Scottish students is increasing year on year. In 2013–
14 the proportion of male students also increased by almost 20%.
Table 4: Chemistry 1B student demographics
n dataset
(% of class list)
n Scottish-schooled
(%)
n non-Scottish-schooled
(%)
n male (%)
n female (%)
n major (%) n non-
major (%)
2011–12 155 (89.6) 100 (64.5) 55 (35.5) 77 (49.7) 78 (50.3) 91 (58.7) 64 (41.3)
2012–13 136 (78.6) 72 (52.9) 61 (47.1) 63 (46.3) 73 (53.7) 84 (61.8) 52 (38.2)
2013–14 164 (77.7) 79 (42.8) 85 (57.2) 106 (64.6) 58 (35.4) 93 (56.7) 71 (43.3)
2.3.4 Genes and Gene Action
Genes and Gene Action is a Scottish second year second semester course at the
University of Edinburgh which aims to introduce the concept of the gene, the nature of
chromosomes and genetic mapping. Students also learn about how genes are expressed and
about the manipulation of genetic material. Throughout their lectures, students use clickers
to enhance their understanding and engagement with course materials. The development of
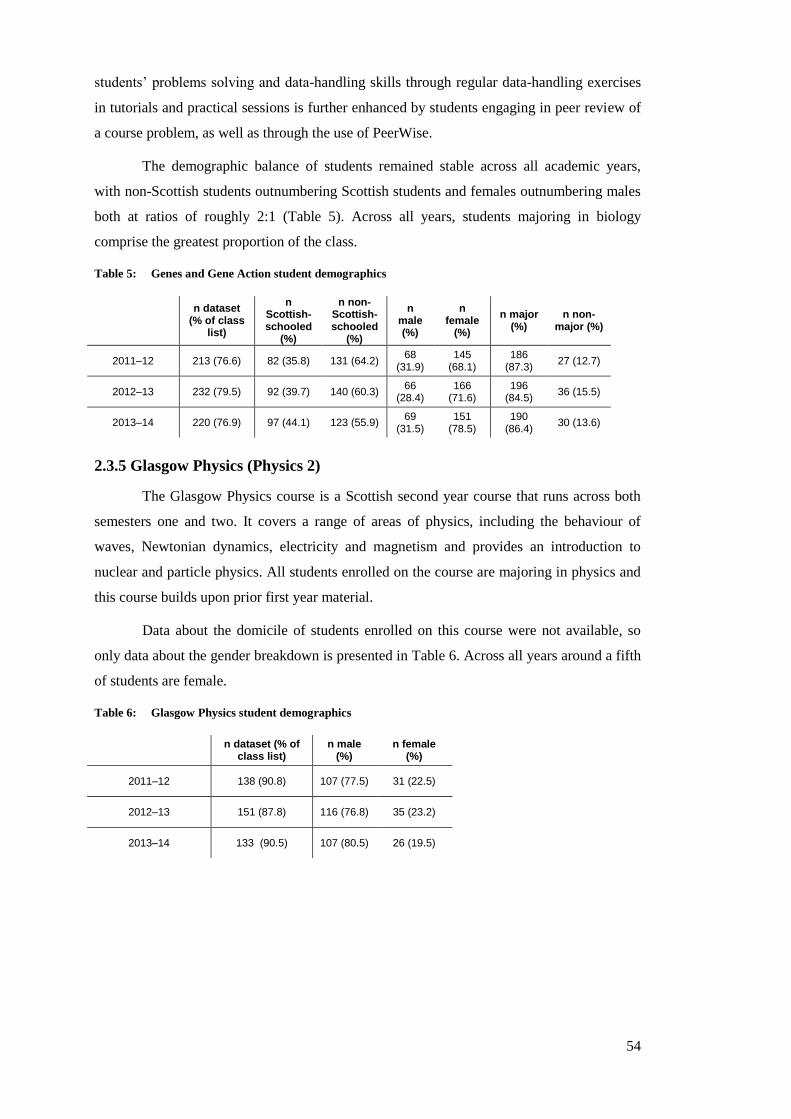
54
students’ problems solving and data-handling skills through regular data-handling exercises
in tutorials and practical sessions is further enhanced by students engaging in peer review of
a course problem, as well as through the use of PeerWise.
The demographic balance of students remained stable across all academic years,
with non-Scottish students outnumbering Scottish students and females outnumbering males
both at ratios of roughly 2:1 (Table 5). Across all years, students majoring in biology
comprise the greatest proportion of the class.
Table 5: Genes and Gene Action student demographics
n dataset
(% of class list)
n Scottish-schooled
(%)
n non-Scottish-schooled
(%)
n male (%)
n female
(%)
n major (%)
n non-major (%)
2011–12 213 (76.6) 82 (35.8) 131 (64.2) 68
(31.9) 145
(68.1) 186
(87.3) 27 (12.7)
2012–13 232 (79.5) 92 (39.7) 140 (60.3) 66
(28.4) 166
(71.6) 196
(84.5) 36 (15.5)
2013–14 220 (76.9) 97 (44.1) 123 (55.9) 69
(31.5) 151
(78.5) 190
(86.4) 30 (13.6)
2.3.5 Glasgow Physics (Physics 2)
The Glasgow Physics course is a Scottish second year course that runs across both
semesters one and two. It covers a range of areas of physics, including the behaviour of
waves, Newtonian dynamics, electricity and magnetism and provides an introduction to
nuclear and particle physics. All students enrolled on the course are majoring in physics and
this course builds upon prior first year material.
Data about the domicile of students enrolled on this course were not available, so
only data about the gender breakdown is presented in Table 6. Across all years around a fifth
of students are female.
Table 6: Glasgow Physics student demographics
n dataset (% of
class list) n male
(%) n female
(%)
2011–12 138 (90.8) 107 (77.5) 31 (22.5)
2012–13 151 (87.8) 116 (76.8) 35 (23.2)
2013–14 133 (90.5) 107 (80.5) 26 (19.5)

55
2.3.6 Nottingham Chemistry (Foundations of Chemistry)
Foundations of Chemistry is a full year compulsory course with PeerWise
introduced in the second semester as a synoptic revision exercise. Topics covered include the
atomic structure; and introduction to stereochemistry; period trends in elemental and atomic
properties and the behaviour of gases – introducing concepts such as entropy, enthalpy and
thermodynamics.
This is a first year course at an English university, so is aimed at a level which
approximates to a Scottish university’s second year. Even so, topics are introduced at an A-
level standard in order to accommodate the range of study backgrounds within the cohort
(particularly with respect to mathematical understanding). By the end of the course, all
students should have achieved a similar theoretical foundation for the later years of study.
All students on this course are chemistry majors, and, given that this is an English
university, there are too few Scottish students to include Scottish domicile a statistical
analysis so Table 7 details only the gender breakdown of the course. In all years, male
students outnumber female students at a ratio of around 2:1.
Table 7: Nottingham Chemistry student demographics
n dataset (% of
class list) n male (%) n female (%)
2011–12 162 (95.9) 107 (66.0) 55 (34.0)
2012–13 167 (92.3) 101 (60.5) 66 (39.5)
2013–14 155 (85.6) 93 (60.0) 62 (40.0)

56
57
Chapter 3
Student data and statistical tests
The analyses reported in this thesis are both quantitative and qualitative in nature.
Data from five sources were collected. Three sources pertain to the quantitative aspect of the
analysis, the remaining two to the qualitative aspects. Descriptive statistics of the
quantitative student data are outlined in Appendix A.
3.1 Student data
End of course exam scores for each student were gathered as a measure of post-
PeerWise attainment. Within each of the courses studied, across the three years, there were
no structural changes to the format of each final exam. This ensures fair comparison can be
made within each course, across each year.
3.1.1 Quantitative data
End of course exam score was used rather than overall course score to isolate the
effects of PeerWise, as PeerWise was an assessable component of each course and other
assessments may have been completed prior to the end of the PeerWise assignment. In each
course, the exam is the main summative component of assessment and, with the exception of
Glasgow Physics (which requires an overall passing grade to satisfactorily complete the
course), students must obtain a pass mark in the exam as well as in the course overall to
successfully complete the course. PeerWise may of course have effects on coursework
attainment. However, each course has a different balance between items of coursework and
exam, while the timings of assignments relative to PeerWise deadlines are also not consistent
across courses, so students may have had more or less exposure to PeerWise at the time of
coursework completion. For all these reasons the effect of PeerWise on coursework
attainment or overall course score was not investigated in this work. The diversity in subject
areas and in institutions, render the format and structure of the end of course exams
inconsistent across courses. Nevertheless many commonalities exist. The concept of an end
of course exam is fairly standard across institutions and disciplines. There is a somewhat
58
unified understanding of what to expect in an exam: there will be a time limit; questions will
be broken into sections; and it is a format undertaken strictly by one individual with no input
from their peers. Although Physics 1A and Physics 1B have an open book format, the
structure of the exam is arguably recognisable to any student or academic within STEM
disciplines. Elite institutions generally come from similar starting points with accreditation
bodies such as the Institute of Physics and the Royal Society of Chemistry driving
commonality and comparability.
The second source of student data was a measure of prior attainment for each
student. These data were collected to allow statistical control of the effects of prior ability on
exam score. Course organisers were asked to identify a test, or a previous course, undertaken
prior to the introduction of PeerWise, which was either a prerequisite for enrolling on the
course, or was a compulsory component within the course under study. In Physics 1A, a first
semester of first year course, students had no prior university experience before enrolling. As
most students arrive into Physics 1A with similar exam results, school attainment grades
tend not to discriminate enough between students to be an appropriate measure. In Physics
1A (Phys. 1A) prior ability was measured by performance at the start of the course on the
Force Concept Inventory (FCI) [147] – a diagnostic test to measure student understanding of
the Newtonian concept of force was taken as the “pre-score”. With the exception of a very
small number of students each year, students enrolled on Physics 1B (Phys. 1B), have
previously taken Physics 1A, therefore their final exam score in Physics 1A (so as not to
count directly prior PeerWise performance) was used as a proxy for ability. Similarly in
Chemistry 1B (Chem. 1B) it is a requirement to have completed Chemistry 1A before
enrolling, therefore exam score in Chemistry 1A was determined to be the most accurate
measure. In both Physics 2 (Glasgow Physics or Glas. Phys.) and Foundations of Chemistry
(Nottingham Chemistry or Nott. Chem.), class tests carried out before the introduction of
PeerWise were considered to be the most reliable indicator of ability – these class tests were
compulsory for all students to complete. The second year semester two biology course Genes
and Gene Action (GGA) was the only course to use an exam score from the previous
academic year. In this case, exam performance on Molecules, Genes and Cells (MGC), a
prerequisite first year semester two course covering the structures of proteins and the growth
and development of cells, was used.
The third source of data was obtained from the usage statistics of PeerWise itself.
Information was obtained about the questions authored – including the full question with
distractors and explanations; the questions answered – including the actual answer each
student had provided; the comments written; the tags generated for each question and the
59
number of days each student was active on the system. Data from the first day of the course
up until the day of the final course exam was included in the analysis. Any submissions or
changes to the system that happened after the first exam diet (i.e. during revision for the re-
sit diet) were not included in this analysis.
Results of the quantitative analysis are presented in Chapters 4, 5, 6 and 7; with
further detail about how the datasets were constructed outlined in Section 3.2 below.
3.1.2 Qualitative data
The fourth data source was end of course questionnaires. End of course surveys were
only obtained from students undertaking the Physics 1A and 1B courses and Genes and Gene
Action. Students were given opportunities to state positive and negative aspects of the course
in general, and were also asked specifically about their experiences with PeerWise. The
format of these questionnaires varied by course and by year, but every mention of PeerWise
– both in response to a specific quesiton about PeerWise, and where students chose
unprompted to mention their experiences with PeerWise – was included in the analysis.
The final data set analysed comprises the responses of a minute paper exercise given
to students in Physics 1B in 2013–14. This exercise was intended to give students a short
focussed opportunity to note down their immediate thoughts on PeerWise. Despite its name,
this particular exercise was designed to take between five and ten minutes to complete. The
paper specifically asked students three questions about their use of PeerWise, focusing
particularly on how they used the comments facility both to give and receive feedback. The
minute paper replaced specific questions about PeerWise in that year’s end of course survey.
Both the student surveys and the minute paper were anonymous and were not
compulsory to complete, so it was not possible to match responses to individual students. It
was thus not possible to probe any direct correlations between student perceptions and
performance or engagement with PeerWise. The results of the qualitative analysis of student
experience are presented in Chapter 8.
3.2 Data cleaning
Quantitative data has been used in three main ways in this work. Firstly, in Chapter
4, a brief analysis of the networks arising from PeerWise use is outlined. Following this,
methods adopted by Denny et. al. in the earliest analyses of PeerWise data [122] are used to
ascertain whether the effect of PeerWise found in these previous studies are replicated in the
data sets employed here. Finally, in Chapters 5, 6 and 7, regression analyses of the
association between PeerWise use and exam score are conducted. Each approach differs
60
slightly in how the data was collected and more importantly in the questions each is seeking
to address, so each uses a slightly different subset of data. Details of the construction of the
datasets used to examine the effect of PeerWise on student attainment, are discussed below
and are followed by a brief outline of the construction of the datasets for network analysis.
3.2.1 Dataset construction for the analysis of student attainment
Students were excluded from the analysis of attainment if they did not have a “pre-
score” as described in Section 3.1.1, above; or in the rare cases where the mark given was 0.
This latter exclusion is due to the lack of consistency in reporting assessment data – it was
often unclear whether students had in fact scored 0, or whether a 0 was an indication of not
having completed the course or test. Students were also excluded where they did not have a
final exam score for the course in question.
Given that this is a dosage study of the relationship between PeerWise engagement
and subsequent performance, students who did not register for PeerWise were excluded, as
were students who registered but failed to engage with the system at all i.e. they did not have
any activity logged. Students with missing data were also excluded, both to avoid confusion,
and because missing data can be problematic in some of the analyses performed.
The total number of students in each dataset and the proportion of the original class
are outlined in Table 8, column 1. It is evident that in some courses a greater proportion of
students was excluded than in others. This is perhaps most notable in Physics 1B, where 40–
50% are excluded, mostly as a result of lacking a mark for Physics 1A. Similarly, more than
20% of students in Genes and Gene Action were excluded – mainly due to drop-outs before
the course started and also being enrolled on the course without a mark from Molecules,
Genes and Cells (used as the pre-score). In all other courses the numbers in the study are
around 80%. All courses have a sufficient total number for statistical analysis.
The question and comment datasets were cleaned as follows. On PeerWise, students
are able to delete questions they have written, however, once deleted these questions can no
longer be answered or commented upon. The PeerWise scores of those who have provided a
comment to a question that is subsequently deleted decrease; therefore it is often a difficult
decision for a question author whether to delete the question. This is evidenced in some of
the comments to questions where students have made an error, but given that it has been
corrected and discussed, the author did not want everyone’s effort to go to ‘waste’. Often a
question is deleted before anyone answers it, as the author wants to make an alteration and
post a similar, but modified question. For this reason, it was decided to exclude any deleted
questions and any answers or questions that arose from these deleted questions. Deleted
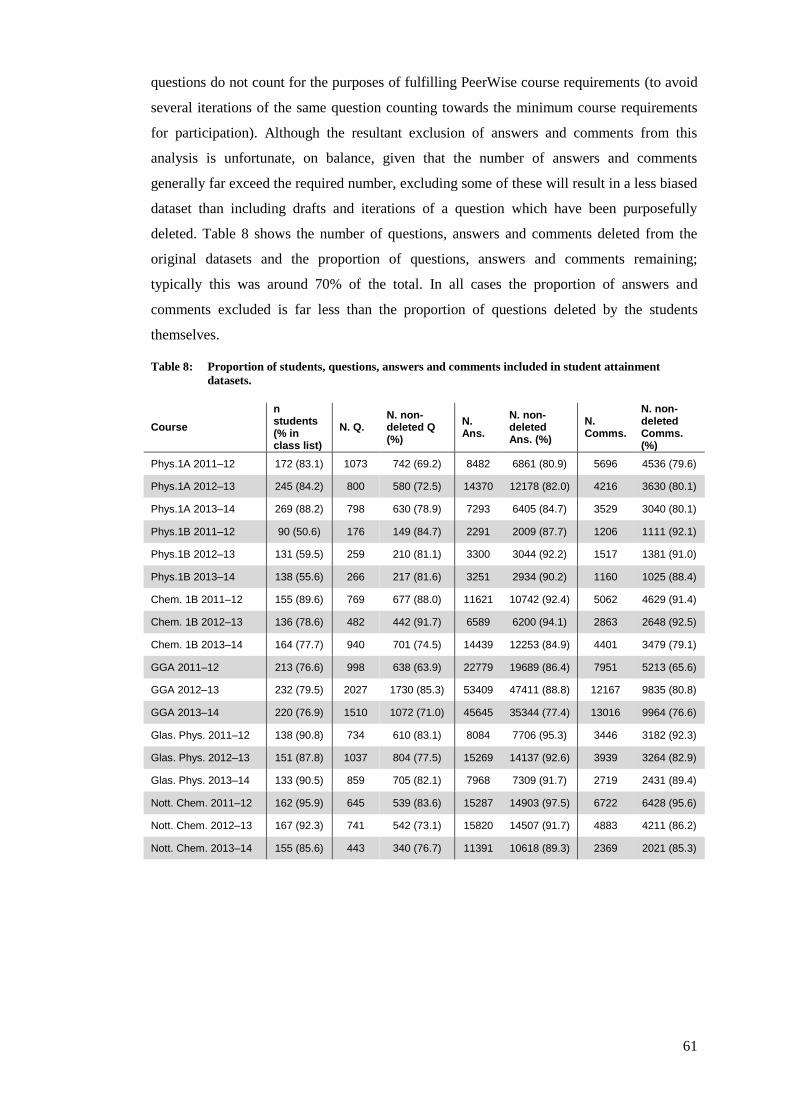
61
questions do not count for the purposes of fulfilling PeerWise course requirements (to avoid
several iterations of the same question counting towards the minimum course requirements
for participation). Although the resultant exclusion of answers and comments from this
analysis is unfortunate, on balance, given that the number of answers and comments
generally far exceed the required number, excluding some of these will result in a less biased
dataset than including drafts and iterations of a question which have been purposefully
deleted. Table 8 shows the number of questions, answers and comments deleted from the
original datasets and the proportion of questions, answers and comments remaining;
typically this was around 70% of the total. In all cases the proportion of answers and
comments excluded is far less than the proportion of questions deleted by the students
themselves.
Table 8: Proportion of students, questions, answers and comments included in student attainment
datasets.
Course
n students (% in class list)
N. Q. N. non-deleted Q (%)
N. Ans.
N. non-deleted Ans. (%)
N. Comms.
N. non-deleted Comms. (%)
Phys.1A 2011–12 172 (83.1) 1073 742 (69.2) 8482 6861 (80.9) 5696 4536 (79.6)
Phys.1A 2012–13 245 (84.2) 800 580 (72.5) 14370 12178 (82.0) 4216 3630 (80.1)
Phys.1A 2013–14 269 (88.2) 798 630 (78.9) 7293 6405 (84.7) 3529 3040 (80.1)
Phys.1B 2011–12 90 (50.6) 176 149 (84.7) 2291 2009 (87.7) 1206 1111 (92.1)
Phys.1B 2012–13 131 (59.5) 259 210 (81.1) 3300 3044 (92.2) 1517 1381 (91.0)
Phys.1B 2013–14 138 (55.6) 266 217 (81.6) 3251 2934 (90.2) 1160 1025 (88.4)
Chem. 1B 2011–12 155 (89.6) 769 677 (88.0) 11621 10742 (92.4) 5062 4629 (91.4)
Chem. 1B 2012–13 136 (78.6) 482 442 (91.7) 6589 6200 (94.1) 2863 2648 (92.5)
Chem. 1B 2013–14 164 (77.7) 940 701 (74.5) 14439 12253 (84.9) 4401 3479 (79.1)
GGA 2011–12 213 (76.6) 998 638 (63.9) 22779 19689 (86.4) 7951 5213 (65.6)
GGA 2012–13 232 (79.5) 2027 1730 (85.3) 53409 47411 (88.8) 12167 9835 (80.8)
GGA 2013–14 220 (76.9) 1510 1072 (71.0) 45645 35344 (77.4) 13016 9964 (76.6)
Glas. Phys. 2011–12 138 (90.8) 734 610 (83.1) 8084 7706 (95.3) 3446 3182 (92.3)
Glas. Phys. 2012–13 151 (87.8) 1037 804 (77.5) 15269 14137 (92.6) 3939 3264 (82.9)
Glas. Phys. 2013–14 133 (90.5) 859 705 (82.1) 7968 7309 (91.7) 2719 2431 (89.4)
Nott. Chem. 2011–12 162 (95.9) 645 539 (83.6) 15287 14903 (97.5) 6722 6428 (95.6)
Nott. Chem. 2012–13 167 (92.3) 741 542 (73.1) 15820 14507 (91.7) 4883 4211 (86.2)
Nott. Chem. 2013–14 155 (85.6) 443 340 (76.7) 11391 10618 (89.3) 2369 2021 (85.3)
62
3.2.2 Network analysis
The number of students in each network dataset is greater than the number of
students in the attainment datasets. This is because all students who participated in PeerWise
were included in the network dataset, regardless of whether or not they had an exam score or
a pre-score as prior attainment was not investigated in this analysis. Of course, in any
analysis of attainment based on the network data, students with no pre- or post-score would
have to be excluded. Keeping in all students maintains the integrity of each network and
preserves as much information as possible by including all peer-to-peer interactions that
occurred. If students without a pre-score were deleted then it would be as if that relationship
between commenter and author had never existed. Given that the purpose of this analysis is
to describe the structure of the relationships formed on PeerWise, rather than analyse student
attainment, it is prudent to retain as much information to give as accurate a picture of
PeerWise networks as possible.
3.3 Variable description
The work reported in this thesis aims to examine how performance in PeerWise, as
measured by metrics obtained from the system, can influence student attainment, in an
attempt to untangle whether there exists any benefit from participating in particular activities
on PeerWise. These metrics will be described within the relevant chapter.
3.3.1 Exam score
The dependent variable of interest throughout this work is student attainment, as
measured by performance in the end of course exam. The use of exam score either as a
dependent variable, measuring attainment, or as a measure of prior ability (3.3.2), has some
potentially problematic issues that must be borne in mind. Firstly, the skills tested in an end
of course exam may not be the same as those fostered in the initiative being investigated – in
the current work, PeerWise involves writing and answering multiple choice questions – in
many courses there is not a multiple choice component to the exam, therefore practicing
answering multiple choice questions may not produce directly transferable benefits.
Moreover, PeerWise encourages the development of higher-order skills such as reasoning
and problem solving. It is arguable whether these skills can be, or are best tested, in a written
exam – especially one that is undertaken relatively close in time to the introduction of
PeerWise. These skills take time to develop and also require, to a greater or lesser degree, a
change in a student’s approach to learning. Perhaps the benefit of engaging with higher-order
learning activities may be best assessed after a longer period of time. Additionally, although
63
many courses purport to assess higher-order skills, assessment items often tend to prioritise
the recall of facts [13].
In an attempt to statistically control, or account for as many other factors which may
influence exam performance, four variables were included in the analyses. These four
variables are prior ability; whether a student had been educated in a Scottish school prior to
entering university; the gender of the student; and whether the student intended to major in
the discipline or was enrolled in another (STEM or otherwise) degree programme. It should
be reiterated that these variables are only included to enhance the robustness of this study
rather than as variables of interest themselves. Focussed research into the effect of these
variables is out of scope of this particular work, but may be of interest to pursue at a later
date. The rationale for these four choices is outlined in the following sections.
3.3.2. Prior ability
A measure of prior ability was identified for each course, as outlined in Section
3.1.1. Past academic performance has regularly been demonstrated to be a strong predictor of
future performance. For example, in a study of 17 meta-analyses focusing on the effects of
prior ability on attainment, prior ability had an overall effect of 0.67 – an extremely high
effect size [12]. To account for the fact that stronger students will generally perform better in
exams than weaker students and that they may also engage with PeerWise to a greater level
[136], ability was statistically controlled for in an attempt to isolate, as far as possible, its
effect on exam score. Using a test of pre-score that is different to the post-score test is
advantageous as it means that students will not carry over learning from the initial test into
the final assessment [148]. However, whilst the relationship between the pre-score and post-
score are the same for each student within a particular course, between the courses, the
relationship between pre- and post-score will often be very different, resulting in varying
strengths of relationship in different courses. For example, the FCI used for Physics 1A was
not an assessment that students had studied for and it was conducted within the first few
weeks of their university career, before instruction took place. In contrast, the exam score for
MGC – the pre-test measure for GGA – was a formally assessed end of course examination
undertaken at the end of the students’ first year. Similarly, the in-class assessment used as
the pre-test in Glasgow Physics, was carried out before the introduction of PeerWise, but
related directly to the curriculum taught in the first half of the course.
3.3.3 Scottish-schooled
Relatively little research has been undertaken into the performance of students
arriving in Scottish universities from different educational systems. However a recent project
64
aimed to investigate the assessment experience of international students during their first
year of study [149]. Although the performance of international students transitioning to study
in a new country was the main focus of this study, it also highlighted interesting differences
between the performance of Scottish students and those schooled in other UK (RUK) or EU
countries. During the course of this project it became apparent that whilst students domiciled
in EU or RUK performed to a similar level, students who were classed as internationally
domiciled and those who were of Scottish domicile had a significantly lower level of
attainment across a range of assessment methods and subject areas within the sciences [149].
Of course, the Scottish and English school systems differ in a number of ways.
Students in England and Wales study A-Levels over their final two years at school. Scottish
students tend to study Highers in their penultimate year at school, progressing to Advanced
Highers in their final year. Completion of the Scottish Advanced Higher is somewhat
equivalent to completion of an A-Level, however the syllabi are different. Scottish system
students apply to university after their penultimate year, with knowledge of their Higher
exam marks, so may obtain an unconditional offer for university entry. Students in the
English system will usually not have exam results before they apply for university, therefore
their place will be conditional on a certain level of performance. The pressure placed on
English students in their final year may ensure that they remain focused on their studies and
in ‘work-mode’, unlike Scottish students who may have worked very hard and achieved
(often very demanding) entrance requirements in their penultimate year and then may take
their ‘foot off the pedal’ – resulting perhaps in a loss of focus and discipline which may
make the transition to university-level study more difficult.
Although in-depth research of this question is beyond scope of this current study,
work has been conducted in the School of Mathematics at The University of Edinburgh to
determine whether the effect of being Scottish-schooled was being conflated with school
results in mathematics. Preliminary findings have shown that students with the highest level
of qualification in mathematics (A or A* at A-Level and A at Advanced Higher) perform
equally well in their first year university mathematics exams. (Toby Bailey, Personal
Communication, December 2014). In Physics 1A in 2011–12 and 2012–13, similar
comparisons were undertaken for both school mathematics and physics results (full results
are detailed in Appendix B). Unsurprisingly, when comparing all students who got the
highest grades with those who did not, those who scored the higher grades in their school
physics and mathematics exams had higher mean scores in their Physics 1A exam.
65
When investigating whether students with an A or A* at A-Level in mathematics or
physics performed differently in end of course exams to students with an A at Advanced
Higher in mathematics or physics, it was found that as with the mathematics study, in
general, there were no differences in the exam performance of the two groups. Only in 2011–
12 did students with an A at Advanced Higher mathematics performed significantly better in
their end of course exam than students with an A or A* at A-Level. Although the results are
mixed, they would seem to suggest that the effects of being Scottish-schooled comprises
more facets than simply exam performance in mathematics and physics.
In order to maintain consistency across all subjects, it was decided to account for any
negative effects of being Scottish schooled as demonstrated in prior research, by creating a
variable indicating whether a student was Scottish domiciled at the point of entry to
university. This information was only available for students based in courses at the
University of Edinburgh (Physics 1A; Physics 1B; Chemistry 1B and GGA) however it
would be extremely unlikely that in Nottingham Chemistry there would be sufficient
numbers of Scottish students for analysis. Information about the proportion of Scottish
students was not available for the specific Glasgow Physics course, however, Scottish
students comprise around 68% of undergraduate physics students at The University of
Glasgow (Jaqueline Jack, Personal Communication, November 2015).
3.3.4 Subject major
In Nottingham Chemistry and Glasgow Physics, only students who are majoring in
chemistry and physics enrol on the courses. However in the Edinburgh-based courses, there
is a mix of majors and non-majors. It was decided to control for the effects of being a subject
major as it could be hypothesised that students who are majoring in a particular subject may
be more invested in their performance; if they are generally struggling they may direct their
efforts into their main subject; or if they chose one subject over another, they may have a
stronger academic history in that particular area. Research has demonstrated that physics
majors perform better on the FCI than physics non-majors [150]. That research did not
extend to examining the difference on exam performance, however, this would seem
reasonable grounds for considering subject major to be a suitable control variable.
3.3.5 Gender
The gender breakdown for all courses is available, and is outlined in Table 2–Table
7 (Section 3.6). Given the significant body of literature investigating the gender performance
gap between males and females across the sciences as a whole [151–153], it is reasonable to
include it as a control variable.

66
3.4 Statistical tests
All statistical analyses were carried out in SPSS version 21, UCINET version 6 and
MLwiN version 2.33. This section outlines the statistical tests used to determine the
existence of a relationship between PeerWise engagement and attainment. In all analyses,
unless otherwise stated, two-tailed tests were used, and p values < 0.05 are considered to
indicate that a relationship is genuine and unlikely to have happened by chance. Although it
may seem more intuitive to use one-tailed tests given that one would perhaps expect increase
in PeerWise to be associated with increases in exam score, a negative relationship between
PeerWise activity and attainment should not be ruled out, and therefore the more
conservative two-tailed test is used.
Throughout the analyses, an attempt has been made to determine the magnitude of
any significant results by reporting an appropriate effect size statistic and the 95%
confidence interval of the estimate. The confidence interval is a measure of the level of
certainty one is able to attribute to a given estimate – a narrow 95% confidence interval
indicates a greater degree of certainty about the result. Effect size statistics aim to provide
standardized information about the magnitude of the effect or relationship, which is
comparable across variables and across statistical tests; however this should be interpreted
with caution. A large effect size does not necessarily equate to high importance, nor a small
effect size dismissed as of little value. Interpretation of the magnitude of an effect size is
dependent on, amongst other things, conventions in the particular academic field, and the
uses to which the information from an analysis is going to be put [12,154]. An intervention
with a small effect might be worthwhile if it costs little to implement in terms of finances,
effort and risk whereas interventions with large effects may be too costly [154]. In his study
of over 800 meta-analyses Hattie [12] suggests that an adequate effect size in educational
initiatives should be one greater than 0.4, however effect sizes should be considered in
relation to the specific field of research. Cohen [155] outlines effect size indices for a variety
of statistical tests, some of which have been used in the current research and will be
described in the appropriate following sections, and also provides some general guidelines as
to how to define small, medium and large effects for each test. In contrast to both Hattie and
Cohen, it has been suggested that effect sizes of 0.1 or even 0.05 may be considered to be
reasonable. It is becoming more generally accepted that effect sizes will depend upon the
characteristics of each particular study – its design, context and the nature of what is being
measured [148,156]. Regardless of the effect size considered to be adequate in a particular
study, in order to detect any effects, especially small ones, and therefore to avoid erroneously
67
accepting the null hypothesis H0 – i.e. making a type II error – a study must have sufficient
power. Based upon his definitions of small, medium and large effects, Cohen also outlines
the number of observations that should be present for each test for significance levels of
0.01, 0.05 and 0.1 [155]. Given that the number of students for each course ranges between
90 and 269 students, certain courses in this work are likely to be underpowered, resulting in
a failure to reject H0 where there are indeed true population effects and resulting in smaller
effect sizes – a potential limitation of this study.
As the design of this work is not that of a randomised controlled experiment it is not
possible to infer a causal relationship between PeerWise engagement (or indeed any of the
other control variables) and exam score. The purpose of this study is not to compare the
results of students who did not engage with those of who did engage – there was not a
designated control group or random allocation of students into different levels of activity,
and the fraction of non-PeerWise users who completed the exam was small. Rather, this
work is more of a “dosage” study, looking at the effects of increased engagement with
PeerWise. It might be viewed that these factors may somewhat limit the generalisability of
the findings from any one particular course. However, given that data from three academic
years of each course have been examined, it would not seem unreasonable to generalise any
emerging patterns to future cohorts of each course. Additionally, this work has been
undertaken in three discrete STEM disciplines within three research intensive, but diverse
institutions, so wider generalisations may be tentatively made, and certainly factors
deserving more detailed investigation might be identified. In each of the courses, the
PeerWise assignment has been fully integrated into the curriculum as a compulsory
component, encouraging student uptake and minimising self-selection bias.
More detail about the specific methods of data analysis including the testing of
statistical assumptions and limitations will be outlined in each chapter. The purpose of the
following section is to provide a brief overview of the main statistical tests used in the thesis.
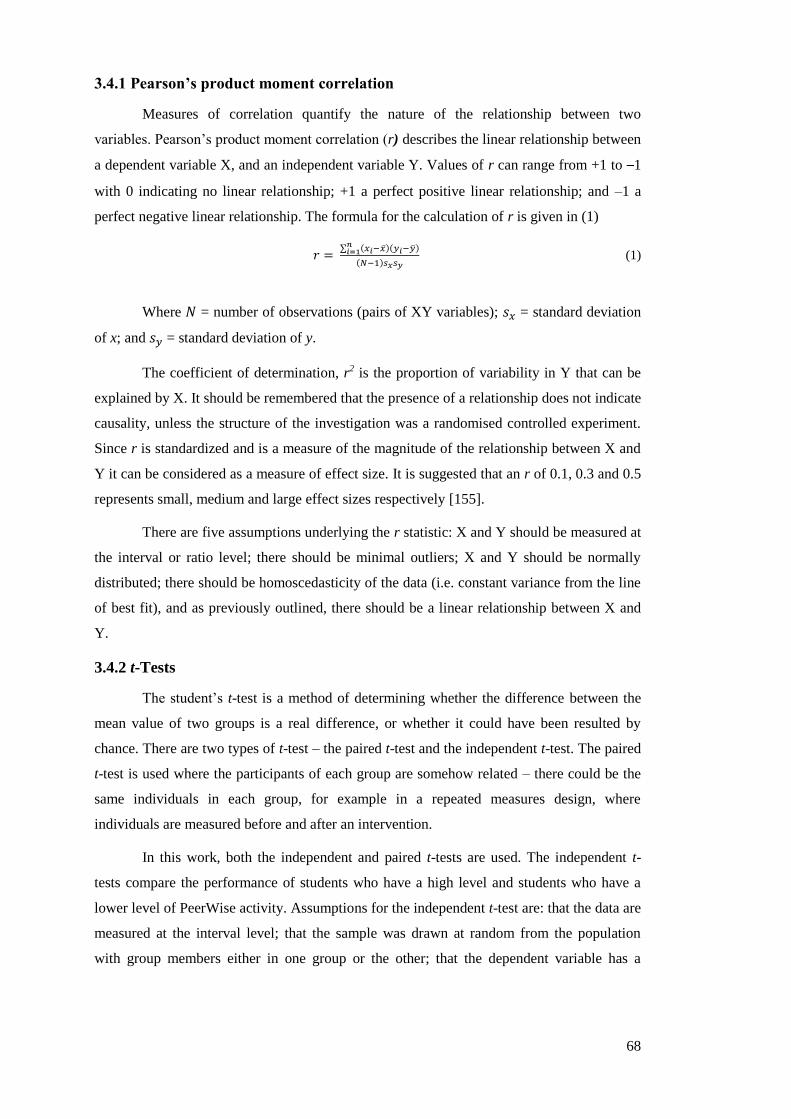
68
3.4.1 Pearson’s product moment correlation
Measures of correlation quantify the nature of the relationship between two
variables. Pearson’s product moment correlation (r) describes the linear relationship between
a dependent variable X, and an independent variable Y. Values of r can range from +1 to –1
with 0 indicating no linear relationship; +1 a perfect positive linear relationship; and –1 a
perfect negative linear relationship. The formula for the calculation of r is given in (1)
𝑟 = ∑ (𝑥𝑖−�̅�)(𝑦𝑖−�̅�)𝑛
𝑖=1
(𝑁−1)𝑠𝑥𝑠𝑦 (1)
Where 𝑁 = number of observations (pairs of XY variables); 𝑠𝑥 = standard deviation
of x; and 𝑠𝑦 = standard deviation of y.
The coefficient of determination, r2 is the proportion of variability in Y that can be
explained by X. It should be remembered that the presence of a relationship does not indicate
causality, unless the structure of the investigation was a randomised controlled experiment.
Since r is standardized and is a measure of the magnitude of the relationship between X and
Y it can be considered as a measure of effect size. It is suggested that an r of 0.1, 0.3 and 0.5
represents small, medium and large effect sizes respectively [155].
There are five assumptions underlying the r statistic: X and Y should be measured at
the interval or ratio level; there should be minimal outliers; X and Y should be normally
distributed; there should be homoscedasticity of the data (i.e. constant variance from the line
of best fit), and as previously outlined, there should be a linear relationship between X and
Y.
3.4.2 t-Tests
The student’s t-test is a method of determining whether the difference between the
mean value of two groups is a real difference, or whether it could have been resulted by
chance. There are two types of t-test – the paired t-test and the independent t-test. The paired
t-test is used where the participants of each group are somehow related – there could be the
same individuals in each group, for example in a repeated measures design, where
individuals are measured before and after an intervention.
In this work, both the independent and paired t-tests are used. The independent t-
tests compare the performance of students who have a high level and students who have a
lower level of PeerWise activity. Assumptions for the independent t-test are: that the data are
measured at the interval level; that the sample was drawn at random from the population
with group members either in one group or the other; that the dependent variable has a
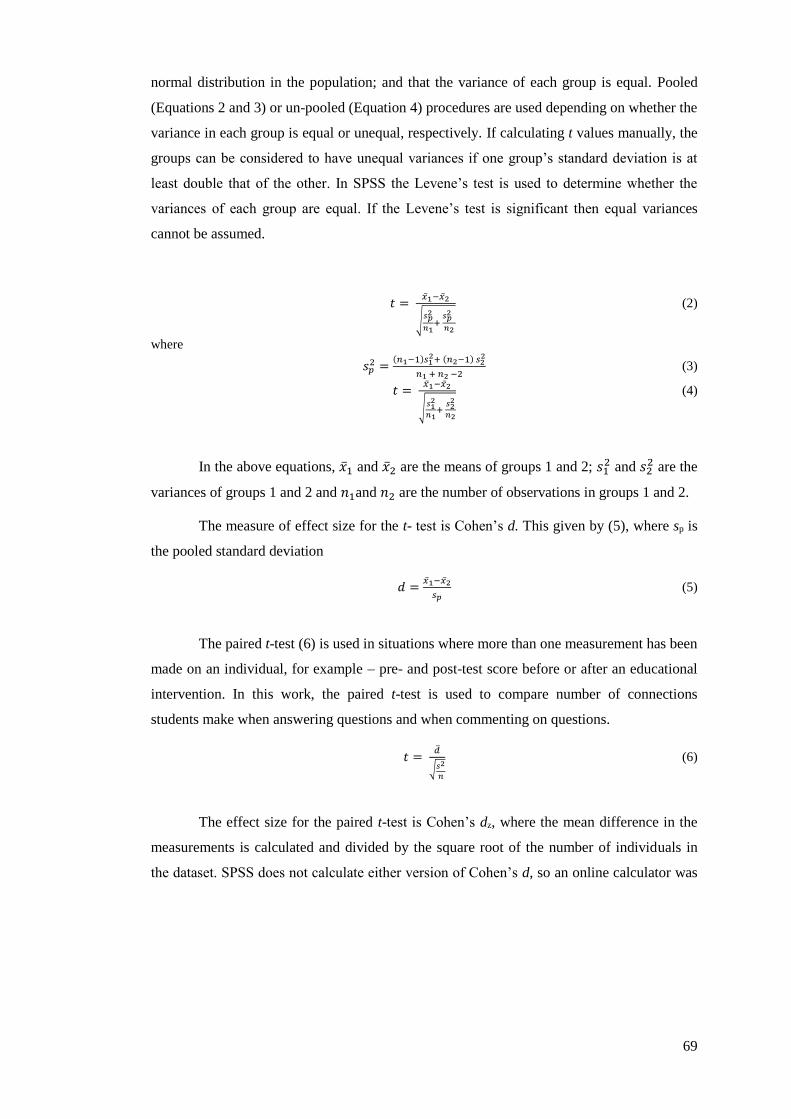
69
normal distribution in the population; and that the variance of each group is equal. Pooled
(Equations 2 and 3) or un-pooled (Equation 4) procedures are used depending on whether the
variance in each group is equal or unequal, respectively. If calculating t values manually, the
groups can be considered to have unequal variances if one group’s standard deviation is at
least double that of the other. In SPSS the Levene’s test is used to determine whether the
variances of each group are equal. If the Levene’s test is significant then equal variances
cannot be assumed.
𝑡 = �̅�1−�̅�2
√𝑠𝑝
2
𝑛1+
𝑠𝑝 2
𝑛2
(2)
where
𝑠𝑝2 =
(𝑛1−1)𝑠12+ (𝑛2−1) 𝑠2
2
𝑛1 + 𝑛2 −2 (3)
𝑡 = �̅�1−�̅�2
√𝑠1
2
𝑛1+
𝑠22
𝑛2
(4)
In the above equations, �̅�1 and �̅�2 are the means of groups 1 and 2; 𝑠12 and 𝑠2
2 are the
variances of groups 1 and 2 and 𝑛1and 𝑛2 are the number of observations in groups 1 and 2.
The measure of effect size for the t- test is Cohen’s d. This given by (5), where sp is
the pooled standard deviation
𝑑 =�̅�1−�̅�2
𝑠𝑝 (5)
The paired t-test (6) is used in situations where more than one measurement has been
made on an individual, for example – pre- and post-test score before or after an educational
intervention. In this work, the paired t-test is used to compare number of connections
students make when answering questions and when commenting on questions.
𝑡 = �̅�
√𝑠2
𝑛
(6)
The effect size for the paired t-test is Cohen’s dz, where the mean difference in the
measurements is calculated and divided by the square root of the number of individuals in
the dataset. SPSS does not calculate either version of Cohen’s d, so an online calculator was
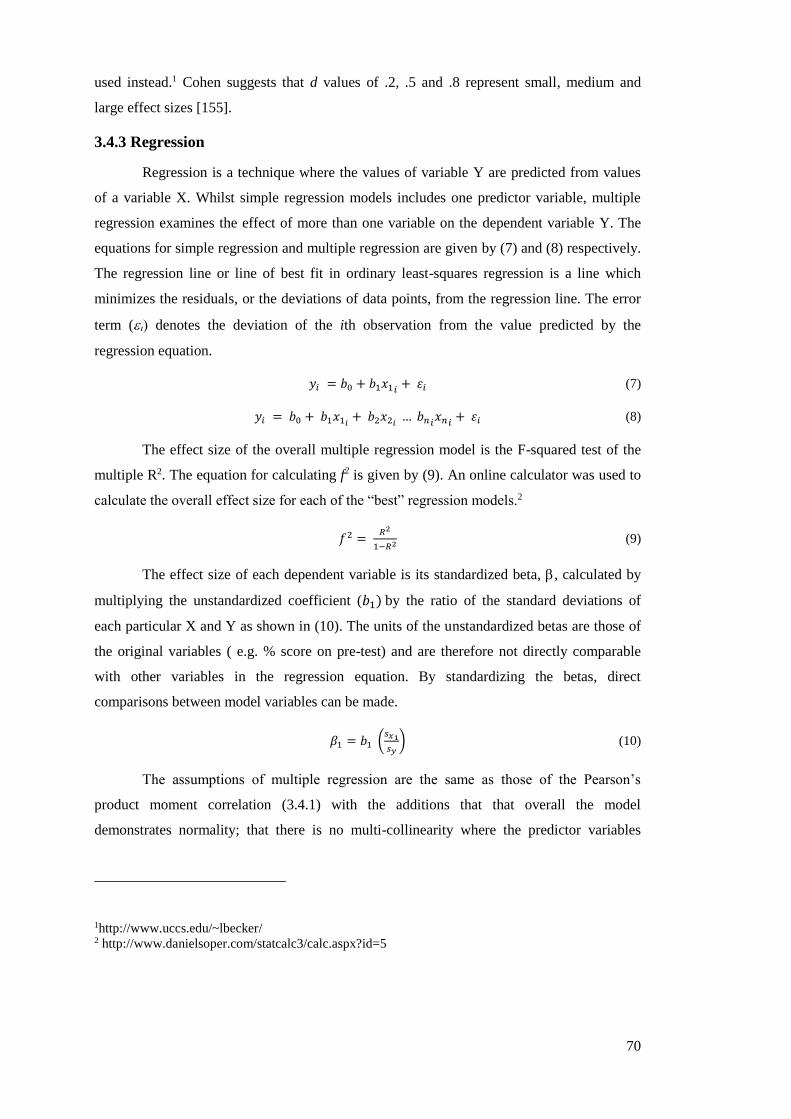
70
used instead.1 Cohen suggests that d values of .2, .5 and .8 represent small, medium and
large effect sizes [155].
3.4.3 Regression
Regression is a technique where the values of variable Y are predicted from values
of a variable X. Whilst simple regression models includes one predictor variable, multiple
regression examines the effect of more than one variable on the dependent variable Y. The
equations for simple regression and multiple regression are given by (7) and (8) respectively.
The regression line or line of best fit in ordinary least-squares regression is a line which
minimizes the residuals, or the deviations of data points, from the regression line. The error
term ( denotes the deviation of the ith observation from the value predicted by the
regression equation.
𝑦𝑖 = 𝑏0 + 𝑏1𝑥1𝑖+ 𝜀𝑖 (7)
𝑦𝑖 = 𝑏0 + 𝑏1𝑥1𝑖+ 𝑏2𝑥2𝑖
… 𝑏𝑛𝑖𝑥𝑛𝑖
+ 𝜀𝑖 (8)
The effect size of the overall multiple regression model is the F-squared test of the
multiple R2. The equation for calculating f2 is given by (9). An online calculator was used to
calculate the overall effect size for each of the “best” regression models.2
𝑓2 = 𝑅2
1−𝑅2 (9)
The effect size of each dependent variable is its standardized beta, , calculated by
multiplying the unstandardized coefficient (𝑏1) by the ratio of the standard deviations of
each particular X and Y as shown in (10). The units of the unstandardized betas are those of
the original variables ( e.g. % score on pre-test) and are therefore not directly comparable
with other variables in the regression equation. By standardizing the betas, direct
comparisons between model variables can be made.
𝛽1 = 𝑏1 (𝑠𝑥1
𝑠𝑦) (10)
The assumptions of multiple regression are the same as those of the Pearson’s
product moment correlation (3.4.1) with the additions that that overall the model
demonstrates normality; that there is no multi-collinearity where the predictor variables
1http://www.uccs.edu/~lbecker/ 2 http://www.danielsoper.com/statcalc3/calc.aspx?id=5
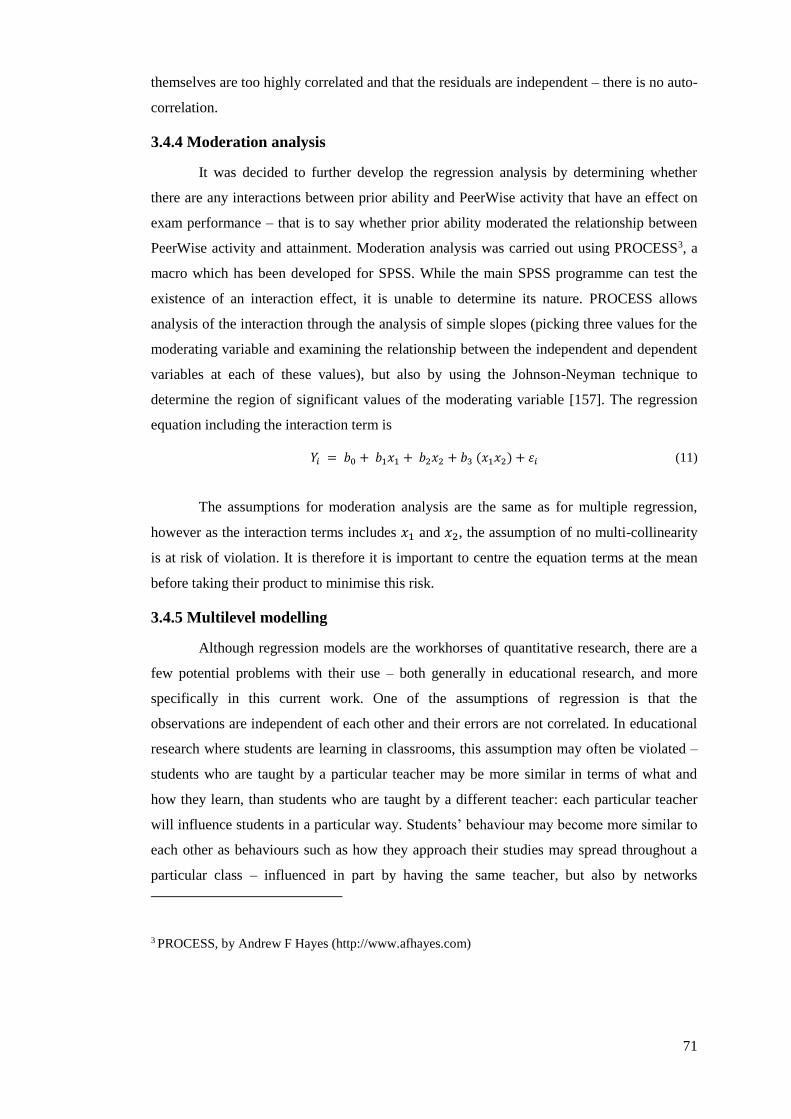
71
themselves are too highly correlated and that the residuals are independent – there is no auto-
correlation.
3.4.4 Moderation analysis
It was decided to further develop the regression analysis by determining whether
there are any interactions between prior ability and PeerWise activity that have an effect on
exam performance – that is to say whether prior ability moderated the relationship between
PeerWise activity and attainment. Moderation analysis was carried out using PROCESS3, a
macro which has been developed for SPSS. While the main SPSS programme can test the
existence of an interaction effect, it is unable to determine its nature. PROCESS allows
analysis of the interaction through the analysis of simple slopes (picking three values for the
moderating variable and examining the relationship between the independent and dependent
variables at each of these values), but also by using the Johnson-Neyman technique to
determine the region of significant values of the moderating variable [157]. The regression
equation including the interaction term is
𝑌𝑖 = 𝑏0 + 𝑏1𝑥1 + 𝑏2𝑥2 + 𝑏3 (𝑥1𝑥2) + 𝜀𝑖 (11)
The assumptions for moderation analysis are the same as for multiple regression,
however as the interaction terms includes 𝑥1 and 𝑥2, the assumption of no multi-collinearity
is at risk of violation. It is therefore it is important to centre the equation terms at the mean
before taking their product to minimise this risk.
3.4.5 Multilevel modelling
Although regression models are the workhorses of quantitative research, there are a
few potential problems with their use – both generally in educational research, and more
specifically in this current work. One of the assumptions of regression is that the
observations are independent of each other and their errors are not correlated. In educational
research where students are learning in classrooms, this assumption may often be violated –
students who are taught by a particular teacher may be more similar in terms of what and
how they learn, than students who are taught by a different teacher: each particular teacher
will influence students in a particular way. Students’ behaviour may become more similar to
each other as behaviours such as how they approach their studies may spread throughout a
particular class – influenced in part by having the same teacher, but also by networks
3 PROCESS, by Andrew F Hayes (http://www.afhayes.com)
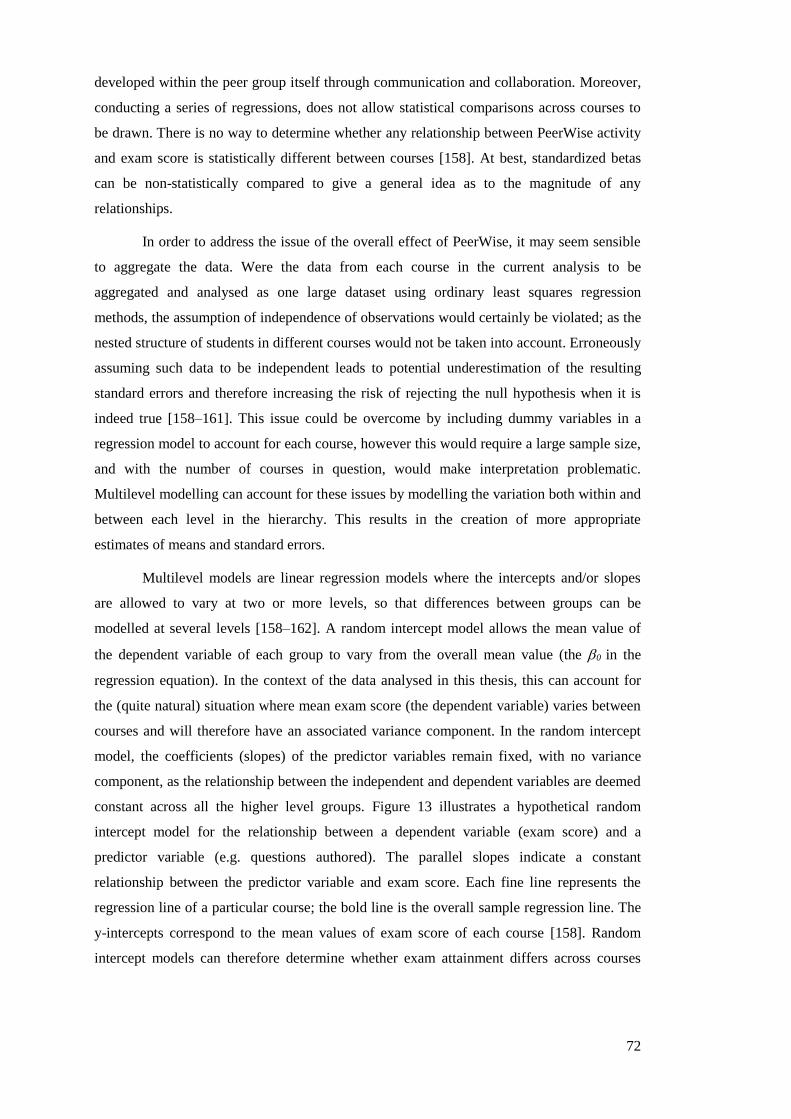
72
developed within the peer group itself through communication and collaboration. Moreover,
conducting a series of regressions, does not allow statistical comparisons across courses to
be drawn. There is no way to determine whether any relationship between PeerWise activity
and exam score is statistically different between courses [158]. At best, standardized betas
can be non-statistically compared to give a general idea as to the magnitude of any
relationships.
In order to address the issue of the overall effect of PeerWise, it may seem sensible
to aggregate the data. Were the data from each course in the current analysis to be
aggregated and analysed as one large dataset using ordinary least squares regression
methods, the assumption of independence of observations would certainly be violated; as the
nested structure of students in different courses would not be taken into account. Erroneously
assuming such data to be independent leads to potential underestimation of the resulting
standard errors and therefore increasing the risk of rejecting the null hypothesis when it is
indeed true [158–161]. This issue could be overcome by including dummy variables in a
regression model to account for each course, however this would require a large sample size,
and with the number of courses in question, would make interpretation problematic.
Multilevel modelling can account for these issues by modelling the variation both within and
between each level in the hierarchy. This results in the creation of more appropriate
estimates of means and standard errors.
Multilevel models are linear regression models where the intercepts and/or slopes
are allowed to vary at two or more levels, so that differences between groups can be
modelled at several levels [158–162]. A random intercept model allows the mean value of
the dependent variable of each group to vary from the overall mean value (the 0 in the
regression equation). In the context of the data analysed in this thesis, this can account for
the (quite natural) situation where mean exam score (the dependent variable) varies between
courses and will therefore have an associated variance component. In the random intercept
model, the coefficients (slopes) of the predictor variables remain fixed, with no variance
component, as the relationship between the independent and dependent variables are deemed
constant across all the higher level groups. Figure 13 illustrates a hypothetical random
intercept model for the relationship between a dependent variable (exam score) and a
predictor variable (e.g. questions authored). The parallel slopes indicate a constant
relationship between the predictor variable and exam score. Each fine line represents the
regression line of a particular course; the bold line is the overall sample regression line. The
y-intercepts correspond to the mean values of exam score of each course [158]. Random
intercept models can therefore determine whether exam attainment differs across courses
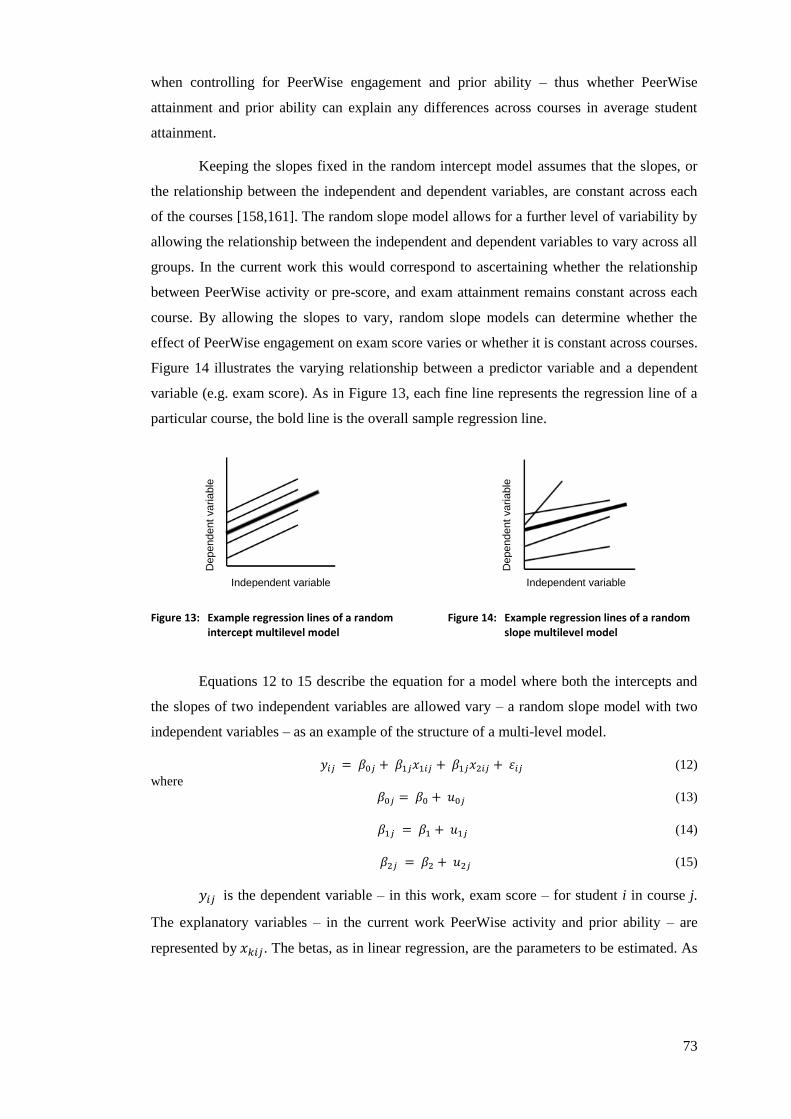
73
when controlling for PeerWise engagement and prior ability – thus whether PeerWise
attainment and prior ability can explain any differences across courses in average student
attainment.
Keeping the slopes fixed in the random intercept model assumes that the slopes, or
the relationship between the independent and dependent variables, are constant across each
of the courses [158,161]. The random slope model allows for a further level of variability by
allowing the relationship between the independent and dependent variables to vary across all
groups. In the current work this would correspond to ascertaining whether the relationship
between PeerWise activity or pre-score, and exam attainment remains constant across each
course. By allowing the slopes to vary, random slope models can determine whether the
effect of PeerWise engagement on exam score varies or whether it is constant across courses.
Figure 14 illustrates the varying relationship between a predictor variable and a dependent
variable (e.g. exam score). As in Figure 13, each fine line represents the regression line of a
particular course, the bold line is the overall sample regression line.
Figure 13: Example regression lines of a random intercept multilevel model
Figure 14: Example regression lines of a random slope multilevel model
Equations 12 to 15 describe the equation for a model where both the intercepts and
the slopes of two independent variables are allowed vary – a random slope model with two
independent variables – as an example of the structure of a multi-level model.
𝑦𝑖𝑗 = 𝛽0𝑗 + 𝛽1𝑗𝑥1𝑖𝑗 + 𝛽1𝑗𝑥2𝑖𝑗 + 𝜀𝑖𝑗 (12)
where
𝛽0𝑗 = 𝛽0 + 𝑢0𝑗 (13)
𝛽1𝑗 = 𝛽1 + 𝑢1𝑗 (14)
𝛽2𝑗 = 𝛽2 + 𝑢2𝑗 (15)
𝑦𝑖𝑗 is the dependent variable – in this work, exam score – for student i in course j.
The explanatory variables – in the current work PeerWise activity and prior ability – are
represented by 𝑥𝑘𝑖𝑗. The betas, as in linear regression, are the parameters to be estimated. As
Independent variable
Dependent
varia
ble
Independent variable
Dependent
varia
ble
74
in linear regression, there is also an error term, 𝜀𝑖𝑗 with a variance of 𝜎𝑒2, which is the
between-student variance. In the multilevel model there is also an additional error term – 𝑢𝑘𝑗
– with a variance of 𝜎𝑢2 which represents the level 2 (in this case course level variance). This
is included to account for the clustering of individuals within courses. Every parameter that
varies at the school level has an associated error term that varies across courses, but remains
constant for each student within a course. In the random intercept model, 𝑢1𝑗 and 𝑢2𝑗 are
excluded as they are the variance components for 𝛽1 and 𝛽2 – the regression slopes [158].
The significance of individual fixed regression coefficients in a particular model can
be assessed by dividing the coefficient by its standard error (S.E). In a similar manner to
linear regression, it is generally accepted that if the S.E. is greater than 1.96, then the
coefficient is significant at the p <0.05 level. Overall model fit can be assessed by the
deviance statistic, the –2*log likelihood (–2LL). Where models are nested, the difference
between the –2LL for two models can be compared to the chi-squared distribution, with the
degrees of freedom (d.f,) being equal to the number of additional parameters being
estimated. A significant decrease in the –2LL indicates an improvement in the fit of the
model.
3.4.6 Network analysis
Network analysis enables the analysis and visualisation of the structure of
relationships between entities – in the present analysis between students and questions. There
are myriad metrics that can be calculated to describe the structure and predict the behaviour
of networks; however this analysis focuses on the student-level metric of degree and the
corresponding network-level metric of average degree, along with the total network density
[163–165]. The rationale for choosing these metrics, along with more detailed outline of the
construction of the network data sets, is discussed in Chapter 4.
An individual’s degree is a measure of well-connected within a particular network
they are. It may be thought of as a measure of importance or potential influence within the
network [166]. Degree can be measured in terms of out-degree (number of outward
connections), in-degree (number of incoming connections) or, in an undirected network,
simply the total number of connections made. As degree is dependent on the size of the
network, in order to allow comparisons of the connectedness of students across networks,
normalised degree – the proportion of connections present from the total possible number of
connections – is used in this analysis. The formula for degree is shown in (16) where 𝑑𝑖 is
the degree centrality of actor i and 𝑥𝑖𝑗 is the cell (i, j) in the adjacency matrix (to be
discussed in more length in Chapter 4). The normalised degree for each actor can be
75
calculated by dividing the degree by n–1, where n equals the number of nodes in the
network. The average degree for the whole network is given by the average value of the
individual student degrees across a network [164].
𝑑𝑖 = ∑ 𝑥𝑖𝑗𝑗 (16)
The second measure of interest when considering the network as a whole is density,
which, in a similar vein to the normalized degree for each individual student, is the
percentage of ties that are present in a network, out of all the ties that could be present, see
(17) and (18), (where n equals the number of nodes). Density may also be thought of as the
probability of a tie occurring between any given nodes [164]. Larger networks tend to have
smaller densities than smaller networks – it is less likely that network of one hundred people
will have a density as large as a network of say ten people – it is more likely that everyone
will be connected to each other in the smaller network than in the larger network [164]. The
average normalised degree of a network is equivalent to the density.
𝑑𝑒𝑛𝑠𝑖𝑡𝑦 = 𝐴𝑐𝑡𝑢𝑎𝑙 𝑇𝑖𝑒𝑠
𝑃𝑜𝑡𝑒𝑛𝑡𝑖𝑎𝑙 𝑇𝑖𝑒𝑠 (17)
where
𝑃𝑜𝑡𝑒𝑛𝑡𝑖𝑎𝑙 𝑇𝑖𝑒𝑠 =𝑛(𝑛−1)
2 (18)

76
77
Chapter 4
Initial exploration of student use of the PeerWise
system
In Chapter 1 it was discussed how engaging with question writing and answering
activities on online platforms such as PeerWise has potential to afford students real
opportunities to develop crucial transferable skills. These skills include: providing
constructive feedback; critically engaging with the quality of feedback received; reflecting
on their own past performance, relative to the standards set by others; and engaging in
meaningful discussion to improve their own understanding and enable reflection on their
strengths and weaknesses. The dependence of students on their peers for the provision of
feedback and clarification of misunderstandings illustrates the social constructivist principles
on which the PeerWise is based [35]. Explaining and justifying one’s viewpoint requires
students to have both a deep level of understanding about the subject area in question, and a
higher level of metacognitive awareness. Engaging in activities such as those promoted by
PeerWise may therefore encourage not just the development of transferable skills, but also
result in enhanced understanding of course materials [34,103]. The work in this chapter
investigates the nature of the connections arising between students when engaging with
PeerWise, using some basic tools of network analysis. The relationship between levels of
PeerWise engagement and student attainment are also investigated, using methods employed
in past analyses of PeerWise. The relationships between PeerWise engagement and
attainment found in the current data are then be compared with relationships found in the
prior literature to determine whether the findings are transferable across academic disciplines
and settings. The objectives of this chapter are to firstly obtain an initial overview of the
nature of relationships forged on PeerWise, and secondly, to investigate the relationship
between PeerWise engagement and attainment
4.1 Initial exploration of student learning networks
It is well established that active learning activities, which encourage students to
develop their knowledge and skills through sharing ideas, have positive benefits in the
78
development of both technical and “soft” skills [18,19]. Despite this, peer learning activities
often comprise a small proportion of course time in the university setting [97,167]. Through
the use of PeerWise, opportunities for peer learning are not restricted to a face-to-face offline
situation. Offline learning activities such as tutorials are resource heavy in terms of
personnel costs and are constrained to be undertaken solely in the classroom setting during
contact teaching hours, thus being somewhat limited in their frequency and duration. As
engaging with others through PeerWise requires only access to a computer with an internet
connection, the opportunities for collaboration are vastly increased, and therefore the
benefits of engaging in collaborative activities can be maximised.
Given that PeerWise use creates more opportunities for collaboration, it therefore
also has the potential to encourage growth of wider student networks of learning than would
otherwise develop in the offline setting. Indeed, the anonymous nature of the system means
that students are far less able to seek out existing friends and are therefore more likely to
engage with someone with whom they have not interacted before. In the traditional
lecture/tutorial scenario, students tend to sit in the same physical area of the lecture hall or
the tutorial room, and then work and associate with a small group of their peers for the
duration of the course. Since PeerWise enables students to answer questions set by anyone
within the cohort and then provide feedback on the questions by writing comments, they are,
in theory at least, given an opportunity to engage with a much wider network of people than
with whom they would usually interact on a day-to-day basis. It has previously been
demonstrated that without anonymity, students tend to form online networks with peers of a
similar academic ability to themselves [168]. It is hypothesised the anonymous nature of
PeerWise will increase their exposure to students who hold different perspectives and with
different ability levels to themselves and those comprising their offline social circle. The
anonymity of the PeerWise system may particularly benefit students whose offline network
is small for any number of reasons. For example, students who do not find it easy to engage
with their peers and to participate in discussion will not be recouping maximal benefits from
engaging in group activities in the offline environment. There may also be students who feel
more confident in expressing their viewpoints online, and who are more willing to test their
ideas and knowledge via PeerWise, in a safe environment, shielded by a computer screen
and with the reassurance of complete anonymity [141]. Some students may have
commitments in their personal or family life that makes them less able to spend time out of
class on campus with their peers – using an online platform may reduce feelings of isolation.
The remainder of Section 4.1 seeks to determine the nature of the networks that arise
from the use of PeerWise. The potential in the network for collaboration and the exchange of
79
ideas will be discussed; the levels of student “connectedness” within each network will also
be measured; and the degree to which this is associated with attainment investigated.
4.1.1 Nature of the PeerWise network
A network comprises actors (nodes) and the ties that directly and indirectly connect
them. The ties connecting the actors may be “state-type” representing relations such as
friendships; or familial relations; or ties may alternatively represent events which may have a
“discrete and transitory nature” and which may be “counted over a period of time” – such as
business transactions or email exchanges [169]. In the current analysis answering and
commenting on questions can be considered as belonging to the latter category. Network
theory analyses the structure of the network in terms of the position of nodes within the
network and their relationship to other nodes. Measures of centrality indicate which nodes
are prominent or powerful in a network and is one of the most often cited network metrics
[170]. Nodes might be in positions of power or influence by virtue of them being a
connection between disparate groups in the network – bridging “structural holes” in the
network [171] or by having a large number of relations which allow resources to be quickly
acquired or disseminated [172].
Networks can be represented by matrices, in which entities represented by the rows
interact with entities represented by the columns. The ‘raw’ PeerWise answer and comment
networks can be considered as two-mode – or affiliation – networks. Students (rows) interact
– or have an affiliation – with questions (columns) either through answering the question
(the answer network) or through commenting on a question (the comment network). An
interaction between a student and a question would be represented by a 1 in the
corresponding matrix cell. In the present study, the two-mode matrices are binary, indicating
simply whether an interaction between a particular student and a particular question is
present (1) or not (0). In order to investigate the opportunities students have for engaging
with their peers, and the extent to which the potential connectivity within each course is
realised, one-mode (student–student) networks were constructed from the two-mode
(student-question) networks as described below.
In the one-mode co-affiliation networks both rows and columns represent students.
If a pair of students have both answered or commented on the same question (or have more
than one question in common) the value of the corresponding matrix element is 1. If they
have no questions in common, it is zero. Both the answer network and the comment network
have therefore been dichotomised – each partnership is only counted once, regardless of how
many times they have answered or commented upon the same questions. Students do not
80
interact with each other – they interact with a question – therefore a non-zero entry in the
network matrix means only that a pair of students have at least one question in common.
It should be noted that a value in the one-mode matrix simply indicates where two
students “share” a question; this cannot be interpreted as one student is actively giving
information to the other – both students are answering or providing a comment on a
question. Hence, the answer and comment networks are not directional.
The nature and structure of the PeerWise network does not allow many of the
common network metrics to be meaningfully applied. As PeerWise is anonymous (to the
extent that even screen names are not visible to other users) students do not know with
whom they are engaging – there is no choice over who they interact with. Moreover, students
actually interact with a question rather than with another student (the question author).
Students only have a connection with each other where they have interacted with at least one
question in common. The shared connection is not so much a direct connection between two
people, such as question author and answerer or author and commenter, but rather a measure
of co-participation [173]. It reflects something about a particular question – perhaps even
something as basic as its difficulty or rating (discussed in more detail in Chapter 8) –
encouraged a pair of students to either answer or comment on it. The question, and perhaps
the reasons for being attracted to and choosing to engage with it, is the common link between
each actor sharing the question. The common thread linking students who answer or
comment on the same question may be that they need practice in the same curricular area or
that a particular question appeals to a shared aspect of the students’ characters. Whilst this
reasoning about shared characteristics of people who co-participate in events may make
sense as to why people would choose to attend the same sports club, it may be considered an
overly grand assertion to make about the PeerWise network. There are many questions to
answer – students generally answer a large number of questions. Rather than viewing
connections as a product of considered choices made by students, co-engagement with a
question is perhaps more accurately viewed as the potential to engage (in the answer
network), or the act of engaging (in the comment network), in peer discussion at a deeper
level, in order to develop a shared understanding of course materials.
In network analysis, having a large number of connections is often seen as an
increased opportunity to obtain ‘secret information’, or at least, gain an advantage by
obtaining information first. [171]. In PeerWise networks, this is not the case as all questions
are visible to all students, as are all comments. The larger one’s network, the more
opportunity for becoming exposed to differing viewpoints. It is the potential for entering into
81
dialogue with another student, first of all by answering the same question, then by sharing
ideas through commenting and providing feedback, that holds the benefit for the student
[166]. The meaning created between one pair of students will be different to the meaning
made by a different pair of students, as each student brings their own background and
understanding to the situation – they generate knowledge and understanding by using past
experiences and prior knowledge [174]. The knowledge and social capital in the network as a
whole is therefore constantly being added to and transformed with each encounter, evolving
into a richer resource for further exploitation. For this reason, it does not make sense to
analyse the roles of the actors in the network in terms of their position of power in
controlling the flow of information, but rather of their potential to gain exposure to the
collective resource or the social capital of the network.
4.1.2 Networks and social capital
It is hypothesised that co-participation in the PeerWise network could aid the
development and transfer of social capital between students within the network. Social
capital has been defined as “investment in social relations with expected returns” where the
interactions between members of a group, or network, maintain and develop the collective
asset [175]. The notion of social capital is broad and has changed significantly, both in terms
of how it is defined and therefore its subsequent measurement. All views, however, focus on
two aspects: “(1) the resources embedded in relations one can directly or indirectly access
and (2) one’s location in this network of relations” [161].
Although there has been some discussion as to whether social capital is an individual
or collective advantage – is it the individual or the group that benefits from having access to
resources? – it is generally accepted that “it is the interact[ion of] members who make the
maintenance and reproduction of this social asset possible” [162]. Lin argues that resources
are embedded in social relations rather than within individuals. In PeerWise students engage
in practices based upon social constructivist pedagogy, sharing perspectives and information
to co-construct knowledge and meaning. Students are aware that other students can give
guidance (resources) to enhance their understanding – they know that they can ask questions
and invite feedback and responses. The degree to which one can access the collective
wisdom – the class resource – will depend on the location one has in the particular network
[176].
Using techniques of network analysis is an appropriate approach to investigate the
degree to which individuals have access to, and can benefit from, the social capital held by
the group [175]. Different network metrics imply different methods of accessing and
82
developing social capital and therefore different network structures. There may be some
benefit to an individual or to the network as a whole from being able to access resources not
currently possessed by the collective – perhaps having one key individual bridging gaps
between subgroups in the network. On the other hand, in order to maintain capital and
preserve resources, a dense network, with lots of inter-connections may be beneficial. Lin
[175] bridges the differing perspectives to identify three aspects of social capital to be
considered when modelling networks. (1) There must be an investment of social capital into
the network. (2) There must be access to and an ability to mobilise social capital when
needed (the degree to which this is possible will depend on an individual’s position within
the network) (3) There must be some return – either in the form of new resources, or
consolidation of current goods [175,176]. All three of these requirements are present in the
PeerWise network: students have capital in the form of understanding and perspective, they
are able to engage with their peers to mobilise the knowledge. The mobilisation of the
knowledge then results in returns (enhanced understanding and performance) for both parties
in the knowledge transaction, which leads to the consolidation of the knowledge in both the
network as a whole and in the individual student.
To date there has been no examination of the networks arising on the PeerWise
system. There has, however, been some research undertaken in the wider field of e-learning
using social network analysis to investigate the nature of the interactions between
participants in e-learning communities in order to more effectively support student learning.
A 2015 review of the research into social network analysis in e-learning found that
collaborative activities were extremely beneficial to student learning [178]. It has been
shown that the density of an individual’s social network is a significant predictor of
academic performance – accounting for around 20% of the variance in academic
performance (when also controlling for academic ability, which, in a similar manner to the
findings in Chapters 5 to 7, explained around 64% of the variance in attainment) [179]. In
the field of physics, a strong correlation has been found between the number of connections
a student has made as measured through recollections of interactions with other students, and
their future exam performance [180].
4.1.3 Data Collection and methods
As participation in PeerWise is a compulsory component of each course, every
student should have participated in the system. Data collection for social network analysis
often relies on recollection of individuals to enumerate friendships or connections and so can
be incomplete or inaccurate due to flaws in recollection or in recording, or due to bias
83
towards particular friendships in the recall process (although how actors perceive their
relationships may be an interesting question in itself) [170]. The data obtained from
PeerWise is not subject to such problems as the network is well bounded – every interaction
has been recorded by the system – resulting in complete, or census, networks.
For each course, two networks were constructed: the ‘answer network’, and the
‘comment network’. Where students answer the same question there is potential for
collaboration and discussion, as comments can only be made after answering a question.
Constructing the answer network using this criterion therefore enables measurement of the
potential for collaboration between students. The comment network is constructed in a
similar way – where there is a shared connection, a particular pair of students have both
answered, and subsequently commented upon, the same question. It is not necessarily the
case that students will have directly responded to each other’s comments, but it is reasonable
to assume that they will have had the opportunity to read and engage with prior comments
which may have either enhanced their own understanding, or instigated a critical response
[173]. (One exception being the student who contributes the first comment to the question.)
One of the most widely used metrics when describing networks and the relationships
that form between actors is ‘centrality’. There are many interpretations of centrality, but they
all provide a measure of importance or influence of an actor within a given network
[163,164,170]. Degree centrality is perhaps the most basic measure of centrality. In an
undirected network, the degree is the number of direct connections an actor has – a measure
of collaboration between students [181]. In the answer network, the degree indicates the
number of people with whom an individual has shared a question through answering, in the
comment network, the number of people with whom an individual has shared a question
through commenting. The number of connections that can be made depend upon the size of
the network – clearly in a larger network, each individual has the opportunity to make more
connections than in a small network. In order to allow comparison of centrality measures
across networks, either within a course (such as the comparison between the answer and
comment networks) or between courses, degree centrality can be normalized by dividing
through by the maximum value possible (i.e. N–1, where N is the number of nodes) [182]. It
should be noted that, although similar, centrality measures calculated from either co-
affiliation matrix here are not equivalent to the number of questions answered or the number
of comments given and received. The number of questions answered and comments provided
provide a measure of the quantity of interactions; however these do not provide information
about how widely across the network a student interacts. A number of comments given or
84
received could indicate a large number of unique connections, or it could indicate that a
student interacts regularly with a smaller number of people.
Just as a network can be analysed from the perspective of its constituent nodes, it
can also be analysed as an entity in its own right. Several metrics can be used to describe the
nature of the network as a whole; however, as already discussed in relation to the individual
node analysis, many of the measures commonly used are unsuited to the PeerWise network.
The density of the network as a whole can be calculated to determine the proportion of
connections that are present out of all possible connections. This measure is equivalent to the
average normalised degree – the mean of the normalised degrees of the nodes in the network.
The density metric is dependent on the size of the network and so it is therefore
difficult to define what amounts to a high or low level of connectivity [164]. It is easier for
people in a smaller network to know a greater proportion of people than for people in a
larger network. In the current analysis, the anonymity of the networks in this case perhaps
negate this issue somewhat as there is an element of randomness in terms of the other people
who choose to interact with a particular question. It would however seem reasonable to
hypothesise that in larger networks it is less likely that any given pairing will arise,
compared to smaller networks. Although the requirements of answering and commenting on
questions are similar across all courses, the number of questions available to be answered
ranges from 1730 in GGA 2012–13 to 149 in Physics 1B 2011–12. In courses where there
are fewer questions to be answered but which have broadly similar requirements for
answering and commenting it is reasonable to hypothesise that there will be more chance of
students answering or commenting on the same questions. In courses where there are more
questions to choose from it is less likely that a particular pairing between any two students
will arise.
Construction and analyses of the networks was carried using the software package
UCINET 6, with subsequent statistical analyses undertaken in SPSS.
4.1.4 Results and discussion
Table 9 shows the mean normalised degree (or density) of the answer and comment
networks for each course. In all courses the density of the comment network is smaller than
the density of the answer network, which is unsurprising, given that a connection has to be
made between students through answering before commenting can occur. (The sole
exception to this is where a question author makes a comment on their own question – the
question author will not have answered their own question but are able to comment by virtue
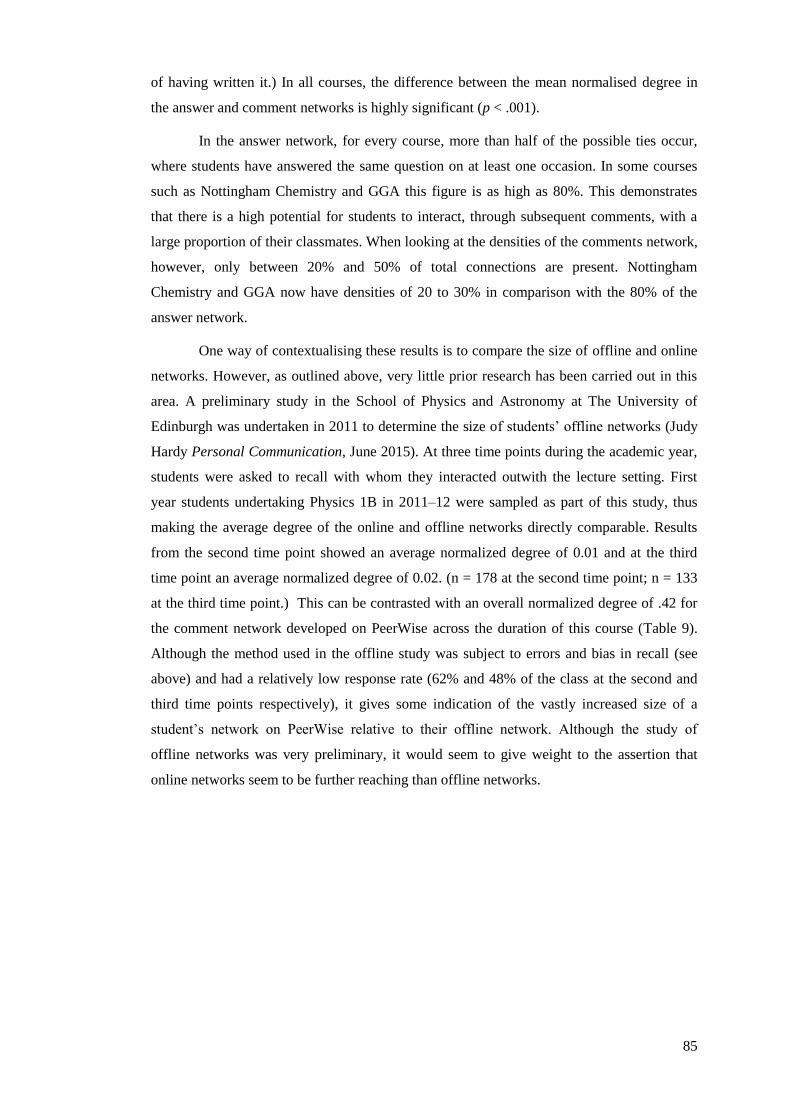
85
of having written it.) In all courses, the difference between the mean normalised degree in
the answer and comment networks is highly significant (p < .001).
In the answer network, for every course, more than half of the possible ties occur,
where students have answered the same question on at least one occasion. In some courses
such as Nottingham Chemistry and GGA this figure is as high as 80%. This demonstrates
that there is a high potential for students to interact, through subsequent comments, with a
large proportion of their classmates. When looking at the densities of the comments network,
however, only between 20% and 50% of total connections are present. Nottingham
Chemistry and GGA now have densities of 20 to 30% in comparison with the 80% of the
answer network.
One way of contextualising these results is to compare the size of offline and online
networks. However, as outlined above, very little prior research has been carried out in this
area. A preliminary study in the School of Physics and Astronomy at The University of
Edinburgh was undertaken in 2011 to determine the size of students’ offline networks (Judy
Hardy Personal Communication, June 2015). At three time points during the academic year,
students were asked to recall with whom they interacted outwith the lecture setting. First
year students undertaking Physics 1B in 2011–12 were sampled as part of this study, thus
making the average degree of the online and offline networks directly comparable. Results
from the second time point showed an average normalized degree of 0.01 and at the third
time point an average normalized degree of 0.02. (n = 178 at the second time point; n = 133
at the third time point.) This can be contrasted with an overall normalized degree of .42 for
the comment network developed on PeerWise across the duration of this course (Table 9).
Although the method used in the offline study was subject to errors and bias in recall (see
above) and had a relatively low response rate (62% and 48% of the class at the second and
third time points respectively), it gives some indication of the vastly increased size of a
student’s network on PeerWise relative to their offline network. Although the study of
offline networks was very preliminary, it would seem to give weight to the assertion that
online networks seem to be further reaching than offline networks.
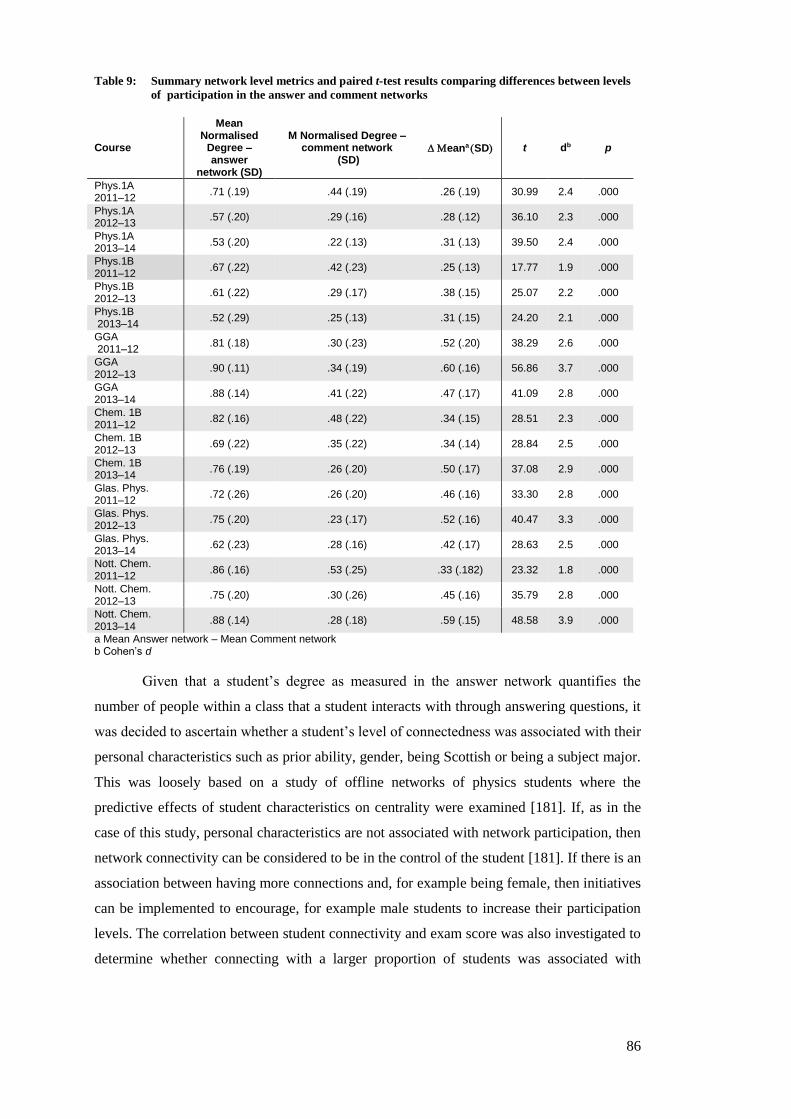
86
Table 9: Summary network level metrics and paired t-test results comparing differences between levels
of participation in the answer and comment networks
Course
Mean Normalised
Degree – answer
network (SD)
M Normalised Degree – comment network
(SD) eana SD t db p
Phys.1A 2011–12
.71 (.19) .44 (.19) .26 (.19) 30.99 2.4 .000
Phys.1A 2012–13
.57 (.20) .29 (.16) .28 (.12) 36.10 2.3 .000
Phys.1A 2013–14
.53 (.20) .22 (.13) .31 (.13) 39.50 2.4 .000
Phys.1B 2011–12
.67 (.22) .42 (.23) .25 (.13) 17.77 1.9 .000
Phys.1B 2012–13
.61 (.22) .29 (.17) .38 (.15) 25.07 2.2 .000
Phys.1B 2013–14
.52 (.29) .25 (.13) .31 (.15) 24.20 2.1 .000
GGA 2011–12
.81 (.18) .30 (.23) .52 (.20) 38.29 2.6 .000
GGA 2012–13
.90 (.11) .34 (.19) .60 (.16) 56.86 3.7 .000
GGA 2013–14
.88 (.14) .41 (.22) .47 (.17) 41.09 2.8 .000
Chem. 1B 2011–12
.82 (.16) .48 (.22) .34 (.15) 28.51 2.3 .000
Chem. 1B 2012–13
.69 (.22) .35 (.22) .34 (.14) 28.84 2.5 .000
Chem. 1B 2013–14
.76 (.19) .26 (.20) .50 (.17) 37.08 2.9 .000
Glas. Phys. 2011–12
.72 (.26) .26 (.20) .46 (.16) 33.30 2.8 .000
Glas. Phys. 2012–13
.75 (.20) .23 (.17) .52 (.16) 40.47 3.3 .000
Glas. Phys. 2013–14
.62 (.23) .28 (.16) .42 (.17) 28.63 2.5 .000
Nott. Chem. 2011–12
.86 (.16) .53 (.25) .33 (.182) 23.32 1.8 .000
Nott. Chem. 2012–13
.75 (.20) .30 (.26) .45 (.16) 35.79 2.8 .000
Nott. Chem. 2013–14
.88 (.14) .28 (.18) .59 (.15) 48.58 3.9 .000
a Mean Answer network – Mean Comment network b Cohen’s d
Given that a student’s degree as measured in the answer network quantifies the
number of people within a class that a student interacts with through answering questions, it
was decided to ascertain whether a student’s level of connectedness was associated with their
personal characteristics such as prior ability, gender, being Scottish or being a subject major.
This was loosely based on a study of offline networks of physics students where the
predictive effects of student characteristics on centrality were examined [181]. If, as in the
case of this study, personal characteristics are not associated with network participation, then
network connectivity can be considered to be in the control of the student [181]. If there is an
association between having more connections and, for example being female, then initiatives
can be implemented to encourage, for example male students to increase their participation
levels. The correlation between student connectivity and exam score was also investigated to
determine whether connecting with a larger proportion of students was associated with
87
performance on end of course exams. The correlations for both these analyses are displayed
in Table 10.
Table 10: Correlations between students’ normalised degrees from the answer network and their personal
characteristics
Pre Male Scottish Major Exam
Phys.1A 2011–12 –.092 .079 .039 .087 .231**
Phys.1A 2012–13 .035 .136* .010 .016 .154*
Phys.1A 2013–14 –.066 –.044 –.054 –.077 .106
Phys.1B 2011–12 .280** –.120 –.057 .011 .260*
Phys.1B 2012–13 .162 –.114 .067 .108 .293**
Phys.1B 2013–14 –.039 –.117 .051 .091 .012
Chem. 1B 2011–12 .290*** .185* –.006 .097 .408**
Chem. 1B 2012–13 .357*** .170* .194* .229** .437**
Chem. 1B 2013–14 .193* –.165* .037 .173* .206**
GGA 2011–12 .243*** –.266*** .054 –.051 .281**
GGA 2012–13 .023 –.237*** .071 –.029 .249**
GGA 2013–14 .287*** –.266*** –.026 –.055 .234**
Glas. Phys. 2011–12
.223** –.071 .344**
Glas. Phys. 2012–13
.095 –.190* .217**
Glas. Phys. 2013–14
.246** –.155 .284**
Nott. Chem. 2011–12
.337*** –.210** .384**
Nott. Chem. 2012–13
.089 –.207** .225**
Nott. Chem. 2013–14
.104 –.117 .281**
*** p < .001; ** p< .01; * p <.05
On the whole, there are few strong associations between student characteristics and
their connectivity. However some significant effects of a medium level of magnitude exist in
the relationship between prior ability and connectivity. This echoes the results of Bruun and
Brewe [180] and could reflect that stronger students participate to a greater degree than
weaker students, certainly with regard to writing and answering questions. (See Table 20,
Section 5.1.1 for correlations between prior-ability and PeerWise activity.) Since students
who participate more will answer more questions, they are more likely to share questions
with a larger proportion of their cohort than weaker students.
In all but two courses there is a significant association between students’
connectivity through answering questions and exam score (Table 10). The degree of
connectivity in the answer network was correlated with exam score as the answer network
88
measures the potential for making meaningful collaborations. In each of the courses where
an association exists (16 courses), the relationship is of a moderate magnitude. This
preliminary analysis highlights the potential enhancement of learning that can occur when
students share perspectives with their wider peer-group.
The above analyses are intended to give a preliminary snapshot of the nature of the
networks arising from student interactions within the PeerWise system. Network density is a
complicated measure, contingent on network size. For the PeerWise data, this is not simply
the number of students in a particular course, but also depends on each particular course’s
assessment requirements i.e. the number of questions students are required to write and
interact with. It is therefore difficult to pinpoint a value that would be considered as
objectively dense. That said, in all the courses examined, over half of the possible
connections are present, with some courses displaying over 80% of possible connections in
the answer network. In all courses, between 30% and 60% of connections are present in the
comment network. The connectivity displayed in the PeerWise networks can be considered
even more impressive when compared to the average degree of students’ self-reported
offline networks (Judy Hardy, Personal Communication, June 2015). Moreover, although
this analysis is preliminary, the work undertaken thus far is consistent with the findings from
previous research studies [178–180] which also found that increased connectivity is
associated with increased performance in end of course exams. This highlights the potential
benefit to students of engaging with a wide range of peer perspectives.
4.2 Preliminary exploration of the relationship between PeerWise
engagement and exam performance
As outlined in Chapter 1, there has already been work undertaken to evaluate
whether students of different ability levels gain benefit from engaging with PeerWise, and if
so, which activities are associated with greatest learning gains. Within most ability levels,
students who have a higher level of activity across all the tasks on PeerWise perform
significantly better on their final exams than students who have a lower level of activity
[122,183]. The results of PeerWise evaluations have been mixed. One review of PeerWise
use in three upper division computer science courses failed to highlight any consistent
benefits from engaging with the system and attainment [126]. Other studies have
demonstrated that participation in discussions via the commenting facility is associated with
exam performance [122], yet some have demonstrated a lack of association between
answering questions and exam score [117,122]. Prior work also suggests that students who
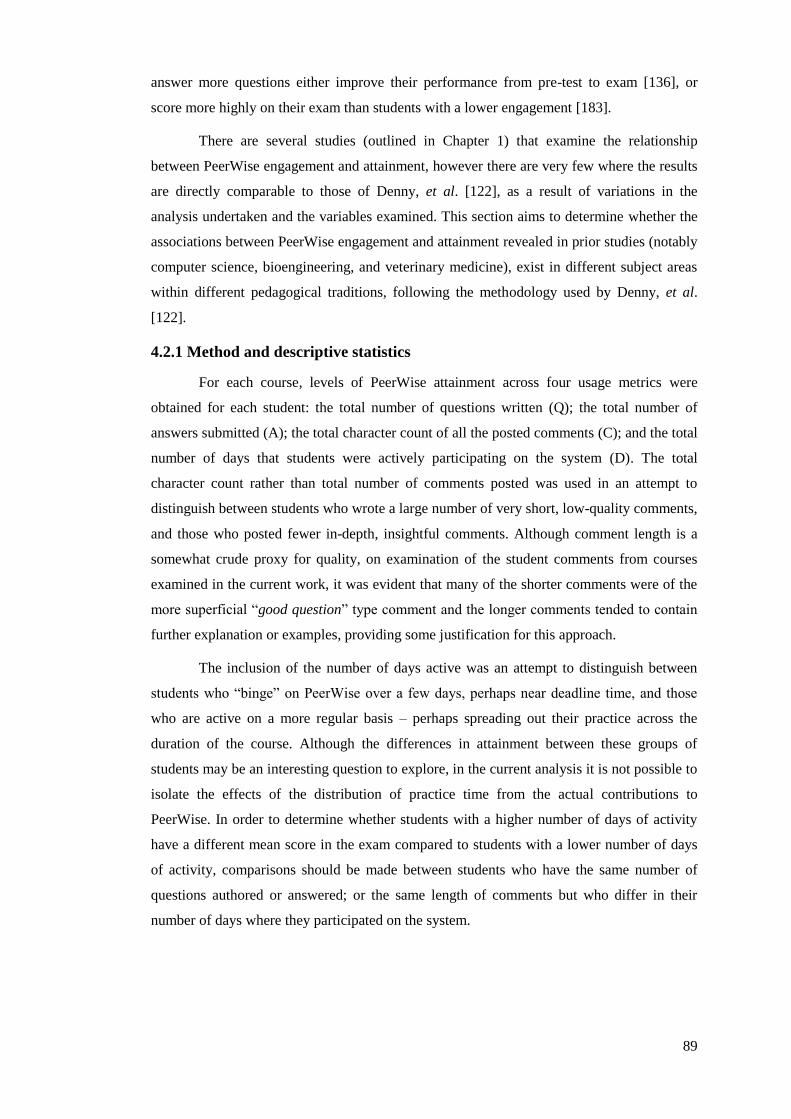
89
answer more questions either improve their performance from pre-test to exam [136], or
score more highly on their exam than students with a lower engagement [183].
There are several studies (outlined in Chapter 1) that examine the relationship
between PeerWise engagement and attainment, however there are very few where the results
are directly comparable to those of Denny, et al. [122], as a result of variations in the
analysis undertaken and the variables examined. This section aims to determine whether the
associations between PeerWise engagement and attainment revealed in prior studies (notably
computer science, bioengineering, and veterinary medicine), exist in different subject areas
within different pedagogical traditions, following the methodology used by Denny, et al.
[122].
4.2.1 Method and descriptive statistics
For each course, levels of PeerWise attainment across four usage metrics were
obtained for each student: the total number of questions written (Q); the total number of
answers submitted (A); the total character count of all the posted comments (C); and the total
number of days that students were actively participating on the system (D). The total
character count rather than total number of comments posted was used in an attempt to
distinguish between students who wrote a large number of very short, low-quality comments,
and those who posted fewer in-depth, insightful comments. Although comment length is a
somewhat crude proxy for quality, on examination of the student comments from courses
examined in the current work, it was evident that many of the shorter comments were of the
more superficial “good question” type comment and the longer comments tended to contain
further explanation or examples, providing some justification for this approach.
The inclusion of the number of days active was an attempt to distinguish between
students who “binge” on PeerWise over a few days, perhaps near deadline time, and those
who are active on a more regular basis – perhaps spreading out their practice across the
duration of the course. Although the differences in attainment between these groups of
students may be an interesting question to explore, in the current analysis it is not possible to
isolate the effects of the distribution of practice time from the actual contributions to
PeerWise. In order to determine whether students with a higher number of days of activity
have a different mean score in the exam compared to students with a lower number of days
of activity, comparisons should be made between students who have the same number of
questions authored or answered; or the same length of comments but who differ in their
number of days where they participated on the system.
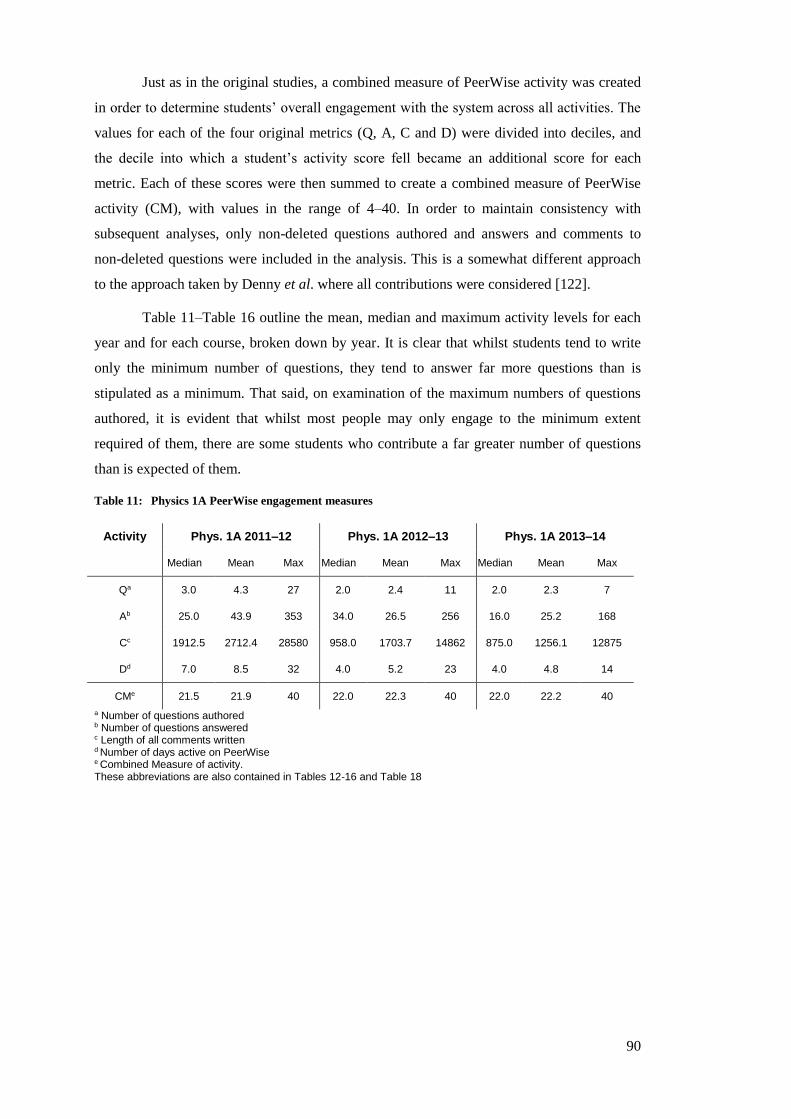
90
Just as in the original studies, a combined measure of PeerWise activity was created
in order to determine students’ overall engagement with the system across all activities. The
values for each of the four original metrics (Q, A, C and D) were divided into deciles, and
the decile into which a student’s activity score fell became an additional score for each
metric. Each of these scores were then summed to create a combined measure of PeerWise
activity (CM), with values in the range of 4–40. In order to maintain consistency with
subsequent analyses, only non-deleted questions authored and answers and comments to
non-deleted questions were included in the analysis. This is a somewhat different approach
to the approach taken by Denny et al. where all contributions were considered [122].
Table 11–Table 16 outline the mean, median and maximum activity levels for each
year and for each course, broken down by year. It is clear that whilst students tend to write
only the minimum number of questions, they tend to answer far more questions than is
stipulated as a minimum. That said, on examination of the maximum numbers of questions
authored, it is evident that whilst most people may only engage to the minimum extent
required of them, there are some students who contribute a far greater number of questions
than is expected of them.
Table 11: Physics 1A PeerWise engagement measures
Activity Phys. 1A 2011–12 Phys. 1A 2012–13 Phys. 1A 2013–14
Median Mean Max Median Mean Max Median Mean Max
Qa 3.0 4.3 27 2.0 2.4 11 2.0 2.3 7
Ab 25.0 43.9 353 34.0 26.5 256 16.0 25.2 168
Cc 1912.5 2712.4 28580 958.0 1703.7 14862 875.0 1256.1 12875
Dd 7.0 8.5 32 4.0 5.2 23 4.0 4.8 14
CMe 21.5 21.9 40 22.0 22.3 40 22.0 22.2 40
a Number of questions authored b Number of questions answered c Length of all comments written d Number of days active on PeerWise e Combined Measure of activity. These abbreviations are also contained in Tables 12-16 and Table 18
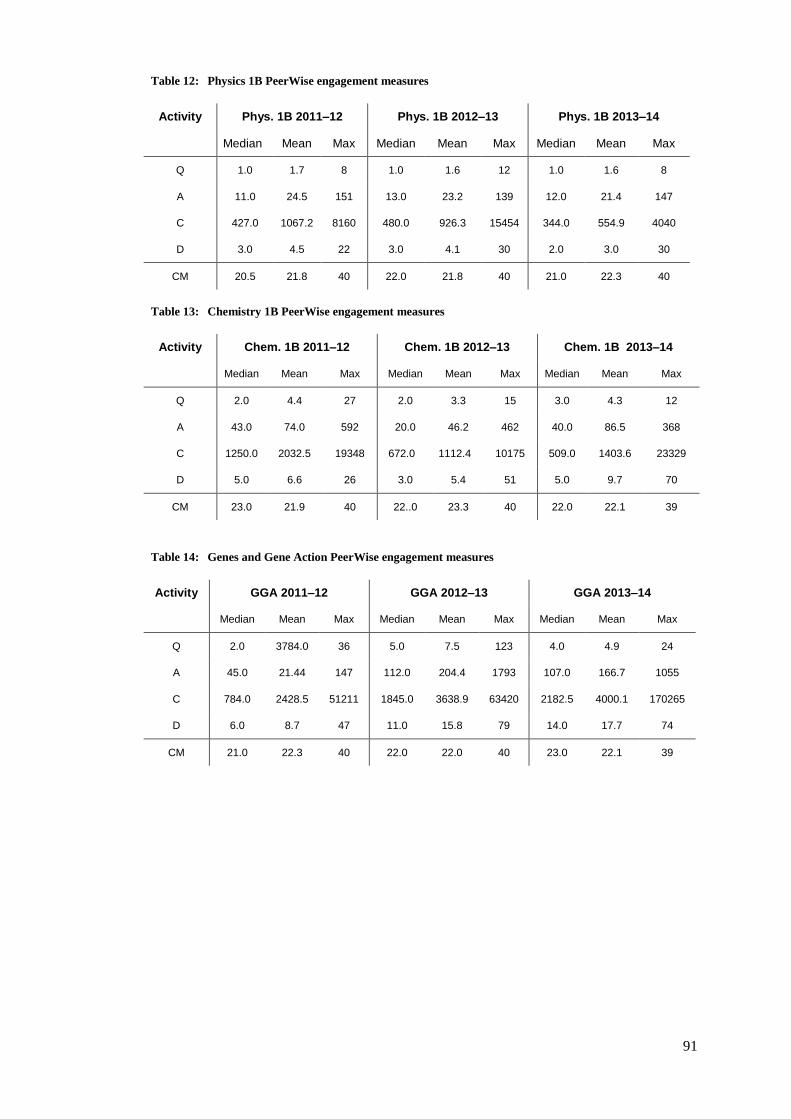
91
Table 12: Physics 1B PeerWise engagement measures
Activity Phys. 1B 2011–12 Phys. 1B 2012–13 Phys. 1B 2013–14
Median Mean Max Median Mean Max Median Mean Max
Q 1.0 1.7 8 1.0 1.6 12 1.0 1.6 8
A 11.0 24.5 151 13.0 23.2 139 12.0 21.4 147
C 427.0 1067.2 8160 480.0 926.3 15454 344.0 554.9 4040
D 3.0 4.5 22 3.0 4.1 30 2.0 3.0 30
CM 20.5 21.8 40 22.0 21.8 40 21.0 22.3 40
Table 13: Chemistry 1B PeerWise engagement measures
Activity Chem. 1B 2011–12 Chem. 1B 2012–13 Chem. 1B 2013–14
Median Mean Max Median Mean Max Median Mean Max
Q 2.0 4.4 27 2.0 3.3 15 3.0 4.3 12
A 43.0 74.0 592 20.0 46.2 462 40.0 86.5 368
C 1250.0 2032.5 19348 672.0 1112.4 10175 509.0 1403.6 23329
D 5.0 6.6 26 3.0 5.4 51 5.0 9.7 70
CM 23.0 21.9 40 22..0 23.3 40 22.0 22.1 39
Table 14: Genes and Gene Action PeerWise engagement measures
Activity GGA 2011–12 GGA 2012–13 GGA 2013–14
Median Mean Max Median Mean Max Median Mean Max
Q 2.0 3784.0 36 5.0 7.5 123 4.0 4.9 24
A 45.0 21.44 147 112.0 204.4 1793 107.0 166.7 1055
C 784.0 2428.5 51211 1845.0 3638.9 63420 2182.5 4000.1 170265
D 6.0 8.7 47 11.0 15.8 79 14.0 17.7 74
CM 21.0 22.3 40 22.0 22.0 40 23.0 22.1 39
92
Table 15: Glasgow Physics PeerWise engagement measures
Activity Glas. Phys. 2011–12 Glas. Phys. 2012–13 Glas. Phys. 2013–14
Median Mean Max Median Mean Max Median Mean Max
Q 4.0 4.4 24 7.0 5.3 25 4.0 5.3 27
A 24.5 58.4 656 40.0 93.6 729 27.0 57.1 576
C 608.5 2342.8 59691 864.0 1817.4 18362 579.0 1506.4 48049
D 5.0 7.1 42 7.0 9.5 25 4.0 6.0 46
CM 22.0 22.1 40 23.0 21.8 40 22.0 21.7 40
Table 16: Nottingham Chemistry PeerWise engagement measures
Activity Nott. Chem. 2011–12 Nott. Chem. 2012–13 Nott. Chem. 2013–14
Median Mean Max Median Mean Max Median Mean Max
Q 3.0 3.3 16 2.0 3.3 26 2.0 2.2 9
A 50.0 82.9 425 33.0 91.8 666 46.0 70.9 364
C 1555.5 3612.4 42354 683.0 1937.4 37019 823.0 1952.3 73901
D 7.0 10.2 46 5.0 8.3 51 6.0 8.8 42
CM 21.0 21.9 40 21.0 21.8 40 23.0 21.9 40
Using the minimum activity requirements set out in Table 1 (Section 2.2) and the
number of submissions in Table 8 (Section 2.3.1), the total number of submissions expected
were everyone to contribute to the minimum level can be compared to the actual number of
submissions (Table 17). Although for most courses the number of contributed questions is
very similar to the minimum number expected, given the course requirements (Table 17),
there are several courses where double (7/18 courses) – or even over triple (3/18) – the
minimum number of questions have been authored. For the number of questions answered,
most courses have well over double the expected number of answers submitted, with many
courses demonstrating between five to ten times as many answers as required. Similarly
there are generally between four to nine times the required number of comments submitted
to the system.
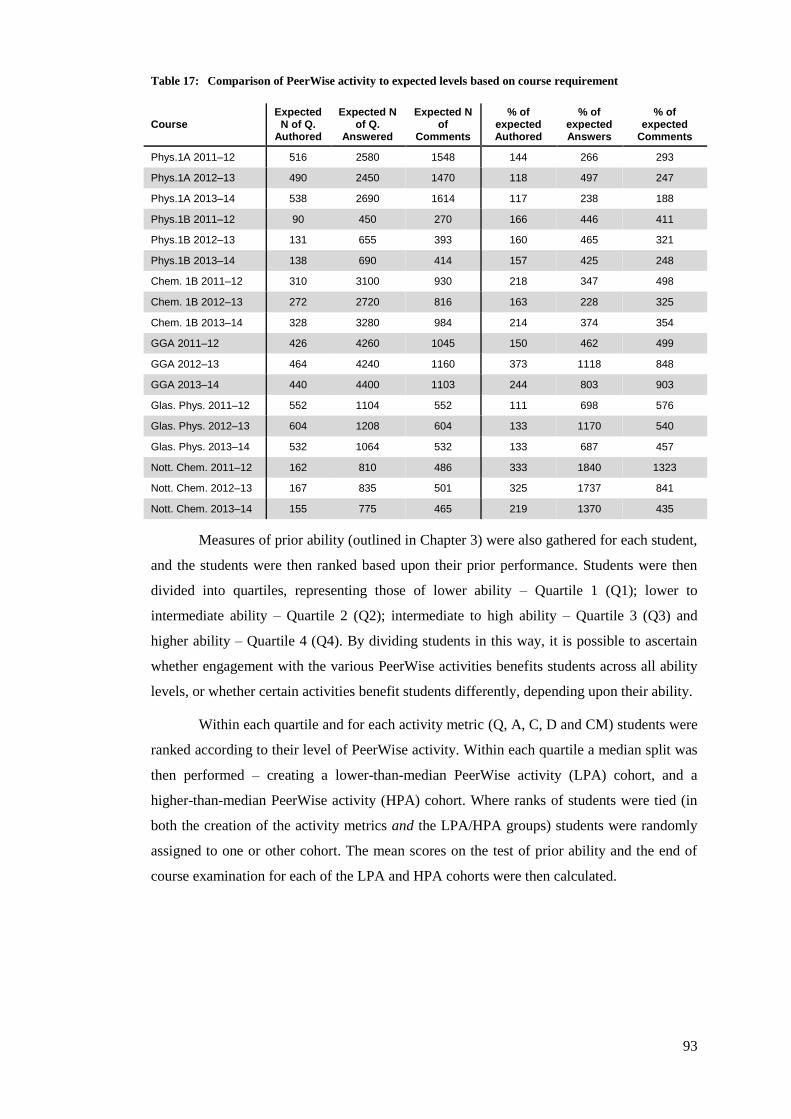
93
Table 17: Comparison of PeerWise activity to expected levels based on course requirement
Course Expected
N of Q. Authored
Expected N of Q.
Answered
Expected N of
Comments
% of expected Authored
% of expected Answers
% of expected
Comments
Phys.1A 2011–12 516 2580 1548 144 266 293
Phys.1A 2012–13 490 2450 1470 118 497 247
Phys.1A 2013–14 538 2690 1614 117 238 188
Phys.1B 2011–12 90 450 270 166 446 411
Phys.1B 2012–13 131 655 393 160 465 321
Phys.1B 2013–14 138 690 414 157 425 248
Chem. 1B 2011–12 310 3100 930 218 347 498
Chem. 1B 2012–13 272 2720 816 163 228 325
Chem. 1B 2013–14 328 3280 984 214 374 354
GGA 2011–12 426 4260 1045 150 462 499
GGA 2012–13 464 4240 1160 373 1118 848
GGA 2013–14 440 4400 1103 244 803 903
Glas. Phys. 2011–12 552 1104 552 111 698 576
Glas. Phys. 2012–13 604 1208 604 133 1170 540
Glas. Phys. 2013–14 532 1064 532 133 687 457
Nott. Chem. 2011–12 162 810 486 333 1840 1323
Nott. Chem. 2012–13 167 835 501 325 1737 841
Nott. Chem. 2013–14 155 775 465 219 1370 435
Measures of prior ability (outlined in Chapter 3) were also gathered for each student,
and the students were then ranked based upon their prior performance. Students were then
divided into quartiles, representing those of lower ability – Quartile 1 (Q1); lower to
intermediate ability – Quartile 2 (Q2); intermediate to high ability – Quartile 3 (Q3) and
higher ability – Quartile 4 (Q4). By dividing students in this way, it is possible to ascertain
whether engagement with the various PeerWise activities benefits students across all ability
levels, or whether certain activities benefit students differently, depending upon their ability.
Within each quartile and for each activity metric (Q, A, C, D and CM) students were
ranked according to their level of PeerWise activity. Within each quartile a median split was
then performed – creating a lower-than-median PeerWise activity (LPA) cohort, and a
higher-than-median PeerWise activity (HPA) cohort. Where ranks of students were tied (in
both the creation of the activity metrics and the LPA/HPA groups) students were randomly
assigned to one or other cohort. The mean scores on the test of prior ability and the end of
course examination for each of the LPA and HPA cohorts were then calculated.
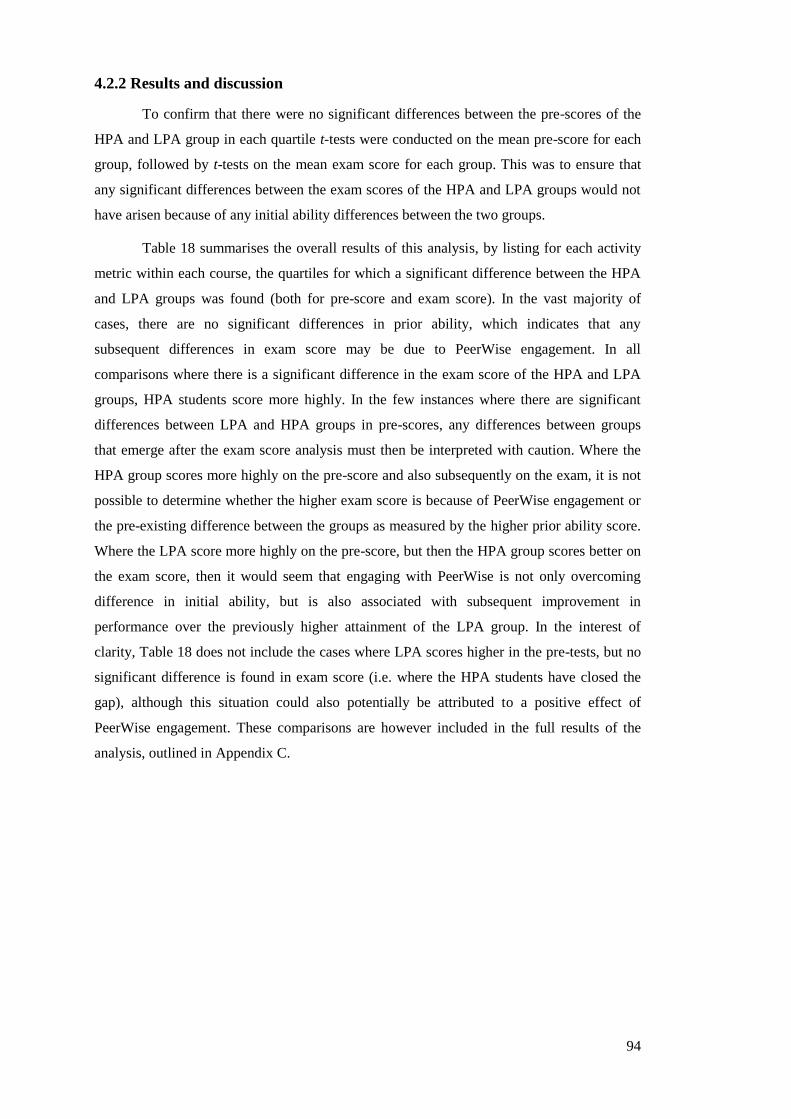
94
4.2.2 Results and discussion
To confirm that there were no significant differences between the pre-scores of the
HPA and LPA group in each quartile t-tests were conducted on the mean pre-score for each
group, followed by t-tests on the mean exam score for each group. This was to ensure that
any significant differences between the exam scores of the HPA and LPA groups would not
have arisen because of any initial ability differences between the two groups.
Table 18 summarises the overall results of this analysis, by listing for each activity
metric within each course, the quartiles for which a significant difference between the HPA
and LPA groups was found (both for pre-score and exam score). In the vast majority of
cases, there are no significant differences in prior ability, which indicates that any
subsequent differences in exam score may be due to PeerWise engagement. In all
comparisons where there is a significant difference in the exam score of the HPA and LPA
groups, HPA students score more highly. In the few instances where there are significant
differences between LPA and HPA groups in pre-scores, any differences between groups
that emerge after the exam score analysis must then be interpreted with caution. Where the
HPA group scores more highly on the pre-score and also subsequently on the exam, it is not
possible to determine whether the higher exam score is because of PeerWise engagement or
the pre-existing difference between the groups as measured by the higher prior ability score.
Where the LPA score more highly on the pre-score, but then the HPA group scores better on
the exam score, then it would seem that engaging with PeerWise is not only overcoming
difference in initial ability, but is also associated with subsequent improvement in
performance over the previously higher attainment of the LPA group. In the interest of
clarity, Table 18 does not include the cases where LPA scores higher in the pre-tests, but no
significant difference is found in exam score (i.e. where the HPA students have closed the
gap), although this situation could also potentially be attributed to a positive effect of
PeerWise engagement. These comparisons are however included in the full results of the
analysis, outlined in Appendix C.
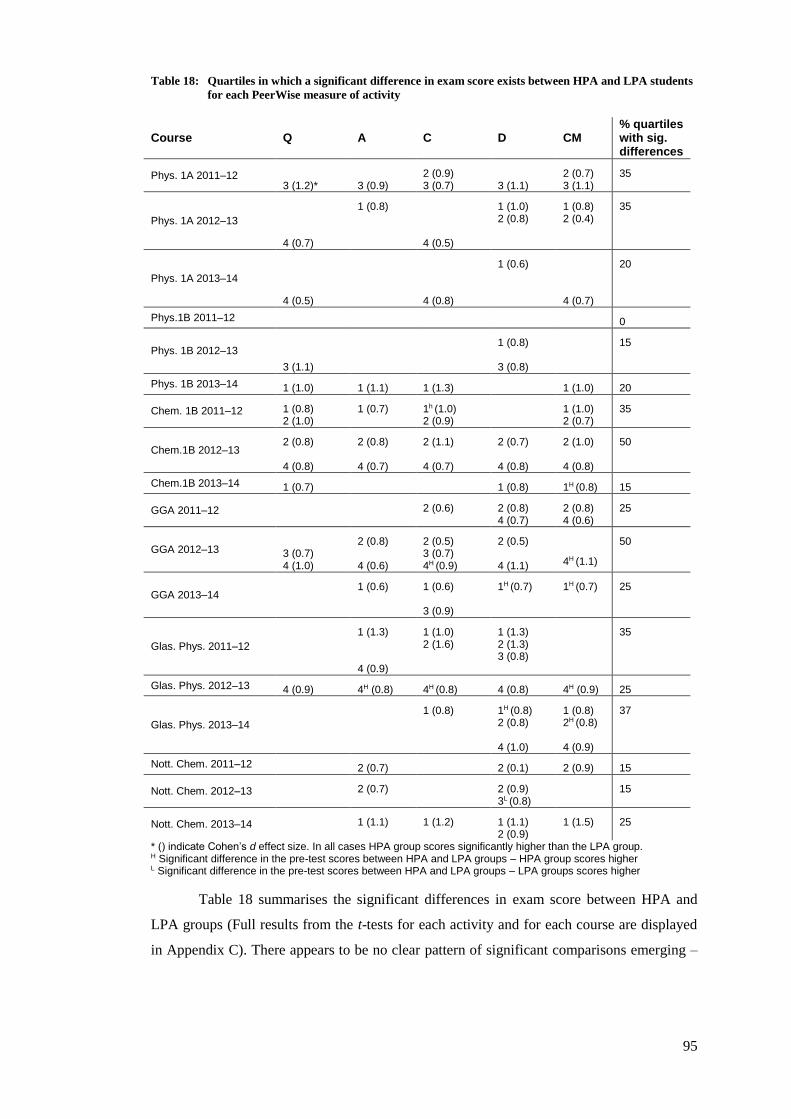
95
Table 18: Quartiles in which a significant difference in exam score exists between HPA and LPA students
for each PeerWise measure of activity
Course Q A C D CM % quartiles with sig. differences
Phys. 1A 2011–12 3 (1.2)*
3 (0.9)
2 (0.9) 3 (0.7)
3 (1.1)
2 (0.7) 3 (1.1)
35
Phys. 1A 2012–13
4 (0.7)
1 (0.8) 4 (0.5)
1 (1.0) 2 (0.8)
1 (0.8) 2 (0.4)
35
Phys. 1A 2013–14
4 (0.5)
4 (0.8)
1 (0.6) 4 (0.7)
20
Phys.1B 2011–12 0
Phys. 1B 2012–13 3 (1.1)
1 (0.8) 3 (0.8)
15
Phys. 1B 2013–14 1 (1.0) 1 (1.1) 1 (1.3) 1 (1.0) 20
Chem. 1B 2011–12 1 (0.8) 2 (1.0)
1 (0.7) 1h (1.0) 2 (0.9)
1 (1.0) 2 (0.7)
35
Chem.1B 2012–13 2 (0.8) 4 (0.8)
2 (0.8) 4 (0.7)
2 (1.1) 4 (0.7)
2 (0.7) 4 (0.8)
2 (1.0) 4 (0.8)
50
Chem.1B 2013–14 1 (0.7) 1 (0.8) 1H (0.8) 15
GGA 2011–12 2 (0.6) 2 (0.8) 4 (0.7)
2 (0.8) 4 (0.6)
25
GGA 2012–13 3 (0.7) 4 (1.0)
2 (0.8) 4 (0.6)
2 (0.5) 3 (0.7) 4H (0.9)
2 (0.5) 4 (1.1)
4H (1.1)
50
GGA 2013–14 1 (0.6) 1 (0.6)
3 (0.9)
1H (0.7) 1H (0.7) 25
Glas. Phys. 2011–12
1 (1.3) 4 (0.9)
1 (1.0) 2 (1.6)
1 (1.3) 2 (1.3) 3 (0.8)
35
Glas. Phys. 2012–13 4 (0.9) 4H (0.8) 4H (0.8) 4 (0.8) 4H (0.9) 25
Glas. Phys. 2013–14
1 (0.8) 1H (0.8) 2 (0.8) 4 (1.0)
1 (0.8) 2H (0.8)
4 (0.9)
37
Nott. Chem. 2011–12 2 (0.7) 2 (0.1) 2 (0.9) 15
Nott. Chem. 2012–13 2 (0.7) 2 (0.9) 3L (0.8)
15
Nott. Chem. 2013–14 1 (1.1) 1 (1.2) 1 (1.1) 2 (0.9)
1 (1.5) 25
* () indicate Cohen’s d effect size. In all cases HPA group scores significantly higher than the LPA group.
H Significant difference in the pre-test scores between HPA and LPA groups – HPA group scores higher L Significant difference in the pre-test scores between HPA and LPA groups – LPA groups scores higher
Table 18 summarises the significant differences in exam score between HPA and
LPA groups (Full results from the t-tests for each activity and for each course are displayed
in Appendix C). There appears to be no clear pattern of significant comparisons emerging –
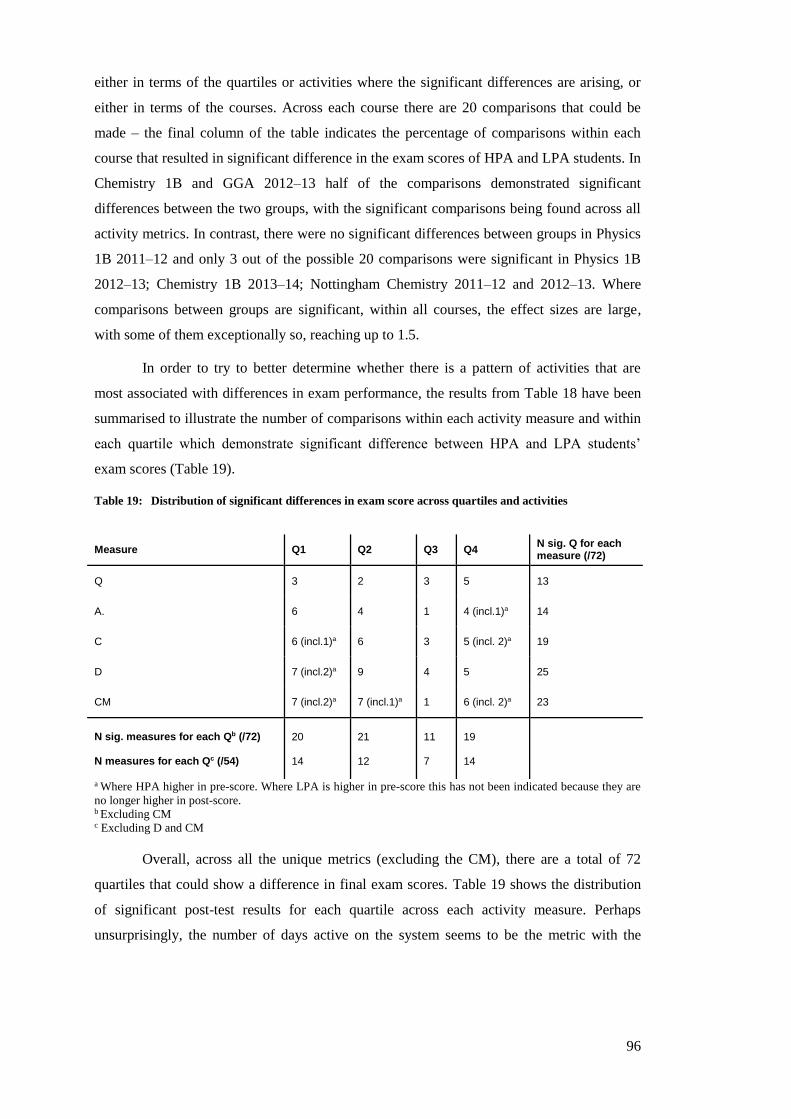
96
either in terms of the quartiles or activities where the significant differences are arising, or
either in terms of the courses. Across each course there are 20 comparisons that could be
made – the final column of the table indicates the percentage of comparisons within each
course that resulted in significant difference in the exam scores of HPA and LPA students. In
Chemistry 1B and GGA 2012–13 half of the comparisons demonstrated significant
differences between the two groups, with the significant comparisons being found across all
activity metrics. In contrast, there were no significant differences between groups in Physics
1B 2011–12 and only 3 out of the possible 20 comparisons were significant in Physics 1B
2012–13; Chemistry 1B 2013–14; Nottingham Chemistry 2011–12 and 2012–13. Where
comparisons between groups are significant, within all courses, the effect sizes are large,
with some of them exceptionally so, reaching up to 1.5.
In order to try to better determine whether there is a pattern of activities that are
most associated with differences in exam performance, the results from Table 18 have been
summarised to illustrate the number of comparisons within each activity measure and within
each quartile which demonstrate significant difference between HPA and LPA students’
exam scores (Table 19).
Table 19: Distribution of significant differences in exam score across quartiles and activities
a Where HPA higher in pre-score. Where LPA is higher in pre-score this has not been indicated because they are
no longer higher in post-score. b Excluding CM c Excluding D and CM
Overall, across all the unique metrics (excluding the CM), there are a total of 72
quartiles that could show a difference in final exam scores. Table 19 shows the distribution
of significant post-test results for each quartile across each activity measure. Perhaps
unsurprisingly, the number of days active on the system seems to be the metric with the
Measure Q1 Q2 Q3 Q4 N sig. Q for each measure (/72)
Q 3 2 3 5 13
A. 6 4 1 4 (incl.1)a 14
C 6 (incl.1)a 6 3 5 (incl. 2)a 19
D 7 (incl.2)a 9 4 5 25
CM 7 (incl.2)a 7 (incl.1)a 1 6 (incl. 2)a 23
N sig. measures for each Qb (/72) N measures for each Qc (/54)
20 14
21 12
11 7
19 14
97
highest proportion (34%) of quartiles demonstrating a significantly different mean exam
score. Although as previously discussed, the number of days active is an attempt to
distinguish between the students who engage with PeerWise for a lesser number of days and
the students who engage on a more consistent basis, in isolation, the metric may also be
confounded with other measures of activity – it is not clear whether or not students who
space their activity produce more or less output on PeerWise than those who “binge”. Of
course, the number of days of activity is an important metric in its own right, as an indication
of the time spent on task. Setting assessment tasks where students spend more time engaged
in the activities is considered a feature of good assessment practice [21,184], and it is clearly
a positive result if students seem to be engaged and motivated to participate in learning
activities – particularly if they are engaging to a level that is over and above the minimum
requirements [122].
Of the other metrics, it is the length of comments written that demonstrates the
greatest proportion of significant differences between final exam score when aggregating the
quartiles together. This reflects the results of the original analysis [122] Looking at each
quartile and activity individually, writing questions seems to benefit those in Q4 (higher
ability) most frequently, answering questions those in Q1 (lower ability), with commenting
benefiting Q1, Q2 and Q4 to similar levels. This is not a particularly surprising result –
writing questions is cognitively very demanding – students who are stronger may find they
are working in their ZPD to create questions, whereas weaker students may find this task
extremely difficult. Stronger students may embrace the challenge and be more able to create
more complex questions, which requires synthesizing ideas and concepts in their own mind
before creating a question that tests their ideas. Answering questions may benefit weaker
students more as an opportunity to test their knowledge, and the repetition of questions on
similar topics may aid retention of concepts [122]. Students from all ability levels may
benefit from commenting, as commenting requires reflection upon the question quality.
Stronger students may benefit from expanding or improving questions whilst lower ability
students may benefit from reflecting upon their own performance and thinking about what
may improve the question under consideration and therefore also their own work. In this
analysis the length of comments given has been examined; an examination of the benefits of
both giving and receiving comments will be addressed as part of the regression analysis in
Chapter 6.
Across Q1, Q2 and Q4, for 30–40% of comparisons the end of course exam score for
HPA was significantly different from those of LPA students. HPA and LPA students of
intermediate to high ability in Q3 differed significantly in exam score in only 17% of the
98
possible instances. Indeed, with regards to the provision of comments, HPA students in Q3
were the only group not to outperform their LPA counterparts in their mean exam score. This
reflects the results of previous work that adopted the same method of analysis [117].
Although this comparison across quartiles is not statistical, it would seem to indicate that
students who are relatively high performers but not in the top quartile might not benefit from
PeerWise to the degree that other students may benefit – perhaps they are of too high an
ability level to benefit from the drill and practice of answering questions but they are not yet
able to engage at the highest level. Perhaps feeling that their performance level is good
enough, they may lack the motivation or to push themselves, in comparison to the top
students in Q4, who may not only be highest performing, but who may also be some of the
hardest working or most motivated. If the number of days active is removed from this
analysis to guard against its potential to be confounded with the levels of activity, the results
are similar, but it seems to be students in Q1 and in Q4 who have the highest proportion of
significantly different exam scores.
Consideration must be given to the design of the research and its consequential
limitations. The current work is not a randomised, controlled experiment and therefore it is
impossible to establish a causal link between PeerWise engagement and exam performance.
It is most appropriate to consider whether PeerWise engagement could be considered one of
many factors which may contribute to differences in final exam performance. That said, it is
interesting to note that when comparing the results presented here to two prior studies that
have used the same methodology, similar effects of PeerWise engagement are demonstrated
[117,131].
Similar to the findings here, in both of these prior studies, where there is a difference
in exam score, HPA students tend to perform better than LPA students. In the original Denny
et al study [122], when looking at engagement across PeerWise as a whole using the CM,
these effects are seen across all ability quartiles. With regards to the individual activities,
students from Quartiles 1 and 4, seem to benefit most – in line with the current work.
Although McQueen et al. [117] use the PeerWise scoreboard score as the measure of
engagement, in Quartiles 2 and 4 HPA students outperform LPA students. This seems to
suggest that PeerWise consistently benefits higher ability students, and those of lower to
lower-intermediate ability. That PeerWise so consistently seems to benefit higher ability
students is an extremely positive finding. Stronger students need extension as much as
weaker students need support. In time and resource-strapped settings there is perhaps a
danger of targeting additional support at weaker students to ensure they do not get left
behind. Whilst this is of course a key goal, the provision of a resource such as PeerWise,
99
which students can engage with at their own pace, and which is self-differentiating, enables
all ability levels to be catered for – including those who need to be stretched – with minimal
instructor intervention and minimal investment of time or financial resources. Through
collaborative learning, weaker students may benefit from the input of stronger students, and
stronger students may benefit from assisting weaker students. This is especially true in large
classes with diverse ranges of incoming knowledge and ability as seen in Scottish first year
courses such as Physics 1A; 1B and Chemistry 1B, and courses which are open to students
from a wide range of disciplines such GGA.
4.2.3 Limitations of the analysis
The analysis of the differences in end of course exam scores between students with
high and low levels of PeerWise activity from low, medium-low, medium-high and high
academic ability groups has been one of the key methods of analysing PeerWise metrics in
the literature to date, and as discussed above, can provide some insight into the complicated
relationships between engaging with PeerWise and exam score for students with varying
levels of ability. Although such an analysis has been undertaken on several occasions, this
approach has several limitations.
Splitting students into attainment quartiles makes an attempt to examine or account
for the effects of prior attainment, however this split is somewhat arbitrary [185]. The
question of where the split occurs will affect the make-up of the groupings and thus the
within and between group variations [185]. Although having a larger number of groupings
allows students’ differences to be modelled at a higher level of granularity than say a
division at the median, it is sub-optimal to categorise a continuous variable, “deliberately
discarding” [185] precious data. Grouping observations together results in a loss of
information about the individual differences between them [186]; there can also be a loss of
statistical power, usually resulting in an erroneous failure to reject the null hypothesis [186].
Type I errors – rejecting the null hypothesis incorrectly – have also been shown to
increase where there is dichotomization of the data [187]. In the quartile analysis, three such
categorisations are made: students’ prior attainment is split into quartiles; within the
quartiles, activity levels are split at the median to create high and low activity level
groupings; and with the creation of the Combined Measure of Activity, where each activity
metric is split into deciles, the decile values are summed. Each split in turn has its own
drawbacks. Firstly class sizes in the current study are of a reasonable size when analysed as a
whole but when split into attainment quartiles and then into high and low engagement, the
sample sizes become smaller. When a class of 200 students is divided into quartiles, each
100
quartile has 50 students. When each quartile is split at the median into high and low activity,
each group will then only comprise 25 students – a relatively small sample size.
Additionally, when splitting students at the median into high and low PeerWise
engagement, there are many tied ranks, especially for the number of questions authored and
the number of days active. This is due to the often narrow distribution of activity levels,
where most students author the minimum number of questions, and where there is a limited
range of days that the students are active on the system. This problem also arises, and in fact
is compounded, when creating the combined measure of activity, as tied ranks need to be
divided into ten groups rather than into two. The limitations of group size and ties at the
mean are highlighted to a greater degree in the current work when compared to previous
studies due to the smaller class sizes (90 to 269 students in the current work, compared with
460 students in the original analysis [122]).
By using techniques of regression, both the pre and post scores for each student are
analysed, thus minimising variability and exploiting more fully the continuous nature of the
PeerWise data. The analysis undertaken in the following three chapters aims to build upon
the findings presented, to explore more robustly the relationships between engaging with
PeerWise and attainment, when controlling for a student’s ability levels and relevant
demographic factors.
Chapter 5 outlines how to interpret the results from the regression analyses and
examines the relationship between the number of questions authored and exam score
(Section 5.2), and the number of questions answered and exam score (Section 5.3). The
number of comments given and received are discussed in Chapter 6, and an overall measure
of activity is created and explored in Chapter 7 – together with an overview of the results
from all the regression models.
101
Chapter 5
Associations between question authoring, answering
and student performance
The aim of this chapter is to investigate whether engaging with writing or answering
questions has a relationship with exam score; whether any such relationship remains when
accounting for variables such as prior ability; and whether the relationship remains the same
for students at different ability levels and across different courses. The analyses in this
chapter aim to develop the preceding work by using the continuous nature of the PeerWise
data to its full potential.
Section 5.1 discusses the structure of the regression analyses, including information
on how each model was constructed, together with methodological justifications – providing
elaboration on the statistical tests outlined in Chapter 3. The analyses of each of the
PeerWise metrics contained in Chapters 5–7 follow the same structure. Section 5.2 provides
an outline of how to interpret the analyses, and their presentation, which is common to each
of these chapters. The relationship between the number of questions authored and exam
score is discussed in Section 5.3; and the relationship between the number of questions
answered and exam score in Section 5.4.
5.1 Structure of regression analyses
The structure of the analyses in Chapters 5, 6 and 7 is broadly consistent across each
of the PeerWise activity measures. For each measure, simple linear regressions were
undertaken in each course to determine whether there was an association between end of
course exam results and engaging with PeerWise. Other variables were then introduced to
the model to determine whether the relationships remain after controlling for key factors
known to have an influence on exam performance, namely: prior ability; having attended a
Scottish school; majoring in the subject area; and gender. Regression results of both the
simple and multiple regression analyses are presented in the main body of this thesis only
where there is a significant association between the PeerWise metric and exam score. If such
102
a relationship exists, the best multiple regression model is presented – defined as the model
which explains the most variance in exam-score. Full model development, including models
where PeerWise activity is not associated with exam score, is detailed in Appendices D to H.
Step 1 of the procedures detailed in Appendices D to H is the simple regression
model, similar in interpretation to a straightforward correlation analysis. β is equivalent to
the correlation coefficient r – which is a measure of the strength of relationship between
variable X (PeerWise activity) and variable Y (exam score). This is in essence an effect size
of the relationship. In the multiple regression models (Step 2 onwards in the detailed
procedure), β can be considered as a measure of the effect of a particular variable in the
model. The adjusted R2 in the simple regression model is identical to R2 – the proportion of
variance in Y which is explained by X. In the multiple regression models adjusted R2 is the
proportion of the variance in Y explained by the combination of X variables, adjusted to
account for the addition of more than one explanatory variable. The semi-partial, or part
correlation (sr), is a measure of the unique correlation between each independent variable
and exam score. When this is squared, it provides a measure of the variance in the dependent
variable uniquely explained by each particular independent variable – an additional measure
of the relative importance of each of the variables in the model.
As prior attainment is known to be a key factor in future academic performance, and
in all cases is strongly correlated with exam score, further analysis was carried out to
determine whether the effect of engaging with PeerWise is constant across all levels of prior
ability, or whether prior attainment has a moderating effect on the relationship between
PeerWise activity and exam score. The moderation analysis has only been carried out on
courses where there is a significant relationship between activity and exam score in the
multiple regression models, and has only been reported for the courses in which an
interaction effect between prior ability and PeerWise activity is demonstrated.
5.1.1 Model construction
Variables were added to the regression model in the following order: PeerWise
metric, pre-score, Scottish, major, male. A hierarchical process was followed with each
variable being entered into SPSS in a separate block, to assess whether a significant
contribution was being made with the addition of each new variable. If a variable
significantly improved the model, it was retained, and the next variable added. If it did not
contribute significantly, it was removed and the next variable entered.
Scottish, major and male are dichotomous variables coded 1 for coming from a
Scottish school, majoring in the particular discipline and being male. Not coming from a
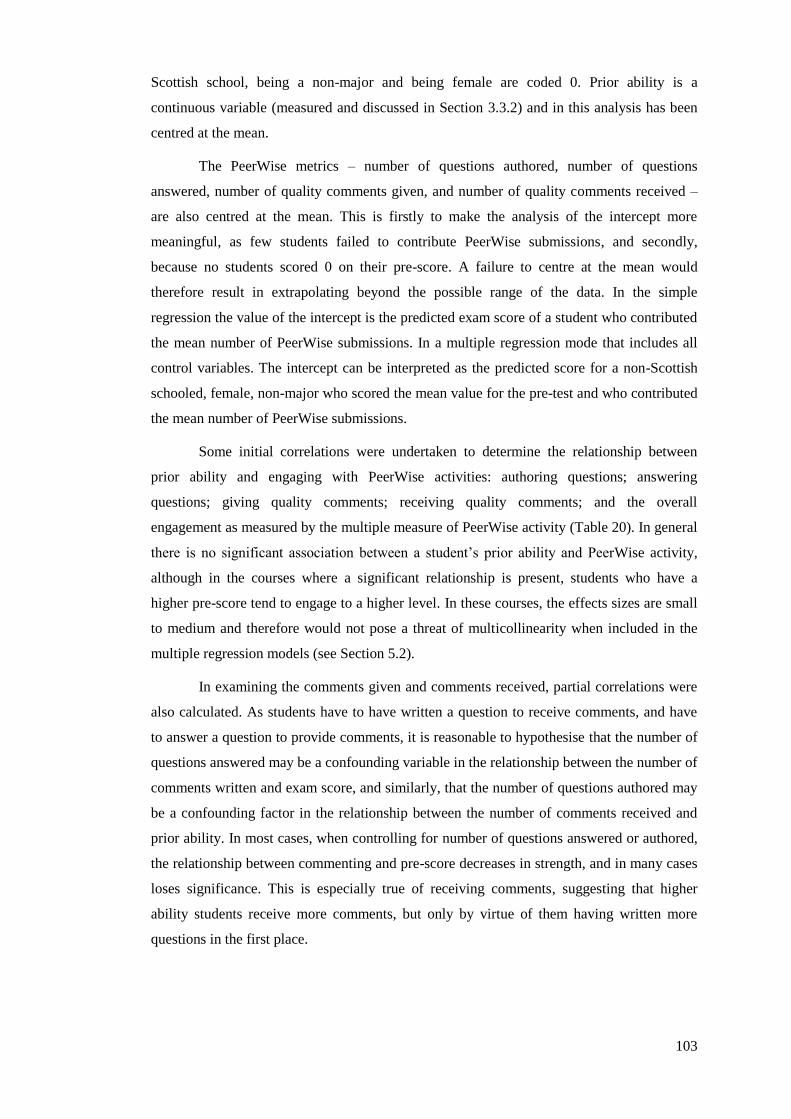
103
Scottish school, being a non-major and being female are coded 0. Prior ability is a
continuous variable (measured and discussed in Section 3.3.2) and in this analysis has been
centred at the mean.
The PeerWise metrics – number of questions authored, number of questions
answered, number of quality comments given, and number of quality comments received –
are also centred at the mean. This is firstly to make the analysis of the intercept more
meaningful, as few students failed to contribute PeerWise submissions, and secondly,
because no students scored 0 on their pre-score. A failure to centre at the mean would
therefore result in extrapolating beyond the possible range of the data. In the simple
regression the value of the intercept is the predicted exam score of a student who contributed
the mean number of PeerWise submissions. In a multiple regression mode that includes all
control variables. The intercept can be interpreted as the predicted score for a non-Scottish
schooled, female, non-major who scored the mean value for the pre-test and who contributed
the mean number of PeerWise submissions.
Some initial correlations were undertaken to determine the relationship between
prior ability and engaging with PeerWise activities: authoring questions; answering
questions; giving quality comments; receiving quality comments; and the overall
engagement as measured by the multiple measure of PeerWise activity (Table 20). In general
there is no significant association between a student’s prior ability and PeerWise activity,
although in the courses where a significant relationship is present, students who have a
higher pre-score tend to engage to a higher level. In these courses, the effects sizes are small
to medium and therefore would not pose a threat of multicollinearity when included in the
multiple regression models (see Section 5.2).
In examining the comments given and comments received, partial correlations were
also calculated. As students have to have written a question to receive comments, and have
to answer a question to provide comments, it is reasonable to hypothesise that the number of
questions answered may be a confounding variable in the relationship between the number of
comments written and exam score, and similarly, that the number of questions authored may
be a confounding factor in the relationship between the number of comments received and
prior ability. In most cases, when controlling for number of questions answered or authored,
the relationship between commenting and pre-score decreases in strength, and in many cases
loses significance. This is especially true of receiving comments, suggesting that higher
ability students receive more comments, but only by virtue of them having written more
questions in the first place.
104
Table 20: Correlation between pre-score and PeerWise engagement levels
Course Number
of Q. Auth.
Number of Q. Ans.
Number of Comm.
Out/controlling for Q Ans.
Number of Comm.
In/controlling for Q Auth.
Multiple Measure
of Activity
Phys. 1A 2011–12 .001 –.056 .095/.164* .024/.040 .019
Phys. 1A 2012–13 .109 .165** .282**/.232*** .014/–.047 .179**
Phys. 1A 2013–14 –.016 –.005 .051/.067 –.038/–.039 –.002
Phys.1B 2011–12 .242* .235* .305*/.205 .249*/.172 .325**
Phys. 1B 2012–13 –.020 .120 .133/.074 .026/.050 .112
Phys. 1B 2013–14 .194* .020 .118/.132 .200*/.090 .165
GGA 2011–12 .151* .166* .186**/.109 .200**/.029 .219**
GGA 2012–13 .111 .117 .204**/.168* .210**/.274*** .187**
GGA 2013–14 .098 .101 .033/–.021 .216**/.003 .157*
Chem. 1B 2011–12 .213** .228** .256**/.182* .279**/.185* .322**
Chem. 1B 2012–13 .391** .266** .273**/.153 .403**/.175* .410**
Chem. 1B 2013–14 .222** .139 .152/.105 .137/.007 .208**
Glas. Phys. 2011–12 .251** .177* .130/.005 .183*/–.068 .210*
Glas. Phys. 2012–13 .148 .168* .232**/.169* .070/–.007 .194*
Glas. Phys. 2013–14 .145 .217* .286**/.209* .148/.063 .257**
Nott. Chem. 2011–12 .231** .202** .233**/.143 .268**/.140 .277**
Nott. Chem. 2012–13 –.002 .140 .145/.063 .069/.188* .101
Nott. Chem. 2013–14 .199* .115 .153/.110 .213**/.107 .223**
* p<0.05 ** p<0.01 *** p<0.001
5.1.2 Assumption checking
In determining the correlation between each of the predictors and exam score,
scatterplots were checked to ascertain that each predictor had a linear relationship with exam
score. This was determined to be the case and the assumption of a linear relationship
between exam score and the combination of predictors in each model also held true on
examination of the plot of predicted versus actual standardised residuals. There was no
substantial evidence of any pattern of distribution of the residuals. Homoscedasity – where
the variance of the errors in the model are the same at all levels of the independent variables
– was confirmed by further examination of the scatterplot of predicted versus actual
standardized residuals – there was no substantial evidence of fanning of the residuals, which
appeared randomly and equally distributed on either side of the mean of zero. Figure 15 is
the scatterplot of the regression of exam score on the multiple measure and prior ability for
Nottingham Chemistry 2013-14
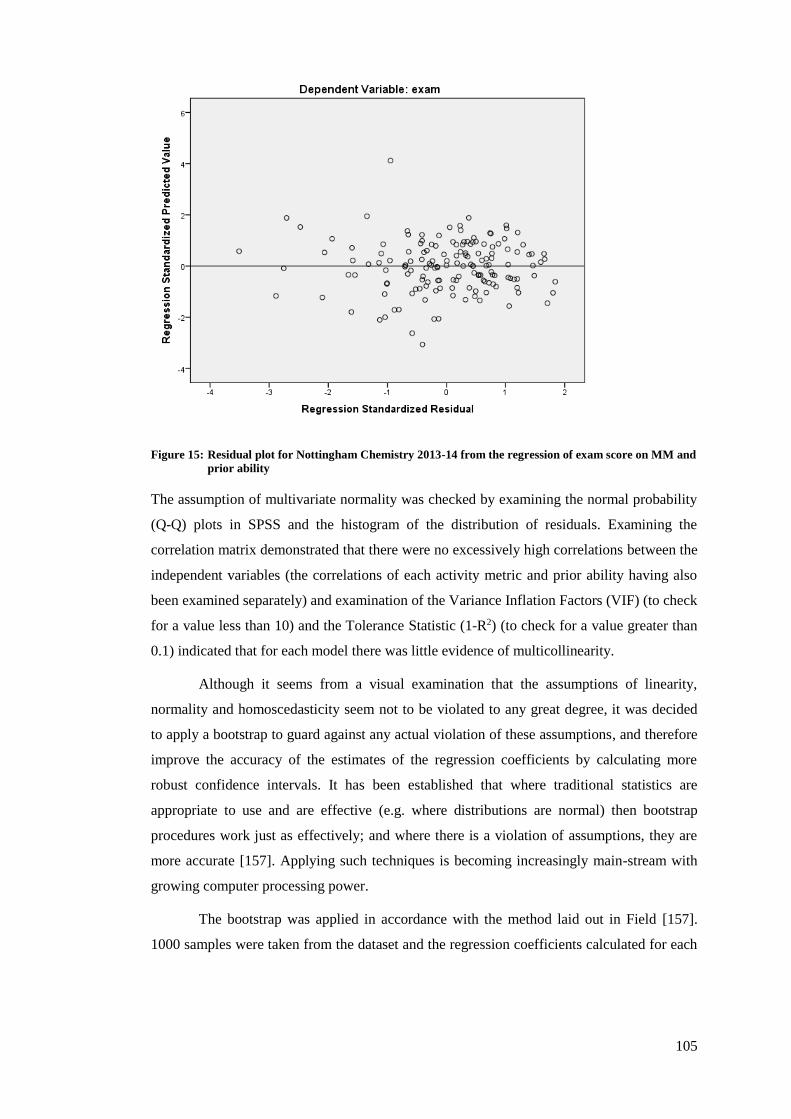
105
Figure 15: Residual plot for Nottingham Chemistry 2013-14 from the regression of exam score on MM and
prior ability
The assumption of multivariate normality was checked by examining the normal probability
(Q-Q) plots in SPSS and the histogram of the distribution of residuals. Examining the
correlation matrix demonstrated that there were no excessively high correlations between the
independent variables (the correlations of each activity metric and prior ability having also
been examined separately) and examination of the Variance Inflation Factors (VIF) (to check
for a value less than 10) and the Tolerance Statistic (1-R2) (to check for a value greater than
0.1) indicated that for each model there was little evidence of multicollinearity.
Although it seems from a visual examination that the assumptions of linearity,
normality and homoscedasticity seem not to be violated to any great degree, it was decided
to apply a bootstrap to guard against any actual violation of these assumptions, and therefore
improve the accuracy of the estimates of the regression coefficients by calculating more
robust confidence intervals. It has been established that where traditional statistics are
appropriate to use and are effective (e.g. where distributions are normal) then bootstrap
procedures work just as effectively; and where there is a violation of assumptions, they are
more accurate [157]. Applying such techniques is becoming increasingly main-stream with
growing computer processing power.
The bootstrap was applied in accordance with the method laid out in Field [157].
1000 samples were taken from the dataset and the regression coefficients calculated for each
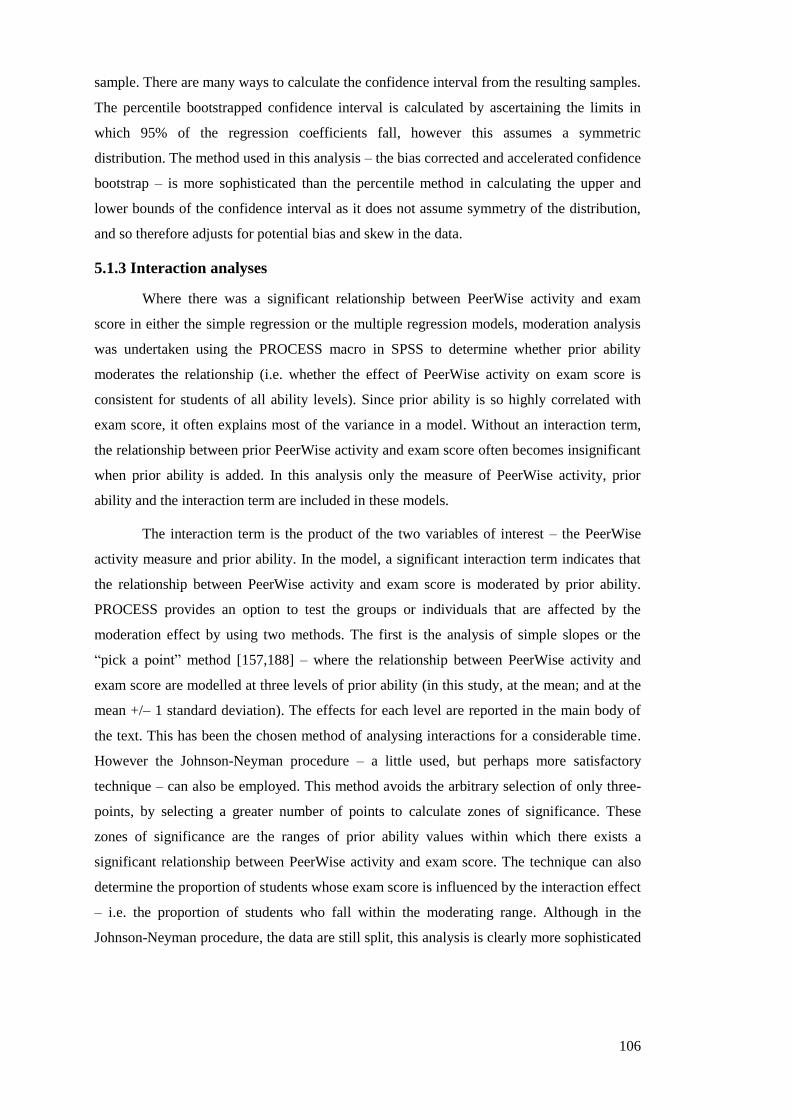
106
sample. There are many ways to calculate the confidence interval from the resulting samples.
The percentile bootstrapped confidence interval is calculated by ascertaining the limits in
which 95% of the regression coefficients fall, however this assumes a symmetric
distribution. The method used in this analysis – the bias corrected and accelerated confidence
bootstrap – is more sophisticated than the percentile method in calculating the upper and
lower bounds of the confidence interval as it does not assume symmetry of the distribution,
and so therefore adjusts for potential bias and skew in the data.
5.1.3 Interaction analyses
Where there was a significant relationship between PeerWise activity and exam
score in either the simple regression or the multiple regression models, moderation analysis
was undertaken using the PROCESS macro in SPSS to determine whether prior ability
moderates the relationship (i.e. whether the effect of PeerWise activity on exam score is
consistent for students of all ability levels). Since prior ability is so highly correlated with
exam score, it often explains most of the variance in a model. Without an interaction term,
the relationship between prior PeerWise activity and exam score often becomes insignificant
when prior ability is added. In this analysis only the measure of PeerWise activity, prior
ability and the interaction term are included in these models.
The interaction term is the product of the two variables of interest – the PeerWise
activity measure and prior ability. In the model, a significant interaction term indicates that
the relationship between PeerWise activity and exam score is moderated by prior ability.
PROCESS provides an option to test the groups or individuals that are affected by the
moderation effect by using two methods. The first is the analysis of simple slopes or the
“pick a point” method [157,188] – where the relationship between PeerWise activity and
exam score are modelled at three levels of prior ability (in this study, at the mean; and at the
mean +/– 1 standard deviation). The effects for each level are reported in the main body of
the text. This has been the chosen method of analysing interactions for a considerable time.
However the Johnson-Neyman procedure – a little used, but perhaps more satisfactory
technique – can also be employed. This method avoids the arbitrary selection of only three-
points, by selecting a greater number of points to calculate zones of significance. These
zones of significance are the ranges of prior ability values within which there exists a
significant relationship between PeerWise activity and exam score. The technique can also
determine the proportion of students whose exam score is influenced by the interaction effect
– i.e. the proportion of students who fall within the moderating range. Although in the
Johnson-Neyman procedure, the data are still split, this analysis is clearly more sophisticated
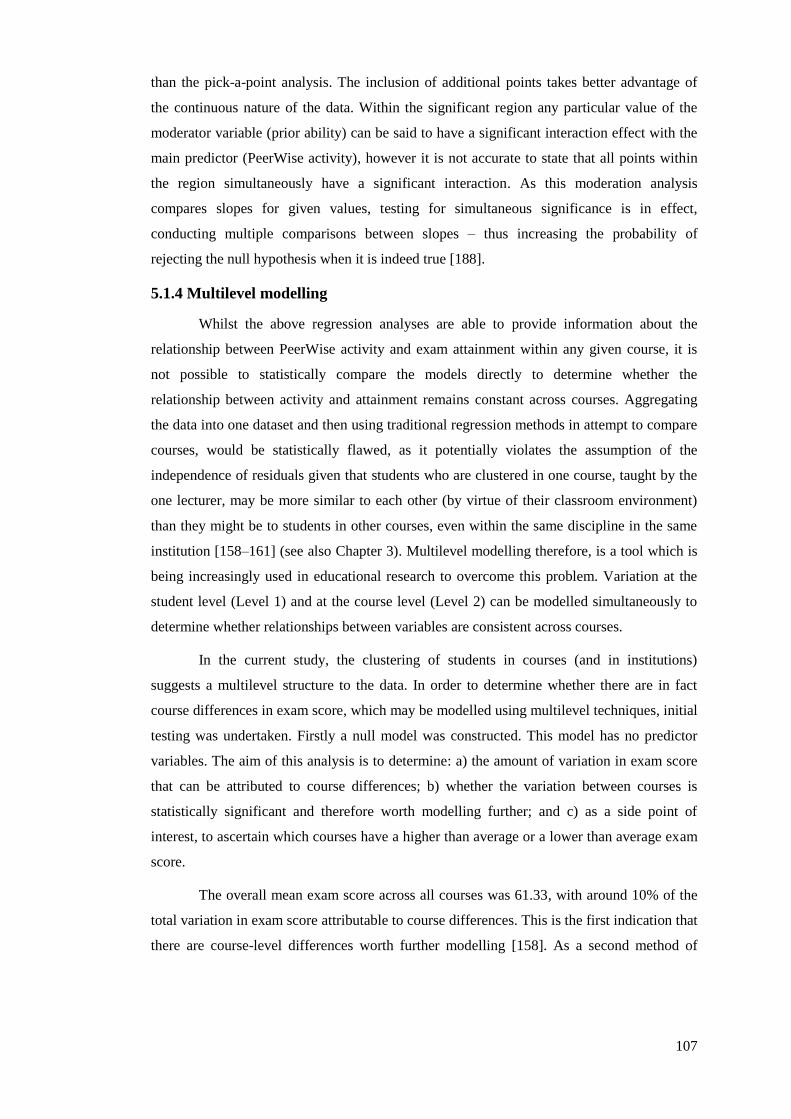
107
than the pick-a-point analysis. The inclusion of additional points takes better advantage of
the continuous nature of the data. Within the significant region any particular value of the
moderator variable (prior ability) can be said to have a significant interaction effect with the
main predictor (PeerWise activity), however it is not accurate to state that all points within
the region simultaneously have a significant interaction. As this moderation analysis
compares slopes for given values, testing for simultaneous significance is in effect,
conducting multiple comparisons between slopes – thus increasing the probability of
rejecting the null hypothesis when it is indeed true [188].
5.1.4 Multilevel modelling
Whilst the above regression analyses are able to provide information about the
relationship between PeerWise activity and exam attainment within any given course, it is
not possible to statistically compare the models directly to determine whether the
relationship between activity and attainment remains constant across courses. Aggregating
the data into one dataset and then using traditional regression methods in attempt to compare
courses, would be statistically flawed, as it potentially violates the assumption of the
independence of residuals given that students who are clustered in one course, taught by the
one lecturer, may be more similar to each other (by virtue of their classroom environment)
than they might be to students in other courses, even within the same discipline in the same
institution [158–161] (see also Chapter 3). Multilevel modelling therefore, is a tool which is
being increasingly used in educational research to overcome this problem. Variation at the
student level (Level 1) and at the course level (Level 2) can be modelled simultaneously to
determine whether relationships between variables are consistent across courses.
In the current study, the clustering of students in courses (and in institutions)
suggests a multilevel structure to the data. In order to determine whether there are in fact
course differences in exam score, which may be modelled using multilevel techniques, initial
testing was undertaken. Firstly a null model was constructed. This model has no predictor
variables. The aim of this analysis is to determine: a) the amount of variation in exam score
that can be attributed to course differences; b) whether the variation between courses is
statistically significant and therefore worth modelling further; and c) as a side point of
interest, to ascertain which courses have a higher than average or a lower than average exam
score.
The overall mean exam score across all courses was 61.33, with around 10% of the
total variation in exam score attributable to course differences. This is the first indication that
there are course-level differences worth further modelling [158]. As a second method of
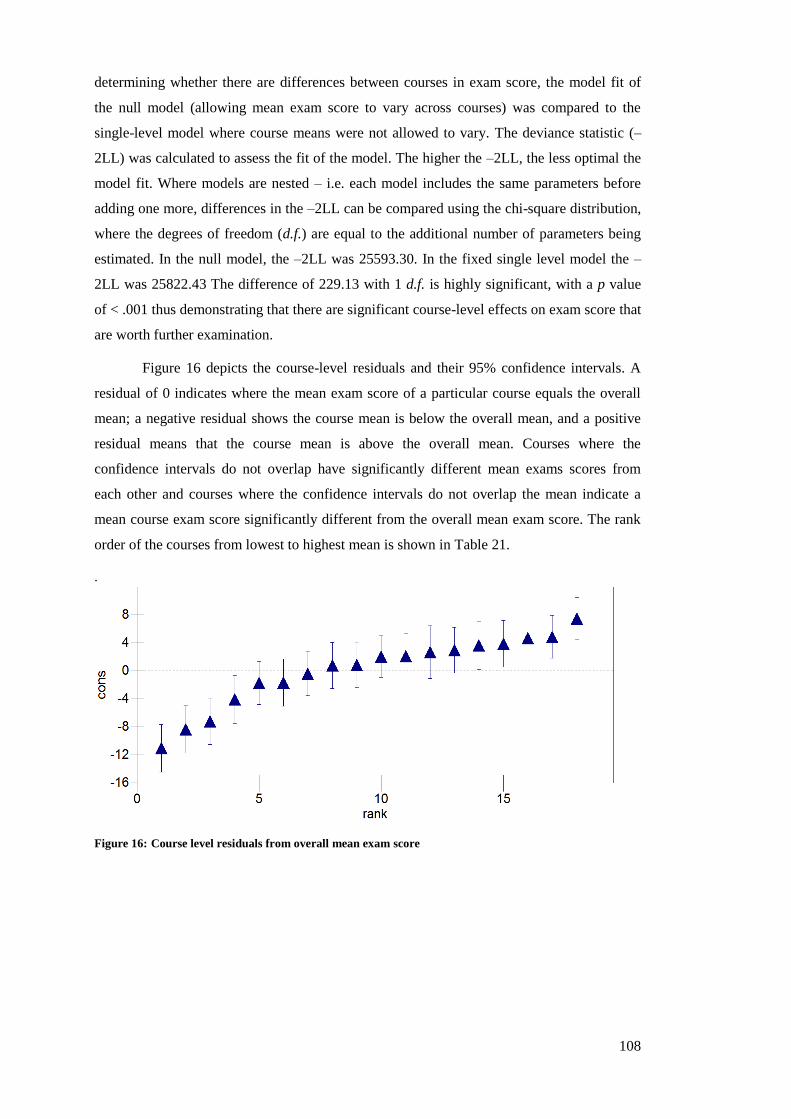
108
determining whether there are differences between courses in exam score, the model fit of
the null model (allowing mean exam score to vary across courses) was compared to the
single-level model where course means were not allowed to vary. The deviance statistic (–
2LL) was calculated to assess the fit of the model. The higher the –2LL, the less optimal the
model fit. Where models are nested – i.e. each model includes the same parameters before
adding one more, differences in the –2LL can be compared using the chi-square distribution,
where the degrees of freedom (d.f.) are equal to the additional number of parameters being
estimated. In the null model, the –2LL was 25593.30. In the fixed single level model the –
2LL was 25822.43 The difference of 229.13 with 1 d.f. is highly significant, with a p value
of < .001 thus demonstrating that there are significant course-level effects on exam score that
are worth further examination.
Figure 16 depicts the course-level residuals and their 95% confidence intervals. A
residual of 0 indicates where the mean exam score of a particular course equals the overall
mean; a negative residual shows the course mean is below the overall mean, and a positive
residual means that the course mean is above the overall mean. Courses where the
confidence intervals do not overlap have significantly different mean exams scores from
each other and courses where the confidence intervals do not overlap the mean indicate a
mean course exam score significantly different from the overall mean exam score. The rank
order of the courses from lowest to highest mean is shown in Table 21.
.
Figure 16: Course level residuals from overall mean exam score
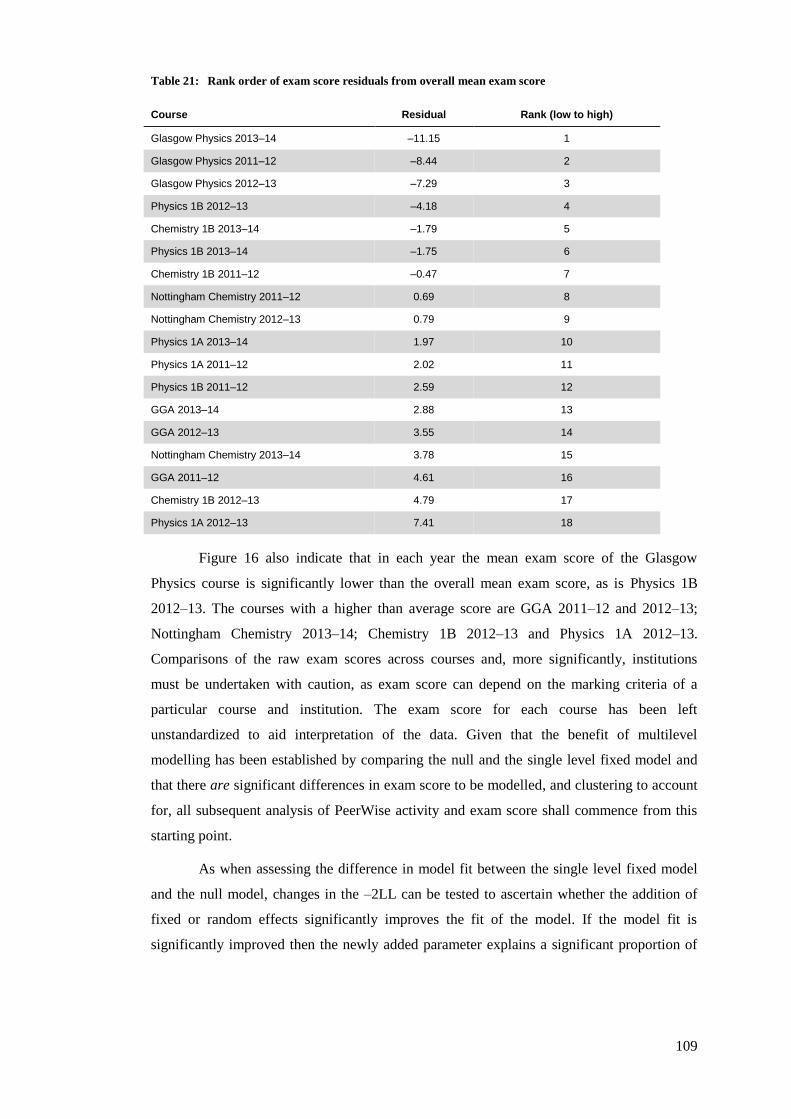
109
Table 21: Rank order of exam score residuals from overall mean exam score
Course Residual Rank (low to high)
Glasgow Physics 2013–14 –11.15 1
Glasgow Physics 2011–12 –8.44 2
Glasgow Physics 2012–13 –7.29 3
Physics 1B 2012–13 –4.18 4
Chemistry 1B 2013–14 –1.79 5
Physics 1B 2013–14 –1.75 6
Chemistry 1B 2011–12 –0.47 7
Nottingham Chemistry 2011–12 0.69 8
Nottingham Chemistry 2012–13 0.79 9
Physics 1A 2013–14 1.97 10
Physics 1A 2011–12 2.02 11
Physics 1B 2011–12 2.59 12
GGA 2013–14 2.88 13
GGA 2012–13 3.55 14
Nottingham Chemistry 2013–14 3.78 15
GGA 2011–12 4.61 16
Chemistry 1B 2012–13 4.79 17
Physics 1A 2012–13 7.41 18
Figure 16 also indicate that in each year the mean exam score of the Glasgow
Physics course is significantly lower than the overall mean exam score, as is Physics 1B
2012–13. The courses with a higher than average score are GGA 2011–12 and 2012–13;
Nottingham Chemistry 2013–14; Chemistry 1B 2012–13 and Physics 1A 2012–13.
Comparisons of the raw exam scores across courses and, more significantly, institutions
must be undertaken with caution, as exam score can depend on the marking criteria of a
particular course and institution. The exam score for each course has been left
unstandardized to aid interpretation of the data. Given that the benefit of multilevel
modelling has been established by comparing the null and the single level fixed model and
that there are significant differences in exam score to be modelled, and clustering to account
for, all subsequent analysis of PeerWise activity and exam score shall commence from this
starting point.
As when assessing the difference in model fit between the single level fixed model
and the null model, changes in the –2LL can be tested to ascertain whether the addition of
fixed or random effects significantly improves the fit of the model. If the model fit is
significantly improved then the newly added parameter explains a significant proportion of
110
the variance and should therefore be left in the model. It has been suggested that individual
random effects may be tested in a similar manner to the fixed effects using Wald’s z test –
where the coefficient is divided by the standard error. [161]. Although this may indicate
whether the covariance significantly differs from zero, or whether the slope or intercept
variance between schools is greater than zero, it has been highlighted that such analysis may
result in over- inflated estimates and under-estimated standard errors, as variances do not
follow a normal distribution, as they are bounded by zero [157,160]. The –2LL is often taken
as be the most accurate determinant of model fit, and thus it is suggested that, just as with
effect sizes, the magnitude of the variance coefficients are considered, rather than their
significance [158]. This approach is adopted in the current work where the primary purpose
of using multilevel modelling is to account for the nested structure of the data and to focus
on the fixed effects in the model – the relationship between PeerWise activity and exam
score [189]. Preliminary analysis of the random effects may be a starting point for future
analyses which may incorporate course-level variables to explain any emerging differences
between courses, in the relationship between PeerWise activity and attainment.
Although using multilevel models is preferable to simply aggregating course data
without regard for the hierarchical, grouped data-structure, the small sample size at level–2
must be taken into account as a potential limitation. Whilst it has been suggested that at a
minimum, there must be at least 10 level 2 units to conduct the analysis, a value of 20 is
thought to be appropriate, and 30 has been cited as the smallest number to ensure that
standard error and estimate display as little bias as possible [190]. Having a smaller number
at level 2 may make estimates of standard errors smaller than they really are – therefore
caution should be exercised in interpreting the random coefficients, however the fixed part of
the model will be unaffected [190]. Given the relatively small sample size of courses in this
study, it is worth firstly interpreting the random intercept models, then use any significant
effects in the random slope models as indicative of relationships worthy of future study.
The assumptions for multilevel modelling are broadly similar to those of linear
regression but are adapted to account for the nested nature of the data. Normality and
independence of the residuals – that the residuals within and across each level are
uncorrelated – are to be considered in multilevel analysis. As with single level linear
regression models, these assumptions were tested in the current work by producing normality
plots (standardized residuals against the normal score) and scatter plots (standardized
residuals against the predicted values of the explanatory variables) at each level of the
analysis. This was undertaken for the best model within each analysis. The normal plots
show some deviation from the 45 line, especially at the extreme values, and the scatterplots
111
also show some indication of a lack of consistency across the different values for each
explanatory variable at both levels, however deletion of the most extreme cases at the
student-level did not materially change the results of the analysis. All students were therefore
included in the final analysis. Given the already small number of level 2 observations, it was
decided not to exclude any of the more extreme courses. The results of the random effects
should therefore be interpreted with a degree of caution.
As the PeerWise requirements vary between courses, the PeerWise activity metrics
within each course were standardized before their inclusion in the analysis. Pre-scores have
also been standardized within each course before their addition to the analysis. Since prior
ability measures are not necessarily consistent across courses (see discussion in Chapter 3)
there is no way to determine whether a student that scores 60% in one course has the same
ability as a student scoring 60% on a different course. The standardized variables are
therefore centred at the group mean and have a standard deviation of 1. As the mean for each
of the courses is zero, they are therefore also centred at the grand mean – the overall mean of
all the courses when aggregated. To assist meaningful interpretation of the results, the final
exam scores for each course remain unstandardized.
5.2 Model interpretation
For each activity, key results from the analysis have been presented in a single table
in the main body of the text. Only the regression parameters for the particular activity
measure in focus have been included in the table to allow comparison across courses and
years. The default best model – unless otherwise stated – is that with the activity measure
and pre–score included. Where additional variables make up the best model, the variable
names are indicated in a footnote to each table. The effect of these variables on exam score
are not the primary focus of this thesis but are included in an attempt to control statistically
for their effects when present.
Each table is constructed in three parts – information about the simple regression
models; information about the multiple regression models; and information about the
presence of an interaction term. Where, for a particular analysis, there is no association
between activity and exam score for a particular analysis, relevant cells have been left blank.
As discussed above, the multiple regression model outlined is the best model – the model
with the most predictive power. It should be noted that whilst some parameters and statistics
may be compared across years and courses, the b values are not standardized and therefore
should only be interpreted in the context of a particular year and course. The standardized
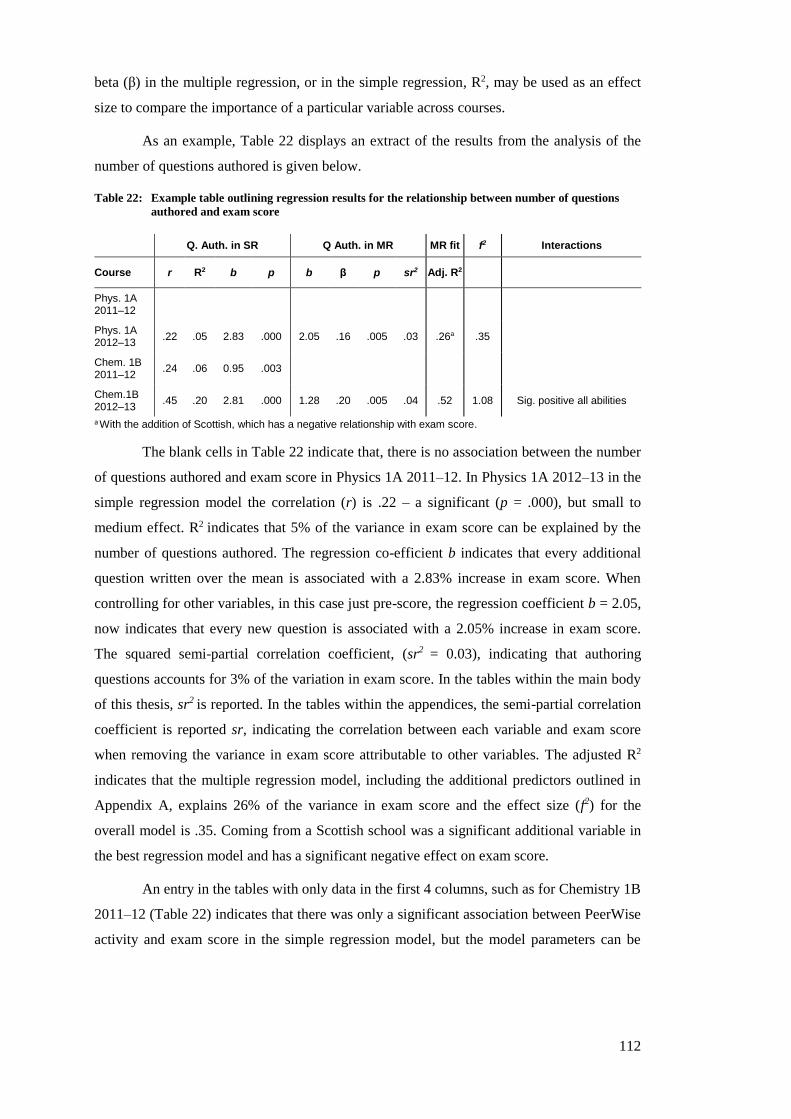
112
beta (β) in the multiple regression, or in the simple regression, R2, may be used as an effect
size to compare the importance of a particular variable across courses.
As an example, Table 22 displays an extract of the results from the analysis of the
number of questions authored is given below.
Table 22: Example table outlining regression results for the relationship between number of questions
authored and exam score
Q. Auth. in SR Q Auth. in MR MR fit f2 Interactions
Course r R2 b p b β p sr2 Adj. R2
Phys. 1A 2011–12
Phys. 1A 2012–13
.22 .05 2.83 .000 2.05 .16 .005 .03 .26a .35
Chem. 1B 2011–12
.24 .06 0.95 .003
Chem.1B 2012–13
.45 .20 2.81 .000 1.28 .20 .005 .04 .52 1.08 Sig. positive all abilities
a With the addition of Scottish, which has a negative relationship with exam score.
The blank cells in Table 22 indicate that, there is no association between the number
of questions authored and exam score in Physics 1A 2011–12. In Physics 1A 2012–13 in the
simple regression model the correlation (r) is .22 – a significant (p = .000), but small to
medium effect. R2 indicates that 5% of the variance in exam score can be explained by the
number of questions authored. The regression co-efficient b indicates that every additional
question written over the mean is associated with a 2.83% increase in exam score. When
controlling for other variables, in this case just pre-score, the regression coefficient b = 2.05,
now indicates that every new question is associated with a 2.05% increase in exam score.
The squared semi-partial correlation coefficient, (sr2 = 0.03), indicating that authoring
questions accounts for 3% of the variation in exam score. In the tables within the main body
of this thesis, sr2 is reported. In the tables within the appendices, the semi-partial correlation
coefficient is reported sr, indicating the correlation between each variable and exam score
when removing the variance in exam score attributable to other variables. The adjusted R2
indicates that the multiple regression model, including the additional predictors outlined in
Appendix A, explains 26% of the variance in exam score and the effect size (f2) for the
overall model is .35. Coming from a Scottish school was a significant additional variable in
the best regression model and has a significant negative effect on exam score.
An entry in the tables with only data in the first 4 columns, such as for Chemistry 1B
2011–12 (Table 22) indicates that there was only a significant association between PeerWise
activity and exam score in the simple regression model, but the model parameters can be
113
interpreted in a similar way as for Physics 1A. In Chemistry 1B 2012–13 and Physics 1A
2012–13, authoring questions is a significant predictor of exam score in both the simple and
multiple regression models. Coming from a Scottish school is not a significant addition to
the regression model in Chemistry 1B 2012–13, but it is in Physics 1A 2012–13. There is a
positive interaction effect present in Chemistry 1B 2012–13 across all ability levels (i.e. the
relationship between question authoring and exam score differs depending on ability level).
For GGA, two additional regression analyses have been included for each course.
GGA is the only course to have a multiple choice component of the final exam, therefore
analyses were carried out to determine whether the effects of PeerWise activity were
stronger for the specific multiple choice aspect of the exam. For each year and each activity,
the simple regression model illustrating the effect of PeerWise on the multiple choice
component is presented, followed by a multiple regression model controlling for the effects
of prior ability. In this analysis the effects of being Scottish, male or a subject major have not
been included. The tables are interpreted in the same way as outlined above.
Multilevel models were then constructed to determine whether engagement with
PeerWise could explain any course variation in exam score; whether this effect remains
when controlling for prior-ability; and whether the effects of PeerWise and/or prior-ability
vary according to course. Using multilevel modelling allows differences between courses to
be statistically modelled and directly compared to each other. The approach to model
building may differ for the analysis of each PeerWise activity, but each analysis broadly
follows the following procedure. Each model builds upon the previous one, in a nested
fashion, starting with the assumption that there are course differences to model. Across all
the activities, Model X.0 is the null model; Model X.1 adds in the PeerWise activity where
the intercepts for each course have been allowed to vary. Model X.2 adds in the effect of
prior ability – again with both the intercepts varying. Model X.3a builds upon X.2 and
allows the relationship between PeerWise activity and exam score to vary across courses.
Model X.3b builds upon X.2, allowing prior-ability to vary across courses but keeping
PeerWise activity constant. Where both slopes vary significantly across courses, a further
model X.4 is constructed with both slopes varying, however given that there are a limited
number of courses at level 2, it is more instructive to interpret each random slope model,
X.3a and X.3b individually with caution. The best model is the one that explains most
variance in the most parsimonious way. Each of the models is discussed in turn for each
activity within the given chapter.
114
Where slopes are permitted to vary across courses, it is possible to ascertain which
courses are more extreme than the overall relationship. Although higher variation will result
in more extreme differences in slopes between course, it is useful to attempt to ascertain
more clearly what the variance component signifies [159]. By taking the square root of the
variance for the slope, one obtains the standard deviation of the slope. According to the
normal distribution, 95% of courses have slopes that fall within ±1.96 standard deviations of
the mean slope (the fixed effect). The 2.5% of courses in the “tails” can be considered to
have very strong relationships (high value coefficients) or weak relationships (low value
coefficients).
5.3 Relationship between number of questions authored and exam
score
Asking questions and seeking answers is integral in scientific endeavour. “The
formulation of a good question is also a creative act and at the heart of what doing science
is all about” [118]. Encouraging students to both ask questions, and to think deeply about
their answers, is intended to develop problem solving skills and to encourage students to
understand concepts as opposed to merely learning facts. In order to write a question for
their peers on PeerWise, students must have figured out the answer to the question; they
must have developed suitable distractors; and they must have formulated an explanation for
why their chosen answer is correct and the distractors are wrong. All these tasks place
significant cognitive demands on students [32,34,66,106].
Table 23 summarises the relationship between questions authored and exam score
for each of the 18 courses. The results for each course are discussed in more detail below.
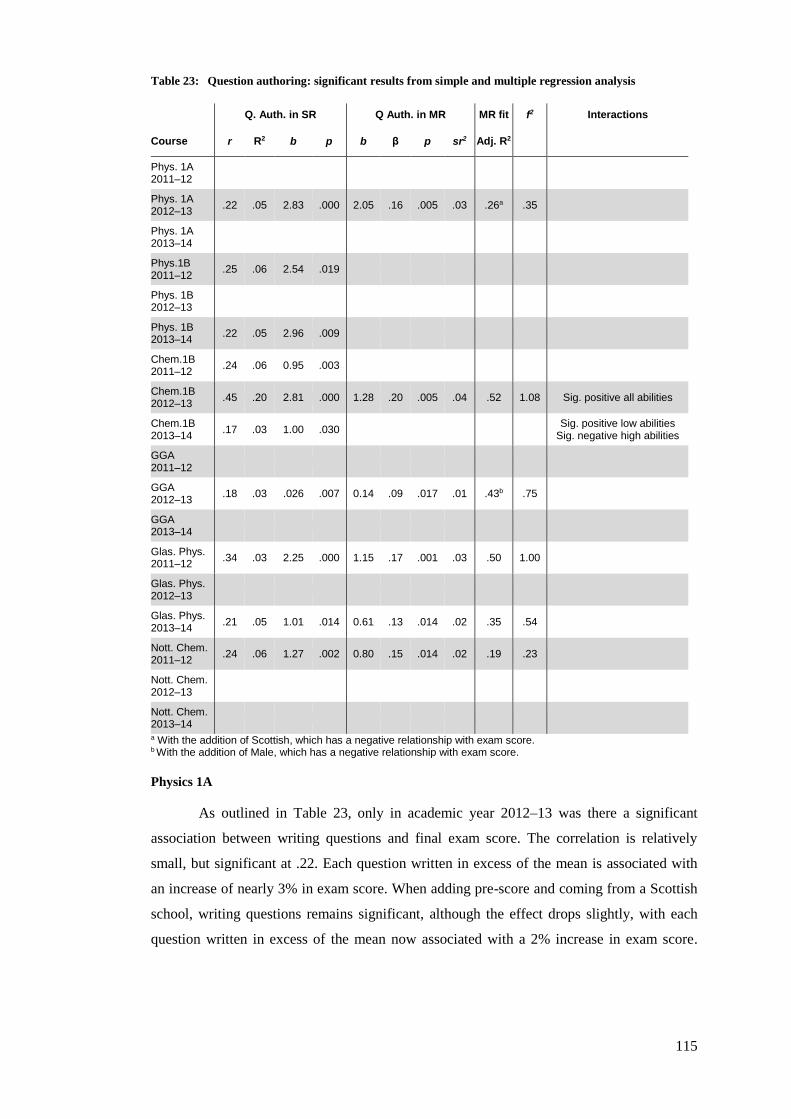
115
Table 23: Question authoring: significant results from simple and multiple regression analysis
Q. Auth. in SR Q Auth. in MR MR fit f2 Interactions
Course r R2 b p b β p sr2 Adj. R2
Phys. 1A 2011–12
Phys. 1A 2012–13
.22 .05 2.83 .000 2.05 .16 .005 .03 .26a .35
Phys. 1A 2013–14
Phys.1B 2011–12
.25 .06 2.54 .019
Phys. 1B 2012–13
Phys. 1B 2013–14
.22 .05 2.96 .009
Chem.1B 2011–12
.24 .06 0.95 .003
Chem.1B 2012–13
.45 .20 2.81 .000 1.28 .20 .005 .04 .52 1.08 Sig. positive all abilities
Chem.1B 2013–14
.17 .03 1.00 .030 Sig. positive low abilities
Sig. negative high abilities
GGA 2011–12
GGA 2012–13
.18 .03 .026 .007 0.14 .09 .017 .01 .43b .75
GGA 2013–14
Glas. Phys. 2011–12
.34 .03 2.25 .000 1.15 .17 .001 .03 .50 1.00
Glas. Phys. 2012–13
Glas. Phys. 2013–14
.21 .05 1.01 .014 0.61 .13 .014 .02 .35 .54
Nott. Chem. 2011–12
.24 .06 1.27 .002 0.80 .15 .014 .02 .19 .23
Nott. Chem. 2012–13
Nott. Chem. 2013–14
a With the addition of Scottish, which has a negative relationship with exam score. b With the addition of Male, which has a negative relationship with exam score.
Physics 1A
As outlined in Table 23, only in academic year 2012–13 was there a significant
association between writing questions and final exam score. The correlation is relatively
small, but significant at .22. Each question written in excess of the mean is associated with
an increase of nearly 3% in exam score. When adding pre-score and coming from a Scottish
school, writing questions remains significant, although the effect drops slightly, with each
question written in excess of the mean now associated with a 2% increase in exam score.
116
There are no significant interaction effects between question authoring and exam score in
Physics 1A, indicating that the effect of writing questions remains constant across all ability
levels.
Physics 1B
In Physics 1B, writing questions is associated with exam score in the simple
regression models for years 2011–12 and 2013–14. As in Physics 1A, each additional
question written over the mean is associated with a 3% increase in exam score and writing
questions explains 5–6% of the variance in exam score. There are no significant interactions
between question authoring and pre score in any of the models.
Chemistry 1B
Across all years, in the simple regression model, question authoring has a significant
positive association with exam score. Only in 2012–13, however, did the significant
association remain when including prior ability in the model where the unique contribution
of question authoring to the model explained 4% of the variance in exam score, and is
associated with a just over a 1% increase in exam score for every question authored.
Both the 2012–13 and 2013–14 data demonstrate significant interaction effects
between the number of questions authored and prior ability (Table 24 Table 25). In 2012–13,
pre-score has a moderating effect across all levels of ability. Using the pick-a-point method,
for each additional question written, the change in exam score for low, medium and higher
abilities is ~ 1%, ~ 2% ~ 3% respectively, indicating that higher ability students may benefit
more from writing questions. More specifically, the Johnson-Neyman region of significance
indicates that the effect of writing question on exam score applies to students who scored
less than +19.29% above the mean. This encompasses 94.12% of the students in the dataset,
indicating that perhaps the top 6% of students do not benefit as much as other students from
authoring questions. In 2013–14, using the pick-a-point method, there is a significant
positive relationship between writing questions for lower ability students, but a negative
relationship for higher ability students b = 1.38 and b = –1.17 respectively. The Johnson-
Neyman region of significance indicates that the positive effects apply to students who
scored less than –8.90% below the mean and those who scored more than +14.02% above
the mean. This encompasses in total, 43.9% of the students in the dataset.
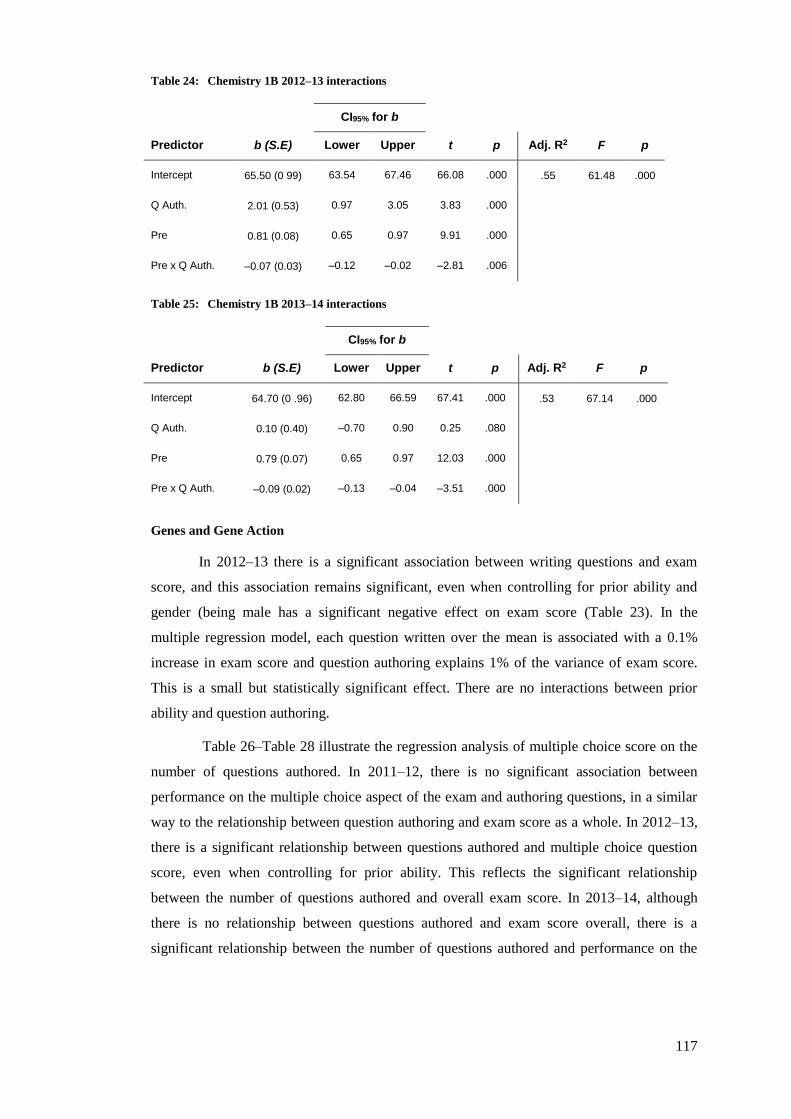
117
Table 24: Chemistry 1B 2012–13 interactions
CI95% for b
Predictor b (S.E) Lower Upper t p Adj. R2 F p
Intercept 65.50 (0 99) 63.54 67.46 66.08 .000 .55 61.48 .000
Q Auth. 2.01 (0.53) 0.97 3.05 3.83 .000
Pre 0.81 (0.08) 0.65 0.97 9.91 .000
Pre x Q Auth. –0.07 (0.03) –0.12 –0.02 –2.81 .006
Table 25: Chemistry 1B 2013–14 interactions
CI95% for b
Predictor b (S.E) Lower Upper t p Adj. R2 F p
Intercept 64.70 (0 .96) 62.80 66.59 67.41 .000 .53 67.14 .000
Q Auth. 0.10 (0.40) –0.70 0.90 0.25 .080
Pre 0.79 (0.07) 0.65 0.97 12.03 .000
Pre x Q Auth. –0.09 (0.02) –0.13 –0.04 –3.51 .000
Genes and Gene Action
In 2012–13 there is a significant association between writing questions and exam
score, and this association remains significant, even when controlling for prior ability and
gender (being male has a significant negative effect on exam score (Table 23). In the
multiple regression model, each question written over the mean is associated with a 0.1%
increase in exam score and question authoring explains 1% of the variance of exam score.
This is a small but statistically significant effect. There are no interactions between prior
ability and question authoring.
Table 26–Table 28 illustrate the regression analysis of multiple choice score on the
number of questions authored. In 2011–12, there is no significant association between
performance on the multiple choice aspect of the exam and authoring questions, in a similar
way to the relationship between question authoring and exam score as a whole. In 2012–13,
there is a significant relationship between questions authored and multiple choice question
score, even when controlling for prior ability. This reflects the significant relationship
between the number of questions authored and overall exam score. In 2013–14, although
there is no relationship between questions authored and exam score overall, there is a
significant relationship between the number of questions authored and performance on the
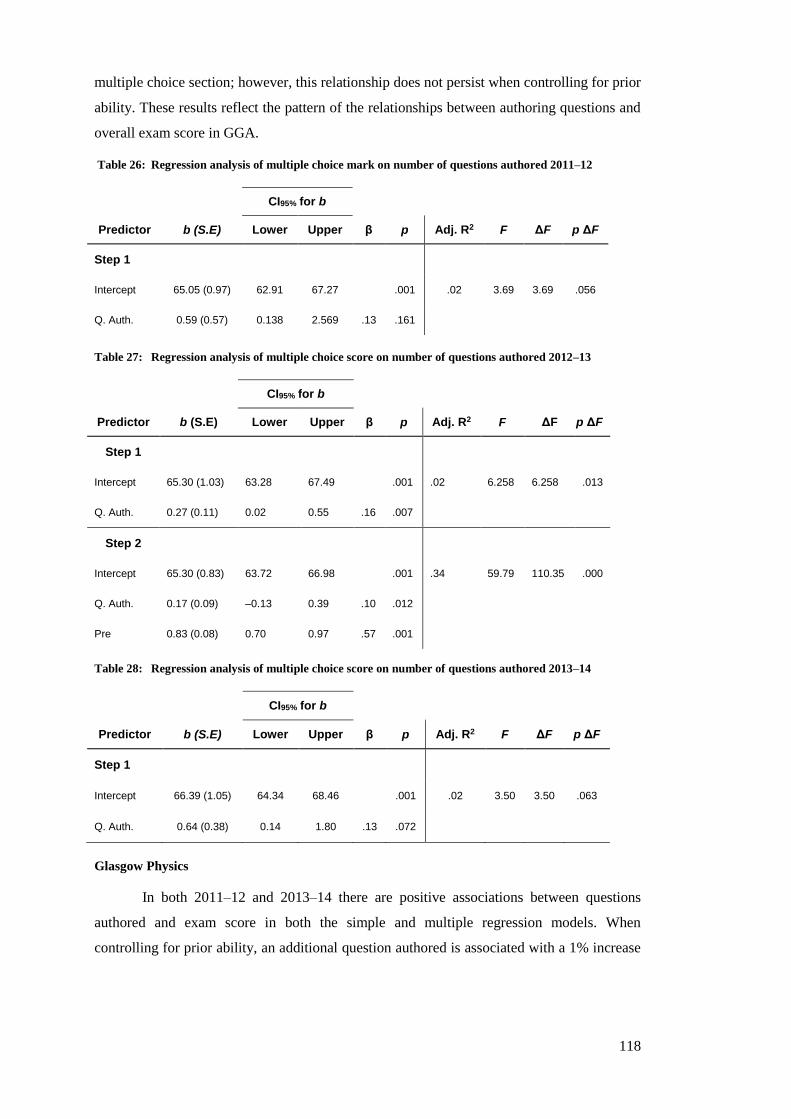
118
multiple choice section; however, this relationship does not persist when controlling for prior
ability. These results reflect the pattern of the relationships between authoring questions and
overall exam score in GGA.
Table 26: Regression analysis of multiple choice mark on number of questions authored 2011–12
CI95% for b
Predictor b (S.E) Lower Upper β p Adj. R2 F ΔF p ΔF
Step 1
Intercept 65.05 (0.97) 62.91 67.27 .001 .02 3.69 3.69 .056
Q. Auth. 0.59 (0.57) 0.138 2.569 .13 .161
Table 27: Regression analysis of multiple choice score on number of questions authored 2012–13
CI95% for b
Predictor b (S.E) Lower Upper β p Adj. R2 F ΔF p ΔF
Step 1
Intercept 65.30 (1.03) 63.28 67.49 .001 .02 6.258 6.258 .013
Q. Auth. 0.27 (0.11) 0.02 0.55 .16 .007
Step 2
Intercept 65.30 (0.83) 63.72 66.98 .001 .34 59.79 110.35 .000
Q. Auth. 0.17 (0.09) –0.13 0.39 .10 .012
Pre 0.83 (0.08) 0.70 0.97 .57 .001
Table 28: Regression analysis of multiple choice score on number of questions authored 2013–14
CI95% for b
Predictor b (S.E) Lower Upper β p Adj. R2 F ΔF p ΔF
Step 1
Intercept 66.39 (1.05) 64.34 68.46 .001 .02 3.50 3.50 .063
Q. Auth. 0.64 (0.38) 0.14 1.80 .13 .072
Glasgow Physics
In both 2011–12 and 2013–14 there are positive associations between questions
authored and exam score in both the simple and multiple regression models. When
controlling for prior ability, an additional question authored is associated with a 1% increase
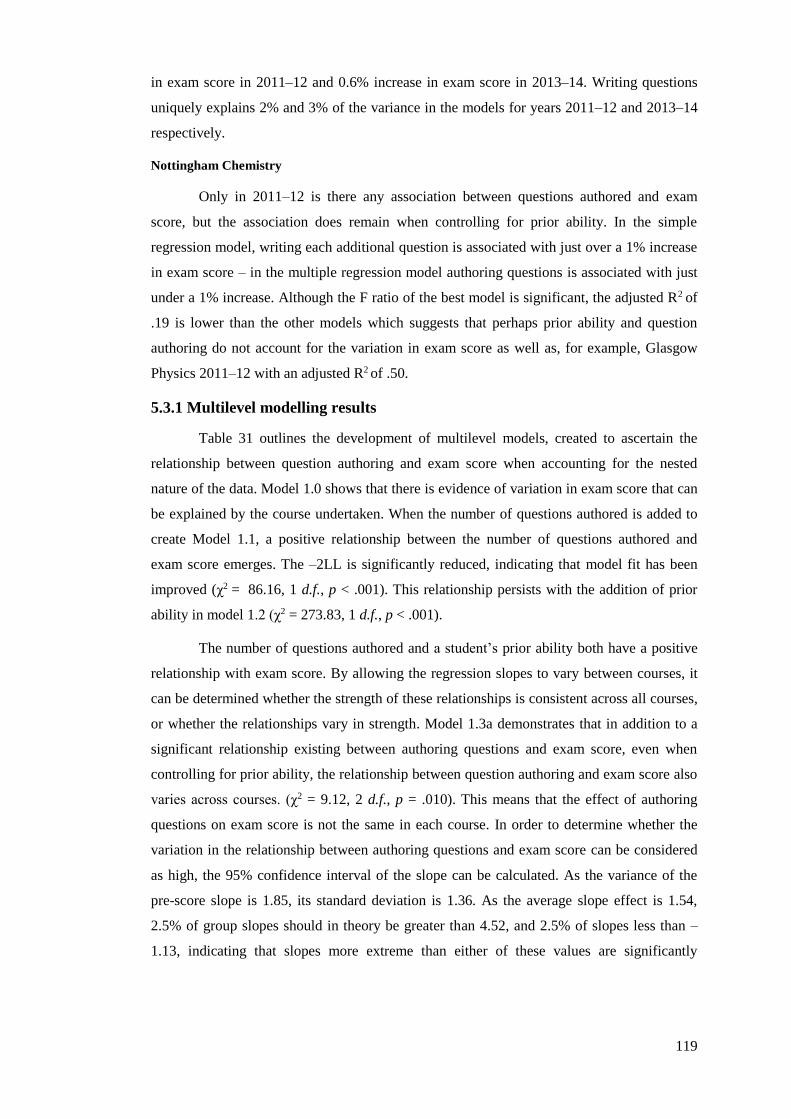
119
in exam score in 2011–12 and 0.6% increase in exam score in 2013–14. Writing questions
uniquely explains 2% and 3% of the variance in the models for years 2011–12 and 2013–14
respectively.
Nottingham Chemistry
Only in 2011–12 is there any association between questions authored and exam
score, but the association does remain when controlling for prior ability. In the simple
regression model, writing each additional question is associated with just over a 1% increase
in exam score – in the multiple regression model authoring questions is associated with just
under a 1% increase. Although the F ratio of the best model is significant, the adjusted R2 of
.19 is lower than the other models which suggests that perhaps prior ability and question
authoring do not account for the variation in exam score as well as, for example, Glasgow
Physics 2011–12 with an adjusted R2 of .50.
5.3.1 Multilevel modelling results
Table 31 outlines the development of multilevel models, created to ascertain the
relationship between question authoring and exam score when accounting for the nested
nature of the data. Model 1.0 shows that there is evidence of variation in exam score that can
be explained by the course undertaken. When the number of questions authored is added to
create Model 1.1, a positive relationship between the number of questions authored and
exam score emerges. The –2LL is significantly reduced, indicating that model fit has been
improved (χ2 = 86.16, 1 d.f., p < .001). This relationship persists with the addition of prior
ability in model 1.2 (χ2 = 273.83, 1 d.f., p < .001).
The number of questions authored and a student’s prior ability both have a positive
relationship with exam score. By allowing the regression slopes to vary between courses, it
can be determined whether the strength of these relationships is consistent across all courses,
or whether the relationships vary in strength. Model 1.3a demonstrates that in addition to a
significant relationship existing between authoring questions and exam score, even when
controlling for prior ability, the relationship between question authoring and exam score also
varies across courses. (χ2 = 9.12, 2 d.f., p = .010). This means that the effect of authoring
questions on exam score is not the same in each course. In order to determine whether the
variation in the relationship between authoring questions and exam score can be considered
as high, the 95% confidence interval of the slope can be calculated. As the variance of the
pre-score slope is 1.85, its standard deviation is 1.36. As the average slope effect is 1.54,
2.5% of group slopes should in theory be greater than 4.52, and 2.5% of slopes less than –
1.13, indicating that slopes more extreme than either of these values are significantly
120
different to the overall mean slope. Although the relationship between the number of
questions authored and exam score is positive in all courses (which, as ascertained
previously, is a significant relationship itself), GGA 2012–13 and Glasgow Physics 2011–12
are more extreme than the overall association between the number of questions authored and
exam score (Table 29).
Table 29: Rank order of questions authored slope residuals
Course Slope Q Auth. Slope Residual Rank (low to high)
Phys. 1A 2013–14 0.14 –1.40 1
GGA 2013–14 0.23 –1.31 2
Phys. 1B.20 2012–13 0.24 –1.30 3
GGA 2011–12 0.62 –0.92 4
Nott. Chem. 2012–13 0.70 –0.84 5
Phys. 1A 2011–12 0.81 –0.73 6
Nott. Chem. 2013–14 0.86 –0.68 7
GGA 2012–13 1.27 –0.27 8
Chem. 1B 2013–14 1.5 –0.04 9
Chem. 1B 2011–12 1.77 0.23 10
Phys. 1B 2011–12 1.84 0.30 11
Phys. 1B 2013–14 1.89 0.35 12
Phys. 1A 2012–13 1.97 0.43 13
Nott. Chem. 2011–12 1.98 0.44 14
Glas. Phys. 2012–13 2.09 0.55 15
Glas. Phys. 2013–14 2.41 0.87 16
Chem. 1B 2012–13 3.68 2.14 17
Glas. Phys 2011–12 3.69 2.15 18
In Model 1.3b, the relationship between prior ability and exam score is permitted to
vary across courses, and indeed it can be determined that the relationship between prior
ability and exam score varies by course. (χ2 = 974.84, 2 d.f., p <.001). As with the
relationship between exam score and questions authored, the 95% confidence interval of the
slope can be calculated. As the variance of the pre-score slope is 9.96, its standard deviation
is 3.16. As the average slope effect is 8.55, slopes that are greater than 14.74, or less than
2.36, are more extreme than the overall mean slope. In this analysis, only Physics 1B 2012–
13 displays a relationship between pre-score and exam score that is more extreme than the
mean relationship (Table 30).
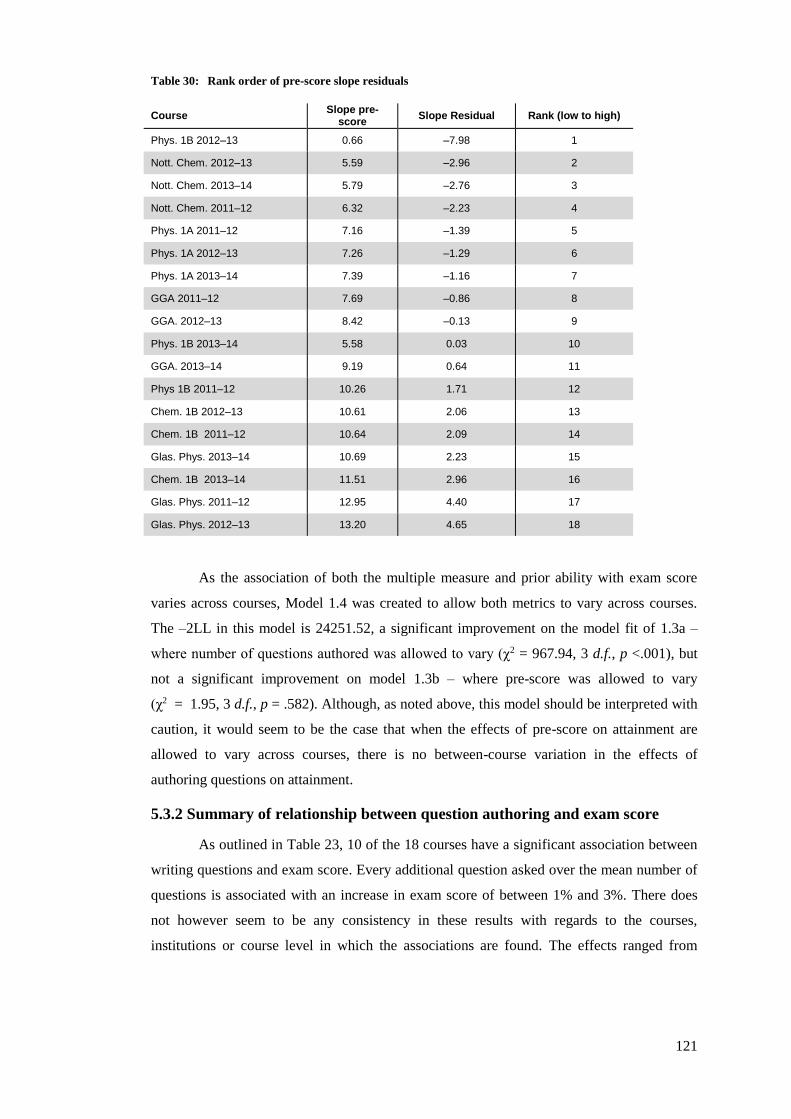
121
Table 30: Rank order of pre-score slope residuals
Course Slope pre-
score Slope Residual Rank (low to high)
Phys. 1B 2012–13 0.66 –7.98 1
Nott. Chem. 2012–13 5.59 –2.96 2
Nott. Chem. 2013–14 5.79 –2.76 3
Nott. Chem. 2011–12 6.32 –2.23 4
Phys. 1A 2011–12 7.16 –1.39 5
Phys. 1A 2012–13 7.26 –1.29 6
Phys. 1A 2013–14 7.39 –1.16 7
GGA 2011–12 7.69 –0.86 8
GGA. 2012–13 8.42 –0.13 9
Phys. 1B 2013–14 5.58 0.03 10
GGA. 2013–14 9.19 0.64 11
Phys 1B 2011–12 10.26 1.71 12
Chem. 1B 2012–13 10.61 2.06 13
Chem. 1B 2011–12 10.64 2.09 14
Glas. Phys. 2013–14 10.69 2.23 15
Chem. 1B 2013–14 11.51 2.96 16
Glas. Phys. 2011–12 12.95 4.40 17
Glas. Phys. 2012–13 13.20 4.65 18
As the association of both the multiple measure and prior ability with exam score
varies across courses, Model 1.4 was created to allow both metrics to vary across courses.
The –2LL in this model is 24251.52, a significant improvement on the model fit of 1.3a –
where number of questions authored was allowed to vary (χ2 = 967.94, 3 d.f., p <.001), but
not a significant improvement on model 1.3b – where pre-score was allowed to vary
(χ2 = 1.95, 3 d.f., p = .582). Although, as noted above, this model should be interpreted with
caution, it would seem to be the case that when the effects of pre-score on attainment are
allowed to vary across courses, there is no between-course variation in the effects of
authoring questions on attainment.
5.3.2 Summary of relationship between question authoring and exam score
As outlined in Table 23, 10 of the 18 courses have a significant association between
writing questions and exam score. Every additional question asked over the mean number of
questions is associated with an increase in exam score of between 1% and 3%. There does
not however seem to be any consistency in these results with regards to the courses,
institutions or course level in which the associations are found. The effects ranged from
122
small but significant (.17) to what could be considered as medium–high within the
educational context (.45). When other predictor variables – most notably prior ability – were
added, the effect of question authoring dropped out in 4 courses. In the remaining 6 courses
the effect of question authoring persisted even when controlling for prior ability, and, where
appropriate, gender or having attended a Scottish school. The standardized betas of authoring
questions in these models are quite small ranging from .09 to .20, illustrating the strength of
the influence of prior ability in the model. The standardized betas of prior ability, which
range from .5 to .7 (see Appendix D), indicate the greater influence prior ability has on exam
achievement. Similar findings regarding the influence of prior ability have been highlighted
in previous studies of the PeerWise system [126], and also in the educational research
literature more generally [12].
The effects of writing questions on exam score are generally constant across all
levels of ability, with two exceptions. In Chemistry 1B 2012–13, whilst the effect is positive
across students with high, medium and low abilities, the effect of writing questions is three
times as strong for high ability students as low ability students. Although the effect of
question authoring drops out of the regression model in Chemistry 1B 2013–14 where the
interaction term is included, it becomes evident that the relationship between the number of
questions authored and exam score is significantly positive for low ability students –
indicating that students with lower ability gain benefit from writing questions – but is
negative for higher ability students – indicating that writing more questions has a detrimental
effect on exam performance. The reasons for this are unclear. There could be an optimal
number of questions to ask; perhaps students write more generic, less in-depth questions and
therefore are not benefiting as much as students who write fewer questions but which cover
more complex topics, requiring more understanding; it could also be the case that students
who write an excessive number of questions may become too invested in PeerWise, so
neglect other aspects of study, which may be more transferable to success in a written exam.
The issue of balancing the number of questions a student should construct whilst maximising
the benefit of the exercise to learners has been discussed in Frase and Schwartz [74], where
the authors suggest that perhaps asking too many questions may result in students exhausting
the materials from which to create the sophisticated questions that are associated with
higher-order learning gains. The authors state that it is not necessarily the case that doubling
the number of questions authored will yield double the benefits on student learning.
In the multilevel model, even when controlling for prior ability, authoring questions
has a significant association with exam score – explaining a significant proportion of the
variation in mean exam score between courses (Table 31). The relationship between
123
questions authored and exam score varies significantly across courses, as do the effects of
prior ability. The effects of question authoring are positive – writing more questions is
associated with an increase in exam attainment. In model 1.3b – the most reliable model,
which explains the most variance – an increase of 1 standard deviation in the number of
questions written is associated with a 1.38% increase in exam score.
Although the effects on exam score are small, it is important to remember that
authoring questions is just one of the required activities in PeerWise, and that as a whole,
PeerWise is only worth between 1% and 5% of the course mark (Section 2.2) Although there
is no breakdown of the value of completing each component of the PeerWise task, it is clear
that the authoring questions would comprise a very small proportion of the total course mark.
When interpreting these results it should also be remembered that students only have
to write between one and three questions. Whilst they are encouraged to synthesise topics,
there is a limit to the range of subject areas upon which a student’s questions will be based. It
is entirely possible that some students either choose not to answer questions in the exam that
relate to the subject matter on which they based their PeerWise questions, or that there were
no questions posed in the exam that covered the same topic as their authored questions. Prior
research findings suggest that the deeper understanding and retention of materials occurs as a
result of students generating questions on specific topics [60,74]. Instructors within the
courses currently under study have not specified either the topics on which students should
base their questions, or that students should choose questions in the final exam based upon
the subject of their authored questions. Therefore, where students do not answer questions in
the exam that correspond to their authored questions, there may not be any discernible effect
of authoring on exam score. Moreover, since there is no control group who wrote no
questions and also no group who were assigned to author a question on a subject that would
later arise in the exam, it is entirely possible that the effects of writing questions for some
students have not come to light by using exam score as a measure of attainment – an issue
highlighted in the prior literature [60,74,138] and as discussed in Chapter 3.
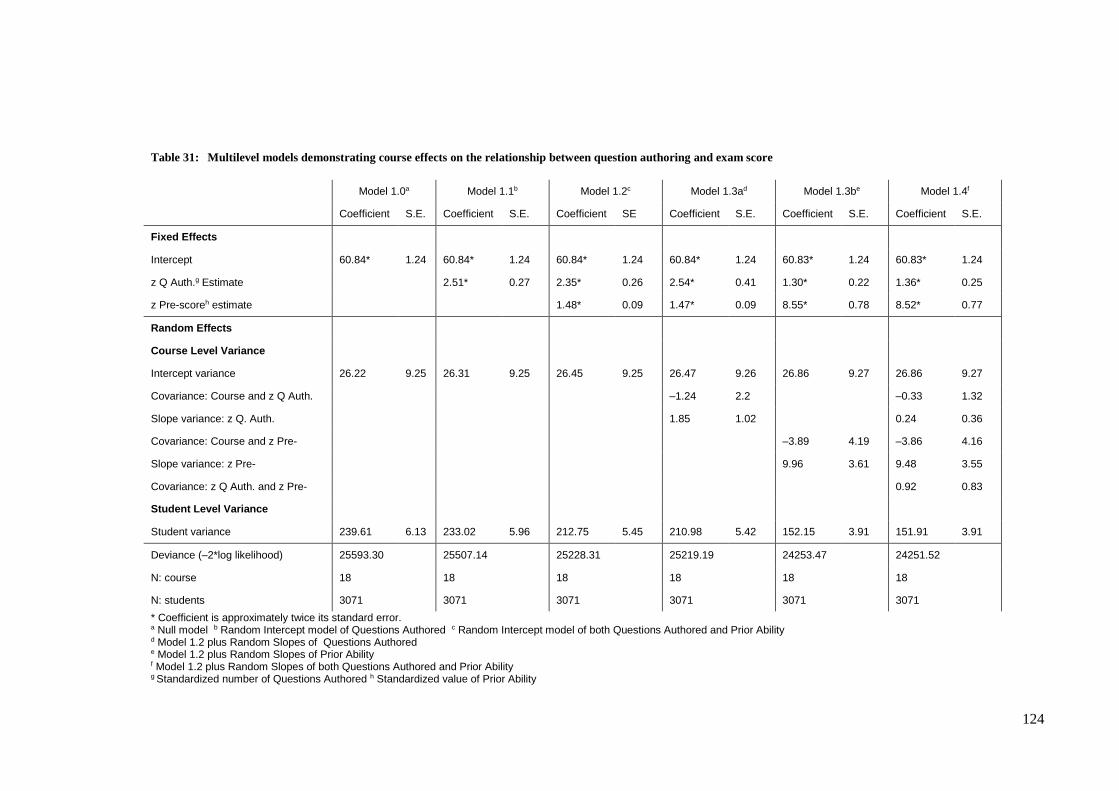
124
Table 31: Multilevel models demonstrating course effects on the relationship between question authoring and exam score
Model 1.0a Model 1.1b Model 1.2c Model 1.3ad Model 1.3be Model 1.4f
Coefficient S.E. Coefficient S.E. Coefficient SE Coefficient S.E. Coefficient S.E. Coefficient S.E.
Fixed Effects
Intercept 60.84* 1.24 60.84* 1.24 60.84* 1.24 60.84* 1.24 60.83* 1.24 60.83* 1.24
z Q Auth.g Estimate 2.51* 0.27 2.35* 0.26 2.54* 0.41 1.30* 0.22 1.36* 0.25
z Pre-scoreh estimate 1.48* 0.09 1.47* 0.09 8.55* 0.78 8.52* 0.77
Random Effects
Course Level Variance
Intercept variance 26.22 9.25 26.31 9.25 26.45 9.25 26.47 9.26 26.86 9.27 26.86 9.27
Covariance: Course and z Q Auth. –1.24 2.2 –0.33 1.32
Slope variance: z Q. Auth. 1.85 1.02 0.24 0.36
Covariance: Course and z Pre- –3.89 4.19 –3.86 4.16
Slope variance: z Pre- 9.96 3.61 9.48 3.55
Covariance: z Q Auth. and z Pre- 0.92 0.83
Student Level Variance
Student variance 239.61 6.13 233.02 5.96 212.75 5.45 210.98 5.42 152.15 3.91 151.91 3.91
Deviance (–2*log likelihood) 25593.30 25507.14 25228.31 25219.19 24253.47 24251.52
N: course 18 18 18 18 18 18
N: students 3071 3071 3071 3071 3071 3071
* Coefficient is approximately twice its standard error. a Null model b Random Intercept model of Questions Authored c Random Intercept model of both Questions Authored and Prior Ability d Model 1.2 plus Random Slopes of Questions Authored e Model 1.2 plus Random Slopes of Prior Ability f Model 1.2 plus Random Slopes of both Questions Authored and Prior Ability g Standardized number of Questions Authored h Standardized value of Prior Ability
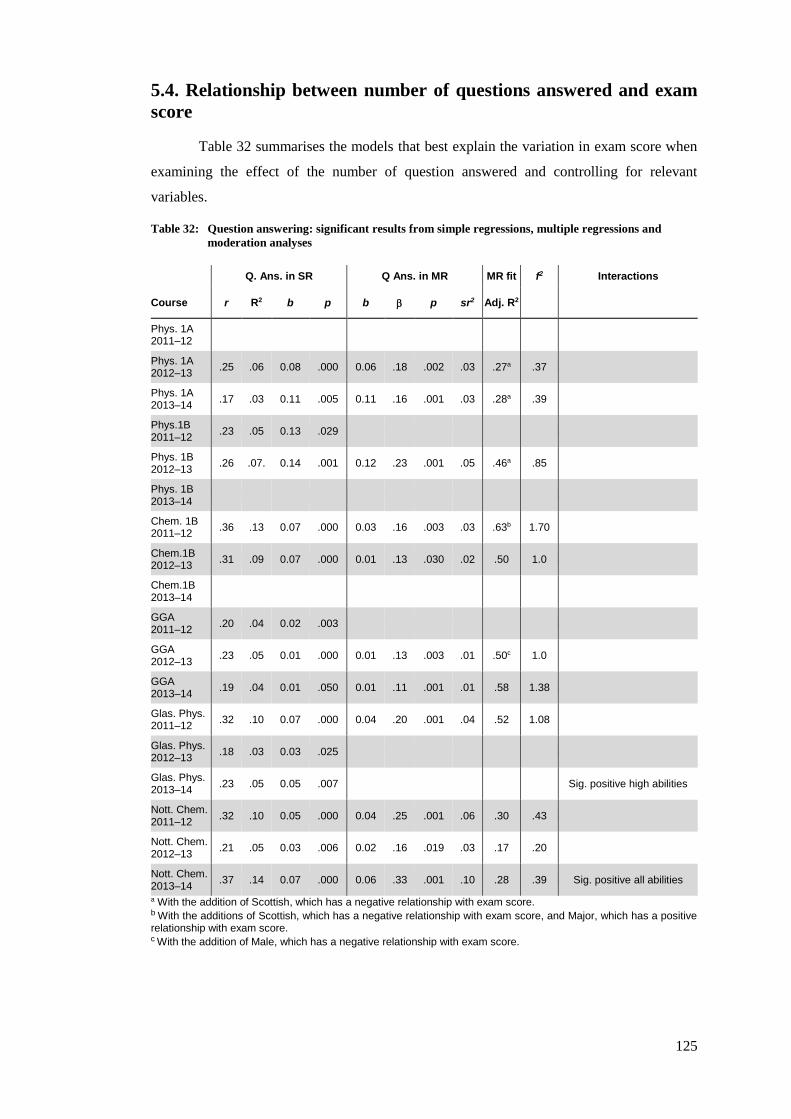
125
5.4. Relationship between number of questions answered and exam
score
Table 32 summarises the models that best explain the variation in exam score when
examining the effect of the number of question answered and controlling for relevant
variables.
Table 32: Question answering: significant results from simple regressions, multiple regressions and
moderation analyses
Q. Ans. in SR Q Ans. in MR MR fit f2 Interactions
Course r R2 b p b p sr2 Adj. R2
Phys. 1A 2011–12
Phys. 1A 2012–13
.25 .06 0.08 .000 0.06 .18 .002 .03 .27a .37
Phys. 1A 2013–14
.17 .03 0.11 .005 0.11 .16 .001 .03 .28a .39
Phys.1B 2011–12
.23 .05 0.13 .029
Phys. 1B 2012–13
.26 .07. 0.14 .001 0.12 .23 .001 .05 .46a .85
Phys. 1B 2013–14
Chem. 1B 2011–12
.36 .13 0.07 .000 0.03 .16 .003 .03 .63b 1.70
Chem.1B 2012–13
.31 .09 0.07 .000 0.01 .13 .030 .02 .50 1.0
Chem.1B 2013–14
GGA 2011–12
.20 .04 0.02 .003
GGA 2012–13
.23 .05 0.01 .000 0.01 .13 .003 .01 .50c 1.0
GGA 2013–14
.19 .04 0.01 .050 0.01 .11 .001 .01 .58 1.38
Glas. Phys. 2011–12
.32 .10 0.07 .000 0.04 .20 .001 .04 .52 1.08
Glas. Phys. 2012–13
.18 .03 0.03 .025
Glas. Phys. 2013–14
.23 .05 0.05 .007 Sig. positive high abilities
Nott. Chem. 2011–12
.32 .10 0.05 .000 0.04 .25 .001 .06 .30 .43
Nott. Chem. 2012–13
.21 .05 0.03 .006 0.02 .16 .019 .03 .17 .20
Nott. Chem. 2013–14
.37 .14 0.07 .000 0.06 .33 .001 .10 .28 .39 Sig. positive all abilities
a With the addition of Scottish, which has a negative relationship with exam score. b With the additions of Scottish, which has a negative relationship with exam score, and Major, which has a positive relationship with exam score. c With the addition of Male, which has a negative relationship with exam score.
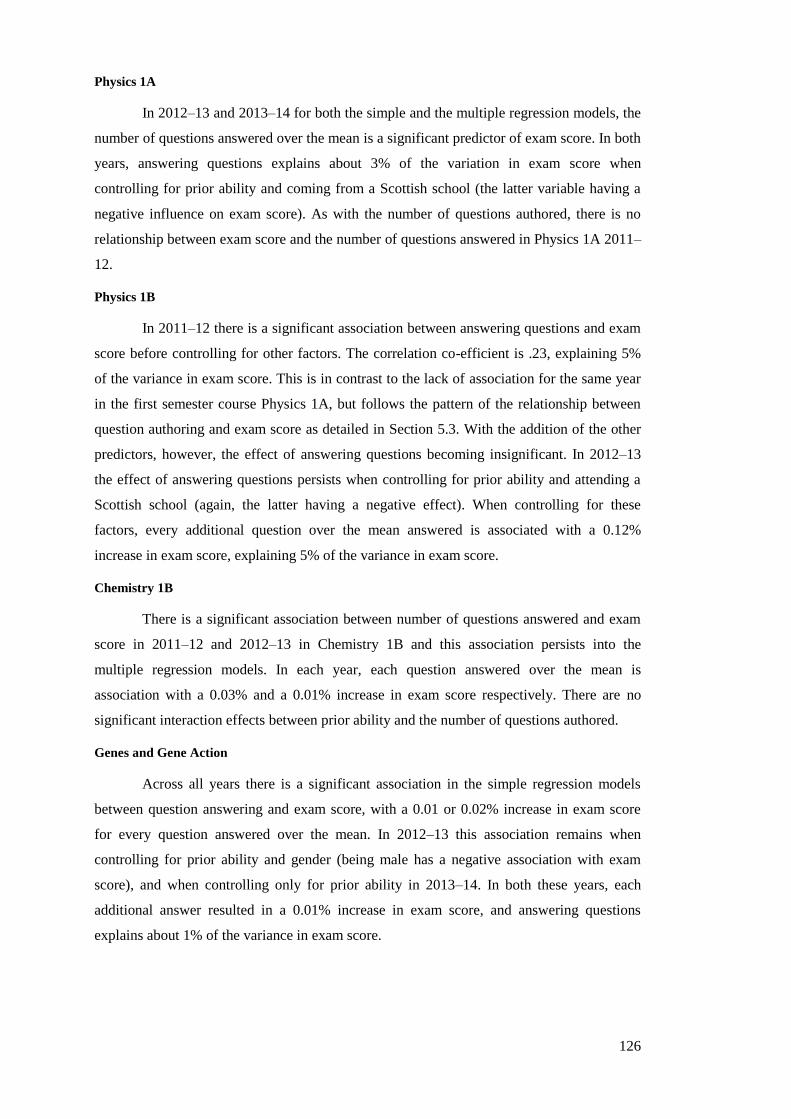
126
Physics 1A
In 2012–13 and 2013–14 for both the simple and the multiple regression models, the
number of questions answered over the mean is a significant predictor of exam score. In both
years, answering questions explains about 3% of the variation in exam score when
controlling for prior ability and coming from a Scottish school (the latter variable having a
negative influence on exam score). As with the number of questions authored, there is no
relationship between exam score and the number of questions answered in Physics 1A 2011–
12.
Physics 1B
In 2011–12 there is a significant association between answering questions and exam
score before controlling for other factors. The correlation co-efficient is .23, explaining 5%
of the variance in exam score. This is in contrast to the lack of association for the same year
in the first semester course Physics 1A, but follows the pattern of the relationship between
question authoring and exam score as detailed in Section 5.3. With the addition of the other
predictors, however, the effect of answering questions becoming insignificant. In 2012–13
the effect of answering questions persists when controlling for prior ability and attending a
Scottish school (again, the latter having a negative effect). When controlling for these
factors, every additional question over the mean answered is associated with a 0.12%
increase in exam score, explaining 5% of the variance in exam score.
Chemistry 1B
There is a significant association between number of questions answered and exam
score in 2011–12 and 2012–13 in Chemistry 1B and this association persists into the
multiple regression models. In each year, each question answered over the mean is
association with a 0.03% and a 0.01% increase in exam score respectively. There are no
significant interaction effects between prior ability and the number of questions authored.
Genes and Gene Action
Across all years there is a significant association in the simple regression models
between question answering and exam score, with a 0.01 or 0.02% increase in exam score
for every question answered over the mean. In 2012–13 this association remains when
controlling for prior ability and gender (being male has a negative association with exam
score), and when controlling only for prior ability in 2013–14. In both these years, each
additional answer resulted in a 0.01% increase in exam score, and answering questions
explains about 1% of the variance in exam score.
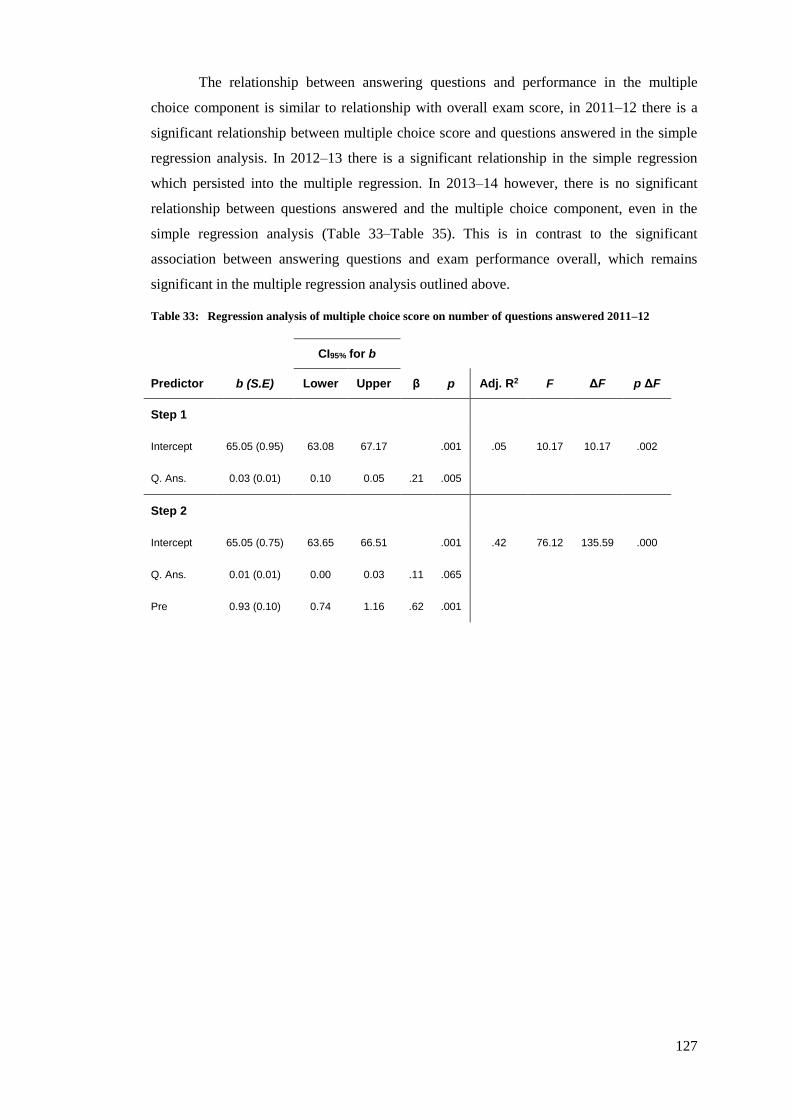
127
The relationship between answering questions and performance in the multiple
choice component is similar to relationship with overall exam score, in 2011–12 there is a
significant relationship between multiple choice score and questions answered in the simple
regression analysis. In 2012–13 there is a significant relationship in the simple regression
which persisted into the multiple regression. In 2013–14 however, there is no significant
relationship between questions answered and the multiple choice component, even in the
simple regression analysis (Table 33–Table 35). This is in contrast to the significant
association between answering questions and exam performance overall, which remains
significant in the multiple regression analysis outlined above.
Table 33: Regression analysis of multiple choice score on number of questions answered 2011–12
CI95% for b
Predictor b (S.E) Lower Upper β p Adj. R2 F ΔF p ΔF
Step 1
Intercept 65.05 (0.95) 63.08 67.17 .001 .05 10.17 10.17 .002
Q. Ans. 0.03 (0.01) 0.10 0.05 .21 .005
Step 2
Intercept 65.05 (0.75) 63.65 66.51 .001 .42 76.12 135.59 .000
Q. Ans. 0.01 (0.01) 0.00 0.03 .11 .065
Pre 0.93 (0.10) 0.74 1.16 .62 .001
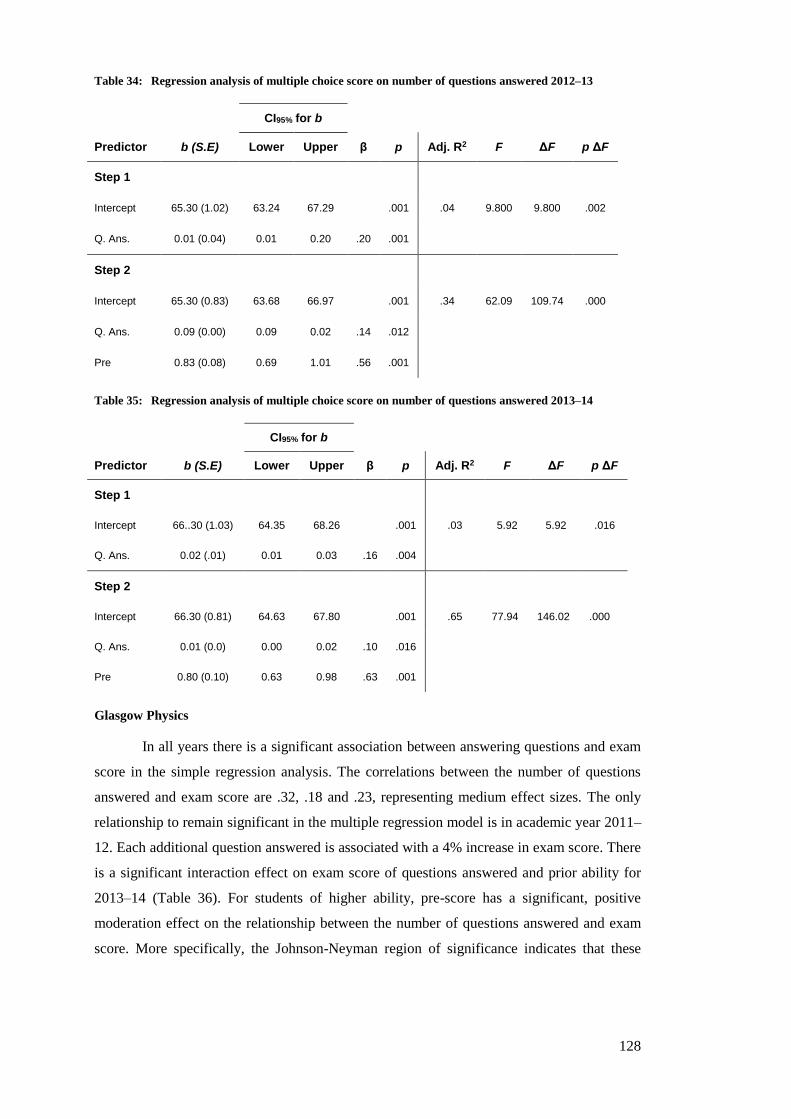
128
Table 34: Regression analysis of multiple choice score on number of questions answered 2012–13
CI95% for b
Predictor b (S.E) Lower Upper β p Adj. R2 F ΔF p ΔF
Step 1
Intercept 65.30 (1.02) 63.24 67.29 .001 .04 9.800 9.800 .002
Q. Ans. 0.01 (0.04) 0.01 0.20 .20 .001
Step 2
Intercept 65.30 (0.83) 63.68 66.97 .001 .34 62.09 109.74 .000
Q. Ans. 0.09 (0.00) 0.09 0.02 .14 .012
Pre 0.83 (0.08) 0.69 1.01 .56 .001
Table 35: Regression analysis of multiple choice score on number of questions answered 2013–14
CI95% for b
Predictor b (S.E) Lower Upper β p Adj. R2 F ΔF p ΔF
Step 1
Intercept 66..30 (1.03) 64.35 68.26 .001 .03 5.92 5.92 .016
Q. Ans. 0.02 (.01) 0.01 0.03 .16 .004
Step 2
Intercept 66.30 (0.81) 64.63 67.80 .001 .65 77.94 146.02 .000
Q. Ans. 0.01 (0.0) 0.00 0.02 .10 .016
Pre 0.80 (0.10) 0.63 0.98 .63 .001
Glasgow Physics
In all years there is a significant association between answering questions and exam
score in the simple regression analysis. The correlations between the number of questions
answered and exam score are .32, .18 and .23, representing medium effect sizes. The only
relationship to remain significant in the multiple regression model is in academic year 2011–
12. Each additional question answered is associated with a 4% increase in exam score. There
is a significant interaction effect on exam score of questions answered and prior ability for
2013–14 (Table 36). For students of higher ability, pre-score has a significant, positive
moderation effect on the relationship between the number of questions answered and exam
score. More specifically, the Johnson-Neyman region of significance indicates that these
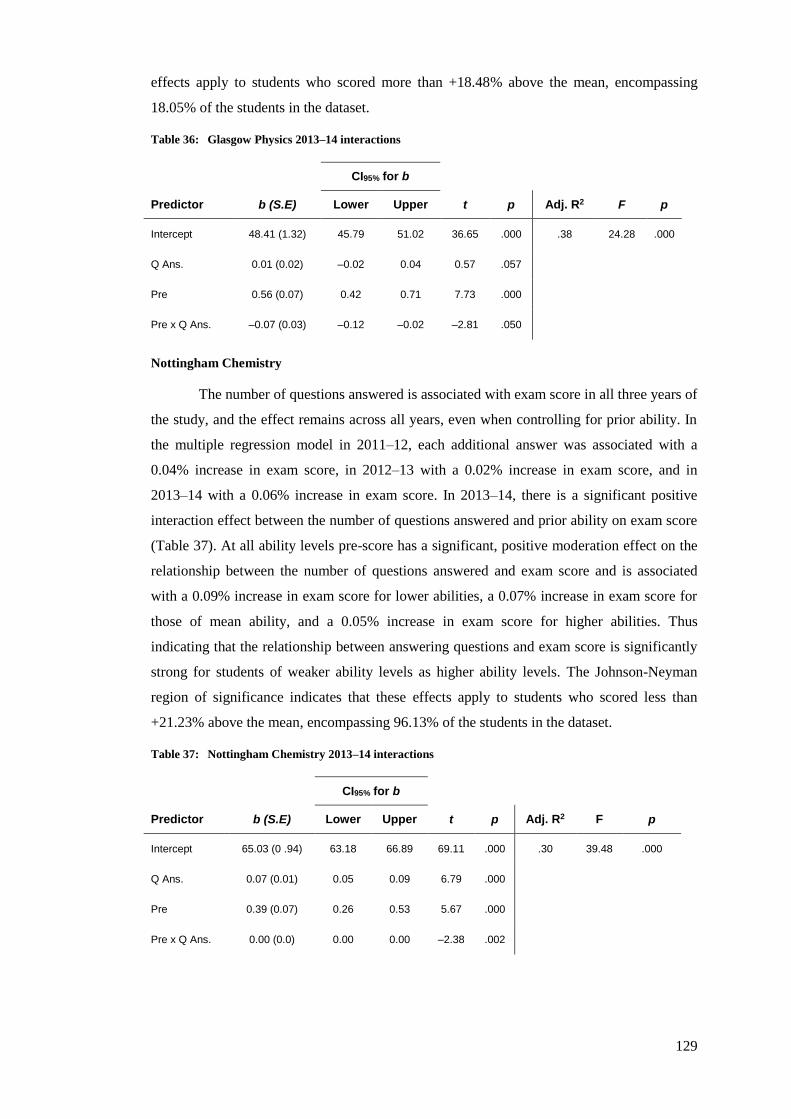
129
effects apply to students who scored more than +18.48% above the mean, encompassing
18.05% of the students in the dataset.
Table 36: Glasgow Physics 2013–14 interactions
CI95% for b
Predictor b (S.E) Lower Upper t p Adj. R2 F p
Intercept 48.41 (1.32) 45.79 51.02 36.65 .000 .38 24.28 .000
Q Ans. 0.01 (0.02) –0.02 0.04 0.57 .057
Pre 0.56 (0.07) 0.42 0.71 7.73 .000
Pre x Q Ans. –0.07 (0.03) –0.12 –0.02 –2.81 .050
Nottingham Chemistry
The number of questions answered is associated with exam score in all three years of
the study, and the effect remains across all years, even when controlling for prior ability. In
the multiple regression model in 2011–12, each additional answer was associated with a
0.04% increase in exam score, in 2012–13 with a 0.02% increase in exam score, and in
2013–14 with a 0.06% increase in exam score. In 2013–14, there is a significant positive
interaction effect between the number of questions answered and prior ability on exam score
(Table 37). At all ability levels pre-score has a significant, positive moderation effect on the
relationship between the number of questions answered and exam score and is associated
with a 0.09% increase in exam score for lower abilities, a 0.07% increase in exam score for
those of mean ability, and a 0.05% increase in exam score for higher abilities. Thus
indicating that the relationship between answering questions and exam score is significantly
strong for students of weaker ability levels as higher ability levels. The Johnson-Neyman
region of significance indicates that these effects apply to students who scored less than
+21.23% above the mean, encompassing 96.13% of the students in the dataset.
Table 37: Nottingham Chemistry 2013–14 interactions
CI95% for b
Predictor b (S.E) Lower Upper t p Adj. R2 F p
Intercept 65.03 (0 .94) 63.18 66.89 69.11 .000 .30 39.48 .000
Q Ans. 0.07 (0.01) 0.05 0.09 6.79 .000
Pre 0.39 (0.07) 0.26 0.53 5.67 .000
Pre x Q Ans. 0.00 (0.0) 0.00 0.00 –2.38 .002
130
5.4.1 Multilevel modelling results
Table 39 follows the development of multilevel models quantifying the relationship
between question answering and exam score when accounting for the clustered nature of the
data. As previously determined, Model 2.0 shows that there is evidence of variation in exam
score amongst courses – thus exam score is partly due to the course attended. When the
number of questions answered is added and allowed to vary at the school level to create
Model 2.1, a positive relationship between the number of questions answered and exam
score emerges. The –2LL is significantly reduced, indicating that model fit has been
improved (χ2 = 152.19, 1 d.f., p <.001). This relationship persists with the addition of prior
ability in model 2.2 (χ2 = 269.84, 1 d.f., p < .001. Although the number of questions
answered and prior ability have a positive relationship with exam score, only by allowing the
regression slopes to vary according to course can it be determined whether the strength of
relationship is consistent across all courses
Model 2.3a demonstrates that whilst there is an overall significant relationship
between answering and exam score, even when controlling for prior ability, the relationship
between question answering and exam score does not vary between courses (χ2 = 0.7, 2 d.f.,
p = .705). In the interests of parsimony (developing models which explain most variance but
excluding variables that do not materially contribute to the model) and given that there is no
variation between courses to model, the number of questions answered was constrained to
vary at its intercept only. The mean number of questions was allowed to vary by course, but
the relationship between answering questions and exam score will remain constant, resulting
in a plot where the regression line for each course is parallel, but crosses the y-axis at
different points. In Model 2.3b, the relationship between prior ability and exam score is
permitted to vary across courses, and indeed it can be determined that the relationship
between prior ability and exam score varies by course (χ2 = 974.84, 2 d.f., p <.001). The
slopes for the relationship between prior-ability and exam score will be not be parallel and
will also cross the y-axis at different points.
Once again, the 95% confidence interval of the slope coefficient can be calculated.
As the variance of the pre-score slope is 9.84, its standard deviation is 3.65. As the average
slope effect is 8.85, 2.5% of the slopes are therefore greater than 15.60, and 2.5% of slopes
are less than 1.70. Only in Physics 1B 2012–13 is the relationship between prior ability and
exam score significantly more extreme than in the other courses (Table 38).
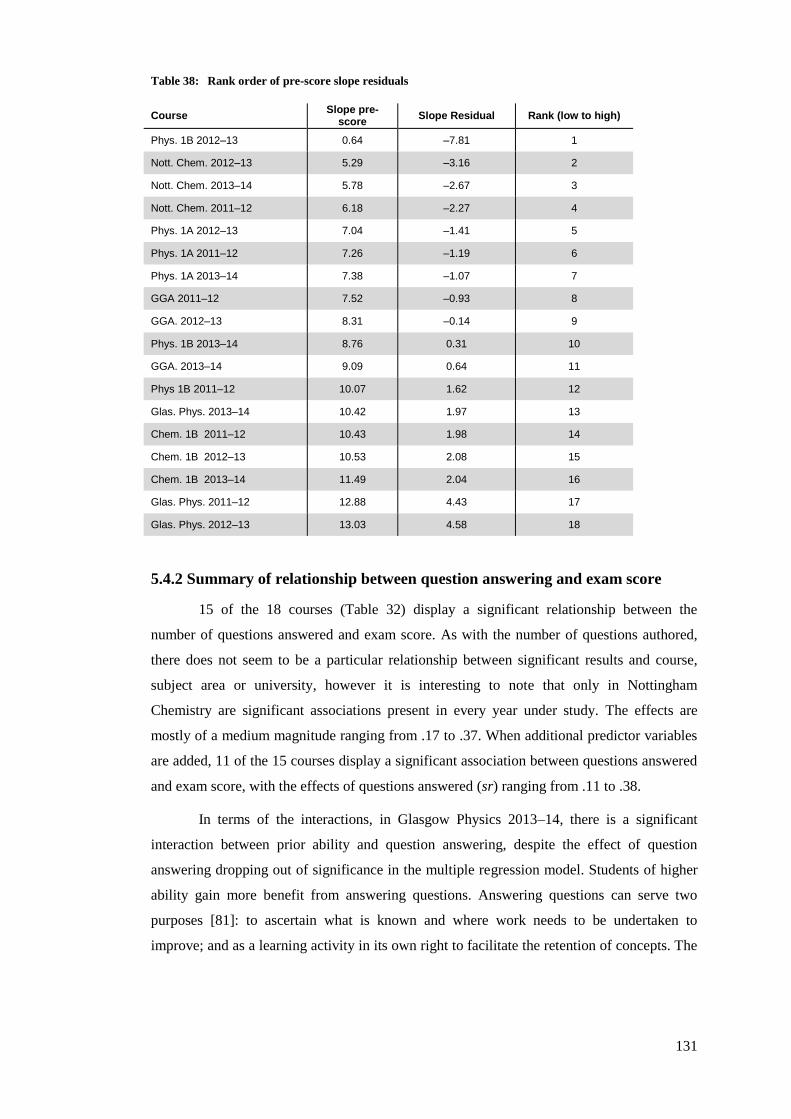
131
Table 38: Rank order of pre-score slope residuals
Course Slope pre-
score Slope Residual Rank (low to high)
Phys. 1B 2012–13 0.64 –7.81 1
Nott. Chem. 2012–13 5.29 –3.16 2
Nott. Chem. 2013–14 5.78 –2.67 3
Nott. Chem. 2011–12 6.18 –2.27 4
Phys. 1A 2012–13 7.04 –1.41 5
Phys. 1A 2011–12 7.26 –1.19 6
Phys. 1A 2013–14 7.38 –1.07 7
GGA 2011–12 7.52 –0.93 8
GGA. 2012–13 8.31 –0.14 9
Phys. 1B 2013–14 8.76 0.31 10
GGA. 2013–14 9.09 0.64 11
Phys 1B 2011–12 10.07 1.62 12
Glas. Phys. 2013–14 10.42 1.97 13
Chem. 1B 2011–12 10.43 1.98 14
Chem. 1B 2012–13 10.53 2.08 15
Chem. 1B 2013–14 11.49 2.04 16
Glas. Phys. 2011–12 12.88 4.43 17
Glas. Phys. 2012–13 13.03 4.58 18
5.4.2 Summary of relationship between question answering and exam score
15 of the 18 courses (Table 32) display a significant relationship between the
number of questions answered and exam score. As with the number of questions authored,
there does not seem to be a particular relationship between significant results and course,
subject area or university, however it is interesting to note that only in Nottingham
Chemistry are significant associations present in every year under study. The effects are
mostly of a medium magnitude ranging from .17 to .37. When additional predictor variables
are added, 11 of the 15 courses display a significant association between questions answered
and exam score, with the effects of questions answered (sr) ranging from .11 to .38.
In terms of the interactions, in Glasgow Physics 2013–14, there is a significant
interaction between prior ability and question answering, despite the effect of question
answering dropping out of significance in the multiple regression model. Students of higher
ability gain more benefit from answering questions. Answering questions can serve two
purposes [81]: to ascertain what is known and where work needs to be undertaken to
improve; and as a learning activity in its own right to facilitate the retention of concepts. The
132
positive effect of answering questions for higher ability students seems somewhat counter-
intuitive, however, it could be hypothesised that students of different ability levels use
question answering activities in different ways. Higher ability students may not need the
reinforcement of drill and practice. Rather, they may use the questions they answer as a
strategic tool to diagnose areas of weakness and target future study. In Nottingham
Chemistry in 2013–14, answering questions was of significant benefit to all students.
However, as perhaps expected, weaker students benefit from answering question more than
higher ability students.
That there are significant associations between answering questions and exam score
in at least one year of each course may be a little surprising given that most courses do not
have a multiple choice component. and despite the fact that past research has failed to
establish a correlation between drill and practice question answering and performance on
non-multiple choice components of the exam [117,122]. In Genes and Gene Action which
does have a multiple choice section, the correlations between the multiple choice score and
the number of question answered reflect the relationships between the overall score and the
number of questions answered.
In the multilevel model, question answering is significantly associated with exam
score – explaining a significant proportion of the course level variation in mean exam scores
– even when controlling for prior ability. The relationship between the number of questions
answered and exam score is constant and positive across courses, whilst, the relationship
between prior ability and exam score varies across courses.
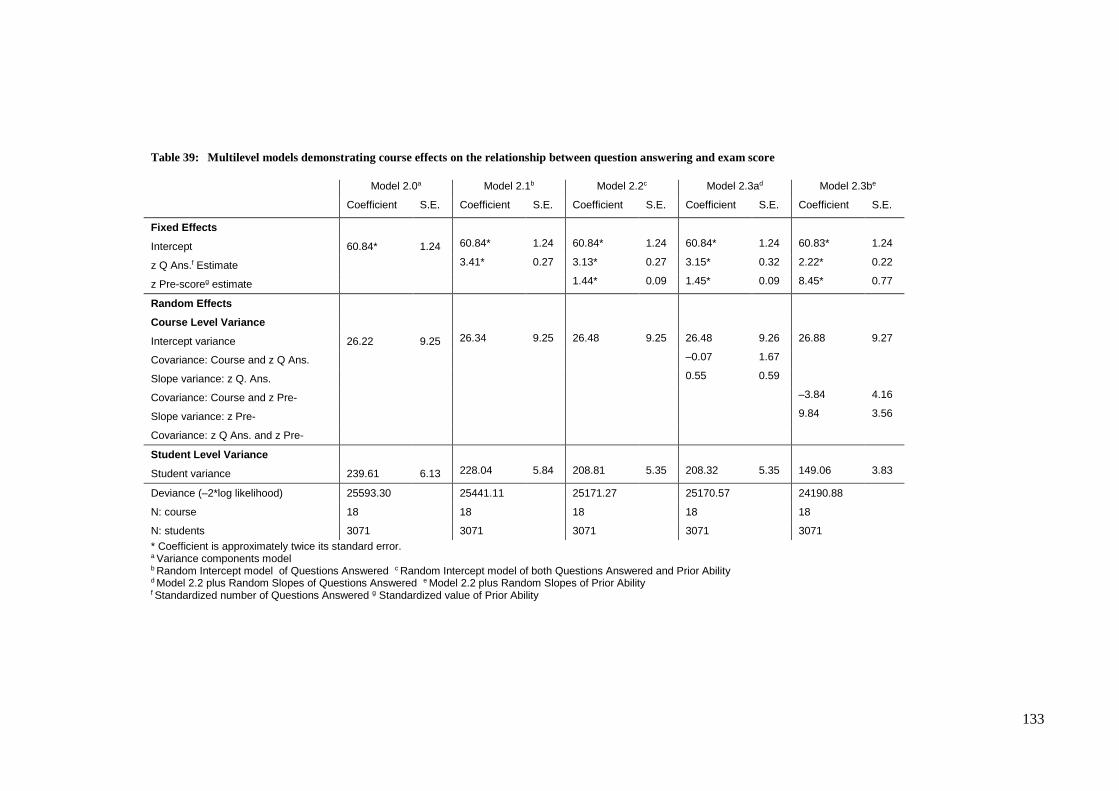
133
Table 39: Multilevel models demonstrating course effects on the relationship between question answering and exam score
Model 2.0a Model 2.1b Model 2.2c Model 2.3ad Model 2.3be
Coefficient S.E. Coefficient S.E. Coefficient S.E. Coefficient S.E. Coefficient S.E.
Fixed Effects
Intercept 60.84* 1.24 60.84* 1.24 60.84* 1.24 60.84* 1.24 60.83* 1.24
z Q Ans.f Estimate 3.41* 0.27 3.13* 0.27 3.15* 0.32 2.22* 0.22
z Pre-scoreg estimate 1.44* 0.09 1.45* 0.09 8.45* 0.77
Random Effects
Course Level Variance
Intercept variance 26.22 9.25 26.34 9.25 26.48 9.25 26.48 9.26 26.88 9.27
Covariance: Course and z Q Ans. –0.07 1.67
Slope variance: z Q. Ans. 0.55 0.59
Covariance: Course and z Pre- –3.84 4.16
Slope variance: z Pre- 9.84 3.56
Covariance: z Q Ans. and z Pre-
Student Level Variance
Student variance 239.61 6.13 228.04 5.84 208.81 5.35 208.32 5.35 149.06 3.83
Deviance (–2*log likelihood) 25593.30 25441.11 25171.27 25170.57 24190.88
N: course 18 18 18 18 18
N: students 3071 3071 3071 3071 3071
* Coefficient is approximately twice its standard error. a Variance components model b Random Intercept model of Questions Answered c Random Intercept model of both Questions Answered and Prior Ability d Model 2.2 plus Random Slopes of Questions Answered e Model 2.2 plus Random Slopes of Prior Ability f Standardized number of Questions Answered g Standardized value of Prior Ability

134
135
Chapter 6
Associations between commenting and student
performance
In the Chapter 4 quartile analysis, the character count of comments written by each
student was used to measure student engagement with giving feedback on PeerWise.
Although character count is a measure of quantity, it does not distinguish between the
student who writes one very long comment and the student who writes a number of smaller
comments, but who ultimately end up writing comments of the same total length. Moreover
using character count as a measure of engagement does not differentiate between the quality
of the comments – in terms of the level of analysis provided by the commenter. This section
aims to provide an overall picture of the quality of comments students write, and whether
giving or receiving quality comments is associated with end of course exam performance.
6.1 Comment coding
To determine the quality of comments made by students, each submitted comment
was categorised according to its level of sophistication. The number of comments at each
level of sophistication were summed for each student, to create a metric encapsulating the
types of comments written and received by them. Since the level of sophistication, or depth,
of comment is a key aspect of the analysis, it was essential to adopt a coding scheme with an
ordinal structure. There are myriad coding schemes that could have been applied, each
focusing on different aspects of the comment. Some schemes seek to identify levels of
critical thinking; whilst others look at the nature of social interactions – the purpose or
function of the comment [191]. Moreover, some of the previously adopted schemes permit
comments to fall under more than one category, and the coding structures are not always
ordinal in nature [88,104,191].
After an initial examination of the PeerWise comments, it became evident that
students commented, not only on the content of a question or in response to a previous
comment (criticising or extending the scope of prior submissions or giving further
136
information and insight), but that they often reflected upon their own ability and
understanding. The coding scheme adopted had to be flexible enough to allow comments
with different foci to be included. It also had to be easy to apply in a reliable manner across
18 courses (i.e. over 80,000 comments), and be general enough to be applicable to three
discrete subject areas. Gonyea and Gangi [192] highlight how coding schemes used in
published studies often lack transferablity to different contexts. It was therefore decided to
create a simple coding scheme where comments could be deemed to fall within the same
cognitive level, irrespective of differences in their focus or purpose.
The unit of analysis was each individual comment – the comment as a whole was
considered and, where more than one idea was expressed, it was coded at the highest
demonstrated level of sophistication. Although applying a single code to each comment may
result in a loss of detail about the comment, in the interests of reliability, and given the
number of comments to be coded, it was decided that in the first instance, this would be the
most appropriate methodology to use. The coding procedure was very loosely based on a
constant comparison method drawn from grounded theory [193]. 500 comments were
examined for sophistication. The categorisations were then applied to the next 500 comments
– any new types of comment were either absorbed into the new scheme or the scheme was
modified. Where the scheme was modified, previous comments were re-coded in light of this
information. It may be appropriate in future projects to further code all or some of the
comments according to a different protocol – perhaps focussing on substantive content or
related to the affective or cognitive nature of the comment.
6.1.1 Coding scheme
The first iteration of coding was undertaken using comments from Physics 1A 2012–
13. Saturation point of the types of comment had been reached by the time this course had
been coded, so the coding scheme was then applied to other courses from that academic year.
The original coding scheme is shown in Table 40, and comprised a seven-point scale. The
example comments have been taken from Physics 1A 2011–12.
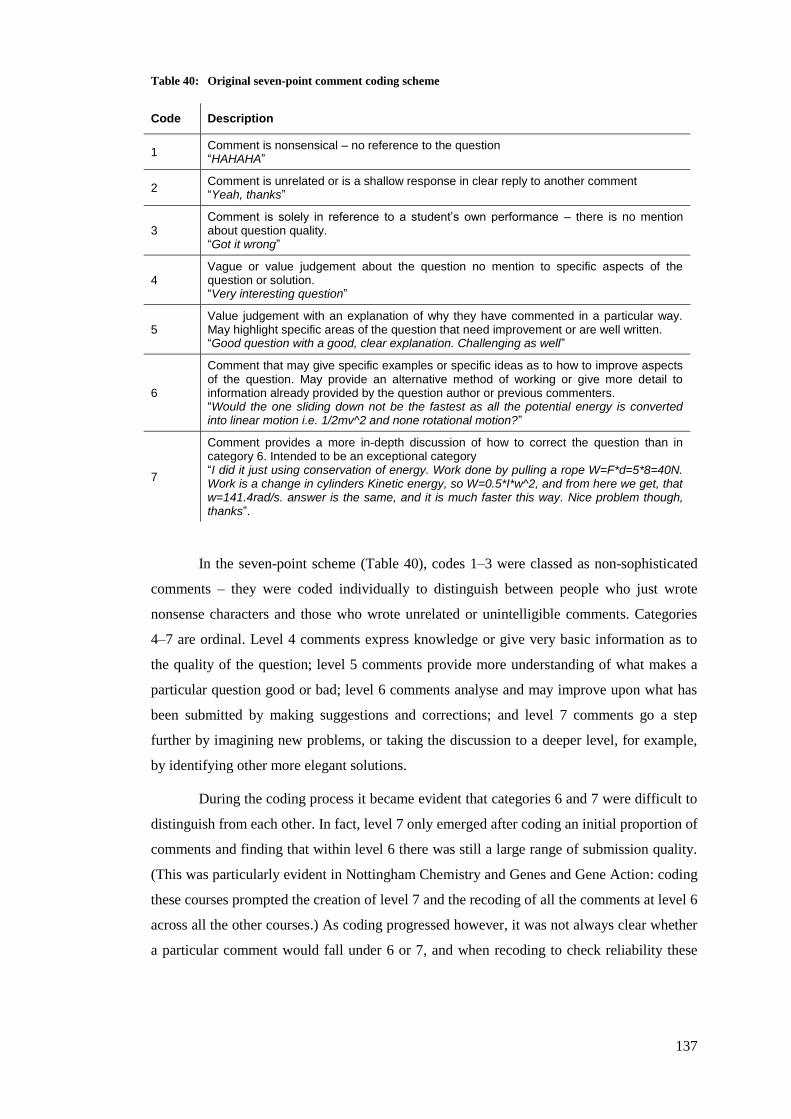
137
Table 40: Original seven-point comment coding scheme
Code Description
1 Comment is nonsensical – no reference to the question “HAHAHA”
2 Comment is unrelated or is a shallow response in clear reply to another comment “Yeah, thanks”
3 Comment is solely in reference to a student’s own performance – there is no mention about question quality. “Got it wrong”
4 Vague or value judgement about the question no mention to specific aspects of the question or solution. “Very interesting question”
5 Value judgement with an explanation of why they have commented in a particular way. May highlight specific areas of the question that need improvement or are well written. “Good question with a good, clear explanation. Challenging as well”
6
Comment that may give specific examples or specific ideas as to how to improve aspects of the question. May provide an alternative method of working or give more detail to information already provided by the question author or previous commenters. “Would the one sliding down not be the fastest as all the potential energy is converted into linear motion i.e. 1/2mv^2 and none rotational motion?”
7
Comment provides a more in-depth discussion of how to correct the question than in category 6. Intended to be an exceptional category “I did it just using conservation of energy. Work done by pulling a rope W=F*d=5*8=40N. Work is a change in cylinders Kinetic energy, so W=0.5*I*w^2, and from here we get, that w=141.4rad/s. answer is the same, and it is much faster this way. Nice problem though, thanks”.
In the seven-point scheme (Table 40), codes 1–3 were classed as non-sophisticated
comments – they were coded individually to distinguish between people who just wrote
nonsense characters and those who wrote unrelated or unintelligible comments. Categories
4–7 are ordinal. Level 4 comments express knowledge or give very basic information as to
the quality of the question; level 5 comments provide more understanding of what makes a
particular question good or bad; level 6 comments analyse and may improve upon what has
been submitted by making suggestions and corrections; and level 7 comments go a step
further by imagining new problems, or taking the discussion to a deeper level, for example,
by identifying other more elegant solutions.
During the coding process it became evident that categories 6 and 7 were difficult to
distinguish from each other. In fact, level 7 only emerged after coding an initial proportion of
comments and finding that within level 6 there was still a large range of submission quality.
(This was particularly evident in Nottingham Chemistry and Genes and Gene Action: coding
these courses prompted the creation of level 7 and the recoding of all the comments at level 6
across all the other courses.) As coding progressed however, it was not always clear whether
a particular comment would fall under 6 or 7, and when recoding to check reliability these
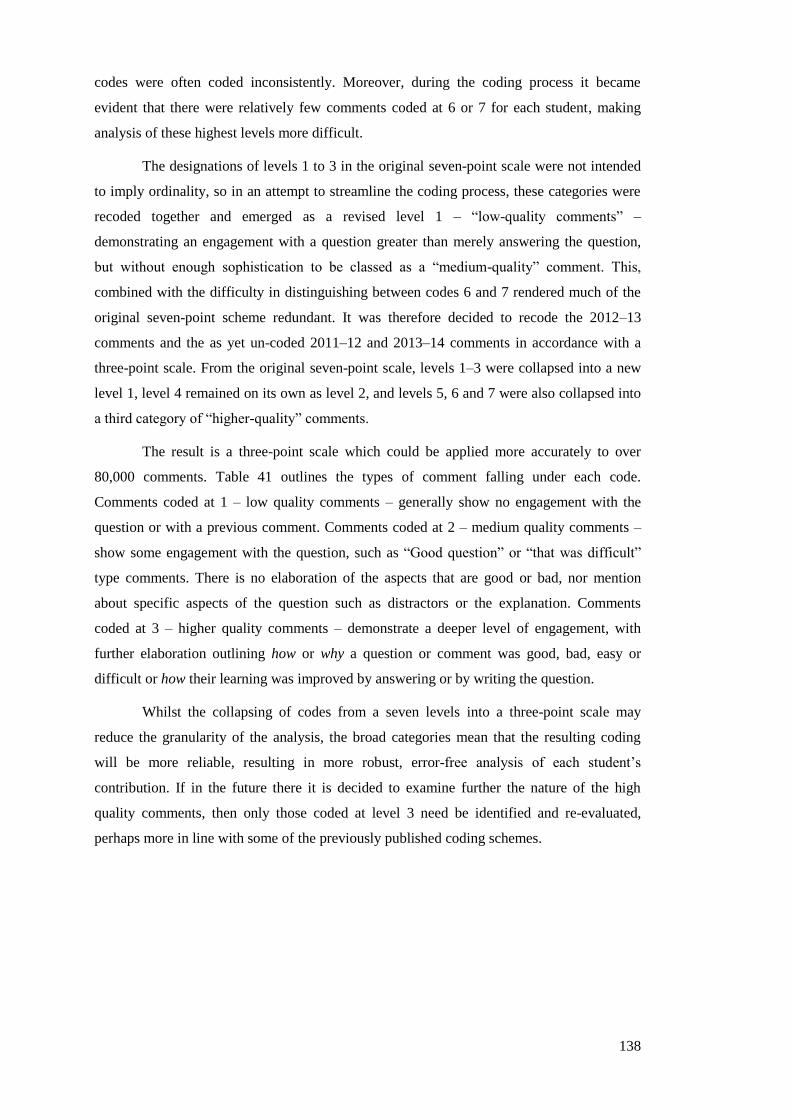
138
codes were often coded inconsistently. Moreover, during the coding process it became
evident that there were relatively few comments coded at 6 or 7 for each student, making
analysis of these highest levels more difficult.
The designations of levels 1 to 3 in the original seven-point scale were not intended
to imply ordinality, so in an attempt to streamline the coding process, these categories were
recoded together and emerged as a revised level 1 – “low-quality comments” –
demonstrating an engagement with a question greater than merely answering the question,
but without enough sophistication to be classed as a “medium-quality” comment. This,
combined with the difficulty in distinguishing between codes 6 and 7 rendered much of the
original seven-point scheme redundant. It was therefore decided to recode the 2012–13
comments and the as yet un-coded 2011–12 and 2013–14 comments in accordance with a
three-point scale. From the original seven-point scale, levels 1–3 were collapsed into a new
level 1, level 4 remained on its own as level 2, and levels 5, 6 and 7 were also collapsed into
a third category of “higher-quality” comments.
The result is a three-point scale which could be applied more accurately to over
80,000 comments. Table 41 outlines the types of comment falling under each code.
Comments coded at 1 – low quality comments – generally show no engagement with the
question or with a previous comment. Comments coded at 2 – medium quality comments –
show some engagement with the question, such as “Good question” or “that was difficult”
type comments. There is no elaboration of the aspects that are good or bad, nor mention
about specific aspects of the question such as distractors or the explanation. Comments
coded at 3 – higher quality comments – demonstrate a deeper level of engagement, with
further elaboration outlining how or why a question or comment was good, bad, easy or
difficult or how their learning was improved by answering or by writing the question.
Whilst the collapsing of codes from a seven levels into a three-point scale may
reduce the granularity of the analysis, the broad categories mean that the resulting coding
will be more reliable, resulting in more robust, error-free analysis of each student’s
contribution. If in the future there it is decided to examine further the nature of the high
quality comments, then only those coded at level 3 need be identified and re-evaluated,
perhaps more in line with some of the previously published coding schemes.
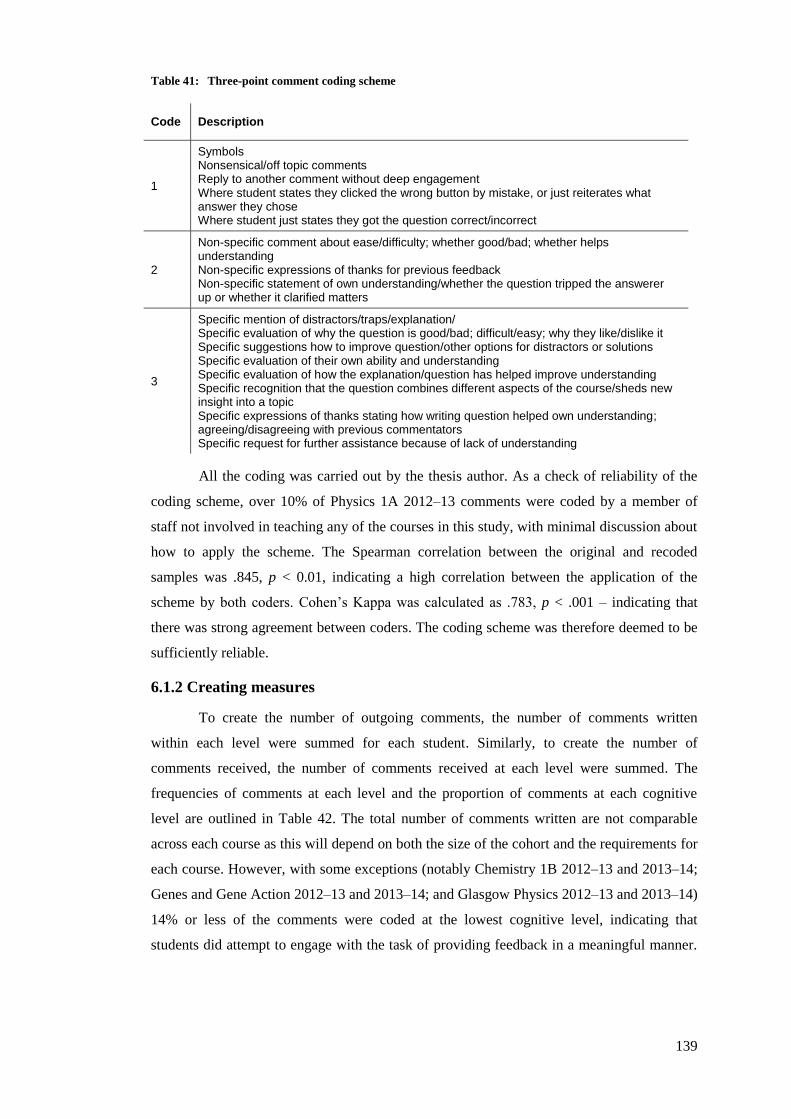
139
Table 41: Three-point comment coding scheme
Code Description
1
Symbols Nonsensical/off topic comments Reply to another comment without deep engagement Where student states they clicked the wrong button by mistake, or just reiterates what answer they chose Where student just states they got the question correct/incorrect
2
Non-specific comment about ease/difficulty; whether good/bad; whether helps understanding Non-specific expressions of thanks for previous feedback Non-specific statement of own understanding/whether the question tripped the answerer up or whether it clarified matters
3
Specific mention of distractors/traps/explanation/ Specific evaluation of why the question is good/bad; difficult/easy; why they like/dislike it Specific suggestions how to improve question/other options for distractors or solutions Specific evaluation of their own ability and understanding Specific evaluation of how the explanation/question has helped improve understanding Specific recognition that the question combines different aspects of the course/sheds new insight into a topic Specific expressions of thanks stating how writing question helped own understanding; agreeing/disagreeing with previous commentators Specific request for further assistance because of lack of understanding
All the coding was carried out by the thesis author. As a check of reliability of the
coding scheme, over 10% of Physics 1A 2012–13 comments were coded by a member of
staff not involved in teaching any of the courses in this study, with minimal discussion about
how to apply the scheme. The Spearman correlation between the original and recoded
samples was .845, p < 0.01, indicating a high correlation between the application of the
scheme by both coders. Cohen’s Kappa was calculated as .783, p < .001 – indicating that
there was strong agreement between coders. The coding scheme was therefore deemed to be
sufficiently reliable.
6.1.2 Creating measures
To create the number of outgoing comments, the number of comments written
within each level were summed for each student. Similarly, to create the number of
comments received, the number of comments received at each level were summed. The
frequencies of comments at each level and the proportion of comments at each cognitive
level are outlined in Table 42. The total number of comments written are not comparable
across each course as this will depend on both the size of the cohort and the requirements for
each course. However, with some exceptions (notably Chemistry 1B 2012–13 and 2013–14;
Genes and Gene Action 2012–13 and 2013–14; and Glasgow Physics 2012–13 and 2013–14)
14% or less of the comments were coded at the lowest cognitive level, indicating that
students did attempt to engage with the task of providing feedback in a meaningful manner.
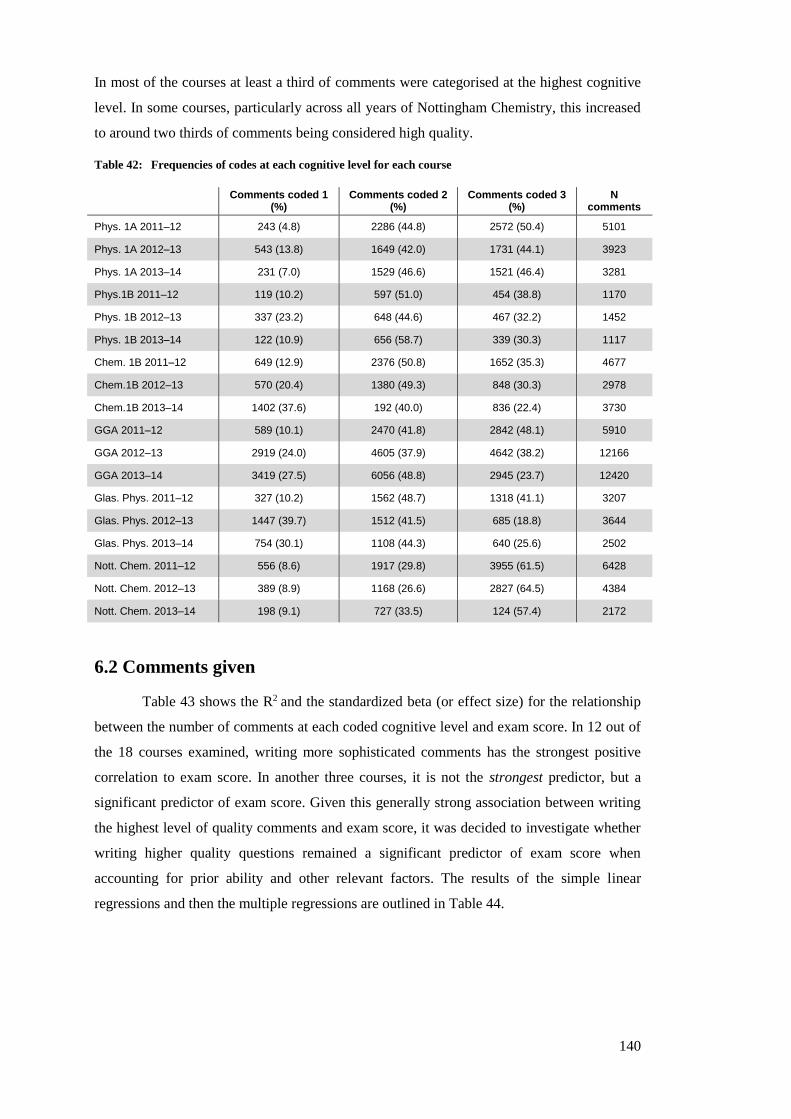
140
In most of the courses at least a third of comments were categorised at the highest cognitive
level. In some courses, particularly across all years of Nottingham Chemistry, this increased
to around two thirds of comments being considered high quality.
Table 42: Frequencies of codes at each cognitive level for each course
Comments coded 1
(%) Comments coded 2
(%) Comments coded 3
(%) N
comments
Phys. 1A 2011–12 243 (4.8) 2286 (44.8) 2572 (50.4) 5101
Phys. 1A 2012–13 543 (13.8) 1649 (42.0) 1731 (44.1) 3923
Phys. 1A 2013–14 231 (7.0) 1529 (46.6) 1521 (46.4) 3281
Phys.1B 2011–12 119 (10.2) 597 (51.0) 454 (38.8) 1170
Phys. 1B 2012–13 337 (23.2) 648 (44.6) 467 (32.2) 1452
Phys. 1B 2013–14 122 (10.9) 656 (58.7) 339 (30.3) 1117
Chem. 1B 2011–12 649 (12.9) 2376 (50.8) 1652 (35.3) 4677
Chem.1B 2012–13 570 (20.4) 1380 (49.3) 848 (30.3) 2978
Chem.1B 2013–14 1402 (37.6) 192 (40.0) 836 (22.4) 3730
GGA 2011–12 589 (10.1) 2470 (41.8) 2842 (48.1) 5910
GGA 2012–13 2919 (24.0) 4605 (37.9) 4642 (38.2) 12166
GGA 2013–14 3419 (27.5) 6056 (48.8) 2945 (23.7) 12420
Glas. Phys. 2011–12 327 (10.2) 1562 (48.7) 1318 (41.1) 3207
Glas. Phys. 2012–13 1447 (39.7) 1512 (41.5) 685 (18.8) 3644
Glas. Phys. 2013–14 754 (30.1) 1108 (44.3) 640 (25.6) 2502
Nott. Chem. 2011–12 556 (8.6) 1917 (29.8) 3955 (61.5) 6428
Nott. Chem. 2012–13 389 (8.9) 1168 (26.6) 2827 (64.5) 4384
Nott. Chem. 2013–14 198 (9.1) 727 (33.5) 124 (57.4) 2172
6.2 Comments given
Table 43 shows the R2 and the standardized beta (or effect size) for the relationship
between the number of comments at each coded cognitive level and exam score. In 12 out of
the 18 courses examined, writing more sophisticated comments has the strongest positive
correlation to exam score. In another three courses, it is not the strongest predictor, but a
significant predictor of exam score. Given this generally strong association between writing
the highest level of quality comments and exam score, it was decided to investigate whether
writing higher quality questions remained a significant predictor of exam score when
accounting for prior ability and other relevant factors. The results of the simple linear
regressions and then the multiple regressions are outlined in Table 44.
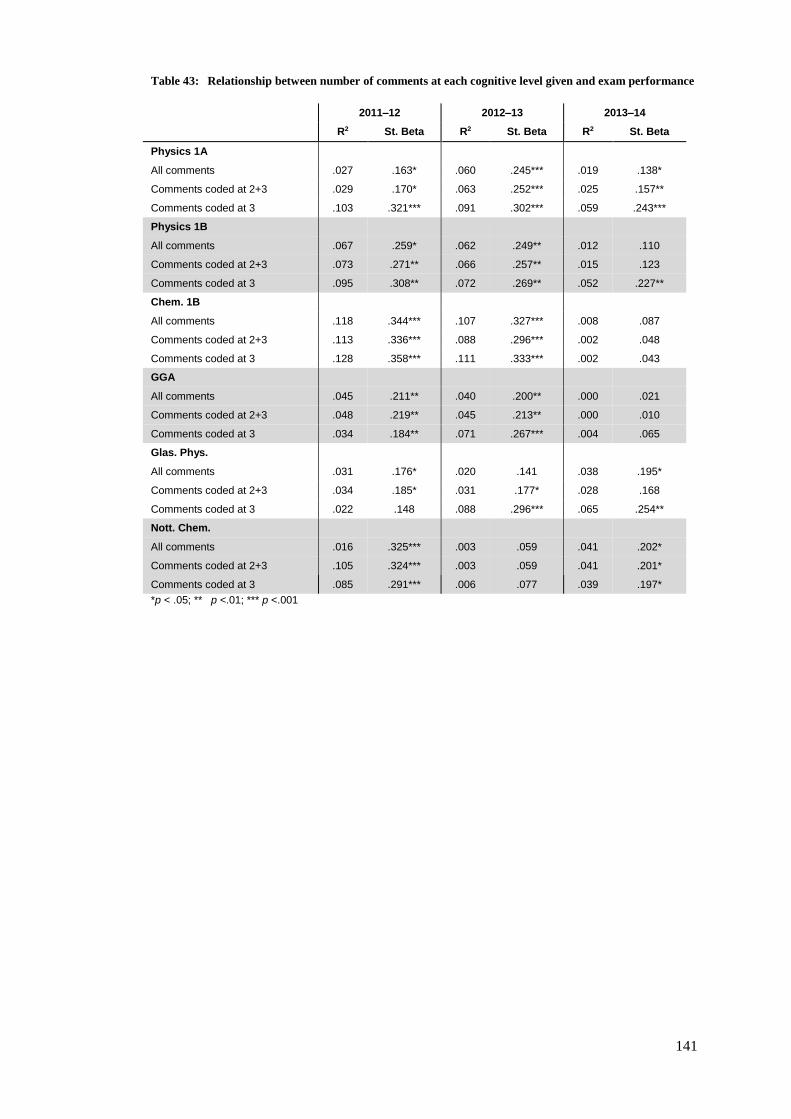
141
Table 43: Relationship between number of comments at each cognitive level given and exam performance
2011–12 2012–13 2013–14
R2 St. Beta R2 St. Beta R2 St. Beta
Physics 1A
All comments .027 .163* .060 .245*** .019 .138*
Comments coded at 2+3 .029 .170* .063 .252*** .025 .157**
Comments coded at 3 .103 .321*** .091 .302*** .059 .243***
Physics 1B
All comments .067 .259* .062 .249** .012 .110
Comments coded at 2+3 .073 .271** .066 .257** .015 .123
Comments coded at 3 .095 .308** .072 .269** .052 .227**
Chem. 1B
All comments .118 .344*** .107 .327*** .008 .087
Comments coded at 2+3 .113 .336*** .088 .296*** .002 .048
Comments coded at 3 .128 .358*** .111 .333*** .002 .043
GGA
All comments .045 .211** .040 .200** .000 .021
Comments coded at 2+3 .048 .219** .045 .213** .000 .010
Comments coded at 3 .034 .184** .071 .267*** .004 .065
Glas. Phys.
All comments .031 .176* .020 .141 .038 .195*
Comments coded at 2+3 .034 .185* .031 .177* .028 .168
Comments coded at 3 .022 .148 .088 .296*** .065 .254**
Nott. Chem.
All comments .016 .325*** .003 .059 .041 .202*
Comments coded at 2+3 .105 .324*** .003 .059 .041 .201*
Comments coded at 3 .085 .291*** .006 .077 .039 .197*
*p < .05; ** p <.01; *** p <.001
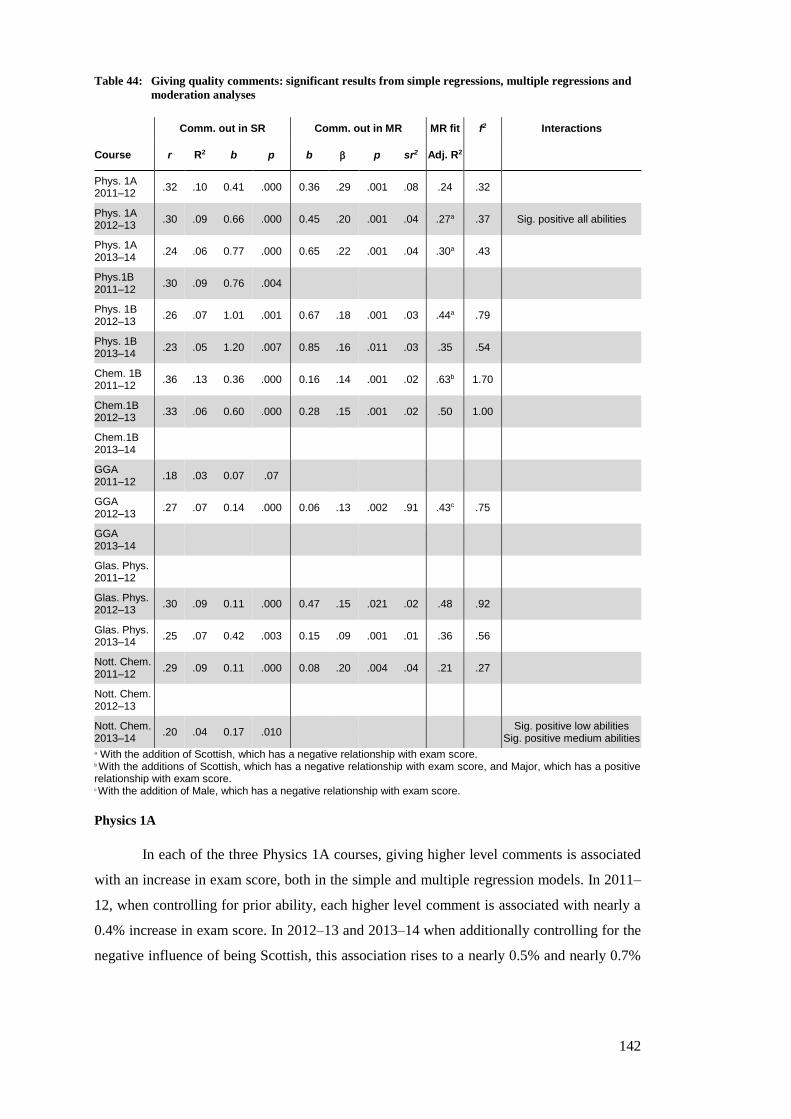
142
Table 44: Giving quality comments: significant results from simple regressions, multiple regressions and
moderation analyses
Comm. out in SR Comm. out in MR MR fit f2 Interactions
Course r R2 b p b p sr2 Adj. R2
Phys. 1A 2011–12
.32 .10 0.41 .000 0.36 .29 .001 .08 .24 .32
Phys. 1A 2012–13
.30 .09 0.66 .000 0.45 .20 .001 .04 .27a .37 Sig. positive all abilities
Phys. 1A 2013–14
.24 .06 0.77 .000 0.65 .22 .001 .04 .30a .43
Phys.1B 2011–12
.30 .09 0.76 .004
Phys. 1B 2012–13
.26 .07 1.01 .001 0.67 .18 .001 .03 .44a .79
Phys. 1B 2013–14
.23 .05 1.20 .007 0.85 .16 .011 .03 .35 .54
Chem. 1B 2011–12
.36 .13 0.36 .000 0.16 .14 .001 .02 .63b 1.70
Chem.1B 2012–13
.33 .06 0.60 .000 0.28 .15 .001 .02 .50 1.00
Chem.1B 2013–14
GGA 2011–12
.18 .03 0.07 .07
GGA 2012–13
.27 .07 0.14 .000 0.06 .13 .002 .91 .43c .75
GGA 2013–14
Glas. Phys. 2011–12
Glas. Phys. 2012–13
.30 .09 0.11 .000 0.47 .15 .021 .02 .48 .92
Glas. Phys. 2013–14
.25 .07 0.42 .003 0.15 .09 .001 .01 .36 .56
Nott. Chem. 2011–12
.29 .09 0.11 .000 0.08 .20 .004 .04 .21 .27
Nott. Chem. 2012–13
Nott. Chem. 2013–14
.20 .04 0.17 .010 Sig. positive low abilities
Sig. positive medium abilities
a With the addition of Scottish, which has a negative relationship with exam score. b With the additions of Scottish, which has a negative relationship with exam score, and Major, which has a positive relationship with exam score. c With the addition of Male, which has a negative relationship with exam score.
Physics 1A
In each of the three Physics 1A courses, giving higher level comments is associated
with an increase in exam score, both in the simple and multiple regression models. In 2011–
12, when controlling for prior ability, each higher level comment is associated with nearly a
0.4% increase in exam score. In 2012–13 and 2013–14 when additionally controlling for the
negative influence of being Scottish, this association rises to a nearly 0.5% and nearly 0.7%
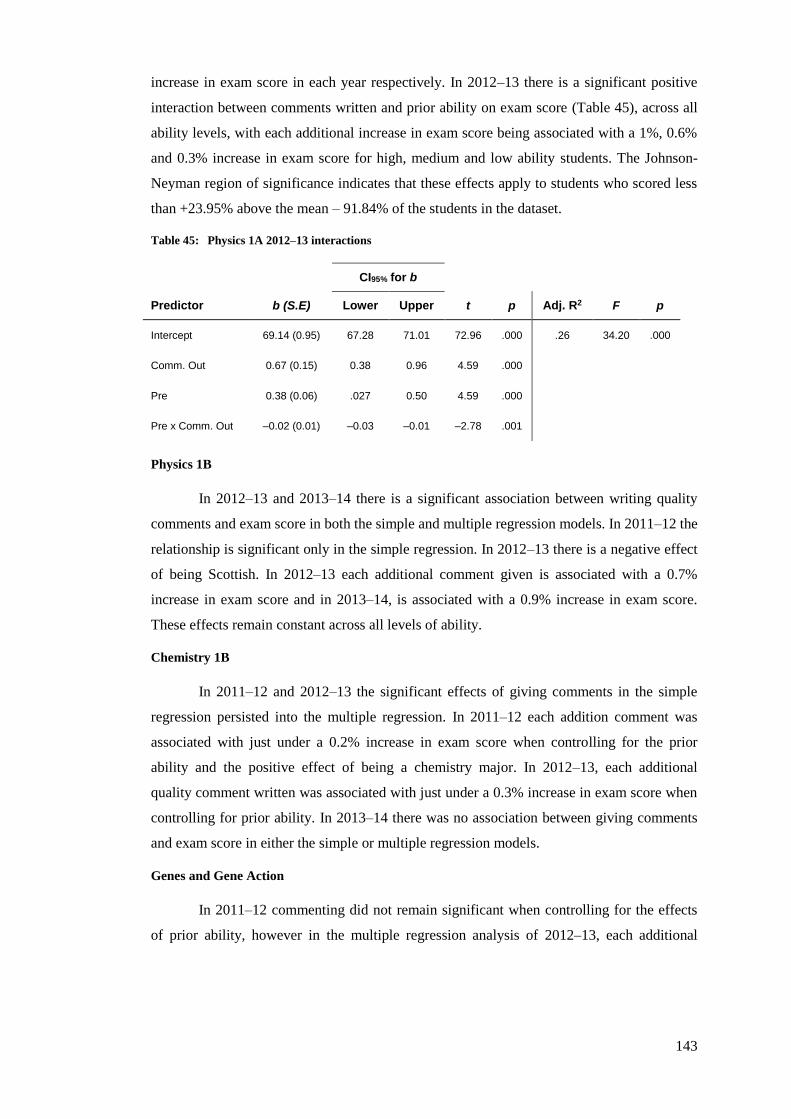
143
increase in exam score in each year respectively. In 2012–13 there is a significant positive
interaction between comments written and prior ability on exam score (Table 45), across all
ability levels, with each additional increase in exam score being associated with a 1%, 0.6%
and 0.3% increase in exam score for high, medium and low ability students. The Johnson-
Neyman region of significance indicates that these effects apply to students who scored less
than +23.95% above the mean – 91.84% of the students in the dataset.
Table 45: Physics 1A 2012–13 interactions
CI95% for b
Predictor b (S.E) Lower Upper t p Adj. R2 F p
Intercept 69.14 (0.95) 67.28 71.01 72.96 .000 .26 34.20 .000
Comm. Out 0.67 (0.15) 0.38 0.96 4.59 .000
Pre 0.38 (0.06) .027 0.50 4.59 .000
Pre x Comm. Out –0.02 (0.01) –0.03 –0.01 –2.78 .001
Physics 1B
In 2012–13 and 2013–14 there is a significant association between writing quality
comments and exam score in both the simple and multiple regression models. In 2011–12 the
relationship is significant only in the simple regression. In 2012–13 there is a negative effect
of being Scottish. In 2012–13 each additional comment given is associated with a 0.7%
increase in exam score and in 2013–14, is associated with a 0.9% increase in exam score.
These effects remain constant across all levels of ability.
Chemistry 1B
In 2011–12 and 2012–13 the significant effects of giving comments in the simple
regression persisted into the multiple regression. In 2011–12 each addition comment was
associated with just under a 0.2% increase in exam score when controlling for the prior
ability and the positive effect of being a chemistry major. In 2012–13, each additional
quality comment written was associated with just under a 0.3% increase in exam score when
controlling for prior ability. In 2013–14 there was no association between giving comments
and exam score in either the simple or multiple regression models.
Genes and Gene Action
In 2011–12 commenting did not remain significant when controlling for the effects
of prior ability, however in the multiple regression analysis of 2012–13, each additional
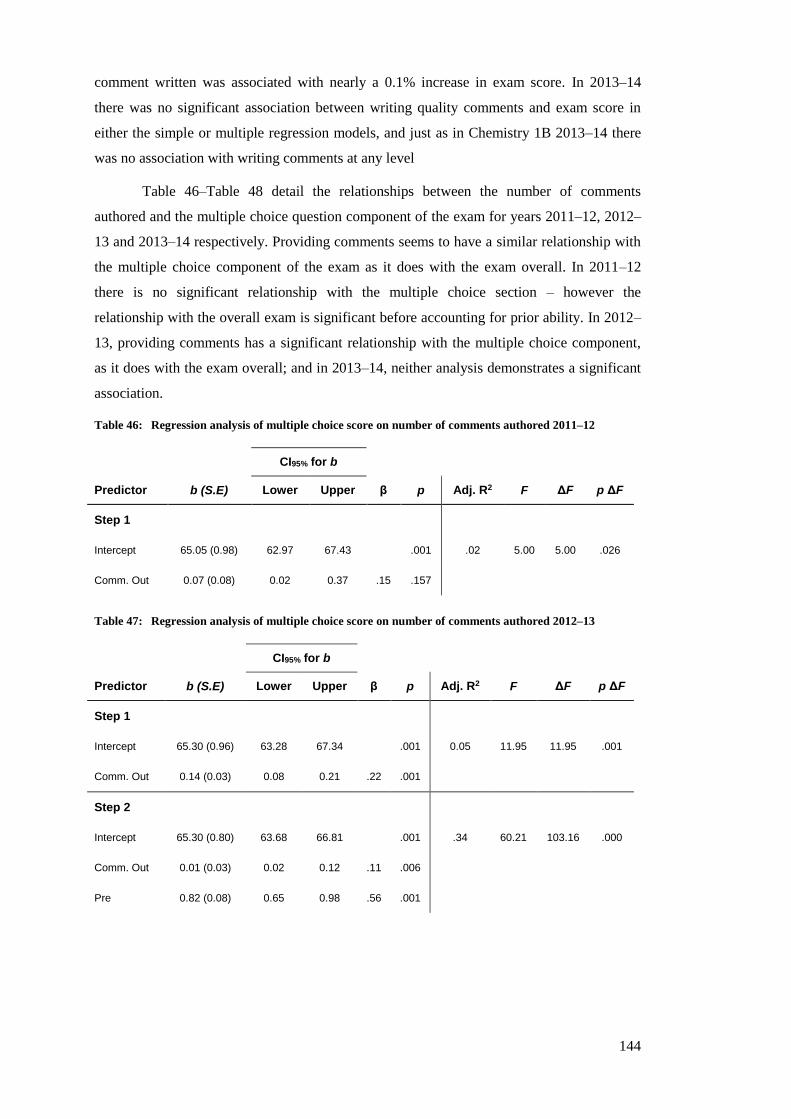
144
comment written was associated with nearly a 0.1% increase in exam score. In 2013–14
there was no significant association between writing quality comments and exam score in
either the simple or multiple regression models, and just as in Chemistry 1B 2013–14 there
was no association with writing comments at any level
Table 46–Table 48 detail the relationships between the number of comments
authored and the multiple choice question component of the exam for years 2011–12, 2012–
13 and 2013–14 respectively. Providing comments seems to have a similar relationship with
the multiple choice component of the exam as it does with the exam overall. In 2011–12
there is no significant relationship with the multiple choice section – however the
relationship with the overall exam is significant before accounting for prior ability. In 2012–
13, providing comments has a significant relationship with the multiple choice component,
as it does with the exam overall; and in 2013–14, neither analysis demonstrates a significant
association.
Table 46: Regression analysis of multiple choice score on number of comments authored 2011–12
CI95% for b
Predictor b (S.E) Lower Upper β p Adj. R2 F ΔF p ΔF
Step 1
Intercept 65.05 (0.98) 62.97 67.43 .001 .02 5.00 5.00 .026
Comm. Out 0.07 (0.08) 0.02 0.37 .15 .157
Table 47: Regression analysis of multiple choice score on number of comments authored 2012–13
CI95% for b
Predictor b (S.E) Lower Upper β p Adj. R2 F ΔF p ΔF
Step 1
Intercept 65.30 (0.96) 63.28 67.34 .001 0.05 11.95 11.95 .001
Comm. Out 0.14 (0.03) 0.08 0.21 .22 .001
Step 2
Intercept 65.30 (0.80) 63.68 66.81 .001 .34 60.21 103.16 .000
Comm. Out 0.01 (0.03) 0.02 0.12 .11 .006
Pre 0.82 (0.08) 0.65 0.98 .56 .001
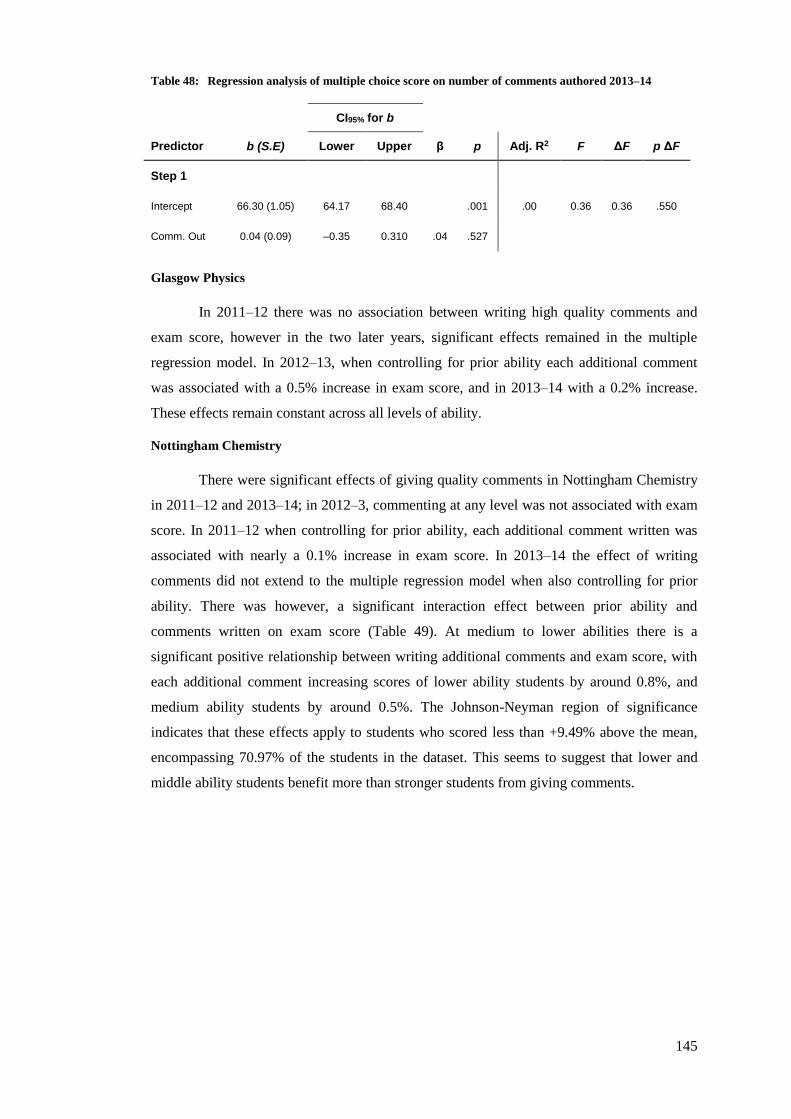
145
Table 48: Regression analysis of multiple choice score on number of comments authored 2013–14
CI95% for b
Predictor b (S.E) Lower Upper β p Adj. R2 F ΔF p ΔF
Step 1
Intercept 66.30 (1.05) 64.17 68.40 .001 .00 0.36 0.36 .550
Comm. Out 0.04 (0.09) –0.35 0.310 .04 .527
Glasgow Physics
In 2011–12 there was no association between writing high quality comments and
exam score, however in the two later years, significant effects remained in the multiple
regression model. In 2012–13, when controlling for prior ability each additional comment
was associated with a 0.5% increase in exam score, and in 2013–14 with a 0.2% increase.
These effects remain constant across all levels of ability.
Nottingham Chemistry
There were significant effects of giving quality comments in Nottingham Chemistry
in 2011–12 and 2013–14; in 2012–3, commenting at any level was not associated with exam
score. In 2011–12 when controlling for prior ability, each additional comment written was
associated with nearly a 0.1% increase in exam score. In 2013–14 the effect of writing
comments did not extend to the multiple regression model when also controlling for prior
ability. There was however, a significant interaction effect between prior ability and
comments written on exam score (Table 49). At medium to lower abilities there is a
significant positive relationship between writing additional comments and exam score, with
each additional comment increasing scores of lower ability students by around 0.8%, and
medium ability students by around 0.5%. The Johnson-Neyman region of significance
indicates that these effects apply to students who scored less than +9.49% above the mean,
encompassing 70.97% of the students in the dataset. This seems to suggest that lower and
middle ability students benefit more than stronger students from giving comments.
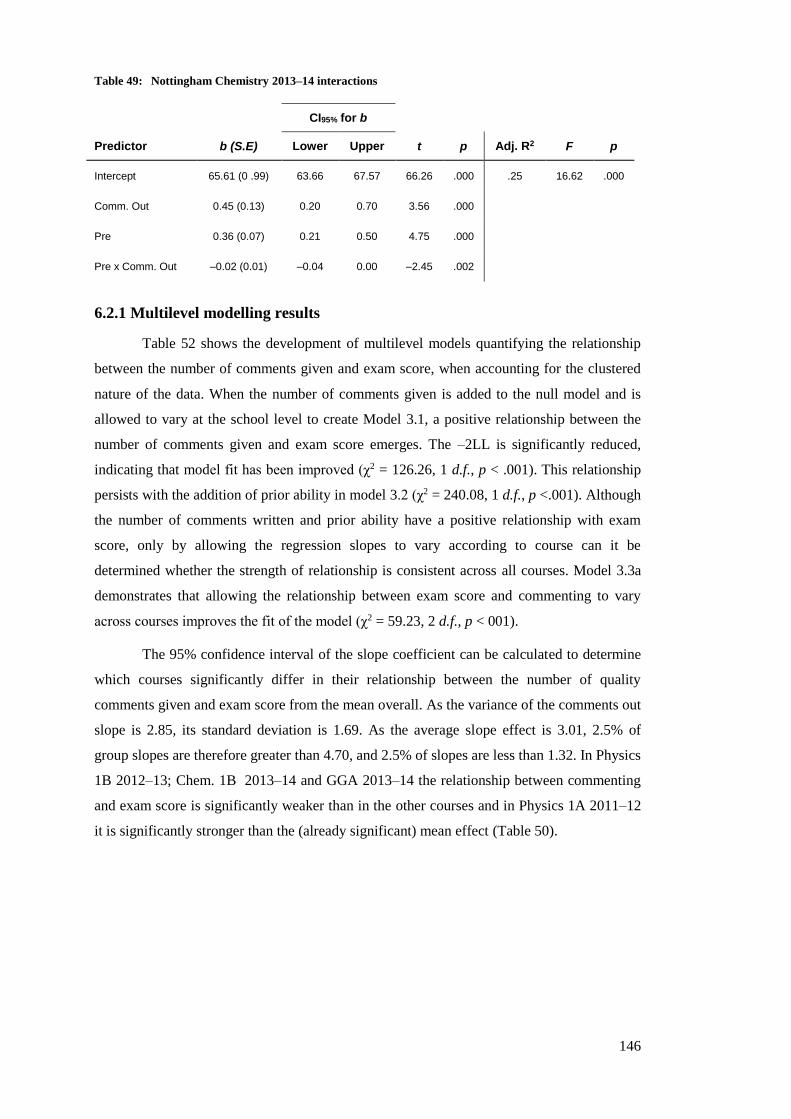
146
Table 49: Nottingham Chemistry 2013–14 interactions
CI95% for b
Predictor b (S.E) Lower Upper t p Adj. R2 F p
Intercept 65.61 (0 .99) 63.66 67.57 66.26 .000 .25 16.62 .000
Comm. Out 0.45 (0.13) 0.20 0.70 3.56 .000
Pre 0.36 (0.07) 0.21 0.50 4.75 .000
Pre x Comm. Out –0.02 (0.01) –0.04 0.00 –2.45 .002
6.2.1 Multilevel modelling results
Table 52 shows the development of multilevel models quantifying the relationship
between the number of comments given and exam score, when accounting for the clustered
nature of the data. When the number of comments given is added to the null model and is
allowed to vary at the school level to create Model 3.1, a positive relationship between the
number of comments given and exam score emerges. The –2LL is significantly reduced,
indicating that model fit has been improved (χ2 = 126.26, 1 d.f., p < .001). This relationship
persists with the addition of prior ability in model 3.2 (χ2 = 240.08, 1 d.f., p <.001). Although
the number of comments written and prior ability have a positive relationship with exam
score, only by allowing the regression slopes to vary according to course can it be
determined whether the strength of relationship is consistent across all courses. Model 3.3a
demonstrates that allowing the relationship between exam score and commenting to vary
across courses improves the fit of the model (χ2 = 59.23, 2 d.f., p < 001).
The 95% confidence interval of the slope coefficient can be calculated to determine
which courses significantly differ in their relationship between the number of quality
comments given and exam score from the mean overall. As the variance of the comments out
slope is 2.85, its standard deviation is 1.69. As the average slope effect is 3.01, 2.5% of
group slopes are therefore greater than 4.70, and 2.5% of slopes are less than 1.32. In Physics
1B 2012–13; Chem. 1B 2013–14 and GGA 2013–14 the relationship between commenting
and exam score is significantly weaker than in the other courses and in Physics 1A 2011–12
it is significantly stronger than the (already significant) mean effect (Table 50).
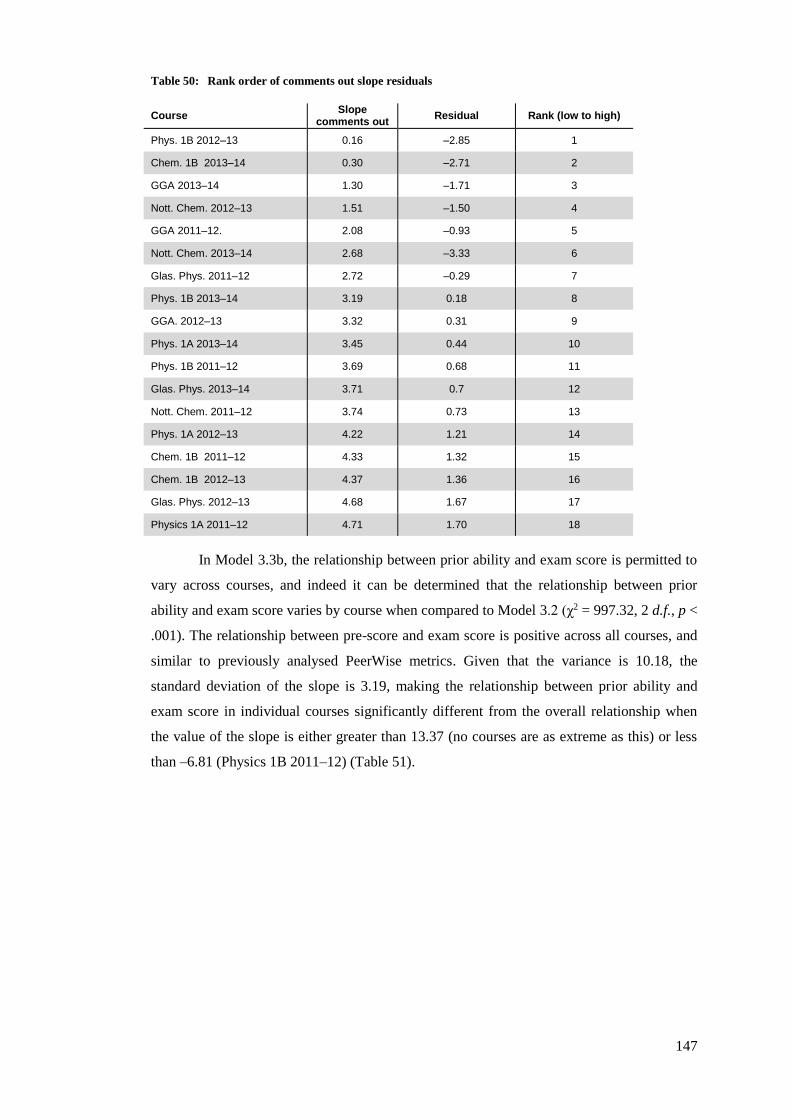
147
Table 50: Rank order of comments out slope residuals
Course Slope
comments out Residual Rank (low to high)
Phys. 1B 2012–13 0.16 –2.85 1
Chem. 1B 2013–14 0.30 –2.71 2
GGA 2013–14 1.30 –1.71 3
Nott. Chem. 2012–13 1.51 –1.50 4
GGA 2011–12. 2.08 –0.93 5
Nott. Chem. 2013–14 2.68 –3.33 6
Glas. Phys. 2011–12 2.72 –0.29 7
Phys. 1B 2013–14 3.19 0.18 8
GGA. 2012–13 3.32 0.31 9
Phys. 1A 2013–14 3.45 0.44 10
Phys. 1B 2011–12 3.69 0.68 11
Glas. Phys. 2013–14 3.71 0.7 12
Nott. Chem. 2011–12 3.74 0.73 13
Phys. 1A 2012–13 4.22 1.21 14
Chem. 1B 2011–12 4.33 1.32 15
Chem. 1B 2012–13 4.37 1.36 16
Glas. Phys. 2012–13 4.68 1.67 17
Physics 1A 2011–12 4.71 1.70 18
In Model 3.3b, the relationship between prior ability and exam score is permitted to
vary across courses, and indeed it can be determined that the relationship between prior
ability and exam score varies by course when compared to Model 3.2 (χ2 = 997.32, 2 d.f., p <
.001). The relationship between pre-score and exam score is positive across all courses, and
similar to previously analysed PeerWise metrics. Given that the variance is 10.18, the
standard deviation of the slope is 3.19, making the relationship between prior ability and
exam score in individual courses significantly different from the overall relationship when
the value of the slope is either greater than 13.37 (no courses are as extreme as this) or less
than –6.81 (Physics 1B 2011–12) (Table 51).
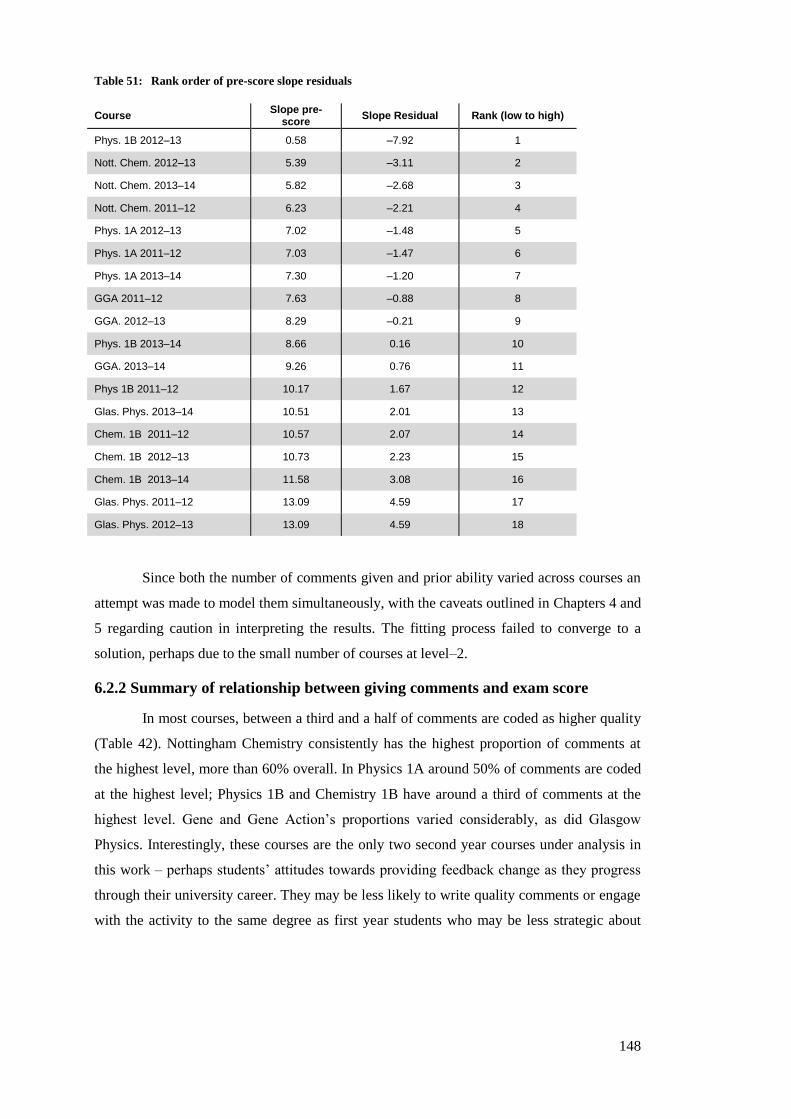
148
Table 51: Rank order of pre-score slope residuals
Course Slope pre-
score Slope Residual Rank (low to high)
Phys. 1B 2012–13 0.58 –7.92 1
Nott. Chem. 2012–13 5.39 –3.11 2
Nott. Chem. 2013–14 5.82 –2.68 3
Nott. Chem. 2011–12 6.23 –2.21 4
Phys. 1A 2012–13 7.02 –1.48 5
Phys. 1A 2011–12 7.03 –1.47 6
Phys. 1A 2013–14 7.30 –1.20 7
GGA 2011–12 7.63 –0.88 8
GGA. 2012–13 8.29 –0.21 9
Phys. 1B 2013–14 8.66 0.16 10
GGA. 2013–14 9.26 0.76 11
Phys 1B 2011–12 10.17 1.67 12
Glas. Phys. 2013–14 10.51 2.01 13
Chem. 1B 2011–12 10.57 2.07 14
Chem. 1B 2012–13 10.73 2.23 15
Chem. 1B 2013–14 11.58 3.08 16
Glas. Phys. 2011–12 13.09 4.59 17
Glas. Phys. 2012–13 13.09 4.59 18
Since both the number of comments given and prior ability varied across courses an
attempt was made to model them simultaneously, with the caveats outlined in Chapters 4 and
5 regarding caution in interpreting the results. The fitting process failed to converge to a
solution, perhaps due to the small number of courses at level–2.
6.2.2 Summary of relationship between giving comments and exam score
In most courses, between a third and a half of comments are coded as higher quality
(Table 42). Nottingham Chemistry consistently has the highest proportion of comments at
the highest level, more than 60% overall. In Physics 1A around 50% of comments are coded
at the highest level; Physics 1B and Chemistry 1B have around a third of comments at the
highest level. Gene and Gene Action’s proportions varied considerably, as did Glasgow
Physics. Interestingly, these courses are the only two second year courses under analysis in
this work – perhaps students’ attitudes towards providing feedback change as they progress
through their university career. They may be less likely to write quality comments or engage
with the activity to the same degree as first year students who may be less strategic about
149
focussing their efforts, or students may simply be more compliant in their first year –
perhaps a hangover from their secondary schooling.
Table 44 shows that 14 of the 18 courses have a significant association between the
number of comments given and exam score. Effect sizes range from .18 to .36, with
providing quality comments explaining between 3% and 13% of variance in exam score.
Although there is not a clear pattern in the instances of significant associations, courses
hosted at Edinburgh seem to have more instances of positive associations in both the simple
and multiple regression models than courses from other institutions.
When other predictor variables are added to the models, 11 out of the 14 courses
maintain the significant relationship between giving comments and exam score. When
interaction effects between writing comments and prior ability are tested, only in Physics 1A
2012–13 and in Nottingham Chemistry 2013–14 do the effects of giving comments on exam
score vary by ability. In Physics 1A, students of all ability levels benefit from writing
comments, however this benefit is greatest for higher ability students. In Nottingham, there
is a significant positive effect of writing comments for students of low and medium ability.
In the multilevel models the fixed relationship between writing comments and exam
score is significant, even when controlling for prior ability. When the slope of the comments
given variable is allowed to vary, the model fit improves significantly, indicating that there is
a significant difference across courses in the relationship between exam score and the
number of comments given. Similarly, as in the previous analyses, when prior ability is
allowed to vary across courses, differences in the relationships between pre-score and exam
score are evident.
Overall it is clear that giving quality feedback is positively associated with exam
score. This is the first time that the relationship between giving feedback on PeerWise and
exam performance has been specifically examined. However, similar relationships have been
demonstrated in the wider literature analysing the effects of feedback on attainment, where it
has been established that providing quality feedback is often associated with improved
performance [89,101,105] – ascribed to the development of higher-order skills such as
questioning, explaining and critiquing others’ work [88].
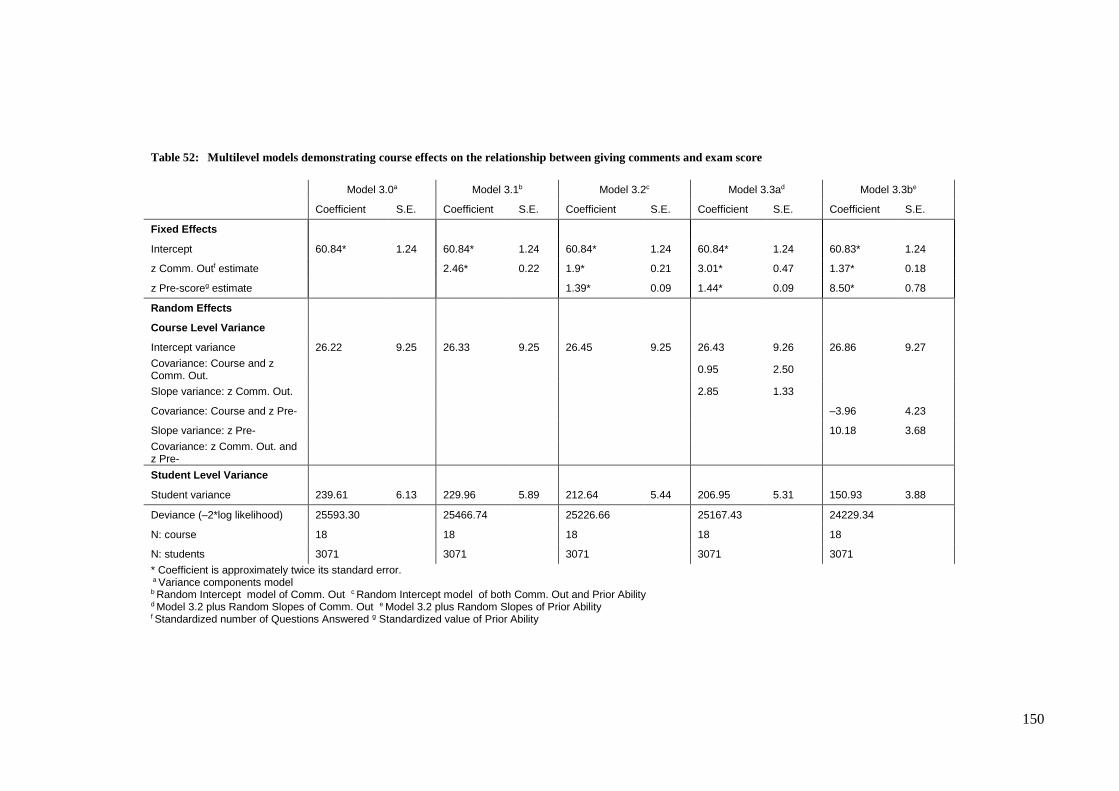
150
Table 52: Multilevel models demonstrating course effects on the relationship between giving comments and exam score
Model 3.0a Model 3.1b Model 3.2c Model 3.3ad Model 3.3be
Coefficient S.E. Coefficient S.E. Coefficient S.E. Coefficient S.E. Coefficient S.E.
Fixed Effects
Intercept 60.84* 1.24 60.84* 1.24 60.84* 1.24 60.84* 1.24 60.83* 1.24
z Comm. Outf estimate 2.46* 0.22 1.9* 0.21 3.01* 0.47 1.37* 0.18
z Pre-scoreg estimate 1.39* 0.09 1.44* 0.09 8.50* 0.78
Random Effects
Course Level Variance
Intercept variance 26.22 9.25 26.33 9.25 26.45 9.25 26.43 9.26 26.86 9.27
Covariance: Course and z Comm. Out.
0.95 2.50
Slope variance: z Comm. Out. 2.85 1.33
Covariance: Course and z Pre- –3.96 4.23
Slope variance: z Pre- 10.18 3.68
Covariance: z Comm. Out. and z Pre-
Student Level Variance
Student variance 239.61 6.13 229.96 5.89 212.64 5.44 206.95 5.31 150.93 3.88
Deviance (–2*log likelihood) 25593.30 25466.74 25226.66 25167.43 24229.34
N: course 18 18 18 18 18
N: students 3071 3071 3071 3071 3071
* Coefficient is approximately twice its standard error. a Variance components model b Random Intercept model of Comm. Out c Random Intercept model of both Comm. Out and Prior Ability d Model 3.2 plus Random Slopes of Comm. Out e Model 3.2 plus Random Slopes of Prior Ability f Standardized number of Questions Answered g Standardized value of Prior Ability
151
6.3 Comments received
Since providing quality feedback is associated with higher exam score, the question
that logically follows is whether receiving quality comments is also associated with exam
score. Although students must engage with feedback in order for it to provide benefit, before
students can consider the feedback, it has to have been provided in the first place. Assessing
the extent to which feedback has been reflected upon is however beyond the scope of this
work, so, in the same manner as the analysis of the comments given, Table 53 outlines the
relationships between receiving comments at each cognitive level and exam score. Receiving
comments (of any quality) is not as strongly associated with exam score as giving comments,
and in fact there do seem to be some courses where there is never an association between
receiving comments and exam score. This could be for two reasons: firstly giving comments
may be more cognitively demanding and therefore more likely to develop understanding;
and secondly students often fail to implement feedback that has been received, therefore
negating any benefit. That said, in 13 out of 18 courses, receiving high quality comments is
significantly associated with exam score.
Table 49 outlines the results from the regression analyses where, just as in the case
of comments given, exam score is regressed on the number of high quality comments
received. The results for each course are discussed in greater depth in the subsequent
sections.
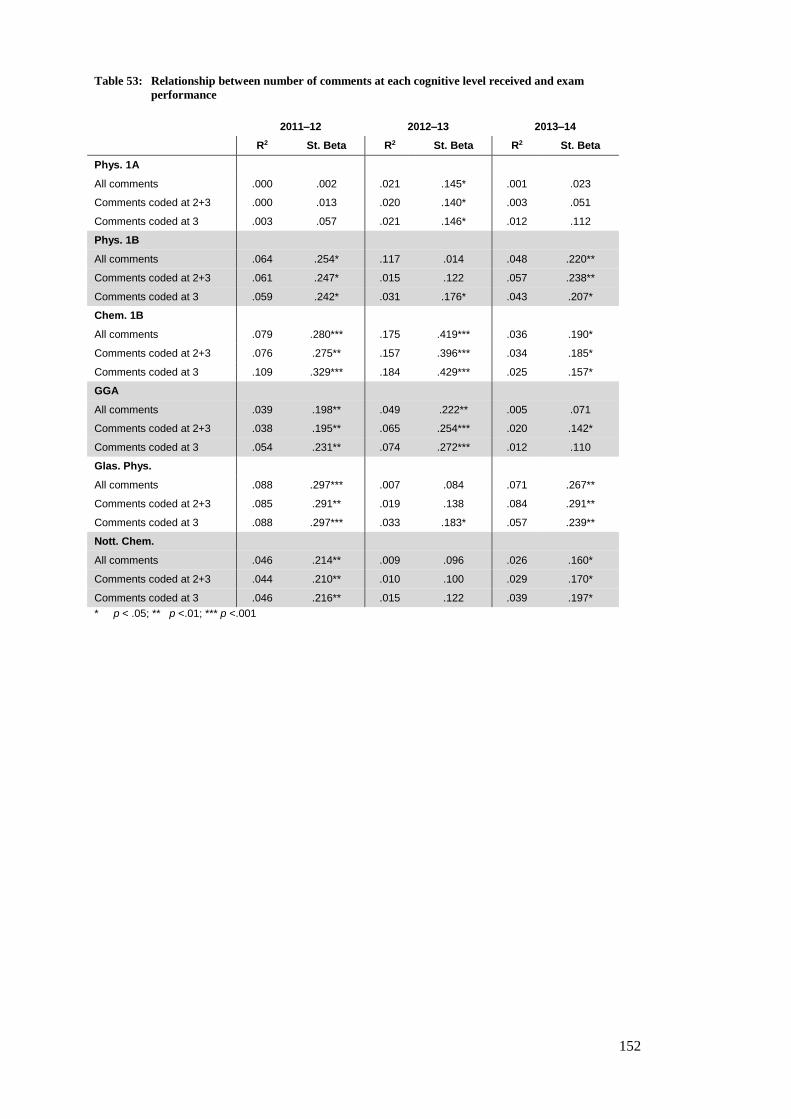
152
Table 53: Relationship between number of comments at each cognitive level received and exam
performance
2011–12 2012–13 2013–14
R2 St. Beta R2 St. Beta R2 St. Beta
Phys. 1A
All comments .000 .002 .021 .145* .001 .023
Comments coded at 2+3 .000 .013 .020 .140* .003 .051
Comments coded at 3 .003 .057 .021 .146* .012 .112
Phys. 1B
All comments .064 .254* .117 .014 .048 .220**
Comments coded at 2+3 .061 .247* .015 .122 .057 .238**
Comments coded at 3 .059 .242* .031 .176* .043 .207*
Chem. 1B
All comments .079 .280*** .175 .419*** .036 .190*
Comments coded at 2+3 .076 .275** .157 .396*** .034 .185*
Comments coded at 3 .109 .329*** .184 .429*** .025 .157*
GGA
All comments .039 .198** .049 .222** .005 .071
Comments coded at 2+3 .038 .195** .065 .254*** .020 .142*
Comments coded at 3 .054 .231** .074 .272*** .012 .110
Glas. Phys.
All comments .088 .297*** .007 .084 .071 .267**
Comments coded at 2+3 .085 .291** .019 .138 .084 .291**
Comments coded at 3 .088 .297*** .033 .183* .057 .239**
Nott. Chem.
All comments .046 .214** .009 .096 .026 .160*
Comments coded at 2+3 .044 .210** .010 .100 .029 .170*
Comments coded at 3 .046 .216** .015 .122 .039 .197*
* p < .05; ** p <.01; *** p <.001
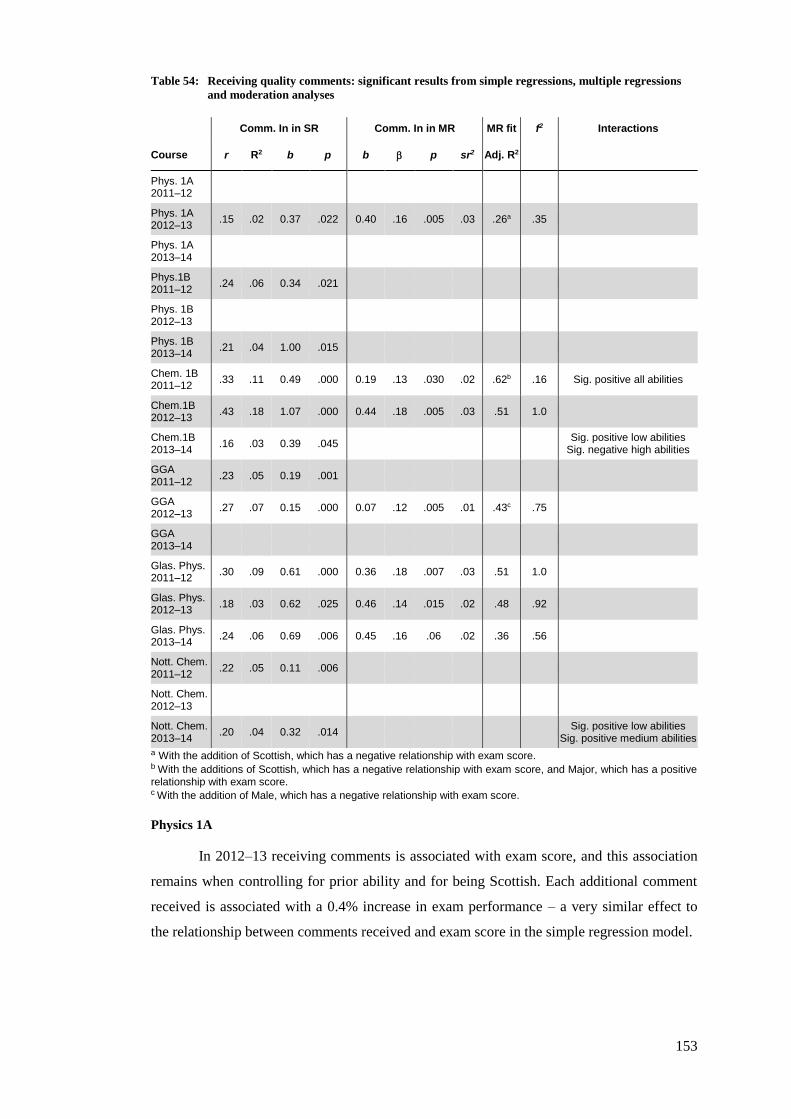
153
Table 54: Receiving quality comments: significant results from simple regressions, multiple regressions
and moderation analyses
Comm. In in SR Comm. In in MR MR fit f2 Interactions
Course r R2 b p b p sr2 Adj. R2
Phys. 1A 2011–12
Phys. 1A 2012–13
.15 .02 0.37 .022 0.40 .16 .005 .03 .26a .35
Phys. 1A 2013–14
Phys.1B 2011–12
.24 .06 0.34 .021
Phys. 1B 2012–13
Phys. 1B 2013–14
.21 .04 1.00 .015
Chem. 1B 2011–12
.33 .11 0.49 .000 0.19 .13 .030 .02 .62b .16 Sig. positive all abilities
Chem.1B 2012–13
.43 .18 1.07 .000 0.44 .18 .005 .03 .51 1.0
Chem.1B 2013–14
.16 .03 0.39 .045 Sig. positive low abilities
Sig. negative high abilities
GGA 2011–12
.23 .05 0.19 .001
GGA 2012–13
.27 .07 0.15 .000 0.07 .12 .005 .01 .43c .75
GGA 2013–14
Glas. Phys. 2011–12
.30 .09 0.61 .000 0.36 .18 .007 .03 .51 1.0
Glas. Phys. 2012–13
.18 .03 0.62 .025 0.46 .14 .015 .02 .48 .92
Glas. Phys. 2013–14
.24 .06 0.69 .006 0.45 .16 .06 .02 .36 .56
Nott. Chem. 2011–12
.22 .05 0.11 .006
Nott. Chem. 2012–13
Nott. Chem. 2013–14
.20 .04 0.32 .014 Sig. positive low abilities
Sig. positive medium abilities
a With the addition of Scottish, which has a negative relationship with exam score. b With the additions of Scottish, which has a negative relationship with exam score, and Major, which has a positive relationship with exam score. c With the addition of Male, which has a negative relationship with exam score.
Physics 1A
In 2012–13 receiving comments is associated with exam score, and this association
remains when controlling for prior ability and for being Scottish. Each additional comment
received is associated with a 0.4% increase in exam performance – a very similar effect to
the relationship between comments received and exam score in the simple regression model.
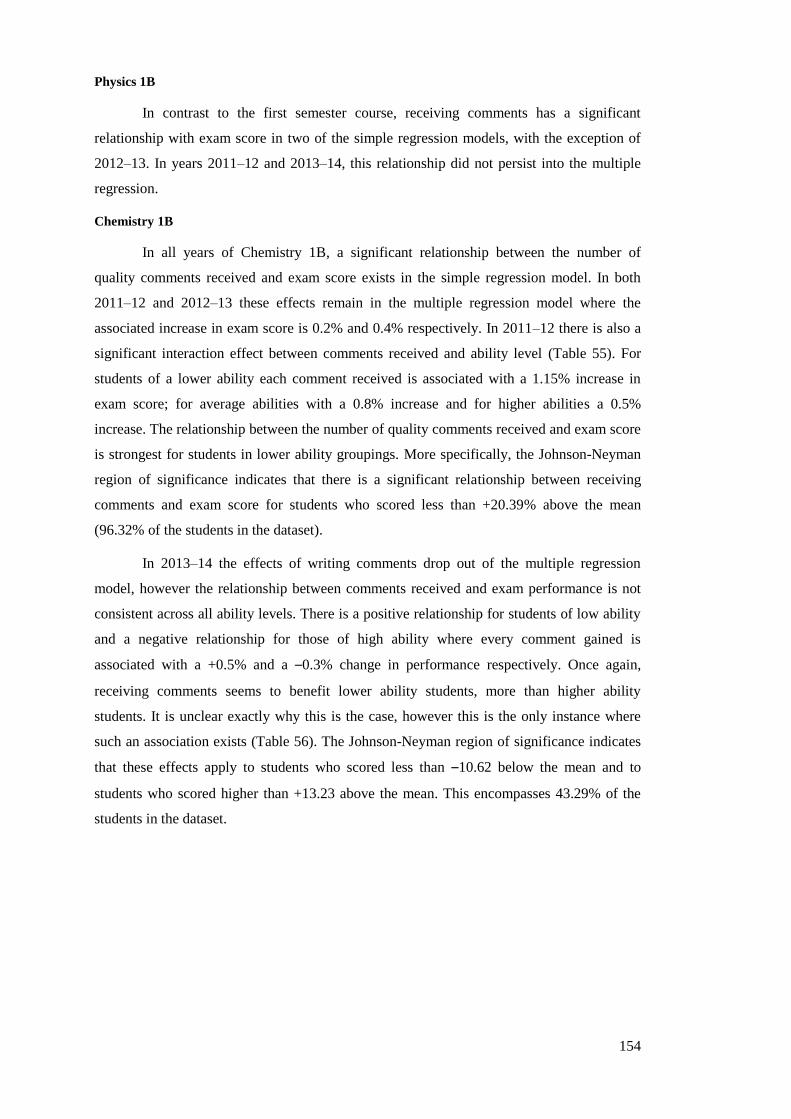
154
Physics 1B
In contrast to the first semester course, receiving comments has a significant
relationship with exam score in two of the simple regression models, with the exception of
2012–13. In years 2011–12 and 2013–14, this relationship did not persist into the multiple
regression.
Chemistry 1B
In all years of Chemistry 1B, a significant relationship between the number of
quality comments received and exam score exists in the simple regression model. In both
2011–12 and 2012–13 these effects remain in the multiple regression model where the
associated increase in exam score is 0.2% and 0.4% respectively. In 2011–12 there is also a
significant interaction effect between comments received and ability level (Table 55). For
students of a lower ability each comment received is associated with a 1.15% increase in
exam score; for average abilities with a 0.8% increase and for higher abilities a 0.5%
increase. The relationship between the number of quality comments received and exam score
is strongest for students in lower ability groupings. More specifically, the Johnson-Neyman
region of significance indicates that there is a significant relationship between receiving
comments and exam score for students who scored less than +20.39% above the mean
(96.32% of the students in the dataset).
In 2013–14 the effects of writing comments drop out of the multiple regression
model, however the relationship between comments received and exam performance is not
consistent across all ability levels. There is a positive relationship for students of low ability
and a negative relationship for those of high ability where every comment gained is
associated with a +0.5% and a –0.3% change in performance respectively. Once again,
receiving comments seems to benefit lower ability students, more than higher ability
students. It is unclear exactly why this is the case, however this is the only instance where
such an association exists (Table 56). The Johnson-Neyman region of significance indicates
that these effects apply to students who scored less than –10.62 below the mean and to
students who scored higher than +13.23 above the mean. This encompasses 43.29% of the
students in the dataset.
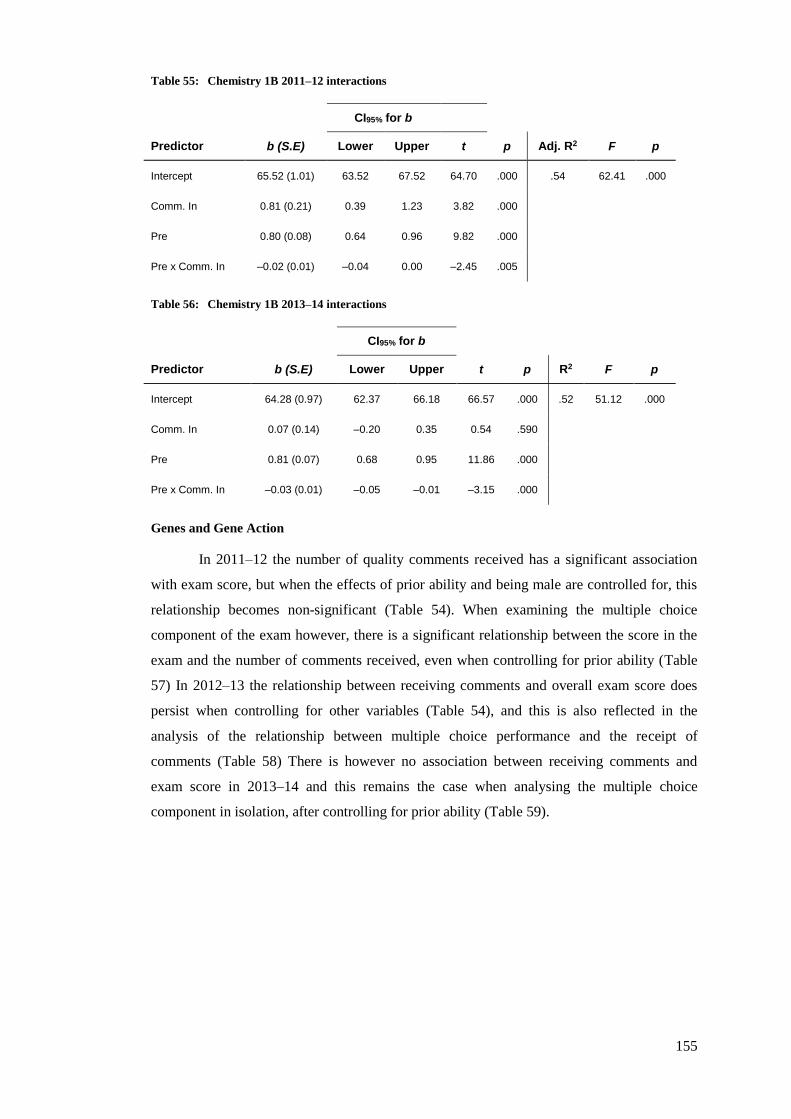
155
Table 55: Chemistry 1B 2011–12 interactions
CI95% for b
Predictor b (S.E) Lower Upper t p Adj. R2 F p
Intercept 65.52 (1.01) 63.52 67.52 64.70 .000 .54 62.41 .000
Comm. In 0.81 (0.21) 0.39 1.23 3.82 .000
Pre 0.80 (0.08) 0.64 0.96 9.82 .000
Pre x Comm. In –0.02 (0.01) –0.04 0.00 –2.45 .005
Table 56: Chemistry 1B 2013–14 interactions
CI95% for b
Predictor b (S.E) Lower Upper t p R2 F p
Intercept 64.28 (0.97) 62.37 66.18 66.57 .000 .52 51.12 .000
Comm. In 0.07 (0.14) –0.20 0.35 0.54 .590
Pre 0.81 (0.07) 0.68 0.95 11.86 .000
Pre x Comm. In –0.03 (0.01) –0.05 –0.01 –3.15 .000
Genes and Gene Action
In 2011–12 the number of quality comments received has a significant association
with exam score, but when the effects of prior ability and being male are controlled for, this
relationship becomes non-significant (Table 54). When examining the multiple choice
component of the exam however, there is a significant relationship between the score in the
exam and the number of comments received, even when controlling for prior ability (Table
57) In 2012–13 the relationship between receiving comments and overall exam score does
persist when controlling for other variables (Table 54), and this is also reflected in the
analysis of the relationship between multiple choice performance and the receipt of
comments (Table 58) There is however no association between receiving comments and
exam score in 2013–14 and this remains the case when analysing the multiple choice
component in isolation, after controlling for prior ability (Table 59).
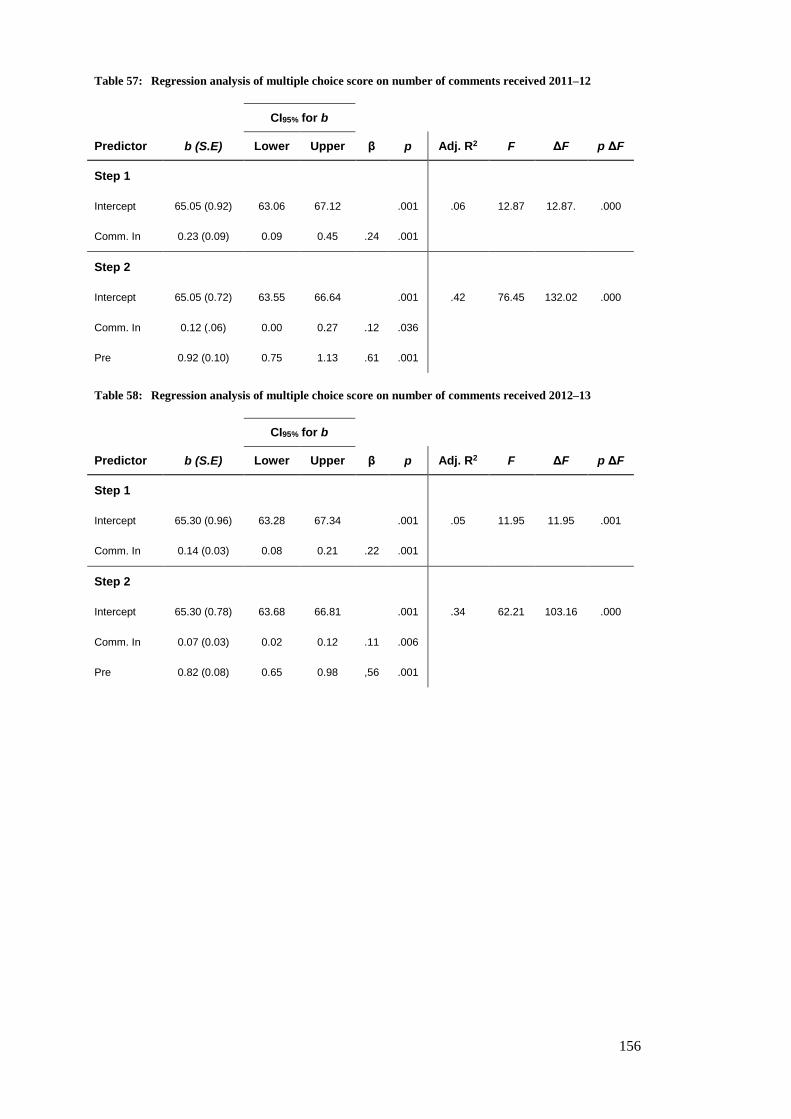
156
Table 57: Regression analysis of multiple choice score on number of comments received 2011–12
CI95% for b
Predictor b (S.E) Lower Upper β p Adj. R2 F ΔF p ΔF
Step 1
Intercept 65.05 (0.92) 63.06 67.12 .001 .06 12.87 12.87. .000
Comm. In 0.23 (0.09) 0.09 0.45 .24 .001
Step 2
Intercept 65.05 (0.72) 63.55 66.64 .001 .42 76.45 132.02 .000
Comm. In 0.12 (.06) 0.00 0.27 .12 .036
Pre 0.92 (0.10) 0.75 1.13 .61 .001
Table 58: Regression analysis of multiple choice score on number of comments received 2012–13
CI95% for b
Predictor b (S.E) Lower Upper β p Adj. R2 F ΔF p ΔF
Step 1
Intercept 65.30 (0.96) 63.28 67.34 .001 .05 11.95 11.95 .001
Comm. In 0.14 (0.03) 0.08 0.21 .22 .001
Step 2
Intercept 65.30 (0.78) 63.68 66.81 .001 .34 62.21 103.16 .000
Comm. In 0.07 (0.03) 0.02 0.12 .11 .006
Pre 0.82 (0.08) 0.65 0.98 ,56 .001
157
Table 59: Regression analysis of multiple choice score on number of comments received 2013–14
CI95% for b
Predictor b (S.E) Lower Upper β p Adj. R2 F ΔF p ΔF
Step 1
Intercept 66.30 (1.04) 64.31 68.33 .001 .03 6.31 6.31 .013
Comm. In 0.28 (0.13) 0.03 0.52 .17 .022
Step 2
Intercept 66.30 (0.81) 64.78 67.89 .001 .40 75.18 140.02 .000
Comm. In 0.05 (0.11) –0.17 0.25 .03 .635
Pre 0.80 (0.09) 0.63 0.98 .64 .001
Glasgow Physics
Across all years receiving comments and exam performance have a significant
relationship, which persists into the multiple regression model controlling for prior ability.
The effects of getting comments as feedback are very similar across all years. Each
additional comment gained is associated with a 0.4%, 0.5% and 0.5% increase in exam score
in academic years 2011–12, 2012–13 and 2013–14 respectively. These results are constant
across all levels of ability – there are not significant interaction effects.
Nottingham Chemistry
Receiving comments is never a significant predictor of exam score when controlling
for prior ability within the Nottingham Chemistry courses. However in the simple regression
models, before controlling for prior ability, in 2011–12 and 2013–14, the relationships are
significant, associated with a 0.1% and a 0.3% increase in exam score respectively. In 2013–
14 this relationship does not remain constant at all ability levels. There is an interaction
effect on the relationship between receiving comments and exam score, resulting in a
significant association between receiving comments and exam score for lower and medium
ability students where each additional comment received is associated with a 0.8% increase
and a 0.4% increase respectively (Table 60). More specifically, the Johnson-Neyman region
of significance indicates that these effects apply to students who scored less than +2.31%
above the mean, encompassing 48.39% of the students in the dataset. Once again, where
there is an interaction effect, there is a stronger relationship between receiving comments
and exam score for lower ability students.
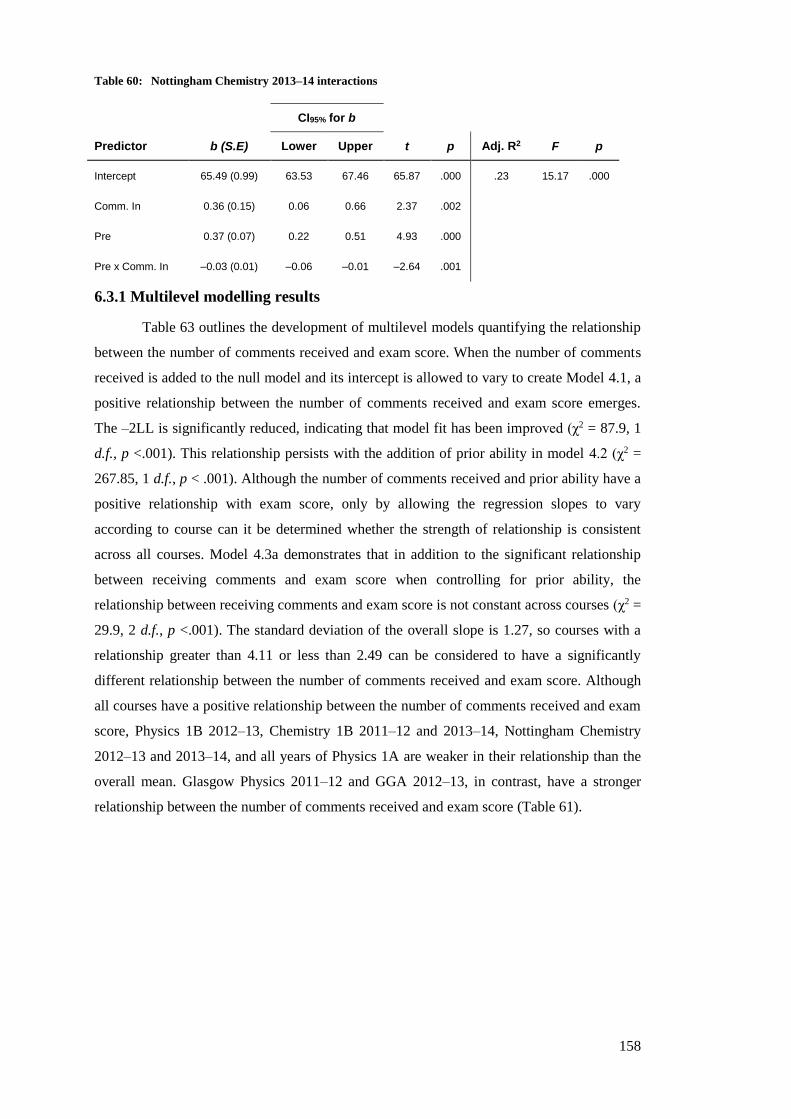
158
Table 60: Nottingham Chemistry 2013–14 interactions
CI95% for b
Predictor b (S.E) Lower Upper t p Adj. R2 F p
Intercept 65.49 (0.99) 63.53 67.46 65.87 .000 .23 15.17 .000
Comm. In 0.36 (0.15) 0.06 0.66 2.37 .002
Pre 0.37 (0.07) 0.22 0.51 4.93 .000
Pre x Comm. In –0.03 (0.01) –0.06 –0.01 –2.64 .001
6.3.1 Multilevel modelling results
Table 63 outlines the development of multilevel models quantifying the relationship
between the number of comments received and exam score. When the number of comments
received is added to the null model and its intercept is allowed to vary to create Model 4.1, a
positive relationship between the number of comments received and exam score emerges.
The –2LL is significantly reduced, indicating that model fit has been improved (χ2 = 87.9, 1
d.f., p <.001). This relationship persists with the addition of prior ability in model 4.2 (χ2 =
267.85, 1 d.f., p < .001). Although the number of comments received and prior ability have a
positive relationship with exam score, only by allowing the regression slopes to vary
according to course can it be determined whether the strength of relationship is consistent
across all courses. Model 4.3a demonstrates that in addition to the significant relationship
between receiving comments and exam score when controlling for prior ability, the
relationship between receiving comments and exam score is not constant across courses (χ2 =
29.9, 2 d.f., p <.001). The standard deviation of the overall slope is 1.27, so courses with a
relationship greater than 4.11 or less than 2.49 can be considered to have a significantly
different relationship between the number of comments received and exam score. Although
all courses have a positive relationship between the number of comments received and exam
score, Physics 1B 2012–13, Chemistry 1B 2011–12 and 2013–14, Nottingham Chemistry
2012–13 and 2013–14, and all years of Physics 1A are weaker in their relationship than the
overall mean. Glasgow Physics 2011–12 and GGA 2012–13, in contrast, have a stronger
relationship between the number of comments received and exam score (Table 61).
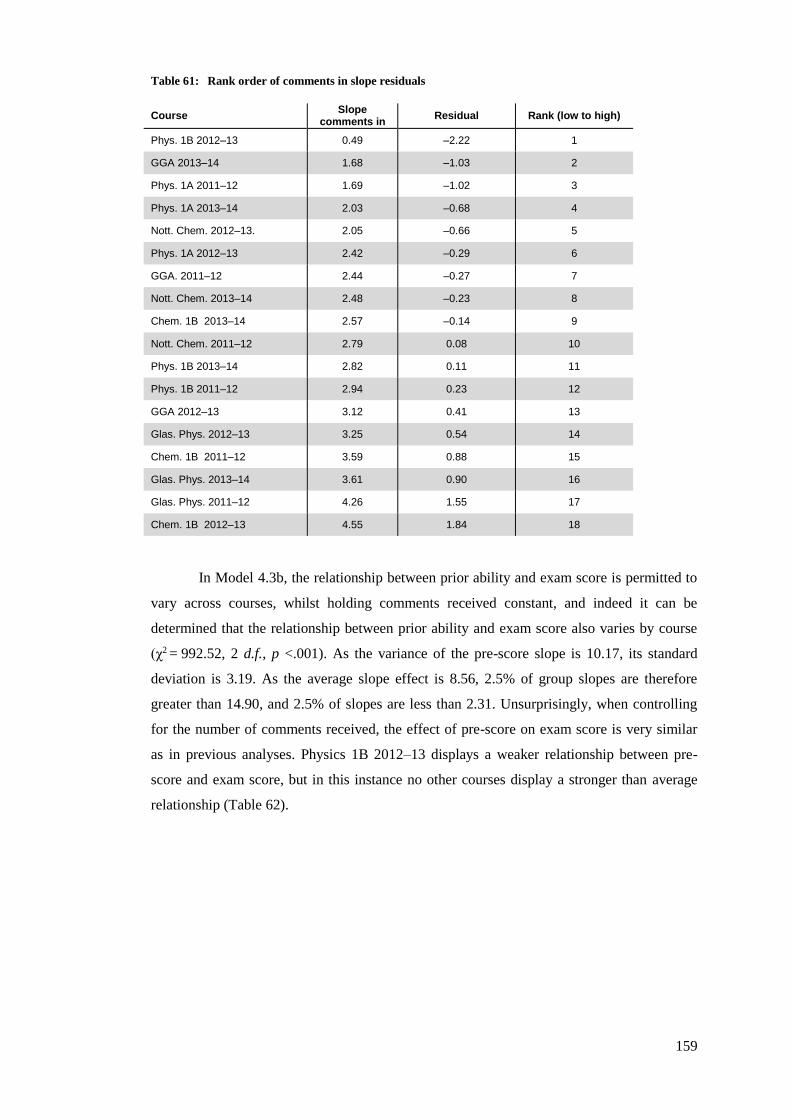
159
Table 61: Rank order of comments in slope residuals
Course Slope
comments in Residual Rank (low to high)
Phys. 1B 2012–13 0.49 –2.22 1
GGA 2013–14 1.68 –1.03 2
Phys. 1A 2011–12 1.69 –1.02 3
Phys. 1A 2013–14 2.03 –0.68 4
Nott. Chem. 2012–13. 2.05 –0.66 5
Phys. 1A 2012–13 2.42 –0.29 6
GGA. 2011–12 2.44 –0.27 7
Nott. Chem. 2013–14 2.48 –0.23 8
Chem. 1B 2013–14 2.57 –0.14 9
Nott. Chem. 2011–12 2.79 0.08 10
Phys. 1B 2013–14 2.82 0.11 11
Phys. 1B 2011–12 2.94 0.23 12
GGA 2012–13 3.12 0.41 13
Glas. Phys. 2012–13 3.25 0.54 14
Chem. 1B 2011–12 3.59 0.88 15
Glas. Phys. 2013–14 3.61 0.90 16
Glas. Phys. 2011–12 4.26 1.55 17
Chem. 1B 2012–13 4.55 1.84 18
In Model 4.3b, the relationship between prior ability and exam score is permitted to
vary across courses, whilst holding comments received constant, and indeed it can be
determined that the relationship between prior ability and exam score also varies by course
(χ2 = 992.52, 2 d.f., p <.001). As the variance of the pre-score slope is 10.17, its standard
deviation is 3.19. As the average slope effect is 8.56, 2.5% of group slopes are therefore
greater than 14.90, and 2.5% of slopes are less than 2.31. Unsurprisingly, when controlling
for the number of comments received, the effect of pre-score on exam score is very similar
as in previous analyses. Physics 1B 2012–13 displays a weaker relationship between pre-
score and exam score, but in this instance no other courses display a stronger than average
relationship (Table 62).
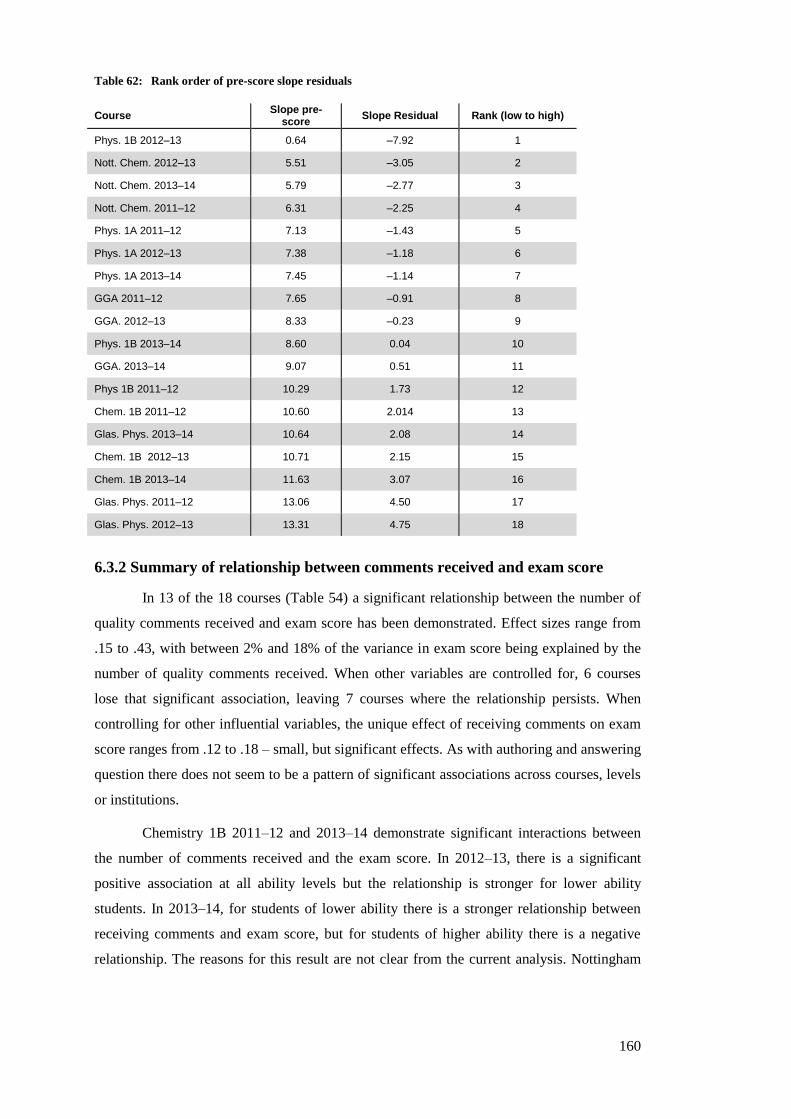
160
Table 62: Rank order of pre-score slope residuals
Course Slope pre-
score Slope Residual Rank (low to high)
Phys. 1B 2012–13 0.64 –7.92 1
Nott. Chem. 2012–13 5.51 –3.05 2
Nott. Chem. 2013–14 5.79 –2.77 3
Nott. Chem. 2011–12 6.31 –2.25 4
Phys. 1A 2011–12 7.13 –1.43 5
Phys. 1A 2012–13 7.38 –1.18 6
Phys. 1A 2013–14 7.45 –1.14 7
GGA 2011–12 7.65 –0.91 8
GGA. 2012–13 8.33 –0.23 9
Phys. 1B 2013–14 8.60 0.04 10
GGA. 2013–14 9.07 0.51 11
Phys 1B 2011–12 10.29 1.73 12
Chem. 1B 2011–12 10.60 2.014 13
Glas. Phys. 2013–14 10.64 2.08 14
Chem. 1B 2012–13 10.71 2.15 15
Chem. 1B 2013–14 11.63 3.07 16
Glas. Phys. 2011–12 13.06 4.50 17
Glas. Phys. 2012–13 13.31 4.75 18
6.3.2 Summary of relationship between comments received and exam score
In 13 of the 18 courses (Table 54) a significant relationship between the number of
quality comments received and exam score has been demonstrated. Effect sizes range from
.15 to .43, with between 2% and 18% of the variance in exam score being explained by the
number of quality comments received. When other variables are controlled for, 6 courses
lose that significant association, leaving 7 courses where the relationship persists. When
controlling for other influential variables, the unique effect of receiving comments on exam
score ranges from .12 to .18 – small, but significant effects. As with authoring and answering
question there does not seem to be a pattern of significant associations across courses, levels
or institutions.
Chemistry 1B 2011–12 and 2013–14 demonstrate significant interactions between
the number of comments received and the exam score. In 2012–13, there is a significant
positive association at all ability levels but the relationship is stronger for lower ability
students. In 2013–14, for students of lower ability there is a stronger relationship between
receiving comments and exam score, but for students of higher ability there is a negative
relationship. The reasons for this result are not clear from the current analysis. Nottingham
161
Chemistry in 2013–14 is the only other course to demonstrate an interaction, consistent with
the other results but as would be expected, and as in Chemistry 1B 2011–12, associations at
each ability level are positive – if weaker for higher ability students.
As with the number of questions authored and answered and comments out, when
examining the multilevel models, there is a significant, positive, fixed relationship between
receiving comments and exam score. When this relationship is allowed to vary, in a similar
manner to the number of questions authored and the number of comments written, the
deviance statistic is significantly improved, therefore the relationships between the number
of comments written and exam score and pre-score and exam score are not consistent across
course.
Reflecting findings from previous studies [88,89] receiving quality comments does
not seem to be as strongly associated with exam score as providing comments, and where
there is an association that varies with ability level; it seems to be the weaker students who
benefit more from the interaction with their peers in this manner. As with writing comments,
there has been little PeerWise-specific research that measures this association, however
research into receiving feedback through other mechanisms highlights the importance of
students understanding why feedback was given and reflecting upon the feedback before
adopting changes [91,94]. The ability to think critically about the feedback received,
disregarding misleading comments and incorporating good suggestions seems to be a key
factor in whether students benefit from receiving feedback [101]. The results do seem to
tentatively support the idea that weaker students benefit from the scaffolding afforded to
them by their peers in terms of clarifying questions and concepts.
It would seem a reasonable proposition that perhaps stronger students do not benefit
from receiving peer feedback as their questions are generally of a higher quality and error
free, and therefore there are fewer points for improvement. On examination of Table 20,
many of the courses display a small to medium, but often highly significant, positive
relationship between receiving comments and prior ability which seems to suggest that
higher ability students do indeed receive more quality comments. Upon further inspection
however, it is evident that the courses displaying this positive relationship also have a
significant relationship between student ability and the number of questions authored. Since
the receipt of comments is likely to be influenced by the number of questions authored,
partial correlations were carried out to isolate the effects of the number of questions authored
on the relationship between prior ability and receiving comments. Of the 10 courses
demonstrating a significant relationship between receiving comments and pre-score, only

162
three courses maintained this relationship when controlling for the number of questions
authored, thus illustrating that in most of the courses where there is a significant relationship
between pre-score and comments received, this relationship is moderated by the fact that
higher ability students tend to write more questions, thus providing themselves with
opportunities to gain more feedback.
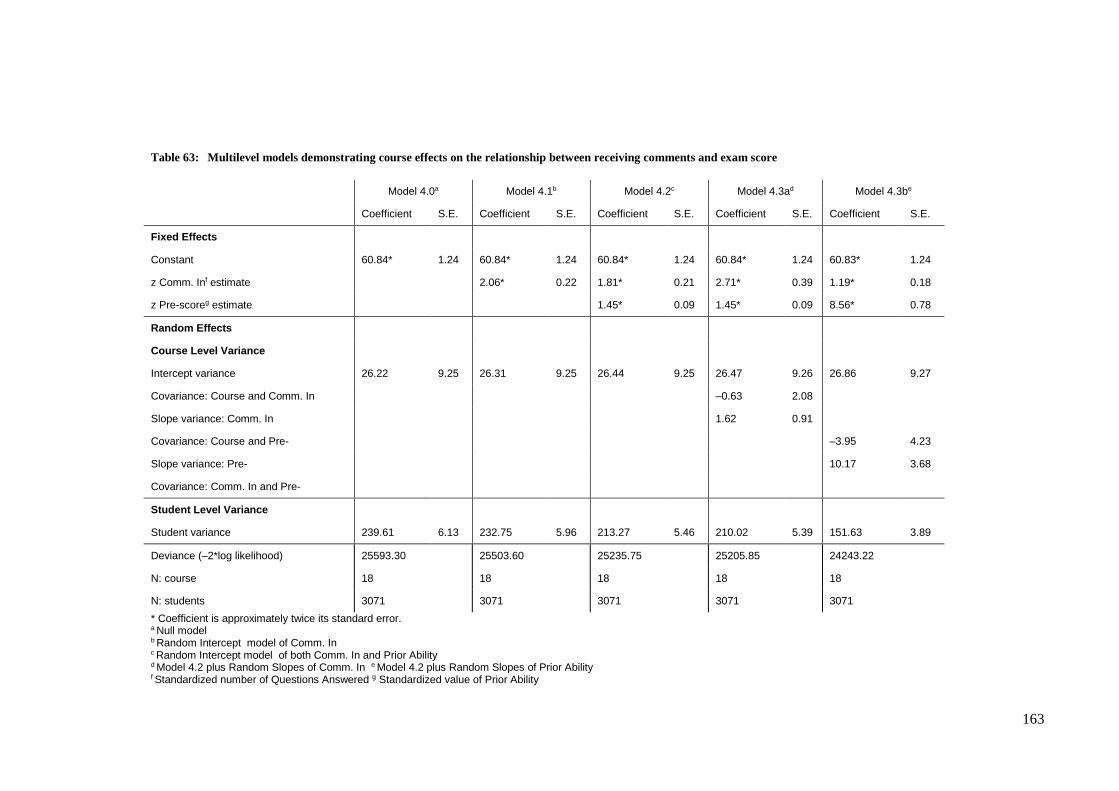
163
Table 63: Multilevel models demonstrating course effects on the relationship between receiving comments and exam score
Model 4.0a Model 4.1b Model 4.2c Model 4.3ad Model 4.3be
Coefficient S.E. Coefficient S.E. Coefficient S.E. Coefficient S.E. Coefficient S.E.
Fixed Effects
Constant 60.84* 1.24 60.84* 1.24 60.84* 1.24 60.84* 1.24 60.83* 1.24
z Comm. Inf estimate 2.06* 0.22 1.81* 0.21 2.71* 0.39 1.19* 0.18
z Pre-scoreg estimate 1.45* 0.09 1.45* 0.09 8.56* 0.78
Random Effects
Course Level Variance
Intercept variance 26.22 9.25 26.31 9.25 26.44 9.25 26.47 9.26 26.86 9.27
Covariance: Course and Comm. In –0.63 2.08
Slope variance: Comm. In 1.62 0.91
Covariance: Course and Pre- –3.95 4.23
Slope variance: Pre- 10.17 3.68
Covariance: Comm. In and Pre-
Student Level Variance
Student variance 239.61 6.13 232.75 5.96 213.27 5.46 210.02 5.39 151.63 3.89
Deviance (–2*log likelihood) 25593.30 25503.60 25235.75 25205.85 24243.22
N: course 18 18 18 18 18
N: students 3071 3071 3071 3071 3071
* Coefficient is approximately twice its standard error. a Null model b Random Intercept model of Comm. In c Random Intercept model of both Comm. In and Prior Ability d Model 4.2 plus Random Slopes of Comm. In e Model 4.2 plus Random Slopes of Prior Ability f Standardized number of Questions Answered g Standardized value of Prior Ability

164
165
Chapter 7
Associations between overall PeerWise engagement
and student performance
The picture painted by the analysis in Chapters 5 and 6 is extremely complex. It is
quite difficult from the separate analyses of each activity to get a feel for the overarching
benefits of participating in PeerWise. In an attempt to quantify the overall relationship
between participation in PeerWise and exam score, an aggregate measure was created to
determine whether the benefits of PeerWise as a whole was more than the benefits of
engaging in each individual activity. Using a similar structure to the previous two chapters,
this chapter analyses the relationship between score on the multiple measure and exam
performance. The chapter then concludes with a summary of the relationship between each
of the measures and exam score.
7.1 Multiple measure of PeerWise engagement
The aggregate, or multiple measure of PeerWise activity for each student (MM)
comprises, for each student, a summed score based upon the four indicators previously
analysed – questions authored; questions answered; quality comments given and quality
comments received. Although it would seem reasonable to assume that these measures
summed together would be a robust metric of overall PeerWise engagement, the reliability
and validity of the measure was first assessed. Within each course four measures: number of
questions authored, answers submitted, high quality comments given and high quality
comments received were standardised into z scores where each course has a mean of 0 and a
standard deviation of 1. These scores were then summed and an average taken, to create the
multiple measure of activity (MM). In order to determine whether the four indicators
together indeed measured the same construct, and so may be validly aggregated, a principal
component analysis was undertaken to ascertain whether the variables loaded onto one
component (i.e. that they all measured PeerWise engagement), and the strength of each
variable’s association with the component [194]. For all but one course (GGA 2012–13)
each of the four variables were extracted onto one component which indicated that they were
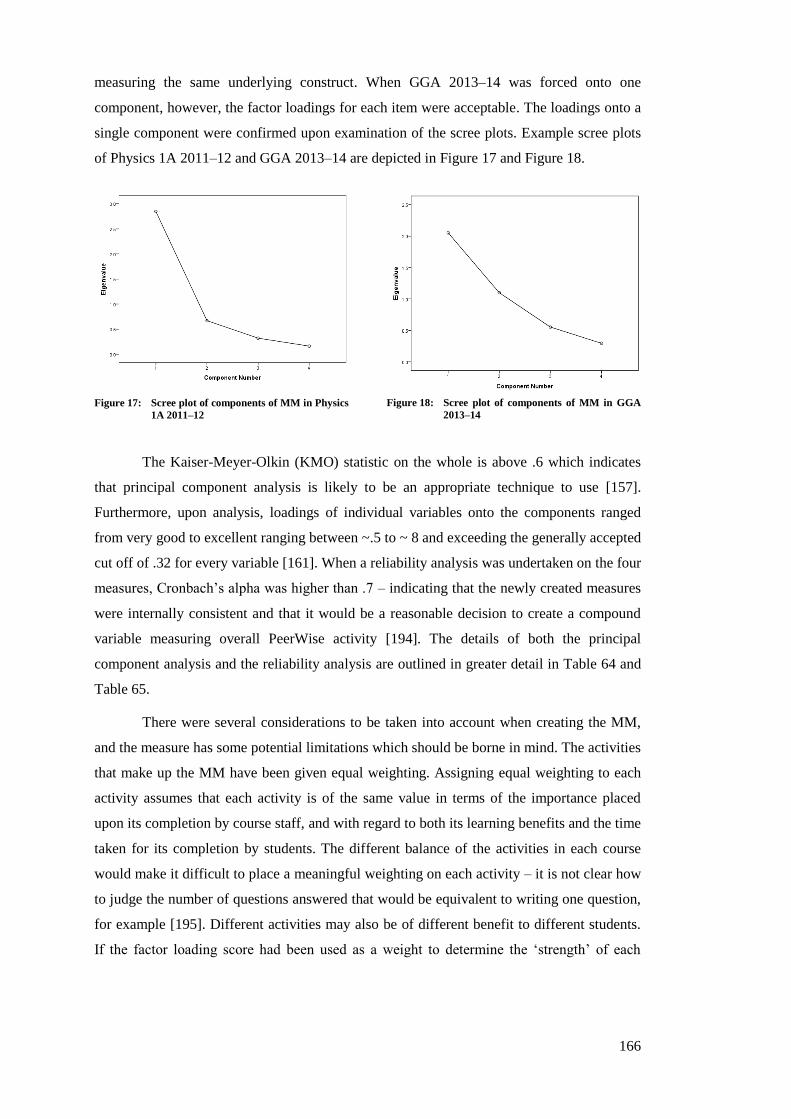
166
measuring the same underlying construct. When GGA 2013–14 was forced onto one
component, however, the factor loadings for each item were acceptable. The loadings onto a
single component were confirmed upon examination of the scree plots. Example scree plots
of Physics 1A 2011–12 and GGA 2013–14 are depicted in Figure 17 and Figure 18.
Figure 17: Scree plot of components of MM in Physics
1A 2011–12
Figure 18: Scree plot of components of MM in GGA
2013–14
The Kaiser-Meyer-Olkin (KMO) statistic on the whole is above .6 which indicates
that principal component analysis is likely to be an appropriate technique to use [157].
Furthermore, upon analysis, loadings of individual variables onto the components ranged
from very good to excellent ranging between ~.5 to ~ 8 and exceeding the generally accepted
cut off of .32 for every variable [161]. When a reliability analysis was undertaken on the four
measures, Cronbach’s alpha was higher than .7 – indicating that the newly created measures
were internally consistent and that it would be a reasonable decision to create a compound
variable measuring overall PeerWise activity [194]. The details of both the principal
component analysis and the reliability analysis are outlined in greater detail in Table 64 and
Table 65.
There were several considerations to be taken into account when creating the MM,
and the measure has some potential limitations which should be borne in mind. The activities
that make up the MM have been given equal weighting. Assigning equal weighting to each
activity assumes that each activity is of the same value in terms of the importance placed
upon its completion by course staff, and with regard to both its learning benefits and the time
taken for its completion by students. The different balance of the activities in each course
would make it difficult to place a meaningful weighting on each activity – it is not clear how
to judge the number of questions answered that would be equivalent to writing one question,
for example [195]. Different activities may also be of different benefit to different students.
If the factor loading score had been used as a weight to determine the ‘strength’ of each
167
activity within the measure, this would make the value of the MM relative to each individual
course and non-comparable across courses. Although giving each activity the same
weighting may not accurately reflect the real balance in terms of the benefits of PeerWise,
this compromise nevertheless ensures comparability across courses.
It is not obvious which activities should be included in the MM. Students are
required to answer, author and comment on questions. Including the receipt of feedback in
the measure may muddy the water, as it is not an activity that the student is actively
pursuing. However, one of the purposes of receiving feedback is to allow the question author
to improve and to learn from their peers, therefore if received feedback is reflected upon,
and, if suitably acted upon, this active engagement with the feedback can also produce
benefits. By excluding the activity of actively engaging with feedback received, the
PeerWise process leaves feedback loops open and data left “dangling” [113]. Although the
comment author will have gained benefit from providing feedback, the full potential of the
feedback would not be fulfilled. In recognition of the value of engaging with feedback, and
so as not to ignore the opportunities for improvement that feedback affords students who
engage with it, the number of quality comments received has been included in the measure.
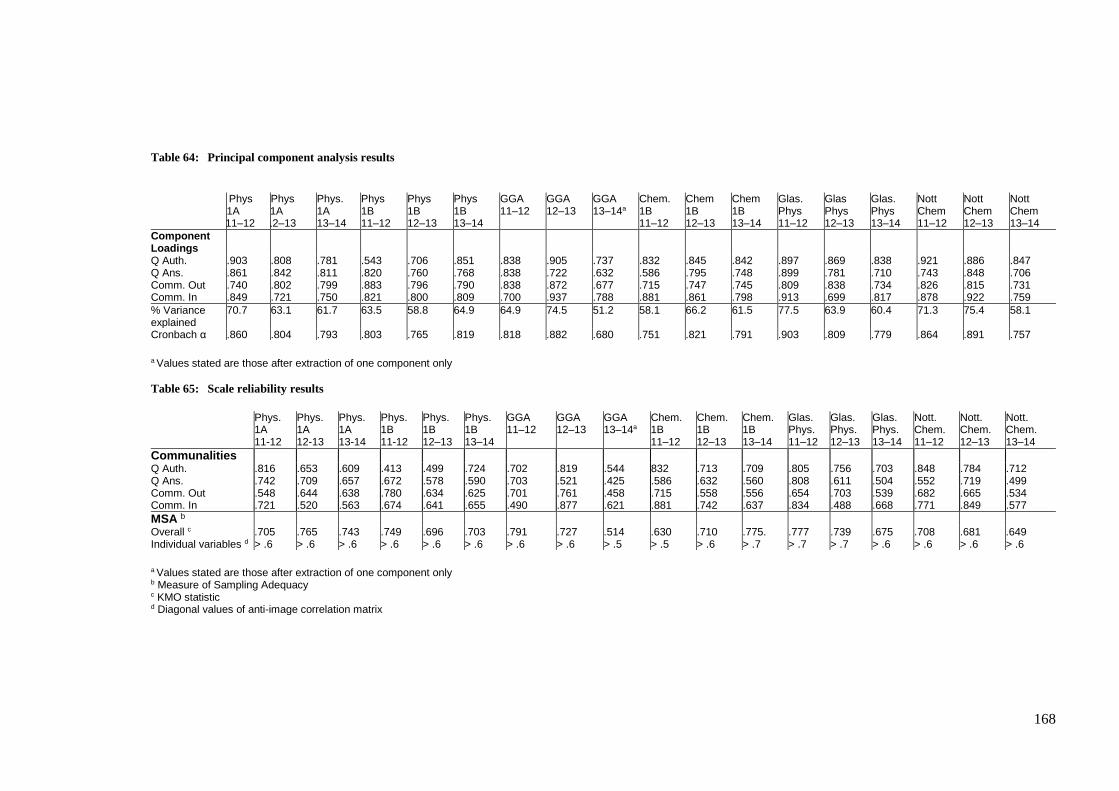
168
Table 64: Principal component analysis results
a Values stated are those after extraction of one component only
Table 65: Scale reliability results
a Values stated are those after extraction of one component only
b Measure of Sampling Adequacy c KMO statistic d Diagonal values of anti-image correlation matrix
Phys 1A 11–12
Phys 1A
12–13
Phys. 1A 13–14
Phys 1B 11–12
Phys 1B 12–13
Phys 1B 13–14
GGA 11–12
GGA 12–13
GGA 13–14a
Chem. 1B 11–12
Chem 1B 12–13
Chem 1B 13–14
Glas. Phys 11–12
Glas Phys 12–13
Glas. Phys 13–14
Nott Chem 11–12
Nott Chem 12–13
Nott Chem 13–14
Component Loadings
Q Auth. .903 .808 .781 .543 .706 .851 .838 .905 .737 .832 .845 .842 .897 .869 .838 .921 .886 .847 Q Ans. .861 .842 .811 .820 .760 .768 .838 .722 .632 .586 .795 .748 .899 .781 .710 .743 .848 .706 Comm. Out .740 .802 .799 .883 .796 .790 .838 .872 .677 .715 .747 .745 .809 .838 .734 .826 .815 .731 Comm. In .849 .721 .750 .821 .800 .809 .700 .937 .788 .881 .861 .798 .913 .699 .817 .878 .922 .759
% Variance explained
70.7 63.1 61.7 63.5 58.8 64.9 64.9 74.5 51.2 58.1 66.2 61.5 77.5 63.9 60.4 71.3 75.4 58.1
Cronbach α .860 .804 .793 .803 .765 .819 .818 .882 .680 .751 .821 .791 .903 .809 .779 .864 .891 .757
Phys. 1A 11-12
Phys. 1A 12-13
Phys. 1A 13-14
Phys. 1B 11-12
Phys. 1B 12–13
Phys. 1B 13–14
GGA 11–12
GGA 12–13
GGA 13–14a
Chem. 1B 11–12
Chem. 1B 12–13
Chem. 1B 13–14
Glas. Phys. 11–12
Glas. Phys. 12–13
Glas. Phys. 13–14
Nott. Chem. 11–12
Nott. Chem. 12–13
Nott. Chem. 13–14
Communalities
Q Auth. .816 .653 .609 .413 .499 .724 .702 .819 .544 832 .713 .709 .805 .756 .703 .848 .784 .712 Q Ans. .742 .709 .657 .672 .578 .590 .703 .521 .425 .586 .632 .560 .808 .611 .504 .552 .719 .499 Comm. Out .548 .644 .638 .780 .634 .625 .701 .761 .458 .715 .558 .556 .654 .703 .539 .682 .665 .534 Comm. In .721 .520 .563 .674 .641 .655 .490 .877 .621 .881 .742 .637 .834 .488 .668 .771 .849 .577
MSA b
Overall c .705 .765 .743 .749 .696 .703 .791 .727 .514 .630 .710 .775. .777 .739 .675 .708 .681 .649 Individual variables d > .6 > .6 > .6 > .6 > .6 > .6 > .6 > .6 > .5 > .5 > .6 > .7 > .7 > .7 > .6 > .6 > .6 > .6
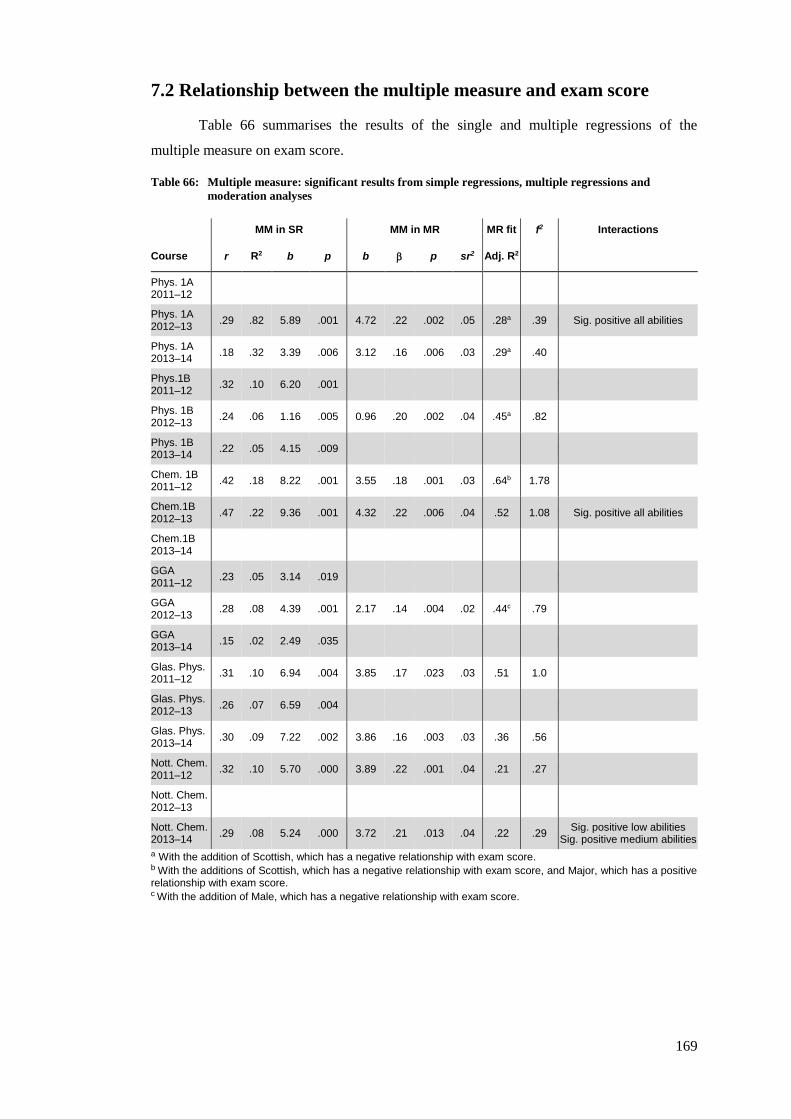
169
7.2 Relationship between the multiple measure and exam score
Table 66 summarises the results of the single and multiple regressions of the
multiple measure on exam score.
Table 66: Multiple measure: significant results from simple regressions, multiple regressions and
moderation analyses
MM in SR MM in MR MR fit f2 Interactions
Course r R2 b p b p sr2 Adj. R2
Phys. 1A 2011–12
Phys. 1A 2012–13
.29 .82 5.89 .001 4.72 .22 .002 .05 .28a .39 Sig. positive all abilities
Phys. 1A 2013–14
.18 .32 3.39 .006 3.12 .16 .006 .03 .29a .40
Phys.1B 2011–12
.32 .10 6.20 .001
Phys. 1B 2012–13
.24 .06 1.16 .005 0.96 .20 .002 .04 .45a .82
Phys. 1B 2013–14
.22 .05 4.15 .009
Chem. 1B 2011–12
.42 .18 8.22 .001 3.55 .18 .001 .03 .64b 1.78
Chem.1B 2012–13
.47 .22 9.36 .001 4.32 .22 .006 .04 .52 1.08 Sig. positive all abilities
Chem.1B 2013–14
GGA 2011–12
.23 .05 3.14 .019
GGA 2012–13
.28 .08 4.39 .001 2.17 .14 .004 .02 .44c .79
GGA 2013–14
.15 .02 2.49 .035
Glas. Phys. 2011–12
.31 .10 6.94 .004 3.85 .17 .023 .03 .51 1.0
Glas. Phys. 2012–13
.26 .07 6.59 .004
Glas. Phys. 2013–14
.30 .09 7.22 .002 3.86 .16 .003 .03 .36 .56
Nott. Chem. 2011–12
.32 .10 5.70 .000 3.89 .22 .001 .04 .21 .27
Nott. Chem. 2012–13
Nott. Chem. 2013–14
.29 .08 5.24 .000 3.72 .21 .013 .04 .22 .29 Sig. positive low abilities
Sig. positive medium abilities
a With the addition of Scottish, which has a negative relationship with exam score. b With the additions of Scottish, which has a negative relationship with exam score, and Major, which has a positive relationship with exam score. c With the addition of Male, which has a negative relationship with exam score.
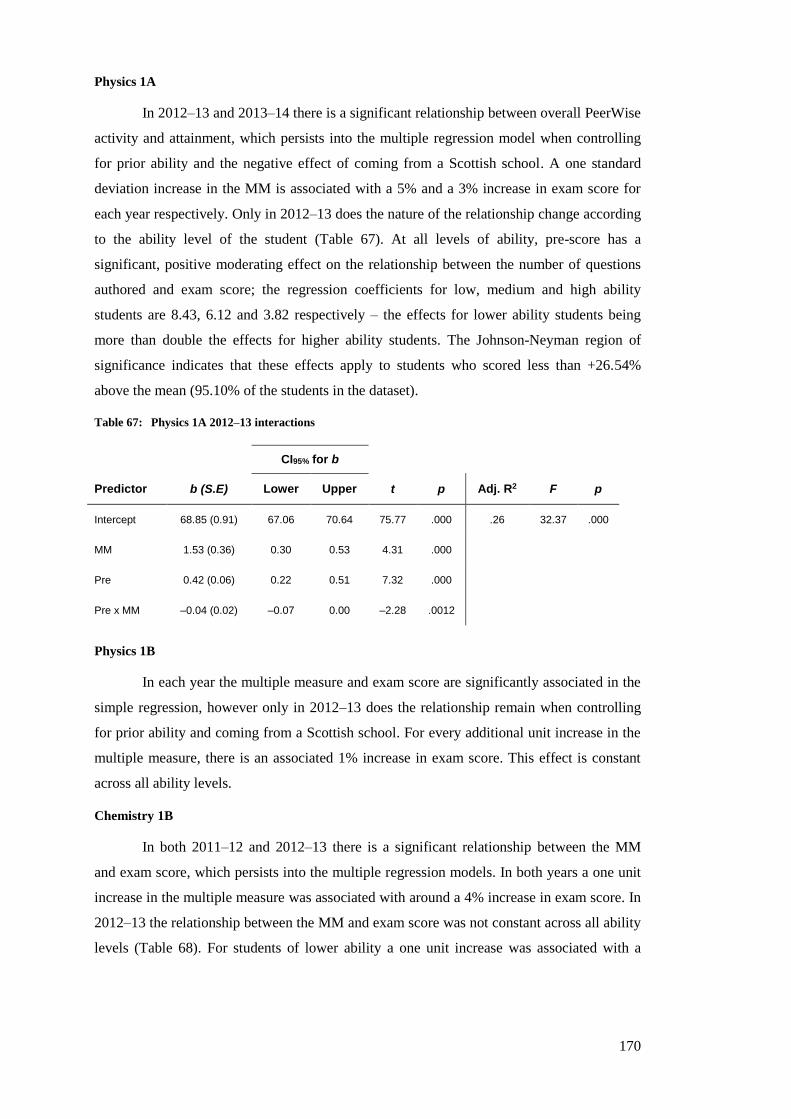
170
Physics 1A
In 2012–13 and 2013–14 there is a significant relationship between overall PeerWise
activity and attainment, which persists into the multiple regression model when controlling
for prior ability and the negative effect of coming from a Scottish school. A one standard
deviation increase in the MM is associated with a 5% and a 3% increase in exam score for
each year respectively. Only in 2012–13 does the nature of the relationship change according
to the ability level of the student (Table 67). At all levels of ability, pre-score has a
significant, positive moderating effect on the relationship between the number of questions
authored and exam score; the regression coefficients for low, medium and high ability
students are 8.43, 6.12 and 3.82 respectively – the effects for lower ability students being
more than double the effects for higher ability students. The Johnson-Neyman region of
significance indicates that these effects apply to students who scored less than +26.54%
above the mean (95.10% of the students in the dataset).
Table 67: Physics 1A 2012–13 interactions
CI95% for b
Predictor b (S.E) Lower Upper t p Adj. R2 F p
Intercept 68.85 (0.91) 67.06 70.64 75.77 .000 .26 32.37 .000
MM 1.53 (0.36) 0.30 0.53 4.31 .000
Pre 0.42 (0.06) 0.22 0.51 7.32 .000
Pre x MM –0.04 (0.02) –0.07 0.00 –2.28 .0012
Physics 1B
In each year the multiple measure and exam score are significantly associated in the
simple regression, however only in 2012–13 does the relationship remain when controlling
for prior ability and coming from a Scottish school. For every additional unit increase in the
multiple measure, there is an associated 1% increase in exam score. This effect is constant
across all ability levels.
Chemistry 1B
In both 2011–12 and 2012–13 there is a significant relationship between the MM
and exam score, which persists into the multiple regression models. In both years a one unit
increase in the multiple measure was associated with around a 4% increase in exam score. In
2012–13 the relationship between the MM and exam score was not constant across all ability
levels (Table 68). For students of lower ability a one unit increase was associated with a
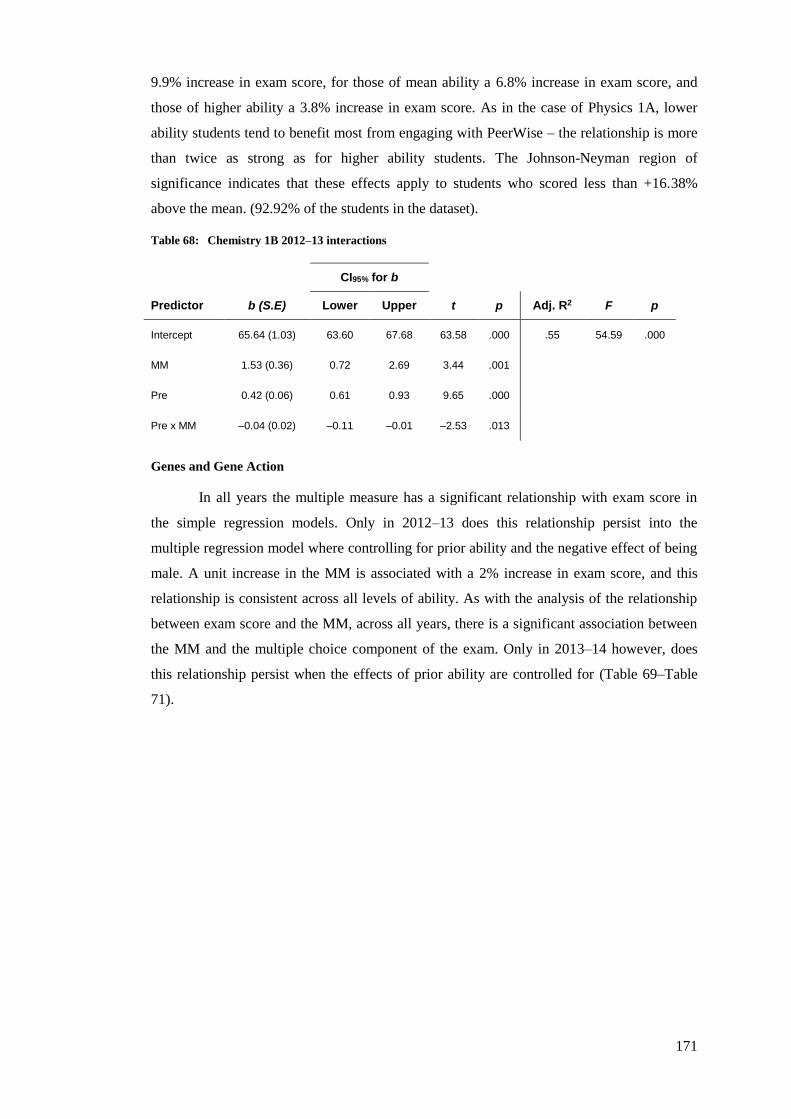
171
9.9% increase in exam score, for those of mean ability a 6.8% increase in exam score, and
those of higher ability a 3.8% increase in exam score. As in the case of Physics 1A, lower
ability students tend to benefit most from engaging with PeerWise – the relationship is more
than twice as strong as for higher ability students. The Johnson-Neyman region of
significance indicates that these effects apply to students who scored less than +16.38%
above the mean. (92.92% of the students in the dataset).
Table 68: Chemistry 1B 2012–13 interactions
CI95% for b
Predictor b (S.E) Lower Upper t p Adj. R2 F p
Intercept 65.64 (1.03) 63.60 67.68 63.58 .000 .55 54.59 .000
MM 1.53 (0.36) 0.72 2.69 3.44 .001
Pre 0.42 (0.06) 0.61 0.93 9.65 .000
Pre x MM –0.04 (0.02) –0.11 –0.01 –2.53 .013
Genes and Gene Action
In all years the multiple measure has a significant relationship with exam score in
the simple regression models. Only in 2012–13 does this relationship persist into the
multiple regression model where controlling for prior ability and the negative effect of being
male. A unit increase in the MM is associated with a 2% increase in exam score, and this
relationship is consistent across all levels of ability. As with the analysis of the relationship
between exam score and the MM, across all years, there is a significant association between
the MM and the multiple choice component of the exam. Only in 2013–14 however, does
this relationship persist when the effects of prior ability are controlled for (Table 69–Table
71).
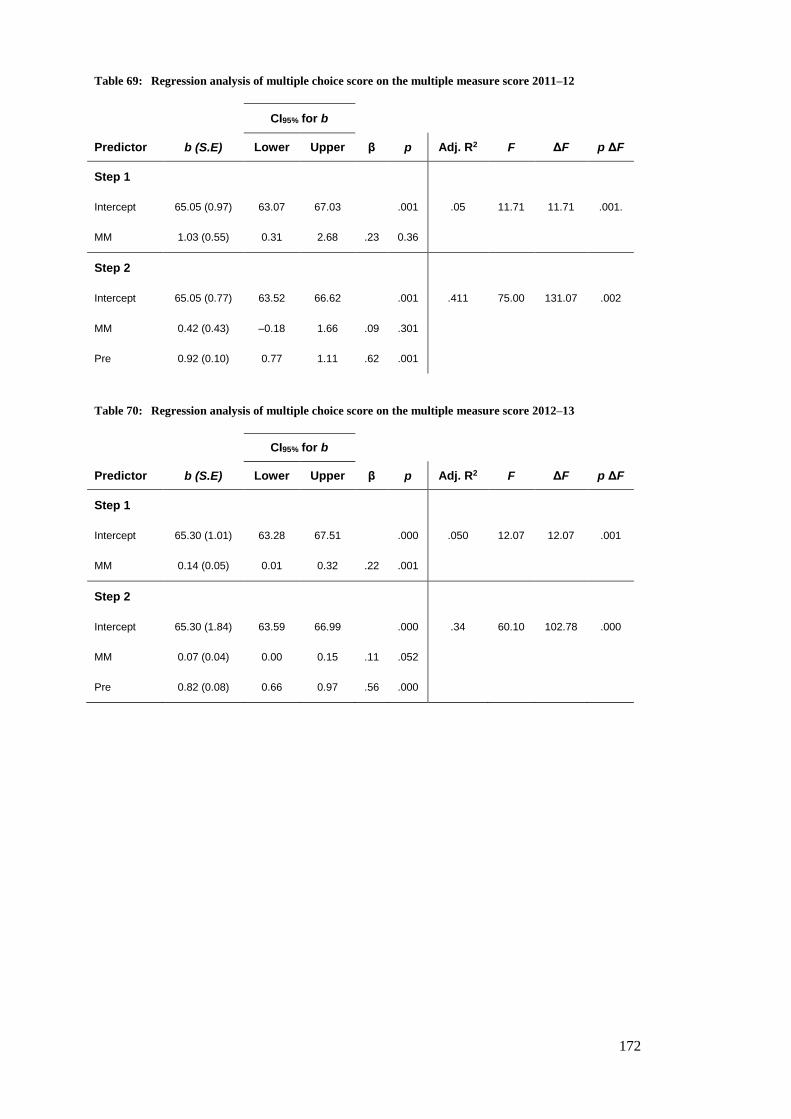
172
Table 69: Regression analysis of multiple choice score on the multiple measure score 2011–12
CI95% for b
Predictor b (S.E) Lower Upper β p Adj. R2 F ΔF p ΔF
Step 1
Intercept 65.05 (0.97) 63.07 67.03 .001 .05 11.71 11.71 .001.
MM 1.03 (0.55) 0.31 2.68 .23 0.36
Step 2
Intercept 65.05 (0.77) 63.52 66.62 .001 .411 75.00 131.07 .002
MM 0.42 (0.43) –0.18 1.66 .09 .301
Pre 0.92 (0.10) 0.77 1.11 .62 .001
Table 70: Regression analysis of multiple choice score on the multiple measure score 2012–13
CI95% for b
Predictor b (S.E) Lower Upper β p Adj. R2 F ΔF p ΔF
Step 1
Intercept 65.30 (1.01) 63.28 67.51 .000 .050 12.07 12.07 .001
MM 0.14 (0.05) 0.01 0.32 .22 .001
Step 2
Intercept 65.30 (1.84) 63.59 66.99 .000 .34 60.10 102.78 .000
MM 0.07 (0.04) 0.00 0.15 .11 .052
Pre 0.82 (0.08) 0.66 0.97 .56 .000
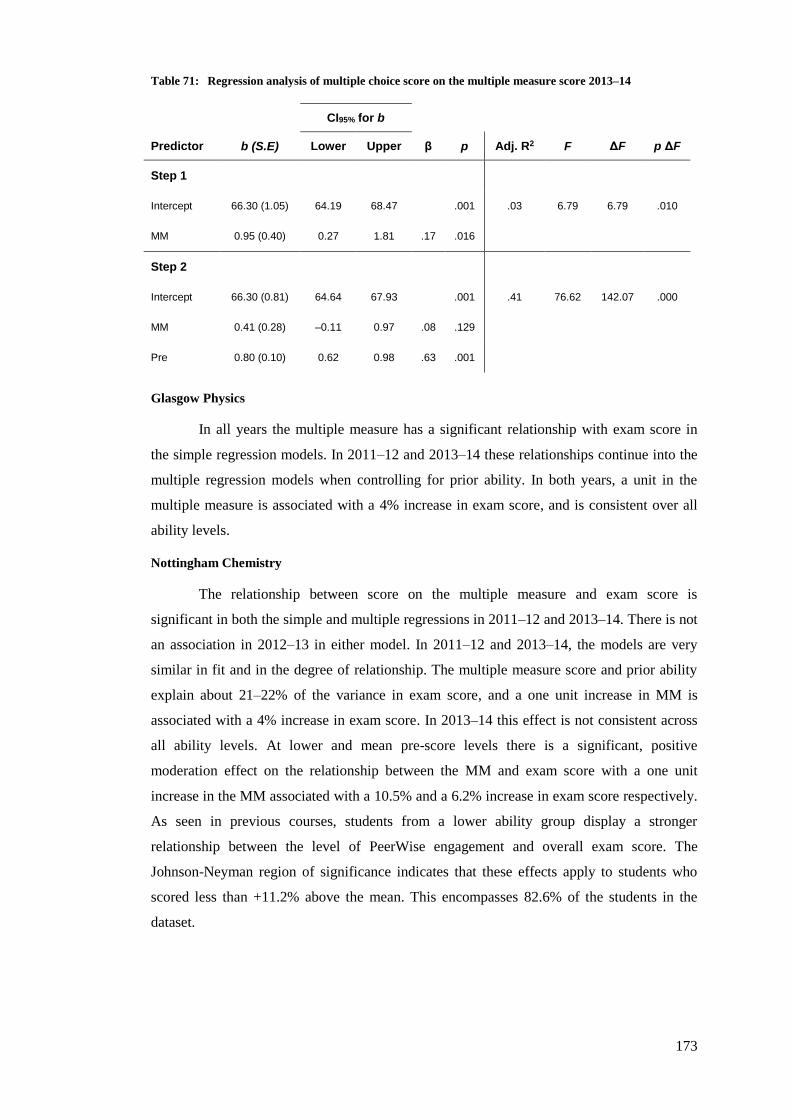
173
Table 71: Regression analysis of multiple choice score on the multiple measure score 2013–14
CI95% for b
Predictor b (S.E) Lower Upper β p Adj. R2 F ΔF p ΔF
Step 1
Intercept 66.30 (1.05) 64.19 68.47 .001 .03 6.79 6.79 .010
MM 0.95 (0.40) 0.27 1.81 .17 .016
Step 2
Intercept 66.30 (0.81) 64.64 67.93 .001 .41 76.62 142.07 .000
MM 0.41 (0.28) –0.11 0.97 .08 .129
Pre 0.80 (0.10) 0.62 0.98 .63 .001
Glasgow Physics
In all years the multiple measure has a significant relationship with exam score in
the simple regression models. In 2011–12 and 2013–14 these relationships continue into the
multiple regression models when controlling for prior ability. In both years, a unit in the
multiple measure is associated with a 4% increase in exam score, and is consistent over all
ability levels.
Nottingham Chemistry
The relationship between score on the multiple measure and exam score is
significant in both the simple and multiple regressions in 2011–12 and 2013–14. There is not
an association in 2012–13 in either model. In 2011–12 and 2013–14, the models are very
similar in fit and in the degree of relationship. The multiple measure score and prior ability
explain about 21–22% of the variance in exam score, and a one unit increase in MM is
associated with a 4% increase in exam score. In 2013–14 this effect is not consistent across
all ability levels. At lower and mean pre-score levels there is a significant, positive
moderation effect on the relationship between the MM and exam score with a one unit
increase in the MM associated with a 10.5% and a 6.2% increase in exam score respectively.
As seen in previous courses, students from a lower ability group display a stronger
relationship between the level of PeerWise engagement and overall exam score. The
Johnson-Neyman region of significance indicates that these effects apply to students who
scored less than +11.2% above the mean. This encompasses 82.6% of the students in the
dataset.
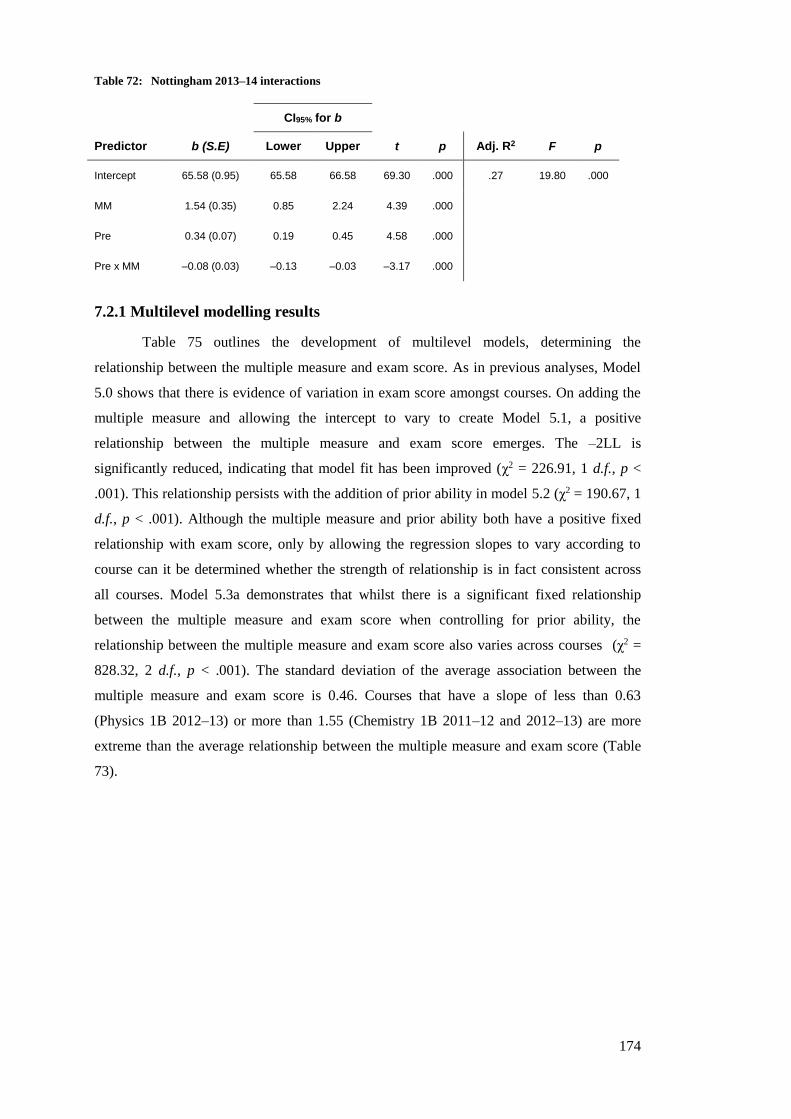
174
Table 72: Nottingham 2013–14 interactions
CI95% for b
Predictor b (S.E) Lower Upper t p Adj. R2 F p
Intercept 65.58 (0.95) 65.58 66.58 69.30 .000 .27 19.80 .000
MM 1.54 (0.35) 0.85 2.24 4.39 .000
Pre 0.34 (0.07) 0.19 0.45 4.58 .000
Pre x MM –0.08 (0.03) –0.13 –0.03 –3.17 .000
7.2.1 Multilevel modelling results
Table 75 outlines the development of multilevel models, determining the
relationship between the multiple measure and exam score. As in previous analyses, Model
5.0 shows that there is evidence of variation in exam score amongst courses. On adding the
multiple measure and allowing the intercept to vary to create Model 5.1, a positive
relationship between the multiple measure and exam score emerges. The –2LL is
significantly reduced, indicating that model fit has been improved (χ2 = 226.91, 1 d.f., p <
.001). This relationship persists with the addition of prior ability in model 5.2 (χ2 = 190.67, 1
d.f., p < .001). Although the multiple measure and prior ability both have a positive fixed
relationship with exam score, only by allowing the regression slopes to vary according to
course can it be determined whether the strength of relationship is in fact consistent across
all courses. Model 5.3a demonstrates that whilst there is a significant fixed relationship
between the multiple measure and exam score when controlling for prior ability, the
relationship between the multiple measure and exam score also varies across courses (χ2 =
828.32, 2 d.f., p < .001). The standard deviation of the average association between the
multiple measure and exam score is 0.46. Courses that have a slope of less than 0.63
(Physics 1B 2012–13) or more than 1.55 (Chemistry 1B 2011–12 and 2012–13) are more
extreme than the average relationship between the multiple measure and exam score (Table
73).
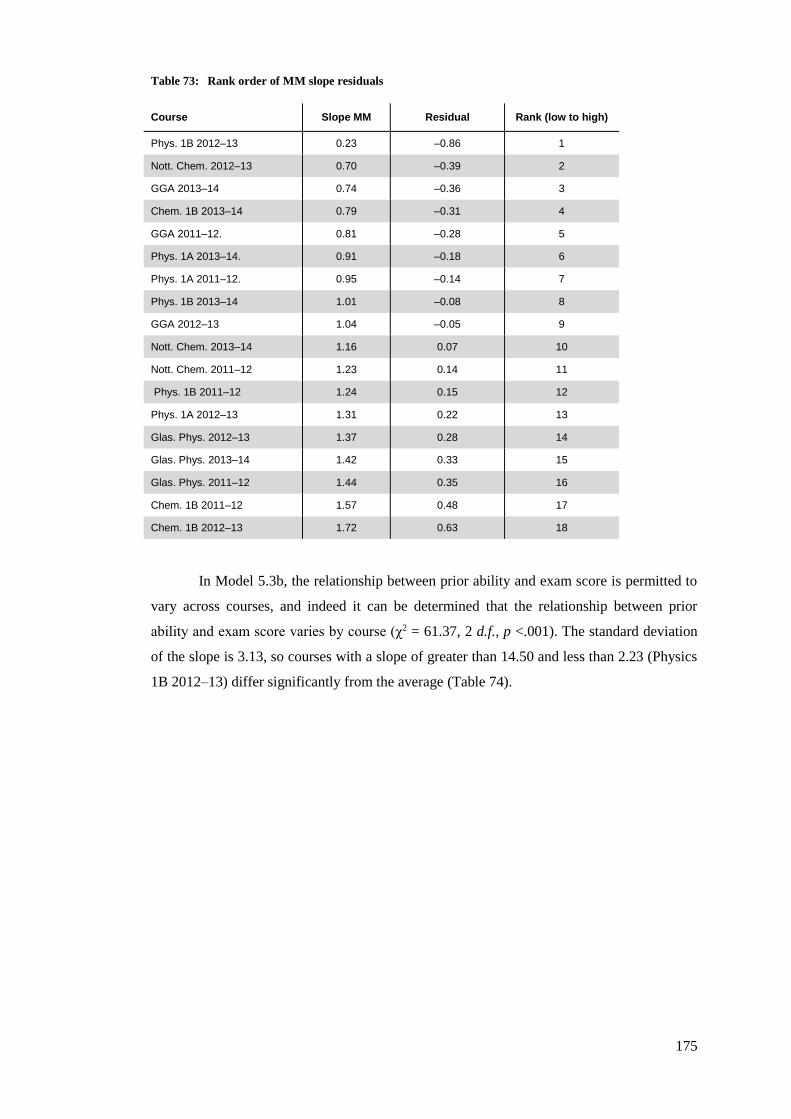
175
Table 73: Rank order of MM slope residuals
Course Slope MM Residual Rank (low to high)
Phys. 1B 2012–13 0.23 –0.86 1
Nott. Chem. 2012–13 0.70 –0.39 2
GGA 2013–14 0.74 –0.36 3
Chem. 1B 2013–14 0.79 –0.31 4
GGA 2011–12. 0.81 –0.28 5
Phys. 1A 2013–14. 0.91 –0.18 6
Phys. 1A 2011–12. 0.95 –0.14 7
Phys. 1B 2013–14 1.01 –0.08 8
GGA 2012–13 1.04 –0.05 9
Nott. Chem. 2013–14 1.16 0.07 10
Nott. Chem. 2011–12 1.23 0.14 11
Phys. 1B 2011–12 1.24 0.15 12
Phys. 1A 2012–13 1.31 0.22 13
Glas. Phys. 2012–13 1.37 0.28 14
Glas. Phys. 2013–14 1.42 0.33 15
Glas. Phys. 2011–12 1.44 0.35 16
Chem. 1B 2011–12 1.57 0.48 17
Chem. 1B 2012–13 1.72 0.63 18
In Model 5.3b, the relationship between prior ability and exam score is permitted to
vary across courses, and indeed it can be determined that the relationship between prior
ability and exam score varies by course (χ2 = 61.37, 2 d.f., p <.001). The standard deviation
of the slope is 3.13, so courses with a slope of greater than 14.50 and less than 2.23 (Physics
1B 2012–13) differ significantly from the average (Table 74).
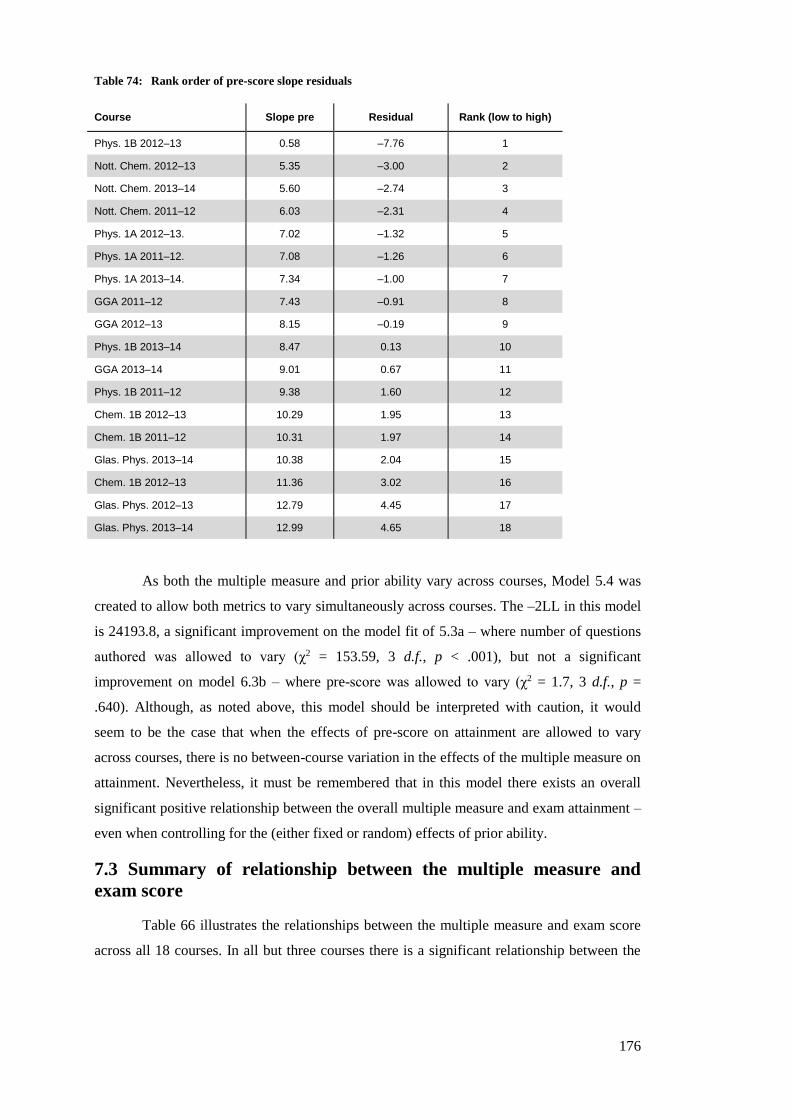
176
Table 74: Rank order of pre-score slope residuals
Course Slope pre Residual Rank (low to high)
Phys. 1B 2012–13 0.58 –7.76 1
Nott. Chem. 2012–13 5.35 –3.00 2
Nott. Chem. 2013–14 5.60 –2.74 3
Nott. Chem. 2011–12 6.03 –2.31 4
Phys. 1A 2012–13. 7.02 –1.32 5
Phys. 1A 2011–12. 7.08 –1.26 6
Phys. 1A 2013–14. 7.34 –1.00 7
GGA 2011–12 7.43 –0.91 8
GGA 2012–13 8.15 –0.19 9
Phys. 1B 2013–14 8.47 0.13 10
GGA 2013–14 9.01 0.67 11
Phys. 1B 2011–12 9.38 1.60 12
Chem. 1B 2012–13 10.29 1.95 13
Chem. 1B 2011–12 10.31 1.97 14
Glas. Phys. 2013–14 10.38 2.04 15
Chem. 1B 2012–13 11.36 3.02 16
Glas. Phys. 2012–13 12.79 4.45 17
Glas. Phys. 2013–14 12.99 4.65 18
As both the multiple measure and prior ability vary across courses, Model 5.4 was
created to allow both metrics to vary simultaneously across courses. The –2LL in this model
is 24193.8, a significant improvement on the model fit of 5.3a – where number of questions
authored was allowed to vary (χ2 = 153.59, 3 d.f., p < .001), but not a significant
improvement on model 6.3b – where pre-score was allowed to vary (χ2 = 1.7, 3 d.f., p =
.640). Although, as noted above, this model should be interpreted with caution, it would
seem to be the case that when the effects of pre-score on attainment are allowed to vary
across courses, there is no between-course variation in the effects of the multiple measure on
attainment. Nevertheless, it must be remembered that in this model there exists an overall
significant positive relationship between the overall multiple measure and exam attainment –
even when controlling for the (either fixed or random) effects of prior ability.
7.3 Summary of relationship between the multiple measure and
exam score
Table 66 illustrates the relationships between the multiple measure and exam score
across all 18 courses. In all but three courses there is a significant relationship between the
177
multiple measure and exam score, and of these 15 courses, 10 display a significant
relationship when controlling for prior ability and/or gender, Scottish and being a subject
major. As with most of the other analyses, there does not seem to be any particular pattern of
significant results across disciplines or institutions. In the simple regression models the effect
of overall PeerWise engagement ranges from .15 to .47 (small to medium-large) whilst in the
multiple regression models the effects range from .14 to .23 (small to medium). In Physics
1A 2012–3, Chemistry 1B 2012–13 and Nottingham Chemistry 2013–14, the relationship
between the MM and exam score varies by ability. In each course, students from the lower
ability group display a stronger relationship between exam score and the MM – perhaps
indicating that overall engagement may benefit weaker students more than stronger students.
When considering the multilevel model, as with other measures, there is an overall
significant positive relationship between the multiple measure and exam score, which
remains even when controlling for prior ability. Including the score on the multiple measure
and pre-score explains a significant proportion of the between-course variance in exam
score. As for the analysis of the number of questions authored and comments written and
received – including the random component significantly explains more variance than just
letting the multiple measure and pre-score remain fixed. As in all other analyses, the
relationship between pre-score and exam score is not constant across all courses, however
the relationship is, unsurprisingly, always positive.
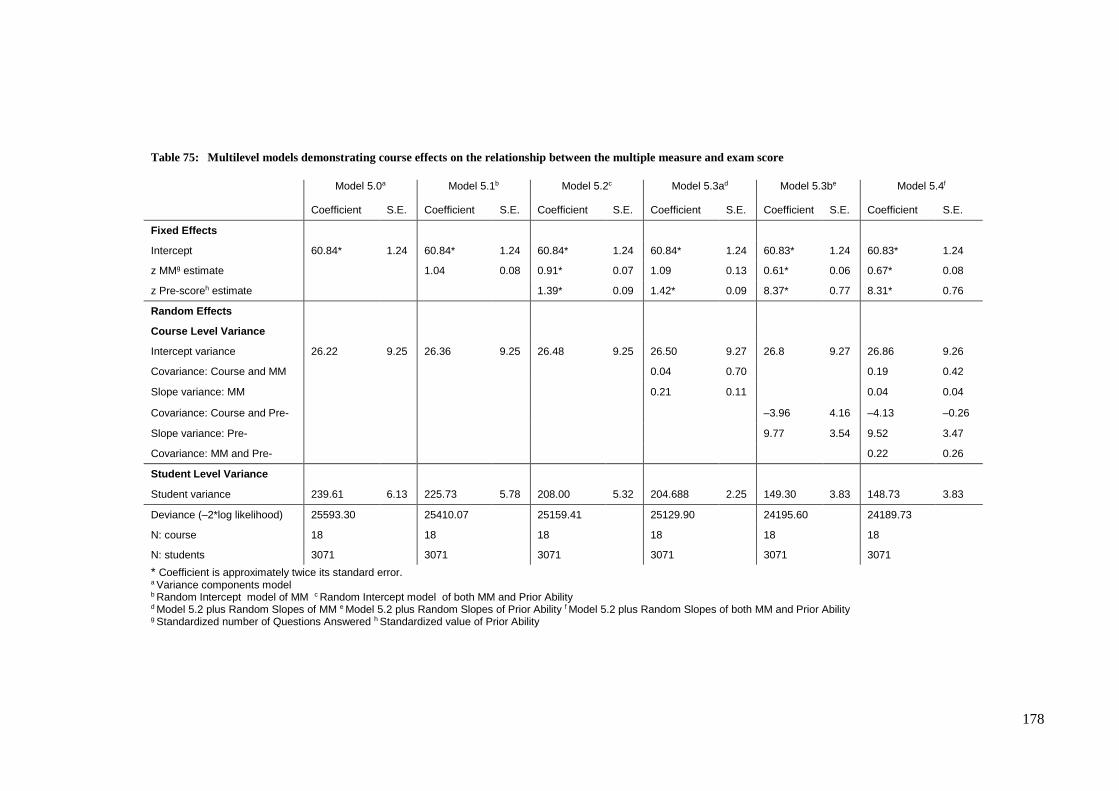
178
Table 75: Multilevel models demonstrating course effects on the relationship between the multiple measure and exam score
Model 5.0a Model 5.1b Model 5.2c Model 5.3ad Model 5.3be Model 5.4f
Coefficient S.E. Coefficient S.E. Coefficient S.E. Coefficient S.E. Coefficient S.E. Coefficient S.E.
Fixed Effects
Intercept 60.84* 1.24 60.84* 1.24 60.84* 1.24 60.84* 1.24 60.83* 1.24 60.83* 1.24
z MMg estimate 1.04 0.08 0.91* 0.07 1.09 0.13 0.61* 0.06 0.67* 0.08
z Pre-scoreh estimate 1.39* 0.09 1.42* 0.09 8.37* 0.77 8.31* 0.76
Random Effects
Course Level Variance
Intercept variance 26.22 9.25 26.36 9.25 26.48 9.25 26.50 9.27 26.8 9.27 26.86 9.26
Covariance: Course and MM 0.04 0.70 0.19 0.42
Slope variance: MM 0.21 0.11 0.04 0.04
Covariance: Course and Pre- –3.96 4.16 –4.13 –0.26
Slope variance: Pre- 9.77 3.54 9.52 3.47
Covariance: MM and Pre- 0.22 0.26
Student Level Variance
Student variance 239.61 6.13 225.73 5.78 208.00 5.32 204.688 2.25 149.30 3.83 148.73 3.83
Deviance (–2*log likelihood) 25593.30 25410.07 25159.41 25129.90 24195.60 24189.73
N: course 18 18 18 18 18 18
N: students 3071 3071 3071 3071 3071 3071
* Coefficient is approximately twice its standard error. a Variance components model b Random Intercept model of MM c Random Intercept model of both MM and Prior Ability d Model 5.2 plus Random Slopes of MM e Model 5.2 plus Random Slopes of Prior Ability f Model 5.2 plus Random Slopes of both MM and Prior Ability g Standardized number of Questions Answered h Standardized value of Prior Ability
179
7.4 Summary and discussion of regression analyses
Table 76 summaries the partial correlations from the multiple regression analyses
that show a significant association between PeerWise activity and exam score. It is evident
from the individual activities that answering questions and providing comments are most
frequently associated with exam score, but the effects of PeerWise activity are generally
quite small when controlling for other factors. The multiple measure tends to show the
largest effect on exam score – perhaps highlighting that the benefits lie in overall
engagement with PeerWise, rather than in the individual activities [122]. Although a few
courses display an interaction term between prior ability and PeerWise activity, in the vast
majority of analyses, the effect of engaging with PeerWise remains constant across abilities
within each course. When such an interaction term does appear it most commonly indicates
that the association between PeerWise engagement and attainment is stronger for weaker
students.
The multilevel models also demonstrate that, even when controlling for prior ability
and the nested structure of the data, engaging with all PeerWise activities has a significant
positive association with exam score. With the exception of answering questions, all the
multilevel analyses demonstrate that the effect of each PeerWise activity on exam score
varies across all courses.
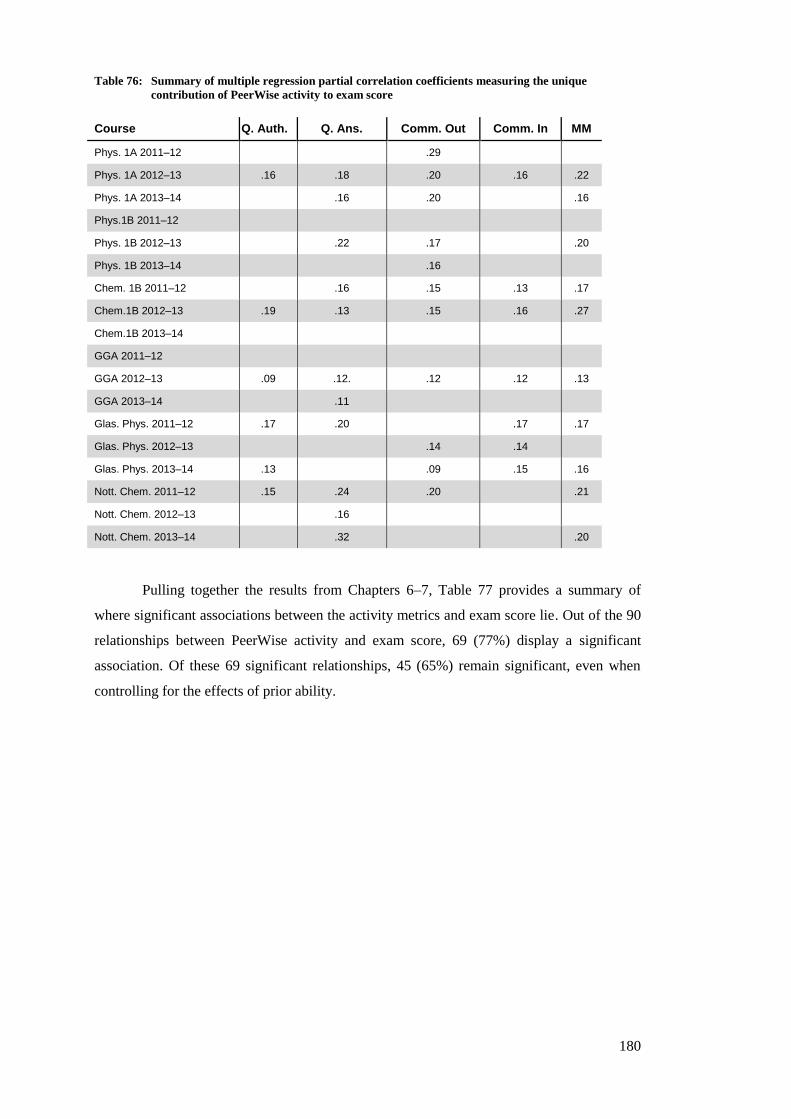
180
Table 76: Summary of multiple regression partial correlation coefficients measuring the unique
contribution of PeerWise activity to exam score
Course Q. Auth. Q. Ans. Comm. Out Comm. In MM
Phys. 1A 2011–12 .29
Phys. 1A 2012–13 .16 .18 .20 .16 .22
Phys. 1A 2013–14 .16 .20 .16
Phys.1B 2011–12
Phys. 1B 2012–13 .22 .17 .20
Phys. 1B 2013–14 .16
Chem. 1B 2011–12 .16 .15 .13 .17
Chem.1B 2012–13 .19 .13 .15 .16 .27
Chem.1B 2013–14
GGA 2011–12
GGA 2012–13 .09 .12. .12 .12 .13
GGA 2013–14 .11
Glas. Phys. 2011–12 .17 .20 .17 .17
Glas. Phys. 2012–13 .14 .14
Glas. Phys. 2013–14 .13 .09 .15 .16
Nott. Chem. 2011–12 .15 .24 .20 .21
Nott. Chem. 2012–13 .16
Nott. Chem. 2013–14 .32 .20
Pulling together the results from Chapters 6–7, Table 77 provides a summary of
where significant associations between the activity metrics and exam score lie. Out of the 90
relationships between PeerWise activity and exam score, 69 (77%) display a significant
association. Of these 69 significant relationships, 45 (65%) remain significant, even when
controlling for the effects of prior ability.
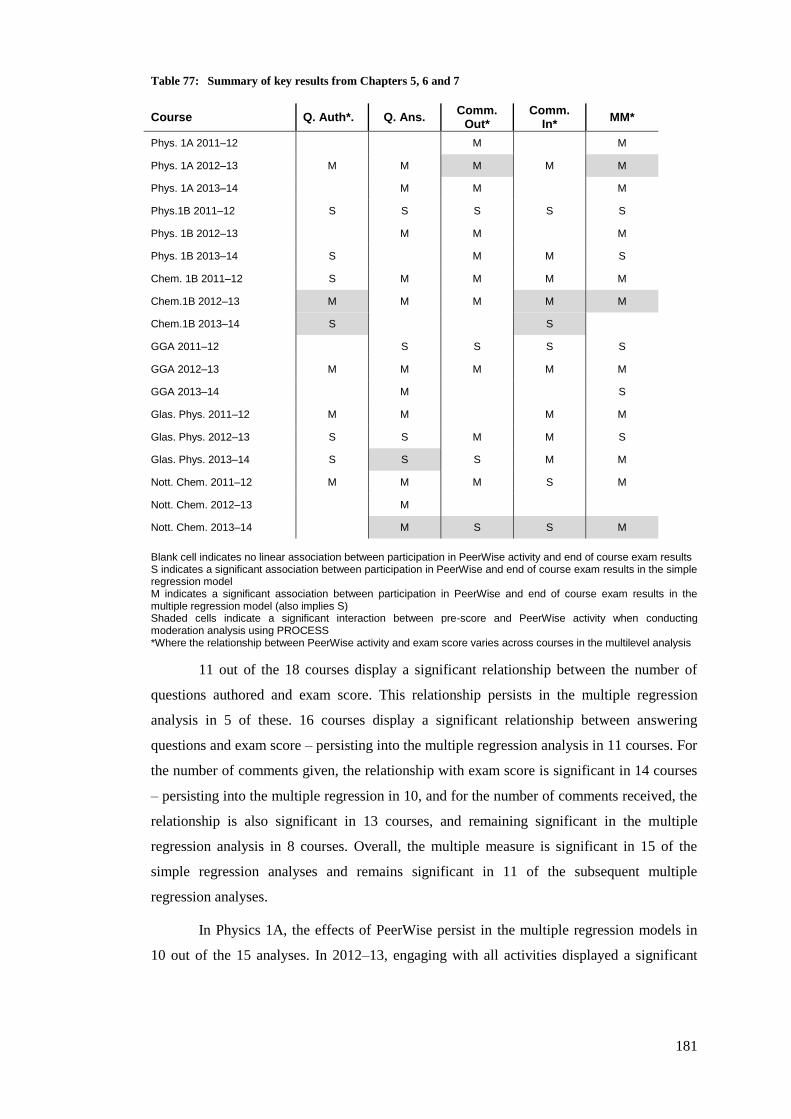
181
Table 77: Summary of key results from Chapters 5, 6 and 7
Course Q. Auth*. Q. Ans. Comm.
Out* Comm.
In* MM*
Phys. 1A 2011–12 M M
Phys. 1A 2012–13 M M M M M
Phys. 1A 2013–14 M M M
Phys.1B 2011–12 S S S S S
Phys. 1B 2012–13 M M M
Phys. 1B 2013–14 S M M S
Chem. 1B 2011–12 S M M M M
Chem.1B 2012–13 M M M M M
Chem.1B 2013–14 S S
GGA 2011–12 S S S S
GGA 2012–13 M M M M M
GGA 2013–14 M S
Glas. Phys. 2011–12 M M M M
Glas. Phys. 2012–13 S S M M S
Glas. Phys. 2013–14 S S S M M
Nott. Chem. 2011–12 M M M S M
Nott. Chem. 2012–13 M
Nott. Chem. 2013–14 M S S M
Blank cell indicates no linear association between participation in PeerWise activity and end of course exam results S indicates a significant association between participation in PeerWise and end of course exam results in the simple regression model M indicates a significant association between participation in PeerWise and end of course exam results in the multiple regression model (also implies S) Shaded cells indicate a significant interaction between pre-score and PeerWise activity when conducting moderation analysis using PROCESS *Where the relationship between PeerWise activity and exam score varies across courses in the multilevel analysis
11 out of the 18 courses display a significant relationship between the number of
questions authored and exam score. This relationship persists in the multiple regression
analysis in 5 of these. 16 courses display a significant relationship between answering
questions and exam score – persisting into the multiple regression analysis in 11 courses. For
the number of comments given, the relationship with exam score is significant in 14 courses
– persisting into the multiple regression in 10, and for the number of comments received, the
relationship is also significant in 13 courses, and remaining significant in the multiple
regression analysis in 8 courses. Overall, the multiple measure is significant in 15 of the
simple regression analyses and remains significant in 11 of the subsequent multiple
regression analyses.
In Physics 1A, the effects of PeerWise persist in the multiple regression models in
10 out of the 15 analyses. In 2012–13, engaging with all activities displayed a significant
182
association with exam score. In Physics 1B, 12 out of 15 analyses display a significant
relationship between activity and exam score in the simple regression, but the significant
relationships only persist in 5 of the multiple regression analyses. In Chemistry 1B, a
significant relationship exists in 12 of the 15 analyses, across all years, persisting in 9 out of
the 12 multiple regression analyses. As in Physics 1A, across all activities in 2012–13 the
effects of PeerWise engagement persists in the multiple regression models. GGA
demonstrates significant relationships in 11 of the 15 analyses with 6 of these remaining
significant in the multiple regression models. Associations, when controlling for prior
ability, were most consistent across all activities in 2012–13, where (with the exception of
the multiple measure) association between activity and exam score persisted in all multiple
regression models. In Glasgow Physics, 14 of the 15 analyses displayed a significant
association in the simple regression models, with half the relationships persisting in the
multiple regression models. In Nottingham Chemistry, 10 of the 15 analyses displayed a
significant association between activity and exam score, with 7 associations persisting in the
multiple regression model.
These results paint a complicated picture of the relationships between PeerWise use
and attainment; there is no clear pattern of significant relationships across years, courses or
activities. However, it would seem that answering questions and engaging with comments,
either through writing or receiving them, are more strongly associated with exam score than
writing questions.
There has been little prior research on the associations between PeerWise
engagement and attainment reported in the literature [122,125,136,183], and even less which
has considered the continuous nature of the PeerWise data [117,139]. In the occasions where
such work has been undertaken, there has been little, if any control for the effects of
students’ prior ability. The current work has controlled for students’ ability levels to account
for the possibility that stronger students will perform better in exams, regardless of their
PeerWise activity. Although effects of PeerWise engagement have dropped out of
significance in some courses with the addition of prior ability, there remain many instances
where engaging with PeerWise has a significant effect on exam score. Moreover, when
considering the results of the multilevel models (which are arguably the most appropriate
models to consider in this analysis), across all courses there is a significant relationship
between engaging with PeerWise and exam score – even when controlling for the effects of
prior ability.
183
Chapter 8
Student views of PeerWise
In Chapters 4–7, the relationship between students’ engagement with PeerWise and
exam attainment was investigated using quantitative methods. The results generally show
that engaging with the PeerWise system through writing, answering and commenting on
questions is positively associated with end of course exam performance, even when
controlling for a student’s level of ability. The level of variation in PeerWise activity is
however quite substantial, both within and across the courses studied. Although most
students write the minimum number of questions, a small number of students may contribute
three or four times the minimum requirement. Conversely, most students answer and
comment on far more questions than is required of them. The purpose of this chapter is to
explore student attitudes towards the PeerWise system to ascertain whether they enjoy
engaging with the system; whether they believe PeerWise can enhance their learning; and,
more specifically, how they use, and benefit from the feedback they give to, and receive
from their peers.
8.1 Rationale and methods
The nature of the PeerWise system means that students need to invest in the system
in order for it to be effective. It is necessary that questions re submitted for students to
answer, and students must provide feedback in order to instigate discussion and share
knowledge. Without buy-in from students, maximum benefits will not be recouped – a
failure to construct questions will mean a limited bank of questions for practice and to
instigate discussion. If students do not discuss the questions and give feedback to the
question author and to previous commenters, such feedback opportunities are passed up.
Students regularly report dissatisfaction with the amount of feedback provided during their
time at university [90,196]. Although the feedback on PeerWise is peer-generated, rather
than provided by academic staff, it enables students to identify areas of weaknesses in their
understanding and allows them to ask for help and further explanations in a safe, supportive
184
environment. Students providing the feedback have to engage more deeply with the
questions, rather than simply answering them.
Asking students directly about their experiences affords the opportunity to
investigate whether they are using the system in the manner originally intended by course
staff, and if not, to explore the reasons why they are not engaging with the system or why
they have modified the experience. Although most students write the minimum number of
questions, some students choose to write far in excess of what is required, and most students
exceed the minimum requirements in terms of answering and commenting on questions. It
may be hypothesised that students find writing questions very onerous in terms of time and
complexity – it is quicker to answer a question and to provide feedback – but are students
aware of the potential learning benefits of asking questions? It could be argued that if
students are aware of the learning to be gained through writing questions then they may be
more likely to engage with the task, thus increasing the benefits of PeerWise. Similarly,
given that students tend to answer more questions and provide more feedback than is
required of them, it would seem to suggest that there is an intrinsic motivation for
participating – it is not simply to fulfil the course requirements. Perhaps students feel that
these activities are most useful to their learning, or that they are a way of making themselves
feel like they are making progress by generating a relatively large output of work in a
relatively short space of time. The degree to which students find benefit in the exercise, and
engage to maximise these benefits, in contrast to merely completing an assessment
requirement, is also an interesting attitude to unpick. Investigating the actual engagement
with PeerWise as reported by students may therefore help explain any disjuncture between
the hypothesised benefits of the system and question writing activities, and the measured
impact of PeerWise on end of course attainment. If students are not engaging with PeerWise
in the manner academic staff intend, they may not be reaping maximum benefits from the
system. Equally, if students find one particular activity too onerous or prefer another aspect
of the system, course staff may be able to modify the assignment in order to maximise
student engagement.
End of course questionnaires were gathered from all three years of Physics 1A
(response rates: 2011–12: 59%; 2012–13: 57%; 2013–14: 34%) and Genes and Gene Action
(response rates: 2011–12: 56%; 2012–13: 55% 2013–14: 34%) and from 2011–12 and 2012–
13 in Physics 1B (response rates 36% and 20% respectively). The student responses were
collected by an online survey at the end of the course, and vary greatly between courses. It is
important to note that non-responses can create a bias in research, as respondents will tend
to be those who have something in particular they wish to say, whilst non-responders may be
185
one of the key groups it would be interesting to hear from [197]. In this chapter there is no
attempt to generalise the findings to a wider population, therefore, whilst the response rate
and potential biases should be taken into account, the themes and issues highlighted here are
those which consistently appear across years and courses.
In all years of Genes and Gene Action and in Physics 1A and 1B in 2011–12 and
2012–13, students were asked, in a closed response question, how useful they found
PeerWise to their learning. They then had the opportunity to outline in an open response
question which aspects of PeerWise they liked best and which they liked least. In Physics 1A
2013–14, rather than asking students in a closed response question, whether PeerWise was
useful to their learning, two open response questions were included in the survey:
What aspect of PeerWise was most useful to your learning and why did you
find it useful? If you did not find PeerWise useful, please indicate your
reasons
What factors made you decide to answer, comment on, or rate a particular
question in PeerWise?
These were designed to gain further insight into what students specifically found, or
did not find, beneficial and their motivations for engaging with the system.
In Physics 1B 2013–14, rather than asking about PeerWise through the end of course
questionnaire, an in-class “minute paper” exercise was conducted. The original plan was to
conduct a number of focus groups to discuss student views in person and to allow the line of
questioning to develop responsively to issues arising in the discussion. However, due to a
low response from students, this was not possible. Upon reflection, it was decided that an in-
class exercise would yield a greater number of responses and that this might enable recurrent
themes to emerge more easily as there would be a greater number of students surveyed. By
keeping the questions very open, general and anonymous it was hoped that students would
not be overly constrained in their responses and that they would have to reflect to some
degree upon the questions in order to answer them. It was hoped that this process would
produce rich, considered data. Although themes arising from the minute papers could not be
probed in real-time as they could be in a focus group, on balance it seemed more beneficial
to obtain a more representative cross-section of responses.
The minute paper exercise was undertaken in tutorials with consent of the course
organiser. This was to encourage participation and maximise the number of responses.
186
Students were asked three questions about their PeerWise experience, focussing mainly on
the feedback given and received via the system:
Do you feel you receive any benefits yourself from giving feedback to
others? If so, what are they? If not why not?
If you write a comment that is more than a simple ‘good question’ type
comment, how do you decide what to write?
If someone comments upon one of your questions how do you use this
feedback?
The vast majority of students in Physics 1B already have experience with PeerWise
from Physics 1A in semester one. Students were not asked to exclude their prior experiences
of PeerWise from their answers – the aim of this exercise was to gain as deep an insight into
student behaviour as possible.
Students were given three blank A6 pieces of paper, each in a different colour, so
that the question they were answering was easily identifiable. The paper was blank so as to
encourage free expression of thought, and was small so as not to seem too daunting – to turn
the exercise into more of a brain-storm and encouraging participation and the submission of
honest responses. The papers for each question were kept separate – this meant that it was
not possible to track the responses of a particular student – but given that the responses were
also completely anonymous, it was felt that this would have little impact on the interpretation
of the findings; there would be no way to associate responses with activity levels or
attainment and given that a member of staff was not observing each individual student, it
could not be guaranteed that any name provided on the responses would in fact be that of the
person who had completed the task. Therefore, in this instance, anonymity was essential to
make students feel comfortable about participating, to encourage the provision of honest
responses.
Although students are encouraged to attend tutorials, many students were absent
from class when the exercise was conducted. Additionally, although students were
encouraged by their tutors to answer the questions, a handful of students submitted blank or
“spoiled” response forms, further reducing the response rate. For two of the questions: Do
you feel you receive any benefits yourself from giving feedback to others? and If you write a
comment that is more than a simple ‘good question’ type comment, how do you decide what
to write?, 129 responses were gathered. For the question; If someone comments upon one of
187
your questions how do you use this feedback? 127 responses were collected. The overall
response rate was just over 50%.
The open responses from all sources were coded in NVivo 10. Using an approach
loosely based on grounded theory [198], each response was broken down into key ideas and
each idea given a code encapsulating the idea. As new ideas emerged, previously coded data
were re-classified according to the new coding scheme; in a constant comparison process.
Using this iterative process and continually revising the data in light of the codes allowed
definitional drift to be identified early, thus ensuring that the coding was reliable – an
important issue given that coding was undertaken by a sole person [199]. As each data
source was being coded line-by-line, from the outset, the codes had a high level of
granularity and were coded within each data source (questionnaire, minute paper question
etc.) [193,200]. This resulted in a plethora of codes and quite noisy data, where codes may
essentially be duplicated across data sources. To rationalise the data, where appropriate,
codes within each data source were then combined into broader codes. For example, if one
student said they disliked PeerWise (coded “dislike PeerWise”), and a second said they hated
PeerWise (coded “hate PeerWise”), these codes would be collapsed into a “dislike
PeerWise” code. Although clearly there is a distinction between these two responses, given
the large amount of data and variety of themes highlighted, it was considered out of scope of
the work at the present time to conduct such a fine-grained analysis when both responses
essentially indicated a negative feeling towards using PeerWise.
Upon completion of coding within each data source it was evident that there were
broader themes emerging across several data sources with codes essentially highlighting the
same issues – even when the actual question or focus of each source was slightly different.
Where duplicate codes had been generated from separate sources, they were then merged
into a single code across all datasets. After a rationalised list of codes was created, the
revised codes were then categorised into the emerging themes. Appendix I details the codes
within each theme which will be discussed in Section 8.3.
Whilst it may be argued that combining codes across datasets may result in a loss of
the integrity of the dataset as a whole – with the coded passages becoming decontextualized
[201] – given the large number of sources – each with relatively few data points, this was
considered the most appropriate method to identify overarching themes highlighted by
students. If students from different courses, from different year groups, who answered
different questions about PeerWise, highlighted similar issues, then this would indicate some
level of generalizability of theme [197]. A number of codes did not fall under any
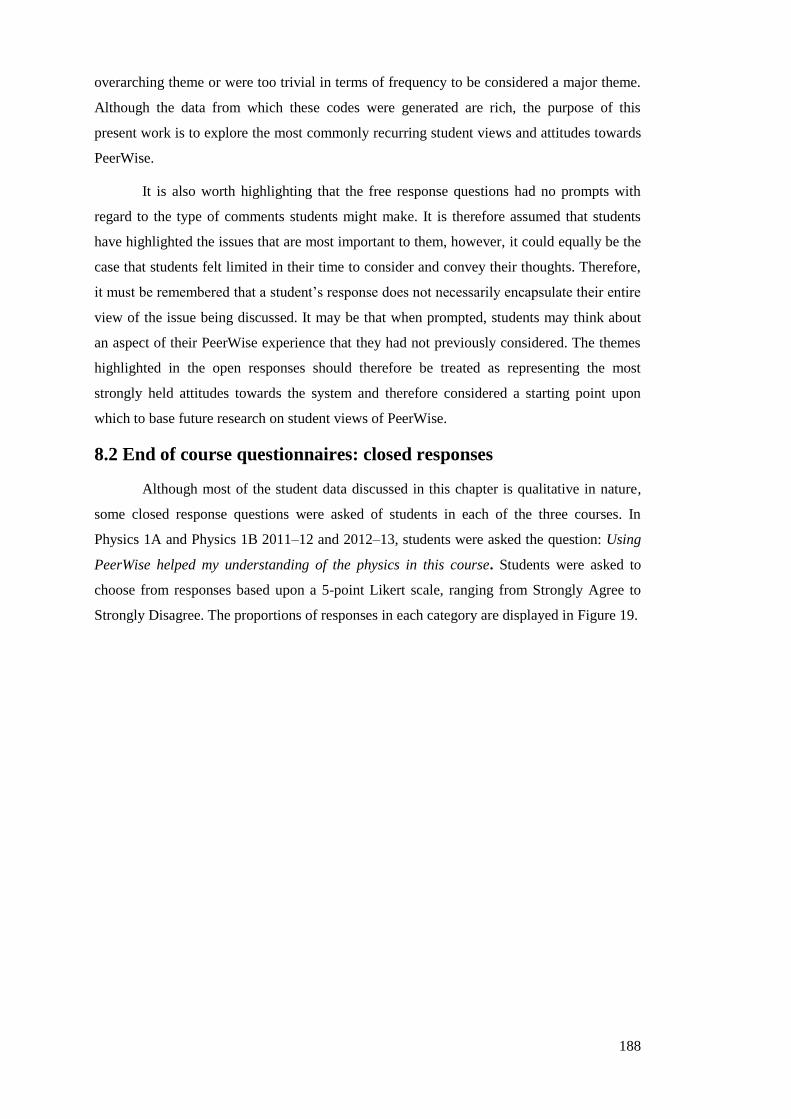
188
overarching theme or were too trivial in terms of frequency to be considered a major theme.
Although the data from which these codes were generated are rich, the purpose of this
present work is to explore the most commonly recurring student views and attitudes towards
PeerWise.
It is also worth highlighting that the free response questions had no prompts with
regard to the type of comments students might make. It is therefore assumed that students
have highlighted the issues that are most important to them, however, it could equally be the
case that students felt limited in their time to consider and convey their thoughts. Therefore,
it must be remembered that a student’s response does not necessarily encapsulate their entire
view of the issue being discussed. It may be that when prompted, students may think about
an aspect of their PeerWise experience that they had not previously considered. The themes
highlighted in the open responses should therefore be treated as representing the most
strongly held attitudes towards the system and therefore considered a starting point upon
which to base future research on student views of PeerWise.
8.2 End of course questionnaires: closed responses
Although most of the student data discussed in this chapter is qualitative in nature,
some closed response questions were asked of students in each of the three courses. In
Physics 1A and Physics 1B 2011–12 and 2012–13, students were asked the question: Using
PeerWise helped my understanding of the physics in this course. Students were asked to
choose from responses based upon a 5-point Likert scale, ranging from Strongly Agree to
Strongly Disagree. The proportions of responses in each category are displayed in Figure 19.
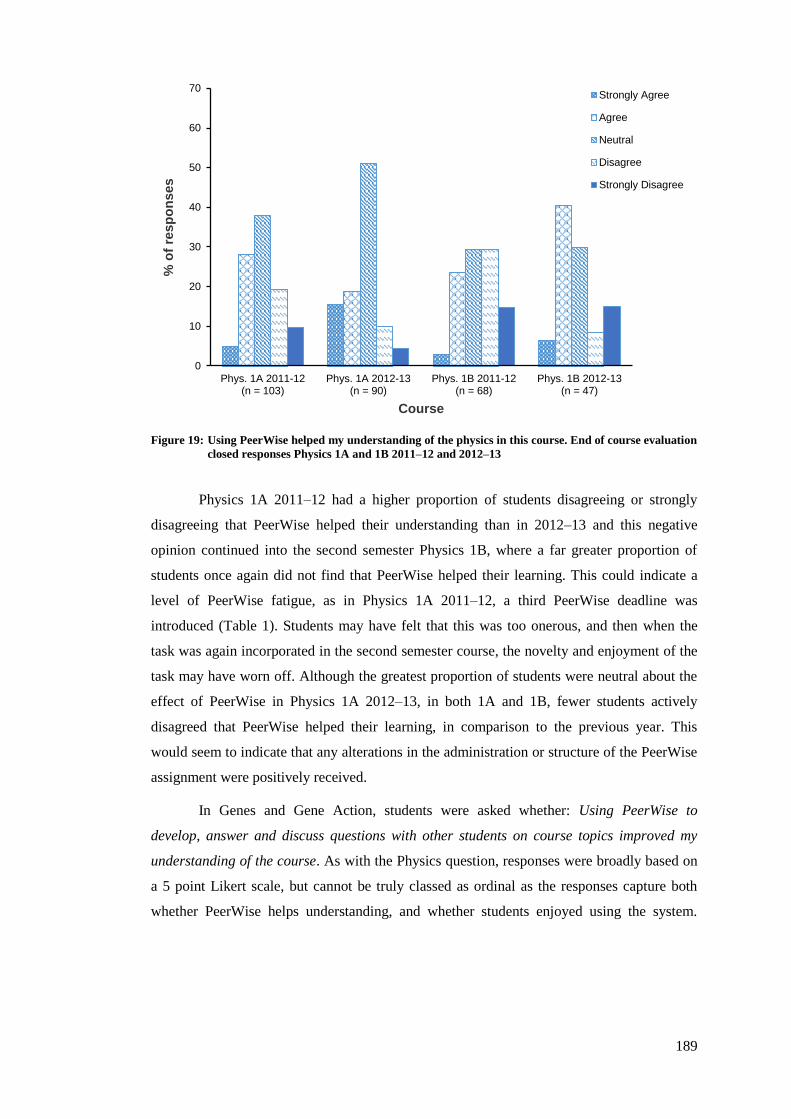
189
Figure 19: Using PeerWise helped my understanding of the physics in this course. End of course evaluation
closed responses Physics 1A and 1B 2011–12 and 2012–13
Physics 1A 2011–12 had a higher proportion of students disagreeing or strongly
disagreeing that PeerWise helped their understanding than in 2012–13 and this negative
opinion continued into the second semester Physics 1B, where a far greater proportion of
students once again did not find that PeerWise helped their learning. This could indicate a
level of PeerWise fatigue, as in Physics 1A 2011–12, a third PeerWise deadline was
introduced (Table 1). Students may have felt that this was too onerous, and then when the
task was again incorporated in the second semester course, the novelty and enjoyment of the
task may have worn off. Although the greatest proportion of students were neutral about the
effect of PeerWise in Physics 1A 2012–13, in both 1A and 1B, fewer students actively
disagreed that PeerWise helped their learning, in comparison to the previous year. This
would seem to indicate that any alterations in the administration or structure of the PeerWise
assignment were positively received.
In Genes and Gene Action, students were asked whether: Using PeerWise to
develop, answer and discuss questions with other students on course topics improved my
understanding of the course. As with the Physics question, responses were broadly based on
a 5 point Likert scale, but cannot be truly classed as ordinal as the responses capture both
whether PeerWise helps understanding, and whether students enjoyed using the system.
0
10
20
30
40
50
60
70
Phys. 1A 2011-12(n = 103)
Phys. 1A 2012-13(n = 90)
Phys. 1B 2011-12(n = 68)
Phys. 1B 2012-13(n = 47)
% o
f re
sp
on
ses
Course
Strongly Agree
Agree
Neutral
Disagree
Strongly Disagree
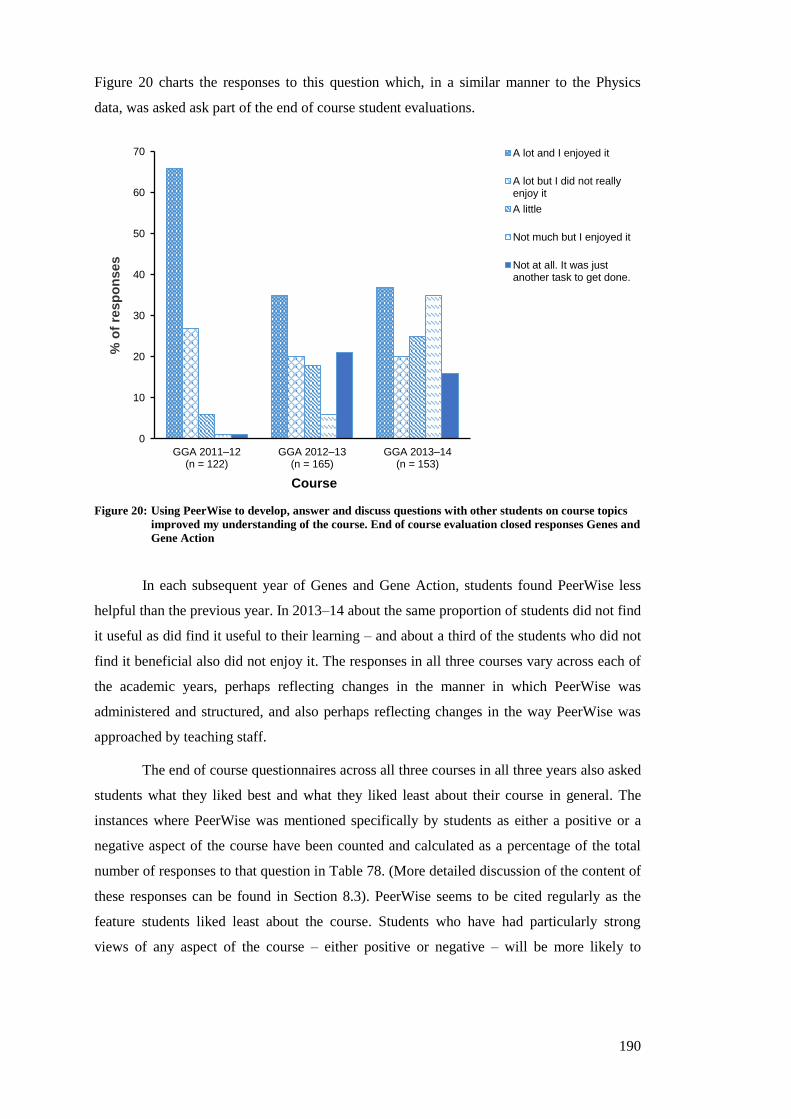
190
Figure 20 charts the responses to this question which, in a similar manner to the Physics
data, was asked ask part of the end of course student evaluations.
Figure 20: Using PeerWise to develop, answer and discuss questions with other students on course topics
improved my understanding of the course. End of course evaluation closed responses Genes and
Gene Action
In each subsequent year of Genes and Gene Action, students found PeerWise less
helpful than the previous year. In 2013–14 about the same proportion of students did not find
it useful as did find it useful to their learning – and about a third of the students who did not
find it beneficial also did not enjoy it. The responses in all three courses vary across each of
the academic years, perhaps reflecting changes in the manner in which PeerWise was
administered and structured, and also perhaps reflecting changes in the way PeerWise was
approached by teaching staff.
The end of course questionnaires across all three courses in all three years also asked
students what they liked best and what they liked least about their course in general. The
instances where PeerWise was mentioned specifically by students as either a positive or a
negative aspect of the course have been counted and calculated as a percentage of the total
number of responses to that question in Table 78. (More detailed discussion of the content of
these responses can be found in Section 8.3). PeerWise seems to be cited regularly as the
feature students liked least about the course. Students who have had particularly strong
views of any aspect of the course – either positive or negative – will be more likely to
0
10
20
30
40
50
60
70
GGA 2011–12 (n = 122)
GGA 2012–13 (n = 165)
GGA 2013–14 (n = 153)
% o
f re
sp
on
ses
Course
A lot and I enjoyed it
A lot but I did not reallyenjoy it
A little
Not much but I enjoyed it
Not at all. It was justanother task to get done.
191
respond to this question. The Physics courses tend to have a smaller proportion of the
respondents making any mention of PeerWise, however, when it is mentioned it is
mentioned in a negative context. In GGA 2012–13 and 2013–14, just over a third and just
under a half of students who answered the questionnaire mentioned PeerWise and in both
years, there were a greater number of negative comments than positive comments. This
reflects the mixed range of responses to the Likert scale questions.
Table 78: Number of times PeerWise is mentioned as the best or worst aspect of the course
Course Phys. 1A
2011–12
Phys 1A
2012–13
Phys.1A
2013–14
Phys 1B
2011–12
Phys.1B
2012–13
GGA
2011–12
GGA
2012–13
GGA
2013–
14
Like Best 5 10 3 1 0 13 18 32
Like Least 25 6 6 8 3 3 42 41
n PW
mentions/n
respondents
30/103 16/90 9/72 9/68 3/47 16/122 60/165 73/153
8.3 Themes from open responses questions
Six main aspects of PeerWise were identified from the coding process outlined in
Section 8.1: community development; compulsory nature; emotional response; quality; skills
and learning; and usefulness. These themes and the individual codes corresponding to each
of them, are detailed in Appendix I. The aim of this section is to explore in more detail each
of the aspects of PeerWise engagement and to discuss potential implications for encouraging
future engagement with, and maximising learning benefits gained from, the system.
8.3.1 Community development
Although not the most frequently occurring theme from the student responses,
students did recognise the community aspect of the system. Given that engagement with
PeerWise results in the establishment of a self-regulating peer-learning environment, and
that its success is dependent on buy-in from students, this recognition is important. It seems
to be the case that some students have developed a sense of community – an understanding
that whilst there are course requirements for participation, the system itself requires
participation in order to be an effective resource, so everyone can benefit from it.
“PeerWise works better when everyone collaborates.”
“If you receive feedback you end up giving feedback and so the cycle
works.”
Do you feel you receive any benefits yourself from
giving feedback to others? Physics 1B 2013–14
192
Several comments highlighted that sharing perspectives is important – students
chose to provide feedback when they thought that their contribution would be useful to the
community, or to commend another student on the helpfulness of their questions, thus
providing support and encouragement for their peers. They also comment that sharing
perspectives enhances their own learning.
“Giving feedback to other people’s work can help you spot problems with
your own work you might not otherwise have noticed or thought about.”
“You realise your own level of physics in comparison with others.”
Do you feel you receive any benefits yourself from
giving feedback to others? Physics 1B 2013–14
“Sometimes I do not agree with it and it can lead to a debate, which is
always useful in some way.”
If someone comments upon one of your questions
how do you use this feedback? Physics 1B 2013–14
Whilst some students perceived there to be community benefits from engaging with
PeerWise, there were others who disliked any peer interaction and who seemed resistant to
engaging in peer learning activities. They believed that the benefits gained from such
exercises were minimal, in comparison to engaging with instructor questions.
“PeerWise, can’t stand it forcing interaction.”
GGA end of course open responses 2012–13
Students will always have a preference for some types of learning activities over
others, and for some students, engaging in group work or peer learning will be their least
favourite mode of learning. The above quotes highlight that if students are not aware of what
such exercises are trying to achieve, and their potential benefits, then they will perhaps feel
less motivated to engage with them. It is important that students understand the wider
purposes of a task to ensure that even if it is not their preferred way of engaging with course
materials, they can recognise the value of the exercise.
193
8.3.2 Compulsory nature
The compulsory nature of the PeerWise assignments was consistently a source of
contention. Students stated that they engaged with the system to increase their score, or
because the assignment was assessed and therefore compulsory.
“Comment because I am assessed on them!”
Do you feel you receive any benefits yourself from
giving feedback to others? Physics 1B 2013–14
“Just an assignment to be completed as quickly as possible.”
What aspect of PeerWise was most useful to your
learning and why? Physics 1A 2013–14
Also in line with this theme, some students felt that feedback provided was not of a
high quality, and that there was a tendency to prioritise gaining points over engaging deeply
or testing themselves as rigorously as they could. This contrasts with the views of other
students who recognise the collaborative nature of the system and is indicative of the varying
degrees of intrinsic and extrinsic motivation held by different students.
“… having to write a certain amount of comments leads to very useless and
redundant feedback with unnecessary comments.”
Do you feel you receive any benefits yourself from
giving feedback to others? Physics 1B 2013–14
“In all honesty I usually picked the easiest questions so I could quickly get it
over with and revise and maybe do something that was, in my opinions more
important.”
What factors made you decide to answer, comment
on, or rate a particular question in PeerWise?
Physics 1A 2013–14
Although a few students were glad the PeerWise assignment was assessed, the
majority of comments highlighted that they felt it would have been better had it not been
assessed. Given the split opinion about the benefits of PeerWise, and the findings from
previous studies [125,127,131], it would seem doubtful whether in actual fact the level of
engagement would be as high, were PeerWise to be formatively assessed rather than
contributing in a small part towards their grade.
194
“Only use it if I must, that is when it is an assignment.”
What aspect of PeerWise was most useful to your
learning and why? Physics 1A 2013–14
“Once I’ve done the required work I stop using PeerWise. I only use it
because it is marked.”
If someone comments upon one of your questions
how do you use this feedback? Physics 1B 2013–14
The value of the PeerWise assignment within the overall grade also gave students
some dissatisfaction. The need to balance requirements with the value of the assignment
within the course as a whole has been previously highlighted specifically in relation to
PeerWise – some students may prioritise it over other elements in a course, perhaps
becoming too absorbed in the task [119], whist others feel that the proportion of marks
assigned to the assignment is disproportionate to the requirements [119,129]. The time-
consuming nature of peer assessment activities in general is a recurring theme in the
literature [34,64,108].
“PeerWise is good however not worth a very big % of the course even
though it takes up quite a lot of time.”
End of course open responses, GGA 2011–12
The scoring system was also often cited as being problematic – students (in some
courses especially) felt that the marking scheme was too vague, particularly when there were
no set requirements of what had to be done to achieve the maximum number of marks. This,
combined with the fact that in some courses marks were dependent on PeerWise score,
which in turn was dependent on the behaviour of others, made students feel that they were
not certain about what they had to do to gain high marks and that they were competing for
marks. This again reflects the often discussed student mistrust towards peer marking and
assessment and the need for clarity and certainty in marking criteria. That students felt the
system could become over-competitive may in actual fact undermine the collaborative
environment PeerWise was intended to foster.
“PeerWise criteria should be made clear well in advance, the competition
has created tension among peers due to grades entirely depending on the
scores of other people.”
End of course open responses, GGA 2012–13
195
“Myself and others got nasty comments on our question and I think people
were getting too competitive with it.”
End of course open responses, GGA 2012–13
Additionally, there was again the view that the marking scheme did not seem to
reward high-quality submissions, rather focussing on quantity of activity – pitting students
who wanted to put in more effort to submit tricky questions against those who submitted
easy questions because they would be answered more often and given more “likes”.
“It was easy to just answer questions, rate and comment to get good scores,
which meant that you didn’t have to write a good question to get top marks.”
“PeerWise essentially turned into points games and the number of decent,
good quality questions were heavily outnumbered by quick and easy non-
thought-provoking questions that were there simply to allow the authors to
rack up a lot of points through people answering them.”
What aspect of PeerWise was most useful to your
learning and why Physics 1A 2013–14
8.3.3 Emotional response
The questions asked, especially in the end of course questionnaires, provided
students an opportunity to state a response to PeerWise that is best described as an emotional
response. This theme encapsulates situations where students said they liked or disliked
PeerWise, or mentioned their reaction to the assignment with regards to their feelings. Many
of these responses were then expanded into statements that encapsulate some of the other
themes explored in this chapter.
Students often provided a simple, short response stating either their like or dislike of
the system.
“I hate PeerWise it’s one more password to remember.”
What aspect of PeerWise was most useful to your
learning and why did you find it useful? Physics
1A 2013–14
“PeerWise was fantastic, it was such a fresh approach and I really enjoyed
it.”
End of course open responses, Physics 1A 2013–13
196
Students also commented that they felt engaging with PeerWise had an impact on
their confidence. Giving comments and feedback made them feel good about themselves as
they were able to help others, and positive feedback received from others helped their own
confidence levels.
“… constructive comments boost confidence in your knowledge and
understanding.”
If someone comments upon one of your questions
how do you use this feedback? Physics 1B 2013–14
“To some extent I became more comfortable with explaining concepts.”
Do you feel you receive any benefits yourself from
giving feedback to others? Physics 1B 2013–14
A small number of responses did however note that confidence could be broken by
receiving negative comments or if the PeerWise community in a particular course was
becoming over-competitive.
“If the feedback is really negative, I’d be very discouraged.”
If someone comments upon one of your questions
how do you use this feedback? Physics 1B 2013–14
“The competitive atmosphere of PeerWise didn’t suit the rest of the course
and didn’t really help boost confidence over course content.”
What aspect of PeerWise was most useful to your
learning and why? Physics 1A 2013–14
In-line with earlier published work [36,108,139], students also commented on their
lack of confidence, both in terms of writing questions and providing feedback. Students may
dislike the peer marking aspect of the task because of their own feelings of lacking expertise,
they feel unable to provide high quality feedback, and feel like they do not trust their own
knowledge and so are therefore not in a position to trust their peers to provide critique on
their submissions [125]. Students may also feel uncomfortable in critiquing other’s work,
and may feel unconfident in letting others see their own work [36,41]. However, the
anonymous nature of PeerWise may somewhat alleviate both this issue, and the potential of
personal bias to skew critiques [36].
197
“Not really because I’m never sure if I’m right in my corrections/feedback.”
Do you feel you receive any benefits yourself from
giving feedback to others? Physics 1B 2013–14
“Having to submit a question for PeerWise assessments. I frequently felt
unconfident in my level of knowledge.”
End of course open responses, Physics 1A 2011–12
8.3.4 Quality
Across all the instruments, the theme of quality was one of the most frequently
recurring. It is important to note that the overarching theme of quality is not solely a
judgement call on the merits of student submissions, instead the term should be taken to
include comments or observations on the qualities of the question. Students state that they
tend to give feedback on specific features of the question such as the layout of the questions;
specific aspects of the question they disagree with (whether they are in actual fact accurate or
not); and the component parts of the question such as any diagrams that may have been
incorporated, the distractors or the explanation or solution provided.
“Comment on the author’s explanation of the answers.”
“I comment about the potential traps the question leads you into with ‘red-
herring’ data given.”
If you write a comment that is more than a simple
‘good question’ type comment, how do you decide
what to write? Physics 1B 2013–14
In a similar manner, the ease or difficulty of a question is a feature often highlighted
by students, as is the complexity of the question as a whole. Many students simply
mentioned that they looked at a question’s difficulty before answering it. Although they did
not necessarily specify whether they pick a question because it is deemed easy or difficult,
students who did specify often highlighted that they would tend to answer an easy question
rather than a difficult question. This is often because they want to score easy points, feeding
into the competitive nature of the system, or because they just want to get the assessment
over and done with as quickly as possible. Indeed, when asked what made students decide to
interact with a question, 27 responses stated that the ease or rating were influential factors.
This has been highlighted in a previous study of PeerWise use, where students said they used
ratings to determine which questions to answer – with higher quality questions getting more
198
exposure [135]. That higher quality questions get more views, should also be reassuring to
those concerned with students being exposed to erroneous information.
“In all honesty I usually picked the easiest questions so I could quickly get it
over with and revise…”
“Mostly random, but skipped questions which looks like they will need a lot
of work.”
“I rated high when the question was not very simple.”
What factors made you decide to answer, comment
on, or rate a particular question in PeerWise?
Physics 1A 2013–14
In terms of the quality of the feedback provided, opinions were generally very
mixed. Many students felt that most feedback is trivial and not constructive, giving little
benefit to the recipient. There was general attitude that good questions did not require much
constructive feedback and that most feedback just stated whether the question was good or
useful or pointing out simple typographical errors. Questions that have errors or are poorly
structured provide more opportunities for students to provide constructive criticism, an
aspect of commenting that has also been highlighted in the wider literature [202].
“I rarely have seen constructive comments on my questions. The better the
question the less you need to say to the person who made it.”
“No real feedback comment. I have bad spelling so usually it’s just
comments, or jokes to my spelling errors than the comments on the physics
of the problem.”
If someone comments upon one of your questions
how do you use this feedback? Physics 1B 2013–14
Such attitudes are reflected in the fourth sub-theme – the quality of the question.
Students tended to state that they write more constructive comments when there were errors
in the question.
199
“I will write more than “good question” if the question has any noticeable
flaws ….”
“I would only comment if I felt the question was flawed, confusing or
wrong.”
If you write a comment that is more than a simple
‘good question’ type comment, how do you decide
what to write? Physics 1B 2013–14
“commented when I found something wrong or some point not mentioned in
the solution.”
What factors made you decide to answer, comment
on, or rate a particular question in PeerWise?
Physics 1A 2013–14
Students also commented if a question was particularly interesting or special –
perhaps being humorous or with an interesting context.
“If there is an original use of physics knowledge required I will comment on
that.”
“If I write an in-depth comment it is generally because something stood out
about the question whether this was a superb physics questions, some faulty
logic or something funny.”
If you write a comment that is more than a simple
‘good question’ type comment, how do you decide
what to write? Physics 1B 2013–14
Students also took the opportunity in their comments to seek clarification, both when
a question was confusing or badly explained, but also when there is a technical point that
perhaps they did not understand. Students seeking clarification can improve their
understanding, and the students giving the explanations may consolidate their understanding
by explaining the problem further, or may find that they need to improve their own
understanding of the problem if a comment probes a concept more deeply than the original
question.
200
“If I see the explanation is poor either by requesting more help or providing
it myself if I am confident with the topic.”
“I usually either point out what may be wrong or unclear …”
“One I don’t understand is going to get a questioning comment.”
If you write a comment that is more than a simple
‘good question’ type comment, how do you decide
what to write? Physics 1B 2013–14
Although students were keen to pick up on points of confusion or aspects which
could be better explained, many students were also keen to assist the question author by
using their comment to provide an alternative explanation or solution to the problem. This
once again highlights a deep level of engagement with the PeerWise community and the
potential richness of the system, in terms of students taking ownership of their own learning
and further developing the resource to increase its usefulness.
“Often there are other possible answers which have not been considered, so
I would comment explaining other possible answers.”
If you write a comment that is more than a simple
‘good question’ type comment, how do you decide
what to write? Physics 1B 2013–14
“I commented on questions for which the explanation used a different
method than I did to arrive at the same answer.”
What factors made you decide to answer, comment
on, or rate a particular question in PeerWise?
Physics 1A 2013–14
8.3.5 Skills and learning
There are three main aspects of the development of skills and learning gained
through the use of PeerWise. Firstly, how engaging with PeerWise helps (or does not help)
student’s own learning; secondly, how student engagement – especially through providing
comments – can help (or not) others’ learning; and thirdly the extent to which skills of
critical thinking and reflecting can be enhanced. This theme was the theme most often
highlighted in the student responses which is perhaps not surprising, given that PeerWise is
intended to deepen understanding and enhance student learning.
There were mixed responses as to whether PeerWise enhanced a student’s own
learning, and in terms of which aspects of the system were best placed to do this. Some
201
students simply stated that using PeerWise did or did not have any effect on their learning or
on their revision experience. Other students provided more detailed comments outlining that
either answering questions or writing questions helped their knowledge and understanding.
Some students stated that they found writing questions very difficult and that they had to be
secure in their own knowledge before they could author a question. Similar findings have
been cited in the literature, where students feel pressure to write questions on subject matter
when simultaneously trying to understand the concepts themselves [126]. Writing questions
is often viewed as being more difficult than the task would perhaps at first seem [64,57].
Some students also highlighted that feedback could be used to rectify errors or problems in
their question – learning from their mistakes.
“I don’t feel it had any impact on my physics knowledge.”
“It helps consolidate what you know.”
End of course open responses, Physics 1A 2011–12
“It is good as a revision tool for some people but that person isn’t me.”
End of course open responses, Physics 1B 2011–12
“Making question was good for consolidating my learning.”
“Made me concentrate on a specific area of physics and get really good at it
by making a question.”
“It was also good to look at the different ways things were explained, so if
there were two similar questions, it was helpful to look at both
explanations.”
What aspect of PeerWise was most useful to your
learning and why did you find it useful? Physics
1A 2013–14

202
“I found PeerWise as a whole an amazing resource, adding over 500
questions to the many questions that the course already has. I enjoyed going
through and finding both simple review questions on basic understanding
from the beginning of the course and complex questions on a combination of
the more recent topics.”
“… answering other questions were useful as sometimes they were a bit
different to other questions we might have seen before.”
What aspect of PeerWise was most useful to your
learning and why did you find it useful? Physics
1A 2013–14
The views of the students surveyed in the current work are broadly in line with the
opinions highlighted in the literature in relation to the enhancement of their knowledge and
understanding. In engaging with question generation activities, students have stated that their
depth and breadth of knowledge has been increased [125]; more generally, they feel that
writing questions increases engagement with course content in terms of the time spent
learning and motivating personal exploration of the subject matter [34,64].
Some students felt that providing comments did not benefit learning and that the
recipient of the feedback benefited most; however others did note that assessing other
students’ questions helped their own understanding and improved their ability to provide
feedback.
“I get benefit from doing the question itself, rather than giving written
feedback”
“I feel I am only giving the feedback to help the other person with their
mistakes.”
“I am compelled to think how to improve their questions and I thus reflect
more on how to write a good question myself.”
Do you feel you receive any benefits yourself from
giving feedback to others? Physics 1B 2013–14
Some students however did seem to focus on the fact that writing questions helped
their own question writing skills – and enabled them to write better questions and to
appreciate the other side of the question writing process.
203
“If the comment is thought about properly then you have to examine the
question to find good/bad aspects and put yourselves in the shoes of the
quesiton writer. This makes you a better question writer yourself but not
necessarily better at the subject the question is about.”
“Makes me consider the components of a good question and so assists me in
writing my own questions.”
Do you feel you receive any benefits yourself from
giving feedback to others? Physics 1B 2013–14
“PeerWise was quite interesting. It was good to see "the other side" of the
process.”
What aspect of PeerWise was most useful to your
learning and why did you find it useful? Physics
1A 2013–14
It is not clear from these responses whether students were writing better questions
because their understanding was enhanced or because they were better aware of how a good
question was constructed. Both outcomes clearly enhance a student’s learning to some
degree, but it would not be optimal if students were focusing on the mechanics of question
writing rather than stretching their knowledge and understanding. In evaluations of another
online question-generation system, it was highlighted that question generation activities
could have a negative impact on learning if students were focused on the mechanics of
question generation more than the content [64].
Not only did students highlight the state of their own understanding, they also
demonstrated a desire to help others improve their own knowledge and understanding. This
also reflects the sense of community and responsibility students feel towards their peers.
“I try to be as helpful as possible.”
“Something I believe the author could use to better this question and future
questions.”
“Mostly I try to identify areas which can be improved and suggest ideas.”
If you write a comment that is more than a simple
‘good question’ type comment, how do you decide
what to write? Physics 1B 2013–14
Whilst students are not assessed on providing feedback, being able to critically
engage with a piece of work, applying standards to assess its quality, then transferring these

204
standards to one’s own work is an extremely valuable skill. Some students do not use or even
read feedback that is provided – failing to close the feedback loop – an issue often
highlighted in the feedback and assessment literature, and one that has arisen specifically in
the context of PeerWise [202]. Although it has been stated that receiving feedback is a
bonus, and that the main benefit to students may actually be providing the critique, a failure
to engage with feedback means that there will certainly be no chance of any bonus benefits
arising from the receipt of the feedback [116].
“Don’t use it. Just want marks.”
“I don’t usually bother to read it.”
“Keep it in mind when writing my next question I guess (well I don’t know
really, I guess I should but that doesn’t happen all that often) usually I go
‘alright’ and forget about it.”
If someone comments upon one of your questions
how do you use this feedback? Physics 1B 2013–14
Many students on the other hand state that their use of received feedback depends on
its quality, and specifically state that they assess the feedback, reflecting upon the reasons
why comments were made, and deciding whether they agree with them, rather than
automatically altering their question or point of view without coming to an opinion about
whether the critique is valid. This shows engagement with the feedback, critically reflecting
upon its validity – and thus closing the feedback loop.
“I carefully read all the comments and sometimes find constructive and
useful feedback which I may use to improve the questions in future.”
“I try first to understand what they mean and whether I agree with their
feedback.”
“I use feedback by understanding where that person is coming from and
help improve my understanding.”
If someone comments upon one of your questions
how do you use this feedback? Physics 1B 2013–14
In providing feedback, students need to make an assessment about the question.
Students state that this means they have to think more deeply about the question – enhancing
205
understanding and developing a more analytical approach – rather than simply answering
questions.
“Consequently, I am now better capable of criticizing seemingly obvious
flaws made in scientific calculations”
What aspect of PeerWise was most useful to your
learning and why? Physics 1A 2013–14
“It forces me to try and be helpfully critical of people’s work. A skill that is
valuable when running a team or business operation.”
“Commenting on others’ questions is useful as you analyse the quesiton
more closely.”
Do you feel you receive any benefits yourself from
giving feedback to others? Physics 1B 2013–14
8.3.6 Usefulness
Students also often commented on the usefulness, in general, of engaging with
PeerWise – finding it either useful or not useful to their learning. If students perceive an
exercise to be useful then they may be more inclined to engage with it and, in the case of
PeerWise, not just view it as a means of completing an assignment, but use it to help with
their learning and skills development. As with any initiative, some students found PeerWise
very useful, whilst others did not feel they gained any particular benefit from it. It is
worthwhile considering why students did not find PeerWise useful in order to address any
issues that could improve the experience for the students. It has been suggested that if the
exam format does not match the PeerWise exercise (i.e. if there are no question setting or
multiple choice questions included in the final assessment), then this could make students
view PeerWise as being less useful to their learning [126]. It is certainly the case that in
Physics 1A and 1B there are no multiple choice questions in the exam. In analysing the
student responses however, many of the negative comments did not elaborate on why
PeerWise was not useful – rather just stating it was a waste of time, or pointless, or simply
not useful. However a few students did elaborate on the elements of the system that they did
not find beneficial.
206
“No as all I’m saying is how well they have done on a particular question,
doesn’t benefit me.”
“No I generally don’t get any benefit from PeerWise.”
Do you feel you receive any benefits yourself from
giving feedback to others? Physics 1B 2013–14
“I don’t use it. It won’t change anything. PeerWise is not useful.”
If someone comments upon one of your questions
how do you use this feedback? Physics 1B 2013–14
“I enjoyed PeerWise, but didn’t find it extremely useful.”
What aspect of PeerWise was most useful to your
learning and why? Physics 1A 2013–14
On the other hand, many students were more positive about the impact PeerWise had
on their learning. In a similar manner to the students who did not find it useful, some
students wrote quite simple comments, not really expanding upon why they found engaging
with the system beneficial. There were several respondents who did respond in more detail.
“I found the explanations quite useful to see what I had done wrong.”
“It forced me to do more homework problems.”
What aspect of PeerWise was most useful to your
learning and why? Physics 1A 2013–14
“PeerWise is a good way to get students revising lecture material
throughout the course...”
End of course open responses, GGA 2013–14
The variety of questions in terms of difficulty and subject area was also considered
useful. Students deemed PeerWise to be a good source for revision – even if they did not like
participating in the actual exercise – thus they recognised that it could be a beneficial
resource.
207
“PeerWise element was a really good way to revise topics.”
“The PeerWise is useful to a certain extent in helping us to revise what we
have learnt.”
“PeerWise was a very helpful way for reviewing the days lecture material.”
End of course open responses, GGA 2012–13
“PeerWise had a large variety of questions to answer on areas of all the
course which was useful.”
“The sheer diversity of questions available was very helpful.”
What aspect of PeerWise was most useful to your
learning and why did you find it useful? Physics
1A 2013–14
8.4 Discussion
It is evident from the responses to both the closed and open questionnaires that
students views about the incorporation of PeerWise into course assessments are mixed [139].
Some students seem to dislike peer learning activities in general and do not believe PeerWise
to have any educational benefit. Despite this, there is a large proportion of students who
recognise the benefits of engaging with the system – that it fosters a sense of community and
allows students to engage in both peer- and self-assessment. Both in the current work and in
prior research, collaboration is considered an extremely powerful aspect of learning
[28,37,97,125,129]. Engaging with peers, particularly whilst participating in learning
activities that result in student-generated resources, encourages students to become active
participants in their own learning process [28–30]. This develops their sense of ownership
over their learning by allowing them to express their opinions and ideas, thus increasing their
focus on course materials and their motivation to learn [34,36,129].
There was also a recognition from some students that engaging with peers, sharing
and developing knowledge provides a benchmark by which to gauge their own learning, and
may also highlight different ways to approach problem solving. Students’ understanding can
be enriched and problems clarified by drawing on the collective resources, or capital, held by
their classmates [175]. Indeed the idea of being able to assess one’s own understanding in
relation to others has also been highlighted as a key benefit of activities which incorporate
peer assessment and collaboration, both specifically in relation to PeerWise [119,125,129]
and also in relation to peer assessment in general [36,37].
208
Students often recognise the benefits of writing questions, however they may
sometimes fail to recognise that providing feedback can sometimes be more beneficial than
receiving feedback. When students read feedback provided to them, they do tend to reflect
upon it to assess whether the feedback is worth acting upon. Although this reflection perhaps
stems from a mistrust of their peers’ ability to provide feedback, rather than a desire to
engage more deeply with it, this is evidence that the feedback loop is, at least in some cases,
being closed, allowing students to benefit from the comments they receive, and perhaps
encouraging them to think more deeply about feedback they receive in the future.
Student responses also highlight the importance of setting clear standards and
expectations when work is being assessed, and that the issue of fairness is crucial. This
should not be surprising for a number of reasons. Firstly, students have a high personal
investment in getting the best level of qualification that they can – they have invested a
highly significant amount of time, effort and money in their education and they do not want
to lose out in terms of marks in unfair circumstances. Secondly, although this may seem to
be a very mark driven attitude, it is also important to remember that a student’s grades are a
key aspect of future employability, so it is only natural that it is important to students that
their marks are “safe” and fair. Thirdly, many students feel anxious over peer assessment and
group work. They worry about their own ability to contribute, and also the ability of their
peers. When marking schemes and standards are unclear, this may exacerbate concerns
students already hold about engaging with their peers.
From the student response, there is a clear tension between contributing quality
submissions and engaging at a surface level with the system to fulfil the assessment
requirements. The structure of the assessment can significantly influence, not just the way
students interact with the system, but also their satisfaction with the assessment requirements
and the sense of fairness. Although most instructors would view PeerWise as a method of
formative assessment, some marks need to be given to encourage engagement. In the courses
studied here, the threshold is set quite low – between 2% and 3% of the overall mark – but
this allows students to feel that their contribution is recognised and valued. As with all
(formative or summative) assessment activities, it is also vital that the expectations of
students are made clear from the outset, to ensure students are confident that they understand
what they need to do obtain the highest marks.
Assessing any piece of work sends a clear message to students what course
organisers view as important [6] and their standards and expectations [14,15]. It is therefore
essential to consider the implications of how PeerWise is marked. The assignment of marks
209
will influence the behaviour of students as they will want to maximise their performance.
Whilst in the majority of reported studies, PeerWise is implemented to promote deep
learning and critical thinking, it seems to be the case that when marking schemes are based
on PeerWise score, what is actually being valued is early participation, the submission of
correct answers and, in effect, the popularity of student contributions to the system [134]. It
is therefore sometimes unclear whether there is alignment between the method of calculating
the assessment marks and the skills the task is seeking to promote [15]. Whilst using
PeerWise score is a convenient way to assign marks, the focus may be diverted from
encouraging students to take ownership of their own learning and creating their own
understandings – “messy” processes requiring students to grapple with their
misunderstandings and test new ideas – towards rewarding correctness. This means that
students may be more inclined to take shortcuts or adopt a more strategic approach, and
perhaps engage with the system at a more superficial level [15]. Whilst it is easy to use
PeerWise score as a way of assessing the assignment, if deeper, critical thinking is most
important to course organisers, then perhaps using PeerWise score is not the optimal way to
encourage more in-depth, challenging and reflective contributions. The score is based in part
on the behaviour of others, and may therefore encourage competition rather than
collaboration between students. Questions that are difficult may not get as many views or
answers as easy questions and they may also have more flaws if they cover complex
material. Writing such questions could be more enriching for students than composing a
simple question, but using the PeerWise score as a method of assessment would make
writing simple questions strategically more advantageous because it is quicker to complete
and stands a better chance of attracting a high number of responses. When quality or depth of
submission is to be considered in the assessment process, it becomes more difficult to assign
a mark without a high level of instructor input, which would be extremely costly both in
terms of instructor time, but also in terms of the ownership of the system. One of the key
features of PeerWise is that it is a student-led space. It would therefore seem a reasonable
compromise to assign scores based on students’ own contributions to the system, rather than
being dependent on the actions of others. This acknowledges the efforts students go to in
creating and developing the resource, whilst not penalising students for testing ideas,
venturing opinions and clarifying areas of misunderstanding.
Although feedback is mixed, aside from students who do not seem enjoy any form of
collaborative work, most other responses recognise that there is some value in engaging with
PeerWise. Not all students will enjoy or feel comfortable with every activity they will face,
and student opinion does seem dependent to a certain degree on how the task is

210
implemented, including aspects such as the mark value assigned to it; the number of
assignments to be completed; and the way marks are assigned. As with all assessed
activities, clarity of expectation, fairness in the assignment of marks and explicitly informing
students about the purpose of the exercise and the desired learning outcomes, will go some
way to enhance engagement and satisfaction with the PeerWise system.
211
Chapter 9
Conclusions and outlook
This one of the most comprehensive studies of PeerWise undertaken to date,
comprising over 3000 students in six courses, across three disciplines, in three universities,
across three academic years. Aggregating the data allowed direct statistical comparisons of
the relationship between each PeerWise activity and exam score to be made across years,
disciplines and institutions. Although some of the published work does span more than one
academic year and/or several courses [125–127,130,131], most previous research has tended
to focus on a single course, in a single year, situated within one institution
[49,57,119,124,129,134–137,139,183,203]. Moreover, where results from more than one
course have been reported, statistical comparisons between them have not been undertaken.
Analysing individual courses in isolation limits the statistical inferences that can be drawn
when making comparisons. Where individual (non-aggregated) course data has been
analysed in the current work, qualitative comparisons – examining trends and patterns – have
been made. Statistical comparisons across courses have been undertaken on aggregated data.
By comparing data from a range of courses in a variety of settings, patterns in the
statistically significant associations between PeerWise activity and attainment may be more
readily identified across scientific disciplines.
In contrast to the majority of earlier studies, this research attempted to provide a
comprehensive investigation of PeerWise across several cohorts, as well as comparing data
from across several different subject areas and institutions. Data from six undergraduate
courses in the fields of physics, chemistry and biology within three research intensive UK
universities were gathered. In order to determine whether the findings were typical within a
particular course, the study was undertaken across three consecutive academic years.
Although PeerWise was implemented in broadly the same manner – for a small proportion of
course credit; with a hands-off approach from teaching staff – there were some differences
between the courses. The disciplines of physics, chemistry and biology are very different in
course content, and even between courses within the same discipline, the material covered
212
will differ. Moreover, although the courses under study are early years courses, they are of
different academic levels – Physics 1A is a course students undertake in their first semester
at university, whilst GGA takes place in the second semester of second year – meaning that
some students will be far more experienced in the university environment, and have a deeper
understanding of the level of work expected of them. Here some of the key findings are
synthesised, along with discussing implications of the results for both teaching and learning,
and potential directions for future research.
9.1 Summary of results
In Chapter 4, higher levels of engagement across all the activities in PeerWise was
shown to benefit students of all ability levels. This finding mirrors work reported in prior
publications, which compares average exam scores of students with a high level of PeerWise
activity, and average exam scores of students with a low level of activity. In these studies,
the more active group tended to perform better on end of course assessments than the group
with the lower level of activity, these findings were consistent irrespective of whether
activity is measured specifically in relation to answering questions [136,183], and more
generally across the range of PeerWise activities [117,122].
When breaking down PeerWise engagement into its constituent activities, the results
were somewhat nuanced. Students of both higher ability and lower abilities seemed to
benefit consistently, while fewer significant effects were identified for students of
intermediate ability. It may be that any level of engagement helps weaker students – by
engaging to a greater degree, or by starting to think in a more critical way. It may also be
surmised that higher ability students may benefit by engaging in extremely challenging tasks
or creating challenging questions – taking the opportunity to stretch themselves. Students
with a more intermediate level of ability may not improve their performance in such a radical
way as the lower-performing students as they are already performing to a relatively high
standard, but they are perhaps not quite able or willing to engage at the level necessary to
obtain benefits from more challenging tasks or from a deeper approach to learning. This
finding echoes the results from the past PeerWise studies that have used a similar
methodology of dividing students into ability quartiles [117,122]. Students of intermediate
ability may therefore need more support than is available through PeerWise alone to enable
them to make the transition to higher achiever – encouraging them to develop the confidence
and motivation to engage at a deeper level – or indeed they may already be working to their
maximum potential.
213
The connections between students established by engaging with PeerWise have also
been investigated (Chapter 4). Students on average engage with 20% to 30% of their class
through commenting on questions, and between 60% and 90% through answering questions.
This is a larger proportion of the class than they would regularly come into contact with in
the offline lecture/tutorial setting. (All courses in this study were relatively high enrolment
by UK standards – with class sizes ranging from around 90 to 269 students). In Physics 1A
for example, students sit in the same groups in workshops or tutorials, working with the
same group of five or six people throughout the course; this is similar to Physics 1B, where
laboratory exercises are conducted in groups of typically two students, and the maximum
tutorial size is twelve students. Furthermore, it is often observed that within the lecture
setting students tend to sit in the same seats – therefore even when peer learning activities
are implemented within a lecture, students tend to interact with the same group of people.
Theories of social constructivism state that students learn by building upon their prior
knowledge, sharing perspectives with their peers, testing their ideas and actively constructing
more sophisticated understandings [24]. Therefore, connecting with, or having opportunities
to connect with, a large proportion of their cohort enables students to increase their exposure
to a wider range of viewpoints and increases opportunities to challenge them. Moreover, this
work has highlighted a significant, positive relationship between the proportion of the class
with whom students interact, and their end of course exam score, findings which reflect prior
work undertaken in a US physics context [181]. In order to directly compare the nature of
student networks on PeerWise with student offline networks, in future research it would be
beneficial to ask students to recall the classmates with whom they interact to obtain a more
robust measure of their offline connections.
The results described in Chapters 5 to 7, clearly indicate that engagement with
PeerWise (particularly answering questions and writing comments) is positively associated
with performance on end of course examinations. When aggregating data across all of the 18
courses within this research, overall engagement with PeerWise – as measured by the
multiple measure of activity – has a statistically significant, positive association with
attainment. Additionally, each of the individual PeerWise activities – writing questions;
answering questions; giving and receiving comments – also has a significant association with
exam score across all of the current courses when student data is aggregated (accounting for
the nested structure of students within courses). Moreover, these relationships between
PeerWise activity and exam score remain significant even when controlling for students’
prior ability. Although the relationship is significant overall, across all activities and across
all courses, only the relationship between the number of questions answered and exam score
214
remains constant across all courses. For the number of questions authored, comments given
and received, and the multiple measure, the relationship between PeerWise activity and
attainment varies in strength across courses, as does the relationship between pre-score and
attainment. It is important to remember, however, that in the context of multilevel modelling,
the number of courses under study is relatively small, therefore varying relationships
between PeerWise activity and exam score and prior ability and exam score in the multilevel
model, should be interpreted with caution – standard errors might be under estimated,
although the overall fixed relationship may be considered reliable.
When examining the relationships between PeerWise engagement and attainment
within each course, the strength of the relationships vary between courses. As outlined
above, the key exception to this is the relationship between answering questions and exam
score, which also appears to be the individual activity most consistently associated with
attainment in the multiple regression models. Answering questions through drill and practice
has been demonstrated in past research to enhance retention of information [78,80,81]. This
result is in contrast to initial results by Denny et al. where answering questions was not
associated with exam score [131], but is consistent with the findings of Rhind and Pettigrew
[125] and subsequent analyses by Denny et al. [136]. The substantial question repository that
is created through PeerWise usage gives students plenty of opportunities to solidify their
knowledge and understanding. Through testing their knowledge on PeerWise, students can
also identify areas of weakness upon which they can improve – effects of which may also be
reflected in end of course exams. Moreover, answering questions is the only PeerWise
activity that is directly comparable with what students are being asked to do in exams; it is
therefore perhaps not surprising that an activity which enables students to test their
knowledge; practice their recall of information or, in the case of the more sophisticated
PeerWise questions, practice a technique or solving a problem – will have a strong
relationship with end of course exams. As most of the courses under study do not have a
MCQ component to the end of course assessment, the effect of answering questions on exam
performance cannot simply be ascribed to a result of practicing exam technique. That said, it
is perhaps not advisable to directly compare the association between question answering and
exam score with the association between question writing and exam score. Students tend to
answer substantially more than the number of questions required, but tend to author the
minimum – a direct comparison would compare minimum engagement levels with
engagement over and above what is required. It would be interesting for future work to
ascertain, for example, how many questions answered would be equivalent to authoring one
215
question to investigate the optimal levels of PeerWise engagement, maximising the ratio of
the effort expended to results achieved.
One interesting finding is that the aggregate measures of PeerWise activity, such as
the combined measure as outlined in Chapter 4, and the multiple measure from Chapter 7
often demonstrate the strongest relationship with exam performance. This is illustrated in the
effect sizes of the differences in exam score between students with high and low PeerWise
engagement (Chapter 4) and in strength and frequency of the significant correlations
between engagement and exam score (Chapter 7). This provides strong evidence to support
Denny’s hypothesis [122] that the benefits of PeerWise lie in engaging across the range of
tasks available on the system.
Despite the variations in the strength of relationship between PeerWise activity and
exam score within individual courses, it is important to note that this work confirms that for
each activity, PeerWise has a significant positive relationship with exam score when student
data is aggregated across all courses. Within each of the courses, where there is a significant
relationship it tends to be of a small to medium magnitude. Although it is crucial to examine
effect sizes when evaluating the impact of interventions or activities it is also important to
balance any effects with the costs – financial or otherwise – of implementing particular
initiatives, and to consider the costs and benefits of any alternatives [154]. Although the
effects may, at times, be small, PeerWise comprises a small proportion of each course – the
equivalent of one or two traditional weekly tutorial problems. To be able to measure any
effect on attainment – particularly when controlling for a student’s ability – from a relatively
small proportion of the total summative workload (between 1% and 6%) should be
considered to be impressive, especially given that more traditional learning activities are not
routinely analysed in terms of their impact on attainment.
PeerWise seems to be an activity that polarises students (Chapter 8) – indeed, it has
previously been dubbed the “Marmite” of education, in reflection of the diversity of student
opinions about it [139]. As with all learning activities, not all students are receptive to
PeerWise – some feel it is a waste of time and they would rather answer questions from
textbooks; others do not feel comfortable engaging in peer learning activities of any sort.
What is clear is that PeerWise is likely to be very different from other exercises that students
will have engaged with in the past. For that reason, expectations for students should be
communicated clearly at the start of the course – in terms of the quality or the level of work
expected [15,21]; but also in terms of being explicit about the reasons why it is being
implemented and the intended benefits of engagement for students. If students can see the
216
value of a task, they are more likely to engage more effectively and realise the benefits of the
activity [15]. One response often given in the end of course questionnaires was that students
believed authoring questions was a way to understand how questions were constructed, and
how to write an effective question. Whilst it is beneficial for students to write complex
questions, synthesising a range of concepts and challenging their peers, the objective of
PeerWise is not to learn how to write questions, but to use the activity as a vehicle to think
more deeply about the subject area, developing understanding and problem solving skills.
Setting clear learning objectives that align with the skills that are actually being assessed,
and making sure students understand the purpose of a task, is good practice in teaching and
should not necessarily be limited to tasks with which students may lack familiarity [15].
In this study, fairness and the setting of clear expectations were very important to
students, as evidenced by feedback from end of course questionnaires. A regularly cited
complaint about the structure of the assignment was regarding the marking of the
assignment. Teaching staff encouraged students to write high quality questions, and to
engage with the PeerWise task at a high cognitive level. However, the method of
apportioning marks for the PeerWise assignment did not involve credit being directly
assigned to the quality of submission. It was therefore possible to score highly whilst not
fulfilling the intended learning objectives of contributing high quality submissions (within
one’s ZPD). Although the algorithm that calculates PeerWise score incorporates student
ratings as a way of accounting for quality, the accuracy of the ratings in these courses is not
certain – especially in courses where there is a high level of competition between students. It
would seem that this enabled some students to “play the game” – engaging at a lower
cognitive level for the same, if not higher, amount of points than students who engage at a
higher cognitive level, often resulting in student discontent.
Students themselves commented on the quality of the submissions to PeerWise,
often stating that they felt that a lot of the comments posted were not of a high quality and
did not provide constructive feedback. They felt that there was a mix of question quality
submitted, with some students believing that questions were either very simple or very
complicated. Students also tended to answer easier questions first, in order to gain easy
marks and rack up their PeerWise score. Moreover questions that were answered often and
were answered correctly also enhance the author’s score, so the opportunity to increase
points, in addition to the fact that quality or complexity is not directly assessed in the
PeerWise assignment, perhaps provide encouragement for students to write simple questions
and to answer simple questions in order to gain more marks. Students did not tend to
mention the badges that they could earn – perhaps indicating that these aspects of the system
217
were not driving influences for engaging with PeerWise – in contrast to previous findings
[119,120]. Perhaps the motivation to earn more points for the assessment is a more pressing
concern. There seems to be a conflict between the students being motivated to engage with
PeerWise to deepen their learning and skills of problem solving, and the desire to score as
many points as possible. This tension may be compounded when PeerWise marking schemes
are based upon the PeerWise score, and indeed, student concerns about marking were most
apparent in courses such as GGA which base their marking scheme very closely on actual
PeerWise score. This is in contrast to courses such as Physics 1A, which use PeerWise score
to ascertain whether students are in the top or bottom half of the class in terms of
participation – the actual score is not important. Therefore, although the mark given to
students in Physics 1A is to some degree based upon the actions of other students, the effects
of others’ performance is not as great as in GGA. Regardless of the precise marking scheme
used, it has been established that students need to be given some credit for the PeerWise
task, otherwise even the most motivated students will fail to engage to the desired level
[130].
9.2 Implications for teaching staff
When aggregating student data, the overall relationships between PeerWise activity
and attainment are significant across courses and across years. However between courses,
and in different years of the same course, the associations between PeerWise activity and
exam score display some variation. This is interesting because the same teaching staff have
taught the courses in each of the years under study, and according to reports from staff, both
the structure and the student make-up of the courses have remained consistent across
academic years. The variation in relationships between courses would seem to suggest that
there are course-level factors that may contribute to how PeerWise impacts upon exam score.
For example, perhaps the length of time spent scaffolding the activity; the level of an
instructor’s involvement with PeerWise, or their enthusiasm and attitude towards the system
more generally; the size of the class; and the number of PeerWise assignments each asks
their students to contribute. Other activities and teaching methods used within a course may
indirectly impact students’ engagement with PeerWise, for example, Physics 1A is taught
using a flipped-classroom approach. With a larger number of courses it would be possible to
quantify and model some of these factors to try to determine the influencing factors on the
relationship between PeerWise and exam score.
The costs, both in terms of time and money, should also be considered when
assessing the impact of implementing the system. PeerWise is free to use. Once the system is
218
populated with student identifiers, then following any scaffolding activities, it becomes
student populated and moderated. The system is designed to have minimal input from
teaching staff, but this therefore requires that there is buy-in from the students to ensure
enough questions are written, that students answer their peers’ queries and that they provide
feedback about the submissions. If the system is populated by enough questions, the online
nature of PeerWise allows students to engage in the activities whenever they want. They are
able to practice their problem solving and critical thinking skills outwith classroom
constraints of time or location, spending more time on task than they would otherwise be
able to in the classroom.
The variety of tasks to be undertaken on PeerWise, and the fact that quality of
submission is not directly assessed, means that students are able to work to their own level
and to their strengths or interests. As long as they fulfil the minimum requirements for the
task, they will get marks. If a student finds writing questions difficult then they can write a
simple one to start with, perhaps progressing to submitting more complex questions over
time, aided by considering the questions submitted by other students in the same class. If
students are struggling to remember particular concepts they can use the question bank for
drill and practice, or can read up on topics to give feedback to students who have posed
questions or who are struggling with a concept themselves. Therefore the activities
undertaken allows the PeerWise assignment to be differentiated for different levels of
student ability and preferences automatically, allowing students to work within their zone of
proximal development.
Although PeerWise is worth a relatively small proportion of their final grade on all
the courses studied, students often felt it unfair that their marks were dependent on the
actions of other people. This is understandable as unlike group work where results may
depend on the collaboration and performance of the group as a whole, using the PeerWise
score as a means of apportioning marks means that students have limited control over some
of the marks they receive. It is not unreasonable for students to want to know what they have
to do in order to get a certain mark – indeed this is a key feature of criterion referenced
marking [15]. In implementing PeerWise, and indeed any assessment activity, course staff
should be aware of student perceptions of fairness and equity – a failure to do so may result
in some students feeling disenfranchised and perhaps fail to engage with the task to an
acceptable level.
219
9.3 Implications for future research
Throughout this research, exam score has remained the chosen outcome variable.
Using end of course exam score is advantageous for a number of reasons. Exam results are a
means by which student performance at university is measured; end of course examinations
are assessments that the vast majority of students complete; they are reasonably objective
measures of attainment, as each course’s exam is administered and marked under the same
conditions. It is however perhaps not the best way to measure the effects that PeerWise has
on the development of student learning. Higher-order skills need to be given time to develop
– using an exam, which is sat in these courses, approximately 10 weeks after the introduction
of PeerWise, as a measure to assess the benefits of the system may fail to capture any more
subtle or longer-term shifts in students’ learning processes. This might include learning to
assess and question the quality of feedback before implementing it; or thinking about a
problem more carefully to find the most elegant solution, rather than taking a ‘plug and
chug’ approach. Moreover, the proportion of marks within the exam that are dedicated to
assessing higher-order skills rather than testing knowledge may not be sufficient to reflect
any development in problem solving or reasoning skills. It may be interesting to construct an
instrument, independent of discipline, to measure the development of students’ higher-order
skills. This would allow for direct comparison to be more readily made across courses, and
to measure more accurately the development of the skills that tasks such as PeerWise seek to
promote.
The design of this study means that there can only be an association between
engaging with PeerWise and exam score. Without undertaking a randomised controlled trial
it is not possible to ascertain whether engagement with PeerWise causes any increase in
attainment. Such trials are extremely challenging to implement in educational settings, on
account of ethical considerations of fairness and equality; the lack of being able to ‘blind’
participants as to whether they are within, or working with the intervention group (which
may lead to intervention groups modifying their behaviour – the Hawthorne effect – or
perhaps the control group unofficially participating in the intervention); and also the rigid,
time-critical structure of the academic timetable, especially at the university level. It is
extremely difficult to implement randomised studies in education. It is important that
students would not be disadvantaged by being allocated to a particular group – either the
control group if the intervention is successful, or the intervention group if it transpires that it
is not beneficial. That said, control variables have been used to try to partition out effects of
known factors that influence attainment – prior ability, gender, being a major and, in this
220
study, having been educated in the Scottish school system. There are several factors that
have not been controlled for in this work, in particular a student’s work ethic; their attitude
towards learning; and the length of time they spent studying for their exams. Future work
might attempt to structure courses to allow for a control group – perhaps having a mid-
course test, which would enable comparisons to be made between students who were
assigned to a PeerWise assignment group and those who were not. Following the test, the
control group could then be given access to the system and carry out the same assignments
as the test group.
As highlighted above, there would appear to be characteristics of each particular
course and instructor that influence the relationships between PeerWise engagement and
attainment in subtle ways that have not been pin-pointed by the current analysis. It would be
interesting to model some potential factors to highlight features of implementation or
teaching that have an influence on both the relationship between engagement with PeerWise
and attainment, and indeed on student attainment in general. This would further inform and
enhance teaching practice in general, and implementation of PeerWise in particular. That
relationships within courses but across academic years often show substantial variation
despite continuity in teaching staff and similarity in implementation is an area worthy of
further consideration, and perhaps deeper reflection by the teaching staff involved.
9.4 Conclusion
The research reported in this thesis has examined student use of PeerWise across a
range of undergraduate science courses to ascertain: the patterns of interactions of PeerWise
usage arising from engaging with the system; any relationships between engaging with
PeerWise and attainment; and student attitudes towards the system. For each of the four
distinct activities – writing questions, answering questions, writing, and receiving comments
– there exists a significant, positive relationship between PeerWise activity levels and
attainment, even when controlling for students’ ability levels. The relationship between
answering questions and exam-score is constant across all 18 courses examined, however the
data suggests that the relationship between the other activities and exam score varies across
the courses. The significant relationship between aggregated measures of PeerWise activity
and attainment indicates that perhaps the benefit to students of engaging with PeerWise lies
in engagement across all the tasks – working to strengthen one’s own particular weaknesses.
Students are often positive about their experiences with PeerWise and the benefits to
their understanding and enhanced engagement with course materials. Many students
however, find the task onerous. Writing questions was generally regarded as the most
221
difficult component of PeerWise, but students also felt uncomfortable in their ability to
critique others’ work and were often uncertain of the quality of feedback received. Analysis
of the comments given by students illustrates that their perceptions of fairness in the
administration and assessment of course-work can influence their attitude towards a given
task – teaching staff should therefore be clear in the setting of assessment criteria and
perhaps re-double efforts to explain to students the expected benefits of engaging with
PeerWise.
The positive relationships that have emerged between PeerWise activity and
attainment, combined with the often very insightful comments from students about how
engagement with the system has (or has not) benefited their learning, illustrates that the
PeerWise tasks not only positively enhance understanding, but also that students are aware
of engaging more deeply with course materials. Although PeerWise is a small component of
each of the courses studied, this analysis adds to the increasing body of literature
demonstrating the benefits of including active learning activities within STEM education.
Enabling students to develop their higher-order skills is a key component of a university
education. The inclusion of tools such as PeerWise within the curriculum increases
opportunities for students to develop their higher-order skills in problem-solving, evaluation
and critical thinking – essential attributes for graduates to become effective contributors in
the work-place and wider society. Research such as that undertaken here, will become
increasingly important to establish the benefits of these new modes of teaching and learning,
and to ensure that they are implemented in the optimal way. Although many established
methods of teaching and learning have not been evaluated in this manner, evidence-based
curriculum design will only become increasingly influential in justifying investment in
developing new teaching methods and technologies, in maximising their impact on student
learning, and in ensuring universities can respond efficiently and effectively to society’s
changing demands.

222
223
Bibliography
[1] The Quality Assurance Agency for Higher Education Scotland 2016 Graduates for
the 21st Century: Integrating the Enhancement Themes
[2] The Quality Assurance Agency for Higher Education 2016 Skills for employability
[3] University of Edinburgh 2011 Graduate Attributes and Indicative Interpretation (v6
.7 )
[4] Nicol D 2010 The foundation for graduate attributes: Developing self-regulation
through self and peer assessment
[5] Moore J W 1989 Tooling Up for the 21st Century J. Chem. Educ. 66 15–9
[6] Boud D 2000 Sustainable Assessment: Rethinking assessment for the learning
society Stud. Contin. Educ. 22 151–67
[7] Rust C 2002 The Impact of Assessment on Student Learning: How Can the Research
Literature Practically Help to Inform the Development of Departmental Assessment
Strategies and Learner-Centred Assessment Practices? Act. Learn. High. Educ. 3
145–58
[8] Boud D and Associates 2010 Assessment 2020: Seven propositions for assessment
reform in higher education (Sydney: Australian Learning and Teaching Council)
[9] Schleicher A The case for 21st-century learning
[10] Anderson L, Krathwohl D, Airasian P, Cruikshank K, Mayer R, Pintrich P, Raths J
and Wittrock M 2001 A taxonomy for learning and teaching and assessing: A
revision of Bloom’s taxonomy of educational objectives. (Addison Wesley Longman)
[11] Schoenfeld A H 1987 What’s All the Fuss about Metacognition? Cognitive Science
and Mathematics Education ed A H Schoenfeld (New York, NY: Routledge) pp 189–
287
[12] Hattie J 2008 Visible Learning: A Synthesis of over 800 Meta-Analyses Relating to
Achievement (Routledge)
[13] Momsen J L, Long T M, Wyse S A and Ebert-May D 2010 Just the Facts ?
Introductory Undergraduate Biology Courses Focus on Low-Level Cognitive Skills
CBE-Life Sci. Educ. 9 435–40
[14] Biggs J 1996 Enhancing Teaching through Constructive Alignment High. Educ. 32
347–64
[15] Biggs J and Tang C 2011 Teaching for Quality Learning at University (Maidenhead:
Open University Press/McGraw-Hill Education)
[16] Wieman C 2012 Applying New Research to Improve Science Education Issues Sci.
Technol. 29 1–9
[17] Zohar A and Dori Y J 2013 Higher Order Thinking Skills and Low-Achieving
224
Students : Are They Mutually Exclusive ? J. Learn. Sci. 12 145–81
[18] Freeman S, Eddy S L, McDonough M, Smith M K, Okoroafor N, Jordt H and
Wenderoth M P 2014 Active learning increases student performance in science,
engineering, and mathematics. Proc. Natl. Acad. Sci. U. S. A. 111 8410–5
[19] Prince M 2004 Does Active Learning Work? A Review of the Research J. Eng.
Educ. 93 223–31
[20] Hake R R 1998 Interactive-engagement versus traditional methods: A six-thousand-
student survey of mechanics test data for introductory physics courses Am. J. Pharm.
Educ. 66 64–74
[21] Chickering A W and Gamson Z F 1987 Seven Principles For Good Practice in
Undergraduate Education
[22] Driver R, Asoko H, Leach J, Scott P and Mortimer E 1994 Constructing Scientific
Knowledge in the Classroom Educ. Res. 23 5–12
[23] Chaiklin S 2003 The zone of proximal development in Vygotsky’s analysis of
learning and instruction Vygotsky’s educational theory and practice in cultural
context ed A Kozulin (Cambridge University Press) pp 39–64
[24] Vygotsky L 1978 Interaction between learning and development Mind and
Development (Cambridge: Harvard University Press) pp 79–91
[25] Denny P PeerWise. Online learning tool
[26] Collis B and de Boer W 2002 A changing pedagogy in e-learning: From acquisition
to contribution J. Comput. High. Educ. 13 87–101
[27] Hamer J 2006 Some experiences with the “contributing student approach” ItiCSE
(Bologna, Italy: ACM) pp 68–72
[28] Collis B and Moonen J 2006 The contributing student: Learners as co-developers of
learning resources for reuse in web Engaged Learning with Emerging Technologies
ed M Khine and D Hung (New York, NY: Springer) pp 49–67
[29] Hamer J, Cutts Q, Jackova J, Luxton-Reilly A, Mccartney R, Purchase H, Riedesel C
and Sanders K 2008 Contributing student pedagogy inroads - SIGCSE Bull. 40 194–
212
[30] Falkner K and Falkner N J G 2012 Supporting and structuring “contributing student
pedagogy ” in computer science curricula Comput. Sci. Educ. 4 413–43
[31] Denny P, Hamer J and Luxton-Reilly A 2008 Tools that support contribution-based
pedagogies Proc. ACM-IFIP IEEIII 140–54
[32] Yu F-Y and Liu Y-H 2005 Potential Values of Incorporating a Multiple-Choice
Question Construction in Physics Experimentation Instruction Int. J. Sci. Educ. 27
1319–35
[33] Sircar S S and Tandon O P 1999 Involving students in question writing: A unique
feedback with fringe benefits Adv. Phsyiology Educ. 22 591–549
[34] Fellenz M R 2004 Using assessment to support higher level learning: the multiple
choice item development assignment Assess. Eval. High. Educ. 29 703–19
[35] Luxton-Reilly A and Denny P 2010 Constructive evaluation: a pedagogy of student-
contributed assessment Comput. Sci. Educ. 20 145–67
225
[36] Brindley C and Scoffield S 1998 Peer assessment in undergraduate programmes
Teach. High. Educ. 3 79–90
[37] Topping K J 1998 Peer assessment between students in colleges and universities Rev.
Educ. Res. 68 249–76
[38] Schraw G, Crippen K J and Hartley K 2006 Promoting Self-Regulation in Science
Education: Metacognition as Part of a Broader Perspective on Learning Res. Sci.
Educ. 36 111–39
[39] Chin C and Brown D E 2000 Learning in science: A comparison of deep and surface
approaches J. Res. Sci. Teach. 37 109–38
[40] Yu F and Wu C-P 2012 Student Question-Generation: The Learning Processes
Involved and Their Relationships with Students ’ Perceived Value J. Res. Educ. Sci.
57 135–62
[41] Barak M and Rafaeli S 2004 On-line question-posing and peer-assessment as means
for web-based knowledge sharing in learning Int. J. Hum. Comput. Stud. 61 84–103
[42] Chin C and Brown D E 2002 Student-generated questions: A meaningful aspect of
learning in science Int. J. Sci. Educ. 24 521–49
[43] Marbach-Ad G and Sokolove P G 2000 Can undergraduate biology students learn to
ask higher level questions? J. Res. Sci. Teach. 37 854–70
[44] Kilpatrick J 1987 Problem Formulating: Where Do Good Problems Come From?
Cognitive Science and Mathematics Education ed A H Schoenfeld (New York, NY:
Routledge) pp 123–49
[45] Rosenshine B, Meister C and Chapman S 1996 Teaching students to generate
questions: A review of the intervention studies Rev. Educ. Res. 66 181–221
[46] Lan Y and Lin P 2011 Evaluation and improvement of students question-posing
ability in a web-based learning environment Australas. J. Educ. Technol. 27 581–99
[47] Harper K A, Etkina E and Lin Y 2003 Encouraging and analyzing student questions
in a large physics course: Meaningful patterns for instructors J. Res. Sci. Teach. 40
776–91
[48] Bates S P, Galloway R K, Riise J and Homer D 2014 Assessing the quality of a
student-generated question repository Phys. Rev. Spec. Top. - Phys. Educ. Res. 10
020105
[49] Denny P, Luxton-Reilly A, Hamer J and Purchase H 2009 Coverage of course topics
in a student generated MCQ repository ItiCSE vol 41 (Paris, France: ACM) pp 11–5
[50] Denny P, Luxton-Reilly A and Hamer J 2008 The PeerWise system of student
contributed assessment questions Proc. 10th Australasian Computing Education
Conference vol 78 pp 69–74
[51] Palincsar A S 1998 Social constructivist perspectives on teaching and learning.
Annu. Rev. Psychol. 49 345–75
[52] Denner P R and Rickards J P 1987 A developmental comparison of the effects of
provided and generated questions on text recall Contemp. Educ. Psychol. 12 135–46
[53] Foos P W 1989 Effects of Student-Written Questions on Student Test Performance
Teach. Psychol. 16 77–8
[54] Zoller U 1987 The fostering of question-asking capability: A meaningful aspect of
226
problem-solving in chemistry J. Chem. Educ. 64 510
[55] Draper S W 2009 Catalytic assessment: understanding how MCQs and EVS can
foster deep learning Br. J. Educ. Technol. 40 285–93
[56] Dillon J T 1986 Student questions and individual learning Educ. Theory 36 333–41
[57] Palmer E and Devitt P 2006 Constructing multiple choice questions as a method for
learning. Ann. Acad. Med. Singapore 35 604–8
[58] Colbert J T, Olson J K and Clough M P 2007 Using the web to encourage student-
generated questions in large-format introductory biology classes CBE-Life Sci. Educ.
6 42–8
[59] Miyake N and Norman D A 1979 To ask a question, one must know enough to know
what is not known J. Verbal Learning Verbal Behav. 18 357–64
[60] Foos P W, Mora J J and Tkacz S 1994 Student Study Techniques and the Generation
Effect J. Educ. Psychol. 86 567–76
[61] Chi M T H, Leeuw N, Chiu M-H and Lavancher C 1994 Eliciting self-explanations
improves understanding Cogn. Sci. 18 439–77
[62] Yu F-Y and Chen Y-J 2014 Effects of student-generated questions as the source of
online drill-and-practice activities on learning Br. J. Educ. Technol. 45 316–29
[63] Yu F, Liu Y and Chan T 2005 A web-based learning system for question posing and
peer assessment Innov. Educ. Teach. Int. 42 337–48
[64] Pittenger A L and Lounsbery J L 2011 Student-generated questions to assess
learning in an online orientation to pharmacy course Am. J. Pharm. Educ. 75
[65] Harper R 2003 Multiple-choice Questions – A Reprieve BEE-j 2 2–7
[66] Nicol D 2007 E-assessment by design: using multiple-choice tests to good effect J.
Furth. High. Educ. 31 53–64
[67] Mcleod P J and Snell L 1996 Student-generated MCQs Med. Teach. 18
[68] Stanger-Hall K F 2012 Multiple-choice exams: an obstacle for higher-level thinking
in introductory science classes. CBE Life Sci. Educ. 11 294–306
[69] Kerkman D D, Kellison K L, Pinon M F, Schmidt D and Lewis S 1994 The quiz
game: Writing and explaining questions improve quiz scores Teach. Psychol. 21 104–
6
[70] Arthur N 2006 Using student-generated assessment items to enhance teamwork and
the learning process Synergy 22–3
[71] Olde C V and Jong T De 2004 Student-generated assignments about electrical
circuits in a computer simulation Int. J. Sci. Educ. 26 859–73
[72] Berry J W and Chew S L 2008 Improving learning through interventions of student-
generated questions and concept maps Teach. Psychol. 35 305–12
[73] Wilson E V 2004 ExamNet asynchronous learning network: augmenting face-to-face
courses with student-developed exam questions Comput. Educ. 42 87–107
[74] Frase L T and Schwartz B J 1975 Effect of question production and answering on
prose recall J. Chem. Educ. 67 628–35
[75] Weinstein Y, McDermott K B and Roediger H L 2010 A comparison of study
227
strategies for passages: rereading, answering questions, and generating questions. J.
Exp. Psychol. Appl. 16 308–16
[76] Papinczak T, Peterson R, Babri A S, Ward K, Kippers V and Wilkinson D 2012
Using student-generated questions for student-centred assessment Assess. Eval. High.
Educ. 37 439–52
[77] McGregor A R and Merchant K W 2005 Reflections on using student-authored
questions to encourage learning in physics Proceedings of The Australian Conference
on Science and Mathematics Education (formerly UniServe Science Conference) vol
11 pp 75–80
[78] Larsen D P, Butler A C and Roediger H L 2008 Test-enhanced learning in medical
education Med. Educ. 42 959–66
[79] Karpicke J D and Roediger H L 2007 Repeated retrieval during learning is the key to
long-term retention J. Mem. Lang. 57 151–62
[80] Karpicke J D and Roediger H L 2008 The critical importance of retrieval for
learning. Science 319 966–8
[81] Roediger H L and Karpicke J D 2006 The Power of Testing Memory . Perspect.
Psychol. Sci. 1 181–210
[82] Hamaker C 1986 The Effects of Adjunct Questions on Prose Learning Rev. Educ.
Res. 56 212–42
[83] Karpicke J D, Butler A C and Roediger H L 2009 Metacognitive strategies in student
learning: do students practise retrieval when they study on their own? Memory 17
471–9
[84] Karpicke J D and Grimaldi P J 2012 Retrieval-Based Learning: A Perspective for
Enhancing Meaningful Learning Educ. Psychol. Rev. 24 401–18
[85] Nelson M M and Schunn C D 2008 The nature of feedback: how different types of
peer feedback affect writing performance Instr. Sci. 37 375–401
[86] Liu N and Carless D 2006 Peer feedback: the learning element of peer assessment
Teach. High. Educ. 11 279–90
[87] Lu J and Law N 2011 Online peer assessment: effects of cognitive and affective
feedback Instr. Sci. 40 257–75
[88] Cho Y H and Cho K 2010 Peer reviewers learn from giving comments Instr. Sci. 39
629–43
[89] Li L, Liu X and Steckelberg A L 2010 Assessor or assessee: How student learning
improves by giving and receiving peer feedback Br. J. Educ. Technol. 41 525–36
[90] Higher Education Funding Council for England 2015 National Student Survey 2015
Summary Data
[91] Jonsson A 2012 Facilitating productive use of feedback in higher education Act.
Learn. High. Educ. 14 63–76
[92] Gibbs G and Simpson C 2004 Conditions Under Which Assessment Supports
Students’ Learning Learn. Teach. High. Educ. 3–31
[93] Duncan N 2007 “Feed-forward”: improving students’ use of tutors' comments
Assess. Eval. High. Educ. 32 271–83
228
[94] Nicol D and Macfarlane-Dick D 2006 Formative assessment and self-regulated
learning: a model and seven principles of good feedback practice Stud. High. Educ.
31 199–218
[95] Taras M 2002 Using Assessment for Learning and Learning from Assessment
Assess. Eval. High. Educ. 27 501–10
[96] Woo Y and Reeves T C 2007 Meaningful interaction in web-based learning: A social
constructivist interpretation Internet High. Educ. 10 15–25
[97] Boud D, Cohen R and Sampson J 1999 Peer Learning and Assessment Assess. Eval.
High. Educ. 24 413–26
[98] Yu F-Y and Liu Y-H 2009 Creating a psychologically safe online space for a
student-generated questions learning activity via different identity revelation modes
Br. J. Educ. Technol. 40 1109–23
[99] van Gennip N A E, Segers M S R and Tillema H H 2009 Peer assessment for
learning from a social perspective: The influence of interpersonal variables and
structural features Educ. Res. Rev. 4 41–54
[100] Chin C 2001 Learning in Science: What do Students’ Questions Tell Us About Their
Thinking ? Educ. J. 29
[101] Li L, Liu X and Zhou Y 2012 Give and take: A re-analysis of assessor and assessee’s
roles in technology-facilitated peer assessment Br. J. Educ. Technol. 43 376–84
[102] Boud D and Molloy E 2013 Rethinking models of feedback for learning: the
challenge of design Assess. Eval. High. Educ. 38 698–712
[103] Sluijsmans D, Dochy F and Moerkerke G 1999 Creating a learning environment by
using self-, peer- and co-assessment Learn. Environ. Res. 1 293–319
[104] Cho K, Schunn C D and Charney D 2006 Commenting on Writing Typology and
Perceived Helpfulness of Comments from Novice Peer Reviewers and Subject Matter
Experts Writ. Commun. 23 260–94
[105] Cho K and MacArthur C 2011 Learning by reviewing. J. Educ. Psychol. 103 73–84
[106] Yu F-Y 2011 Multiple peer-assessment modes to augment online student question-
generation processes Comput. Educ. 56 484–94
[107] Nicol D, Thomson A and Breslin C 2013 Rethinking feedback practices in higher
education: a peer review perspective Assess. Eval. High. Educ. 39 102–22
[108] Hanrahan S J and Isaacs G 2001 Assessing Self- and Peer-assessment: The students’
views High. Educ. Res. Dev. 20 53–70
[109] Donovan P 2014 Closing the feedback loop: physics undergraduates’ use of feedback
comments on laboratory coursework Assess. Eval. High. Educ. 39 1017–29
[110] Tseng S-C and Tsai C-C 2007 On-line peer assessment and the role of the peer
feedback: A study of high school computer course Comput. Educ. 49 1161–74
[111] Gielen S, Peeters E, Dochy F, Onghena P and Struyven K 2010 Improving the
effectiveness of peer feedback for learning Learn. Instr. 20 304–15
[112] Higgins R, Hartley P and Skelton A 2002 The Conscientious Consumer:
Reconsidering the role of assessment feedback in student learning Stud. High. Educ.
27 53–64
229
[113] Sadler D R 1989 Formative assessment and the design of instructional systems Instr.
Sci. 18 119–44
[114] Ertmer P A, Richardson J C, Belland B, Camin D, Connolly P, Coulthard G, Lei K
and Mong C 2007 Using Peer Feedback to Enhance the Quality of Student Online
Postings: An Exploratory Study J. Comput. Commun. 12 412–33
[115] Wen M L and Tsai C-C 2006 University Students’ Perceptions of and Attitudes
Toward (Online) Peer Assessment High. Educ. 51 27–44
[116] Hamer J, Purchase H, Luxton-Reilly A and Denny P 2014 A comparison of peer and
tutor feedback Assess. Eval. High. Educ. 1–14
[117] McQueen H A, Shields C, Finnegan D J, Higham J and Simmen M W 2014 Peerwise
provides significant academic benefits to biological science students across diverse
learning tasks, but with minimal instructor intervention. Biochem. Mol. Biol. Educ. a
Bimon. Publ. Int. Union Biochem. Mol. Biol. 1–11
[118] Chin C 2002 Student-Generated Questions: Encouraging Inquisitive Minds in
Learning Science Teacing Learn. 23 59–67
[119] Ryan B J 2013 Line up, line up: using technology to align and enhance peer learning
and assessment in a student centred foundation organic chemistry module Chem.
Educ. Res. Pr. 14 229–38
[120] Denny P 2013 The effect of virtual achievements on student engagement Proc.
SIGCHI Conf. Hum. Factors Comput. Syst. - CHI ’13 763
[121] Luxton-Reilly A, Denny P, Plimmer B and Bertinshaw D 2011 Supporting student-
generated free-response questions Proc. 16th Annu. Jt. Conf. Innov. Technol.
Comput. Sci. Educ. - ITiCSE ’11 153
[122] Denny P, Hamer J, Luxton-Reilly A and Purchase H 2008 PeerWise: Students
sharing their multiple choice questions ICER (ACM) pp 51–8
[123] Bates S P, Galloway R K and McBride K L 2012 Student-generated content: using
PeerWise to enhance engagement and outcomes in introductory physics courses 2011
Physics Education Research Conference ed N Rebello, P Engelhardt and C Singh
(Omaha) pp 123–6
[124] Galloway K W and Burns S 2014 Doing it for themselves: students creating a high
quality peer-learning environment Chem. Educ. Res. Pr.
[125] Rhind S M and Pettigrew G W 2012 Peer generation of multiple-choice questions:
student engagement and experiences. J. Vet. Med. Educ. 39 375–9
[126] Denny P, Hanks B, Simon B and Bagley S 2011 PeerWise: Exploring conflicting
efficacy studies Proceedings of the seventh international workshop on Computing
education research pp 53–9
[127] Devon J, Paterson J H, Moffat D C and McCrae J 2012 Evaluation of student
engagement with peer feedback based on student-generated MCQs ITALICS 11
[128] Paterson J, Wilson J N and Leimich P 2010 Uses of peer assessment in database
teaching and learning Data security and security data ed L . MacKinnon (Berlin:
Springer-Verlag) pp 135–46
[129] Hooper A S C, Park S J and Gerondis G 2011 Promoting student participation and
collaborative learning in a large Info 101 class: Student perceptions of PeerWise web
2.0 technology. Proceedings of Higher Education Research and Development Society
230
of Australasia International Conference
[130] MacRaighne A, Casey M M, Howard R, Ryan B, Mac Raighne A, Casey M M,
Howard R and Ryan B 2015 Student Attitudes to an Online, Peer-instruction,
Revision Aid in Science Education J. Perspect. Appl. Acad. Pract. 3 49–60
[131] Denny P, Luxton-Reilly A and Hamer J 2008 Student use of the PeerWise system
ItiCSE 40 73–7
[132] Denny P 2010 Motivating online collaborative learning ItiCSE vol 37 (Ankara,
Turkey) p 300
[133] Casey M M, Bates S P, Galloway K W, Galloway R K, Hardy J, Kay A E, Kirsop P
and McQueen H A 2014 Scaffolding student engagement via online peer learning
Eur. J. Phys. 35 045002
[134] Bottomley S and Denny P 2011 A participatory learning approach to biochemistry
using student authored and evaluated multiple-choice questions. Biochem. Mol. Biol.
Educ. 39 352–61
[135] Denny P, Luxton-Reilly A and Simon B 2009 Quality of student contributed
questions using PeerWise Proc. 11th Australasian Computing Education Conference
(Wellington, New Zealand) pp 55–63
[136] Denny P, Hanks B and Simon B 2010 PeerWise: Replication study of a student-
collaborative self-testing web service in a U.S. setting SIGCSE pp 421–53
[137] Purchase H, Hamer J, Denny P and Luxton-Reilly A 2010 The Quality of a PeerWise
MCQ Repository Proc. 12th Australasian Computing Education Conference pp 137–
46
[138] Denny P 2014 Students learn by generating study questions – but the content
matters! PeerWise Community
[139] Sykes A, Denny P and Nicolson L 2011 PeerWise - The Marmite of Veterinary
Student Learning Proceedings of the 10th European Conference on E-Learning, Vols
1 and 2 ed S G and A Rospigliosi
[140] Singh L 2014 Technology enhanced peer learning with PeerWise : Experiences and
perceptions from a developing country Caribb. Teach. Sch. 4 5–22
[141] Luxton-Reilly A, Denny P, Plimmer B and Sheehan R 2012 Activities, Affordances
and Attitude - How Student-generated Questions Assist Learning ItiCSE (Haifa:
ACM) pp 4–9
[142] UCAS 2015 UCAS Search tool
[143] Unistats 2015 About Unistats
[144] Waldrop M M 2015 Why we are teaching science wrong, and how to make it right
Nature 523 272–4
[145] Henderson C and Dancy M 2009 Impact of physics education research on the
teaching of introductory quantitative physics in the United States Phys. Rev. Spec.
Top. - Phys. Educ. Res. 5 1–9
[146] Andrews T M, Leonard M J, Colgrove C A and Kalinowski S T 2011 Active
learning not associated with student learning in a random sample of college biology
courses CBE Life Sci. Educ. 10 394–405
[147] Hestenes D, Wells M and Swackhamer G 1992 Force Concept Inventory Phys.
231
Teach. 30 1–15
[148] Hutchison D and Styles B 2010 A guide to running randomised controlled trials for
educational researchers (Slough)
[149] Kay A E, Hardy J and Bates S 2012 A level playing field? Students’ experiences of
assessment in stem disciplines Proceedings of the HEA STEM Learning and
Teaching Conference
[150] Donnelly R C A 2014 Gender differences in undergraduate students’ performance,
perception and participation in physics (The University of Edinburgh)
[151] Miyake A, Kost-Smith L E, Finkelstein N D, Pollock S J, Cohen G L and Ito T A
2010 Reducing the Gender Achievement Gap in College Science: A Classroo Study
of Values Affirmation. Science 330 1234–7
[152] Kost-Smith L E, Pollock S J and Finkelstein N D 2010 Gender disparities in second-
semester college physics: The incremental effects of a “smog of bias” Phys. Rev.
Spec. Top. - Phys. Educ. Res. 6 020112
[153] Creech L R and Sweeder R D 2012 Analysis of student performance in large-
enrollment life science courses. CBE Life Sci. Educ. 11 386–91
[154] Lipsey M W, Puzio K, Yun C, Hebert M A, Steinka-Fry K, Cole M W, Roberts M,
Anthony K S and Busick M D 2013 Translating the Statistical Representation of the
Effects of Education Interventions Into More Readily Interpretable Forms
[155] Cohen J 1992 A Power Primer Psychol. Bull. 112 155–9
[156] Elliot K and Schagen I 2004 But what does it mean? The use of effect sizes in
education research (National Foundation for Educational Research)
[157] Field A P 2013 Discovering Statistics using SPSS (London: Sage Publications)
[158] Robson K and Pevalin D 2016 Multilevel Modeling in Plain Language (Lomdon:
Sage Publications Ltd)
[159] Snijders T A B and Bosker R J 2012 Multilevel Analysis. An Introduction to Basic
and Advanced Multilevel Modeling (London: Sage Publications)
[160] Luke D A 2004 Multilevel Modeling (Thousand Oaks, California: Sage Publications)
[161] Tabachnick B G and Fidell L S 2013 Using Multivariate Statistics (Boston: Pearson)
[162] Goldstein H 2011 Multilevel Statistical Models (Chichester: John Wiley and Sons)
[163] Wasserman S and Faust K 1994 Social Network Analysis: Methods and Applications.
(Cambridge: Cambridge University Press)
[164] Borgatti S P, Everett M G and Johnson J C 2013 Analyzing Social Networks
(London: Sage Publications Ltd)
[165] Borgatti S P and Lopez-Kidwell V 2011 Network Theory The SAGE Handbook of
Social Network Anlaysis ed J Scott and P L Carrington (London: Sage Publications
Ltd) pp 40–55
[166] Borgatti S P 2005 Centrality and network flow Soc. Networks 27 55–71
[167] Topping K J 2005 Trends in Peer Learning Educ. Psychol. 25 631–45
[168] Dawson S 2010 “Seeing” the learning community: An exploration of the
development of a resource for monitoring online student networking Br. J. Educ.
232
Technol. 41 736–52
[169] Borgatti S P and Halgin D S 2011 On network theory Organ. Sci. 22 1168–81
[170] Borgatti S P, Mehra A, Brass D J and Labianca G 2009 Network Analysis in the
Social Sciences Science (80-. ). 323 892–6
[171] Burt R S 2000 The network structure of social capital Res. Organ. Behav. 22 345–
423
[172] Granovetter M S 1973 The Strength of Weak Ties Am. J. Sociol. 78 1360–80
[173] Borgatti S P and Halgin D S 2009 Analyzing Affiliation Networks The SAGE
Handbook of Social Network Analysis ed J P Scott and P J Carrington (London: Sage
Publications) pp 417–33
[174] Wittrock M C 2015 Learning as a Generative Process Educ. Psychol. 1 40–5
[175] Lin N 1999 Building a Network Theory of Social Capital Connecdtions 22 28–51
[176] Carolan B V 2013 Social Network Analysis and Education: Theory, Methods &
Applications (Sage Publications)
[177] Lin N 2001 Theories of Capital Social Capital: A Theory of Social Structure and
Action (Cambridge University Press) pp 3–18
[178] Cela K L, Sicilia M Á and Sánchez S 2015 Social network analysis in e-learning
environments: A preliminary systematic review Educ. Psychol. Rev. 27 219–46
[179] Rizzuto T E, LeDoux J and Hatala J P 2008 It’s not just what you know, it’s who
you know: Testing a model of the relative importance of social networks to academic
performance Soc. Psychol. Educ. 12 175–89
[180] Bruun J and Brewe E 2013 Talking and learning physics: Predicting future grades
from network measures and Force Concept Inventory pretest scores Phys. Rev. Spec.
Top. - Phys. Educ. Res. 9 020109
[181] Brewe E, Kramer L and Sawtelle V 2012 Investigating student communities with
network analysis of interactions in a physics learning center Phys. Rev. Spec. Top. -
Phys. Educ. Res. 8 010101
[182] Hanneman R A and Riddle M 2011 Concepts and Measures for Basic Network
Analysis The SAGE Handbook of Social Network aAnlaysis ed J P Scott and P J
Carrington (London: Sage Publications Ltd) pp 340–69
[183] Denny P, Simon B and Micou M 2010 Evaluation of PeerWise as an educational tool
for bioengineers ASEE Annual Conference and Exposition (Louisville, Kentucky)
[184] Gibbs G R 1999 Using Assessment Strategically to Change the Way Students Learn
From Assessment Matters in Higher Education Choosing an Using Diverse
Approaches ed S Brown and A Glasnwer (Maidenhead: Open University Press) pp
41–53
[185] Altman D G and Royston P 2006 The cost of dichotomising continuous variables Br.
Med. J. 332 1080
[186] Cohen J 1983 The Cost of Dichotomization Appl. Psychol. Meas. 7 249–53
[187] MacCallum R C, Zhang S, Preacher K J and Rucker D D 2002 On the practice of
Dichotomization of Quantitative Variables Psychol. Methods 7 19–40
[188] Hayes A F and Matthes J 2009 Computational procedures for probing interactions in
233
OLS and logistic regression: SPSS and SAS implementations. Behav. Res. Methods
41 924–36
[189] Kreft I and De Leeuw J 1998 Introducing Multilevel Modeling (London: Sage
Publications Ltd)
[190] Maas C J and Hox J 2005 Sufficient Sample Sizes for Multilevel Modeling J. Res.
Methods Behav. Soc. Sci. 1 86–92
[191] Weltzer-Ward L, Baltes B and Lynn L K 2009 Assessing quality of critical thought
in online discussion Campus-Wide Inf. Syst. 26 168–77
[192] Gonyea N E and Gangi J M 2012 Reining in student comments: a model for
categorising and studying online student comments Assess. Eval. High. Educ. 37 45–
55
[193] Charmaz K 2004 Grounded Theory Encyclopedia of Social Science Research
Methods ed M S Lewis-Beck, A Bryman and T F Liao (Thousand Oaks California:
SAGE Publications, Inc.)
[194] Howitt D and Duncan C 2013 Introduction to Statistics in Psychology (London:
Pearson)
[195] OECD 2008 Handbook on Constructing Composite Indicators
[196] Higher Education Academy 2012 National Student Suvey Discipline Report -
Physical Sciences vol 12
[197] Bryman A 2012 Social Research Methods (Oxford: Oxford University Press)
[198] Charmaz K 2008 Reconstructing Grounded Theory The SAGE handbook of social
research methods ed L Bickman, P Alasuutari and J Brannen (London: Sage
Publications Ltd) pp 461–79
[199] Gibbs G R 2007 Analyzing Qualitative Data (London: Sage)
[200] Bazeley P and Jackson K 2013 Qualitative Data Analysis with NVivo (Los Angeles:
Sage)
[201] Cohen L, Manion L and Morrison K 2007 Research Methods in Education vol 55, ed
6th (Routledge)
[202] Paterson J H, Devon J, McCrae J, Moffat D C and Gray E 2011 Enhancing the
quality of student-generated MCQs: Final report
[203] Luxton-Reilly A, Hamer J, Denny P, Luxton-Reilly A and Hamer J 2008 The
PeerWise system of student contributed assessment questions Proc. 10th Australasian
Computing Education Conference vol 78 pp 69–74

234

235
Appendix A
Descriptive statistics of quantitative variables

236
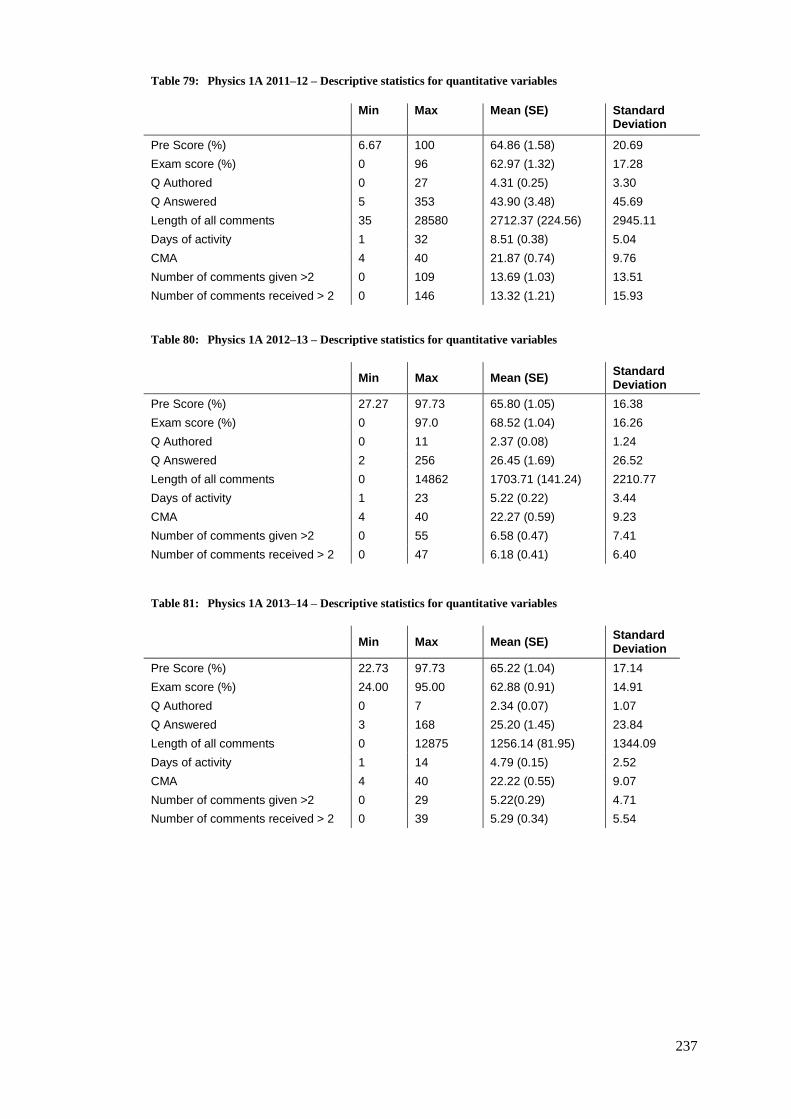
237
Table 79: Physics 1A 2011–12 – Descriptive statistics for quantitative variables
Min Max Mean (SE) Standard Deviation
Pre Score (%) 6.67 100 64.86 (1.58) 20.69
Exam score (%) 0 96 62.97 (1.32) 17.28
Q Authored 0 27 4.31 (0.25) 3.30
Q Answered 5 353 43.90 (3.48) 45.69
Length of all comments 35 28580 2712.37 (224.56) 2945.11
Days of activity 1 32 8.51 (0.38) 5.04
CMA 4 40 21.87 (0.74) 9.76
Number of comments given >2 0 109 13.69 (1.03) 13.51
Number of comments received > 2 0 146 13.32 (1.21) 15.93
Table 80: Physics 1A 2012–13 – Descriptive statistics for quantitative variables
Min Max Mean (SE) Standard Deviation
Pre Score (%) 27.27 97.73 65.80 (1.05) 16.38
Exam score (%) 0 97.0 68.52 (1.04) 16.26
Q Authored 0 11 2.37 (0.08) 1.24
Q Answered 2 256 26.45 (1.69) 26.52
Length of all comments 0 14862 1703.71 (141.24) 2210.77
Days of activity 1 23 5.22 (0.22) 3.44
CMA 4 40 22.27 (0.59) 9.23
Number of comments given >2 0 55 6.58 (0.47) 7.41
Number of comments received > 2 0 47 6.18 (0.41) 6.40
Table 81: Physics 1A 2013–14 – Descriptive statistics for quantitative variables
Min Max Mean (SE) Standard Deviation
Pre Score (%) 22.73 97.73 65.22 (1.04) 17.14
Exam score (%) 24.00 95.00 62.88 (0.91) 14.91
Q Authored 0 7 2.34 (0.07) 1.07
Q Answered 3 168 25.20 (1.45) 23.84
Length of all comments 0 12875 1256.14 (81.95) 1344.09
Days of activity 1 14 4.79 (0.15) 2.52
CMA 4 40 22.22 (0.55) 9.07
Number of comments given >2 0 29 5.22(0.29) 4.71
Number of comments received > 2 0 39 5.29 (0.34) 5.54

238
Table 82: Physics 1B 2011–12 – Descriptive statistics for quantitative variables
Min Max Mean (SE) Standard Deviation
Pre Score (%) 31.64 93.29 67.48 (1.46) 13.88
Exam score (%) 31.0 94.0 63.69 (1.61) 15.27
Q Authored 0 8 1.66 (0.16) 1.48
Q Answered 0 158 24.49 (3.14) 29.45
Length of all comments 0 8160 1067.23 (168.62) 1599.68
Days of activity 1 22 4.52 (0.49) 4.60
CMA 4 40 21.82 (1.01) 9.62
Number of comments given >2 0 28 4.77 (0.64) 6.08
Number of comments received > 2 0 54 5.06 (1.17) 11.07
Table 83: Physics 1B 2012–13 – Descriptive statistics for quantitative variables
Min Max Mean (SE) Standard Deviation
Pre Score (%) 34 97 71.78 (1.22) 13.99
Exam score (%) 9 87 56.37 (1.28) 14.69
Q Authored 0 12 1.60(0.13) 1.53
Q Answered 1 139 23.24 (2.34) 26.77
Length of all comments 0 30 926.31 (128.97) 1590.56
Days of activity 1 15454 4.05 (0.36) 4.16
CMA 5.00 40.00 21.770 (0.80) 9.17
Number of comments given >2 0 24 3.42 (0.34) 3.93
Number of comments received > 2 0 21 3.29 (0.35) 3.99
Table 84: Physics 1B 2013–14 – Descriptive statistics for quantitative variables
Min Max Mean (SE) Standard Deviation
Pre Score (%) 30 95 65.38 (1.23) 14.49
Exam score (%) 17 90 58.98 (1.31) 15.36
Q Authored 0 8 1.57 (0.10) 1.15
Q Answered 3 147 21.36 (2.46) 28.84
Length of all comments 0 4040 554.89 (52.11) 612.13
Days of activity 1 30 3.01 (0.31) 3.64
CMA 6 40 22.26 (0.72) 8.51
Number of comments given >2 0 18 2.36 (0.25) 2.19
Number of comments received > 2 0 20 2.20 (0.27) 15.36
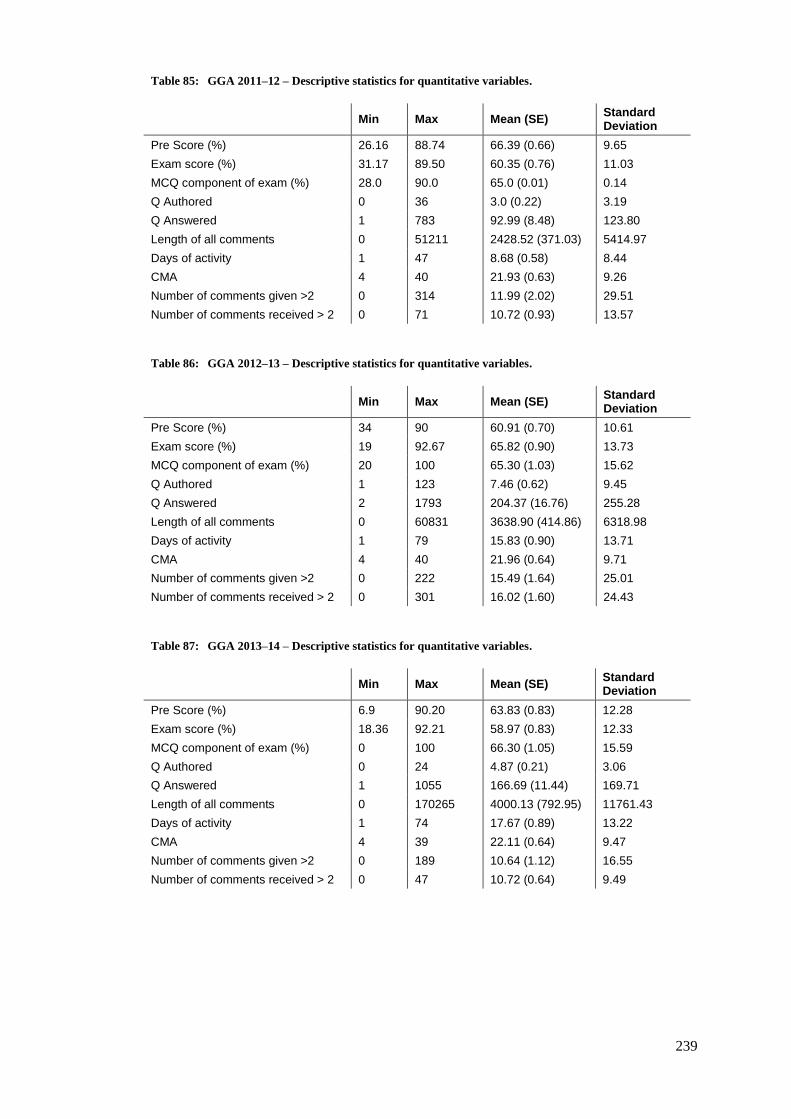
239
Table 85: GGA 2011–12 – Descriptive statistics for quantitative variables.
Min Max Mean (SE) Standard Deviation
Pre Score (%) 26.16 88.74 66.39 (0.66) 9.65
Exam score (%) 31.17 89.50 60.35 (0.76) 11.03
MCQ component of exam (%) 28.0 90.0 65.0 (0.01) 0.14
Q Authored 0 36 3.0 (0.22) 3.19
Q Answered 1 783 92.99 (8.48) 123.80
Length of all comments 0 51211 2428.52 (371.03) 5414.97
Days of activity 1 47 8.68 (0.58) 8.44
CMA 4 40 21.93 (0.63) 9.26
Number of comments given >2 0 314 11.99 (2.02) 29.51
Number of comments received > 2 0 71 10.72 (0.93) 13.57
Table 86: GGA 2012–13 – Descriptive statistics for quantitative variables.
Min Max Mean (SE) Standard Deviation
Pre Score (%) 34 90 60.91 (0.70) 10.61
Exam score (%) 19 92.67 65.82 (0.90) 13.73
MCQ component of exam (%) 20 100 65.30 (1.03) 15.62
Q Authored 1 123 7.46 (0.62) 9.45
Q Answered 2 1793 204.37 (16.76) 255.28
Length of all comments 0 60831 3638.90 (414.86) 6318.98
Days of activity 1 79 15.83 (0.90) 13.71
CMA 4 40 21.96 (0.64) 9.71
Number of comments given >2 0 222 15.49 (1.64) 25.01
Number of comments received > 2 0 301 16.02 (1.60) 24.43
Table 87: GGA 2013–14 – Descriptive statistics for quantitative variables.
Min Max Mean (SE) Standard Deviation
Pre Score (%) 6.9 90.20 63.83 (0.83) 12.28
Exam score (%) 18.36 92.21 58.97 (0.83) 12.33
MCQ component of exam (%) 0 100 66.30 (1.05) 15.59
Q Authored 0 24 4.87 (0.21) 3.06
Q Answered 1 1055 166.69 (11.44) 169.71
Length of all comments 0 170265 4000.13 (792.95) 11761.43
Days of activity 1 74 17.67 (0.89) 13.22
CMA 4 39 22.11 (0.64) 9.47
Number of comments given >2 0 189 10.64 (1.12) 16.55
Number of comments received > 2 0 47 10.72 (0.64) 9.49

240
Table 88: Chemistry 1B 2011–12 – Descriptive statistics for quantitative variables.
Min Max Mean (SE) Standard Deviation
Pre Score (%) 30.10 94.20 73.27 (0.88) 10.94
Exam score (%) 38.75 92.00 65.72 (1.18) 14.68
Q Authored 0 27 4.37 (0.30) 3.71
Q Answered 5 592 73.97 (6.62) 82.38
Length of all comments 0 19348 2032.50 (235.07) 2926.55
Days of activity 1 26 6.57 (0.41) 5.06
CMA 4 40 21.88 (0.80 9.95
Number of comments given >2 0 112 10.56 (1.17) 14.51
Number of comments received > 2 0 63 10.63 (0.79) 9.81
Table 89: Chemistry 1B 2012–13 – Descriptive statistics for quantitative variables.
Min Max Mean (SE) Standard Deviation
Pre Score (%) 33 96 64.62 (1.06) 12.38
Exam score (%) 12 94# 64.63 (1.40) 16.33
Q Authored 0 15 3.25 (0.22) 2.58
Q Answered 0 462 46.19 (6.40) 74.67
Length of all comments 0 10175 1112.36 (129.37) 1508.74
Days of activity 1 51 5.35 (0.60) 6.94
CMA 4 40 22.32 (0.83) 9.69
Number of comments given >2 0 60 6.06 (0.78) 9.08
Number of comments received > 2 0 51 5.93 (0.56) 6.56
Table 90: Chemistry 1B 2013–14 – Descriptive statistics for quantitative variables.
Min Max Mean (SE) Standard Deviation
Pre Score (%) 20 94 61.31 (1.56) 14.83
Exam score (%) 6 95 63.88 (1.36) 17.37
Q Authored 0 12 4.27 (0.23) 2.90
Q Answered 1 368 66.47 (6.73) 86.21
Length of all comments 0 23329 1403.56 (192.96) 2471.14
Days of activity 1 70 9.65 (0.92) 11.81
CMA 4 39 22.10 (0.76) 9.78
Number of comments given >2 0 80 5.00 (0.69) 8.81
Number of comments received > 2 0 100 24.04 (1.76) 22.50
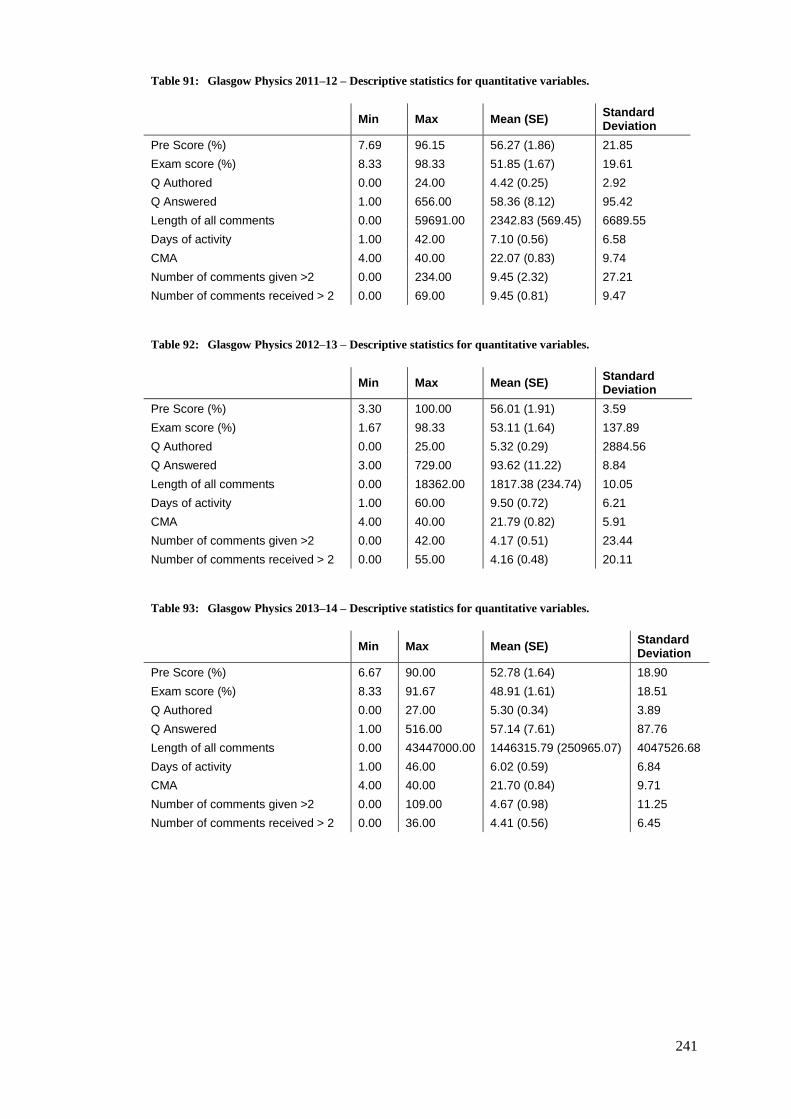
241
Table 91: Glasgow Physics 2011–12 – Descriptive statistics for quantitative variables.
Min Max Mean (SE) Standard Deviation
Pre Score (%) 7.69 96.15 56.27 (1.86) 21.85
Exam score (%) 8.33 98.33 51.85 (1.67) 19.61
Q Authored 0.00 24.00 4.42 (0.25) 2.92
Q Answered 1.00 656.00 58.36 (8.12) 95.42
Length of all comments 0.00 59691.00 2342.83 (569.45) 6689.55
Days of activity 1.00 42.00 7.10 (0.56) 6.58
CMA 4.00 40.00 22.07 (0.83) 9.74
Number of comments given >2 0.00 234.00 9.45 (2.32) 27.21
Number of comments received > 2 0.00 69.00 9.45 (0.81) 9.47
Table 92: Glasgow Physics 2012–13 – Descriptive statistics for quantitative variables.
Min Max Mean (SE) Standard Deviation
Pre Score (%) 3.30 100.00 56.01 (1.91) 3.59
Exam score (%) 1.67 98.33 53.11 (1.64) 137.89
Q Authored 0.00 25.00 5.32 (0.29) 2884.56
Q Answered 3.00 729.00 93.62 (11.22) 8.84
Length of all comments 0.00 18362.00 1817.38 (234.74) 10.05
Days of activity 1.00 60.00 9.50 (0.72) 6.21
CMA 4.00 40.00 21.79 (0.82) 5.91
Number of comments given >2 0.00 42.00 4.17 (0.51) 23.44
Number of comments received > 2 0.00 55.00 4.16 (0.48) 20.11
Table 93: Glasgow Physics 2013–14 – Descriptive statistics for quantitative variables.
Min Max Mean (SE) Standard Deviation
Pre Score (%) 6.67 90.00 52.78 (1.64) 18.90
Exam score (%) 8.33 91.67 48.91 (1.61) 18.51
Q Authored 0.00 27.00 5.30 (0.34) 3.89
Q Answered 1.00 516.00 57.14 (7.61) 87.76
Length of all comments 0.00 43447000.00 1446315.79 (250965.07) 4047526.68
Days of activity 1.00 46.00 6.02 (0.59) 6.84
CMA 4.00 40.00 21.70 (0.84) 9.71
Number of comments given >2 0.00 109.00 4.67 (0.98) 11.25
Number of comments received > 2 0.00 36.00 4.41 (0.56) 6.45
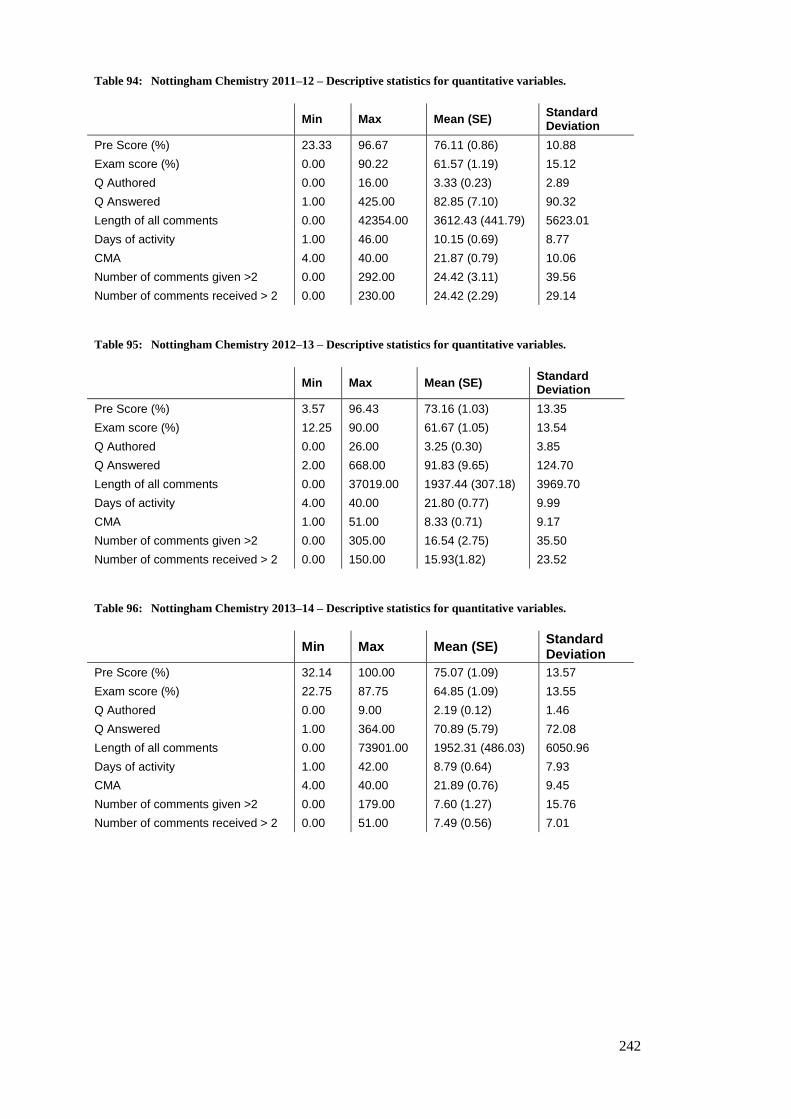
242
Table 94: Nottingham Chemistry 2011–12 – Descriptive statistics for quantitative variables.
Min Max Mean (SE) Standard Deviation
Pre Score (%) 23.33 96.67 76.11 (0.86) 10.88
Exam score (%) 0.00 90.22 61.57 (1.19) 15.12
Q Authored 0.00 16.00 3.33 (0.23) 2.89
Q Answered 1.00 425.00 82.85 (7.10) 90.32
Length of all comments 0.00 42354.00 3612.43 (441.79) 5623.01
Days of activity 1.00 46.00 10.15 (0.69) 8.77
CMA 4.00 40.00 21.87 (0.79) 10.06
Number of comments given >2 0.00 292.00 24.42 (3.11) 39.56
Number of comments received > 2 0.00 230.00 24.42 (2.29) 29.14
Table 95: Nottingham Chemistry 2012–13 – Descriptive statistics for quantitative variables.
Min Max Mean (SE) Standard Deviation
Pre Score (%) 3.57 96.43 73.16 (1.03) 13.35
Exam score (%) 12.25 90.00 61.67 (1.05) 13.54
Q Authored 0.00 26.00 3.25 (0.30) 3.85
Q Answered 2.00 668.00 91.83 (9.65) 124.70
Length of all comments 0.00 37019.00 1937.44 (307.18) 3969.70
Days of activity 4.00 40.00 21.80 (0.77) 9.99
CMA 1.00 51.00 8.33 (0.71) 9.17
Number of comments given >2 0.00 305.00 16.54 (2.75) 35.50
Number of comments received > 2 0.00 150.00 15.93(1.82) 23.52
Table 96: Nottingham Chemistry 2013–14 – Descriptive statistics for quantitative variables.
Min Max Mean (SE) Standard Deviation
Pre Score (%) 32.14 100.00 75.07 (1.09) 13.57
Exam score (%) 22.75 87.75 64.85 (1.09) 13.55
Q Authored 0.00 9.00 2.19 (0.12) 1.46
Q Answered 1.00 364.00 70.89 (5.79) 72.08
Length of all comments 0.00 73901.00 1952.31 (486.03) 6050.96
Days of activity 1.00 42.00 8.79 (0.64) 7.93
CMA 4.00 40.00 21.89 (0.76) 9.45
Number of comments given >2 0.00 179.00 7.60 (1.27) 15.76
Number of comments received > 2 0.00 51.00 7.49 (0.56) 7.01

243
Appendix B
Comparison of the attainment of students in school
level mathematics and physics

244
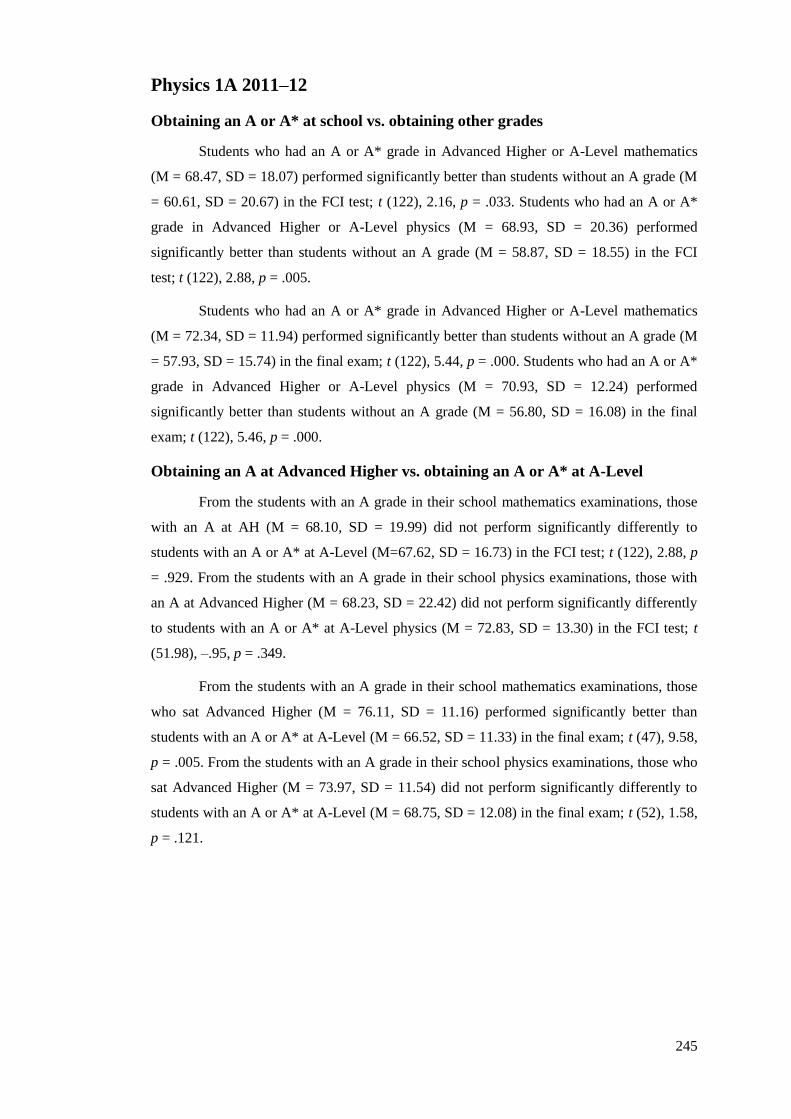
245
Physics 1A 2011–12
Obtaining an A or A* at school vs. obtaining other grades
Students who had an A or A* grade in Advanced Higher or A-Level mathematics
(M = 68.47, SD = 18.07) performed significantly better than students without an A grade (M
= 60.61, SD = 20.67) in the FCI test; t (122), 2.16, p = .033. Students who had an A or A*
grade in Advanced Higher or A-Level physics (M = 68.93, SD = 20.36) performed
significantly better than students without an A grade (M = 58.87, SD = 18.55) in the FCI
test; t (122), 2.88, p = .005.
Students who had an A or A* grade in Advanced Higher or A-Level mathematics
(M = 72.34, SD = 11.94) performed significantly better than students without an A grade (M
= 57.93, SD = 15.74) in the final exam; t (122), 5.44, p = .000. Students who had an A or A*
grade in Advanced Higher or A-Level physics (M = 70.93, SD = 12.24) performed
significantly better than students without an A grade (M = 56.80, SD = 16.08) in the final
exam; t (122), 5.46, p = .000.
Obtaining an A at Advanced Higher vs. obtaining an A or A* at A-Level
From the students with an A grade in their school mathematics examinations, those
with an A at AH (M = 68.10, SD = 19.99) did not perform significantly differently to
students with an A or A* at A-Level (M=67.62, SD = 16.73) in the FCI test; t (122), 2.88, p
= .929. From the students with an A grade in their school physics examinations, those with
an A at Advanced Higher (M = 68.23, SD = 22.42) did not perform significantly differently
to students with an A or A* at A-Level physics (M = 72.83, SD = 13.30) in the FCI test; t
(51.98), –.95, p = .349.
From the students with an A grade in their school mathematics examinations, those
who sat Advanced Higher (M = 76.11, SD = 11.16) performed significantly better than
students with an A or A* at A-Level (M = 66.52, SD = 11.33) in the final exam; t (47), 9.58,
p = .005. From the students with an A grade in their school physics examinations, those who
sat Advanced Higher (M = 73.97, SD = 11.54) did not perform significantly differently to
students with an A or A* at A-Level (M = 68.75, SD = 12.08) in the final exam; t (52), 1.58,
p = .121.
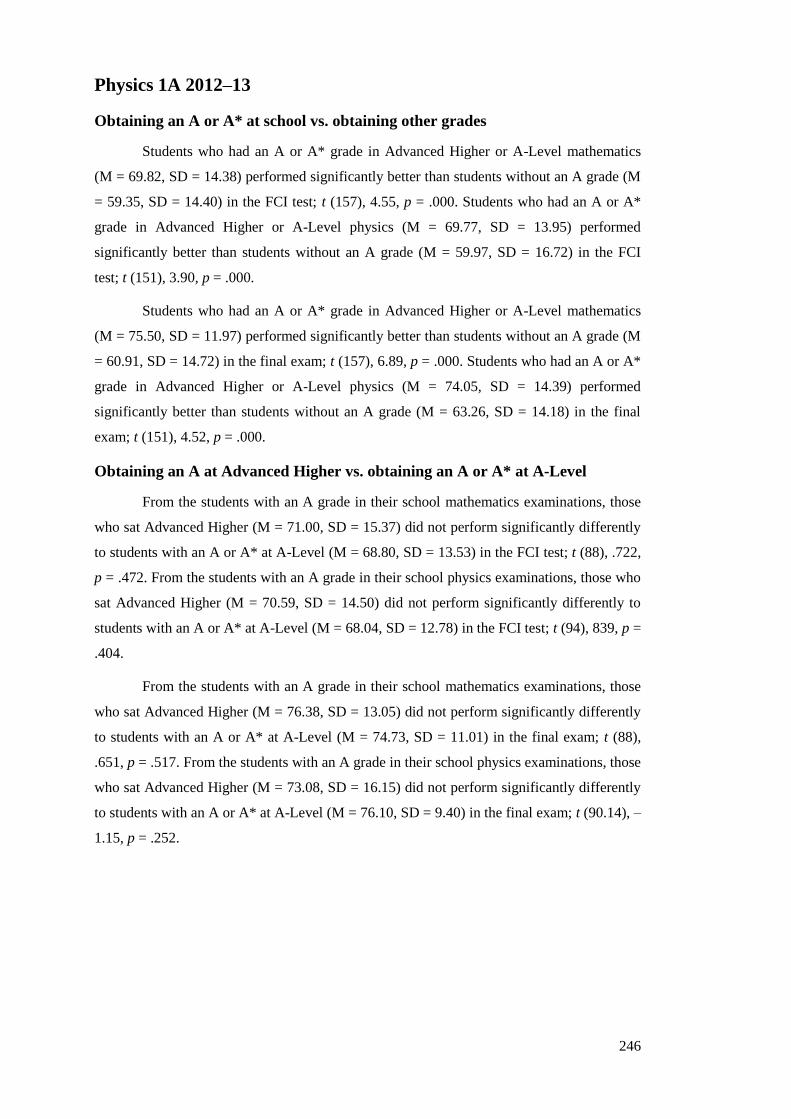
246
Physics 1A 2012–13
Obtaining an A or A* at school vs. obtaining other grades
Students who had an A or A* grade in Advanced Higher or A-Level mathematics
(M = 69.82, SD = 14.38) performed significantly better than students without an A grade (M
= 59.35, SD = 14.40) in the FCI test; t (157), 4.55, p = .000. Students who had an A or A*
grade in Advanced Higher or A-Level physics (M = 69.77, SD = 13.95) performed
significantly better than students without an A grade (M = 59.97, SD = 16.72) in the FCI
test; t (151), 3.90, p = .000.
Students who had an A or A* grade in Advanced Higher or A-Level mathematics
(M = 75.50, SD = 11.97) performed significantly better than students without an A grade (M
= 60.91, SD = 14.72) in the final exam; t (157), 6.89, p = .000. Students who had an A or A*
grade in Advanced Higher or A-Level physics (M = 74.05, SD = 14.39) performed
significantly better than students without an A grade (M = 63.26, SD = 14.18) in the final
exam; t (151), 4.52, p = .000.
Obtaining an A at Advanced Higher vs. obtaining an A or A* at A-Level
From the students with an A grade in their school mathematics examinations, those
who sat Advanced Higher (M = 71.00, SD = 15.37) did not perform significantly differently
to students with an A or A* at A-Level (M = 68.80, SD = 13.53) in the FCI test; t (88), .722,
p = .472. From the students with an A grade in their school physics examinations, those who
sat Advanced Higher (M = 70.59, SD = 14.50) did not perform significantly differently to
students with an A or A* at A-Level (M = 68.04, SD = 12.78) in the FCI test; t (94), 839, p =
.404.
From the students with an A grade in their school mathematics examinations, those
who sat Advanced Higher (M = 76.38, SD = 13.05) did not perform significantly differently
to students with an A or A* at A-Level (M = 74.73, SD = 11.01) in the final exam; t (88),
.651, p = .517. From the students with an A grade in their school physics examinations, those
who sat Advanced Higher (M = 73.08, SD = 16.15) did not perform significantly differently
to students with an A or A* at A-Level (M = 76.10, SD = 9.40) in the final exam; t (90.14), –
1.15, p = .252.

247
Appendix C
t-Tests comparing the differences in exam
performance between high and low PeerWise activity
groups

248
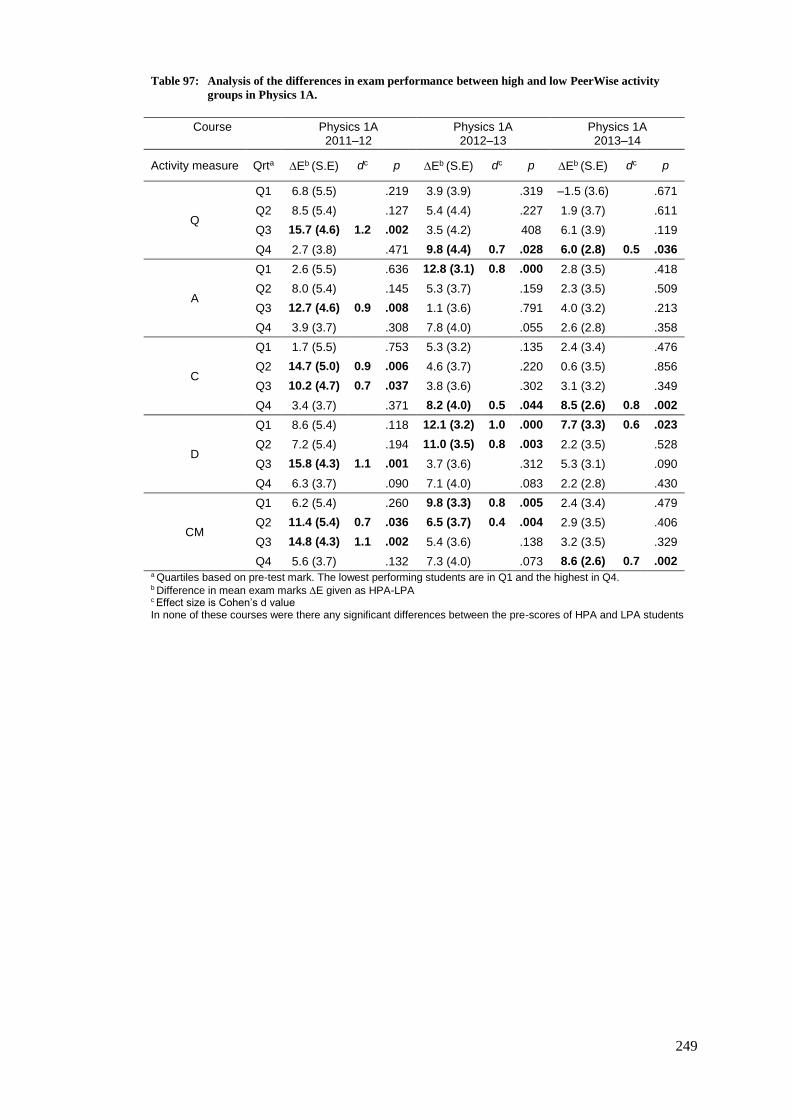
249
Table 97: Analysis of the differences in exam performance between high and low PeerWise activity
groups in Physics 1A.
Course
Physics 1A 2011–12
Physics 1A 2012–13
Physics 1A 2013–14
Activity measure Qrta Eb (S.E) dc p Eb (S.E) dc p Eb (S.E) dc p
Q
Q1 6.8 (5.5) .219 3.9 (3.9) .319 –1.5 (3.6) .671
Q2 8.5 (5.4) .127 5.4 (4.4) .227 1.9 (3.7) .611
Q3 15.7 (4.6) 1.2 .002 3.5 (4.2) 408 6.1 (3.9) .119
Q4 2.7 (3.8) .471 9.8 (4.4) 0.7 .028 6.0 (2.8) 0.5 .036
A
Q1 2.6 (5.5) .636 12.8 (3.1) 0.8 .000 2.8 (3.5) .418
Q2 8.0 (5.4) .145 5.3 (3.7) .159 2.3 (3.5) .509
Q3 12.7 (4.6) 0.9 .008 1.1 (3.6) .791 4.0 (3.2) .213
Q4 3.9 (3.7) .308 7.8 (4.0) .055 2.6 (2.8) .358
C
Q1 1.7 (5.5) .753 5.3 (3.2) .135 2.4 (3.4) .476
Q2 14.7 (5.0) 0.9 .006 4.6 (3.7) .220 0.6 (3.5) .856
Q3 10.2 (4.7) 0.7 .037 3.8 (3.6) .302 3.1 (3.2) .349
Q4 3.4 (3.7) .371 8.2 (4.0) 0.5 .044 8.5 (2.6) 0.8 .002
D
Q1 8.6 (5.4) .118 12.1 (3.2) 1.0 .000 7.7 (3.3) 0.6 .023
Q2 7.2 (5.4) .194 11.0 (3.5) 0.8 .003 2.2 (3.5) .528
Q3 15.8 (4.3) 1.1 .001 3.7 (3.6) .312 5.3 (3.1) .090
Q4 6.3 (3.7) .090 7.1 (4.0) .083 2.2 (2.8) .430
CM
Q1 6.2 (5.4) .260 9.8 (3.3) 0.8 .005 2.4 (3.4) .479
Q2 11.4 (5.4) 0.7 .036 6.5 (3.7) 0.4 .004 2.9 (3.5) .406
Q3 14.8 (4.3) 1.1 .002 5.4 (3.6) .138 3.2 (3.5) .329
Q4 5.6 (3.7) .132 7.3 (4.0) .073 8.6 (2.6) 0.7 .002 a Quartiles based on pre-test mark. The lowest performing students are in Q1 and the highest in Q4. b Difference in mean exam marks E given as HPA-LPA c Effect size is Cohen’s d value In none of these courses were there any significant differences between the pre-scores of HPA and LPA students
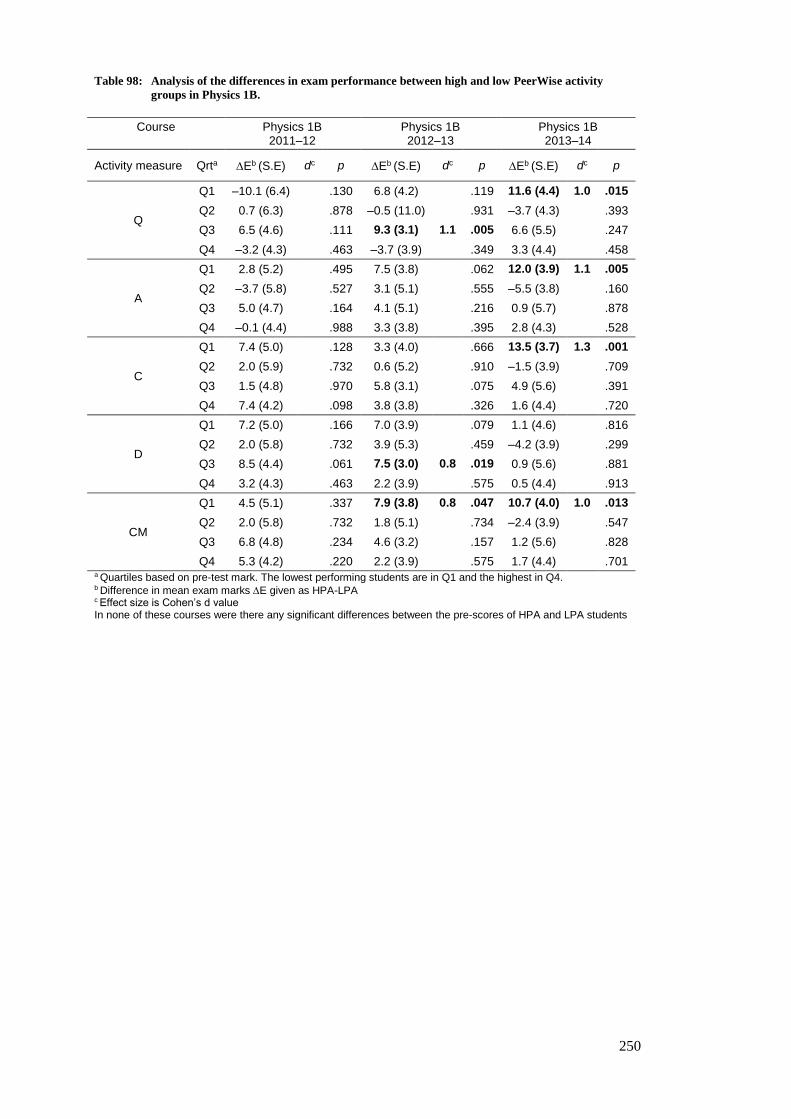
250
Table 98: Analysis of the differences in exam performance between high and low PeerWise activity
groups in Physics 1B.
Course
Physics 1B 2011–12
Physics 1B 2012–13
Physics 1B 2013–14
Activity measure Qrta Eb (S.E) dc p Eb (S.E) dc p Eb (S.E) dc p
Q
Q1 –10.1 (6.4) .130 6.8 (4.2) .119 11.6 (4.4) 1.0 .015
Q2 0.7 (6.3) .878 –0.5 (11.0) .931 –3.7 (4.3) .393
Q3 6.5 (4.6) .111 9.3 (3.1) 1.1 .005 6.6 (5.5) .247
Q4 –3.2 (4.3) .463 –3.7 (3.9) .349 3.3 (4.4) .458
A
Q1 2.8 (5.2) .495 7.5 (3.8) .062 12.0 (3.9) 1.1 .005
Q2 –3.7 (5.8) .527 3.1 (5.1) .555 –5.5 (3.8) .160
Q3 5.0 (4.7) .164 4.1 (5.1) .216 0.9 (5.7) .878
Q4 –0.1 (4.4) .988 3.3 (3.8) .395 2.8 (4.3) .528
C
Q1 7.4 (5.0) .128 3.3 (4.0) .666 13.5 (3.7) 1.3 .001
Q2 2.0 (5.9) .732 0.6 (5.2) .910 –1.5 (3.9) .709
Q3 1.5 (4.8) .970 5.8 (3.1) .075 4.9 (5.6) .391
Q4 7.4 (4.2) .098 3.8 (3.8) .326 1.6 (4.4) .720
D
Q1 7.2 (5.0) .166 7.0 (3.9) .079 1.1 (4.6) .816
Q2 2.0 (5.8) .732 3.9 (5.3) .459 –4.2 (3.9) .299
Q3 8.5 (4.4) .061 7.5 (3.0) 0.8 .019 0.9 (5.6) .881
Q4 3.2 (4.3) .463 2.2 (3.9) .575 0.5 (4.4) .913
CM
Q1 4.5 (5.1) .337 7.9 (3.8) 0.8 .047 10.7 (4.0) 1.0 .013
Q2 2.0 (5.8) .732 1.8 (5.1) .734 –2.4 (3.9) .547
Q3 6.8 (4.8) .234 4.6 (3.2) .157 1.2 (5.6) .828
Q4 5.3 (4.2) .220 2.2 (3.9) .575 1.7 (4.4) .701 a Quartiles based on pre-test mark. The lowest performing students are in Q1 and the highest in Q4. b Difference in mean exam marks E given as HPA-LPA c Effect size is Cohen’s d value In none of these courses were there any significant differences between the pre-scores of HPA and LPA students
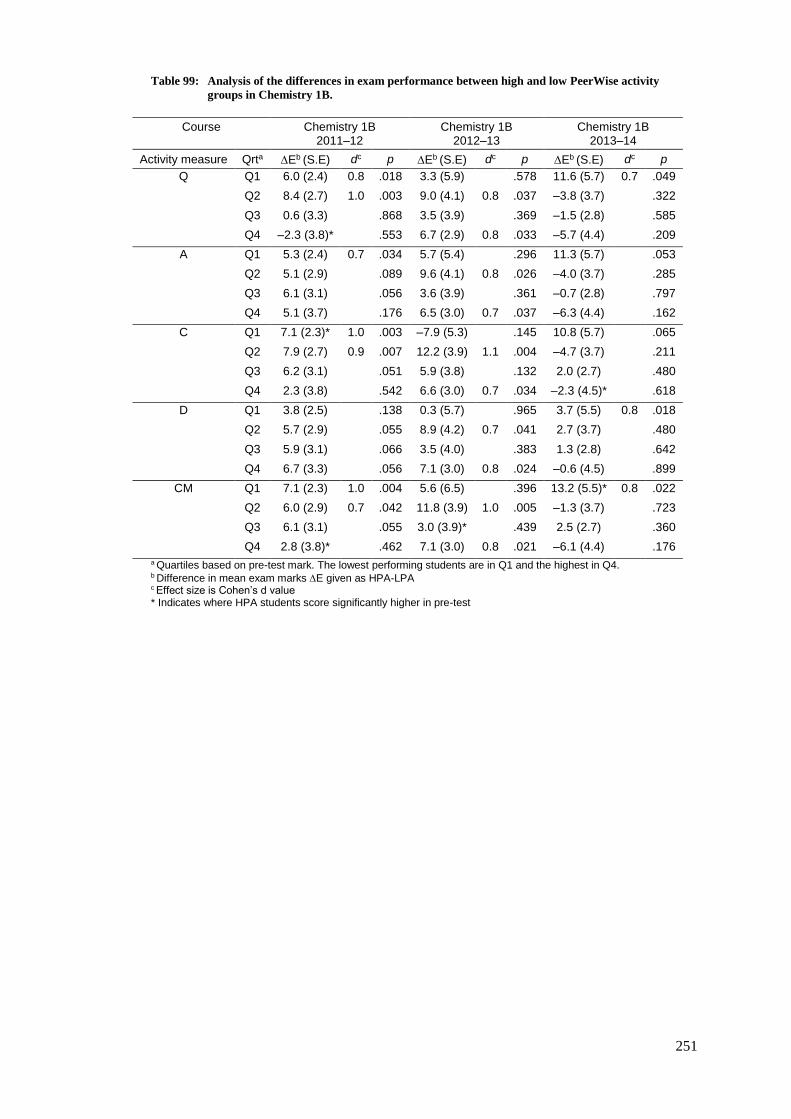
251
Table 99: Analysis of the differences in exam performance between high and low PeerWise activity
groups in Chemistry 1B.
Course
Chemistry 1B 2011–12
Chemistry 1B 2012–13
Chemistry 1B 2013–14
Activity measure Qrta Eb (S.E) dc p Eb (S.E) dc p Eb (S.E) dc p
Q Q1 6.0 (2.4) 0.8 .018 3.3 (5.9) .578 11.6 (5.7) 0.7 .049
Q2 8.4 (2.7) 1.0 .003 9.0 (4.1) 0.8 .037 –3.8 (3.7) .322
Q3 0.6 (3.3) .868 3.5 (3.9) .369 –1.5 (2.8) .585
Q4 –2.3 (3.8)* .553 6.7 (2.9) 0.8 .033 –5.7 (4.4) .209
A Q1 5.3 (2.4) 0.7 .034 5.7 (5.4) .296 11.3 (5.7) .053
Q2 5.1 (2.9) .089 9.6 (4.1) 0.8 .026 –4.0 (3.7) .285
Q3 6.1 (3.1) .056 3.6 (3.9) .361 –0.7 (2.8) .797
Q4 5.1 (3.7) .176 6.5 (3.0) 0.7 .037 –6.3 (4.4) .162
C Q1 7.1 (2.3)* 1.0 .003 –7.9 (5.3) .145 10.8 (5.7) .065
Q2 7.9 (2.7) 0.9 .007 12.2 (3.9) 1.1 .004 –4.7 (3.7) .211
Q3 6.2 (3.1) .051 5.9 (3.8) .132 2.0 (2.7) .480
Q4 2.3 (3.8) .542 6.6 (3.0) 0.7 .034 –2.3 (4.5)* .618
D Q1 3.8 (2.5) .138 0.3 (5.7) .965 3.7 (5.5) 0.8 .018
Q2 5.7 (2.9) .055 8.9 (4.2) 0.7 .041 2.7 (3.7) .480
Q3 5.9 (3.1) .066 3.5 (4.0) .383 1.3 (2.8) .642
Q4 6.7 (3.3) .056 7.1 (3.0) 0.8 .024 –0.6 (4.5) .899
CM Q1 7.1 (2.3) 1.0 .004 5.6 (6.5) .396 13.2 (5.5)* 0.8 .022
Q2 6.0 (2.9) 0.7 .042 11.8 (3.9) 1.0 .005 –1.3 (3.7) .723
Q3 6.1 (3.1) .055 3.0 (3.9)* .439 2.5 (2.7) .360
Q4 2.8 (3.8)* .462 7.1 (3.0) 0.8 .021 –6.1 (4.4) .176
a Quartiles based on pre-test mark. The lowest performing students are in Q1 and the highest in Q4. b Difference in mean exam marks E given as HPA-LPA c Effect size is Cohen’s d value * Indicates where HPA students score significantly higher in pre-test
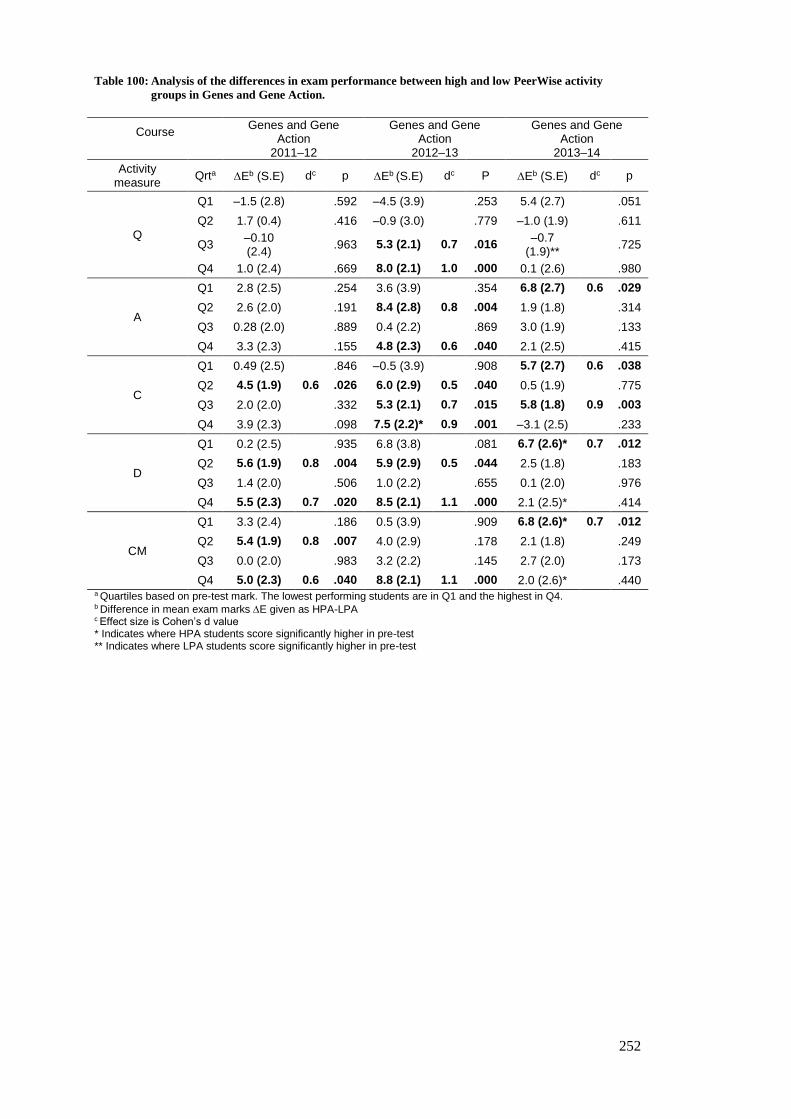
252
Table 100: Analysis of the differences in exam performance between high and low PeerWise activity
groups in Genes and Gene Action.
Course
Genes and Gene Action
2011–12
Genes and Gene Action
2012–13
Genes and Gene Action
2013–14
Activity measure
Qrta Eb (S.E) dc p Eb (S.E) dc P Eb (S.E) dc p
Q
Q1 –1.5 (2.8) .592 –4.5 (3.9) .253 5.4 (2.7) .051
Q2 1.7 (0.4) .416 –0.9 (3.0) .779 –1.0 (1.9) .611
Q3 –0.10 (2.4)
.963 5.3 (2.1) 0.7 .016 –0.7
(1.9)** .725
Q4 1.0 (2.4) .669 8.0 (2.1) 1.0 .000 0.1 (2.6) .980
A
Q1 2.8 (2.5) .254 3.6 (3.9) .354 6.8 (2.7) 0.6 .029
Q2 2.6 (2.0) .191 8.4 (2.8) 0.8 .004 1.9 (1.8) .314
Q3 0.28 (2.0) .889 0.4 (2.2) .869 3.0 (1.9) .133
Q4 3.3 (2.3) .155 4.8 (2.3) 0.6 .040 2.1 (2.5) .415
C
Q1 0.49 (2.5) .846 –0.5 (3.9) .908 5.7 (2.7) 0.6 .038
Q2 4.5 (1.9) 0.6 .026 6.0 (2.9) 0.5 .040 0.5 (1.9) .775
Q3 2.0 (2.0) .332 5.3 (2.1) 0.7 .015 5.8 (1.8) 0.9 .003
Q4 3.9 (2.3) .098 7.5 (2.2)* 0.9 .001 –3.1 (2.5) .233
D
Q1 0.2 (2.5) .935 6.8 (3.8) .081 6.7 (2.6)* 0.7 .012
Q2 5.6 (1.9) 0.8 .004 5.9 (2.9) 0.5 .044 2.5 (1.8) .183
Q3 1.4 (2.0) .506 1.0 (2.2) .655 0.1 (2.0) .976
Q4 5.5 (2.3) 0.7 .020 8.5 (2.1) 1.1 .000 2.1 (2.5)* .414
CM
Q1 3.3 (2.4) .186 0.5 (3.9) .909 6.8 (2.6)* 0.7 .012
Q2 5.4 (1.9) 0.8 .007 4.0 (2.9) .178 2.1 (1.8) .249
Q3 0.0 (2.0) .983 3.2 (2.2) .145 2.7 (2.0) .173
Q4 5.0 (2.3) 0.6 .040 8.8 (2.1) 1.1 .000 2.0 (2.6)* .440 a Quartiles based on pre-test mark. The lowest performing students are in Q1 and the highest in Q4. b Difference in mean exam marks E given as HPA-LPA c Effect size is Cohen’s d value * Indicates where HPA students score significantly higher in pre-test ** Indicates where LPA students score significantly higher in pre-test
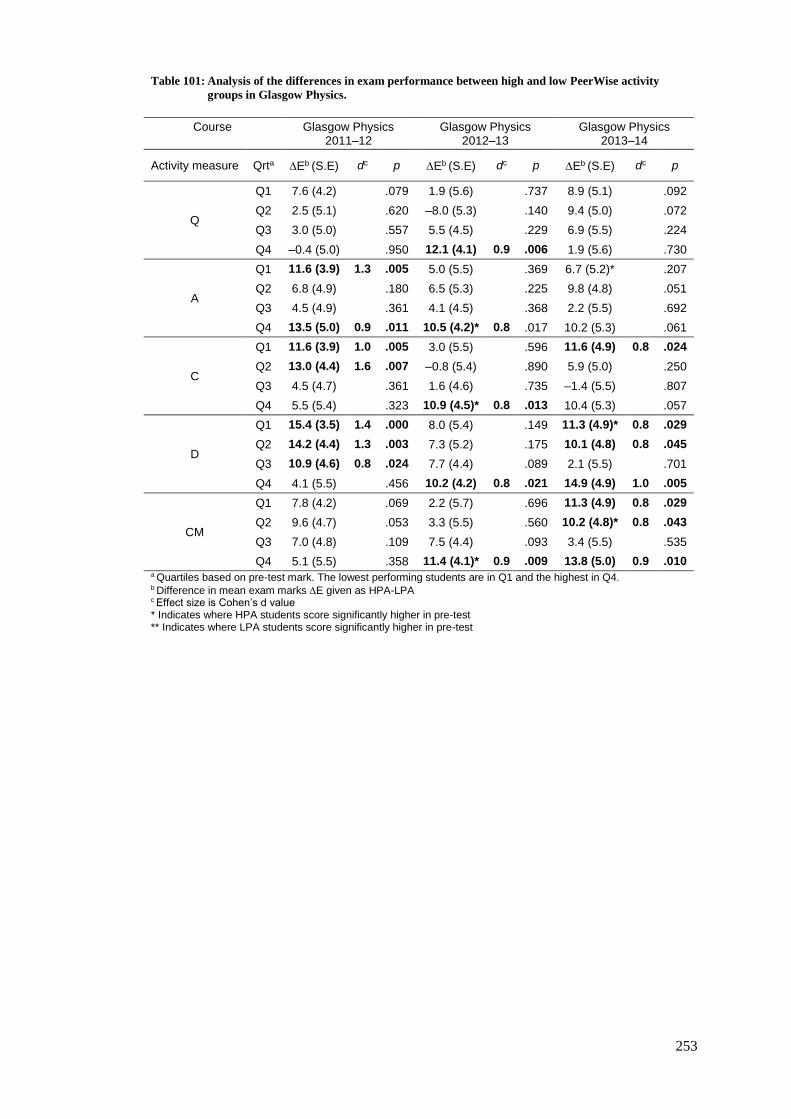
253
Table 101: Analysis of the differences in exam performance between high and low PeerWise activity
groups in Glasgow Physics.
Course
Glasgow Physics 2011–12
Glasgow Physics 2012–13
Glasgow Physics 2013–14
Activity measure Qrta Eb (S.E) dc p Eb (S.E) dc p Eb (S.E) dc p
Q
Q1 7.6 (4.2) .079 1.9 (5.6) .737 8.9 (5.1) .092
Q2 2.5 (5.1) .620 –8.0 (5.3) .140 9.4 (5.0) .072
Q3 3.0 (5.0) .557 5.5 (4.5) .229 6.9 (5.5) .224
Q4 –0.4 (5.0) .950 12.1 (4.1) 0.9 .006 1.9 (5.6) .730
A
Q1 11.6 (3.9) 1.3 .005 5.0 (5.5) .369 6.7 (5.2)* .207
Q2 6.8 (4.9) .180 6.5 (5.3) .225 9.8 (4.8) .051
Q3 4.5 (4.9) .361 4.1 (4.5) .368 2.2 (5.5) .692
Q4 13.5 (5.0) 0.9 .011 10.5 (4.2)* 0.8 .017 10.2 (5.3) .061
C
Q1 11.6 (3.9) 1.0 .005 3.0 (5.5) .596 11.6 (4.9) 0.8 .024
Q2 13.0 (4.4) 1.6 .007 –0.8 (5.4) .890 5.9 (5.0) .250
Q3 4.5 (4.7) .361 1.6 (4.6) .735 –1.4 (5.5) .807
Q4 5.5 (5.4) .323 10.9 (4.5)* 0.8 .013 10.4 (5.3) .057
D
Q1 15.4 (3.5) 1.4 .000 8.0 (5.4) .149 11.3 (4.9)* 0.8 .029
Q2 14.2 (4.4) 1.3 .003 7.3 (5.2) .175 10.1 (4.8) 0.8 .045
Q3 10.9 (4.6) 0.8 .024 7.7 (4.4) .089 2.1 (5.5) .701
Q4 4.1 (5.5) .456 10.2 (4.2) 0.8 .021 14.9 (4.9) 1.0 .005
CM
Q1 7.8 (4.2) .069 2.2 (5.7) .696 11.3 (4.9) 0.8 .029
Q2 9.6 (4.7) .053 3.3 (5.5) .560 10.2 (4.8)* 0.8 .043
Q3 7.0 (4.8) .109 7.5 (4.4) .093 3.4 (5.5) .535
Q4 5.1 (5.5) .358 11.4 (4.1)* 0.9 .009 13.8 (5.0) 0.9 .010 a Quartiles based on pre-test mark. The lowest performing students are in Q1 and the highest in Q4. b Difference in mean exam marks E given as HPA-LPA c Effect size is Cohen’s d value * Indicates where HPA students score significantly higher in pre-test ** Indicates where LPA students score significantly higher in pre-test
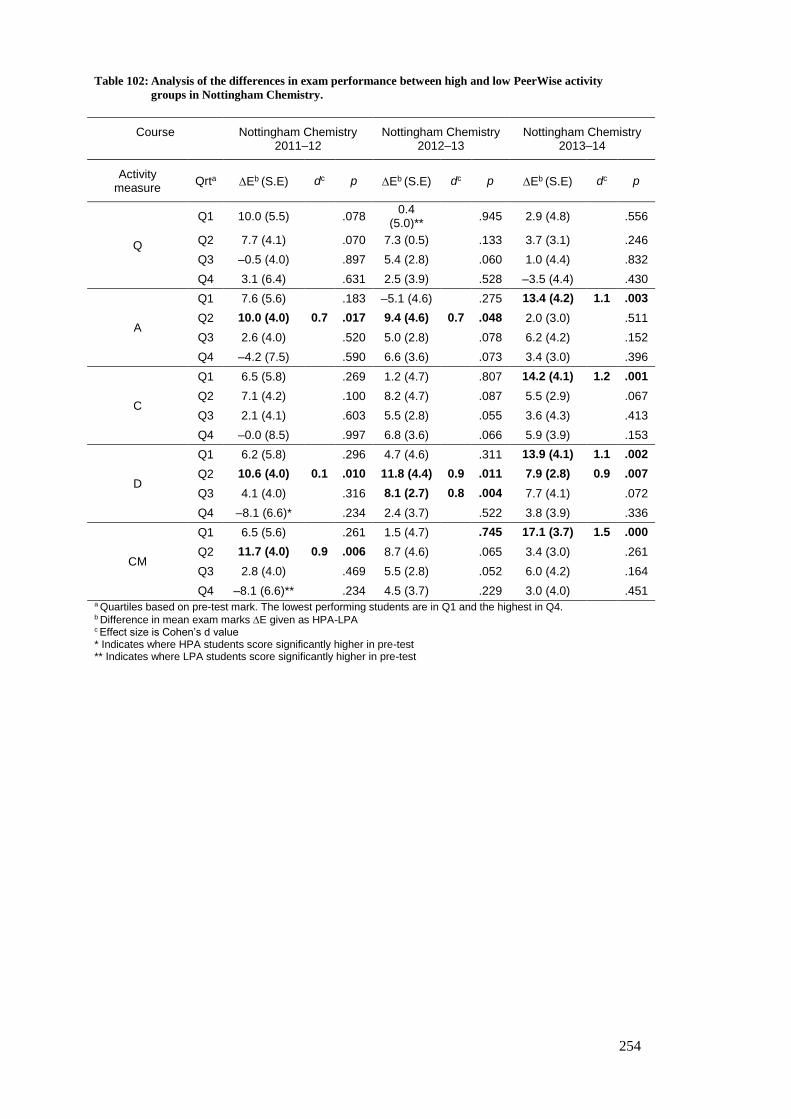
254
Table 102: Analysis of the differences in exam performance between high and low PeerWise activity
groups in Nottingham Chemistry.
Course
Nottingham Chemistry 2011–12
Nottingham Chemistry 2012–13
Nottingham Chemistry 2013–14
Activity measure
Qrta Eb (S.E) dc p Eb (S.E) dc p Eb (S.E) dc p
Q
Q1 10.0 (5.5) .078 0.4
(5.0)** .945 2.9 (4.8) .556
Q2 7.7 (4.1) .070 7.3 (0.5) .133 3.7 (3.1) .246
Q3 –0.5 (4.0) .897 5.4 (2.8) .060 1.0 (4.4) .832
Q4 3.1 (6.4) .631 2.5 (3.9) .528 –3.5 (4.4) .430
A
Q1 7.6 (5.6) .183 –5.1 (4.6) .275 13.4 (4.2) 1.1 .003
Q2 10.0 (4.0) 0.7 .017 9.4 (4.6) 0.7 .048 2.0 (3.0) .511
Q3 2.6 (4.0) .520 5.0 (2.8) .078 6.2 (4.2) .152
Q4 –4.2 (7.5) .590 6.6 (3.6) .073 3.4 (3.0) .396
C
Q1 6.5 (5.8) .269 1.2 (4.7) .807 14.2 (4.1) 1.2 .001
Q2 7.1 (4.2) .100 8.2 (4.7) .087 5.5 (2.9) .067
Q3 2.1 (4.1) .603 5.5 (2.8) .055 3.6 (4.3) .413
Q4 –0.0 (8.5) .997 6.8 (3.6) .066 5.9 (3.9) .153
D
Q1 6.2 (5.8) .296 4.7 (4.6) .311 13.9 (4.1) 1.1 .002
Q2 10.6 (4.0) 0.1 .010 11.8 (4.4) 0.9 .011 7.9 (2.8) 0.9 .007
Q3 4.1 (4.0) .316 8.1 (2.7) 0.8 .004 7.7 (4.1) .072
Q4 –8.1 (6.6)* .234 2.4 (3.7) .522 3.8 (3.9) .336
CM
Q1 6.5 (5.6) .261 1.5 (4.7) .745 17.1 (3.7) 1.5 .000
Q2 11.7 (4.0) 0.9 .006 8.7 (4.6) .065 3.4 (3.0) .261
Q3 2.8 (4.0) .469 5.5 (2.8) .052 6.0 (4.2) .164
Q4 –8.1 (6.6)** .234 4.5 (3.7) .229 3.0 (4.0) .451 a Quartiles based on pre-test mark. The lowest performing students are in Q1 and the highest in Q4. b Difference in mean exam marks E given as HPA-LPA c Effect size is Cohen’s d value * Indicates where HPA students score significantly higher in pre-test ** Indicates where LPA students score significantly higher in pre-test

255
Appendix D
Multiple regression models examining the
relationship between question authoring and exam
score
In each of the following tables, the best model, as discussed in the main text, is indicated by
an asterisk (*).

256
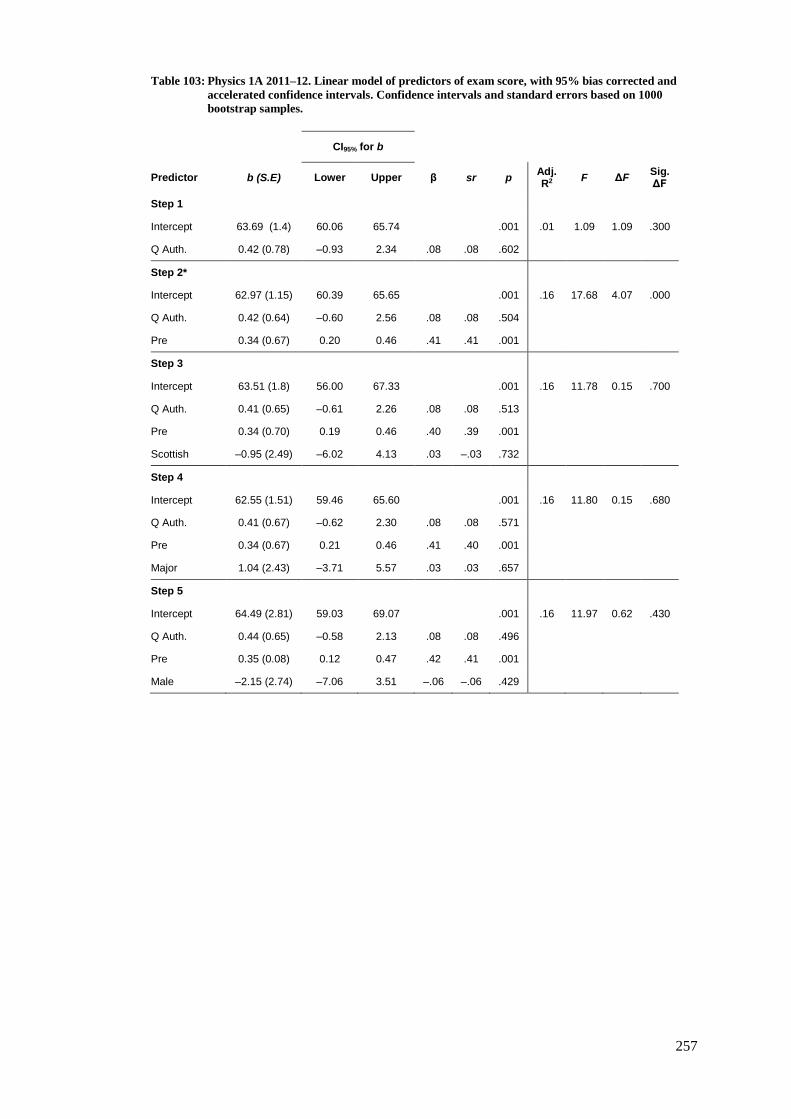
257
Table 103: Physics 1A 2011–12. Linear model of predictors of exam score, with 95% bias corrected and
accelerated confidence intervals. Confidence intervals and standard errors based on 1000
bootstrap samples.
CI95% for b
Predictor b (S.E) Lower Upper β sr p Adj. R2
F ΔF Sig. ΔF
Step 1
Intercept 63.69 (1.4) 60.06 65.74 .001 .01 1.09 1.09 .300
Q Auth. 0.42 (0.78) –0.93 2.34 .08 .08 .602
Step 2*
Intercept 62.97 (1.15) 60.39 65.65 .001 .16 17.68 4.07 .000
Q Auth. 0.42 (0.64) –0.60 2.56 .08 .08 .504
Pre 0.34 (0.67) 0.20 0.46 .41 .41 .001
Step 3
Intercept 63.51 (1.8) 56.00 67.33 .001 .16 11.78 0.15 .700
Q Auth. 0.41 (0.65) –0.61 2.26 .08 .08 .513
Pre 0.34 (0.70) 0.19 0.46 .40 .39 .001
Scottish –0.95 (2.49) –6.02 4.13 .03 –.03 .732
Step 4
Intercept 62.55 (1.51) 59.46 65.60 .001 .16 11.80 0.15 .680
Q Auth. 0.41 (0.67) –0.62 2.30 .08 .08 .571
Pre 0.34 (0.67) 0.21 0.46 .41 .40 .001
Major 1.04 (2.43) –3.71 5.57 .03 .03 .657
Step 5
Intercept 64.49 (2.81) 59.03 69.07 .001 .16 11.97 0.62 .430
Q Auth. 0.44 (0.65) –0.58 2.13 .08 .08 .496
Pre 0.35 (0.08) 0.12 0.47 .42 .41 .001
Male –2.15 (2.74) –7.06 3.51 –.06 –.06 .429
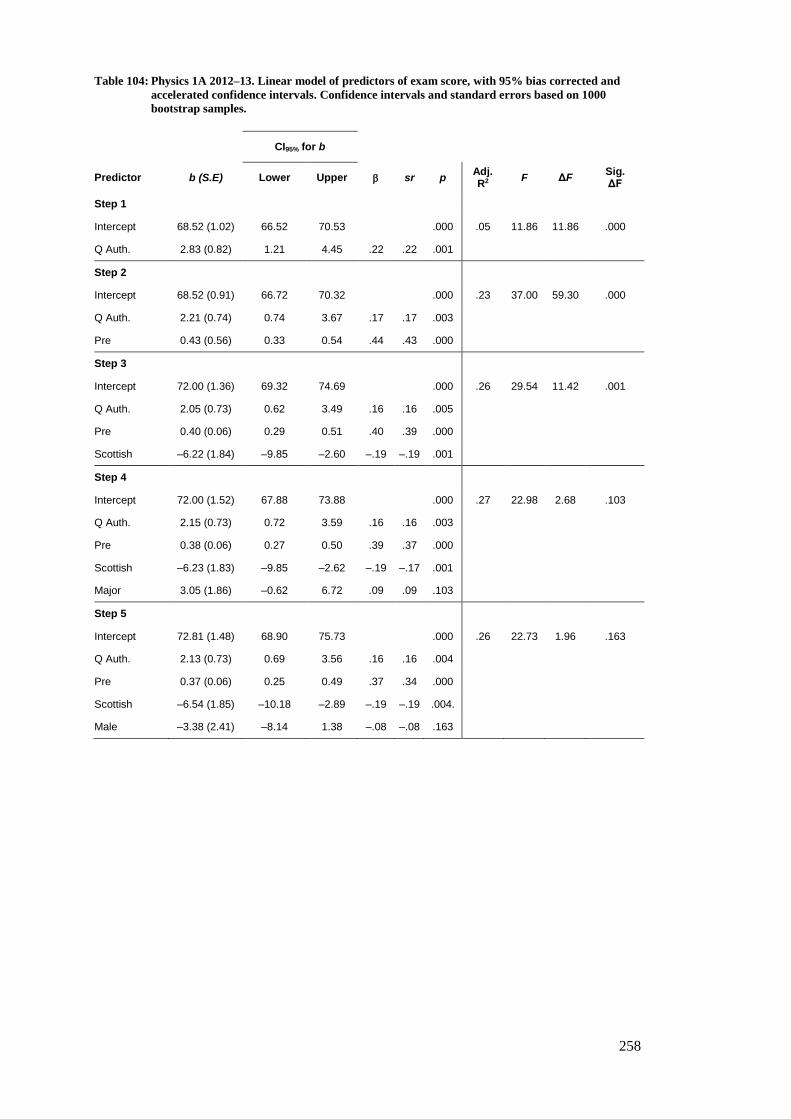
258
Table 104: Physics 1A 2012–13. Linear model of predictors of exam score, with 95% bias corrected and
accelerated confidence intervals. Confidence intervals and standard errors based on 1000
bootstrap samples.
CI95% for b
Predictor b (S.E) Lower Upper sr p Adj. R2
F ΔF Sig. ΔF
Step 1
Intercept 68.52 (1.02) 66.52 70.53 .000 .05 11.86 11.86 .000
Q Auth. 2.83 (0.82) 1.21 4.45 .22 .22 .001
Step 2
Intercept 68.52 (0.91) 66.72 70.32 .000 .23 37.00 59.30 .000
Q Auth. 2.21 (0.74) 0.74 3.67 .17 .17 .003
Pre 0.43 (0.56) 0.33 0.54 .44 .43 .000
Step 3
Intercept 72.00 (1.36) 69.32 74.69 .000 .26 29.54 11.42 .001
Q Auth. 2.05 (0.73) 0.62 3.49 .16 .16 .005
Pre 0.40 (0.06) 0.29 0.51 .40 .39 .000
Scottish –6.22 (1.84) –9.85 –2.60 –.19 –.19 .001
Step 4
Intercept 72.00 (1.52) 67.88 73.88 .000 .27 22.98 2.68 .103
Q Auth. 2.15 (0.73) 0.72 3.59 .16 .16 .003
Pre 0.38 (0.06) 0.27 0.50 .39 .37 .000
Scottish –6.23 (1.83) –9.85 –2.62 –.19 –.17 .001
Major 3.05 (1.86) –0.62 6.72 .09 .09 .103
Step 5
Intercept 72.81 (1.48) 68.90 75.73 .000 .26 22.73 1.96 .163
Q Auth. 2.13 (0.73) 0.69 3.56 .16 .16 .004
Pre 0.37 (0.06) 0.25 0.49 .37 .34 .000
Scottish –6.54 (1.85) –10.18 –2.89 –.19 –.19 .004.
Male –3.38 (2.41) –8.14 1.38 –.08 –.08 .163
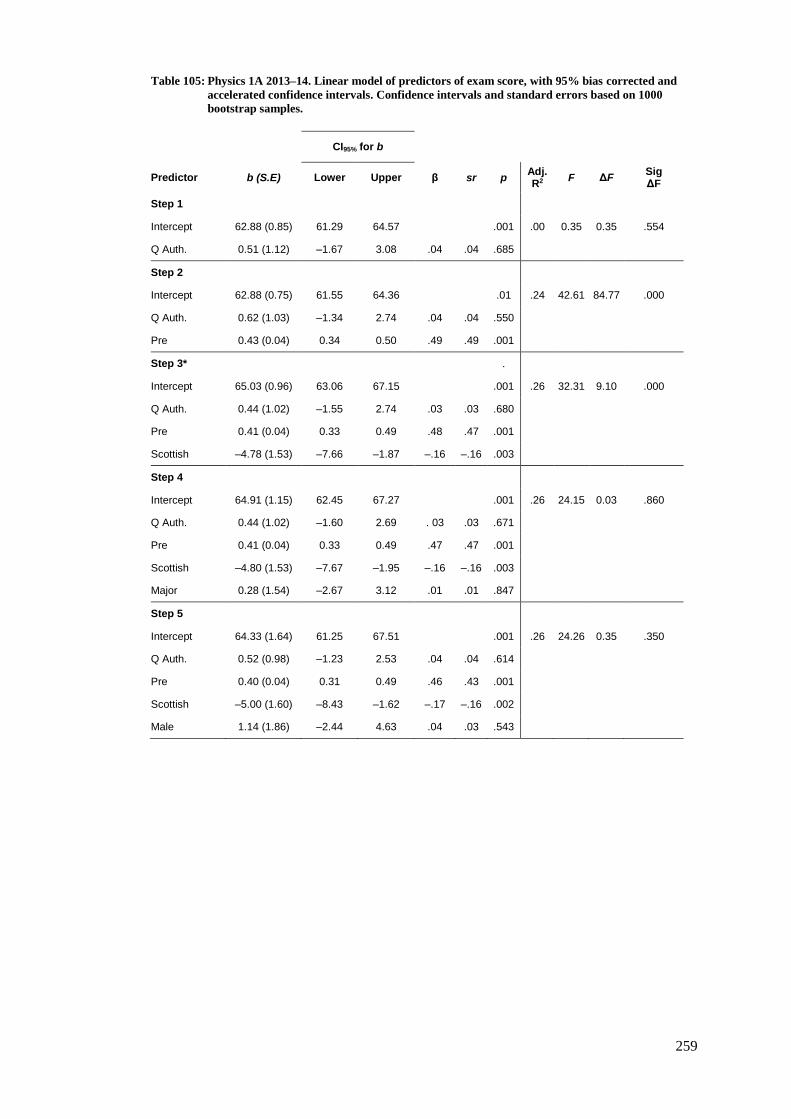
259
Table 105: Physics 1A 2013–14. Linear model of predictors of exam score, with 95% bias corrected and
accelerated confidence intervals. Confidence intervals and standard errors based on 1000
bootstrap samples.
CI95% for b
Predictor b (S.E) Lower Upper β sr p Adj. R2
F ΔF Sig ΔF
Step 1
Intercept 62.88 (0.85) 61.29 64.57 .001 .00 0.35 0.35 .554
Q Auth. 0.51 (1.12) –1.67 3.08 .04 .04 .685
Step 2
Intercept 62.88 (0.75) 61.55 64.36 .01 .24 42.61 84.77 .000
Q Auth. 0.62 (1.03) –1.34 2.74 .04 .04 .550
Pre 0.43 (0.04) 0.34 0.50 .49 .49 .001
Step 3* .
Intercept 65.03 (0.96) 63.06 67.15 .001 .26 32.31 9.10 .000
Q Auth. 0.44 (1.02) –1.55 2.74 .03 .03 .680
Pre 0.41 (0.04) 0.33 0.49 .48 .47 .001
Scottish –4.78 (1.53) –7.66 –1.87 –.16 –.16 .003
Step 4
Intercept 64.91 (1.15) 62.45 67.27 .001 .26 24.15 0.03 .860
Q Auth. 0.44 (1.02) –1.60 2.69 . 03 .03 .671
Pre 0.41 (0.04) 0.33 0.49 .47 .47 .001
Scottish –4.80 (1.53) –7.67 –1.95 –.16 –.16 .003
Major 0.28 (1.54) –2.67 3.12 .01 .01 .847
Step 5
Intercept 64.33 (1.64) 61.25 67.51 .001 .26 24.26 0.35 .350
Q Auth. 0.52 (0.98) –1.23 2.53 .04 .04 .614
Pre 0.40 (0.04) 0.31 0.49 .46 .43 .001
Scottish –5.00 (1.60) –8.43 –1.62 –.17 –.16 .002
Male 1.14 (1.86) –2.44 4.63 .04 .03 .543

260
Table 106: Physics 1B 2011–12. Linear model of predictors of exam score, with 95% bias corrected and
accelerated confidence intervals. Confidence intervals and standard errors based on 1000
bootstrap samples.
CI95% for b
Predictor b (S.E) Lower Upper β sr p Adj. R2
F ΔF Sig ΔF
Step 1
Intercept 63.69 (1.49) 60.95 66.93 .001 .06 5.68 5.68 .019
Q Auth. 2.54 (0.76) 0.86 3.89 .25 .25 .001
Step 2*
Intercept 63.69 (1.10) 61.51 65.61 .001 .51 47.20 83.41 .000
Q Auth. 0.80 (0.57) –0.44 1.80 .08 .08 .129
Pre 0.77 (0.07) 0.62 .091 .70 .70 .001
Step 3
Intercept 63.31 (1.84) 59.69 66.99 .001 .50 31.16 0.08 .778
Q Auth. 0.85 (0.63) –0.55 1.97 .08 .08 .149
Pre 0.77 (0.07) 0.62 0.91 .70 .70 .001
Scottish 0.67 (2.44) –0.41 5.51 .02 .02 .789
Step 4
Intercept 62.83 (1.61) 59.88 66.12 .001 .51 31.51 0.58 .448
Q Auth. 0.83 (0.51) –0.34 1.88 .08 .08 .129
Pre 0.76 (0.07) 0.62 .090 .70 .67 .001
Major 1.73 (2.35) –3.50 6.18 .06 .06 .447
Step 5
Intercept 66.06 (1.95) 62.20 70.02 .001 .51 32.27 1.67 .199
Q Auth. 0.72 (0.60) –0.69 1.71 .07 .07 .193
Pre 0.79 (0.08) 0.64 0.93 .71 .69 .001
Male –3.28 (2.35) –8.29 1.31 –.10 –.10 .153
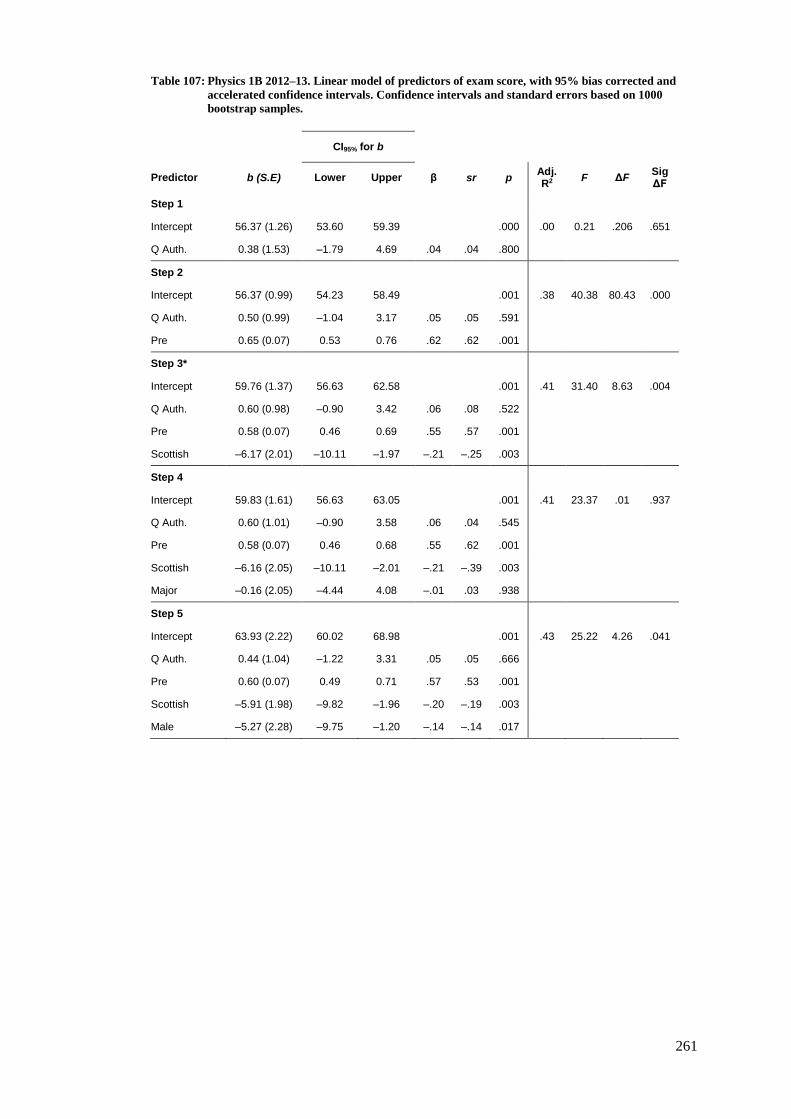
261
Table 107: Physics 1B 2012–13. Linear model of predictors of exam score, with 95% bias corrected and
accelerated confidence intervals. Confidence intervals and standard errors based on 1000
bootstrap samples.
CI95% for b
Predictor b (S.E) Lower Upper β sr p Adj. R2
F ΔF Sig ΔF
Step 1
Intercept 56.37 (1.26) 53.60 59.39 .000 .00 0.21 .206 .651
Q Auth. 0.38 (1.53) –1.79 4.69 .04 .04 .800
Step 2
Intercept 56.37 (0.99) 54.23 58.49 .001 .38 40.38 80.43 .000
Q Auth. 0.50 (0.99) –1.04 3.17 .05 .05 .591
Pre 0.65 (0.07) 0.53 0.76 .62 .62 .001
Step 3*
Intercept 59.76 (1.37) 56.63 62.58 .001 .41 31.40 8.63 .004
Q Auth. 0.60 (0.98) –0.90 3.42 .06 .08 .522
Pre 0.58 (0.07) 0.46 0.69 .55 .57 .001
Scottish –6.17 (2.01) –10.11 –1.97 –.21 –.25 .003
Step 4
Intercept 59.83 (1.61) 56.63 63.05 .001 .41 23.37 .01 .937
Q Auth. 0.60 (1.01) –0.90 3.58 .06 .04 .545
Pre 0.58 (0.07) 0.46 0.68 .55 .62 .001
Scottish –6.16 (2.05) –10.11 –2.01 –.21 –.39 .003
Major –0.16 (2.05) –4.44 4.08 –.01 .03 .938
Step 5
Intercept 63.93 (2.22) 60.02 68.98 .001 .43 25.22 4.26 .041
Q Auth. 0.44 (1.04) –1.22 3.31 .05 .05 .666
Pre 0.60 (0.07) 0.49 0.71 .57 .53 .001
Scottish –5.91 (1.98) –9.82 –1.96 –.20 –.19 .003
Male –5.27 (2.28) –9.75 –1.20 –.14 –.14 .017

262
Table 108: Physics 1B 2013–14. Linear model of predictors of exam score, with 95% bias corrected and
accelerated confidence intervals. Confidence intervals and standard errors based on 1000
bootstrap samples.
CI95% for b
Predictor b (S.E) Lower Upper β sr p Adj. R2
F ΔF Sig ΔF
Step 1
Intercept 58.98 (1.23) 56.82 61.25 .001 .05 7.04 7.04 .009
Q Auth. 2.96 (0.97) 0.85 4.92 .22 .22 .002
Step 2*
Intercept 59.98 (1.02) 57.04 60.72 .001 .33 35.00 59.92 .000
Q Auth. 1.53 (0.92) –0.34 3.42 .12 .11 .094
Pre 0.58 (0.08) 0.44 0.72 .55 .54 .001
Step 3 .
Intercept 60.75 (1.49) 57.49 63.71 .001 .34 24.54 2.72 .101
Q Auth. 1.51 (0.90) –0.19 3.40 .11 .22 ,085
Pre 0.55 (0.08) 0.38 0.70 .52 .49 .001
Scottish –3.64 (2.32) –8.14 0.90 –.12 –.11 .109
Step 4
Intercept 59.30 (1.49) 56.55 62.26 .001 .33 23.19 0.06 .804
Q Auth. 1.53 (0.97) –0.44 3.51 .12 .11 .093
Pre 0.58 (0.08) 0.43 0.73 .55 .55 .001
Major –0.55 (2.16) –4.44 3.52 –.02 –.02 .815
Step 5
Intercept 60.17 (1.67) 57.18 63.48 .001 .33 23.42 0.51 .477
Q Auth. 1.52 (0.93) –0.32 3.16 . 11 .11 .091
Pre 0.59 (0.74) 0.42 0.74 .56 .54 .001
Male –1.70 (2.17) –6.11 2.72 –.05 –.05 .463
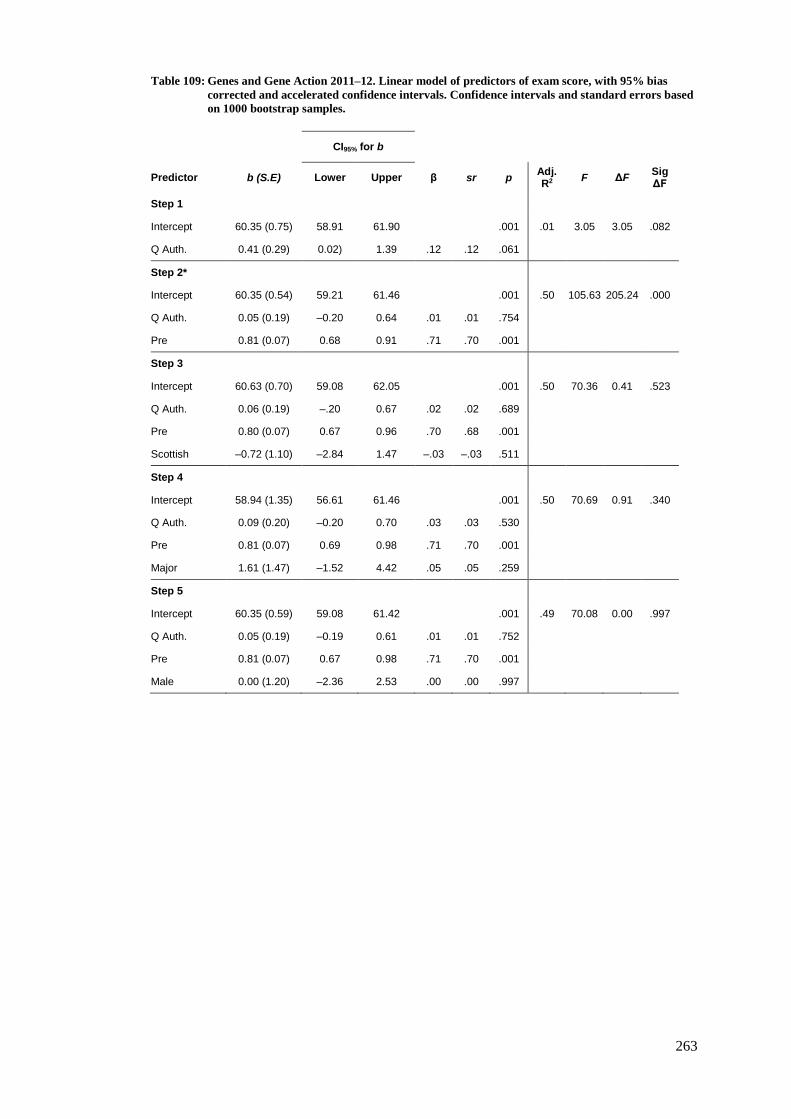
263
Table 109: Genes and Gene Action 2011–12. Linear model of predictors of exam score, with 95% bias
corrected and accelerated confidence intervals. Confidence intervals and standard errors based
on 1000 bootstrap samples.
CI95% for b
Predictor b (S.E) Lower Upper β sr p Adj. R2
F ΔF Sig ΔF
Step 1
Intercept 60.35 (0.75) 58.91 61.90 .001 .01 3.05 3.05 .082
Q Auth. 0.41 (0.29) 0.02) 1.39 .12 .12 .061
Step 2*
Intercept 60.35 (0.54) 59.21 61.46 .001 .50 105.63 205.24 .000
Q Auth. 0.05 (0.19) –0.20 0.64 .01 .01 .754
Pre 0.81 (0.07) 0.68 0.91 .71 .70 .001
Step 3
Intercept 60.63 (0.70) 59.08 62.05 .001 .50 70.36 0.41 .523
Q Auth. 0.06 (0.19) –.20 0.67 .02 .02 .689
Pre 0.80 (0.07) 0.67 0.96 .70 .68 .001
Scottish –0.72 (1.10) –2.84 1.47 –.03 –.03 .511
Step 4
Intercept 58.94 (1.35) 56.61 61.46 .001 .50 70.69 0.91 .340
Q Auth. 0.09 (0.20) –0.20 0.70 .03 .03 .530
Pre 0.81 (0.07) 0.69 0.98 .71 .70 .001
Major 1.61 (1.47) –1.52 4.42 .05 .05 .259
Step 5
Intercept 60.35 (0.59) 59.08 61.42 .001 .49 70.08 0.00 .997
Q Auth. 0.05 (0.19) –0.19 0.61 .01 .01 .752
Pre 0.81 (0.07) 0.67 0.98 .71 .70 .001
Male 0.00 (1.20) –2.36 2.53 .00 .00 .997

264
Table 110: Genes and Gene Action 2012–13. Linear model of predictors of exam score, with 95% bias
corrected and accelerated confidence intervals. Confidence intervals and standard errors based
on 1000 bootstrap samples.
CI95% for b
Predictor b (S.E) Lower Upper β sr p Adj. R2
F ΔF Sig ΔF
Step 1
Intercept 65.82 (0.88) 64.00 67.66 .001 .03 7.29 7.29 .007
Q Auth. 0.26 (0.11) 0.10 0.60 .18 .18 .005
Step 2*
Intercept 65.82 (0.67) 64.57 67.11 .001 .40 77.67 143.52 .000
Q Auth. 0.16 (0.80) 0.03 0.41 .11 .11 .014
Pre 0.80 (0.07) 0.65 0.95 .62 .61 .001
Step 3
Intercept 66.70 (0.90) 64.78 68.54 .001 .40 52.77 2.18 .141
Q Auth. 0.16 (0.08) 0.04 0.43 .11 .11 .017
Pre 0.76 (0.07) 0.61 0.92 .59 .56 .001
Scottish –2.22 (1.56) –5.15 0.77 –.08 –.08 .150
Step 4
Intercept 64.40 (1.88) 60.41 68.39 .001 .00 51.95 0.72 .398
Q Auth. 0.17 (0.08) 0.03 0.41 .12 .11 .010
Pre 0.79 (0.07) 0.64 0.93 .61 .60 .001
Major 1.68 (2.08) 2.10 5.53 .04 .04 .425
Step 5
Intercept 67.32 (0.73) 65.83 68.76 .001 .43 58.31 12.08 .001
Q Auth. 0.14 (0.07) 0.01 0.38 .09 .09 .017
Pre 0.79 (0.07) 0.67 0.92 .61 .61 .001
Male –5.28 (1.67) –8.82 –1.58 –.17 –.17 .004

265
Table 111: Genes and Gene Action 2013–14. Linear model of predictors of exam score, with 95% bias
corrected and accelerated confidence intervals. Confidence intervals and standard errors based
on 1000 bootstrap samples.
CI95% for b
Predictor b (S.E) Lower Upper β sr p Adj. R2
F ΔF Sig ΔF
Step 1
Intercept 58.97 (0.82) 57.37 60.56 .001 0.00 0.46 0.56 .455
Q Auth. 0.20 (0.30) –0.32 0.88 .05 .05 .516
Step 2*
Intercept 58.97 (0.54) 57.94 59.91 .001 .57 146.82 292.33 .000
Q Auth. –0.10 (0.18) –0.48 0.34 –.02 –.02 .590
Pre 0.76 (0.63) 0.64 0.91 .76 .76 .001
Step 3
Intercept 58.89 (0.81) 57.28 60.62 .001 .57 97.45 0.03 .865
Q Auth. –0.10 (0.18) –0.48 0.35 –.02 –.02 .581
Pre 0.77 (0.07) 0.63 0.93 .76 .73 .001
Scottish 0.20 (1.27) –2.41 2.87 . 01 .01 .872
Step 4
Intercept 58.83 (1.49) 56.24 61.27 .001 .57 97.44 0.01 .921
Q Auth. –0.09 (0.20) –0.49 0.36 –.02 –.02 .645
Pre 0.76 (0.06) 0.65 0.89 .76 .76 .001
Major 0.15 (1.61) –3.26 3.67 .00 .00 .905
Step 5
Intercept 58.71 (0.63) 57.48 59.85 .001 .57 97.81 0.49 .485
Q Auth. –0.08 (0.17) –0.42 0.28 –.02 –.02 .627
Pre 0.77 (0.06) 0.65 0.90 .76 .76 .001
Male 0.83 (1.18) –1.53 2.84 .03 .03 .472

266
Table 112: Chemistry 1B 2011–12. Linear model of predictors of exam score, with 95% bias corrected and
accelerated confidence intervals. Confidence intervals and standard errors based on 1000
bootstrap samples.
CI95% for b
Predictor b (S.E) Lower Upper β sr p Adj. R2
F ΔF Sig ΔF
Step 1
Intercept 65.72 (1.17) 63.16 68.75 .001 .06 9.25 9.25 .003
Q Auth. 0.95 (0.39) 0.28 2.13 .24 .24 .010
Step 2
Intercept 65.72 (0.77) 64.12 67.50 .001 .58 108.76 196.46 .000
Q Auth. .32 (0.26) –0.16 1.02 .08 .08 .225
Pre 1.00 (0.08) 0.84 1.17 .75 .73 .001
Step 3
Intercept 68.49 (1.21) 66.16 70.67 .001 .60 77.94 7.30 .008
Q Auth. 0.334 (0.25) –0.19 0.99 .10 .08 .171
Pre 0.97 (0.08) 0.81 1.15 .72 .70 .001
Scottish –4.29 (1.60) –7.69 –0.78 –.14 –.14 .012
Step 4*
Intercept 65.96 (1.66) 62.90 69.26 .001 .61 61.84 5.92 .016
Q Auth. 0.34 (0.24) –0.10 0.95 .09 .09 .137
Pre 0.98 (0.08) 0.83 1.17 .73 .70 .001
Scottish –3.72 (1.54) –6.66 –0.58 –.12 –.12 .020
Major 3.68. (1.56) 0.56 6.52 .12 .12 .023
Step 5
Intercept 66.03 (1.85) 62.31 69.95 .001 .61 49.15 0.01 .920
Q Auth. 0.34 (0.24) –0.11 0.95 .09 .08 .140
Pre 0.98 (0.08) 0,84 1.16 .73 .70 .001
Scottish –3.71 (1.58) –6.83 –0.39 –12 –.12 .026
Major 3.67 (1.59) 0.56 6.56 .12 .12 .023
Male –0.15 (1.54) –2.87 2.39 –.01 –.01 .916
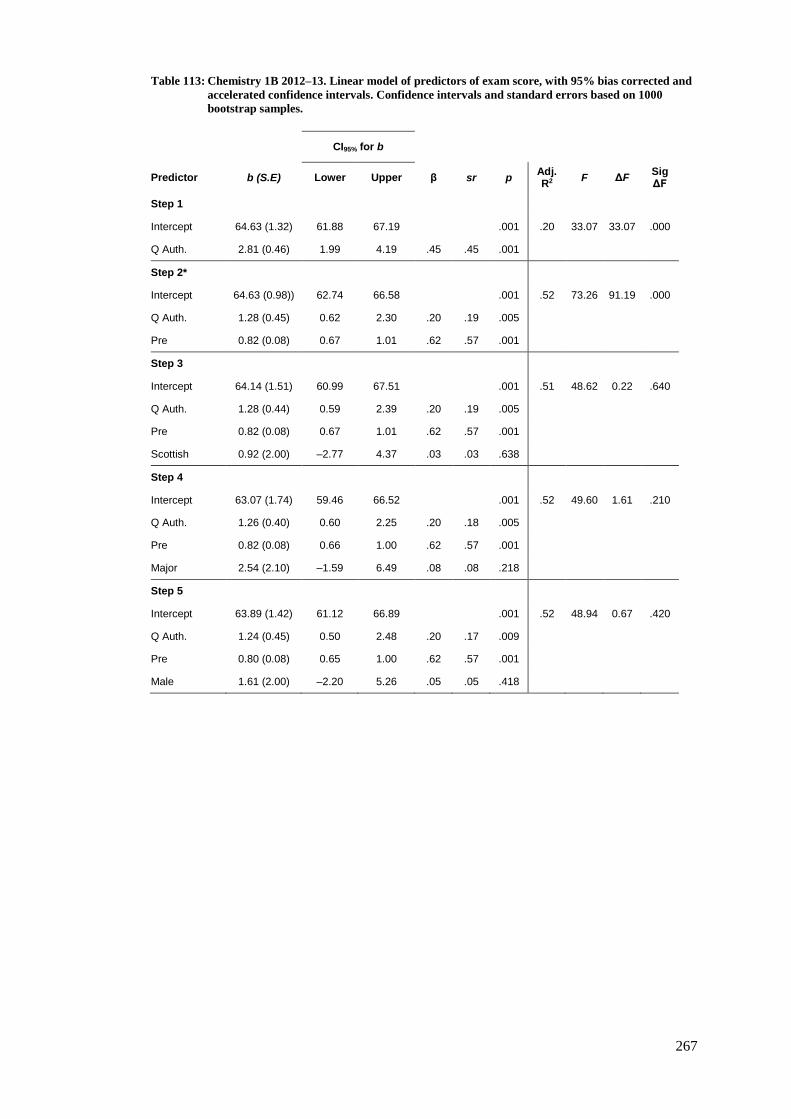
267
Table 113: Chemistry 1B 2012–13. Linear model of predictors of exam score, with 95% bias corrected and
accelerated confidence intervals. Confidence intervals and standard errors based on 1000
bootstrap samples.
CI95% for b
Predictor b (S.E) Lower Upper β sr p Adj. R2
F ΔF Sig ΔF
Step 1
Intercept 64.63 (1.32) 61.88 67.19 .001 .20 33.07 33.07 .000
Q Auth. 2.81 (0.46) 1.99 4.19 .45 .45 .001
Step 2*
Intercept 64.63 (0.98)) 62.74 66.58 .001 .52 73.26 91.19 .000
Q Auth. 1.28 (0.45) 0.62 2.30 .20 .19 .005
Pre 0.82 (0.08) 0.67 1.01 .62 .57 .001
Step 3
Intercept 64.14 (1.51) 60.99 67.51 .001 .51 48.62 0.22 .640
Q Auth. 1.28 (0.44) 0.59 2.39 .20 .19 .005
Pre 0.82 (0.08) 0.67 1.01 .62 .57 .001
Scottish 0.92 (2.00) –2.77 4.37 .03 .03 .638
Step 4
Intercept 63.07 (1.74) 59.46 66.52 .001 .52 49.60 1.61 .210
Q Auth. 1.26 (0.40) 0.60 2.25 .20 .18 .005
Pre 0.82 (0.08) 0.66 1.00 .62 .57 .001
Major 2.54 (2.10) –1.59 6.49 .08 .08 .218
Step 5
Intercept 63.89 (1.42) 61.12 66.89 .001 .52 48.94 0.67 .420
Q Auth. 1.24 (0.45) 0.50 2.48 .20 .17 .009
Pre 0.80 (0.08) 0.65 1.00 .62 .57 .001
Male 1.61 (2.00) –2.20 5.26 .05 .05 .418
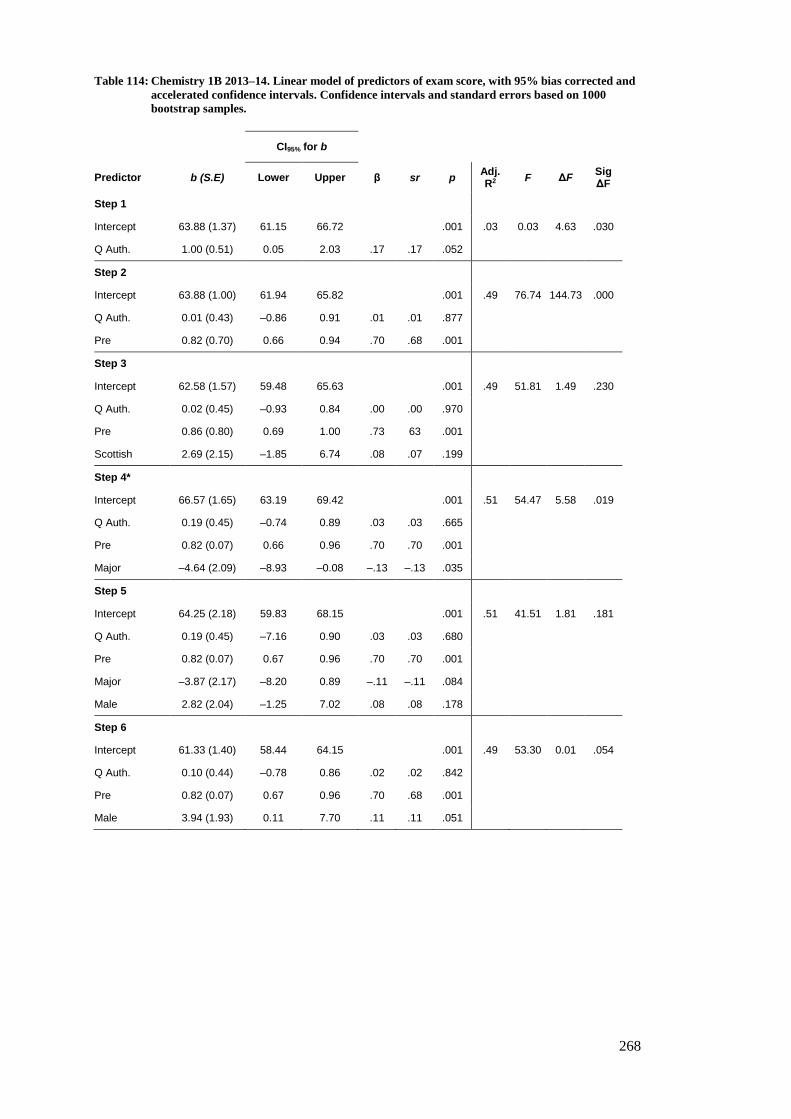
268
Table 114: Chemistry 1B 2013–14. Linear model of predictors of exam score, with 95% bias corrected and
accelerated confidence intervals. Confidence intervals and standard errors based on 1000
bootstrap samples.
CI95% for b
Predictor b (S.E) Lower Upper β sr p Adj. R2
F ΔF Sig ΔF
Step 1
Intercept 63.88 (1.37) 61.15 66.72 .001 .03 0.03 4.63 .030
Q Auth. 1.00 (0.51) 0.05 2.03 .17 .17 .052
Step 2
Intercept 63.88 (1.00) 61.94 65.82 .001 .49 76.74 144.73 .000
Q Auth. 0.01 (0.43) –0.86 0.91 .01 .01 .877
Pre 0.82 (0.70) 0.66 0.94 .70 .68 .001
Step 3
Intercept 62.58 (1.57) 59.48 65.63 .001 .49 51.81 1.49 .230
Q Auth. 0.02 (0.45) –0.93 0.84 .00 .00 .970
Pre 0.86 (0.80) 0.69 1.00 .73 63 .001
Scottish 2.69 (2.15) –1.85 6.74 .08 .07 .199
Step 4*
Intercept 66.57 (1.65) 63.19 69.42 .001 .51 54.47 5.58 .019
Q Auth. 0.19 (0.45) –0.74 0.89 .03 .03 .665
Pre 0.82 (0.07) 0.66 0.96 .70 .70 .001
Major –4.64 (2.09) –8.93 –0.08 –.13 –.13 .035
Step 5
Intercept 64.25 (2.18) 59.83 68.15 .001 .51 41.51 1.81 .181
Q Auth. 0.19 (0.45) –7.16 0.90 .03 .03 .680
Pre 0.82 (0.07) 0.67 0.96 .70 .70 .001
Major –3.87 (2.17) –8.20 0.89 –.11 –.11 .084
Male 2.82 (2.04) –1.25 7.02 .08 .08 .178
Step 6
Intercept 61.33 (1.40) 58.44 64.15 .001 .49 53.30 0.01 .054
Q Auth. 0.10 (0.44) –0.78 0.86 .02 .02 .842
Pre 0.82 (0.07) 0.67 0.96 .70 .68 .001
Male 3.94 (1.93) 0.11 7.70 .11 .11 .051

269
Table 115: Glasgow Physics 2011–12. Linear model of predictors of exam score, with 95% bias corrected
and accelerated confidence intervals. Confidence intervals and standard errors based on 1000
bootstrap samples.
CI95% for b
Predictor b (S.E) Lower Upper β sr p Adj. R2
F ΔF Sig ΔF
Step 1
Intercept 51.58 (1.58) 48.50 55.23 .001 .03 17.17 17.17 .000
Q Auth. 2.25 (0.55) 1.40 3.96 .34 .34 .001
Step 2
Intercept 51.85 (1.14) 49.52 54.10 .001 .50 70.72 110.45 .000
Q Auth. 1.15 (0.42) 0.46 2.18 .17 .17 .003
Pre 0.59 (0.06) 0.48 0.68 .65 .63 .001
Step 3
Intercept 50.05 (2.47) 45.38 54.77 .001 .50 47.24 0.65 .420
Q Auth. 1.19 (0.44) 0.50 2.26 .18 .17 .006
Pre 0.58 (0.06) 0.47 0.68 .64 .62 .001
Male 2.31 (2.80) –4.20 8.07 .05 .05 .407

270
Table 116: Glasgow Physics 2012–13. Linear model of predictors of exam score, with 95% bias corrected
and accelerated confidence intervals. Confidence intervals and standard errors based on 1000
bootstrap samples.
CI95% for b
Predictor b (S.E) Lower Upper β sr p Adj. R2
F ΔF Sig ΔF
Step 1
Intercept 53.11 (1.63) 50.07 56.28 .001 .03 4.56 4.56 .340
Q Auth. 0.97 (0.56) –0.10 2.33 .17 .17 .079
Step 2
Intercept 53.11 (1.18) 50.65 55.61 .001 .47 66.84 125.33 .000
Q Auth. 0.40 (0.48) –0.49 1.60 .07 .07 .404
Pre 0.58 (0.05) 0.47 0.67 ,67 .67 .001
Step 3
Intercept 54.33 (2.34) 50.33 58.95 .001 .47 44.45 0.31 .581
Q Auth. 0.38 (0.48) –0.51 1.58 .07 .07 .429
Pre 0.58 (0.05) 0.48 0.68 .68 .67 .001
Male –1.58 (2.81) –7.94 4.55 –.03 –.03 .591
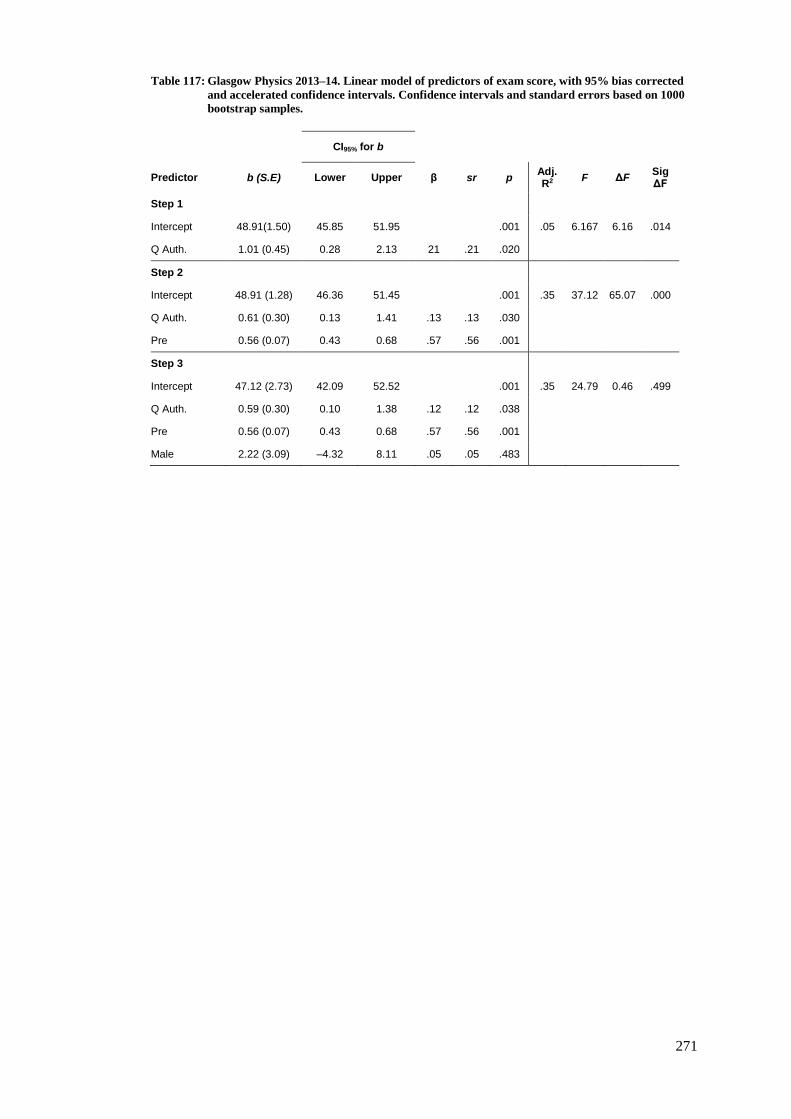
271
Table 117: Glasgow Physics 2013–14. Linear model of predictors of exam score, with 95% bias corrected
and accelerated confidence intervals. Confidence intervals and standard errors based on 1000
bootstrap samples.
CI95% for b
Predictor b (S.E) Lower Upper β sr p Adj. R2
F ΔF Sig ΔF
Step 1
Intercept 48.91(1.50) 45.85 51.95 .001 .05 6.167 6.16 .014
Q Auth. 1.01 (0.45) 0.28 2.13 21 .21 .020
Step 2
Intercept 48.91 (1.28) 46.36 51.45 .001 .35 37.12 65.07 .000
Q Auth. 0.61 (0.30) 0.13 1.41 .13 .13 .030
Pre 0.56 (0.07) 0.43 0.68 .57 .56 .001
Step 3
Intercept 47.12 (2.73) 42.09 52.52 .001 .35 24.79 0.46 .499
Q Auth. 0.59 (0.30) 0.10 1.38 .12 .12 .038
Pre 0.56 (0.07) 0.43 0.68 .57 .56 .001
Male 2.22 (3.09) –4.32 8.11 .05 .05 .483

272
Table 118: Nottingham Chemistry 2011–12. Linear model of predictors of exam score, with 95% bias
corrected and accelerated confidence intervals. Confidence intervals and standard errors based
on 1000 bootstrap samples.
CI95% for b
Predictor b (S.E) Lower Upper β sr p Adj. R2
F ΔF Sig ΔF
Step 1
Intercept 61.57 (1.15) 59.45 63.87 .001 .06 9.96 9.96 .002
Q Auth. 1.27 (0.35) 0.57 1.99 .24 .24 .001
Step 2
Intercept 61.57 (1.04) 59.61 63.61 .001 .19 20.08 28.49 .000
Q Auth. 0.80 (0.34) 0.16 1.51 .15 .15 .014
Pre 0.54 (0.09) 0.38 0.74 . 37 .37 .001
Step 3
Intercept 62.99 (1.51) 59.99 66.39 .001 .19 13.68 0.90 .344
Q Auth. 0.77 (0.34) 0.19 1.50 .15 .14 .017
Pre 0.54 (0.09) 0.38 0.74 .39 .38 .001
Male –2.15 (2.02) –5.93 1.31 –.07 –.07 .285

273
Table 119: Nottingham Chemistry 2012–13. Linear model of predictors of exam score, with 95% bias
corrected and accelerated confidence intervals. Confidence intervals and standard errors based
on 1000 bootstrap samples.
CI95% for b
Predictor b (S.E) Lower Upper β sr p Adj. R2
F ΔF Sig ΔF
Step 1
Intercept 61.67 (1.04) 59.66 63.67 .001 .01 1.16 1.16 .283
Q Auth. 0.29 (0.26) –0.13 0.99 .08 .08 .200
Step 2
Intercept 61.67 (0.96) 59.69 63.65 .001 .15 15.72 30.71 .000
Q Auth. 0.30 (0.25) –0.07 0.89 .08 .08 .182
Pre 0.40 (0.07) 0.23 0.57 .39 .39 .001
Step 3
Intercept 61.70 (1.19) 59.16 64.13 .001 .15 10.41 0.00 .975
Q Auth. 0.30 (0.25) –0.08 0.91 .08 .08 .178
Pre 0.40 (0.07) 0.26 0.57 .39 .39 .001
Male 0.61 (2.05) –4.30 4.20 .00 .00 .970
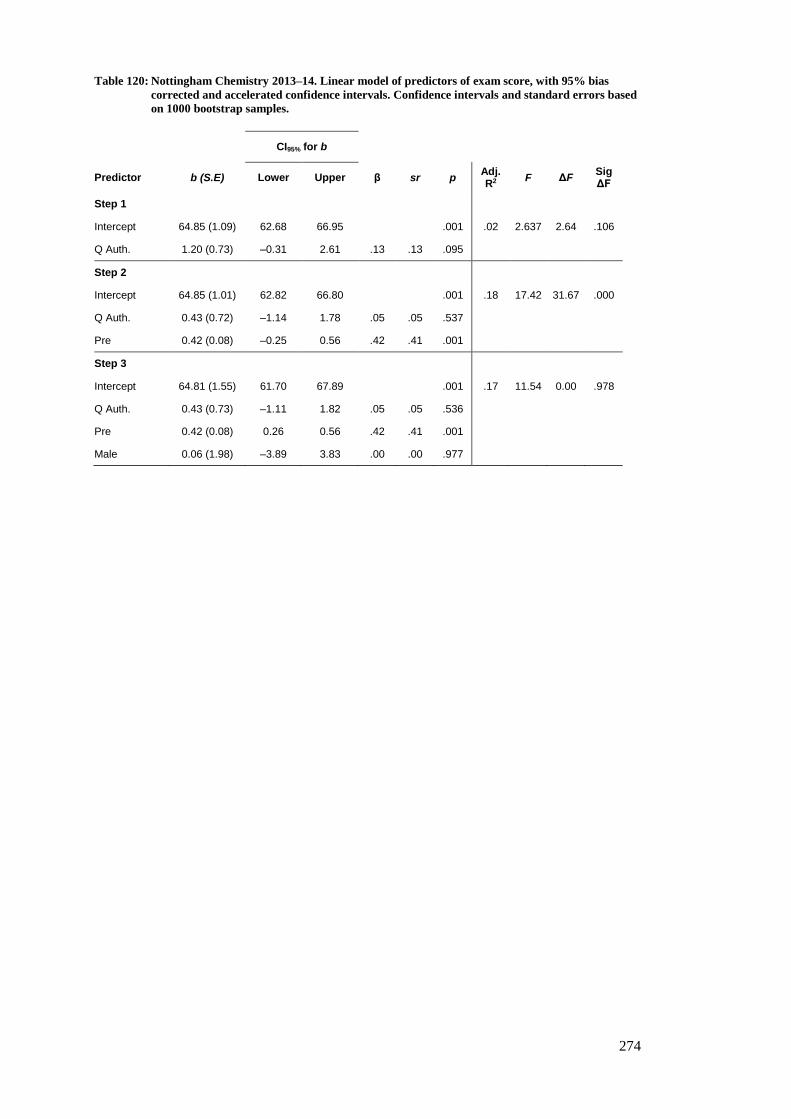
274
Table 120: Nottingham Chemistry 2013–14. Linear model of predictors of exam score, with 95% bias
corrected and accelerated confidence intervals. Confidence intervals and standard errors based
on 1000 bootstrap samples.
CI95% for b
Predictor b (S.E) Lower Upper β sr p Adj. R2
F ΔF Sig ΔF
Step 1
Intercept 64.85 (1.09) 62.68 66.95 .001 .02 2.637 2.64 .106
Q Auth. 1.20 (0.73) –0.31 2.61 .13 .13 .095
Step 2
Intercept 64.85 (1.01) 62.82 66.80 .001 .18 17.42 31.67 .000
Q Auth. 0.43 (0.72) –1.14 1.78 .05 .05 .537
Pre 0.42 (0.08) –0.25 0.56 .42 .41 .001
Step 3
Intercept 64.81 (1.55) 61.70 67.89 .001 .17 11.54 0.00 .978
Q Auth. 0.43 (0.73) –1.11 1.82 .05 .05 .536
Pre 0.42 (0.08) 0.26 0.56 .42 .41 .001
Male 0.06 (1.98) –3.89 3.83 .00 .00 .977

275
Appendix E
Multiple regression models examining the
relationship between question answering and exam
score
In each of the following tables, the best model, as discussed in the main text, is indicated by
an asterisk (*).

276

277
Table 121: Physics 1A 2011–12. Linear model of predictors of exam score, with 95% bias corrected and
accelerated confidence intervals. Confidence intervals and standard errors based on 1000
bootstrap samples.
CI95% for b
Predictor b (S.E) Lower Upper β sr p Adj. R2
F ΔF Sig. ΔF
Step 1
Intercept 62.97 (1.32) 60.23 65.97 .001 .01 2.44 2.44 .120
Q Ans. 0.05 (0.06) –0.06 0.20 .12 .12 .514
Step 2*
Intercept 62.97 (1.21) 60.49 65.71 .001 .18 19.42 35.89 .000
Q Ans. 0.06 (0.05) –0.04 0.20 .14 .12 .323
Pre 0.35 (.0.07) 0.24 0.45 .42 .42 .001
Step 3 .
Intercept 63.55 (1.91) 59.92 67.42 .001 .17 12.94 0.17 .691
Q Ans. 0.06 (0.05) –0.04 0.20 .14 .14 .322
Pre 0.34 (0.07) 0.22 0.45 .41 .40 .001
Scottish –1.02 (2.56) –5.86 3.98 –.03 –.03 .656
Step 4
Intercept 62.56 (1.50) 59.51 66.07 .001 .17 12.94 0.17 .680
Q Ans. 0.06 (0.06) –0.03 0.21 .14 .14 .337
Pre 0.35 (0.07) –.23 0.46 .41 .41 .001
Major 1.29 (2.43) –3.68 5.10 .03 .03 .666
Step 5
Intercept 64.61 (2.07) 60.76 69.01 .001 .18 13.19 0.79 .376
Q Ans. 0.06 (0.05) –0.03 0.19 .15 .15 .289
Pre 0.36 (0.07) 0.23 0.47 .43 .42 .001
Male –2.40 (2.67) –7.75 3.11 –.06 –.06 .372

278
Table 122: Physics 1A 2012–13. Linear model of predictors of exam score, with 95% bias corrected and
accelerated confidence intervals. Confidence intervals and standard errors based on 1000
bootstrap samples
CI95% for b
Predictor b (S.E) Lower Upper β sr p Adj. R2
F ΔF Sig. ΔF
Step 1
Intercept 68.52 (1.05) 6.36 70.74 .001 .06 15.87 15.87 .000
Q Ans. 0.08 (0.02) 0.05 0.13 .25 .25 .001
Step 2
Intercept 68.52 (0.93) 66.48 70.45 .001 .23 37.59 55.72 .000
Q Ans. 0.06 (0.02) 0.03 0.11 .18 .18 .002
Pre 0.42 (0.06) 0.31 0.53 .43 .42 .001
Step 3*
Intercept 72.19 (1.21) 69.50 74.84 .001 .27 30.55 12.82 .000
Q Ans. 0.06 (0.02) 0.03 0.10 .18 .18 .002
Pre 0.38 (0.06) 0.27 0.50 .38 .37 .001
Scottish –6.55 (1.89) –10.25 –3.05 –.20 –.20 .001
Step 4
Intercept 71.09 (1.44) 68.08 74.08 .001 .27 23.72 2.62 .107
Q Ans. 0.06 (0.02) 0.03 0.11 .18 .18 .002
Pre 0.37 (0.06) 0.26 0.49 .37 .36 .001
Scottish –6.58 (1.87) –10.19 –3.19 –.20 –.20 .001
Major 3.00 (1.95) –0.96 6.92 .09 .09 .120
Step 5
Intercept 73.23 (1.25) 70.74 75.91 .001 .27 23.91 3.16 .077
Q Ans. 0.06 (0.02) 0.04 0.11 .20 .19 .002
Pre 0.35 (0.06) 0.23 0.45 .35 .32 .001
Scottish –6.97 (1.90) –10.91 –3.56 –.21 –.21 .002
Male –4.31 (2.42) –9.50 0.21 –.10 –.10 .091
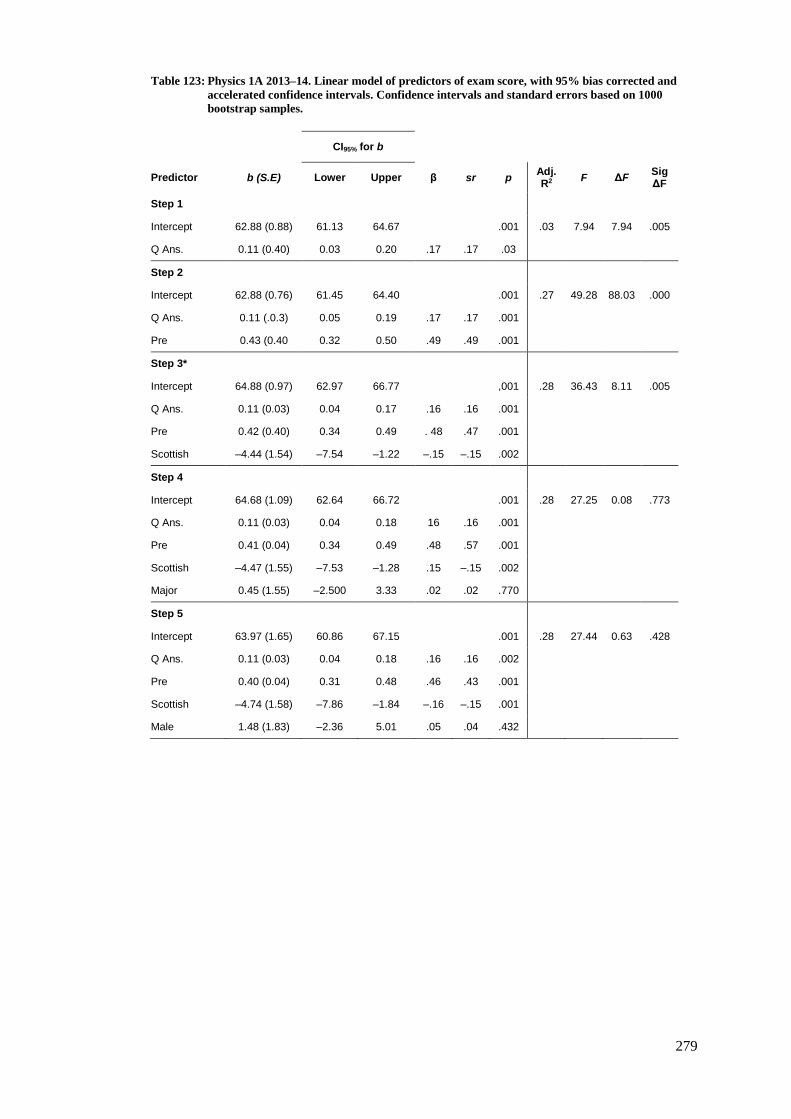
279
Table 123: Physics 1A 2013–14. Linear model of predictors of exam score, with 95% bias corrected and
accelerated confidence intervals. Confidence intervals and standard errors based on 1000
bootstrap samples.
CI95% for b
Predictor b (S.E) Lower Upper β sr p Adj. R2
F ΔF Sig ΔF
Step 1
Intercept 62.88 (0.88) 61.13 64.67 .001 .03 7.94 7.94 .005
Q Ans. 0.11 (0.40) 0.03 0.20 .17 .17 .03
Step 2
Intercept 62.88 (0.76) 61.45 64.40 .001 .27 49.28 88.03 .000
Q Ans. 0.11 (.0.3) 0.05 0.19 .17 .17 .001
Pre 0.43 (0.40 0.32 0.50 .49 .49 .001
Step 3*
Intercept 64.88 (0.97) 62.97 66.77 ,001 .28 36.43 8.11 .005
Q Ans. 0.11 (0.03) 0.04 0.17 .16 .16 .001
Pre 0.42 (0.40) 0.34 0.49 . 48 .47 .001
Scottish –4.44 (1.54) –7.54 –1.22 –.15 –.15 .002
Step 4
Intercept 64.68 (1.09) 62.64 66.72 .001 .28 27.25 0.08 .773
Q Ans. 0.11 (0.03) 0.04 0.18 16 .16 .001
Pre 0.41 (0.04) 0.34 0.49 .48 .57 .001
Scottish –4.47 (1.55) –7.53 –1.28 .15 –.15 .002
Major 0.45 (1.55) –2.500 3.33 .02 .02 .770
Step 5
Intercept 63.97 (1.65) 60.86 67.15 .001 .28 27.44 0.63 .428
Q Ans. 0.11 (0.03) 0.04 0.18 .16 .16 .002
Pre 0.40 (0.04) 0.31 0.48 .46 .43 .001
Scottish –4.74 (1.58) –7.86 –1.84 –.16 –.15 .001
Male 1.48 (1.83) –2.36 5.01 .05 .04 .432
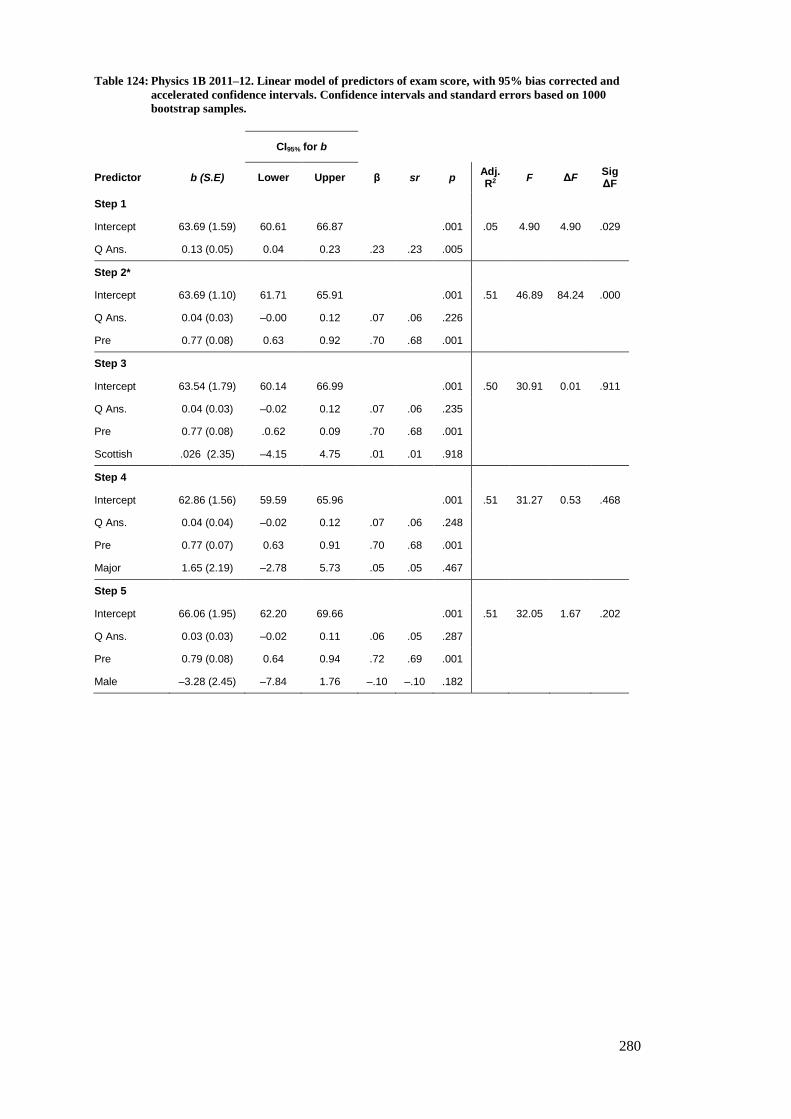
280
Table 124: Physics 1B 2011–12. Linear model of predictors of exam score, with 95% bias corrected and
accelerated confidence intervals. Confidence intervals and standard errors based on 1000
bootstrap samples.
CI95% for b
Predictor b (S.E) Lower Upper β sr p Adj. R2
F ΔF Sig ΔF
Step 1
Intercept 63.69 (1.59) 60.61 66.87 .001 .05 4.90 4.90 .029
Q Ans. 0.13 (0.05) 0.04 0.23 .23 .23 .005
Step 2*
Intercept 63.69 (1.10) 61.71 65.91 .001 .51 46.89 84.24 .000
Q Ans. 0.04 (0.03) –0.00 0.12 .07 .06 .226
Pre 0.77 (0.08) 0.63 0.92 .70 .68 .001
Step 3
Intercept 63.54 (1.79) 60.14 66.99 .001 .50 30.91 0.01 .911
Q Ans. 0.04 (0.03) –0.02 0.12 .07 .06 .235
Pre 0.77 (0.08) .0.62 0.09 .70 .68 .001
Scottish .026 (2.35) –4.15 4.75 .01 .01 .918
Step 4
Intercept 62.86 (1.56) 59.59 65.96 .001 .51 31.27 0.53 .468
Q Ans. 0.04 (0.04) –0.02 0.12 .07 .06 .248
Pre 0.77 (0.07) 0.63 0.91 .70 .68 .001
Major 1.65 (2.19) –2.78 5.73 .05 .05 .467
Step 5
Intercept 66.06 (1.95) 62.20 69.66 .001 .51 32.05 1.67 .202
Q Ans. 0.03 (0.03) –0.02 0.11 .06 .05 .287
Pre 0.79 (0.08) 0.64 0.94 .72 .69 .001
Male –3.28 (2.45) –7.84 1.76 –.10 –.10 .182
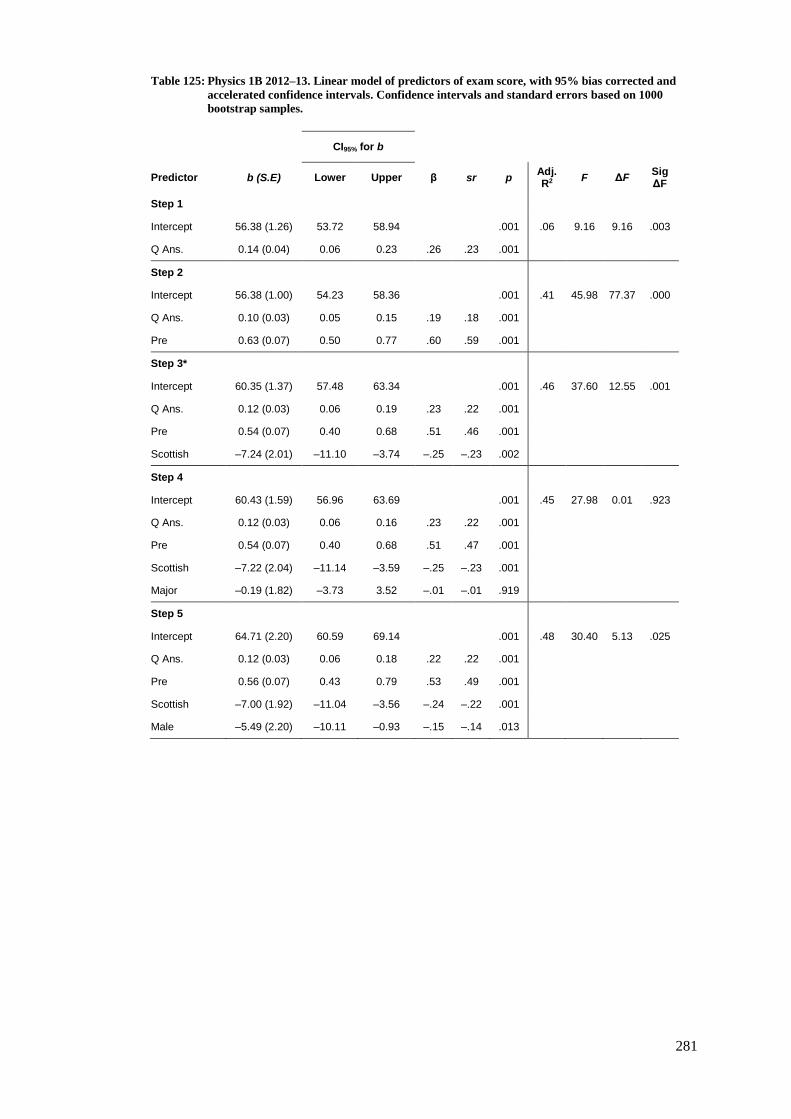
281
Table 125: Physics 1B 2012–13. Linear model of predictors of exam score, with 95% bias corrected and
accelerated confidence intervals. Confidence intervals and standard errors based on 1000
bootstrap samples.
CI95% for b
Predictor b (S.E) Lower Upper β sr p Adj. R2
F ΔF Sig ΔF
Step 1
Intercept 56.38 (1.26) 53.72 58.94 .001 .06 9.16 9.16 .003
Q Ans. 0.14 (0.04) 0.06 0.23 .26 .23 .001
Step 2
Intercept 56.38 (1.00) 54.23 58.36 .001 .41 45.98 77.37 .000
Q Ans. 0.10 (0.03) 0.05 0.15 .19 .18 .001
Pre 0.63 (0.07) 0.50 0.77 .60 .59 .001
Step 3*
Intercept 60.35 (1.37) 57.48 63.34 .001 .46 37.60 12.55 .001
Q Ans. 0.12 (0.03) 0.06 0.19 .23 .22 .001
Pre 0.54 (0.07) 0.40 0.68 .51 .46 .001
Scottish –7.24 (2.01) –11.10 –3.74 –.25 –.23 .002
Step 4
Intercept 60.43 (1.59) 56.96 63.69 .001 .45 27.98 0.01 .923
Q Ans. 0.12 (0.03) 0.06 0.16 .23 .22 .001
Pre 0.54 (0.07) 0.40 0.68 .51 .47 .001
Scottish –7.22 (2.04) –11.14 –3.59 –.25 –.23 .001
Major –0.19 (1.82) –3.73 3.52 –.01 –.01 .919
Step 5
Intercept 64.71 (2.20) 60.59 69.14 .001 .48 30.40 5.13 .025
Q Ans. 0.12 (0.03) 0.06 0.18 .22 .22 .001
Pre 0.56 (0.07) 0.43 0.79 .53 .49 .001
Scottish –7.00 (1.92) –11.04 –3.56 –.24 –.22 .001
Male –5.49 (2.20) –10.11 –0.93 –.15 –.14 .013

282
Table 126: Physics 1B 2013–14. Linear model of predictors of exam score, with 95% bias corrected and
accelerated confidence intervals. Confidence intervals and standard errors based on 1000
bootstrap samples.
CI95% for b
Predictor b (S.E) Lower Upper β sr p Adj. R2
F ΔF Sig ΔF
Step 1
Intercept 59.98 (1.32) 56.31 61.59 .001 .00 0.62 0.25 .617
Q Ans. 0.02 (0.05) –0.08 0.13 .04 .04 .667
Step 2*
Intercept 59.98 (1.07) 56.78 61.16 .001 .32 33.21 66.05 .000
Q Ans. 0.02 (0.05) –0.82 0.12 .03 .03 .751
Pre 0.61 (0.07) 0.46 0.74 .57 .57 .001
Step 3
Intercept 60.80 (1.46) 58.13 63.54 .001 .33 23.38 2.83 .095
Q Ans. 0.02 (0.05) –0.08 0.11 .04 .04 .706
Pre 0.57 (0.08) 0.41 0.73 .54 .58 .001
Scottish –3.75 (2.25) –9.13 1.12 –.12 –.12 .097
Step 4
Intercept 59.42 (1.66) 56.04 62.84 .001 .32 22.03 0.11 .739
Q Ans. 0.02 (0.05) –0.09 0.12 .04 .03 .704
Pre 0.61 (0.07) 0.45 0.76 .57 .57 .001
Major –0.74 (2.17) –5.37 3.45 –.02 –.02 .718
Step 5
Intercept 60.19 (1.79) 56.86 63.37 .001 .32 22.23 0.51 .476
Q Ans. 0.02 (0.05) –0.09 0.10 .03 .03 .734
Pre 0.62 (0.07) 0.48 0.75 .58 .57 .001
Male –1.72 (2.28) –6.48 3.11 –.05 –.05 .465
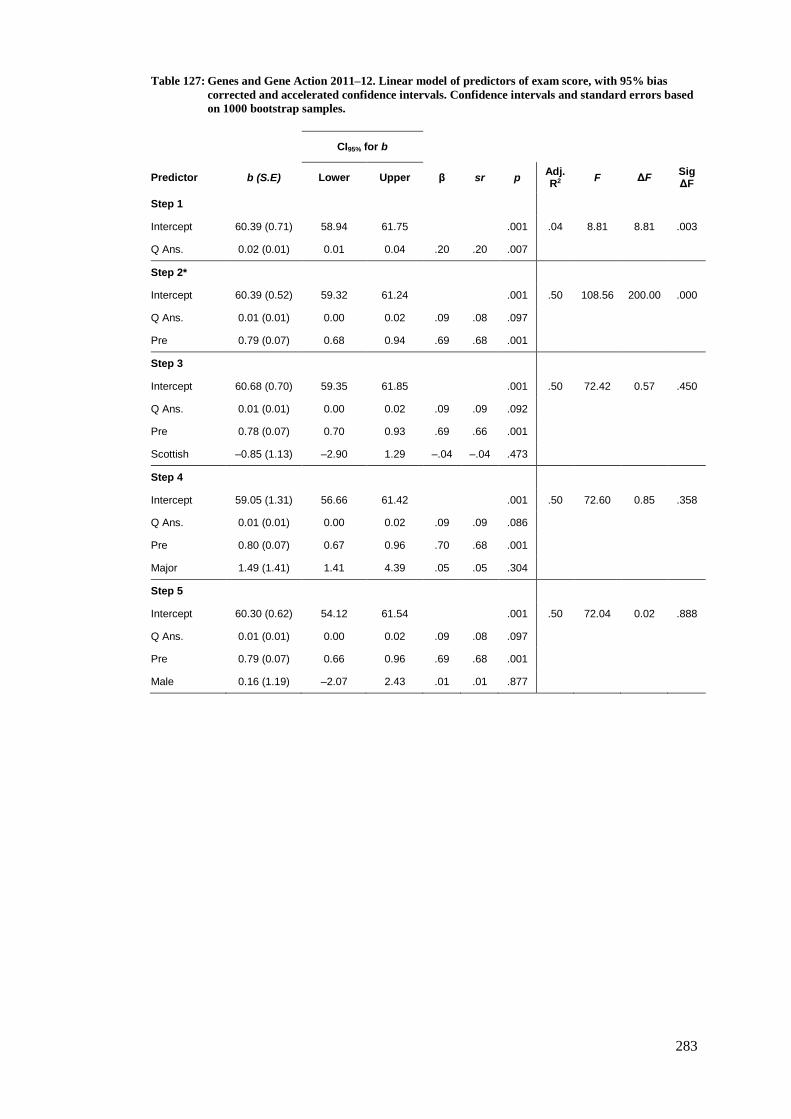
283
Table 127: Genes and Gene Action 2011–12. Linear model of predictors of exam score, with 95% bias
corrected and accelerated confidence intervals. Confidence intervals and standard errors based
on 1000 bootstrap samples.
CI95% for b
Predictor b (S.E) Lower Upper β sr p Adj. R2
F ΔF Sig ΔF
Step 1
Intercept 60.39 (0.71) 58.94 61.75 .001 .04 8.81 8.81 .003
Q Ans. 0.02 (0.01) 0.01 0.04 .20 .20 .007
Step 2*
Intercept 60.39 (0.52) 59.32 61.24 .001 .50 108.56 200.00 .000
Q Ans. 0.01 (0.01) 0.00 0.02 .09 .08 .097
Pre 0.79 (0.07) 0.68 0.94 .69 .68 .001
Step 3
Intercept 60.68 (0.70) 59.35 61.85 .001 .50 72.42 0.57 .450
Q Ans. 0.01 (0.01) 0.00 0.02 .09 .09 .092
Pre 0.78 (0.07) 0.70 0.93 .69 .66 .001
Scottish –0.85 (1.13) –2.90 1.29 –.04 –.04 .473
Step 4
Intercept 59.05 (1.31) 56.66 61.42 .001 .50 72.60 0.85 .358
Q Ans. 0.01 (0.01) 0.00 0.02 .09 .09 .086
Pre 0.80 (0.07) 0.67 0.96 .70 .68 .001
Major 1.49 (1.41) 1.41 4.39 .05 .05 .304
Step 5
Intercept 60.30 (0.62) 54.12 61.54 .001 .50 72.04 0.02 .888
Q Ans. 0.01 (0.01) 0.00 0.02 .09 .08 .097
Pre 0.79 (0.07) 0.66 0.96 .69 .68 .001
Male 0.16 (1.19) –2.07 2.43 .01 .01 .877
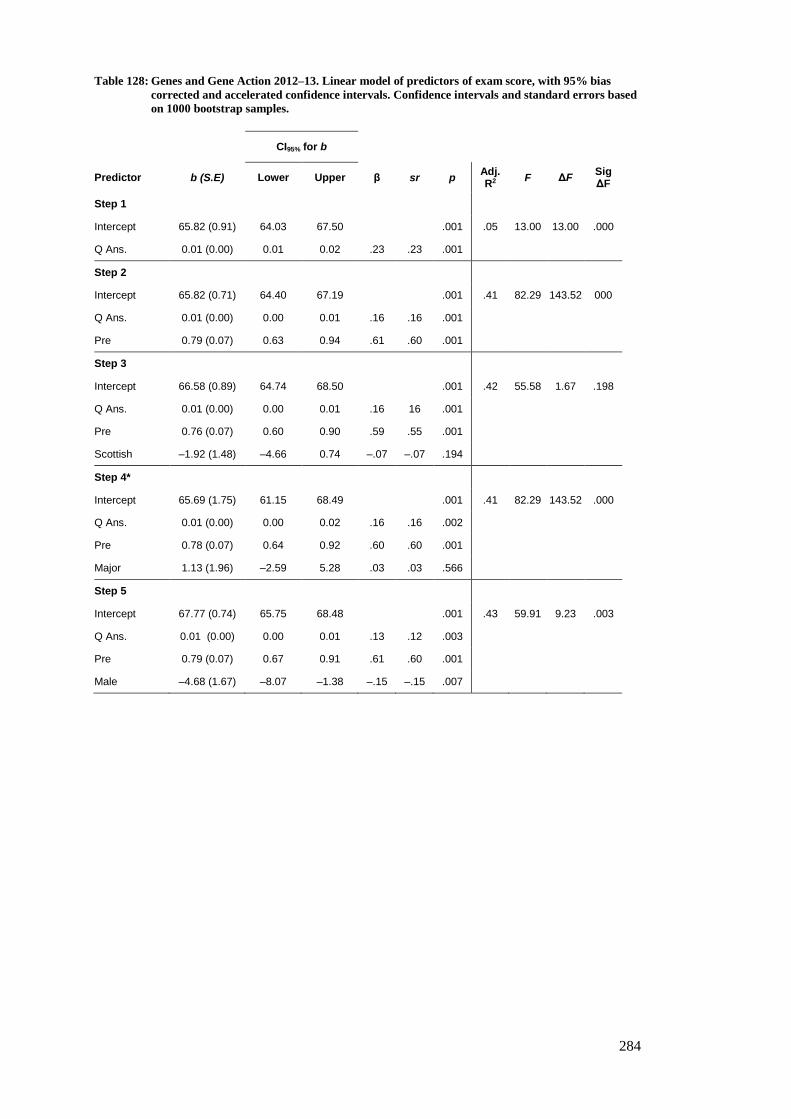
284
Table 128: Genes and Gene Action 2012–13. Linear model of predictors of exam score, with 95% bias
corrected and accelerated confidence intervals. Confidence intervals and standard errors based
on 1000 bootstrap samples.
CI95% for b
Predictor b (S.E) Lower Upper β sr p Adj. R2
F ΔF Sig ΔF
Step 1
Intercept 65.82 (0.91) 64.03 67.50 .001 .05 13.00 13.00 .000
Q Ans. 0.01 (0.00) 0.01 0.02 .23 .23 .001
Step 2
Intercept 65.82 (0.71) 64.40 67.19 .001 .41 82.29 143.52 000
Q Ans. 0.01 (0.00) 0.00 0.01 .16 .16 .001
Pre 0.79 (0.07) 0.63 0.94 .61 .60 .001
Step 3
Intercept 66.58 (0.89) 64.74 68.50 .001 .42 55.58 1.67 .198
Q Ans. 0.01 (0.00) 0.00 0.01 .16 16 .001
Pre 0.76 (0.07) 0.60 0.90 .59 .55 .001
Scottish –1.92 (1.48) –4.66 0.74 –.07 –.07 .194
Step 4*
Intercept 65.69 (1.75) 61.15 68.49 .001 .41 82.29 143.52 .000
Q Ans. 0.01 (0.00) 0.00 0.02 .16 .16 .002
Pre 0.78 (0.07) 0.64 0.92 .60 .60 .001
Major 1.13 (1.96) –2.59 5.28 .03 .03 .566
Step 5
Intercept 67.77 (0.74) 65.75 68.48 .001 .43 59.91 9.23 .003
Q Ans. 0.01 (0.00) 0.00 0.01 .13 .12 .003
Pre 0.79 (0.07) 0.67 0.91 .61 .60 .001
Male –4.68 (1.67) –8.07 –1.38 –.15 –.15 .007

285
Table 129: Genes and Gene Action 2013–14. Linear model of predictors of exam score, with 95% bias
corrected and accelerated confidence intervals. Confidence intervals and standard errors based
on 1000 bootstrap samples.
CI95% for b
Predictor b (S.E) Lower Upper β sr p Adj. R2
F ΔF Sig ΔF
Step 1
Intercept 58.97 (0.81) 57.83 60.40 .001 .04 7.98 7.98 .005
Q Ans. 0.01 (0.00) 0.01 0.02 .19 .19 .002
Step 2*
Intercept 58.97 (0.53) 57.97 59.95 .001 .58 154.20 289.86 .000
Q Ans. 0.01 (0.00) 0.00 0.01 .11 .11 .002
Pre 0.75 (0.06) 0.63 0.89 .75 .74 .001
Step 3
Intercept 58.93 (0.79) 57.40 60.25 .001 .58 102.34 0.01 .924
Q Ans. 0.01 (0.00) 0.00 0.01 .11 .11 .002
Pre 0.75 (0.07) 0.62 0.91 .75 .71 .001
Scottish 0.11 (1.23) –2.41 2.83 .00 .00 .929
Step 4
Intercept 58.79 (1.37) 56.21 61.13 .001 .58 102.34 0.02 .894
Q Ans. 0.01 (0.00) 0.00 0.01 .11 .11. .001
Pre 0.75 (0.06) 0.62 0.89 .75 .74 .001
Major 0.21 (1.48) –2.75 3.33 .01 .01 .899
Step 5
Intercept 58.44 (0.60) 57.28 59.55 .001 .59 103.97 2.03 .156
Q Ans. 0.01 (0.00) 0.01 0.01 .13 .12 .001
Pre 0.75 (0.06) 0.63 0.89 .75 .74 .001
Male 1.70 (1.24) –0.70 4.03 .06 .06 ,170
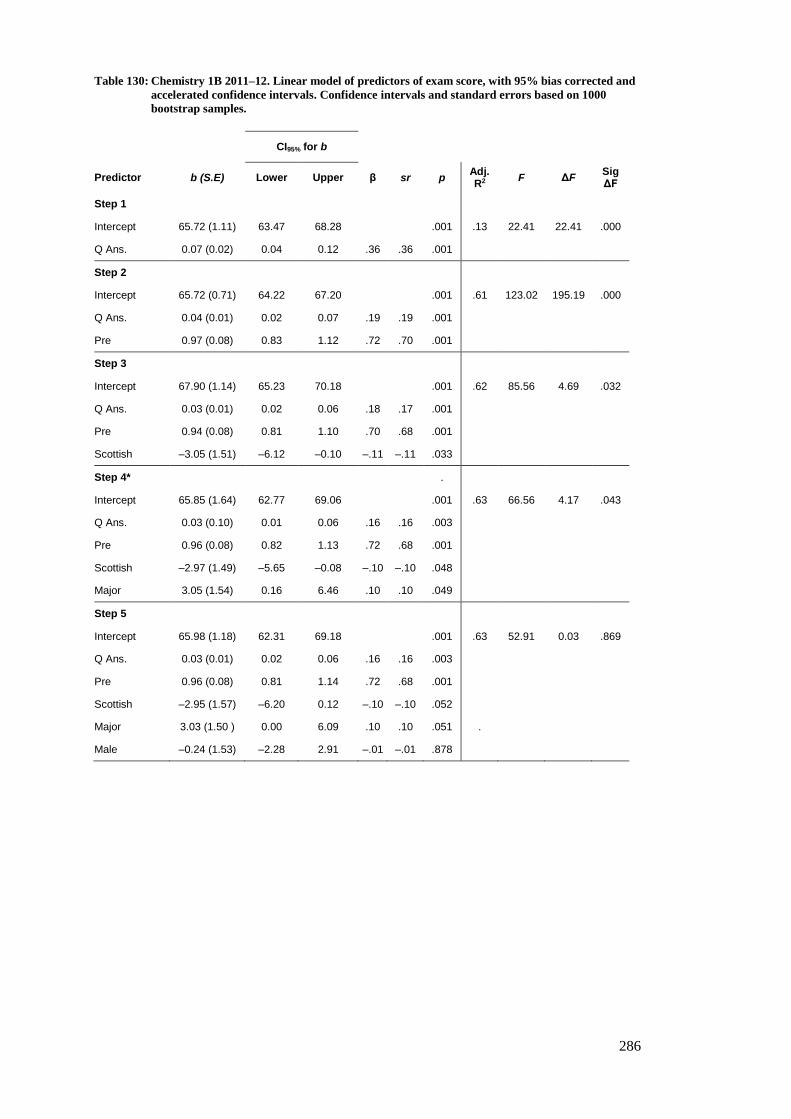
286
Table 130: Chemistry 1B 2011–12. Linear model of predictors of exam score, with 95% bias corrected and
accelerated confidence intervals. Confidence intervals and standard errors based on 1000
bootstrap samples.
CI95% for b
Predictor b (S.E) Lower Upper β sr p Adj. R2
F ΔF Sig ΔF
Step 1
Intercept 65.72 (1.11) 63.47 68.28 .001 .13 22.41 22.41 .000
Q Ans. 0.07 (0.02) 0.04 0.12 .36 .36 .001
Step 2
Intercept 65.72 (0.71) 64.22 67.20 .001 .61 123.02 195.19 .000
Q Ans. 0.04 (0.01) 0.02 0.07 .19 .19 .001
Pre 0.97 (0.08) 0.83 1.12 .72 .70 .001
Step 3
Intercept 67.90 (1.14) 65.23 70.18 .001 .62 85.56 4.69 .032
Q Ans. 0.03 (0.01) 0.02 0.06 .18 .17 .001
Pre 0.94 (0.08) 0.81 1.10 .70 .68 .001
Scottish –3.05 (1.51) –6.12 –0.10 –.11 –.11 .033
Step 4* .
Intercept 65.85 (1.64) 62.77 69.06 .001 .63 66.56 4.17 .043
Q Ans. 0.03 (0.10) 0.01 0.06 .16 .16 .003
Pre 0.96 (0.08) 0.82 1.13 .72 .68 .001
Scottish –2.97 (1.49) –5.65 –0.08 –.10 –.10 .048
Major 3.05 (1.54) 0.16 6.46 .10 .10 .049
Step 5
Intercept 65.98 (1.18) 62.31 69.18 .001 .63 52.91 0.03 .869
Q Ans. 0.03 (0.01) 0.02 0.06 .16 .16 .003
Pre 0.96 (0.08) 0.81 1.14 .72 .68 .001
Scottish –2.95 (1.57) –6.20 0.12 –.10 –.10 .052
Major 3.03 (1.50 ) 0.00 6.09 .10 .10 .051 .
Male –0.24 (1.53) –2.28 2.91 –.01 –.01 .878
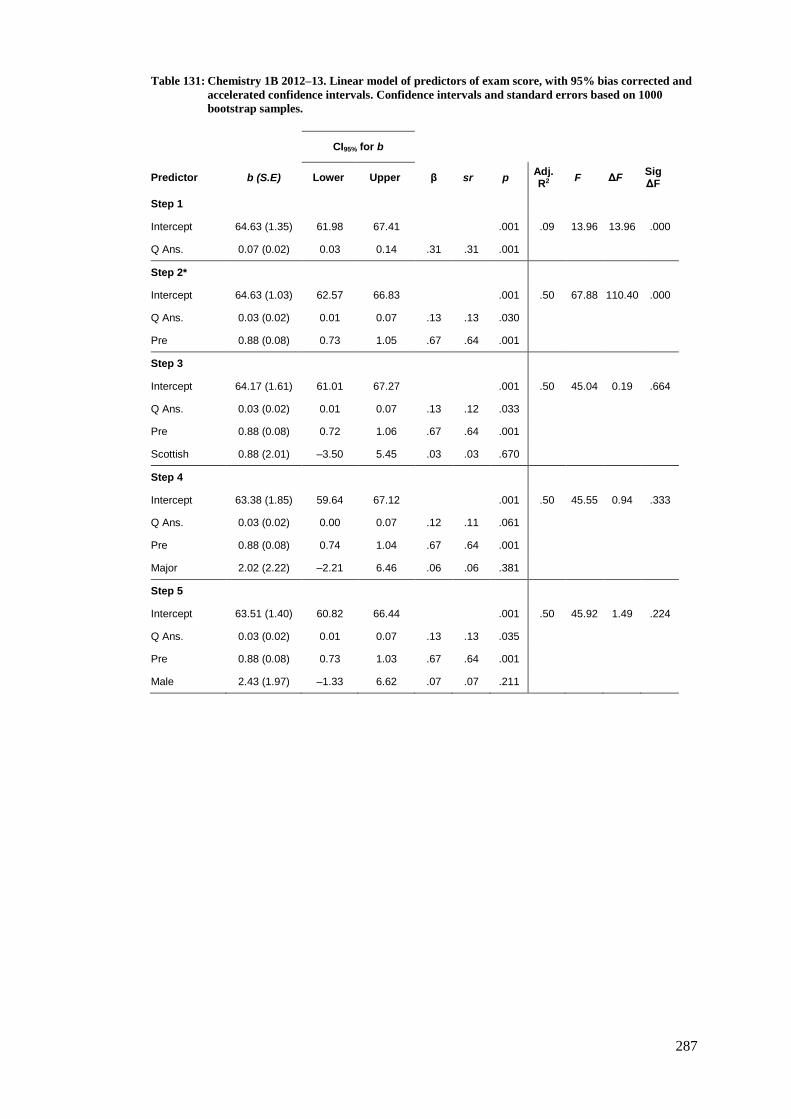
287
Table 131: Chemistry 1B 2012–13. Linear model of predictors of exam score, with 95% bias corrected and
accelerated confidence intervals. Confidence intervals and standard errors based on 1000
bootstrap samples.
CI95% for b
Predictor b (S.E) Lower Upper β sr p Adj. R2
F ΔF Sig ΔF
Step 1
Intercept 64.63 (1.35) 61.98 67.41 .001 .09 13.96 13.96 .000
Q Ans. 0.07 (0.02) 0.03 0.14 .31 .31 .001
Step 2*
Intercept 64.63 (1.03) 62.57 66.83 .001 .50 67.88 110.40 .000
Q Ans. 0.03 (0.02) 0.01 0.07 .13 .13 .030
Pre 0.88 (0.08) 0.73 1.05 .67 .64 .001
Step 3
Intercept 64.17 (1.61) 61.01 67.27 .001 .50 45.04 0.19 .664
Q Ans. 0.03 (0.02) 0.01 0.07 .13 .12 .033
Pre 0.88 (0.08) 0.72 1.06 .67 .64 .001
Scottish 0.88 (2.01) –3.50 5.45 .03 .03 .670
Step 4
Intercept 63.38 (1.85) 59.64 67.12 .001 .50 45.55 0.94 .333
Q Ans. 0.03 (0.02) 0.00 0.07 .12 .11 .061
Pre 0.88 (0.08) 0.74 1.04 .67 .64 .001
Major 2.02 (2.22) –2.21 6.46 .06 .06 .381
Step 5
Intercept 63.51 (1.40) 60.82 66.44 .001 .50 45.92 1.49 .224
Q Ans. 0.03 (0.02) 0.01 0.07 .13 .13 .035
Pre 0.88 (0.08) 0.73 1.03 .67 .64 .001
Male 2.43 (1.97) –1.33 6.62 .07 .07 .211

288
Table 132: Chemistry 1B 2013–14. Linear model of predictors of exam score, with 95% bias corrected and
accelerated confidence intervals. Confidence intervals and standard errors based on 1000
bootstrap samples.
CI95% for b
Predictor b (S.E) Lower Upper β sr p Adj. R2
F ΔF Sig ΔF
Step 1
Intercept 63.88 (1.32) 61.39 66.46 .001 .01 2.05 2.05 .154
Q Ans. 0.03 (0.02) –0.01 0.06 .11 .11 .149
Step 2
Intercept 63.88 (0.95) 61.97 65.88 .001 .48 76.76 149.59 .000
Q Ans. 0.00 (0.01) –0.02 0.03 .02 .02 .773
Pre 0.82 (0.7) 0.66 0.95 .70 .69 .001
Step 3
Intercept 62.58 (1.55) 59.39 65.56 .001 .48 51.81 1.46 .229
Q Ans. .000 (0.01) –0.03 0.03 .00 .00 970
Pre 0.86 (0.09) 0.67 1.02 .73 .64 .001
Scottish 2.69 (2.33) –1.88 7.43 .08 .07 .250
Step 4*
Intercept 66.54 (1.60) 63.23 69.47 .001 .50 54.55 5.67 .018
Q Ans. 0.01 (0.01) –0.02 0.03 .04 .04 .488
Pre 0.82 (0.07) 0.67 0.95 .70 .69 .001
Major –4.69 (2.07) –8.32 –0.75 –.13 –.13 .026
Step 5
Intercept 64.28 (2.03) 59.97 68.53 .001 .50 41.56 1.79 .812
Q Ans. 0.01(0.01) –0.02 0.03 .04 .04 .496
Pre 0.82 (0.07) 0.67 0.96 .70 .69 .001
Major –3.91 (2.13) –7.92 0.58 –.11 –.11 .072
Male 2.81 (1.84) –0.81 6.04 .08 .07 .121
Step 6
Intercept 61.33 (1.47) 58.48 64.23 .001 .49 53.32 3.78 .054
Q Ans. 0.00 (0.01) –0.20 0.03 .02 .02 .741
Pre 0.82 (0.07) 0.67 0.95 .70 .69 .001
Male 3.94 (1.93) –0.90 7.71 .11 .11 .046

289
Table 133: Glasgow Physics 2011–12. Linear model of predictors of exam score, with 95% bias corrected
and accelerated confidence intervals. Confidence intervals and standard errors based on 1000
bootstrap samples.
CI95% for b
Predictor b (S.E) Lower Upper β sr p Adj. R2
F ΔF Sig ΔF
Step 1
Intercept 51.85 (1.56) 48.59 55.11 .001 .10 15.07 15.07 .000
Q Ans. 0.07 (0.02) 0.04 0.13 .32 .32 .001
Step 2*
Intercept 51.27 (1.17) 49.53 54.05 .001 .52 73.91 119.61 .000
Q Ans. 0.04 (0.02) 0.02 0.10 .20 .20 .004
Pre 0.59 (0.05) 0.50 0.68 .66 .65 .001
Step 3
Intercept 49.77 (2.15) 45.69 53.56 .001 .52 49.53 0.89 .348
Q Ans. 0.05 (0.02) 0.02 0.10 .21 .20 .003
Pre 0.58 (0.05) 0.49 0.68 .65 .63 .001
Male 2.68 (2.53) –2.04 7.86 .06 .06 .311
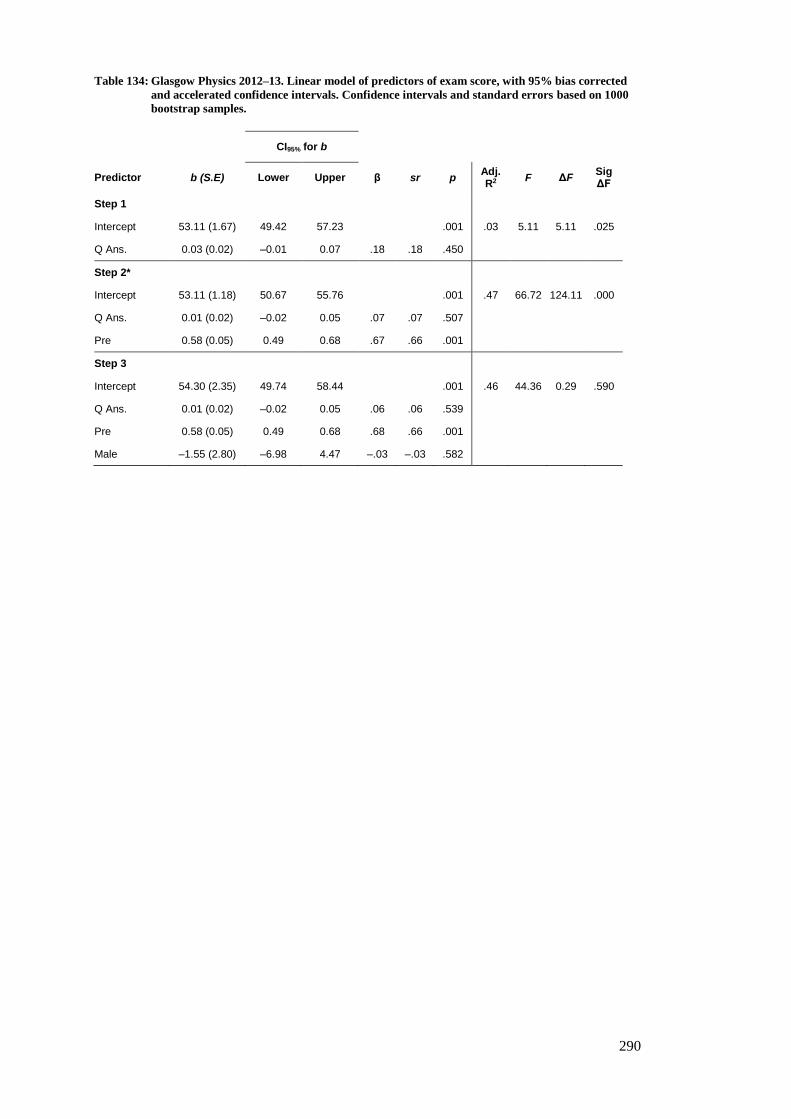
290
Table 134: Glasgow Physics 2012–13. Linear model of predictors of exam score, with 95% bias corrected
and accelerated confidence intervals. Confidence intervals and standard errors based on 1000
bootstrap samples.
CI95% for b
Predictor b (S.E) Lower Upper β sr p Adj. R2
F ΔF Sig ΔF
Step 1
Intercept 53.11 (1.67) 49.42 57.23 .001 .03 5.11 5.11 .025
Q Ans. 0.03 (0.02) –0.01 0.07 .18 .18 .450
Step 2*
Intercept 53.11 (1.18) 50.67 55.76 .001 .47 66.72 124.11 .000
Q Ans. 0.01 (0.02) –0.02 0.05 .07 .07 .507
Pre 0.58 (0.05) 0.49 0.68 .67 .66 .001
Step 3
Intercept 54.30 (2.35) 49.74 58.44 .001 .46 44.36 0.29 .590
Q Ans. 0.01 (0.02) –0.02 0.05 .06 .06 .539
Pre 0.58 (0.05) 0.49 0.68 .68 .66 .001
Male –1.55 (2.80) –6.98 4.47 –.03 –.03 .582
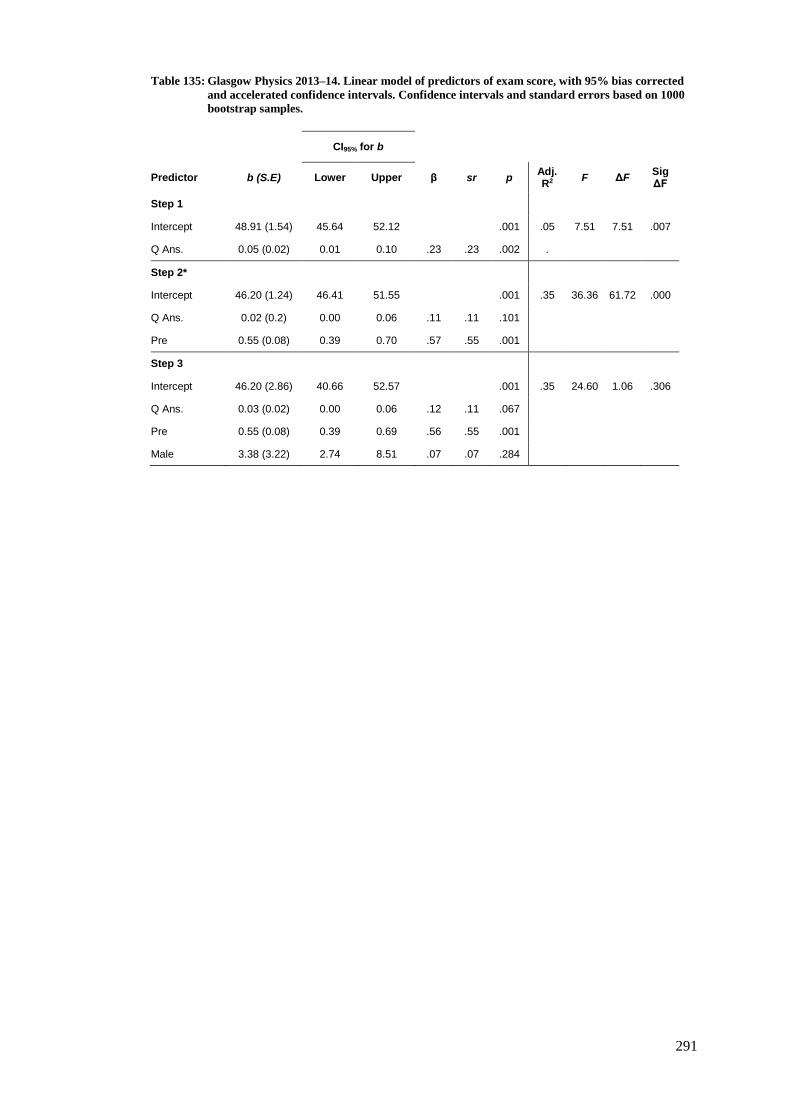
291
Table 135: Glasgow Physics 2013–14. Linear model of predictors of exam score, with 95% bias corrected
and accelerated confidence intervals. Confidence intervals and standard errors based on 1000
bootstrap samples.
CI95% for b
Predictor b (S.E) Lower Upper β sr p Adj. R2
F ΔF Sig ΔF
Step 1
Intercept 48.91 (1.54) 45.64 52.12 .001 .05 7.51 7.51 .007
Q Ans. 0.05 (0.02) 0.01 0.10 .23 .23 .002 .
Step 2*
Intercept 46.20 (1.24) 46.41 51.55 .001 .35 36.36 61.72 .000
Q Ans. 0.02 (0.2) 0.00 0.06 .11 .11 .101
Pre 0.55 (0.08) 0.39 0.70 .57 .55 .001
Step 3
Intercept 46.20 (2.86) 40.66 52.57 .001 .35 24.60 1.06 .306
Q Ans. 0.03 (0.02) 0.00 0.06 .12 .11 .067
Pre 0.55 (0.08) 0.39 0.69 .56 .55 .001
Male 3.38 (3.22) 2.74 8.51 .07 .07 .284

292
Table 136: Nottingham Chemistry 2011–12. Linear model of predictors of exam score, with 95% bias
corrected and accelerated confidence intervals. Confidence intervals and standard errors based
on 1000 bootstrap samples.
CI95% for b
Predictor b (S.E) Lower Upper β sr p Adj. R2
F ΔF Sig ΔF
Step 1
Intercept 61.57 (1.08) 59.32 63.64 .001 .10 18.54 18.54 .000
Q Ans. 0.05 (0.01) 0.03 0.07 .32 .32 .001
Step 2*
Intercept 61.57 (0.99) 59.56 63.52 .001 .30 24.84 28.02 .000
Q Ans. 0.04 (0.01) 0.02 0.06 .25 25 .001
Pre 0.52 (0.09) 0.35 0.70 .37 .37 .001
Step 3
Intercept 62.40 (1.62) 59.11 65.46 .001 .23 16.60 0.32 .570
Q Ans. 0.04 (0.01) 0.02 0.06 .24 .24 .001
Pre 0.52 (0.09) 0.35 0.71 .38 .38 .001
Male –1.27 (2.11) –5.42 2.74 –.04 –.04 .537
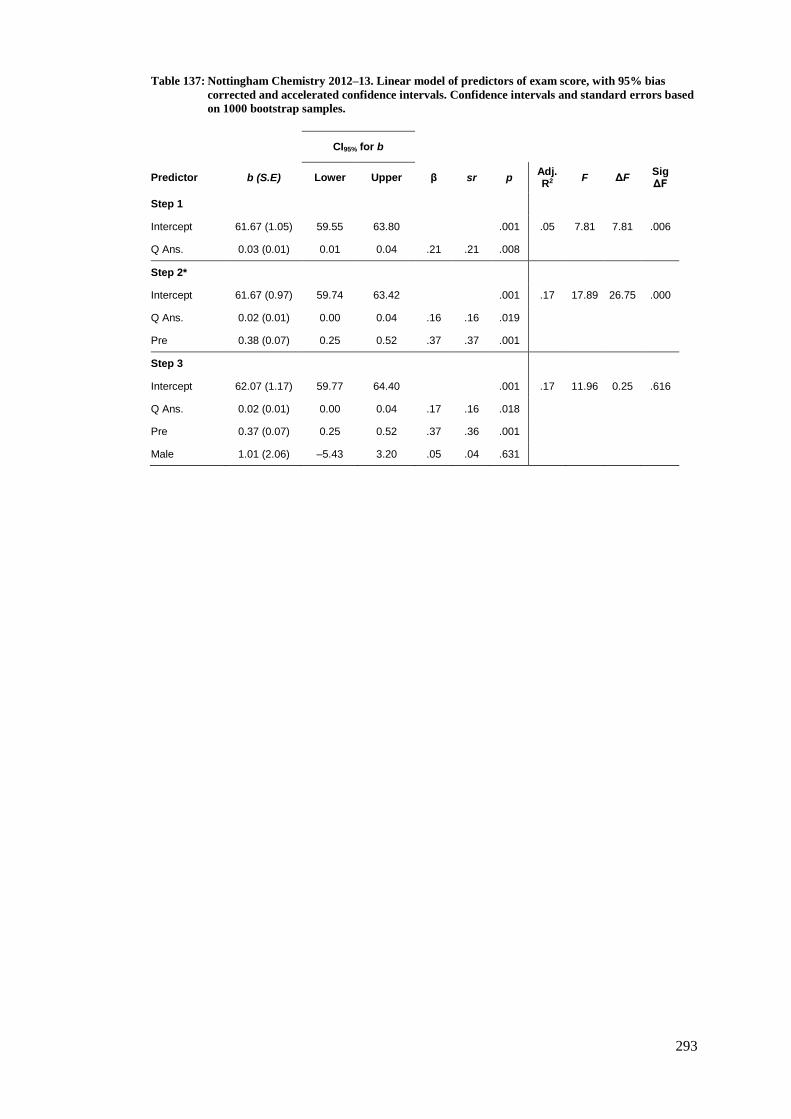
293
Table 137: Nottingham Chemistry 2012–13. Linear model of predictors of exam score, with 95% bias
corrected and accelerated confidence intervals. Confidence intervals and standard errors based
on 1000 bootstrap samples.
CI95% for b
Predictor b (S.E) Lower Upper β sr p Adj. R2
F ΔF Sig ΔF
Step 1
Intercept 61.67 (1.05) 59.55 63.80 .001 .05 7.81 7.81 .006
Q Ans. 0.03 (0.01) 0.01 0.04 .21 .21 .008
Step 2*
Intercept 61.67 (0.97) 59.74 63.42 .001 .17 17.89 26.75 .000
Q Ans. 0.02 (0.01) 0.00 0.04 .16 .16 .019
Pre 0.38 (0.07) 0.25 0.52 .37 .37 .001
Step 3
Intercept 62.07 (1.17) 59.77 64.40 .001 .17 11.96 0.25 .616
Q Ans. 0.02 (0.01) 0.00 0.04 .17 .16 .018
Pre 0.37 (0.07) 0.25 0.52 .37 .36 .001
Male 1.01 (2.06) –5.43 3.20 .05 .04 .631

294
Table 138: Nottingham Chemistry 2013–14. Linear model of predictors of exam score, with 95% bias
corrected and accelerated confidence intervals. Confidence intervals and standard errors based
on 1000 bootstrap samples.
CI95% for b
Predictor b (S.E) Lower Upper β sr p Adj. R2
F ΔF Sig ΔF
Step 1
Intercept 64.85 (1.03) 62.70 67.00 .001 .14 24.38 24.38 .000
Q Ans. 0.07 (0.01) 0.05 0.09 .37 .37 .001
Step 2*
Intercept 64.85 (0.94) 62.87 66.76 .001 .28 30.86 32.41 .000
Q Ans. 0.06 (0.01) 0.05 0.09 .33 .32 .001
Pre 0.39 (0.07) 0.24 0.53 .39 .39 .001
Step 3
Intercept 63.86 (1.46) 60.80 66.76 .001 .28 20.80 0.74 .392
Q Ans. 0.07 (0.01) 0.05 0.09 .34 .33 .001
Pre 0.39 (0.07) 0.24 0.53 .39 .39 .001
Male 1.64 (1.96) –2.35 5.82 .06 .06 .373

295
Appendix F
Multiple regression models examining the
relationship between comment authoring and exam
score
In each of the following tables, the best model, as discussed in the main text, is indicated by
an asterisk (*).

296
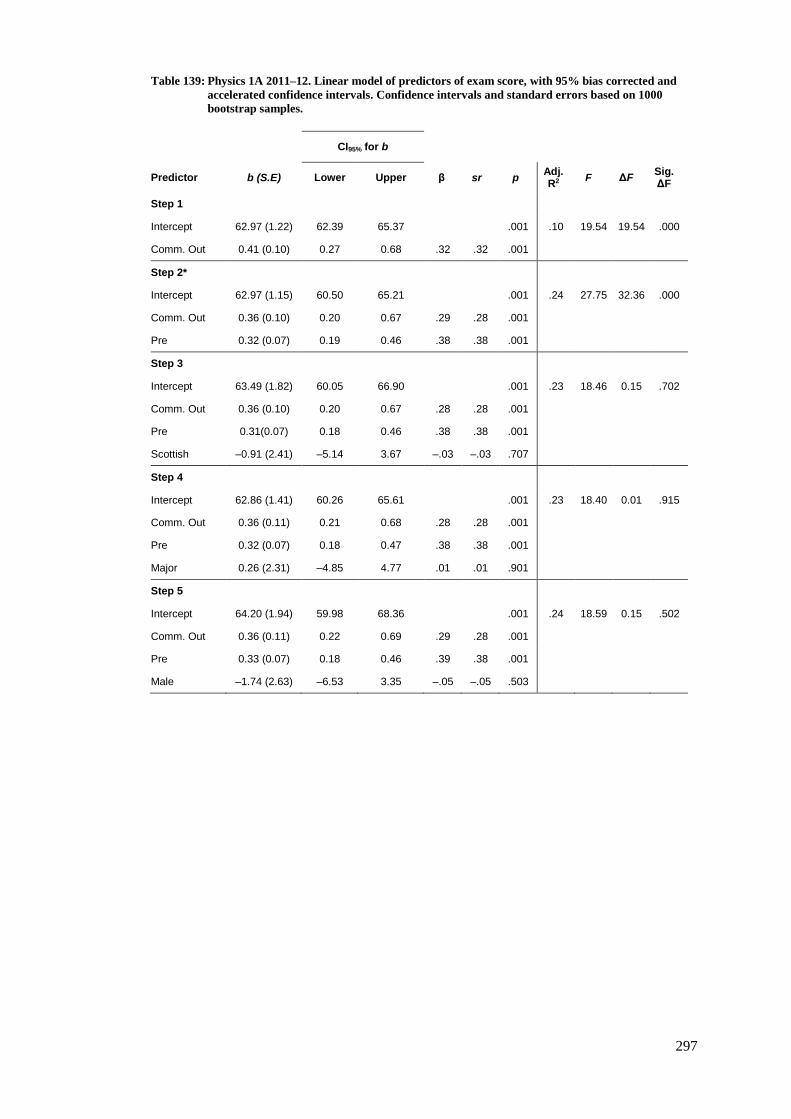
297
Table 139: Physics 1A 2011–12. Linear model of predictors of exam score, with 95% bias corrected and
accelerated confidence intervals. Confidence intervals and standard errors based on 1000
bootstrap samples.
CI95% for b
Predictor b (S.E) Lower Upper β sr p Adj. R2
F ΔF Sig. ΔF
Step 1
Intercept 62.97 (1.22) 62.39 65.37 .001 .10 19.54 19.54 .000
Comm. Out 0.41 (0.10) 0.27 0.68 .32 .32 .001
Step 2*
Intercept 62.97 (1.15) 60.50 65.21 .001 .24 27.75 32.36 .000
Comm. Out 0.36 (0.10) 0.20 0.67 .29 .28 .001
Pre 0.32 (0.07) 0.19 0.46 .38 .38 .001
Step 3
Intercept 63.49 (1.82) 60.05 66.90 .001 .23 18.46 0.15 .702
Comm. Out 0.36 (0.10) 0.20 0.67 .28 .28 .001
Pre 0.31(0.07) 0.18 0.46 .38 .38 .001
Scottish –0.91 (2.41) –5.14 3.67 –.03 –.03 .707
Step 4
Intercept 62.86 (1.41) 60.26 65.61 .001 .23 18.40 0.01 .915
Comm. Out 0.36 (0.11) 0.21 0.68 .28 .28 .001
Pre 0.32 (0.07) 0.18 0.47 .38 .38 .001
Major 0.26 (2.31) –4.85 4.77 .01 .01 .901
Step 5
Intercept 64.20 (1.94) 59.98 68.36 .001 .24 18.59 0.15 .502
Comm. Out 0.36 (0.11) 0.22 0.69 .29 .28 .001
Pre 0.33 (0.07) 0.18 0.46 .39 .38 .001
Male –1.74 (2.63) –6.53 3.35 –.05 –.05 .503

298
Table 140: Physics 1A 2012–13. Linear model of predictors of exam score, with 95% bias corrected and
accelerated confidence intervals. Confidence intervals and standard errors based on 1000
bootstrap samples.
CI95% for b
Predictor b (S.E) Lower Upper β sr p Adj. R2
F ΔF Sig. ΔF
Step 1
Intercept 68.52 (0.98) 66.53 70.55 .001 .09 24.37 24.37 .000
Comm. Out 0.66 (0.13) 0.45 0.97 .30 .30 .001
Step 2
Intercept 68.52 (0.90) 66.63 70.36 .001 .23 38.04 47.09 .000
Comm. Out 0.42 (0.12) 0.19 0.75 .19 .18 .001
Pre 0.40 (0.06) 0.29 0.51 .40 .39 .001
Step 3*
Intercept 72.43 (1.24) 70.02 74.80 .001 .27 31.67 14.64 .000
Comm. Out 0.45 (0.12) 0.23 0.73 .20 .20 .001
Pre 0.35 (0.06) 0.22 0.46 .35 .33 .001
Scottish –6.98 (1.98) –10.82 –3.18 –.21 –.21 .001
Step 4
Intercept 71.26 (1.48) 68.52 74.31 .001 .28 24.72 3.06 .082
Comm. Out 0.47 (0.12) 0.25 0.75 .21 .20 .001
Pre 0.34 (0.06) 0.20 0.45 .34 .32 .001
Scottish –7.03(1.96) –10.96 –3.19 –.22 –.21 .001
Major 3.23 (1.91) –0.47 6.74 .10 .10 .098
Step 5
Intercept 73.37 (1.24) 71.02 75.89 .001 .28 24.56 2.60 .108
Comm. Out 0.47 (0.12) 0.25 0.74 .21 .20 .001
Pre 0.32 (0.06) 0.19 0.45 .32 .28 .001
Scottish –7.37 (1.85) –11.26 –3.72 –.23 –.22 .001
Male –3.87 (2.39) –8.48 0.76 –.09 –.09 .103
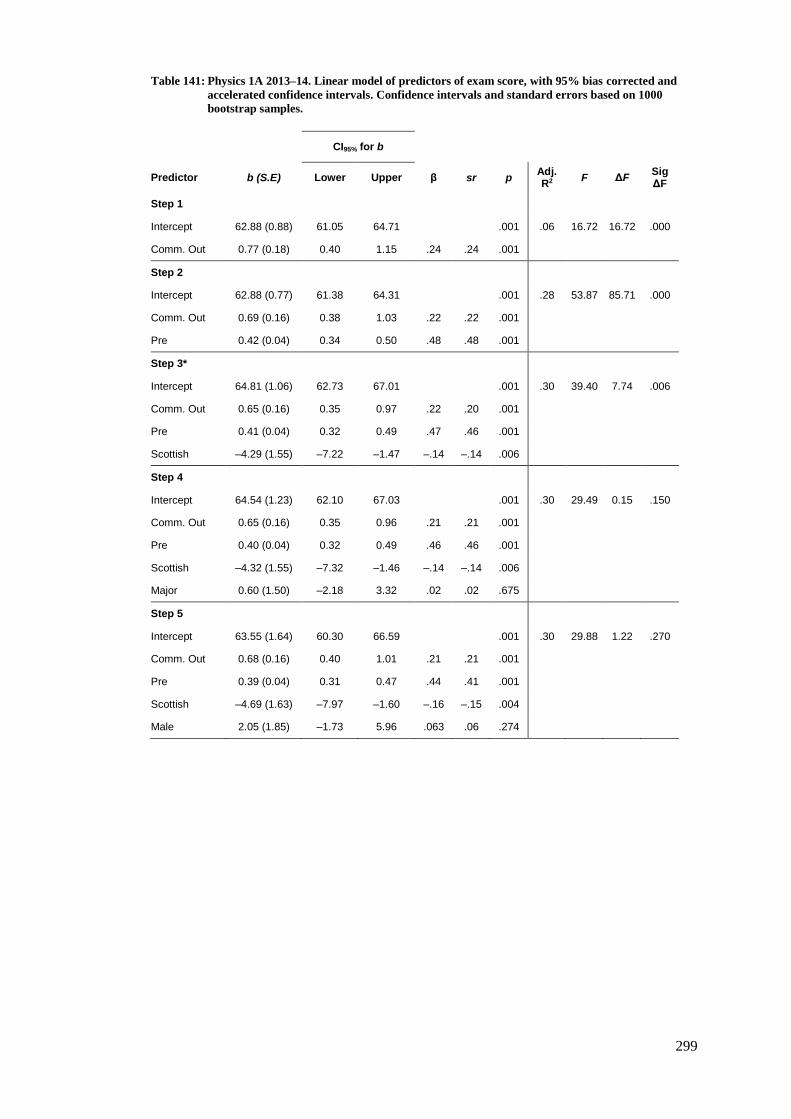
299
Table 141: Physics 1A 2013–14. Linear model of predictors of exam score, with 95% bias corrected and
accelerated confidence intervals. Confidence intervals and standard errors based on 1000
bootstrap samples.
CI95% for b
Predictor b (S.E) Lower Upper β sr p Adj. R2
F ΔF Sig ΔF
Step 1
Intercept 62.88 (0.88) 61.05 64.71 .001 .06 16.72 16.72 .000
Comm. Out 0.77 (0.18) 0.40 1.15 .24 .24 .001
Step 2
Intercept 62.88 (0.77) 61.38 64.31 .001 .28 53.87 85.71 .000
Comm. Out 0.69 (0.16) 0.38 1.03 .22 .22 .001
Pre 0.42 (0.04) 0.34 0.50 .48 .48 .001
Step 3*
Intercept 64.81 (1.06) 62.73 67.01 .001 .30 39.40 7.74 .006
Comm. Out 0.65 (0.16) 0.35 0.97 .22 .20 .001
Pre 0.41 (0.04) 0.32 0.49 .47 .46 .001
Scottish –4.29 (1.55) –7.22 –1.47 –.14 –.14 .006
Step 4
Intercept 64.54 (1.23) 62.10 67.03 .001 .30 29.49 0.15 .150
Comm. Out 0.65 (0.16) 0.35 0.96 .21 .21 .001
Pre 0.40 (0.04) 0.32 0.49 .46 .46 .001
Scottish –4.32 (1.55) –7.32 –1.46 –.14 –.14 .006
Major 0.60 (1.50) –2.18 3.32 .02 .02 .675
Step 5
Intercept 63.55 (1.64) 60.30 66.59 .001 .30 29.88 1.22 .270
Comm. Out 0.68 (0.16) 0.40 1.01 .21 .21 .001
Pre 0.39 (0.04) 0.31 0.47 .44 .41 .001
Scottish –4.69 (1.63) –7.97 –1.60 –.16 –.15 .004
Male 2.05 (1.85) –1.73 5.96 .063 .06 .274
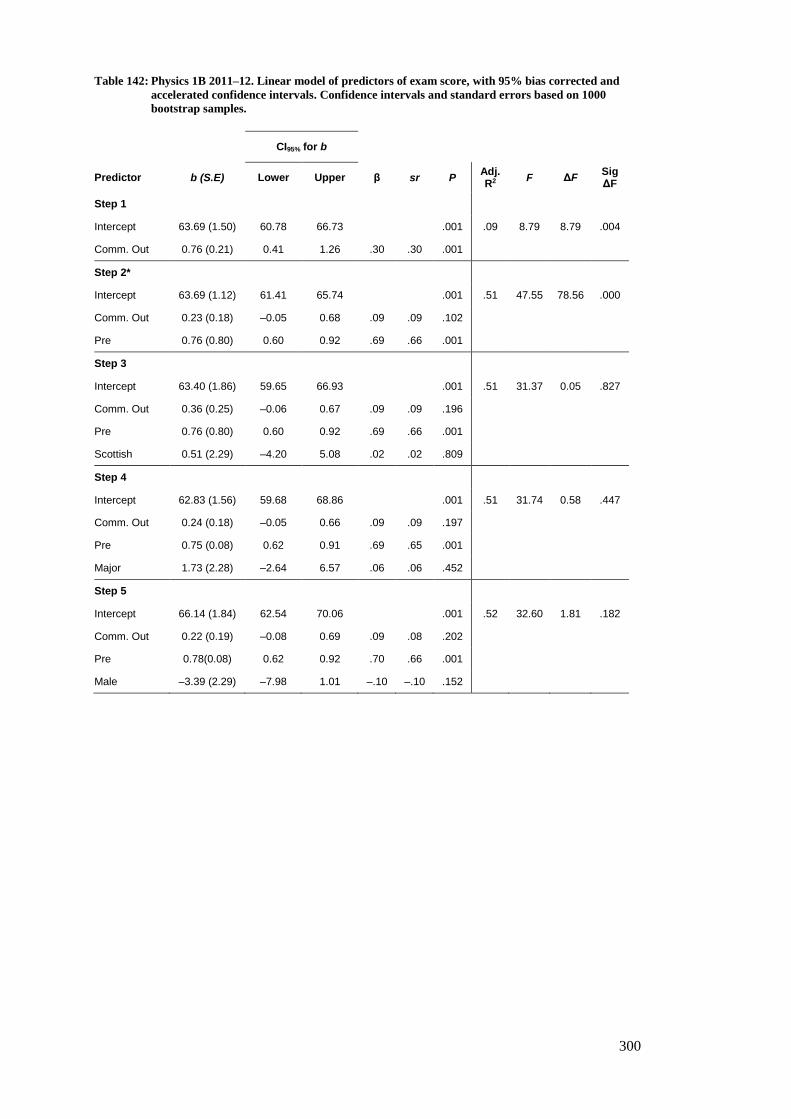
300
Table 142: Physics 1B 2011–12. Linear model of predictors of exam score, with 95% bias corrected and
accelerated confidence intervals. Confidence intervals and standard errors based on 1000
bootstrap samples.
CI95% for b
Predictor b (S.E) Lower Upper β sr P Adj. R2
F ΔF Sig ΔF
Step 1
Intercept 63.69 (1.50) 60.78 66.73 .001 .09 8.79 8.79 .004
Comm. Out 0.76 (0.21) 0.41 1.26 .30 .30 .001
Step 2*
Intercept 63.69 (1.12) 61.41 65.74 .001 .51 47.55 78.56 .000
Comm. Out 0.23 (0.18) –0.05 0.68 .09 .09 .102
Pre 0.76 (0.80) 0.60 0.92 .69 .66 .001
Step 3
Intercept 63.40 (1.86) 59.65 66.93 .001 .51 31.37 0.05 .827
Comm. Out 0.36 (0.25) –0.06 0.67 .09 .09 .196
Pre 0.76 (0.80) 0.60 0.92 .69 .66 .001
Scottish 0.51 (2.29) –4.20 5.08 .02 .02 .809
Step 4
Intercept 62.83 (1.56) 59.68 68.86 .001 .51 31.74 0.58 .447
Comm. Out 0.24 (0.18) –0.05 0.66 .09 .09 .197
Pre 0.75 (0.08) 0.62 0.91 .69 .65 .001
Major 1.73 (2.28) –2.64 6.57 .06 .06 .452
Step 5
Intercept 66.14 (1.84) 62.54 70.06 .001 .52 32.60 1.81 .182
Comm. Out 0.22 (0.19) –0.08 0.69 .09 .08 .202
Pre 0.78(0.08) 0.62 0.92 .70 .66 .001
Male –3.39 (2.29) –7.98 1.01 –.10 –.10 .152
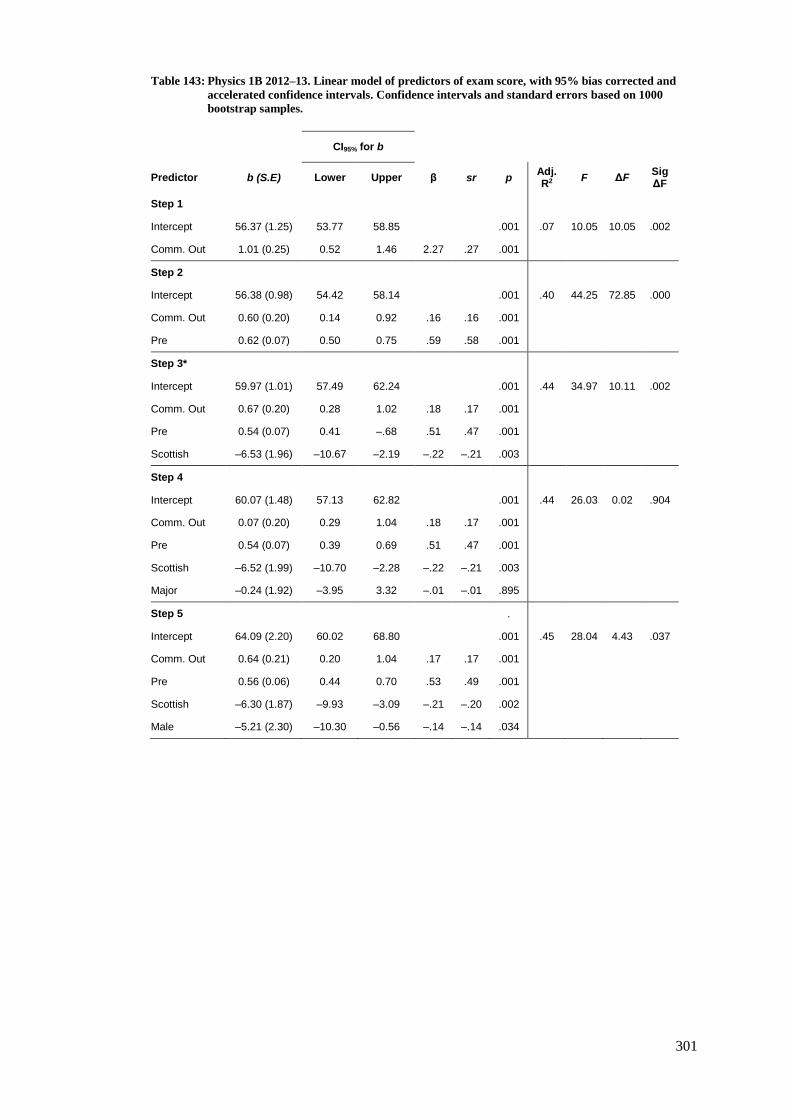
301
Table 143: Physics 1B 2012–13. Linear model of predictors of exam score, with 95% bias corrected and
accelerated confidence intervals. Confidence intervals and standard errors based on 1000
bootstrap samples.
CI95% for b
Predictor b (S.E) Lower Upper β sr p Adj. R2
F ΔF Sig ΔF
Step 1
Intercept 56.37 (1.25) 53.77 58.85 .001 .07 10.05 10.05 .002
Comm. Out 1.01 (0.25) 0.52 1.46 2.27 .27 .001
Step 2
Intercept 56.38 (0.98) 54.42 58.14 .001 .40 44.25 72.85 .000
Comm. Out 0.60 (0.20) 0.14 0.92 .16 .16 .001
Pre 0.62 (0.07) 0.50 0.75 .59 .58 .001
Step 3*
Intercept 59.97 (1.01) 57.49 62.24 .001 .44 34.97 10.11 .002
Comm. Out 0.67 (0.20) 0.28 1.02 .18 .17 .001
Pre 0.54 (0.07) 0.41 –.68 .51 .47 .001
Scottish –6.53 (1.96) –10.67 –2.19 –.22 –.21 .003
Step 4
Intercept 60.07 (1.48) 57.13 62.82 .001 .44 26.03 0.02 .904
Comm. Out 0.07 (0.20) 0.29 1.04 .18 .17 .001
Pre 0.54 (0.07) 0.39 0.69 .51 .47 .001
Scottish –6.52 (1.99) –10.70 –2.28 –.22 –.21 .003
Major –0.24 (1.92) –3.95 3.32 –.01 –.01 .895
Step 5 .
Intercept 64.09 (2.20) 60.02 68.80 .001 .45 28.04 4.43 .037
Comm. Out 0.64 (0.21) 0.20 1.04 .17 .17 .001
Pre 0.56 (0.06) 0.44 0.70 .53 .49 .001
Scottish –6.30 (1.87) –9.93 –3.09 –.21 –.20 .002
Male –5.21 (2.30) –10.30 –0.56 –.14 –.14 .034

302
Table 144: Physics 1B 2013–14. Linear model of predictors of exam score, with 95% bias corrected and
accelerated confidence intervals. Confidence intervals and standard errors based on 1000
bootstrap samples.
CI95% for b
Predictor b (S.E) Lower Upper β sr p Adj. R2
F ΔF Sig ΔF
Step 1
Intercept 58.98 (1.33) 56.17 61.50 .001 .05 7.41 7.41 .007
Comm. Out 1.20 (0.44) 0.17 2.15 .23 .23 .004
Step 2
Intercept 58.98 (1.10) 56.84 61.10 .001 .35 37.09 63.37 .000
Comm. Out 0.85 (0.36) 0.11 1.56 .16 .16 .011
Pre 0.59 (0.07) 0.43 0.73 .55 .55 .001
Step 3*
Intercept 60.79 (1.59) 57,62 63.82 .001 .35 26.05 2.91 .090
Comm. Out 0.86 (0.36) 0.17 1.56 .16 .16 .012
Pre 0.55 (0.08) 0.39 0.70 .52 .50 .001
Scottish –3.73 (2.31) –7.97 0.92 –.12 –.12 .104
Step 4
Intercept 59.71 (1.55) 56.67 62.56 .001 .34 24.71 0.32 .573
Comm. Out 0.88 (0.37) 0.08 1.58 .17 .16 .018
Pre 0.59 (0.07) 0.45 0.72 .55 .55 .001
Major –1.23 (2.14) –5.87 3.41 –.04 –.04 .575
Step 5
Intercept 60.11 (1.74) 56.86 63.50 .001 .34 24.78 0.46 .497
Comm. Out 0.85 (0.35) 0.06 1.53 .16 .16 .014
Pre 0.60 (0.07) 0.45 0.74 .56 .55 .001
Male –1.60 (2.23) –6.17 2.56 –.05 –.05 .484

303
Table 145: Genes and Gene Action 2011–12. Linear model of predictors of exam score, with 95% bias
corrected and accelerated confidence intervals. Confidence intervals and standard errors based
on 1000 bootstrap samples.
CI95% for b
Predictor b (S.E) Lower Upper β sr p Adj. R2
F ΔF Sig ΔF
Step 1
Intercept 60.35 (0.77) 58.71 62.23 .001 .03 7.36 7.36 .007
Comm. Out 0.07 (0.05) 0.03 0.26 .18 .18 .063
Step 2*
Intercept 60.35 (0.54) 59.28 61.43 .001 .50 106.73 199.18 .000
Comm. Out 0.02 (0.03) –0.01 0.12 .05 .05 .227
Pre 0.80 (–0.07) 0.66 0.95 .70 .69 .001
Step 3
Intercept 60.67 (0.70) 59.35 62.00 .001 .50 71.19 1.03 .455
Comm. Out 0.02 (0.03) –0.01 0.11 .06 .06 .239
Pre 0.79 (0.07) 0.65 0.95 .69 .66 .001
Scottish –0.85 (1.14) –3.35 1.80 –.04 –.06 .451
Step 4
Intercept 58.96 (1.32) 56.41 61.56 .001 .50 71.45 0.94 .333
Comm. Out 0.02 (0.02) –0.01 0.11 .06 .06 .227
Pre 0.81 (0.07) 0.66 0.95 .70 .66 .001
Major 1.59 (1.43) –1.43 4.48 .05 .05 .262
Step 5
Intercept 60.34 (0.64) 59.08 61.54 .001 .50 70.81 0.00 .979
Comm. Out 0.02 (0.03) –0.01 0.12 .05 .05 .296
Pre 0.79 (0.07) 0.67 0.93 .70 .69 .001
Male 0.03 (1.20) –2.41 2.45 .00 .00 .979

304
Table 146: Genes and Gene Action 2012–13. Linear model of predictors of exam score, with 95% bias
corrected and accelerated confidence intervals. Confidence intervals and standard errors based
on 1000 bootstrap samples.
CI95% for b
Predictor b (S.E) Lower Upper β sr p Adj. R2
F ΔF Sig ΔF
Step 1
Intercept 65.82 (0.88) 63.87 67.57 .001 .07 19.02 19.02 .000
Comm. Out .141 (0.04) 0.09 0.26 .28 .27 .001
Step 2
Intercept 65.82 (0 69) 64.40 67.19 .011 .41 81.06 132.26 .000
Comm. Out 0.08 (0.03) 0.04 0.16 .15 .14 .004
Pre 0.77 (0.07) 0.64 0.92 .600 .56 .001
Step 3
Intercept 66.75 (0.90) 64.93 68.51 .001 .41 55.17 2.39 .123
Comm. Out 0.08 (0.03) 0.04 0.17 .15 .15 .002
Pre 0.74 (0.08) 0.60 0.89 .57 .53 .001
Scottish –2.30 (1.57) –5.46 0.92 –.08 –.08 .134
Step 4
Intercept 64.21 (1.90) 60.11 67.67 .001 .41 54.34 0.93 .336
Comm. Out 0.08 (0.03) 0.04 0.17 .16 .15 .001
Pre 0.76 (0.07) 0.62 0.91 .59 .57 .001
Major 1.89 (2.08) –2.01 5.91 .05 .05 .346
Step 5*
Intercept 67.23 (0.79) 65.58 68.93 .001 .43 59.75 10.45 .001
Comm. Out 0.06 (0.02) 0.03 0.13 .13 .12 .002
Pre 0.77 (0.07) 0.65 0.91 .60 .59 .001
Male –4.92 (1.67) –8.24 –1.55 –.16 –.16 .002
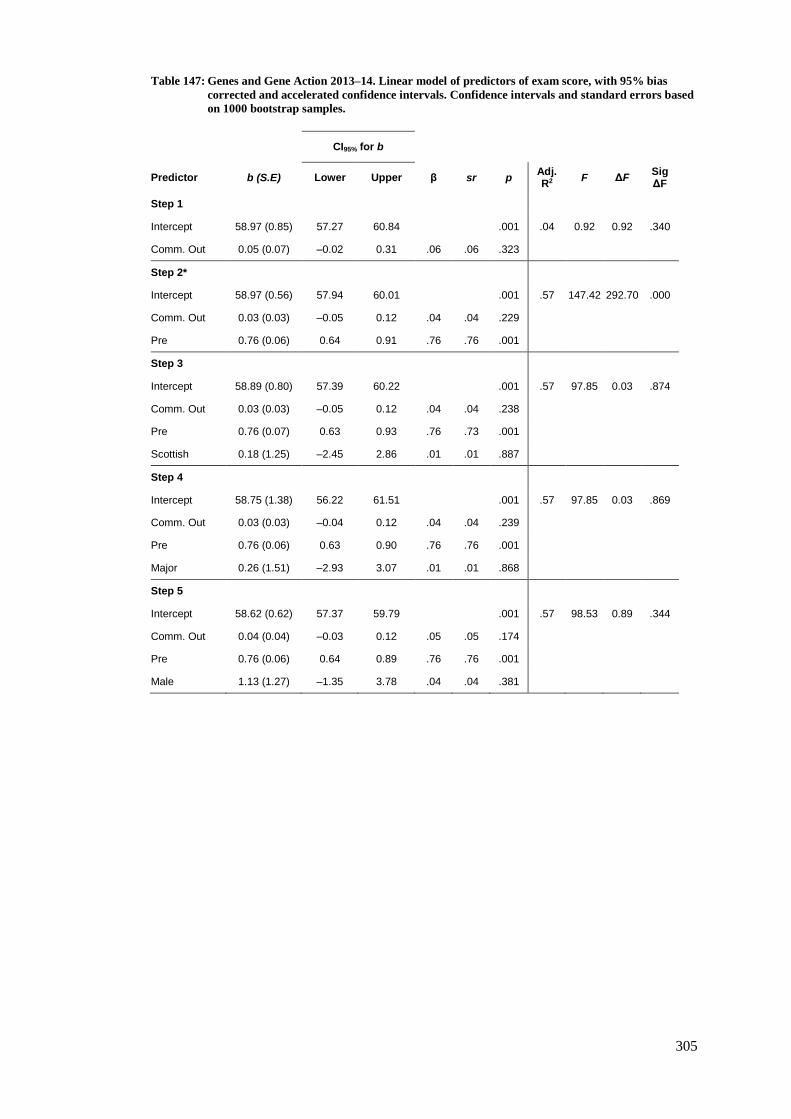
305
Table 147: Genes and Gene Action 2013–14. Linear model of predictors of exam score, with 95% bias
corrected and accelerated confidence intervals. Confidence intervals and standard errors based
on 1000 bootstrap samples.
CI95% for b
Predictor b (S.E) Lower Upper β sr p Adj. R2
F ΔF Sig ΔF
Step 1
Intercept 58.97 (0.85) 57.27 60.84 .001 .04 0.92 0.92 .340
Comm. Out 0.05 (0.07) –0.02 0.31 .06 .06 .323
Step 2*
Intercept 58.97 (0.56) 57.94 60.01 .001 .57 147.42 292.70 .000
Comm. Out 0.03 (0.03) –0.05 0.12 .04 .04 .229
Pre 0.76 (0.06) 0.64 0.91 .76 .76 .001
Step 3
Intercept 58.89 (0.80) 57.39 60.22 .001 .57 97.85 0.03 .874
Comm. Out 0.03 (0.03) –0.05 0.12 .04 .04 .238
Pre 0.76 (0.07) 0.63 0.93 .76 .73 .001
Scottish 0.18 (1.25) –2.45 2.86 .01 .01 .887
Step 4
Intercept 58.75 (1.38) 56.22 61.51 .001 .57 97.85 0.03 .869
Comm. Out 0.03 (0.03) –0.04 0.12 .04 .04 .239
Pre 0.76 (0.06) 0.63 0.90 .76 .76 .001
Major 0.26 (1.51) –2.93 3.07 .01 .01 .868
Step 5
Intercept 58.62 (0.62) 57.37 59.79 .001 .57 98.53 0.89 .344
Comm. Out 0.04 (0.04) –0.03 0.12 .05 .05 .174
Pre 0.76 (0.06) 0.64 0.89 .76 .76 .001
Male 1.13 (1.27) –1.35 3.78 .04 .04 .381
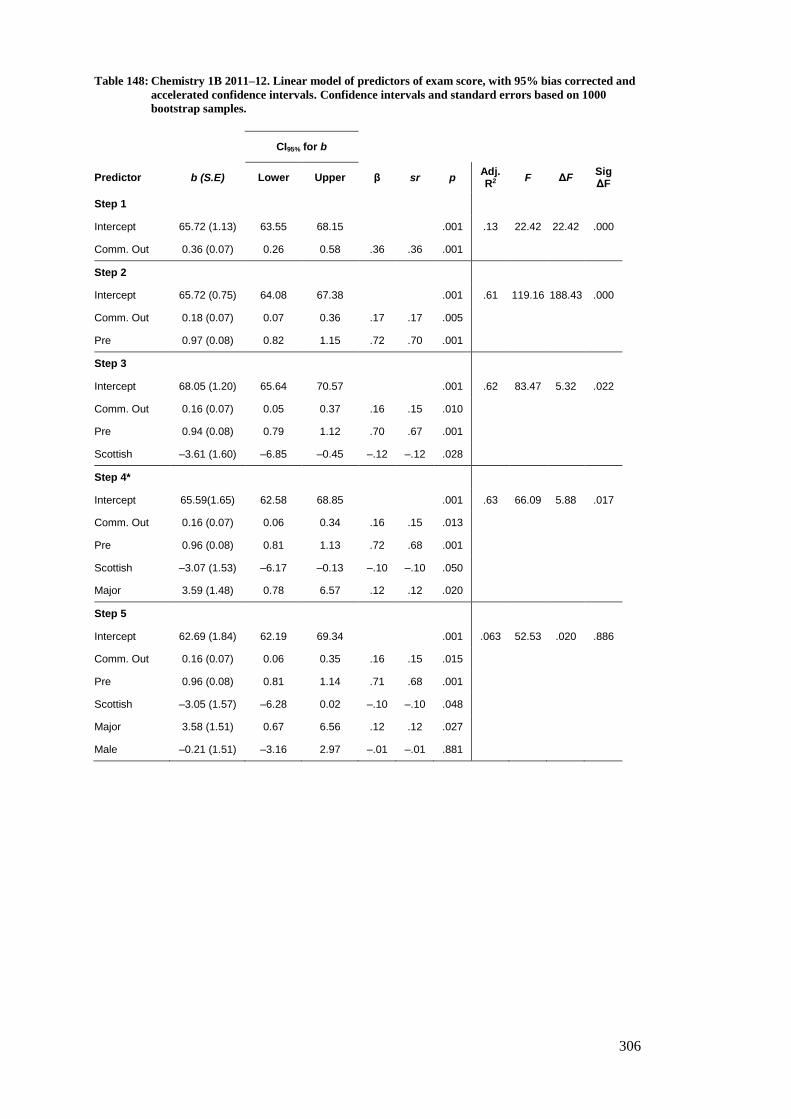
306
Table 148: Chemistry 1B 2011–12. Linear model of predictors of exam score, with 95% bias corrected and
accelerated confidence intervals. Confidence intervals and standard errors based on 1000
bootstrap samples.
CI95% for b
Predictor b (S.E) Lower Upper β sr p Adj. R2
F ΔF Sig ΔF
Step 1
Intercept 65.72 (1.13) 63.55 68.15 .001 .13 22.42 22.42 .000
Comm. Out 0.36 (0.07) 0.26 0.58 .36 .36 .001
Step 2
Intercept 65.72 (0.75) 64.08 67.38 .001 .61 119.16 188.43 .000
Comm. Out 0.18 (0.07) 0.07 0.36 .17 .17 .005
Pre 0.97 (0.08) 0.82 1.15 .72 .70 .001
Step 3
Intercept 68.05 (1.20) 65.64 70.57 .001 .62 83.47 5.32 .022
Comm. Out 0.16 (0.07) 0.05 0.37 .16 .15 .010
Pre 0.94 (0.08) 0.79 1.12 .70 .67 .001
Scottish –3.61 (1.60) –6.85 –0.45 –.12 –.12 .028
Step 4*
Intercept 65.59(1.65) 62.58 68.85 .001 .63 66.09 5.88 .017
Comm. Out 0.16 (0.07) 0.06 0.34 .16 .15 .013
Pre 0.96 (0.08) 0.81 1.13 .72 .68 .001
Scottish –3.07 (1.53) –6.17 –0.13 –.10 –.10 .050
Major 3.59 (1.48) 0.78 6.57 .12 .12 .020
Step 5
Intercept 62.69 (1.84) 62.19 69.34 .001 .063 52.53 .020 .886
Comm. Out 0.16 (0.07) 0.06 0.35 .16 .15 .015
Pre 0.96 (0.08) 0.81 1.14 .71 .68 .001
Scottish –3.05 (1.57) –6.28 0.02 –.10 –.10 .048
Major 3.58 (1.51) 0.67 6.56 .12 .12 .027
Male –0.21 (1.51) –3.16 2.97 –.01 –.01 .881
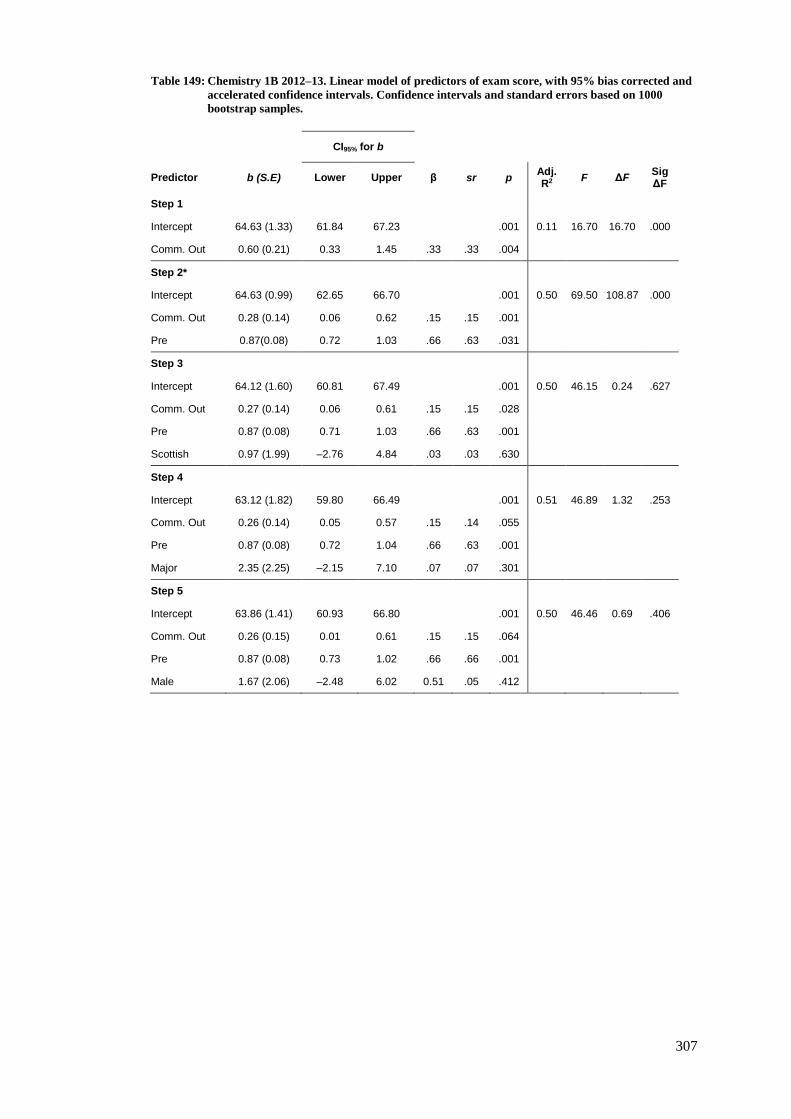
307
Table 149: Chemistry 1B 2012–13. Linear model of predictors of exam score, with 95% bias corrected and
accelerated confidence intervals. Confidence intervals and standard errors based on 1000
bootstrap samples.
CI95% for b
Predictor b (S.E) Lower Upper β sr p Adj. R2
F ΔF Sig ΔF
Step 1
Intercept 64.63 (1.33) 61.84 67.23 .001 0.11 16.70 16.70 .000
Comm. Out 0.60 (0.21) 0.33 1.45 .33 .33 .004
Step 2*
Intercept 64.63 (0.99) 62.65 66.70 .001 0.50 69.50 108.87 .000
Comm. Out 0.28 (0.14) 0.06 0.62 .15 .15 .001
Pre 0.87(0.08) 0.72 1.03 .66 .63 .031
Step 3
Intercept 64.12 (1.60) 60.81 67.49 .001 0.50 46.15 0.24 .627
Comm. Out 0.27 (0.14) 0.06 0.61 .15 .15 .028
Pre 0.87 (0.08) 0.71 1.03 .66 .63 .001
Scottish 0.97 (1.99) –2.76 4.84 .03 .03 .630
Step 4
Intercept 63.12 (1.82) 59.80 66.49 .001 0.51 46.89 1.32 .253
Comm. Out 0.26 (0.14) 0.05 0.57 .15 .14 .055
Pre 0.87 (0.08) 0.72 1.04 .66 .63 .001
Major 2.35 (2.25) –2.15 7.10 .07 .07 .301
Step 5
Intercept 63.86 (1.41) 60.93 66.80 .001 0.50 46.46 0.69 .406
Comm. Out 0.26 (0.15) 0.01 0.61 .15 .15 .064
Pre 0.87 (0.08) 0.73 1.02 .66 .66 .001
Male 1.67 (2.06) –2.48 6.02 0.51 .05 .412

308
Table 150: Chemistry 1B 2013–14. Linear model of predictors of exam score, with 95% bias corrected and
accelerated confidence intervals. Confidence intervals and standard errors based on 1000
bootstrap samples.
CI95% for b
Predictor b (S.E) Lower Upper β sr p Adj. R2
F ΔF Sig ΔF
Step 1
Intercept 63.88 (1.38) 60.96 67.21 .001 .00 0.30 0.30 .582
Comm. Out –0.09 (0.28) –0.40 0.84 –.04 –.04 .711
Step 2
Intercept 63.88 (0.96) 61.82 66.18 .001 .51 84.06 167.50 .000
Comm. Out –0.30 (0.26) –0.60 0.45 –.15 –.15 .218
Pre 0.85 (0.07) 0.69 0.98 .72 .71 .001
Step 3
Intercept 62.74 (1.47) 59.87 65.79 .001 .51 56.51 1.21 .273
Comm. Out –0.30 (0.26) –0.60 0.45 –.15 –.15 .229
Pre 0.88 (0.08) 0.70 1.05 .75 .67 .001
Scottish 2.36 (2.25) –2.49 6.23 .07 .06 .311
Step 4*
Intercept 66.29 (1.41) 63.10 69.99 .001 .52 59.08 4.97 .027
Comm. Out –0.29 (0.28) –0.62 0.45 –.15 –.15 .299
Pre 0.85 (0.07) 0.70 0.99 .73 .72 .001
Major –4.25 (1.98) –7.87 –1.40 –.12 –.12 .041
Step 5
Intercept 61.47 (1.46) 58.88 64.10 .001 .51 58.09 3.53 .062
Comm. Out –0.30 (0.28) –0.62 0.47 –.15 –.15 .293
Pre 0.85 (0.07) 0.71 0.97 .73 .72 .001
Male 3.73 (1.94) –0.43 8.80 .13 .10 .067

309
Table 151: Glasgow Physics 2011–12. Linear model of predictors of exam score, with 95% bias corrected
and accelerated confidence intervals. Confidence intervals and standard errors based on 1000
bootstrap samples.
CI95% for b
Predictor b (S.E) Lower Upper β sr p Adj. R2
F ΔF Sig ΔF
Step 1
Intercept 51.85 (0.18) 48.29 56.44 .001 .02 3.07 3.07 .082
Comm. Out 0.11 (0.16) 0.01 0.92 .15 .15 .157
Step 2*
Intercept 51.85 (1.30) 49.24 54.84 .001 .48 64.27 122.74 .000
Comm. Out 0.04 (0.11) –0.03 0.59 .06 .06 .448
Pre 0.62 (0.06) 0.51 0.72 .69 .68 .001
Step 3
Intercept 50.72 (2.32) 46.18 55.46 .001 .48 42.69 0.25 .619
Comm. Out 0.04 (0.11) –0.03 0.62 .06 .06 .444
Pre 0.61 (0.06) 0.51 0.72 .68 .67 .01
Male 1.46 (2.70) –4.55 7.84 .03 .03 .578

310
Table 152: Glasgow Physics 2012–13. Linear model of predictors of exam score, with 95% bias corrected
and accelerated confidence intervals. Confidence intervals and standard errors based on 1000
bootstrap samples.
CI95% for b
Predictor b (S.E) Lower Upper β sr p Adj. R2
F ΔF Sig ΔF
Step 1
Intercept 53.11 (1.50) 49.81 56.25 .001 .09 14.34 14.34 .000
Comm. Out 0.96 (0.28) 0.47 1.62 .30 .30 .001
Step 2*
Intercept 53.11 (1.17) 50.60 55.58 .001 .48 70.94 116.43 .000
Comm. Out 0.47 (0.21) 0.07 1.03 .15 .14 .021
Pre 0.56 (0.05) 0.46 0.65 .65 .63 .001
Step 3
Intercept 54.91 (2.35) 50.25 59.76 .001 .49 47.44 0.70 .404
Comm. Out 0.48(0.21) 0.08 1.04 .15 .14 .021
Pre 0.56 (0.05) 0.46 0.66 .66 .64 .001
Male –2.35 (2.77) –7.66 2.78 –.05 –.05 .402

311
Table 153: Glasgow Physics 2013–14. Linear model of predictors of exam score, with 95% bias corrected
and accelerated confidence intervals. Confidence intervals and standard errors based on 1000
bootstrap samples.
CI95% for b
Predictor b (S.E) Lower Upper β sr p Adj. R2
F ΔF Sig ΔF
Step 1
Intercept 48.91 (1.58) 45.91 52.51 .001 0.07 9.06 9.06 .003
Comm. Out 0.42 (0.24) 0.29 1.56 .25 .25 .010
Step 2*
Intercept 48.91 (1.28) 46.49 51.48 .001 0.355 35.80 58.56 .000
Comm. Out 0.15 (0.14) –0.12 0.69 .09 .09 .040
Pre 0.55 (0.07) 0.39 0.70 .56 .54 .001
Step 3
Intercept 46.58 (2.86) 41.61 51.61 .001 0.35 24.09 0.78 .379
Comm. Out 0.16 (0.14) –0.11 0.76 .10 .09 .041
Pre 0.55 (0.07) 0.38 0.70 .56 .54 .001
Male 2.90 (3.20) –3.84 9.60 .06 .06 .363

312
Table 154: Nottingham Chemistry 2011–12. Linear model of predictors of exam score, with 95% bias
corrected and accelerated confidence intervals. Confidence intervals and standard errors based
on 1000 bootstrap samples.
CI95% for b
Predictor b (S.E) Lower Upper β sr p Adj. R2
F ΔF Sig ΔF
Step 1
Intercept 61.57(1.08) 59.26 63.86 .001 .09 14.82 14.82 .000
Comm. Out 0.11 (0.03) 0.06 0.21 .29 .29 .002
Step 2*
Intercept 61.57 (1.02) 59.46 63.68 .001 .21 22.26 27.28 .000
Comm. Out 0.08 (0.03) 0.04 0.14 .20 .20 .004
Pre 0.52 (0.09) 0.35 0.72 .38 .37 .001
Step 3
Intercept 62.64 (1.50) 59.82 65.59 .001 .21 14.97 0.51 .480
Comm. Out 0.08 (0.03) 0.04 0.14 .20 .19 .005
Pre 0.53 (0.09) 0.36 0.73 .38 .37 .001
Male –1.62 (2.06) –5.81 2.57 –.05 –.05 .433

313
Table 155: Nottingham Chemistry 2012–13. Linear model of predictors of exam score, with 95% bias
corrected and accelerated confidence intervals. Confidence intervals and standard errors based
on 1000 bootstrap samples.
CI95% for b
Predictor b (S.E) Lower Upper β sr p Adj. R2
F ΔF Sig ΔF
Step 1
Intercept 61.67 (1.01) 59.69 63.72 .001 .01 0.98 0.98 .325
Comm. Out 0.29 (0.04) –0.01 0.16 .08 .08 .355
Step 2*
Intercept 61.67 (0.95) 59.75 63.66 .001 .14 14.94 28.75 .000
Comm. Out 0.01 (0.04) –0.03 0.14 .02 .02 .814
Pre 0.40 (0.70) 0.28 0.55 .39 .39 .001
Step 3
Intercept 61.73 (1.17) 59.15 64.19 .001 .14 9.90 0.01 .942
Comm. Out 0.01 (0.04) –0.03 0.14 .02 .02 .797
Pre 0.40 (0.07) 0.28 0.55 .39 .39 .001
Male 0.15 (2.01) –3.77 3.71 .01 .01 .940
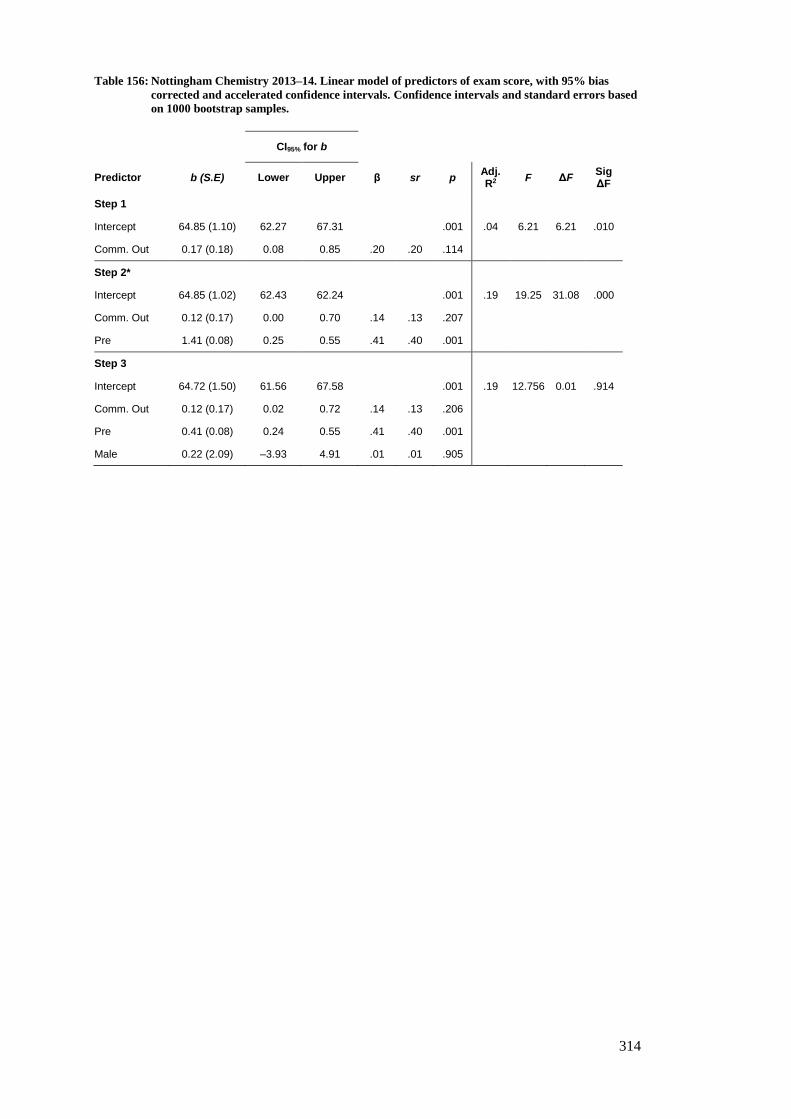
314
Table 156: Nottingham Chemistry 2013–14. Linear model of predictors of exam score, with 95% bias
corrected and accelerated confidence intervals. Confidence intervals and standard errors based
on 1000 bootstrap samples.
CI95% for b
Predictor b (S.E) Lower Upper β sr p Adj. R2
F ΔF Sig ΔF
Step 1
Intercept 64.85 (1.10) 62.27 67.31 .001 .04 6.21 6.21 .010
Comm. Out 0.17 (0.18) 0.08 0.85 .20 .20 .114
Step 2*
Intercept 64.85 (1.02) 62.43 62.24 .001 .19 19.25 31.08 .000
Comm. Out 0.12 (0.17) 0.00 0.70 .14 .13 .207
Pre 1.41 (0.08) 0.25 0.55 .41 .40 .001
Step 3
Intercept 64.72 (1.50) 61.56 67.58 .001 .19 12.756 0.01 .914
Comm. Out 0.12 (0.17) 0.02 0.72 .14 .13 .206
Pre 0.41 (0.08) 0.24 0.55 .41 .40 .001
Male 0.22 (2.09) –3.93 4.91 .01 .01 .905

315
Appendix G
Multiple regression models examining the
relationship between comments received and exam
score
In each of the following tables, the best model, as discussed in the main text, is indicated by
an asterisk (*).

316

317
Table 157: Physics 1A 2011–12. Linear model of predictors of exam score, with 95% bias corrected and
accelerated confidence intervals. Confidence intervals and standard errors based on 1000
bootstrap samples.
CI95% for b
Predictor b (S.E) Lower Upper β sr p Adj. R2
F ΔF Sig. ΔF
Step 1
Intercept 62.97 (1.36) 60.08 66.09 .001 .00 0.56 0.56 .454
Comm. In 0.06 (0.21) –0.20 0.62 .06 .06 .700
Step 2*
Intercept 62.97 (1.23) 60.56 65.77 .001 .16 17.18 33.70 .000
Comm. In 0.05 (0.17) –0.14 0.59 .05 .05 .698
Pre 0.34 (0.07) 0.21 0.44 .41 .41 .001
Step 3
Intercept 63.60 (2.49) 59.44 68.16 .001 .16 11.59 0.49 .485
Comm. In 0.05 (0.18) –0.15 0.59 .05 .05 .706
Pre 0.33 (0.07 0.20 0.44 .40 .39 .001
Scottish –1.12 (2.46) –5.96 3.72 –.03 –.03 .689
Step 4
Intercept 62.55 (1.51) 59.22 66.18 .001 .16 11.46 0.17 .678
Comm. In 0.05 (0.17) –0.14 0.59 .05 .05 .711
Pre 0.34 (0.07) 0.21 0.44 .40 .40 .001
Major 1.03 (2.49) –4.17 5.70 .03 .03 .663
Step 5
Intercept 64.32 (2.05) 59.88 68.51 .001 .16 11.50 0.49 .485
Comm. In 0.05 (0.18) –0.13 0.60 .05 .05 .717
Pre 0.35 (0.07) 0.22 0.44 .42 .41 .001
Male –1.91 (2.61) –7.46 3.40 –.05 –.05 .477
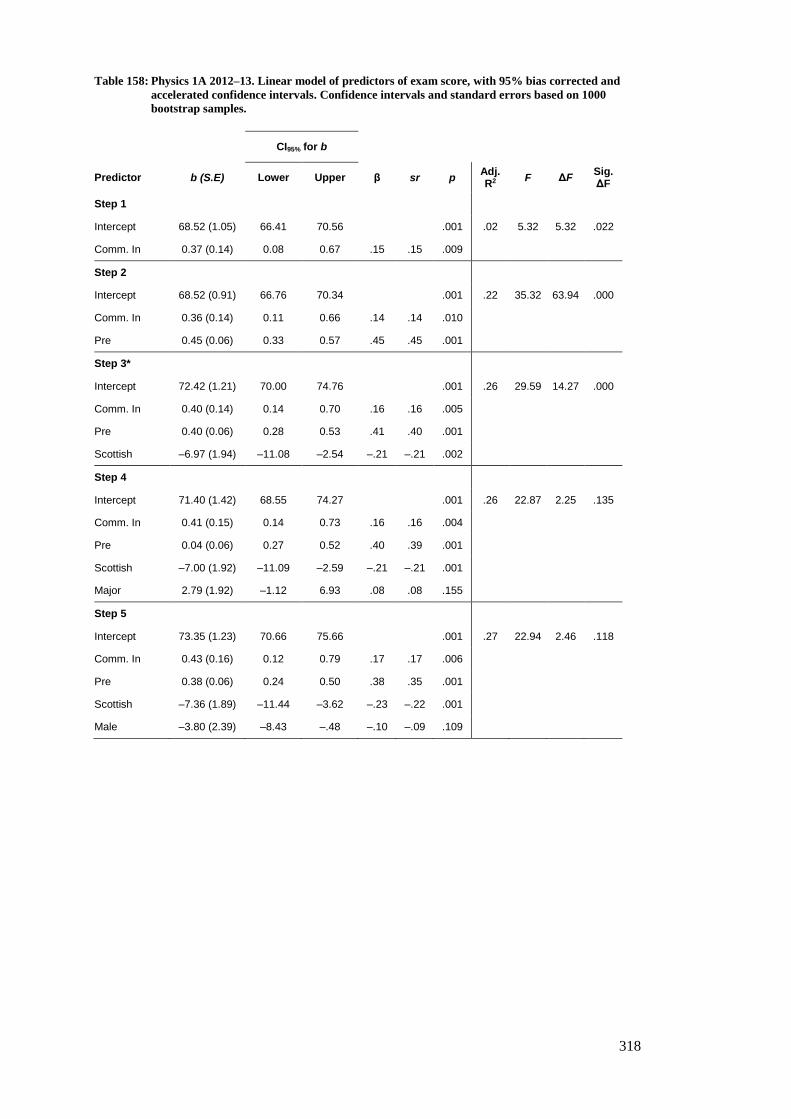
318
Table 158: Physics 1A 2012–13. Linear model of predictors of exam score, with 95% bias corrected and
accelerated confidence intervals. Confidence intervals and standard errors based on 1000
bootstrap samples.
CI95% for b
Predictor b (S.E) Lower Upper β sr p Adj. R2
F ΔF Sig. ΔF
Step 1
Intercept 68.52 (1.05) 66.41 70.56 .001 .02 5.32 5.32 .022
Comm. In 0.37 (0.14) 0.08 0.67 .15 .15 .009
Step 2
Intercept 68.52 (0.91) 66.76 70.34 .001 .22 35.32 63.94 .000
Comm. In 0.36 (0.14) 0.11 0.66 .14 .14 .010
Pre 0.45 (0.06) 0.33 0.57 .45 .45 .001
Step 3*
Intercept 72.42 (1.21) 70.00 74.76 .001 .26 29.59 14.27 .000
Comm. In 0.40 (0.14) 0.14 0.70 .16 .16 .005
Pre 0.40 (0.06) 0.28 0.53 .41 .40 .001
Scottish –6.97 (1.94) –11.08 –2.54 –.21 –.21 .002
Step 4
Intercept 71.40 (1.42) 68.55 74.27 .001 .26 22.87 2.25 .135
Comm. In 0.41 (0.15) 0.14 0.73 .16 .16 .004
Pre 0.04 (0.06) 0.27 0.52 .40 .39 .001
Scottish –7.00 (1.92) –11.09 –2.59 –.21 –.21 .001
Major 2.79 (1.92) –1.12 6.93 .08 .08 .155
Step 5
Intercept 73.35 (1.23) 70.66 75.66 .001 .27 22.94 2.46 .118
Comm. In 0.43 (0.16) 0.12 0.79 .17 .17 .006
Pre 0.38 (0.06) 0.24 0.50 .38 .35 .001
Scottish –7.36 (1.89) –11.44 –3.62 –.23 –.22 .001
Male –3.80 (2.39) –8.43 –.48 –.10 –.09 .109
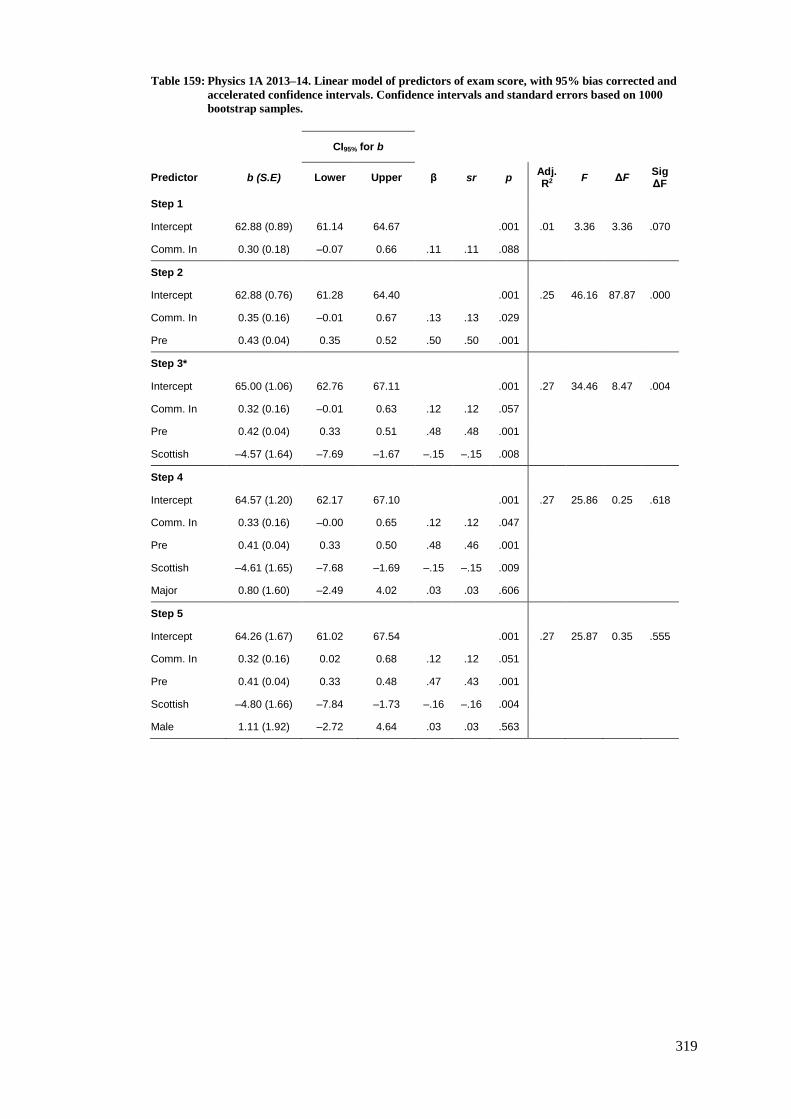
319
Table 159: Physics 1A 2013–14. Linear model of predictors of exam score, with 95% bias corrected and
accelerated confidence intervals. Confidence intervals and standard errors based on 1000
bootstrap samples.
CI95% for b
Predictor b (S.E) Lower Upper β sr p Adj. R2
F ΔF Sig ΔF
Step 1
Intercept 62.88 (0.89) 61.14 64.67 .001 .01 3.36 3.36 .070
Comm. In 0.30 (0.18) –0.07 0.66 .11 .11 .088
Step 2
Intercept 62.88 (0.76) 61.28 64.40 .001 .25 46.16 87.87 .000
Comm. In 0.35 (0.16) –0.01 0.67 .13 .13 .029
Pre 0.43 (0.04) 0.35 0.52 .50 .50 .001
Step 3*
Intercept 65.00 (1.06) 62.76 67.11 .001 .27 34.46 8.47 .004
Comm. In 0.32 (0.16) –0.01 0.63 .12 .12 .057
Pre 0.42 (0.04) 0.33 0.51 .48 .48 .001
Scottish –4.57 (1.64) –7.69 –1.67 –.15 –.15 .008
Step 4
Intercept 64.57 (1.20) 62.17 67.10 .001 .27 25.86 0.25 .618
Comm. In 0.33 (0.16) –0.00 0.65 .12 .12 .047
Pre 0.41 (0.04) 0.33 0.50 .48 .46 .001
Scottish –4.61 (1.65) –7.68 –1.69 –.15 –.15 .009
Major 0.80 (1.60) –2.49 4.02 .03 .03 .606
Step 5
Intercept 64.26 (1.67) 61.02 67.54 .001 .27 25.87 0.35 .555
Comm. In 0.32 (0.16) 0.02 0.68 .12 .12 .051
Pre 0.41 (0.04) 0.33 0.48 .47 .43 .001
Scottish –4.80 (1.66) –7.84 –1.73 –.16 –.16 .004
Male 1.11 (1.92) –2.72 4.64 .03 .03 .563

320
Table 160: Physics 1B 2011–12. Linear model of predictors of exam score, with 95% bias corrected and
accelerated confidence intervals. Confidence intervals and standard errors based on 1000
bootstrap samples.
CI95% for b
Predictor b (S.E) Lower Upper β sr p Adj. R2
F ΔF Sig ΔF
Step 1
Intercept 63.69 (1.58) 6.62 66.71 .001 .06 5.56 5.56 .021
Comm. In 0.34 (0.13) 0.17 0.68 .24 .22 .007
Step 2*
Intercept 63.69 (1.15) 61,39 65.89 .001 .51 47.00 83.25 .000
Comm. In 0.10 (0.09) –0.05 0.31 .07 .07 .252
Pre 0.77 (0.07) –0.54 0.87 .70 .68 .001
Step 3
Intercept 63.30 (1.87) 59.68 67.12 .001 .50 31.03 0.08 .773
Comm. In 0.10 (0.10) –0.06 0.33 .08 .07 .274
Pre 0.77 (0.08) 0.62 0.92 .70 .68 .001
Scottish 0.69 (2.45) –4.28 5.57 .02 .02 .762
Step 4
Intercept 62.69 (1.62) 59.49 65.93 .001 .51 31.48 0.73 .394
Comm. In 0.15 (0.09) –0.05 0.32 .08 .08 .202
Pre 0.76 (0.08) 0.62 0.91 .69 .67 .001
Major 0.10 (1.96) –2.39 6.82 .07 .06 .419
Step 5
Intercept 66.10 (1.93) 62.26 69.83 .001 .51 32.17 1.73 .191
Comm. In 0.09 (0.08) –0..05 0.27 .06 .06 .226
Pre 0.79 (0.08) 0.64 0.96 .72 .69 .001
Male –3.34 (2.38) –8.00 1.40 –.10 –.10 .161

321
Table 161: Physics 1B 2012–13. Linear model of predictors of exam score, with 95% bias corrected and
accelerated confidence intervals. Confidence intervals and standard errors based on 1000
bootstrap samples.
CI95% for b
Predictor b (S.E) Lower Upper β sr p Adj. R2
F ΔF Sig ΔF
Step 1
Intercept 56.37 (1.28) 53.91 58.90 .001 .03 4.11 4.11 .045
Comm. In 0.65 (0.37) –0.22 1.41 .18 .18 .070
Step 2
Intercept 56.38 (1.00) 54.53 58.44 .001 .39 43.29 79.97 .000
Comm. In 0.51 (0.28) –0.16 1.07 .14 .14 .069
Pre 0.64 (0.07) 0.53 0.77 .61 .61 .001
Step 3* .
Intercept 59.98 (1.35) 57.35 62.64 .001 .43 34.26 10.07 .002
Comm. In 0.59 (0.28) 0.00 1.13 .16 .16 .027
Pre 0.56 (0.07) 0.43 0.69 .54 .50 .001
Scottish –6.56 (1.89) –10.33 –2.83 –.22 –.21 .003
Step 4
Intercept 59.88 (1.57) 56.62 62.82 .001 .43 25.50 0.02 .894
Comm. In 0.60 (0.29) 0.00 1.19 .16 .16 .032
Pre 0.56 (0.07) 0.43 0.70 .54 .50 .001
Scottish –6.58 (1.94) –10.56 –2.73 –.22 –.21 .003
Major 0.27 (1.95) –3.55 4.64 .01 .01 .897
Step 5
Intercept 63.81 (2.31) 59.22 68.29 .001 .45 3.75 27.19 .065
Comm. In 0.54 (0.28) –0.12 1.07 .15 .14 .060
Pre 0.58 (0.07) 0.45 0.72 .56 .52 .001
Scottish –6.31 (1.78) –10.16 –2.75 –.21 –.20 .002
Male –4.86 (2.35) –9.68 –0.24 –.13 –.13 .043

322
Table 162: Physics 1B 2013–14. Linear model of predictors of exam score, with 95% bias corrected and
accelerated confidence intervals. Confidence intervals and standard errors based on 1000
bootstrap samples.
CI95% for b
Predictor b (S.E) Lower Upper β sr p Adj. R2
F ΔF Sig ΔF
Step 1
Intercept 58.98 (1.27) 56.60 61.22 .001 .04 6.11 6.11 .015
Comm. In 1.00 (0.38) 0.16 1.63 .21 .21 .006
Step 2*
Intercept 59.98 (1.08) 56.76 60.96 .001 .33 34.41 60.06 .000
Comm. In 0.45 (0.35) –0.17 1.13 .10 .09 .166
Pre 0.59 (0.07) 0.43 0.75 .55 .54 .001
Step 3 .
Intercept 60.67 (1.57) 57.65 63.68 .001 .34 24.01 2.46 .120
Comm. In 0.42 (0.35) –0.23 1.08 .09 .09 .241
Pre 0.56 (0.08) 0.39 0.72 .52 .50 .001
Scottish –3.48 (2.34) –8.18 1.03 –.11 –.11 .135
Step 4
Intercept 60.84 (1.63) 56.14 62.09 .001 .32 22.79 0.03 .853
Comm. In 0.46 (0.35) –0.26 1.20 .10 .09 .177
Pre 0.59 (0.08) 0.43 0.74 .55 .54 .001
Major –0.41 (2.13) –4.34 3.84 –.01 –.01 .848
Step 5
Intercept 61.15 (1.75) 56.70 63.94 .01 .33 22.98 0.42 .520
Comm. In 0.45 (0.35) –0.26 1.20 .09 .09 .182
Pre 0.60 (0.07) 0.46 0.74 .56 .54 .001
Male –1.54 (2.18) –5.47 2.18 –.05 –.05 .477

323
Table 163: Genes and Gene Action 2011–12. Linear model of predictors of exam score, with 95% bias
corrected and accelerated confidence intervals. Confidence intervals and standard errors based
on 1000 bootstrap samples.
CI95% for b
Predictor b (S.E) Lower Upper β sr p Adj. R2
F ΔF Sig ΔF
Step 1
Intercept 60.35 (0.74) 58.86 61.67 .001 .05 11.94 11.94 .001
Comm. In 0.19 (0.06) 0.06 0.32 .23 .23 .007
Step 2*
Intercept 60.35 (0.55) 59.26 61.36 .001 .51 109.18 195.40 .000
Comm. In 0.08 (0.04) 0.00 0.17 .09 .09 .095
Pre 0.79 (0.07) 0.65 0.96 .69 .68 .001
Step 3
Intercept 60.64 (0.73) 59.28 61.90 .001 .50 72.74 0.45 .503
Comm. In .08 (0.04) 0.00 0.18 .10 .09 .084
Pre 0.78 (0.08) 0.65 0.96 .68 .66 .001
Scottish –0.76 (1.11) 1.63 –.03 –.03 .500
Step 4
Intercept 58.78 (1.17) 56.54 61.14 .001 .51 73.26 1.21 .272
Comm. In 0.08 (0.05) –0.01 0.19 .10 .10 .075
Pre 0.80 (0.07 0.67 0.93 .70 .68 .001
Major 1.79 (1.31) –0.95 4.65 .05 .05 .178
Step 5
Intercept 60.31 (0.62) 59.01 61.51 .001 .50 72.44 0.01 .922
Comm. In 0.08 (0.04) –0.01 0.17 .09 .09 .072
Pre 0.79 (0.07) 0.64 0.96 .69 .67 .001
Male 0.11 (1.19) –2.24 2.52 .01 .01 .927
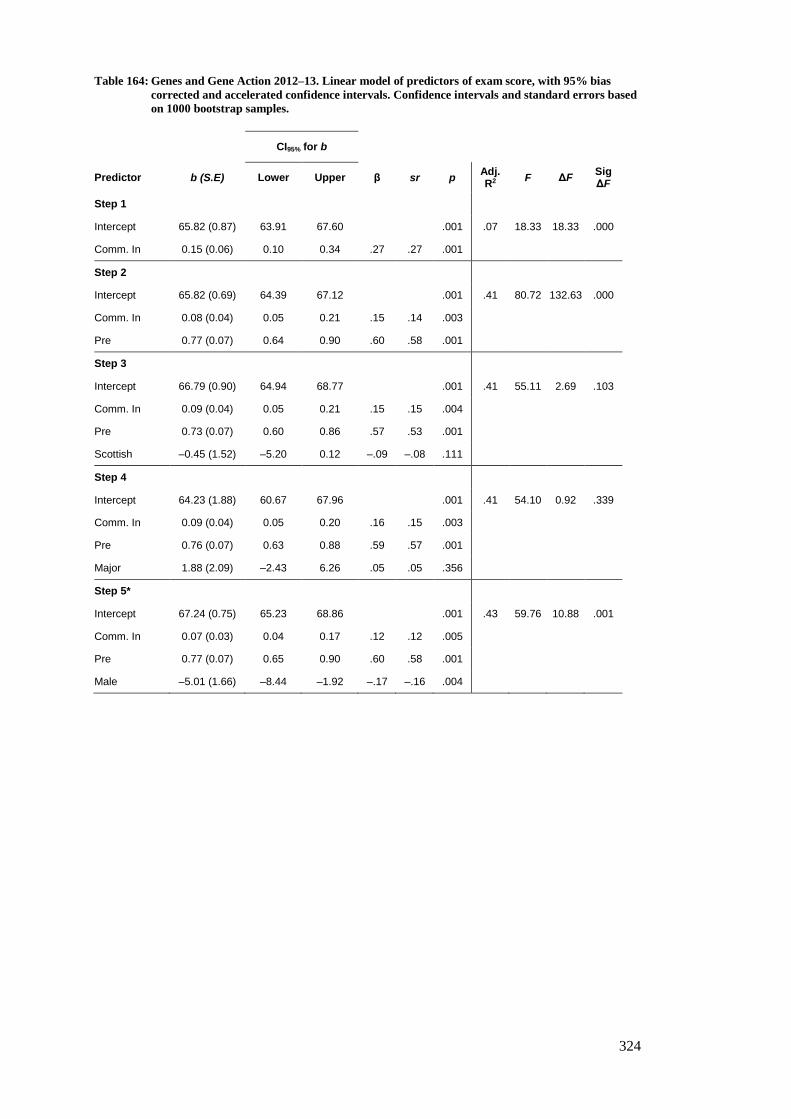
324
Table 164: Genes and Gene Action 2012–13. Linear model of predictors of exam score, with 95% bias
corrected and accelerated confidence intervals. Confidence intervals and standard errors based
on 1000 bootstrap samples.
CI95% for b
Predictor b (S.E) Lower Upper β sr p Adj. R2
F ΔF Sig ΔF
Step 1
Intercept 65.82 (0.87) 63.91 67.60 .001 .07 18.33 18.33 .000
Comm. In 0.15 (0.06) 0.10 0.34 .27 .27 .001
Step 2
Intercept 65.82 (0.69) 64.39 67.12 .001 .41 80.72 132.63 .000
Comm. In 0.08 (0.04) 0.05 0.21 .15 .14 .003
Pre 0.77 (0.07) 0.64 0.90 .60 .58 .001
Step 3
Intercept 66.79 (0.90) 64.94 68.77 .001 .41 55.11 2.69 .103
Comm. In 0.09 (0.04) 0.05 0.21 .15 .15 .004
Pre 0.73 (0.07) 0.60 0.86 .57 .53 .001
Scottish –0.45 (1.52) –5.20 0.12 –.09 –.08 .111
Step 4
Intercept 64.23 (1.88) 60.67 67.96 .001 .41 54.10 0.92 .339
Comm. In 0.09 (0.04) 0.05 0.20 .16 .15 .003
Pre 0.76 (0.07) 0.63 0.88 .59 .57 .001
Major 1.88 (2.09) –2.43 6.26 .05 .05 .356
Step 5*
Intercept 67.24 (0.75) 65.23 68.86 .001 .43 59.76 10.88 .001
Comm. In 0.07 (0.03) 0.04 0.17 .12 .12 .005
Pre 0.77 (0.07) 0.65 0.90 .60 .58 .001
Male –5.01 (1.66) –8.44 –1.92 –.17 –.16 .004
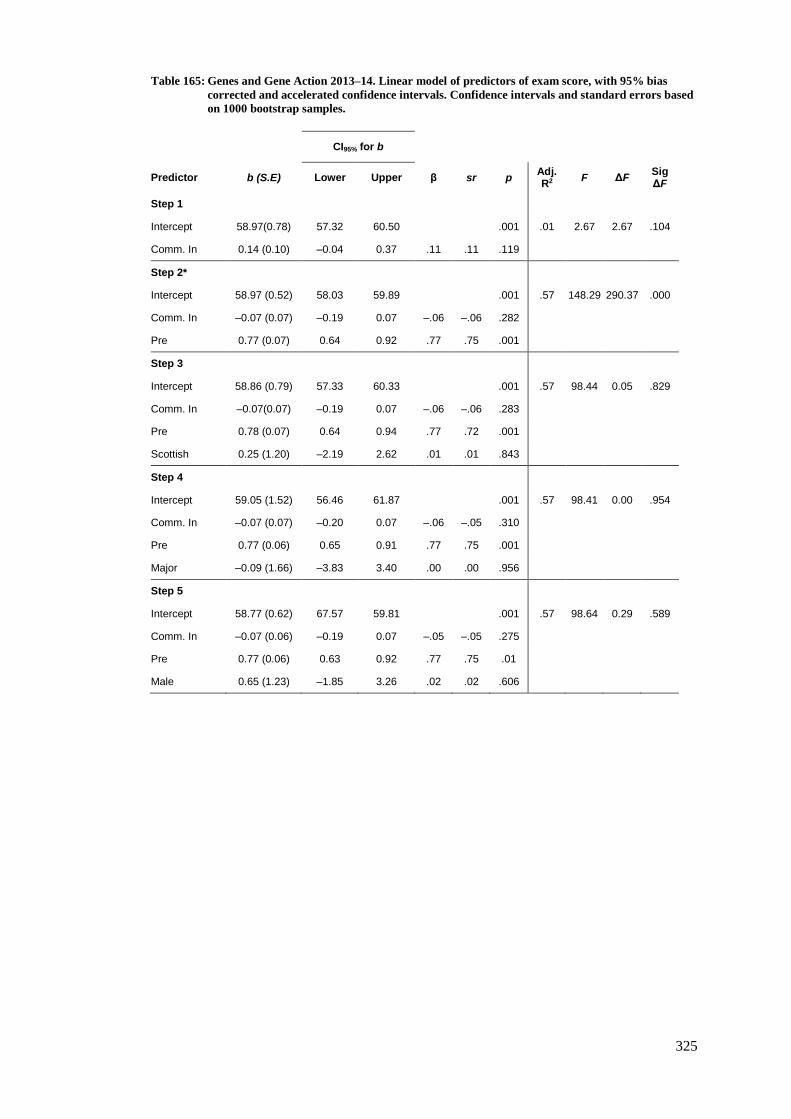
325
Table 165: Genes and Gene Action 2013–14. Linear model of predictors of exam score, with 95% bias
corrected and accelerated confidence intervals. Confidence intervals and standard errors based
on 1000 bootstrap samples.
CI95% for b
Predictor b (S.E) Lower Upper β sr p Adj. R2
F ΔF Sig ΔF
Step 1
Intercept 58.97(0.78) 57.32 60.50 .001 .01 2.67 2.67 .104
Comm. In 0.14 (0.10) –0.04 0.37 .11 .11 .119
Step 2*
Intercept 58.97 (0.52) 58.03 59.89 .001 .57 148.29 290.37 .000
Comm. In –0.07 (0.07) –0.19 0.07 –.06 –.06 .282
Pre 0.77 (0.07) 0.64 0.92 .77 .75 .001
Step 3
Intercept 58.86 (0.79) 57.33 60.33 .001 .57 98.44 0.05 .829
Comm. In –0.07(0.07) –0.19 0.07 –.06 –.06 .283
Pre 0.78 (0.07) 0.64 0.94 .77 .72 .001
Scottish 0.25 (1.20) –2.19 2.62 .01 .01 .843
Step 4
Intercept 59.05 (1.52) 56.46 61.87 .001 .57 98.41 0.00 .954
Comm. In –0.07 (0.07) –0.20 0.07 –.06 –.05 .310
Pre 0.77 (0.06) 0.65 0.91 .77 .75 .001
Major –0.09 (1.66) –3.83 3.40 .00 .00 .956
Step 5
Intercept 58.77 (0.62) 67.57 59.81 .001 .57 98.64 0.29 .589
Comm. In –0.07 (0.06) –0.19 0.07 –.05 –.05 .275
Pre 0.77 (0.06) 0.63 0.92 .77 .75 .01
Male 0.65 (1.23) –1.85 3.26 .02 .02 .606
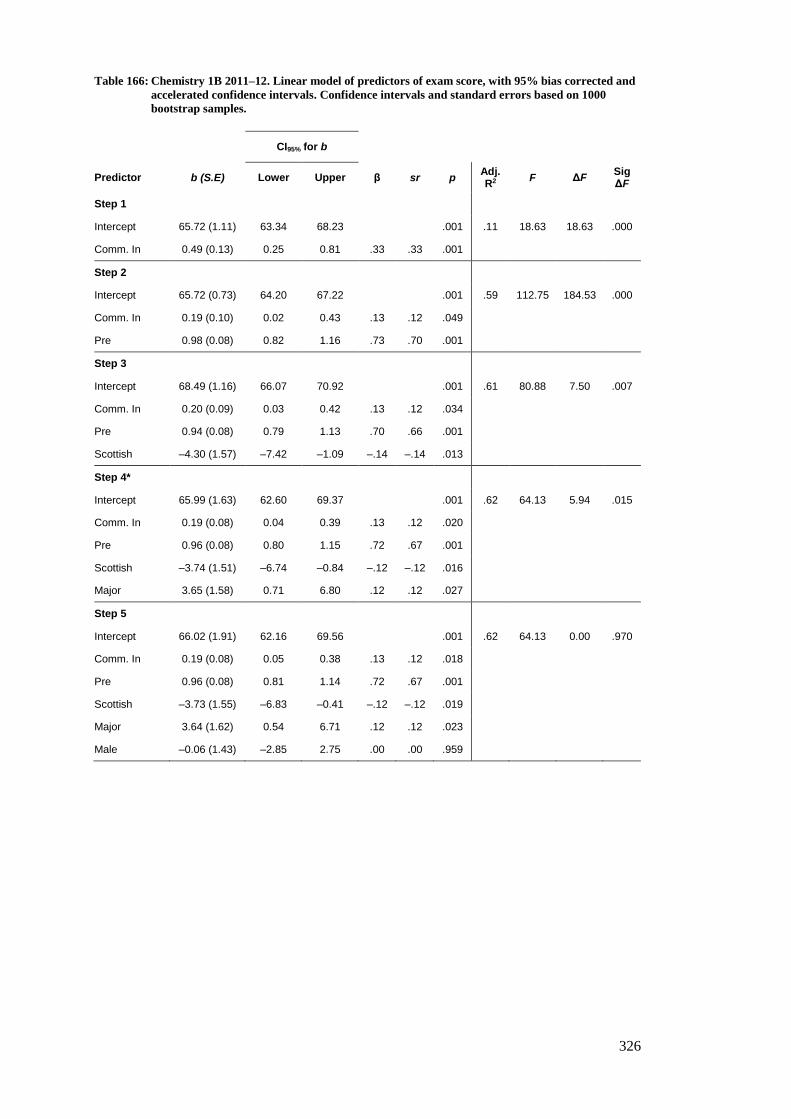
326
Table 166: Chemistry 1B 2011–12. Linear model of predictors of exam score, with 95% bias corrected and
accelerated confidence intervals. Confidence intervals and standard errors based on 1000
bootstrap samples.
CI95% for b
Predictor b (S.E) Lower Upper β sr p Adj. R2
F ΔF Sig ΔF
Step 1
Intercept 65.72 (1.11) 63.34 68.23 .001 .11 18.63 18.63 .000
Comm. In 0.49 (0.13) 0.25 0.81 .33 .33 .001
Step 2
Intercept 65.72 (0.73) 64.20 67.22 .001 .59 112.75 184.53 .000
Comm. In 0.19 (0.10) 0.02 0.43 .13 .12 .049
Pre 0.98 (0.08) 0.82 1.16 .73 .70 .001
Step 3
Intercept 68.49 (1.16) 66.07 70.92 .001 .61 80.88 7.50 .007
Comm. In 0.20 (0.09) 0.03 0.42 .13 .12 .034
Pre 0.94 (0.08) 0.79 1.13 .70 .66 .001
Scottish –4.30 (1.57) –7.42 –1.09 –.14 –.14 .013
Step 4*
Intercept 65.99 (1.63) 62.60 69.37 .001 .62 64.13 5.94 .015
Comm. In 0.19 (0.08) 0.04 0.39 .13 .12 .020
Pre 0.96 (0.08) 0.80 1.15 .72 .67 .001
Scottish –3.74 (1.51) –6.74 –0.84 –.12 –.12 .016
Major 3.65 (1.58) 0.71 6.80 .12 .12 .027
Step 5
Intercept 66.02 (1.91) 62.16 69.56 .001 .62 64.13 0.00 .970
Comm. In 0.19 (0.08) 0.05 0.38 .13 .12 .018
Pre 0.96 (0.08) 0.81 1.14 .72 .67 .001
Scottish –3.73 (1.55) –6.83 –0.41 –.12 –.12 .019
Major 3.64 (1.62) 0.54 6.71 .12 .12 .023
Male –0.06 (1.43) –2.85 2.75 .00 .00 .959
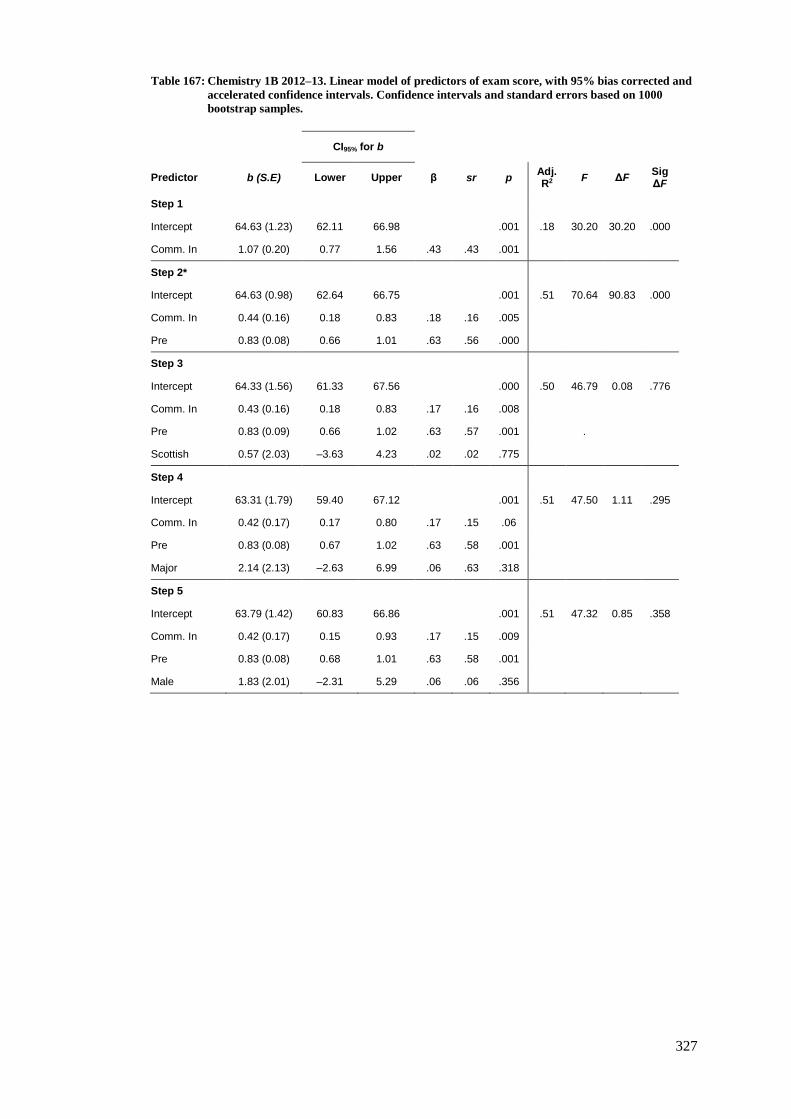
327
Table 167: Chemistry 1B 2012–13. Linear model of predictors of exam score, with 95% bias corrected and
accelerated confidence intervals. Confidence intervals and standard errors based on 1000
bootstrap samples.
CI95% for b
Predictor b (S.E) Lower Upper β sr p Adj. R2
F ΔF Sig ΔF
Step 1
Intercept 64.63 (1.23) 62.11 66.98 .001 .18 30.20 30.20 .000
Comm. In 1.07 (0.20) 0.77 1.56 .43 .43 .001
Step 2*
Intercept 64.63 (0.98) 62.64 66.75 .001 .51 70.64 90.83 .000
Comm. In 0.44 (0.16) 0.18 0.83 .18 .16 .005
Pre 0.83 (0.08) 0.66 1.01 .63 .56 .000
Step 3
Intercept 64.33 (1.56) 61.33 67.56 .000 .50 46.79 0.08 .776
Comm. In 0.43 (0.16) 0.18 0.83 .17 .16 .008
Pre 0.83 (0.09) 0.66 1.02 .63 .57 .001 .
Scottish 0.57 (2.03) –3.63 4.23 .02 .02 .775
Step 4
Intercept 63.31 (1.79) 59.40 67.12 .001 .51 47.50 1.11 .295
Comm. In 0.42 (0.17) 0.17 0.80 .17 .15 .06
Pre 0.83 (0.08) 0.67 1.02 .63 .58 .001
Major 2.14 (2.13) –2.63 6.99 .06 .63 .318
Step 5
Intercept 63.79 (1.42) 60.83 66.86 .001 .51 47.32 0.85 .358
Comm. In 0.42 (0.17) 0.15 0.93 .17 .15 .009
Pre 0.83 (0.08) 0.68 1.01 .63 .58 .001
Male 1.83 (2.01) –2.31 5.29 .06 .06 .356

328
Table 168: Chemistry 1B 2013–14. Linear model of predictors of exam score, with 95% bias corrected and
accelerated confidence intervals. Confidence intervals and standard errors based on 1000
bootstrap samples.
CI95% for b
Predictor b (S.E) Lower Upper β sr p Adj. R2
F ΔF Sig ΔF
Step 1
Intercept 63.88 (1.36) 61.11 66.86 .001 .03 4.07 4.07 .045
Comm. In 0.39 (0.18) 0.06 0.91 .16 .16 .032
Step 2
Intercept 63.88 (0.01) 61.59 66.14 .001 .49 77.85 147.94 .000
Comm. In 1.54 (0.17) –0.23 0.44 .06 .06 .350
Pre 0.81 (0.07) 0.66 0.95 .69 .68 .001
Step 3
Intercept 62.56 (1.50) 59.73 65.60 .001 .49 52.62 1.58 .210
Comm. In 0.16 (0.17) –0.23 0.45 .06 .06 .344
Pre 0.85 (0.08) 0.68 1.02 .73 .64 .001
Scottish 2.74 (2.21) –1.34 7.63 .08 .07 .218
Step 4*
Intercept 66.46 (1.56) 62.92 69.75 .001 .50 55.18 5.50 .020
Comm. In 0.16 (0.17) –0.20 –0.49 .07 .07 .309
Pre 0.81 (0.07) 0.66 0.96 .69 .69 .001
Major –4.55 (1.95) –7.92 –1.35 –.13 –.13 .025
Step 5
Intercept 61.39 (1.40) 58.83 63.88 .001 .49 53.96 3.62 .059
Comm. In 0.15 (0.17) –0.23 0.45 .06 .06 .394
Pre 0.81 (0.07) 0.67 0.96 .70 .69 .001
Male 3.85 (1.90) 0.28 7.96 .11 .11 .046

329
Table 169: Glasgow Physics 2011–12. Linear model of predictors of exam score, with 95% bias corrected
and accelerated confidence intervals. Confidence intervals and standard errors based on 1000
bootstrap samples.
CI95% for b
Predictor b (S.E) Lower Upper β sr p Adj. R2
F ΔF Sig ΔF
Step 1
Intercept 51.85 (1.62) 48.45 55.04 .001 .09 13.12 13.12 .000
Comm. In. 0.61 (0.16) 0.36 1.03 .30 .30 .001
Step 2*
Intercept 51.85 (1.19) 49.48 54.21 .001 .51 71.37 118.29 .000
Comm. In. 0.36 (0.13) 0.15 0.72 .18 .17 .007
Pre 0.60 (0.05) 0.48 0.70 .66 .65 .001
Step 3
Intercept 50.15 (2.36) 45.48 55.50 .001 .51 47.63 0.59 .445
Comm. In 0.37 (0.14) 0.15 0.74 .18 .18 .007
Pre 0.59 (0.06) 0.47 0.70 .66 .64 .001
Male 2.19 (2.74) –3.39 7.65 .05 .05 .424
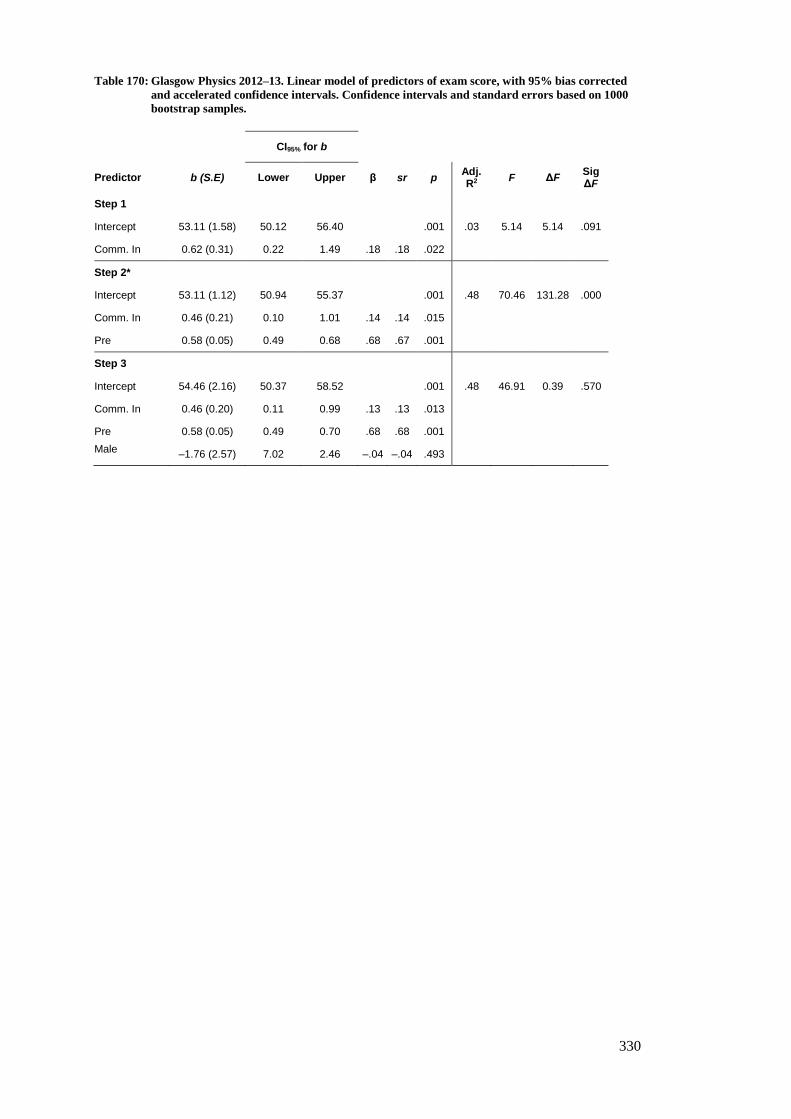
330
Table 170: Glasgow Physics 2012–13. Linear model of predictors of exam score, with 95% bias corrected
and accelerated confidence intervals. Confidence intervals and standard errors based on 1000
bootstrap samples.
CI95% for b
Predictor b (S.E) Lower Upper β sr p Adj. R2
F ΔF Sig ΔF
Step 1
Intercept 53.11 (1.58) 50.12 56.40 .001 .03 5.14 5.14 .091
Comm. In 0.62 (0.31) 0.22 1.49 .18 .18 .022
Step 2*
Intercept 53.11 (1.12) 50.94 55.37 .001 .48 70.46 131.28 .000
Comm. In 0.46 (0.21) 0.10 1.01 .14 .14 .015
Pre 0.58 (0.05) 0.49 0.68 .68 .67 .001
Step 3
Intercept 54.46 (2.16) 50.37 58.52 .001 .48 46.91 0.39 .570
Comm. In 0.46 (0.20) 0.11 0.99 .13 .13 .013
Pre 0.58 (0.05) 0.49 0.70 .68 .68 .001
Male –1.76 (2.57) 7.02 2.46 –.04 –.04 .493

331
Table 171: Glasgow Physics 2013–14. Linear model of predictors of exam score, with 95% bias corrected
and accelerated confidence intervals. Confidence intervals and standard errors based on 1000
bootstrap samples.
CI95% for b
Predictor b (S.E) Lower Upper β sr p Adj. R2
F ΔF Sig ΔF
Step 1
Intercept 48.91 (1.51) 45.92 52.13 .001 .06 7.95 7.95 .006
Comm. In 0.69 (0.27) 0.24 1.51 .24 .24 .010
Step 2*
Intercept 48.91 (1.23) 46.46 51.69 .001 .36 38.29 64.76 .000
Comm. In 0.45 (0.17) 0.19 0.90 .16 .15 .006
Pre 0.56 (0.07) 0.41 0.67 .56 .56 .001
Step 3
Intercept 46.94 (2.82) 41.85 52.18 .001 .36 25.64 0.57 .000
Comm. In 0.44 (0.17) 0.19 0.93 .15 .15 .007
Pre 0.55 (0.70) 0.41 0.67 .57 .56 .001
Male 2.46 (3.20) –4.13 8.93 .05 .05 .474
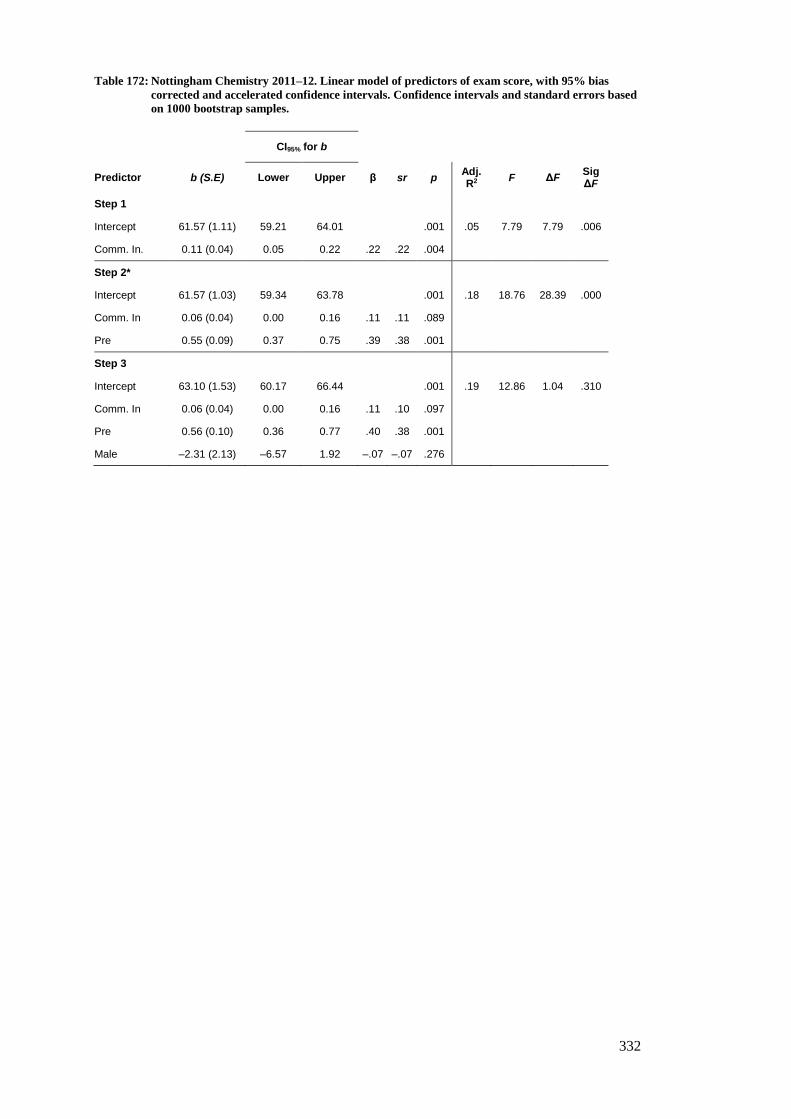
332
Table 172: Nottingham Chemistry 2011–12. Linear model of predictors of exam score, with 95% bias
corrected and accelerated confidence intervals. Confidence intervals and standard errors based
on 1000 bootstrap samples.
CI95% for b
Predictor b (S.E) Lower Upper β sr p Adj. R2
F ΔF Sig ΔF
Step 1
Intercept 61.57 (1.11) 59.21 64.01 .001 .05 7.79 7.79 .006
Comm. In. 0.11 (0.04) 0.05 0.22 .22 .22 .004
Step 2*
Intercept 61.57 (1.03) 59.34 63.78 .001 .18 18.76 28.39 .000
Comm. In 0.06 (0.04) 0.00 0.16 .11 .11 .089
Pre 0.55 (0.09) 0.37 0.75 .39 .38 .001
Step 3
Intercept 63.10 (1.53) 60.17 66.44 .001 .19 12.86 1.04 .310
Comm. In 0.06 (0.04) 0.00 0.16 .11 .10 .097
Pre 0.56 (0.10) 0.36 0.77 .40 .38 .001
Male –2.31 (2.13) –6.57 1.92 –.07 –.07 .276
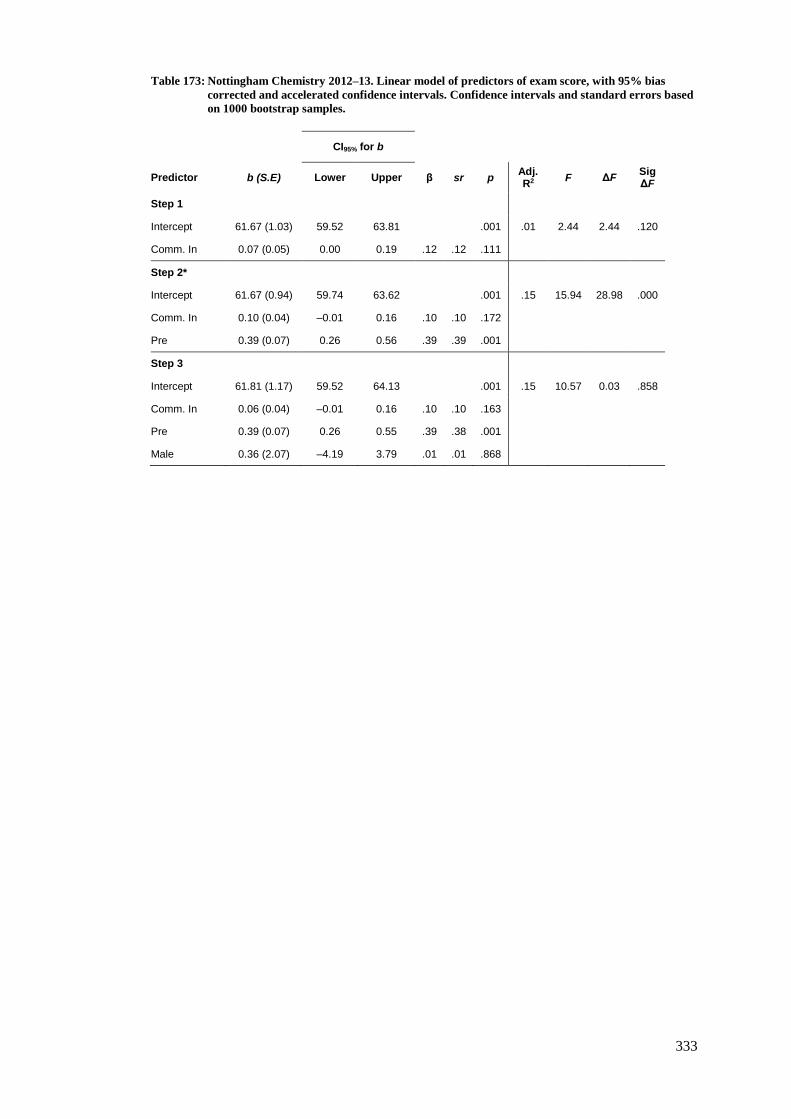
333
Table 173: Nottingham Chemistry 2012–13. Linear model of predictors of exam score, with 95% bias
corrected and accelerated confidence intervals. Confidence intervals and standard errors based
on 1000 bootstrap samples.
CI95% for b
Predictor b (S.E) Lower Upper β sr p Adj. R2
F ΔF Sig ΔF
Step 1
Intercept 61.67 (1.03) 59.52 63.81 .001 .01 2.44 2.44 .120
Comm. In 0.07 (0.05) 0.00 0.19 .12 .12 .111
Step 2*
Intercept 61.67 (0.94) 59.74 63.62 .001 .15 15.94 28.98 .000
Comm. In 0.10 (0.04) –0.01 0.16 .10 .10 .172
Pre 0.39 (0.07) 0.26 0.56 .39 .39 .001
Step 3
Intercept 61.81 (1.17) 59.52 64.13 .001 .15 10.57 0.03 .858
Comm. In 0.06 (0.04) –0.01 0.16 .10 .10 .163
Pre 0.39 (0.07) 0.26 0.55 .39 .38 .001
Male 0.36 (2.07) –4.19 3.79 .01 .01 .868

334
Table 174: Nottingham Chemistry 2013–14. Linear model of predictors of exam score, with 95% bias
corrected and accelerated confidence intervals. Confidence intervals and standard errors based
on 1000 bootstrap samples.
CI95% for b
Predictor b (S.E) Lower Upper β sr p Adj. R2
F ΔF Sig ΔF
Step 1
Intercept 64.85 (1.03) 62.66 67.15 .001 .04 6.20 6.20 .014
Comm. In 0.32 (0.17) 0.11 0.87 .20 .20 .025
Step 2*
Intercept 64.85 (0.95) 62.75 66.96 .001 .19 18.55 29.73 .000
Comm. In 0.22 (0.16) –0.08 0.62 .11 .11 .158
Pre 0.41 (0.08) 0.24 0.55 .41 .40 .001
Step 3
Intercept 64.77 (1.43) 61.69 67.52 .001 .18 12.29 0.00 .948
Comm. In 0.22 (0.16) –0.07 0.63 .11 .11 .161
Pre 0.41 (0.08) 0.23 0.55 .41 .40 .001
Male 0.13 (1.96) –3.55 4.17 .01 .01 .932
335
Appendix H
Multiple regression models examining the
relationship between the multiple measure of
PeerWise activity and exam score
In each of the following tables, the best model, as discussed in the main text, is indicated by
an asterisk (*).

336
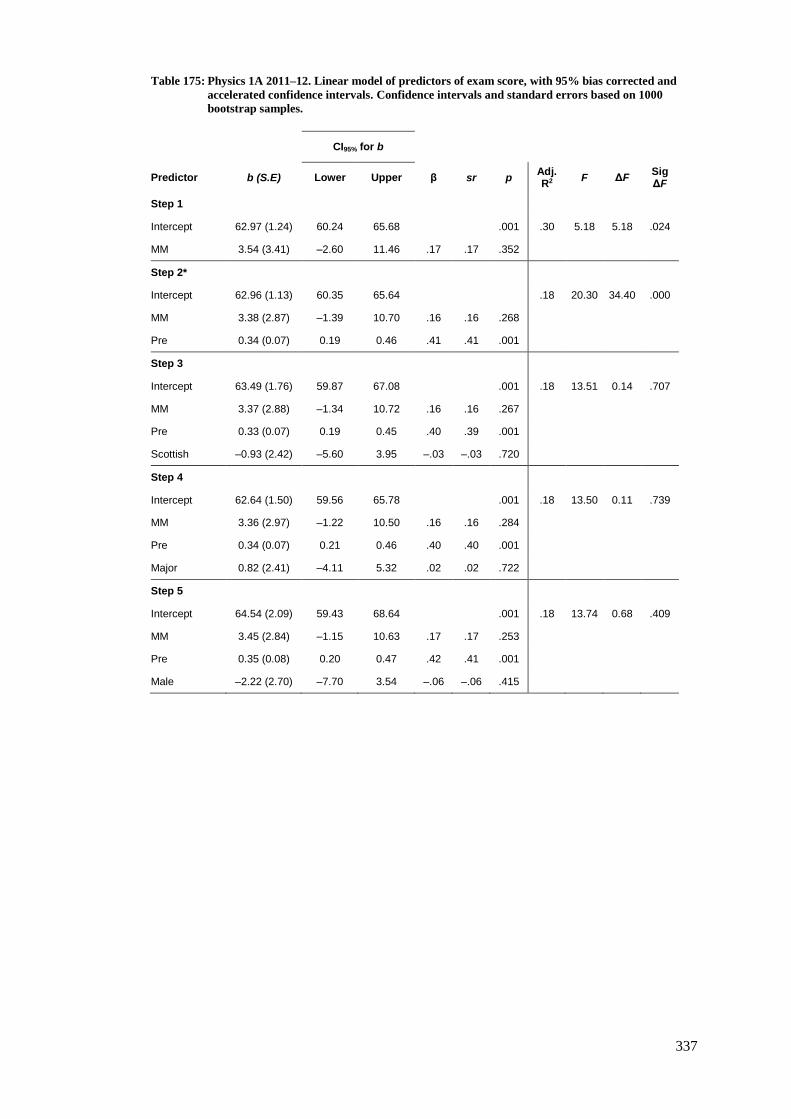
337
Table 175: Physics 1A 2011–12. Linear model of predictors of exam score, with 95% bias corrected and
accelerated confidence intervals. Confidence intervals and standard errors based on 1000
bootstrap samples.
CI95% for b
Predictor b (S.E) Lower Upper β sr p Adj. R2
F ΔF Sig ΔF
Step 1
Intercept 62.97 (1.24) 60.24 65.68 .001 .30 5.18 5.18 .024
MM 3.54 (3.41) –2.60 11.46 .17 .17 .352
Step 2*
Intercept 62.96 (1.13) 60.35 65.64 .18 20.30 34.40 .000
MM 3.38 (2.87) –1.39 10.70 .16 .16 .268
Pre 0.34 (0.07) 0.19 0.46 .41 .41 .001
Step 3
Intercept 63.49 (1.76) 59.87 67.08 .001 .18 13.51 0.14 .707
MM 3.37 (2.88) –1.34 10.72 .16 .16 .267
Pre 0.33 (0.07) 0.19 0.45 .40 .39 .001
Scottish –0.93 (2.42) –5.60 3.95 –.03 –.03 .720
Step 4
Intercept 62.64 (1.50) 59.56 65.78 .001 .18 13.50 0.11 .739
MM 3.36 (2.97) –1.22 10.50 .16 .16 .284
Pre 0.34 (0.07) 0.21 0.46 .40 .40 .001
Major 0.82 (2.41) –4.11 5.32 .02 .02 .722
Step 5
Intercept 64.54 (2.09) 59.43 68.64 .001 .18 13.74 0.68 .409
MM 3.45 (2.84) –1.15 10.63 .17 .17 .253
Pre 0.35 (0.08) 0.20 0.47 .42 .41 .001
Male –2.22 (2.70) –7.70 3.54 –.06 –.06 .415

338
Table 176: Physics 1A 2012–13. Linear model of predictors of exam score, with 95% bias corrected and
accelerated confidence intervals. Confidence intervals and standard errors based on 1000
bootstrap samples.
CI95% for b
Predictor b (S.E) Lower Upper β sr p Adj. R2 F ΔF Sig ΔF
Step 1
Intercept 68.52 (0.97) 66.49 70.57 .001 .82 21.84 21.84 .000
MM 5.89 (1.14) 3.88 8.69 .29 .29 .001
Step 2
Intercept 68.52 (0.89) 66.63 70.52 .001 .24 40.34 54.06 .000
MM 4.36 (1.26) 2.10 7.66 .21 .21 .002
Pre 0.41 (0.06) 0.28 0.54 .42 .41 .001
Step 3*
Intercept 72.29 (1.24) 69.96 74.61 .001 .28 32.94 13.85 .000
MM 4.72 (1.20) 2.28 7.43 .22 .22 .002
Pre 0.37 (0.06) 0.24 0.50 .37 .36 .001
Scottish –6.74 (1.85) –10.62 –2.59 –.21 –.20 .001
Step 4
Intercept 71.10 (1.44) 68.34 73.76 .001 .29 25.71 3.15 .077
MM 4.65 (1.18) 2.46 7.43 .23 .22 .001
Pre 0.36 (0.06) 0.22 0.49 .36 .34 .001
Scottish –6.78 (1.83) –10.69 –2.65 –.21 –.21 .001
Major 3.25 (1.82) –0.66 6.88 .10 .02 .083
Step 5
Intercept 73.36 (1.24) 70.81 75.78 .001 .29 25.79 3.38 .067
MM 4.79 (1.19) 2.95 7.31 .23 .23 .001
Pre 0.33 (0.06) 0.21 1.45 .34 .31 .001
Scottish –7.18 (1.82) –10.87 –3.36 –.22 –.22 .001
Male –4.40 (2.30) –9.40 0.05 –.11 –.10 .058
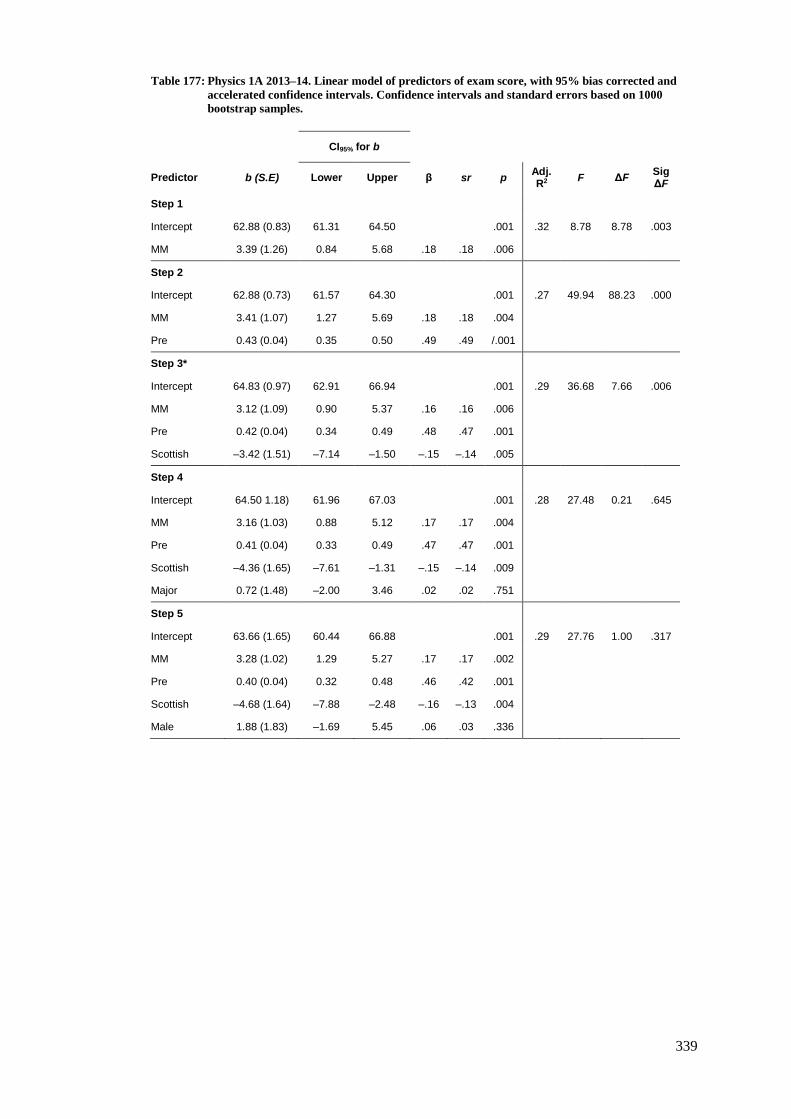
339
Table 177: Physics 1A 2013–14. Linear model of predictors of exam score, with 95% bias corrected and
accelerated confidence intervals. Confidence intervals and standard errors based on 1000
bootstrap samples.
CI95% for b
Predictor b (S.E) Lower Upper β sr p Adj. R2
F ΔF Sig ΔF
Step 1
Intercept 62.88 (0.83) 61.31 64.50 .001 .32 8.78 8.78 .003
MM 3.39 (1.26) 0.84 5.68 .18 .18 .006
Step 2
Intercept 62.88 (0.73) 61.57 64.30 .001 .27 49.94 88.23 .000
MM 3.41 (1.07) 1.27 5.69 .18 .18 .004
Pre 0.43 (0.04) 0.35 0.50 .49 .49 /.001
Step 3*
Intercept 64.83 (0.97) 62.91 66.94 .001 .29 36.68 7.66 .006
MM 3.12 (1.09) 0.90 5.37 .16 .16 .006
Pre 0.42 (0.04) 0.34 0.49 .48 .47 .001
Scottish –3.42 (1.51) –7.14 –1.50 –.15 –.14 .005
Step 4
Intercept 64.50 1.18) 61.96 67.03 .001 .28 27.48 0.21 .645
MM 3.16 (1.03) 0.88 5.12 .17 .17 .004
Pre 0.41 (0.04) 0.33 0.49 .47 .47 .001
Scottish –4.36 (1.65) –7.61 –1.31 –.15 –.14 .009
Major 0.72 (1.48) –2.00 3.46 .02 .02 .751
Step 5
Intercept 63.66 (1.65) 60.44 66.88 .001 .29 27.76 1.00 .317
MM 3.28 (1.02) 1.29 5.27 .17 .17 .002
Pre 0.40 (0.04) 0.32 0.48 .46 .42 .001
Scottish –4.68 (1.64) –7.88 –2.48 –.16 –.13 .004
Male 1.88 (1.83) –1.69 5.45 .06 .03 .336
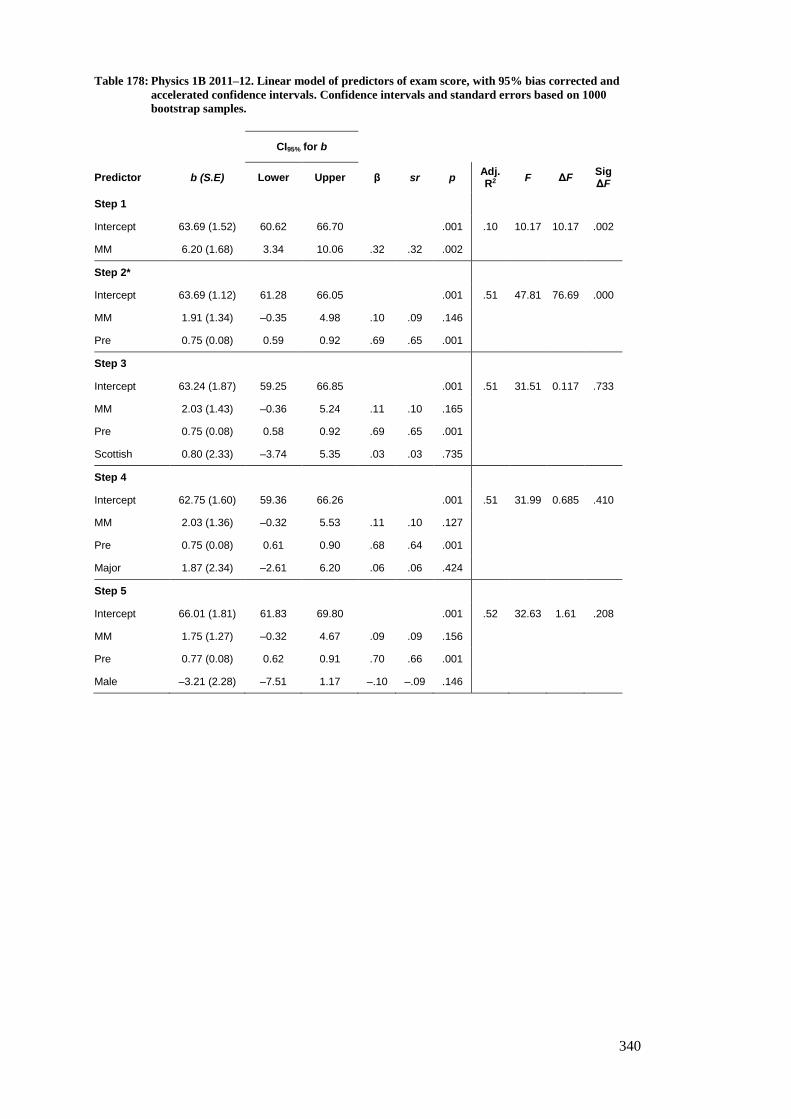
340
Table 178: Physics 1B 2011–12. Linear model of predictors of exam score, with 95% bias corrected and
accelerated confidence intervals. Confidence intervals and standard errors based on 1000
bootstrap samples.
CI95% for b
Predictor b (S.E) Lower Upper β sr p Adj. R2
F ΔF Sig ΔF
Step 1
Intercept 63.69 (1.52) 60.62 66.70 .001 .10 10.17 10.17 .002
MM 6.20 (1.68) 3.34 10.06 .32 .32 .002
Step 2*
Intercept 63.69 (1.12) 61.28 66.05 .001 .51 47.81 76.69 .000
MM 1.91 (1.34) –0.35 4.98 .10 .09 .146
Pre 0.75 (0.08) 0.59 0.92 .69 .65 .001
Step 3
Intercept 63.24 (1.87) 59.25 66.85 .001 .51 31.51 0.117 .733
MM 2.03 (1.43) –0.36 5.24 .11 .10 .165
Pre 0.75 (0.08) 0.58 0.92 .69 .65 .001
Scottish 0.80 (2.33) –3.74 5.35 .03 .03 .735
Step 4
Intercept 62.75 (1.60) 59.36 66.26 .001 .51 31.99 0.685 .410
MM 2.03 (1.36) –0.32 5.53 .11 .10 .127
Pre 0.75 (0.08) 0.61 0.90 .68 .64 .001
Major 1.87 (2.34) –2.61 6.20 .06 .06 .424
Step 5
Intercept 66.01 (1.81) 61.83 69.80 .001 .52 32.63 1.61 .208
MM 1.75 (1.27) –0.32 4.67 .09 .09 .156
Pre 0.77 (0.08) 0.62 0.91 .70 .66 .001
Male –3.21 (2.28) –7.51 1.17 –.10 –.09 .146
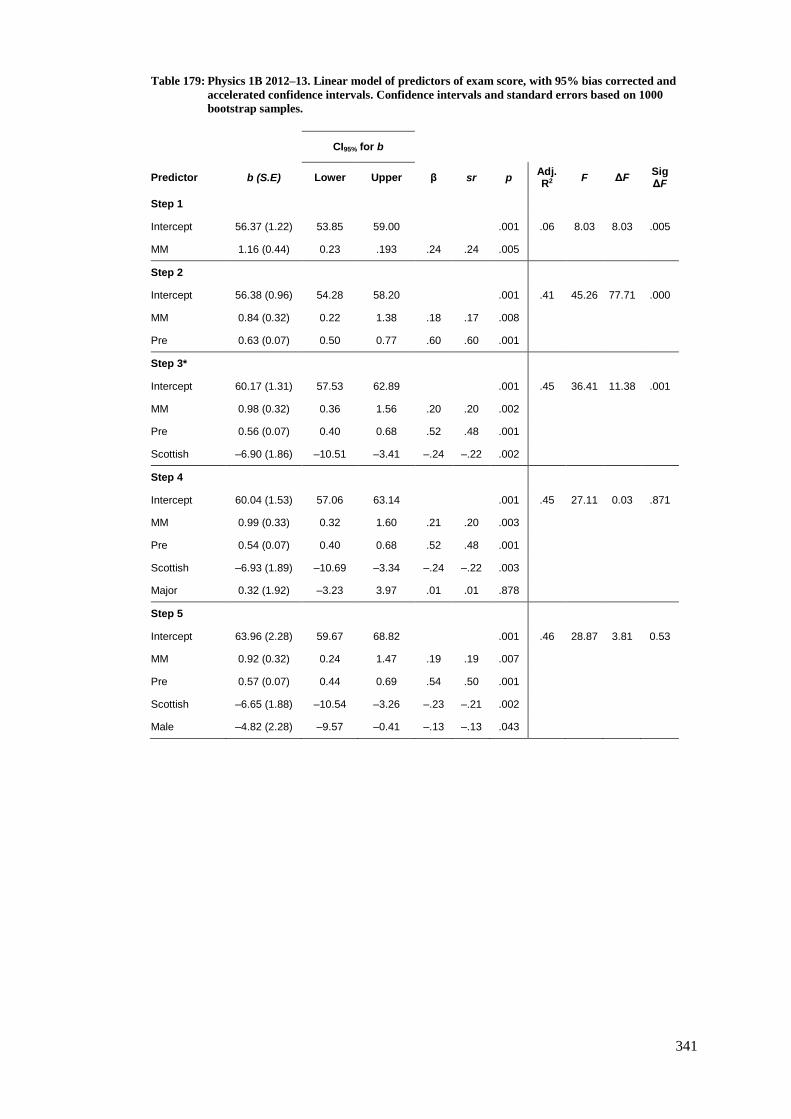
341
Table 179: Physics 1B 2012–13. Linear model of predictors of exam score, with 95% bias corrected and
accelerated confidence intervals. Confidence intervals and standard errors based on 1000
bootstrap samples.
CI95% for b
Predictor b (S.E) Lower Upper β sr p Adj. R2
F ΔF Sig ΔF
Step 1
Intercept 56.37 (1.22) 53.85 59.00 .001 .06 8.03 8.03 .005
MM 1.16 (0.44) 0.23 .193 .24 .24 .005
Step 2
Intercept 56.38 (0.96) 54.28 58.20 .001 .41 45.26 77.71 .000
MM 0.84 (0.32) 0.22 1.38 .18 .17 .008
Pre 0.63 (0.07) 0.50 0.77 .60 .60 .001
Step 3*
Intercept 60.17 (1.31) 57.53 62.89 .001 .45 36.41 11.38 .001
MM 0.98 (0.32) 0.36 1.56 .20 .20 .002
Pre 0.56 (0.07) 0.40 0.68 .52 .48 .001
Scottish –6.90 (1.86) –10.51 –3.41 –.24 –.22 .002
Step 4
Intercept 60.04 (1.53) 57.06 63.14 .001 .45 27.11 0.03 .871
MM 0.99 (0.33) 0.32 1.60 .21 .20 .003
Pre 0.54 (0.07) 0.40 0.68 .52 .48 .001
Scottish –6.93 (1.89) –10.69 –3.34 –.24 –.22 .003
Major 0.32 (1.92) –3.23 3.97 .01 .01 .878
Step 5
Intercept 63.96 (2.28) 59.67 68.82 .001 .46 28.87 3.81 0.53
MM 0.92 (0.32) 0.24 1.47 .19 .19 .007
Pre 0.57 (0.07) 0.44 0.69 .54 .50 .001
Scottish –6.65 (1.88) –10.54 –3.26 –.23 –.21 .002
Male –4.82 (2.28) –9.57 –0.41 –.13 –.13 .043
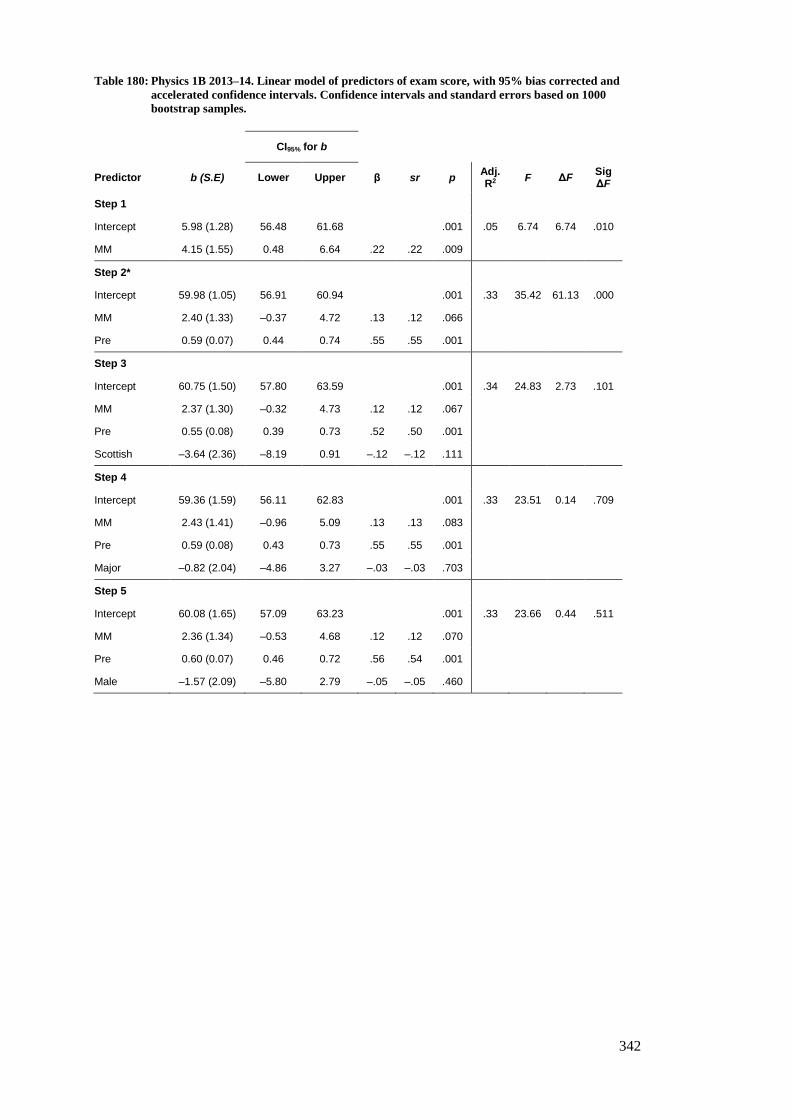
342
Table 180: Physics 1B 2013–14. Linear model of predictors of exam score, with 95% bias corrected and
accelerated confidence intervals. Confidence intervals and standard errors based on 1000
bootstrap samples.
CI95% for b
Predictor b (S.E) Lower Upper β sr p Adj. R2
F ΔF Sig ΔF
Step 1
Intercept 5.98 (1.28) 56.48 61.68 .001 .05 6.74 6.74 .010
MM 4.15 (1.55) 0.48 6.64 .22 .22 .009
Step 2*
Intercept 59.98 (1.05) 56.91 60.94 .001 .33 35.42 61.13 .000
MM 2.40 (1.33) –0.37 4.72 .13 .12 .066
Pre 0.59 (0.07) 0.44 0.74 .55 .55 .001
Step 3
Intercept 60.75 (1.50) 57.80 63.59 .001 .34 24.83 2.73 .101
MM 2.37 (1.30) –0.32 4.73 .12 .12 .067
Pre 0.55 (0.08) 0.39 0.73 .52 .50 .001
Scottish –3.64 (2.36) –8.19 0.91 –.12 –.12 .111
Step 4
Intercept 59.36 (1.59) 56.11 62.83 .001 .33 23.51 0.14 .709
MM 2.43 (1.41) –0.96 5.09 .13 .13 .083
Pre 0.59 (0.08) 0.43 0.73 .55 .55 .001
Major –0.82 (2.04) –4.86 3.27 –.03 –.03 .703
Step 5
Intercept 60.08 (1.65) 57.09 63.23 .001 .33 23.66 0.44 .511
MM 2.36 (1.34) –0.53 4.68 .12 .12 .070
Pre 0.60 (0.07) 0.46 0.72 .56 .54 .001
Male –1.57 (2.09) –5.80 2.79 –.05 –.05 .460
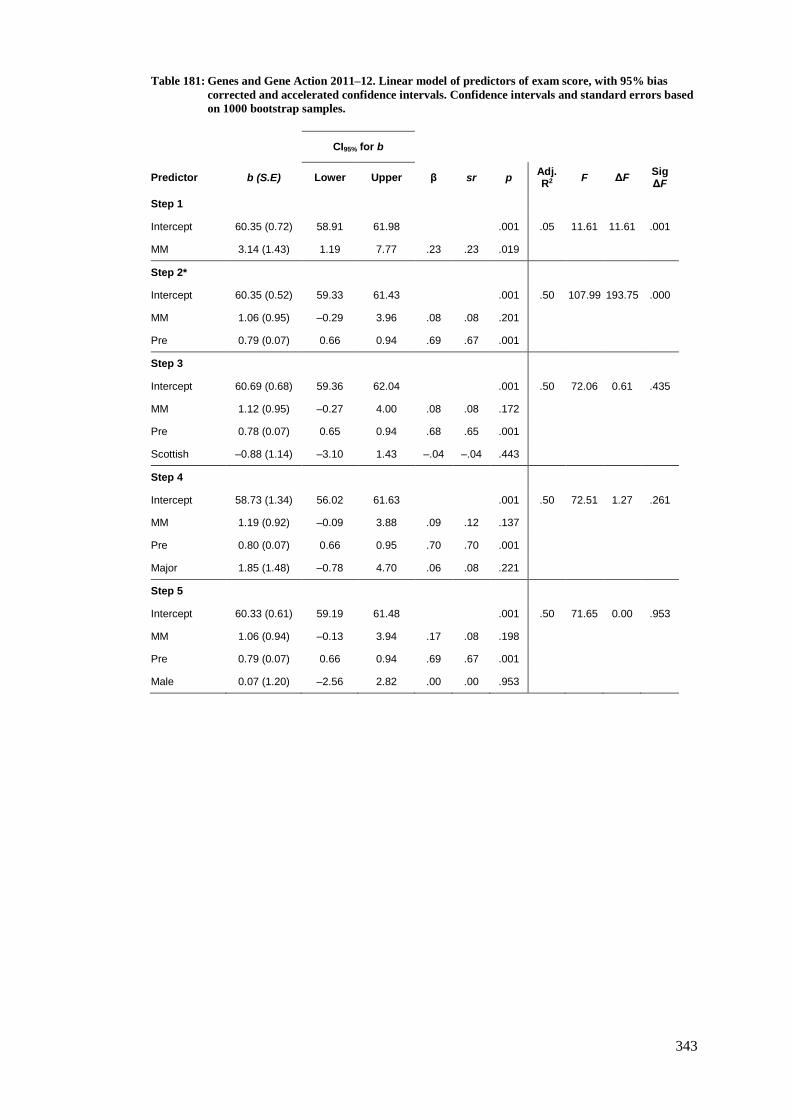
343
Table 181: Genes and Gene Action 2011–12. Linear model of predictors of exam score, with 95% bias
corrected and accelerated confidence intervals. Confidence intervals and standard errors based
on 1000 bootstrap samples.
CI95% for b
Predictor b (S.E) Lower Upper β sr p Adj. R2
F ΔF Sig ΔF
Step 1
Intercept 60.35 (0.72) 58.91 61.98 .001 .05 11.61 11.61 .001
MM 3.14 (1.43) 1.19 7.77 .23 .23 .019
Step 2*
Intercept 60.35 (0.52) 59.33 61.43 .001 .50 107.99 193.75 .000
MM 1.06 (0.95) –0.29 3.96 .08 .08 .201
Pre 0.79 (0.07) 0.66 0.94 .69 .67 .001
Step 3
Intercept 60.69 (0.68) 59.36 62.04 .001 .50 72.06 0.61 .435
MM 1.12 (0.95) –0.27 4.00 .08 .08 .172
Pre 0.78 (0.07) 0.65 0.94 .68 .65 .001
Scottish –0.88 (1.14) –3.10 1.43 –.04 –.04 .443
Step 4
Intercept 58.73 (1.34) 56.02 61.63 .001 .50 72.51 1.27 .261
MM 1.19 (0.92) –0.09 3.88 .09 .12 .137
Pre 0.80 (0.07) 0.66 0.95 .70 .70 .001
Major 1.85 (1.48) –0.78 4.70 .06 .08 .221
Step 5
Intercept 60.33 (0.61) 59.19 61.48 .001 .50 71.65 0.00 .953
MM 1.06 (0.94) –0.13 3.94 .17 .08 .198
Pre 0.79 (0.07) 0.66 0.94 .69 .67 .001
Male 0.07 (1.20) –2.56 2.82 .00 .00 .953

344
Table 182: Genes and Gene Action 2012–13. Linear model of predictors of exam score, with 95% bias
corrected and accelerated confidence intervals. Confidence intervals and standard errors based
on 1000 bootstrap samples.
CI95% for b
Predictor b (S.E) Lower Upper β sr p Adj. R2
F ΔF Sig ΔF
Step 1
Intercept 65.82 (0.90) 63.99 67.66 .001 .08 18.78 18.78 .000
MM 4.39 (1.37) 3.08 9.18 .28 .28 .001
Step 2
Intercept 65.82 (0.70) 64.38 67.17 .001 .41 82.46 135.18 .000
MM 2.61 (0.90) 1.66 5.44 .16 .16 .003
Pre 0.77 (0.08) 0.63 0.93 .60 .59 .001
Step 3
Intercept 66.72 (0.91) 64.97 68.57 .001 .42 56.07 2.33 .128
MM 2.64 (0.95) 0.40 1.51 .17 .16 .003
Pre 0.74 (0.08) 0.59 0.88 .57 .53 .001
Scottish –2.27 (1.53) –5.10 0.62 –.08 –.08 .137
Step 4
Intercept 64.13 (1.78) 60.67 67.77 .001 .41 55.33 1.04 .308
MM 2.77 (0.95) 0.41 1.50 .17 .17 .002
Pre 0.76 (0.07) 0.62 0.89 .59 .57 .001
Major 1.99 (1.96) –2.12 5.88 .05 .05 .316
Step 5*
Intercept 67.19 (0.75) 65.80 68.53 .001 .44 60.46 9.98 .002
MM 2.17 (0.80) 1.31 4.55 .14 .13 .004
Pre 0.77 (0.07) 0.64 0.92 .60 .59 .001
Male –4.81 (1.74) –8.35 –1.21 –.16 –.16 .006

345
Table 183: Genes and Gene Action 2013–14. Linear model of predictors of exam score, with 95% bias
corrected and accelerated confidence intervals. Confidence intervals and standard errors based
on 1000 bootstrap samples.
CI95% for b
Predictor b (S.E) Lower Upper β sr p Adj. R2
F ΔF Sig ΔF
Step 1
Intercept 58.97 (0.81) 57.43 60.85 .001 .02 4.65 4.65 .023
MM 2.49 (1.23) 0.39 5.61 .15 .15 .035
Step 2*
Intercept 58.97 (0.54) 57.88 60.17 .001 .57 146.89 283.11 .000
MM 0.46 (0.75) –1.23 1.98 .03 .03 .549
Pre 0.76 (0.06) 0.64 0.89 .75 .74 .001
Step 3
Intercept 59.80 (0.82) 57.35 60.49 .001 .57 97.49 0.02 .883
MM 0.45 (0.75) –1.22 1.98 .03 .03 .551
Pre 0.76 (0.07) 0.63 0.91 .76 .71 .001
Scottish 0.17 (1.22) –2.16 2.69 .01 .01 .880
Step 4
Intercept 58.62 (1.34) 56.19 61.11 .001 .57 97.53 0.07 .799
MM 0.48 (0.75) –1.04 1.97 .03 .03 .511
Pre 0.76 (0.06) 0.65 0.89 .75 .74 .001
Major 0.41 (1.46) –2.57 3.43 .01 .01 .783
Step 5
Intercept 58.62 (0.63) 57.20 59.91 .001 .57 98.16 0.87 .351
MM 0.65 (0.76) –1.03 2.11 .04 .04 .374
Pre 0.76 (0.06) 0.63 0.90 .75 .75 .001
Male 1.14 (1.23) –1.21 3.50 .04 .04 .366
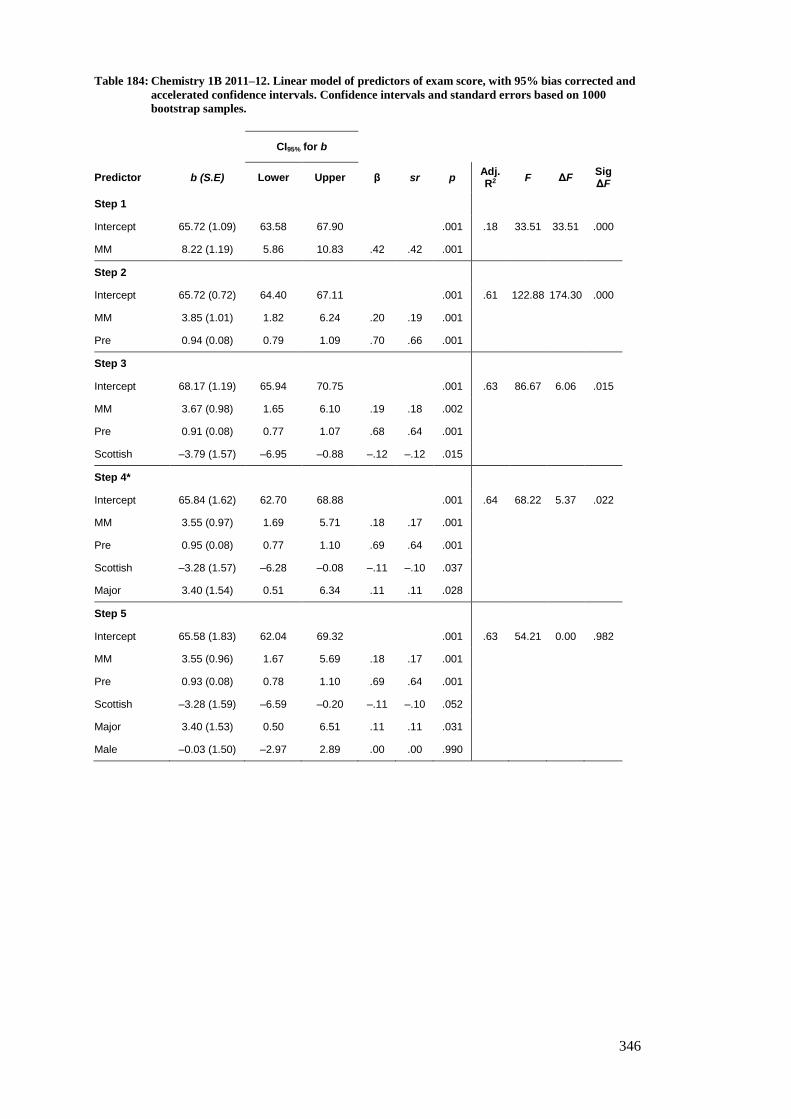
346
Table 184: Chemistry 1B 2011–12. Linear model of predictors of exam score, with 95% bias corrected and
accelerated confidence intervals. Confidence intervals and standard errors based on 1000
bootstrap samples.
CI95% for b
Predictor b (S.E) Lower Upper β sr p Adj. R2
F ΔF Sig ΔF
Step 1
Intercept 65.72 (1.09) 63.58 67.90 .001 .18 33.51 33.51 .000
MM 8.22 (1.19) 5.86 10.83 .42 .42 .001
Step 2
Intercept 65.72 (0.72) 64.40 67.11 .001 .61 122.88 174.30 .000
MM 3.85 (1.01) 1.82 6.24 .20 .19 .001
Pre 0.94 (0.08) 0.79 1.09 .70 .66 .001
Step 3
Intercept 68.17 (1.19) 65.94 70.75 .001 .63 86.67 6.06 .015
MM 3.67 (0.98) 1.65 6.10 .19 .18 .002
Pre 0.91 (0.08) 0.77 1.07 .68 .64 .001
Scottish –3.79 (1.57) –6.95 –0.88 –.12 –.12 .015
Step 4*
Intercept 65.84 (1.62) 62.70 68.88 .001 .64 68.22 5.37 .022
MM 3.55 (0.97) 1.69 5.71 .18 .17 .001
Pre 0.95 (0.08) 0.77 1.10 .69 .64 .001
Scottish –3.28 (1.57) –6.28 –0.08 –.11 –.10 .037
Major 3.40 (1.54) 0.51 6.34 .11 .11 .028
Step 5
Intercept 65.58 (1.83) 62.04 69.32 .001 .63 54.21 0.00 .982
MM 3.55 (0.96) 1.67 5.69 .18 .17 .001
Pre 0.93 (0.08) 0.78 1.10 .69 .64 .001
Scottish –3.28 (1.59) –6.59 –0.20 –.11 –.10 .052
Major 3.40 (1.53) 0.50 6.51 .11 .11 .031
Male –0.03 (1.50) –2.97 2.89 .00 .00 .990

347
Table 185: Chemistry 1B 2012–13. Linear model of predictors of exam score, with 95% bias corrected and
accelerated confidence intervals. Confidence intervals and standard errors based on 1000
bootstrap samples.
CI95% for b
Predictor b (S.E) Lower Upper β sr p Adj. R2
F ΔF Sig ΔF
Step 1
Intercept 64.63 (1.30) 61.91 67.42 .001 .22 37.14 37.14 .000
MM 9.36 (1.80) 6.59 13.88 .47 .47 .001
Step 2*
Intercept 64.63 (1.01) 62.64 66.80 .001 .52 74.33 87.54 .000
MM 4.32 (1.44) 2.10 7.98 .22 .20 .006
Pre 0.81 (0.08) 0.65 0.97 .61 .56 .001
Step 3
Intercept 64.33 (1.64) 60.87 67.59 .001 .52 9.24 0.08 .775
MM 4.28 (1.45) 2.06 8.30 .21 .19 .005
Pre 0.81 (0.09) 0.65 0.97 .61 .56 .001
Scottish 0.57 (2.03) –3.07 3.99 .02 .02 .781
Step 4
Intercept 63.48 (1.75) 59.95 67.18 .001 .52 40.21 0.86 .356
MM 4.15 (1.60) 1.68 8.13 .21 .19 .008
Pre 0.81 (0.08) 0.64 1.00 .61 .56 .001
Major 1.87 (2.11) –2.19 5.97 .06 .06 .377
Step 5
Intercept 63.86 (1.37) 61.34 66.78 .001 .52 49.69 0.72 .398
MM 4.20 (1.50) 1.85 8.09 .21 .19 .011
Pre 0.81 (0.08) 0.64 0.96 .61 .56 .001
Male 1.66 (1.99) –2.46 5.85 .02 .06 .404

348
Table 186: Chemistry 1B 2013–14. Linear model of predictors of exam score, with 95% bias corrected and
accelerated confidence intervals. Confidence intervals and standard errors based on 1000
bootstrap samples.
CI95% for b
Predictor b (S.E) Lower Upper β sr p Adj. R2
F ΔF Sig ΔF
Step 1
Intercept 63.88 (1.35) 60.81 66.57 .001 .02 2.57 2.59 .111
MM 2.77 (2.08) –1.30 7.56 .13 .13 .172
Step 2
Intercept 63.88 (0.96) 61.90 65.74 .001 .48 76.82 148.73 .000
MM –0.47 (2.02) –4.71 3.60 –.02 –.02 .824
Pre 0.82 (0.07) 0.69 0.97 .70 .69 .001
Step 3
Intercept 62.54 (1.56) 59.06 65.79 .001 .48 51.95 1.61 .206
MM –0.59 (2.05) –4.88 3.37 –.03 –.03 .779
Pre 0.87 (0.09) 0.70 1.05 .74 .64 .001
Scottish 2.79 (2.30) –1.39 7.14 .08 .07 .238
Step 4*
Intercept 66.41 (1.64) 62.56 70.03 .001 .50 54.27 5.18 .024
MM –0.11 (2.23) –4.90 4.13 –.01 –.01 .963
Pre 0.82 (0.07) 0.68 0.96 0.70 .69 .001
Major –4.46 (2.09) –8.14 –0.64 –.13 –.13 .038
Step 5
Intercept 64.14 (2.24) 59.81 68.35 .001 0.50 41.36 1.81 .180
MM –0.13 (2.28) –4.89 4.14 –.01 –.01 .953
Pre 0.83 (0.07) 0.68 0.96 .71 .69 .001
Major –3.68 (2.20) –7.59 0.35 –.11 –.10 .099
Male 2.83 (2.01) –1.26 7.12 .08 .08 .181
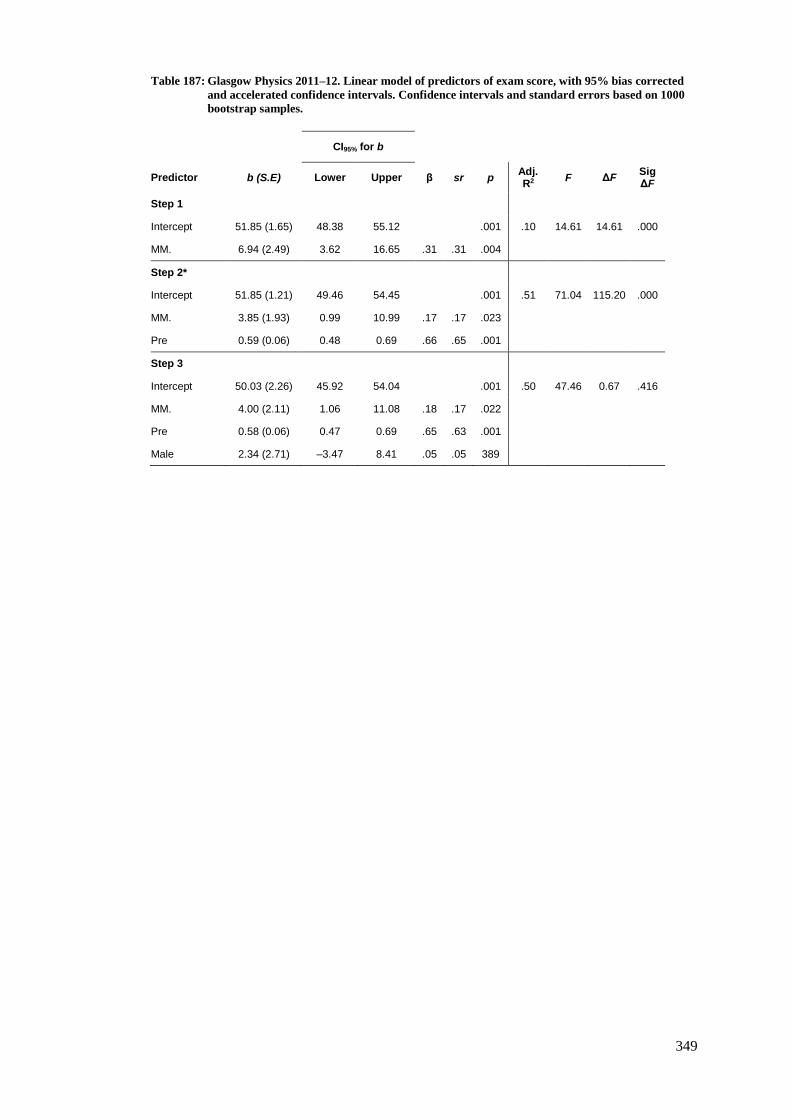
349
Table 187: Glasgow Physics 2011–12. Linear model of predictors of exam score, with 95% bias corrected
and accelerated confidence intervals. Confidence intervals and standard errors based on 1000
bootstrap samples.
CI95% for b
Predictor b (S.E) Lower Upper β sr p Adj. R2
F ΔF Sig ΔF
Step 1
Intercept 51.85 (1.65) 48.38 55.12 .001 .10 14.61 14.61 .000
MM. 6.94 (2.49) 3.62 16.65 .31 .31 .004
Step 2*
Intercept 51.85 (1.21) 49.46 54.45 .001 .51 71.04 115.20 .000
MM. 3.85 (1.93) 0.99 10.99 .17 .17 .023
Pre 0.59 (0.06) 0.48 0.69 .66 .65 .001
Step 3
Intercept 50.03 (2.26) 45.92 54.04 .001 .50 47.46 0.67 .416
MM. 4.00 (2.11) 1.06 11.08 .18 .17 .022
Pre 0.58 (0.06) 0.47 0.69 .65 .63 .001
Male 2.34 (2.71) –3.47 8.41 .05 .05 389

350
Table 188: Glasgow Physics 2012–13. Linear model of predictors of exam score, with 95% bias corrected
and accelerated confidence intervals. Confidence intervals and standard errors based on 1000
bootstrap samples.
CI95% for b
Predictor b (S.E) Lower Upper β sr p Adj. R2
F ΔF Sig ΔF
Step 1
Intercept 53.11 (1.58) 49.90 56.48 .001 .07 10.92 10.95 .001
MM. 6.59 (2.40) 1.94 12.29 .26 .26 .004
Step 2*
Intercept 53.11 (1.18) 50.74 55.61 .001 .48 70.15 120.62 .000
MM. 3.37 (2.00) –0.58 7.80 .13 .13 .076
Pre 0.57 (0.05) 0.46 0.68 .66 .65 .001
Step 3
Intercept 54.27 (2.28) 50.39 58.23 .001 .48 46.64 0.29 .594
MM. 3.30 (1.99) –0.58 7.63 .13 .13 .088
Pre 0.57 (0.05) 0.46 0.68 .66 .65 .001
Male –1.51 (2.72) –6.95 4.36 –.03 –.03 .607

351
Table 189: Glasgow Physics 2013–14. Linear model of predictors of exam score, with 95% bias corrected
and accelerated confidence intervals. Confidence intervals and standard errors based on 1000
bootstrap samples.
CI95% for b
Predictor b (S.E) Lower Upper β sr p Adj. R2
F ΔF Sig ΔF
Step 1
Intercept 48.91 (1.56) 45.89 52.05 .001 .09 13.19 13.19 .000
MM. 7.22 (1.92) 3.58 11.63 .30 .30 .002
Step 2*
Intercept 48.91 (1.29) 46.44 51.42 .001 .36 38.44 57.96 .000
MM. 3.86 (1.32) 1.65 6.90 .16 .16 .003
Pre 0.54 (0.07) 0.38 0.69 .55 .53 .001
Step 3
Intercept 46.71 (2.77) 41.90 52.40 .001 .36 25.81 0.71 .401
MM. 3.84 (1.33) 1.64 7.08 .16 .16 .003
Pre 0.54 (0.07) 0.38 0.69 .55 .53 .001
Male 2.73 (3.15) –3.72 8.75 .06 .06 .400

352
Table 190: Nottingham Chemistry 2011–12. Linear model of predictors of exam score, with 95% bias
corrected and accelerated confidence intervals. Confidence intervals and standard errors based
on 1000 bootstrap samples.
CI95% for b
Predictor b (S.E) Lower Upper β sr p Adj. R2
F ΔF Sig ΔF
Step 1
Intercept 61.57 (1.10) 59.33 63.85 .001 0.10 17.97 17.97 .000
MM. 5.70 (1.20) 3.52 8.34 .32 .32 .001
Step 2*
Intercept 61.57 (1.02) 59.49 63.66 .001 0.21 22.84 25.01 .000
MM. 3.89 (1.13) 1.79 6.49 .22 .21 .001
Pre 0.51 (0.09) 0.33 0.69 .36 .35 .001
Step 3
Intercept 62.55 (1.56) 59.45 66.15 .001 0.21 15.36 0.54 .462
MM. 3.77 (1.14) 1.62 6.28 .21 .20 .002
Pre 0.51 (0.09) 0.34 0.70 .37 .36 .001
Male –1.66 (2.09) –5.36 2.25 –.05 –.05 .438
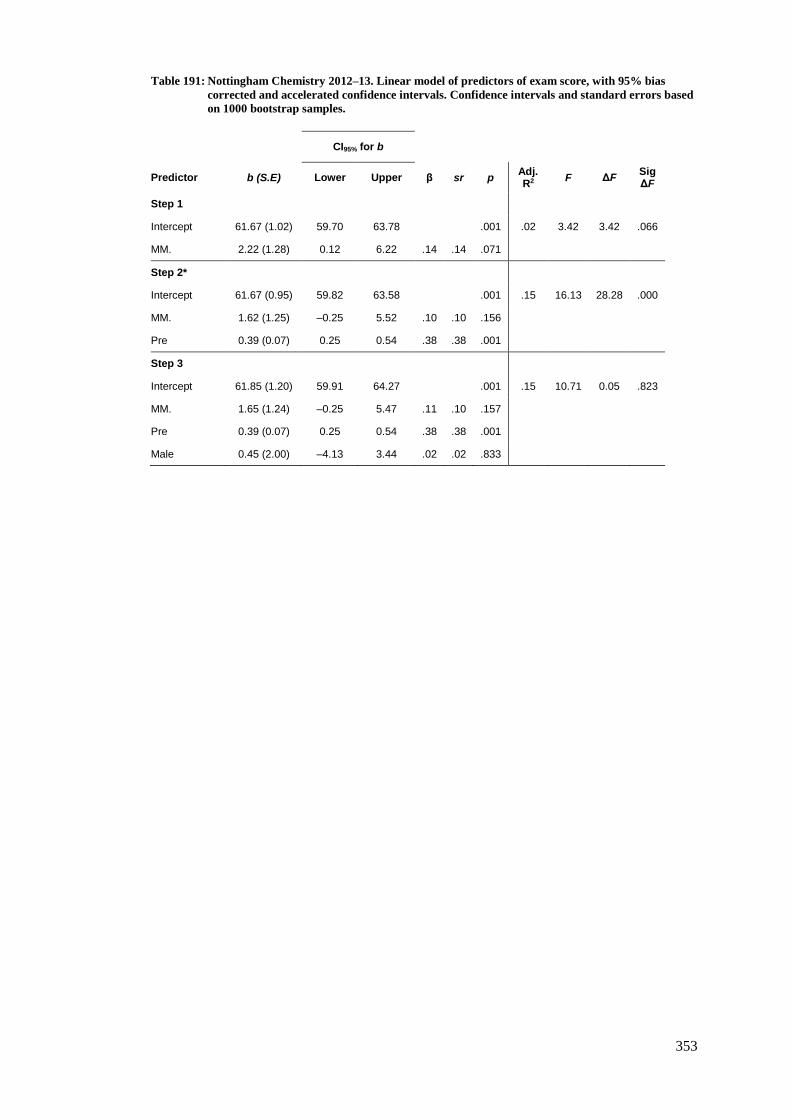
353
Table 191: Nottingham Chemistry 2012–13. Linear model of predictors of exam score, with 95% bias
corrected and accelerated confidence intervals. Confidence intervals and standard errors based
on 1000 bootstrap samples.
CI95% for b
Predictor b (S.E) Lower Upper β sr p Adj. R2
F ΔF Sig ΔF
Step 1
Intercept 61.67 (1.02) 59.70 63.78 .001 .02 3.42 3.42 .066
MM. 2.22 (1.28) 0.12 6.22 .14 .14 .071
Step 2*
Intercept 61.67 (0.95) 59.82 63.58 .001 .15 16.13 28.28 .000
MM. 1.62 (1.25) –0.25 5.52 .10 .10 .156
Pre 0.39 (0.07) 0.25 0.54 .38 .38 .001
Step 3
Intercept 61.85 (1.20) 59.91 64.27 .001 .15 10.71 0.05 .823
MM. 1.65 (1.24) –0.25 5.47 .11 .10 .157
Pre 0.39 (0.07) 0.25 0.54 .38 .38 .001
Male 0.45 (2.00) –4.13 3.44 .02 .02 .833
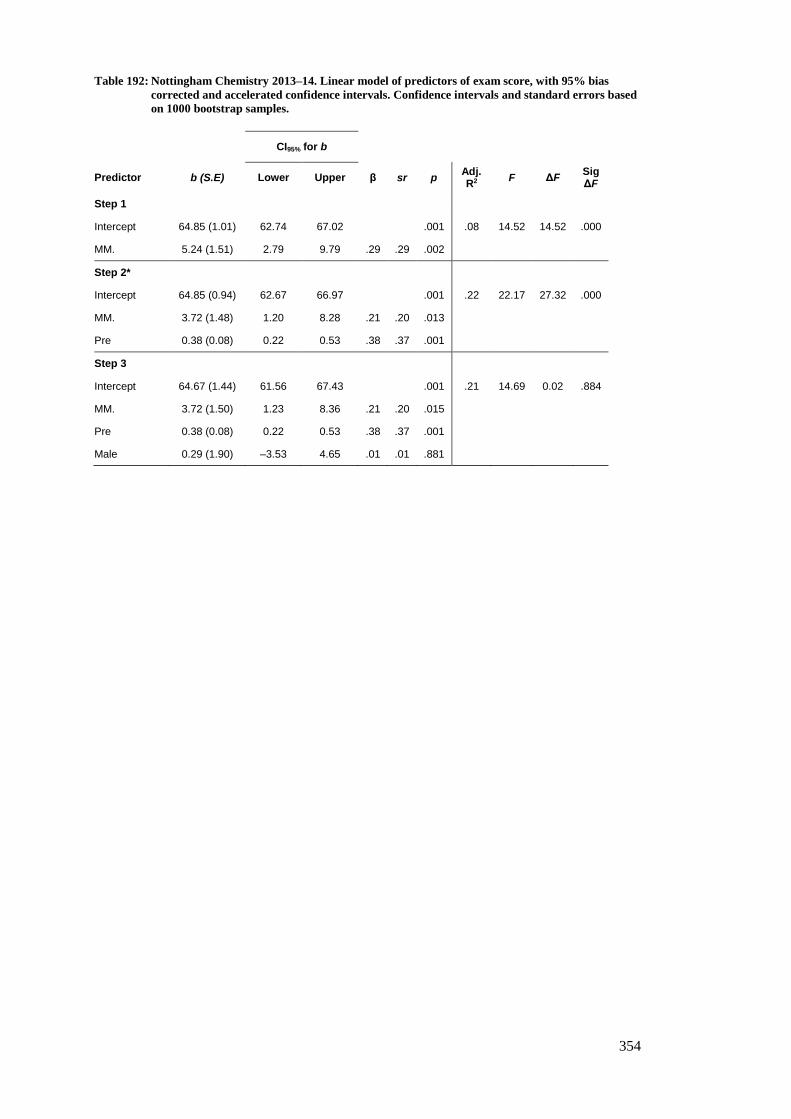
354
Table 192: Nottingham Chemistry 2013–14. Linear model of predictors of exam score, with 95% bias
corrected and accelerated confidence intervals. Confidence intervals and standard errors based
on 1000 bootstrap samples.
CI95% for b
Predictor b (S.E) Lower Upper β sr p Adj. R2
F ΔF Sig ΔF
Step 1
Intercept 64.85 (1.01) 62.74 67.02 .001 .08 14.52 14.52 .000
MM. 5.24 (1.51) 2.79 9.79 .29 .29 .002
Step 2*
Intercept 64.85 (0.94) 62.67 66.97 .001 .22 22.17 27.32 .000
MM. 3.72 (1.48) 1.20 8.28 .21 .20 .013
Pre 0.38 (0.08) 0.22 0.53 .38 .37 .001
Step 3
Intercept 64.67 (1.44) 61.56 67.43 .001 .21 14.69 0.02 .884
MM. 3.72 (1.50) 1.23 8.36 .21 .20 .015
Pre 0.38 (0.08) 0.22 0.53 .38 .37 .001
Male 0.29 (1.90) –3.53 4.65 .01 .01 .881
355
Appendix I
Themes and codes emerging from student responses
The following tables list the aggregated codes and themes that have emerged from
qualitative coding of students’ responses to end of course questionnaires and minute papers –
as outlined in Chapter 8 of this work. The parenthesised numbers indicate the number of
times a particular theme or sub-theme was coded.

356
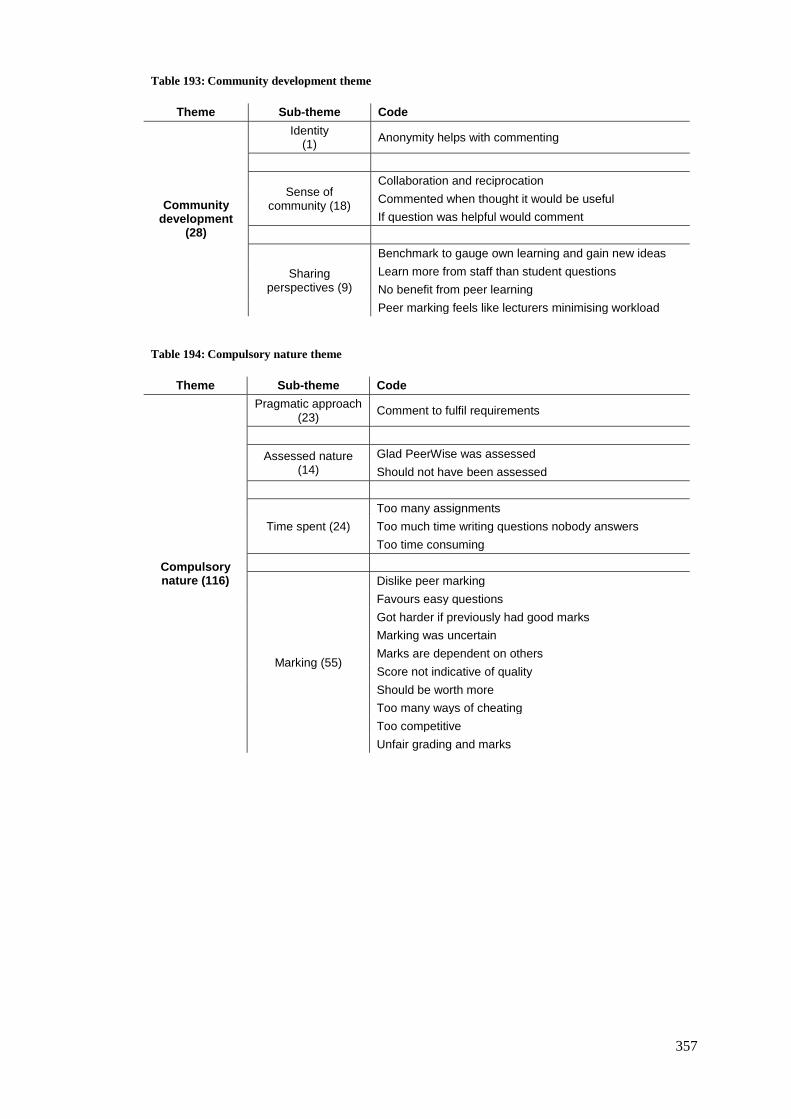
357
Table 193: Community development theme
Theme Sub-theme Code
Community development
(28)
Identity (1)
Anonymity helps with commenting
Sense of community (18)
Collaboration and reciprocation
Commented when thought it would be useful
If question was helpful would comment
Sharing perspectives (9)
Benchmark to gauge own learning and gain new ideas
Learn more from staff than student questions
No benefit from peer learning
Peer marking feels like lecturers minimising workload
Table 194: Compulsory nature theme
Theme Sub-theme Code
Compulsory nature (116)
Pragmatic approach (23)
Comment to fulfil requirements
Assessed nature (14)
Glad PeerWise was assessed
Should not have been assessed
Time spent (24)
Too many assignments
Too much time writing questions nobody answers
Too time consuming
Marking (55)
Dislike peer marking
Favours easy questions
Got harder if previously had good marks
Marking was uncertain
Marks are dependent on others
Score not indicative of quality
Should be worth more
Too many ways of cheating
Too competitive
Unfair grading and marks
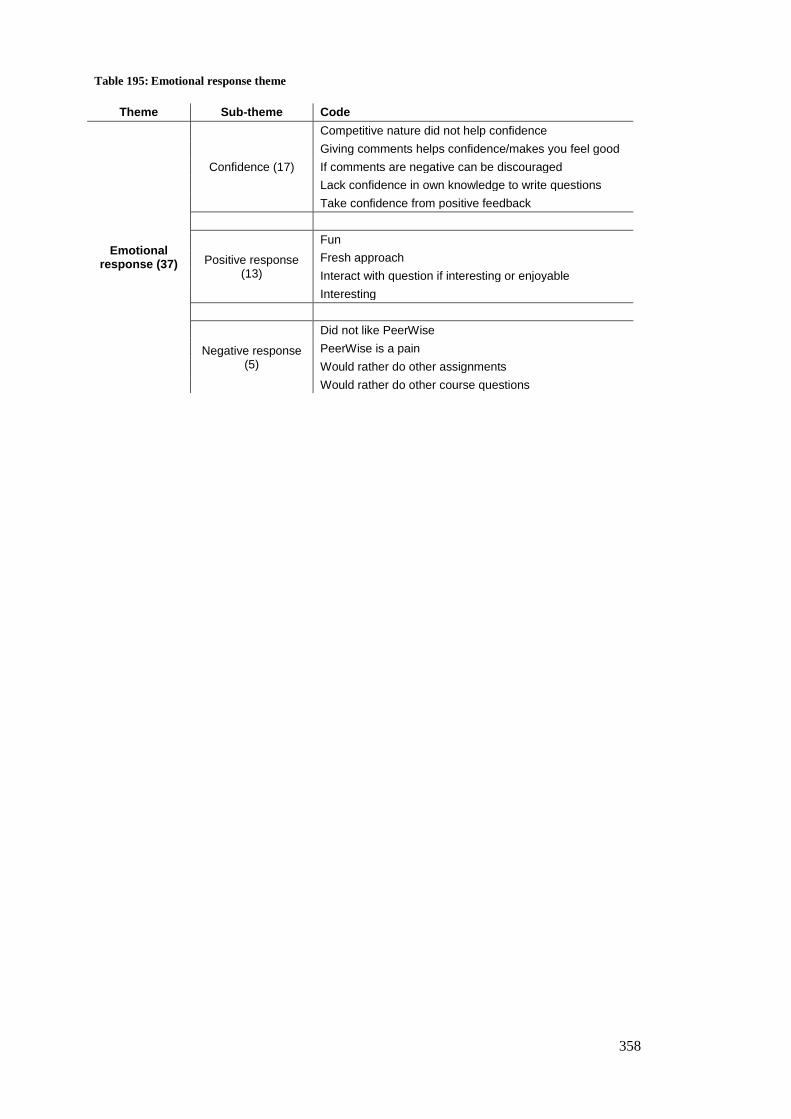
358
Table 195: Emotional response theme
Theme Sub-theme Code
Emotional response (37)
Confidence (17)
Competitive nature did not help confidence
Giving comments helps confidence/makes you feel good
If comments are negative can be discouraged
Lack confidence in own knowledge to write questions
Take confidence from positive feedback
Positive response (13)
Fun
Fresh approach
Interact with question if interesting or enjoyable
Interesting
Negative response (5)
Did not like PeerWise
PeerWise is a pain
Would rather do other assignments
Would rather do other course questions
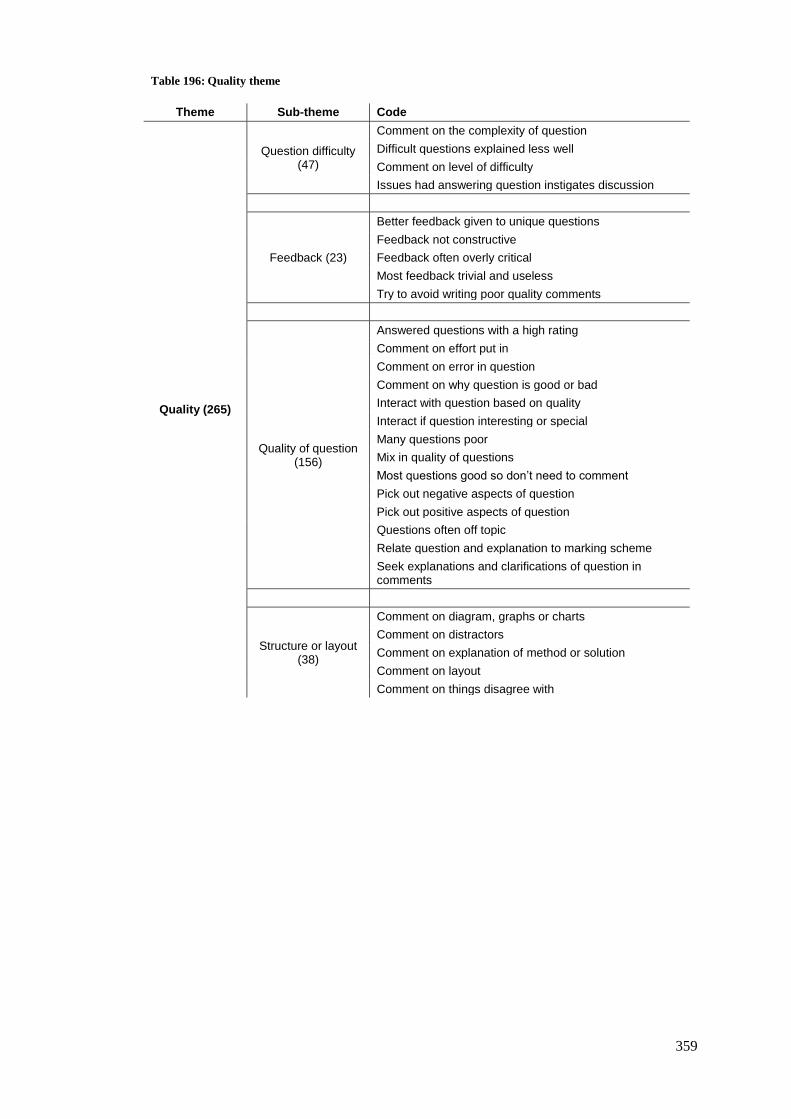
359
Table 196: Quality theme
Theme Sub-theme Code
Quality (265)
Question difficulty (47)
Comment on the complexity of question
Difficult questions explained less well
Comment on level of difficulty
Issues had answering question instigates discussion
Feedback (23)
Better feedback given to unique questions
Feedback not constructive
Feedback often overly critical
Most feedback trivial and useless
Try to avoid writing poor quality comments
Quality of question (156)
Answered questions with a high rating
Comment on effort put in
Comment on error in question
Comment on why question is good or bad
Interact with question based on quality
Interact if question interesting or special
Many questions poor
Mix in quality of questions
Most questions good so don’t need to comment
Pick out negative aspects of question
Pick out positive aspects of question
Questions often off topic
Relate question and explanation to marking scheme
Seek explanations and clarifications of question in comments
Structure or layout (38)
Comment on diagram, graphs or charts
Comment on distractors
Comment on explanation of method or solution
Comment on layout
Comment on things disagree with
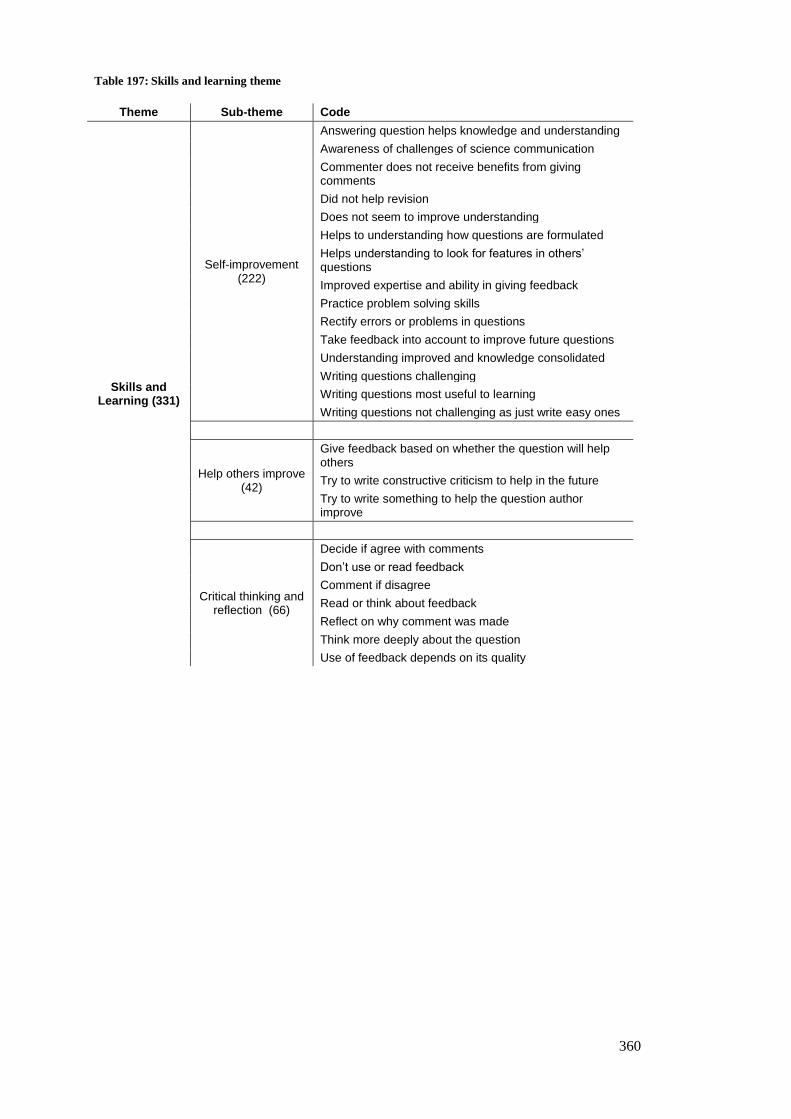
360
Table 197: Skills and learning theme
Theme Sub-theme Code
Skills and Learning (331)
Self-improvement (222)
Answering question helps knowledge and understanding
Awareness of challenges of science communication
Commenter does not receive benefits from giving comments
Did not help revision
Does not seem to improve understanding
Helps to understanding how questions are formulated
Helps understanding to look for features in others’ questions
Improved expertise and ability in giving feedback
Practice problem solving skills
Rectify errors or problems in questions
Take feedback into account to improve future questions
Understanding improved and knowledge consolidated
Writing questions challenging
Writing questions most useful to learning
Writing questions not challenging as just write easy ones
Help others improve (42)
Give feedback based on whether the question will help others
Try to write constructive criticism to help in the future
Try to write something to help the question author improve
Critical thinking and reflection (66)
Decide if agree with comments
Don’t use or read feedback
Comment if disagree
Read or think about feedback
Reflect on why comment was made
Think more deeply about the question
Use of feedback depends on its quality
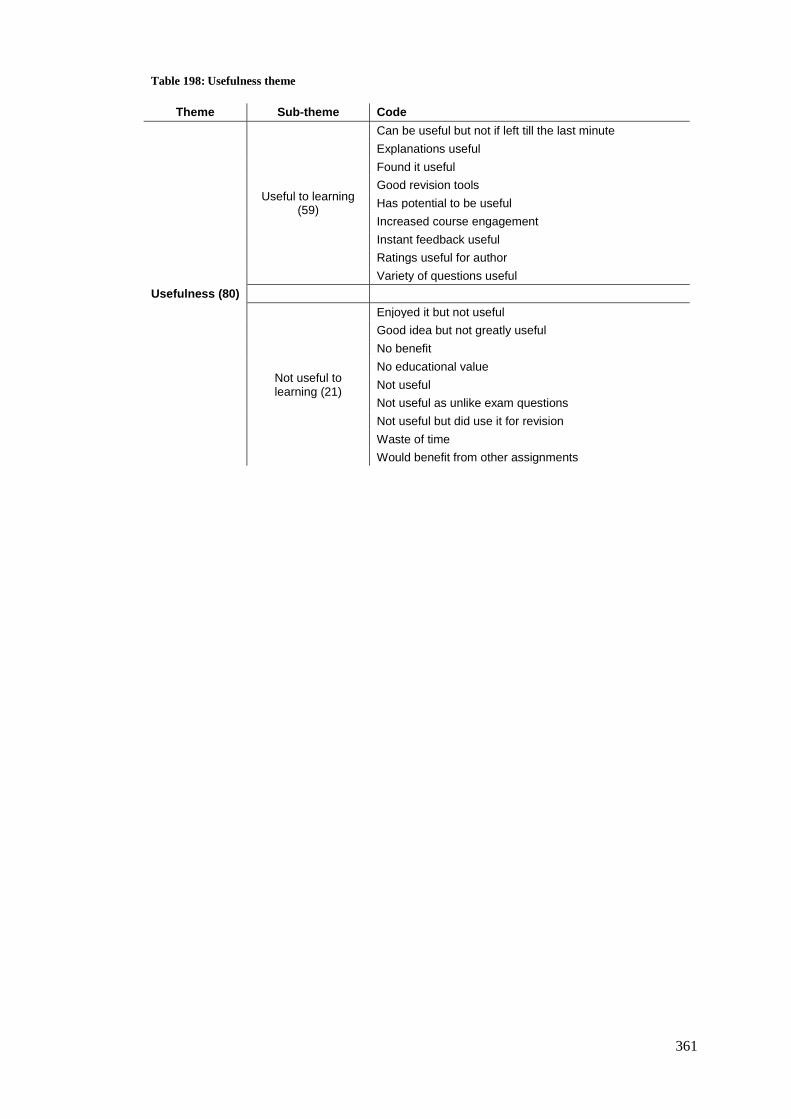
361
Table 198: Usefulness theme
Theme Sub-theme Code
Usefulness (80)
Useful to learning (59)
Can be useful but not if left till the last minute
Explanations useful
Found it useful
Good revision tools
Has potential to be useful
Increased course engagement
Instant feedback useful
Ratings useful for author
Variety of questions useful
Not useful to learning (21)
Enjoyed it but not useful
Good idea but not greatly useful
No benefit
No educational value
Not useful
Not useful as unlike exam questions
Not useful but did use it for revision
Waste of time
Would benefit from other assignments

362

363
Publications
Hardy J, Bates S P, Casey M M, Galloway K W, Galloway R K, Kay A E, Kirsop P and
McQueen H A 2014 Student-Generated Content: Enhancing learning through sharing
multiple-choice questions Int. J. Sci. Educ. 1–15
Casey M M, Bates S P, Galloway K W, Galloway R K, Hardy J, Kay A E, Kirsop P and
McQueen H A 2014 Scaffolding student engagement via online peer learning Eur. J. Phys.
35 045002
Recommended


