
LARGE‐MAGNITUDE FISSURE ERUPTIONS IN ICELAND:
SOURCE CHARACTERISATION
Report on the source characteristics of a ‘Laki‐type’ eruption for scenario
modelling and findings of an expert consultation and elicitation
British Geological Survey Open File Report OR/12/098

iii
LARGE‐MAGNITUDE FISSURE ERUPTIONS IN ICELAND:
SOURCE CHARACTERISATION
Report on the source characteristics of a ‘Laki‐type’ eruption for scenario
modelling and findings of an expert consultation and elicitation
British Geological Survey Open File Report OR/12/098
Loughlin, S. C., Aspinall, W. P., Vye‐Brown, C., Baxter, P. J., Braban, C. F., Hort, M., Schmidt, A.,
Thordarson, T., Witham, C.
This report was prepared for the Civil Contingencies Secretariat (Cabinet Office) following a meeting held between 15‐17th May 2012 at 35, Great Smith Street, London. The report is published by the British Geological Survey (Natural Environment Research Council) under contract to the Cabinet Office. © Queen's Printer and Controller of HMSO [2012]
You may re‐use this information (excluding logos) free of charge in any format or medium, under the terms of the Open Government Licence. To view this licence, visit http://www.nationalarchives.gov.uk/doc/open‐government‐licence or email [email protected].
Where we have identified any third party copyright information you will need to obtain permission from the copyright holders concerned.
This publication is available for download at www.bgs.ac.uk Loughlin, S. C., Aspinall, W. P. A., Vye‐Brown, C., Baxter, P. J., Braban, C., Hort, M., Schmidt, A., Thordarson, T., Witham, C. 2012. Large‐magnitude fissure eruptions in Iceland: source characterisation. BGS Open File Report, OR/12/098. For enquiries or further copies of the report, contact: Dr Sue Loughlin, British Geological Survey, West Mains Road, Edinburgh, EH16 6SH. Email: [email protected] Phone: (0131) 650 0417

iv
List of meeting and elicitation participants
Willy Aspinall Aspinall and Associates / University of Bristol
Peter Baxter University of Cambridge
Steve Blake Open University
Christine Braban Centre for Ecology and Hydrology (NERC)
Antonio Costa University of Reading
Pierre Delmelle Université Catholique de Louvain
Anjan Ghosh Health Protection Agency1
Matthew Hort UK Met Office
Robie Kamanyire Health Protection Agency1
Ishani Kar‐Purkayastha Health Protection Agency1
Sue Loughlin British Geological Survey (NERC)
Tamsin Mather University of Oxford
Virginia Murray Health Protection Agency1
Clive Oppenheimer University of Cambridge
Anja Schmidt University of Leeds
David Stevenson University of Edinburgh
Thorvaldur Thordarson University of Edinburgh2
Roland von Glasow University of East Anglia
Charlotte Vye British Geological Survey (NERC)
Geoff Wadge University of Reading
Claire Witham UK Met Office
Acknowledgements
We thank the Icelandic Meteorological Office and the Institute of Earth Sciences at the University of
Iceland, for their support and input.
1 From 1st April 2014, HPA became part of Public Health England. 2 Now at the University of Iceland.

v
Contents
Contents .................................................................................................................................................. v
EXECUTIVE SUMMARY .................................................................................................................... viii
Summary ................................................................................................................................................ ix
1. Introduction ........................................................................................................................................ 1
1.1 Background .................................................................................................................................. 1
1.2 Aims and Objectives ..................................................................................................................... 1
1.3 Notes ............................................................................................................................................ 2
1.4 Methods ...................................................................................................................................... 2
2. Fissure eruptions in Iceland ................................................................................................................ 4
2.1 Iceland’s volcanic systems ........................................................................................................... 4
2.2 Magma productivity in Iceland .................................................................................................... 5
2.3 Fissure eruptions .......................................................................................................................... 6
Large‐volume fissure eruptions ...................................................................................................... 9
Large‐volume fissure eruptions (Holocene) .................................................................................... 9
Large‐volume fissure eruptions (historical time) .......................................................................... 10
3. Characteristics of large‐volume fissure eruptions in Iceland ......................................................... 12
3.1 LAKI ............................................................................................................................................ 12
Eruption character ........................................................................................................................ 12
Volatile emissions ......................................................................................................................... 12
3.2 ELDGJÁ ....................................................................................................................................... 14
Eruption character ........................................................................................................................ 14
Volatile emissions ......................................................................................................................... 15
3.3 THJÓRSÁ ..................................................................................................................................... 15
Eruption character and volatile emissions .................................................................................... 15
4. Atmospheric dispersion and chemical transformation .................................................................. 16
4.1 Background ................................................................................................................................ 16
4.2 Meteorological effects ............................................................................................................... 16
4.3 Chemical and physical reactions – SO2 ...................................................................................... 17
4.4 Chemical and physical reactions – HCl and HF .......................................................................... 19
4.5 Deposition processes ................................................................................................................. 20
4.6 Chemistry and models ............................................................................................................... 21
5. Observations, modelling and impacts of Laki 1783 .......................................................................... 23

vi
5.1 Observations in Iceland and Europe in 1783 ............................................................................. 23
5.2 Analysis of the Laki eruption ...................................................................................................... 24
5.3 Previous modelling studies of a Laki‐type eruption .................................................................. 28
5.4 The Laki eruption in a global context ......................................................................................... 30
6. Monitoring and operational activities ............................................................................................ 31
6.1 Qualitative discussions .......................................................................................................... 31
6.2 Monitoring near‐source ........................................................................................................ 31
Early warning ................................................................................................................................ 31
Real‐time source parameters ....................................................................................................... 32
Direct sampling ............................................................................................................................. 34
In‐situ sensors ............................................................................................................................... 34
UV spectroscopy ........................................................................................................................... 35
Broadband IR................................................................................................................................. 35
Laser spectroscopy ........................................................................................................................ 35
Satellite remote sensing ............................................................................................................... 35
Assessing sulphur content ............................................................................................................ 36
6.3 Monitoring in the far‐field ......................................................................................................... 36
At altitude ..................................................................................................................................... 36
At ground level .............................................................................................................................. 37
7. Expert elicitation ............................................................................................................................... 39
7.1 Quantitative elicitation: proceedings ........................................................................................ 39
7.2 Expert calibration ....................................................................................................................... 39
7.3 Target Item results: summary .................................................................................................... 39
7.4 Expert elicitation ‐ conclusions .................................................................................................. 40
7.5 Qualitative questions ................................................................................................................. 41
8. Brief discussion on impacts .............................................................................................................. 46
8.1 Health impacts (human and animal).......................................................................................... 46
8.2 Environmental impacts .............................................................................................................. 47
8.3 Aviation impacts ........................................................................................................................ 48
8.4 Other sectors ............................................................................................................................. 48
9. Summary of results ........................................................................................................................... 49
9.1 Key findings ................................................................................................................................ 49
9.2 Knowledge gaps ......................................................................................................................... 53
9.3 Research and monitoring needed .............................................................................................. 54
vii
9.4 Response needed ....................................................................................................................... 55
9.5 Recommendations ..................................................................................................................... 55
10. References ...................................................................................................................................... 57
APPENDIX A: Meeting and elicitation participants ............................................................................... 71
APPENDIX B: Expert Judgment Elicitation – a briefing note ................................................................. 73
APPENDIX C: Elicitation Results ............................................................................................................ 78
APPENDIX D. Qualitative questions .................................................................................................... 106
APPENDIX E: Glossary ......................................................................................................................... 108
APPENDIX F: Volcanic Gas and Ash UK Ground level Monitoring Capability ...................................... 112
APPENDIX G: Gas Guidelines ............................................................................................................... 120
APPENDIX H: IVHHN Ash analysis protocol ......................................................................................... 121
APPENDIX I: Some ongoing relevant research projects ...................................................................... 122

viii
EXECUTIVE SUMMARY
The British Geological Survey and the Met Office together with government departments, agencies
and academic partners across the UK and in Iceland are engaged in a programme of work that aims
to ensure that plans are in place in Iceland, the UK and the rest of Europe to facilitate a coordinated
and timely response to future eruptions that occur in Iceland.
As a consequence of the eruption of the Eyjafjallajökull volcano in 2010, Professor Sir John
Beddington appointed a ‘Scientific Advisory Group in Emergencies’ (SAGE) which met several times
during the eruption. One of the tasks of the SAGE was to consider potential future eruption
scenarios that might affect the UK and as a result, volcanic eruptions were included for the first time
in the UK National Risk Register (NRR). One of the scenarios adopted in the NRR
(https://www.gov.uk/government/publications/national‐risk‐register‐of‐civil‐emergencies) is based
on the 1783‐4 fissure eruption of Grimsvötn volcano, commonly known as the ‘Laki eruption’.
The BGS was contracted to characterise source parameters and their uncertainties to enable further
modelling of a Laki eruption scenario, a critical step towards better understanding the possible
impacts of such an eruption. This report presents the outcomes of a meeting and expert elicitation
held under contract to the Cabinet Office in May 2012. A multidisciplinary expert group with
specialist knowledge of this particular type of eruption, volcanic degassing, remote sensing of gases
and aerosols, atmospheric processes and dispersion modelling was nominated to take part, along
with a few experts on the health and environmental impacts of volcanic eruptions to provide
guidance on their modelling requirements. The elicitation was run by Professor Willy Aspinall.
It is hoped that the very short process that led to this report was nevertheless sufficient to stimulate
valuable scientific discussion, to prompt planning initiatives and to motivate relevant research
proposals. This report acts as a multidisciplinary resource with key research papers and the
outcomes of the meeting presented as well as the elicited source parameters. Areas where scientific
understanding is limited or is still emerging are highlighted here as ‘knowledge gaps’ and research to
tackle these gaps is recommended.
Planning by government departments, research institutes and others is underway and can also be
guided by the contents this report. It is suggested that consideration is given as to how scientific
inputs should best be delivered in any future volcanic emergency, in the light of recent experiences.

ix
Summary
What is the Laki eruption scenario?
The Laki eruption scenario is based on a large fissure eruption that occurred in 1783‐4 for which
there is published evidence of significant distal impacts across Europe (see below)3. The impact on
Iceland was devastating: more than 60% of the grazing livestock was killed by fluorosis and
ultimately ~20% of the island’s population died in the aftermath as a result of induced illness,
environmental stress and famine4.
As well as lava flows, the atmospheric volcanic emissions from such an eruption include mainly
water vapour, gases including carbon dioxide, sulphur dioxide, hydrogen chloride and hydrogen
fluoride, aerosols (e.g. particles such as sulphates) and trace metals such as mercury, arsenic and
iridium. At times, there may also be volcanic ash depending on how explosive the eruption is and the
presence of water. Sulphur dioxide (SO2) is chemically converted during atmospheric transport to
sulphate aerosol. The rates of this chemical conversion vary depending on factors such as
temperature, humidity and availability of oxidants. The main potential hazards of concern to the UK
include volcanic gases and aerosol (air pollution), acid rain and deposition of acids and other
aerosols.
There have been four large fissure eruptions in Iceland in historical time (the last c.1130 years), the
1783‐4 Laki eruption being the second largest in terms of the volume of volcanic material erupted.
This type of eruption is characterised by huge outpourings of mainly lava, gases and aerosols
(atmospheric particles) which can cause regional to hemispheric‐scale impacts but most risks can be
mitigated with effective planning.
Observations in UK and Europe in 1783
In the UK and Europe, from 12 June 1783 there were reports of an atmospheric ‘haze’ and ‘dry
sulphurous fogs’ at different times which were almost certainly associated with volcanic aerosols3
and possibly gases.
Contemporary records from England and other European countries document some environmental
and health impacts of the haze (e.g. workers in fields suffering respiratory difficulty; crop and
vegetation damage5) but the haze and its effects were variable spatially and temporally at a local
scale. This significant variability is controlled by the eruption dynamics and by the influences of
regional‐to‐local scale meteorology.
Meteorological records show that there was extreme heat in the summer of 1783 followed by an
exceptionally cold winter in the northern hemisphere. There were unusual thunderstorms, ball
3 Thordarson and Self, 1993 4 Thordarson and Self, 2003 5 Grattan et al., 2003

x
lightning and large hailstones. It is not possible to prove that this extreme weather was linked to the
eruption though the unusual meteorological phenomena caused commentators to make the
suggestion at the time6.
A published study7 based on 404 parish records in England, provides evidence for two periods of
crisis mortality during the Laki eruption period: one peak in August‐September 1783 and a second
peak in January‐February 1784 with above normal mortality rates for the subsequent two months. It
is not possible to directly ascribe these excess deaths to the Laki eruption but the unusual monthly
mortality pattern indicates a forcing on mortality unrelated to normal seasonal trends and
potentially unique in a fifty year series of such data. The significance of these findings and those of
some other publications using death records at the time warrant further assessment for their value
and possible implications for the UK and Europe today.
Modelling the scenario
In order to be hazardous at ground level in the UK, the air pollutants need to be a) transported to
the UK by the wind, b) present at ground levels in the UK, and c) at harmful concentrations.
Different models need to be combined to understand key processes in this scenario – weather
models, atmospheric transport (dispersion) models and chemistry models. To produce detailed
modelling results including multiple physical and chemical processes requires considerable resources
(time) and computing power. Solving the first order problem of whether or not volcanic emissions
can physically reach the UK under particular eruption and meteorological conditions has been seen
to be possible and can be probabilistically assessed using long range dispersion models but
neglecting chemical conversion processes.
Atmospheric dispersion models require knowledge of the source characteristics of an eruption – for
example the height of the column of emissions (ash, gas and aerosol) above the vent, the rate of
emission and, for ash, the distribution of particle sizes between the vent and the top of the eruption
column. In order to facilitate modelling of future eruption scenarios, this report presents a range of
eruption characteristics (source parameters) for a Laki‐type eruption and their uncertainties based
on an expert elicitation. This reflects current knowledge. The report also presents information on the
possible dynamic evolution of a future large‐volume fissure eruption for modelling purposes.
Models and the results of modelling, and their hazard implications, need to be thoroughly
understood by practitioners, in particular the effects of assumptions and uncertainties. Running
several models with the same starting parameters helps understanding of these uncertainties and if
validated against observational data may inform on model capabilities and limitations.
To inform risk assessments fully, given inevitable scientific uncertainties, a probabilistic modelling
approach is needed. Eruption scenarios would be modelled using multiple years of meteorological
data. Outputs suitable for health and environmental modelling, including deposition and air
6 Franklin, 1784 7 Witham and Oppenheimer, 2004

xi
concentration data and distribution maps for different scenarios e.g. summer and winter events,
could be produced. Outputs can also be produced for different flight levels.
The better our understanding of eruptive and atmospheric processes, the more effective models can
be when applied as part of the response to future events. Improved understanding is needed of the
composition and transformation of gases and aerosols in the atmosphere and this is best achieved
through focused collection of data between and during eruptions, laboratory studies and modelling.
For example, more detailed studies are needed to establish wet and dry deposition rates and
scavenging coefficients for different species.
A future eruption
The Icelandic Meteorological Office (IMO) is mandated to monitor volcanoes in Iceland and would
expect some geophysical and/or geochemical evidence of unrest before a Laki‐type fissure eruption.
In 1783 there were felt earthquakes three to four weeks before the eruption. Currently, such an
increase in activity would be communicated by IMO increasing the ‘aviation colour code’
(http://www.wovo.org/aviation‐colour‐codes.html) and distributing a notification called a ‘Volcano
Observatory Notice for Aviation’
(http://www.icao.int/safety/meteorology/ivatf/Meeting%20MetaData/IP.10.pdf) thus informing the
aviation sector, UK Met Office, BGS and others. When an eruption has begun, where possible, the
IMO provides real‐time eruption source parameters to the UK Met Office for operational forecasting
purposes. It is not certain that the potential scale of a Laki‐type eruption would be clear at the onset
of the eruption.
Once an eruption is underway, the gases, aerosols and ash will be transported away from the
volcano by the winds acting at the time. Assuming the worst expected meteorological conditions for
the UK (strong wind flow from the northwest) we could have a minimum lead time of approximately
six hours.
All large historical fissure eruptions in Iceland appear to have had very similar eruption dynamics
with more intense and vigorous activity in the early stages of the eruption. In the case of Laki, about
96% of gases were released in the first 5 months and 60% in the first six weeks of the eruption3.
Monitoring
The IMO make much monitoring data available online (e.g. http://en.vedur.is/earthquakes‐and‐
volcanism/earthquakes/). The UK Government, BGS and others in the UK and across Europe are
contributing to the IMO‐led monitoring effort in Iceland partly in order to secure the maximum
possible lead time and effective information flow during an emergency.
Ground‐based, airborne and satellite monitoring techniques are of value both near the volcano and
in the far‐field (e.g. the UK). Nevertheless, none of the existing techniques in isolation would give a
high resolution time‐series of source parameters/data. There is significant potential to develop new,
purpose‐specific monitoring techniques and some novel techniques have been developed, or are
being developed, but the technology is not yet available commercially. The ideal future situation

xii
would involve improved capacity and the sustained coordination of resources and collaboration
across institutes and nations in order to effectively respond to eruptions.
This report summarises existing monitoring capability in the UK. We recommend extending existing
ground‐based air quality networks to increase spatial and temporal resolution of data (e.g. more
sites instrumented and more species monitored, especially gases and trace metals). There is
currently no capability to monitor hydrogen sulphide, hydrogen fluoride or hydrogen bromide, for
example, and also limited air quality monitoring in most rural areas (e.g. the Highlands and Islands of
Scotland). Knowledge of the location and vertical characterisation of volcanic clouds can be
improved using LiDAR (Light Detection And Ranging), aircraft, balloon sondes, UAVs (unmanned
aerial vehicles); new methods could be developed. If there is fine ash, gas or aerosol deposited over
the UK, sample collection and analyses should be coordinated (e.g. in a similar manner to the DEFRA
Volcanic Ash Network). The UK could engage appropriate and available remote sensing resources,
further exploit current sensors, develop new satellite payloads and plan for enhanced observation
capabilities to facilitate crisis management.
For the present hazard scenario concerns, detailed analysis of observations from any eruption can
lead to significant improvements in understanding processes, development of methods and planning
for future eruptions. In this context, future eruptions around the world will offer opportunities to
conduct observations, experiments, test new techniques and improve near real‐time collection,
integration and analysis of multi‐parametric data. Observations and monitoring must be combined
with improved numerical models of different eruption processes and laboratory experiments of
eruption column processes in order to facilitate our future ability to harness data, observations and
modelling to better assess eruption parameters in real‐time and therefore forecast hazards
effectively.
Health impacts
Unfortunately, historical records relating to 1783‐4 cannot be critically analysed using the standard
epidemiological methods used in modern air pollution research. It is not possible to reliably infer
the short‐term exposure levels of people to individual air pollutants from the reports of odour, haze
or vegetation damage. The available historical data are also inadequate for calculating age‐specific
death rates, or doing time‐series analyses from the parish numbers of deaths, which are also known
to be highly unstable in many parishes due to the high prevalence of endemic infectious diseases no
longer seen in Britain today, and the much lower life expectancy in 1783.
For a future Laki‐type eruption scenario, modelling ambient air concentrations of specific air
pollutants is required to provide first order estimates of all‐cause and disease specific mortality and
morbidity, based on exposure‐response data for SO2 and particulate matter (PM2.5 and PM10) from
clinical and epidemiological studies. In one published paper8 the modelling forecasts that the
concentration of volcanic PM2.5 particulate matter (particles with diameters <2.5 micrometer) could
double across central, western and northern Europe during the first three months of a future Laki
eruption scenario. The model dataset was used to estimate the number of days (out of 266 days
8 Schmidt et al. 2011
xiii
considered) that could exceed the current World Health Organisation (WHO) 24‐h mean PM2.5 air
quality guideline of 25 μg/m3. Over land areas of Europe (excluding Iceland), the mean number of
exceedances could increase by 36 days (range 14‐63 days) compared to a ‘normal’ non‐volcanic
mean of 38 days. The authors estimate 142,000 additional cardiopulmonary fatalities could occur in
Europe (with a 95% confidence interval 52,000‐228,000) and the UK may experience an increase in
mortality of about 3.5% (i.e. about 21,000 additional cardiopulmonary fatalities due to eruption on
top of 595,800 all‐cause deaths).
Global air quality guidelines are well‐established for SO2 (UK and EU guidelines are similar) which
would be a major constituent gas in the erupted plume from Iceland. However, modelling studies
are needed to establish the volcanic and meteorological conditions required for SO2 to reach UK
ground level before the gas is chemically converted to sulphate aerosol. At high enough
concentrations SO2 could trigger acute respiratory symptoms in asthma sufferers and aggravate the
condition of patients with chronic lung problems. To assess health effects on such individuals, peak
concentrations measured and averaged over periods of 15 minutes using air quality networks would
need to be compared with existing guideline values.
Models, in theory, predict 15 minute mean SO2 concentrations needed for health impacts (e.g. 15
minute WHO thresholds for SO2) but crucially these outputs are considered much more uncertain
(due to model limitations) when compared to, for example, 24‐h mean concentration outputs. New
statistical methods may need to be investigated in order to develop capacity to address health
impact requirements given model output constraints.
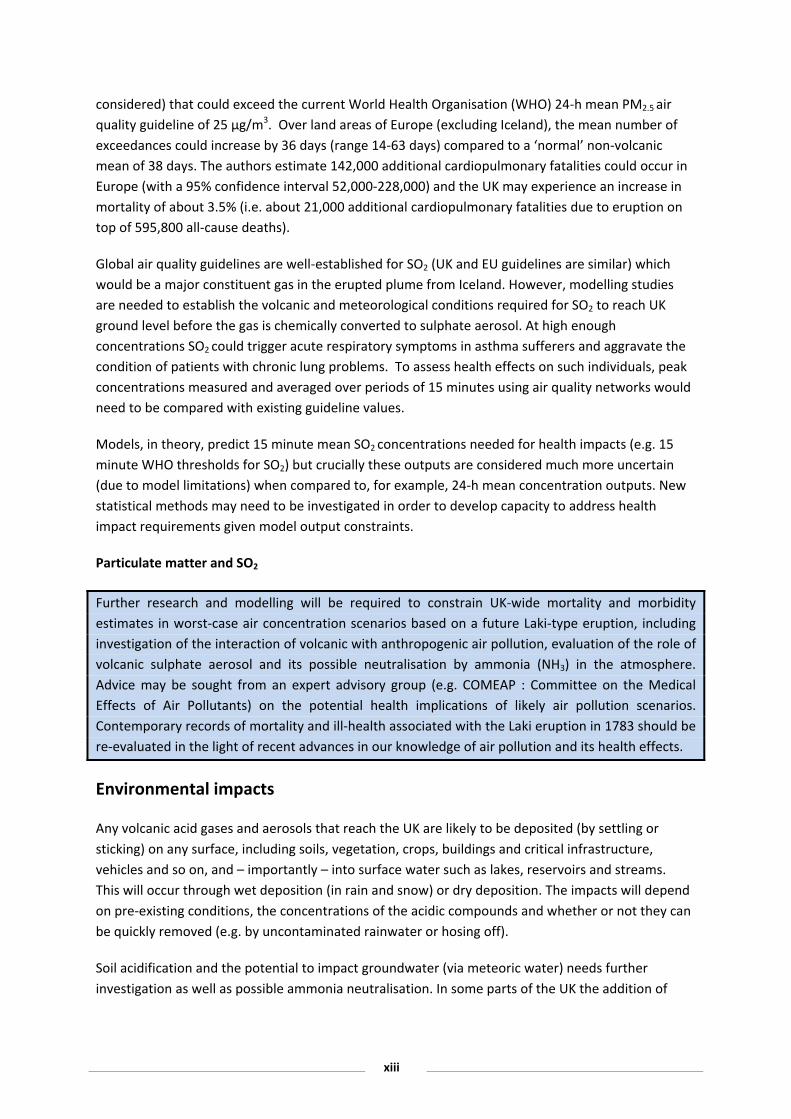
Particulate matter and SO2
Further research and modelling will be required to constrain UK‐wide mortality and morbidity
estimates in worst‐case air concentration scenarios based on a future Laki‐type eruption, including
investigation of the interaction of volcanic with anthropogenic air pollution, evaluation of the role of
volcanic sulphate aerosol and its possible neutralisation by ammonia (NH3) in the atmosphere.
Advice may be sought from an expert advisory group (e.g. COMEAP : Committee on the Medical
Effects of Air Pollutants) on the potential health implications of likely air pollution scenarios.
Contemporary records of mortality and ill‐health associated with the Laki eruption in 1783 should be
re‐evaluated in the light of recent advances in our knowledge of air pollution and its health effects.
Environmental impacts
Any volcanic acid gases and aerosols that reach the UK are likely to be deposited (by settling or
sticking) on any surface, including soils, vegetation, crops, buildings and critical infrastructure,
vehicles and so on, and – importantly – into surface water such as lakes, reservoirs and streams.
This will occur through wet deposition (in rain and snow) or dry deposition. The impacts will depend
on pre‐existing conditions, the concentrations of the acidic compounds and whether or not they can
be quickly removed (e.g. by uncontaminated rainwater or hosing off).
Soil acidification and the potential to impact groundwater (via meteoric water) needs further
investigation as well as possible ammonia neutralisation. In some parts of the UK the addition of

xiv
sulphur may benefit the soils, elsewhere soils are already acidified and sensitive ecosystems are at
risk. Localised rainfall carrying a volcanic burden may produce deposition hotspots.
Effective environmental management will rely heavily on good monitoring networks and knowledge
of the sensitivity of different crops, vegetation, ecosystems to the pollutants. The impacts of acid
gases and aerosols on different vegetation types under different atmospheric conditions was studied
to some extent in the late 20th century, however there is limited literature available so further
research is needed to carry out sensitivity tests and experiments on a range of plants and crops to
establish thresholds and likely impacts, particularly on crops. The development of new products to
facilitate emergency management, such as hourly concentration maps based on deposition
monitoring, would be of value.
Volcanic particulates and gases can also penetrate into infrastructure systems and buildings, and
potential effects on modern electronics, for instance, are not clearly understood. Monitoring of
dried grass would be necessary to identify risk of fluorosis. Livestock could be kept indoors to reduce
exposure. A volcanic haze or ‘vog’ is likely to lead to reduced visibility and could impact different
sectors including transport. Experience elsewhere suggests that such a haze and its impacts will be
spatially and temporally variable.
Aviation and transport impacts
SO2 and sulphate (in the form of sulphuric acid) could cause damage to airframes and sulphate
deposits can accumulate in turbines blocking cooling holes and leading to overheating during flight9.
Sulphate aerosols also accelerate corrosion thus leading to a need for increased maintenance and
decreasing engine lifetime. There is the possibility of crew and passengers being exposed to toxic
gases on a plane/helicopter if SO2 for example has not fully oxidised in the atmosphere. In order to
quantify what the effects may be, more research and modelling work is needed. The potential for
reduced visibility would also need to be taken into account by others in the transport sector (e.g.
shipping).
Official advice in an emergency
In the event of a Laki‐type eruption, guidance will be needed for the public and all sectors including
transport workers, schools, farmers, veterinarians, water managers and critical infrastructure on
living with and managing the consequences of volcanic air pollution. Modelling is needed to
establish the likelihood of SO2 or other gases and aerosols reaching the UK and planning should be in
place in the event of a future eruption for warning and advising the population on the possibility of
peaks in gas and aerosol concentrations (which cannot currently be modelled at appropriate
resolution with sufficient accuracy to characterise human exposure). Modelling and further
investigation is also needed to establish whether SO2 or other gases and aerosols could be a hazard
to crew and passengers at flight levels.
9 Miller and Casadevall, 2000

1
1. Introduction
1.1 Background
1.1.1 During the 2010 eruption of the Eyjafjallajökull volcano, the Government’s Chief Scientific
Adviser Sir John Beddington convened a Scientific Advisory Group in Emergencies (SAGE) in
order to respond to the situation. One of the tasks of the group was to assess future scenarios
of volcanic activity in Iceland that might impact the UK. Each scenario had to be based on a
documented historical event.
1.1.2 Two scenarios were adopted for the National Risk Assessment (NRA): Eyjafjallajökull 2010 (a
prolonged small‐moderate‐magnitude explosive eruption10) and Grímsvötn 1783‐4 (a large‐
magnitude prolonged fissure eruption from the Laki craters). The Laki 1783‐4 eruption
represents the ‘reasonable worst case scenario’ in NRA terms. Based on data available at the
time, the probability of such an event occurring in given future time periods and subsequently
the likely impacts of such an event were documented for the NRA. Volcanic eruptions were
identified in the National Risk Register (NRR) for the first time in 2011, based on the NRA.
1.1.3 The British Geological Survey (BGS) receives some funding from government to provide a
national capability in volcanology. Therefore BGS responded to the 2010 eruption in several
ways including a) providing advice to government and agencies when required and particularly
during the crisis, b) liaising with partners in Iceland at the University of Iceland (UoI), Icelandic
Meteorological Office (IMO) and Icelandic Civil Protection (National Commissioner of the
Icelandic Police), c) supporting capacity building in Iceland and in the UK by enhancing existing
monitoring networks (e.g. geophysical and gas monitoring in Iceland, volcanic ash collection
and analysis in the UK), d) supporting contingency planning for future eruptions.
1.1.4 As part of this effort, the Civil Contingencies Secretariat requested that the source
characteristics of a future Laki‐type eruption scenario be considered and documented to
facilitate modelling of the potential future impacts on the UK. It was proposed that an expert
elicitation would be the best way to establish preliminary values for source characteristics and
uncertainties and to bring together a multidisciplinary group of experts. Professor Willy
Aspinall has many years of experience in conducting expert elicitations and led this element of
the work. The task was commissioned in April 2012.
1.2 Aims and Objectives
1.2.1 The main aims of this work are to facilitate modelling of the ‘Laki‐type eruption scenario’ and
government planning for a future large magnitude fissure eruption in Iceland and also to
engage the interest of the scientific research community.
1.2.2 The main objective of this work is to characterise a Laki‐type eruption in terms of a range of
appropriate ‘source’ parameters for modelling. Additional goals are to:
10 A glossary of terms including magnitude is given in Appendix E.

2
establish likely eruption location, duration, dynamic evolution.
evaluate the eruptive gases, aerosols, ash that may be produced and could ultimately
lead to impacts in the UK.
establish what chemical reactions, physical processes and meteorology should be
included in modelling of plume transport.
establish what the wet and dry deposition rates might be.
characterise likely concentrations in the UK based on current knowledge.
identify what the optimum monitoring and observation networks might look like from
source to UK.
understand what data on concentrations and deposition are required by health,
environment and infrastructure experts.
identify knowledge gaps.
make recommendations for further work.
1.3 Notes
1.3.1 We do not consider the effect of volcanic eruptions on global climate in this study.
1.3.2 This report contains a compilation of key papers in volcano and atmospheric science, the
results of an expert consultation and the recommendations of the expert group based on a
deliberative exercise and open discussion. These findings are primarily aimed at a professional
multidisciplinary audience who will be involved in observing or modelling volcano eruptions
and those who may have to respond to future eruptions.
1.3.3 We recognise that from a science perspective this is a multidisciplinary problem that requires
co‐working, collaboration and co‐production across disciplines.
1.3.4 This is not an impact assessment but will facilitate the modelling needed to fully understand
what the impacts across different sectors might look like.
1.3.5 This document was compiled during May‐June 2012. The findings reported within this
document reflect the current state of knowledge which will change with time and further
research.
1.4 Methods
1.4.1 The literature reviews (chapters 2‐5) were carried out before the May 2012 meeting and key
papers were collated as a resource.
1.4.2 A multidisciplinary expert group from academia, research institutes and institutes with
operational responsibilities was identified covering volcanology, meteorology and atmospheric
science to discuss the source characteristics of a Laki‐type eruption. Those identified were

3
invited to participate in a three day meeting in London. A small number of representatives
from the health and environmental impacts fields were invited to join the discussions and
present the requirements of modellers in these fields. The group size was limited by available
funds.
1.4.3 The original intention had been to elicit scientists in Iceland as well but the logistics for this
proved too challenging in the time available. It is hoped that the process can be repeated in a
year or two to include our Icelandic colleagues and take into account what has been learned
during this exercise.
1.4.4 The expert group was also invited to provide additional peer‐reviewed literature to the
collection.
1.4.5 Briefing notes on the fundamentals of expert elicitation and the scope of the exercise were
circulated to the expert group (Appendix B).
1.4.6 A draft set of target questions for discussion and elicitation at the meeting was prepared and
circulated to the expert group, who were invited to submit revisions or further questions.
Several feedback responses and suggestions were provided by group members, ahead of the
meeting.
1.4.7 The questions were combined into a list and then reduced to a number of key points that
could be addressed in the available time. The revised list was circulated to the expert group for
comment.
1.4.8 The meeting was held in London and comprised further discussion on the questions to be
answered (day one), a deliberative exercise (on qualitative questions) and an expert elicitation
to capture the current perception of uncertainties of source term characteristics for modelling
(day two), and the presentation and discussion of results (day 3).
1.4.9 The outcomes of much of the deliberative exercise are presented in Chapter 6 on monitoring.
The outcomes of the expert elicitation are presented in Chapter 7 with a brief discussion on
impacts presented in Chapter 8 and a summary with knowledge gaps and recommendations
highlighted in Chapter 9. Additional useful and relevant data and documents are presented in
the Appendices.
1.4.10 There is a glossary (Appendix E) containing definitions of some terms.
4
2. Fissure eruptions in Iceland
2.1 Iceland’s volcanic systems
2.1.1 Iceland is situated on the mid‐Atlantic tectonic plate boundary and also on a mantle ‘hot
spot’ both of which control the occurrence of volcanism. A wide belt of active volcanoes and
faulting follows the plate boundary from north to south through Iceland (Saemundsson, 1979;
Thordarson and Larsen 2007) this is shown as dark grey in Figure 1. The spreading apart of two
tectonic plates through faulting, fracturing and volcanic eruptions is known as ‘rifting’.
2.1.2 Principal volcanic structures within the volcanic zones are called ‘volcanic systems’. A
volcanic system comprises a fissure swarm (an elongate zone of fractures and eruptive
fissures) or a central volcano or both and has a typical lifetime of 0.5‐1.5 million years
(Thordarson and Larsen 2007). Iceland has thirty volcanic systems. The Laki eruption was from
fissures belonging to the Grímsvötn volcanic system.
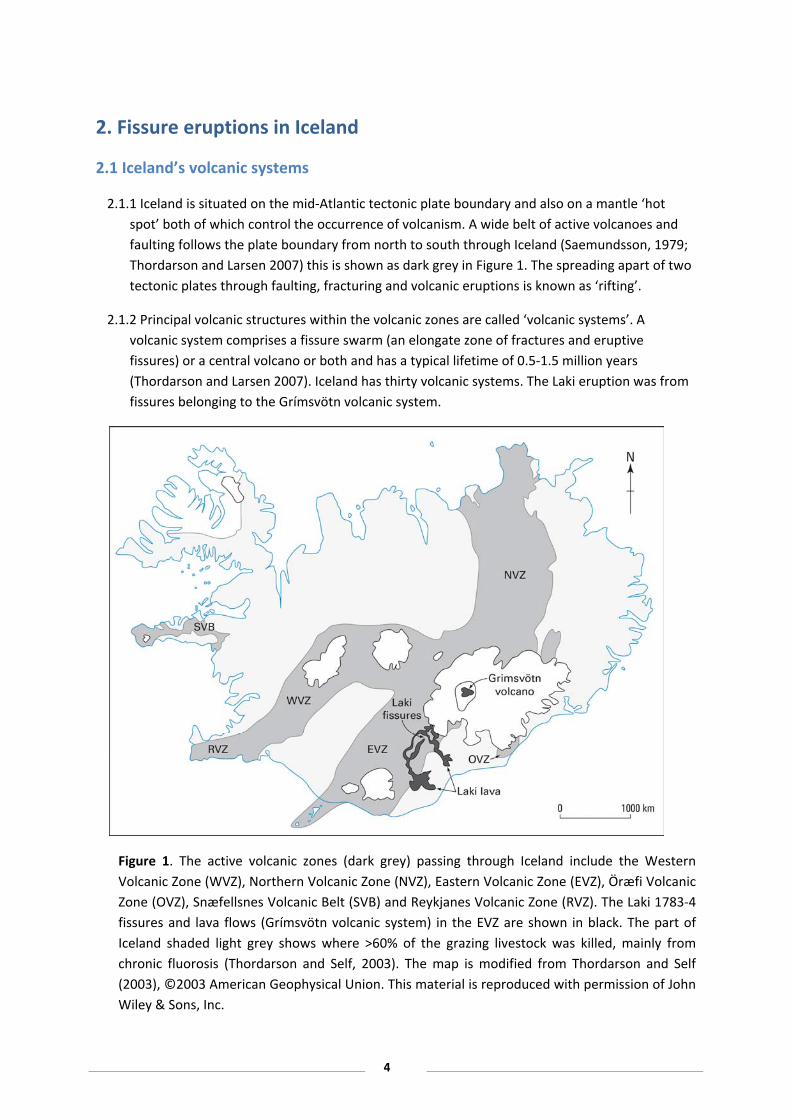
Figure 1. The active volcanic zones (dark grey) passing through Iceland include the Western
Volcanic Zone (WVZ), Northern Volcanic Zone (NVZ), Eastern Volcanic Zone (EVZ), Öræfi Volcanic
Zone (OVZ), Snæfellsnes Volcanic Belt (SVB) and Reykjanes Volcanic Zone (RVZ). The Laki 1783‐4
fissures and lava flows (Grímsvötn volcanic system) in the EVZ are shown in black. The part of
Iceland shaded light grey shows where >60% of the grazing livestock was killed, mainly from
chronic fluorosis (Thordarson and Self, 2003). The map is modified from Thordarson and Self
(2003), ©2003 American Geophysical Union. This material is reproduced with permission of John
Wiley & Sons, Inc.

5
2.1.3 All volcanic zones in Iceland (dark grey in Figure 1) could be the sites of future eruptions. The
main volcanic zones include the Northern Volcanic Zone (NVZ), the Western Volcanic Zone
(WVZ), the Reykjanes Volcanic Zone (RVZ) and the Eastern Volcanic Zone (EVZ). The Eastern
Volcanic Zone (EVZ) has been the site of most volcanic activity in historical times. The Öræfi
Volcanic Belt (OVB) under the southern part of Vatnajökull glacier may be an embryonic rift
zone and the Snæfellsnes Volcanic Belt (SVB) in the far west of Iceland is an older rift zone
(Thordarson and Larsen, 2007).
2.1.4. Geological mapping combined with geochemical and petrological analysis and dating
enables scientists to identify the eruption products and eruption histories of the different
volcanic systems (e.g. Saemundsson, 1979; Jóhannesson and Sæmundsson, 1998; Thordarson
and Larsen 2007).
2.2 Magma productivity in Iceland
2.2.1 Magma is molten or partially molten rock beneath the Earth’s surface. The type of magma
erupted from a volcanic system in Iceland (or any volcano) may vary between eruptions or
even during phases of a single eruption and this affects the style of eruption. The most
important magma variables that control the style of eruption are composition, temperature,
crystal content and amount of gas (e.g. Parfitt and Wilson, 2008).
2.2.2 Magma undergoes chemical evolution from the moment it is first formed in the Earth’s
mantle until its eruption at the surface. Magmas erupted in close to their original state almost
direct from magma reservoirs at the base of the Earth’s crust are typically basaltic in
composition. Some magmas undergo significant compositional changes, mainly during storage
in the crust and may be referred to as ‘evolved’or silicic.
2.2.3 Measurement of the total silica (SiO2) content (by weight) of magma allows compositional
classification as follows: basaltic magma (45‐52% SiO2), intermediate magma (52‐62% SiO2),
silicic magma (>62% SiO2). Magmas with lower SiO2 content (basaltic magmas) typically have
lower viscosity and higher temperatures than higher SiO2 magmas (silicic magmas).
2.2.4 Eruptions of basaltic composition contribute 79% of the total erupted volume of magma in
historical times in Iceland , intermediate composition 16% (95% of this attributed to Hekla) and
silicic composition 5% (50% attributed to the Öræfi 1362AD eruption; Thordarson and Larsen,
2007). The Laki fissure eruption had a basaltic composition.
2.2.5 The total volume of magma erupted (measured as lava and tephra11 volumes combined) in
the last 1130 years (historical time in Iceland extends back to late 9th century) is 87 km3
(DRE12). Of the total, 77% was erupted by just four volcanic systems in the Eastern Volcanic
Zone (EVZ): Grímsvötn, Barðarbunga/Veidivotn, Hekla and Katla (Thordarson and Larsen, 2007,
Table 1).
11 Tephra is fragmented material formed during explosions (includes ash) 12 DRE ‐ Dense Rock Equivalent

6
2.2.6 The EVZ accounts for ~79% (~69km3) of the total erupted magma volume in historical time,
the Western Volcanic Zone and Northern Volcanic Zone account for 15‐16% (Thordarson and
Larsen, 2007).
Volcanic zone
Number of eruptions in historical time
Volume of magma
erupted in historical time (km3)
EVZ Katla 21 + 25EVZ Hekla 23 13
EVZ Bardarbunga‐Veidivötn
23 + 10
EVZ Grimsvötn ~ 70 21
Table 1. The four most active volcanic systems in historical times (about last 1130 years) are in the
Eastern Volcanic Zone. There were 205 historical eruptive events in Iceland and the total erupted
volume was 87km3, 77% of this was erupted by these four systems in the EVZ (data compiled from
Thordarson and Larsen 2007).
2.2.7 Historical eruptions in Iceland have been defined by Thordarson and Larsen (2007) as
follows: effusive (>95% of the erupted magma is lava), explosive (>95% of erupted magma is
tephra), anything between these two end‐members is referred to as a mixed eruption. The
great majority of historical eruptions have been explosive (about three‐quarters). The Laki
eruption was mixed and produced a relatively large volume of tephra (see section 3.1).
2.3 Fissure eruptions
2.3.1 Volcanic fissures are linear vents, that are orientated parallel to the regional rift zone and
are formed as a result of a single eruptive episode. The magma is believed to be fed from a
great depth directly to the surface along a dyke. Initially, a long section of a fissure may erupt
and then activity commonly becomes focused with time at several vents along the fissure (Fig.
2).
2.3.2 A fissure eruption may comprise several episodes, each opening a new fissure. Each episode
begins with a short‐lived explosive phase lasting hours to days followed by a phase of lower
intensity typically characterised by lava fountaining.
2.3.3 Fissure eruptions are always characterised by magmas of basaltic composition (45‐52% SiO2),
high temperature and low viscosity.
2.3.4 The degree of explosivity is controlled mainly by gas content of the magma, viscosity and
eruption rate. When much of the dissolved gas in the magma is able to separate from the
magma before the eruption, the resulting eruption may be just mildly explosive and
characterised by lava fountains (or ‘fire fountains’) of incandescent fragmented magma that

7
rise above the vent and then collapse to either coalesce into lava flows or form spatter
cones/ramparts (Fig. 2).
2.3.5 Fissure eruptions can be vigorously explosive, especially when a fissure first opens up. The
interaction of water and magma can also lead to highly explosive hydromagmatic or
phreatomagmatic eruptions that generate volcanic ash.
2.3.6 There have been 205 eruptions in historical time (last 1130 years) identified based on the
mapping of eruption products and analysis of historical records (Thordarson and Larsen, 2007).
Of these, 13 have been classified as prolonged fissure eruptions with varied styles of activity
mostly consisting of lava fountains and lava flows (Fig. 2).
2.3.7 Five of these 13 fissure eruptions produced substantial tephra (fragmented material formed
during explosions). Three of these produced >1km3 tephra (Thordarson and Larsen, 2007). For
comparison, the Eyjafjallajökull eruption in 2010 produced a total of 0.27 km3 tephra much of
which was fine ash due to magma‐water interaction (Gudmundsson et al., 2012). It is the
grainsize of the tephra that largely controls the potential for it to be transported significant
distances.Although fine ash is not normally a major eruption product of fissure eruptions it
may be generated if the erupting magma interacts with groundwater, surface water or
snow/ice.
Figure 2. Example of an active fissure vent on the East Rift Zone, Hawaii. Magma erupts along
the linear fissure and the intensity of activity varies through time. The eruption products are
dominated by lava which flows away from the fissure (here into a previously active fissure) and
gas/aerosol which rises in the atmosphere to different heights depending on eruption intensity
and buoyancy effects. Published with permission: U. S. Geological Survey – Hawaiian Volcano
Observatory.
8
2.3.8 Eruptive fissures and associated aligned fractures and faults are collectively known as
‘fissure swarms’. Iceland has thirty volcanic systems but only twenty one of these feature
existing fissure swarms.
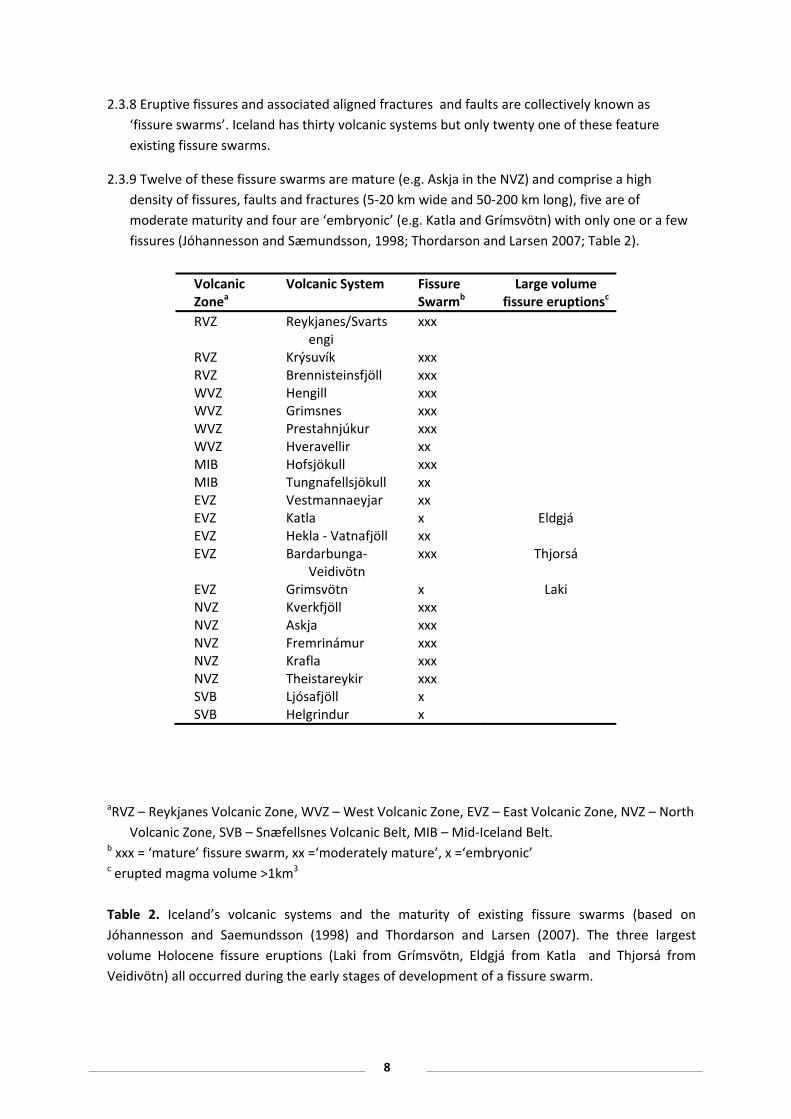
2.3.9 Twelve of these fissure swarms are mature (e.g. Askja in the NVZ) and comprise a high
density of fissures, faults and fractures (5‐20 km wide and 50‐200 km long), five are of
moderate maturity and four are ‘embryonic’ (e.g. Katla and Grímsvötn) with only one or a few
fissures (Jóhannesson and Sæmundsson, 1998; Thordarson and Larsen 2007; Table 2).
aRVZ – Reykjanes Volcanic Zone, WVZ – West Volcanic Zone, EVZ – East Volcanic Zone, NVZ – North
Volcanic Zone, SVB – Snæfellsnes Volcanic Belt, MIB – Mid‐Iceland Belt. b xxx = ‘mature’ fissure swarm, xx =‘moderately mature’, x =‘embryonic’ c erupted magma volume >1km3
Table 2. Iceland’s volcanic systems and the maturity of existing fissure swarms (based on
Jóhannesson and Saemundsson (1998) and Thordarson and Larsen (2007). The three largest
volume Holocene fissure eruptions (Laki from Grímsvötn, Eldgjá from Katla and Thjorsá from
Veidivötn) all occurred during the early stages of development of a fissure swarm.
Volcanic Zonea
Volcanic System Fissure Swarmb
Large volume fissure eruptionsc
RVZ Reykjanes/Svartsengi
xxx
RVZ Krýsuvík xxx RVZ Brennisteinsfjöll xxx WVZ Hengill xxx WVZ Grimsnes xxx WVZ Prestahnjúkur xxx WVZ Hveravellir xx MIB Hofsjökull xxx MIB Tungnafellsjökull xx EVZ Vestmannaeyjar xx EVZ Katla x Eldgjá EVZ Hekla ‐ Vatnafjöll xx EVZ Bardarbunga‐
Veidivötn xxx Thjorsá
EVZ Grimsvötn x Laki NVZ Kverkfjöll xxx NVZ Askja xxx NVZ Fremrinámur xxx NVZ Krafla xxx NVZ Theistareykir xxx SVB Ljósafjöll x SVB Helgrindur x

9
Large‐volume fissure eruptions
2.3.10 Following Thordarson and Larsen (2007), here we define large fissure eruptions in Iceland as
those that erupt more than 1km3 magma (DRE). Erupted volume can be converted to erupted
mass (if the magma density is known) to give ‘magnitude’ which allows different types of
eruptions worldwide to be compared. The eruptions typically have durations of months to
years with several distinct episodes.
2.3.11 The ‘embryonic’ Katla and Grímsvötn fissure swarms produced the two largest fissure
eruptions in Iceland in historical times (Eldgjá 934‐938 and Laki 1783‐4 AD respectively – Table
2). The overall largest Holocene (last ~12,000 years) fissure eruption, Thjorsá also took place
when the Veidivötn fissure swarm was immature (Thordarson and Larsen, 2007).
Large‐volume fissure eruptions (Holocene)
2.3.12 There have been fourteen large‐volume fissure eruptions just from the Grimsvötn,
Barðarbunga/Veidivötn and Katla volcanic systems during the Holocene (Thordarson and
Larson, 2007). These three systems have been by far the most productive systems (in terms of
erupted magma volume) during the Holocene (Thordarson et al. 2003), see Table 3.
Volcanic system Eruption Age (years BP) Calendar age Volume (km3)
Veidivötn Thjorsá lava c.8600 22‐25 Veidivötn Rauðhóll –Flögd lava >8000 1 Veidivötn Háganga >8000 1 Veidivötn Háa‐Botnar lava >8000 1.1 Veidivötn Tungnáa lava 6800 1.4 Veidivötn Tungnáa lava 6700 3.8 Veidivötn Sigalda lava 6200 3.4 Veidivötn Brydja lava c.4000 1 Veidivötn Búrfell –Dreki lava 3200 6.5 Grímsvötn Halsar‐Botnar lava c. 6000 >3 Grímsvötn Núpar lava 3800 7 Grímsvötn Laki 227 AD 1783‐1784 15.1 Katla Hólmsá c.6800 >5 Katla Eldgjá c. 1070 AD 934‐938 19.6
Table 3. Holocene large‐volume fissure eruptions in the Veidivötn, Grímsvötn and Katla volcanic
systems. Years BP are calculated from AD 2010 (modified from Thordarson et al., 2003 and
references therein), © The Geological Society of London 2003.
2.3.13 The three largest Holocene fissure eruptions in Iceland were: Thjórsá 8600BP, Eldgjá 934‐
938 AD, and Laki 1783‐4 (Thordarson et al., 2003; Tables 2, 3 and 4). The historical record,
available data and research on each of these eruptions is less as one goes back in time and is
summarised in Table 4.

10
2.3.14 The large‐volume Holocene fissure eruptions are not equally distributed through time but
have tended to occur mainly in distinct time periods of a few hundred years duration between
9000‐8000 BP, 6800‐6200 BP, 4000‐3200 BP and a historical period including events in 934 AD
and 1734 AD (Table 3).
Large‐volume fissure eruptions (historical time)
2.3.15 Based on a combination of geological mapping and historical documents, four large‐volume
fissure eruptions are known to have taken place in Iceland during historical time (the last 1130
years): 1. Eldgjá 934‐938 AD (Katla‐ EVZ),2. Hallmundarhraun ~950 AD (WVZ), 3. Frambruni
pre‐13th century (NVZ) and 4, Laki 1783‐4 (Grimsvötn ‐ EVZ). According to Thordarson and
Larsen (2007), these four historical eruptions account for more than one half (54%) of the total
erupted magma volume in historical time in Iceland.
Fissure eruptions
Eruption date
No. of episodes
Erupted volume (km3)
References
Krafla 1975‐1984 9 Surtsey 1963‐1967 6‐7 Askja 1921‐1929 5‐6 Trollahraun 1862‐1864 2‐3 Skaftáreldar
(Laki) 1783‐1785 10‐11 15.1 Thordarson & Self, 1993;
Thordarson et al., 2003a, 2003b.
Myvatnseldar 1724‐1729 6‐7 Veidivötn 1477‐ Illahraun 1227‐ Frambruni
(Dyngjuhals) Pre‐13th C 4.0 Thordarson and Larsen, 2007
Krysuvikureldar 1151‐ Y‐Hellnaharaun C10 Husafellsbruni c. 950 Eldgjá c. 934 19.6 Larsen, 2000, 2005;
Thordarson et al. 2001, 2003 Hallmundarhraun c.900 8.5 Sinton et al. 2005 Vatnaöldur c. 870
Table 4: Historical fissure eruptions in Iceland (modified from Thordarson and Larsen 2007 and
references therein). Large‐volume fissure eruptions (erupted magma volume >1km3) are shown in
bold.
2.3.16 The average recurrence rate for large‐volume fissure eruptions in historical times in Iceland
is 270 years, the last such eruption was Laki in 1783‐4. Statistically, the very short time period
(~1130 years) with reliable data available makes detailed analysis challenging. The eruptions
vary considerably in terms of volume of erupted magma. For fissure eruptions of any erupted
volume, the average recurrence rate in historical times is 88 years (Table 4).

11
2.3.17 Historical large‐volume fissure eruptions have produced some tephra which is preserved as
layers where it fell to the ground and these layers can be mapped and the minimum volume
calculated, this ranges from 0.4 to 1.2km3 (Thordarson and Self, 1993; Thordarson and Larsen,
2007). If there is no magma‐water interaction, most tephra will fall to the ground near‐source.
2.3.18 The historical Vatnaöldur (~870AD) and Veidivötn (1477AD) eruptions were the two largest
phreatomagmatic fissure eruptions in Iceland during the whole Holocene (Larsen, 1984;
Thordarson et al., 2003; Table 4). These eruptions interacted with water which may have
included groundwater, surface water, snow and ice.
2.3.19 In general, the uncertainty on calculation of erupted magma volumes of historical eruptions
is substantial and variable (Table 5).
Date Total volume (km3)
Volume error
Mass(kg)
SO2
(Mt) SO2
error Duration
Thjórsá 8600BP 22‐25 ~25+% ‐ 150 20‐25% 600 yrs (?)
Eldgjá 934‐938AD 19.6 ~25% 5.5 x 10¹³ 184 20‐25% 1‐3 yrs (?)
Laki 1783‐1784AD 15.1 ~15% 4.2 x 10¹³ 122 20‐25% 8 months
Table 5. Published data for the three largest Holocene fissure eruptions in Iceland (Thordarson and
Self, 2003; Thordarson and Larsen, 2007). The SO2 error is discussed in section 6.1.41.
2.3.20 The largest volume fissure eruptions that have occurred during the Holocene in Iceland are
still orders of magnitude smaller than the largest eruptions of this type that have occurred
worldwide in geological time. ‘Flood basalts’ are very large magnitude basalt eruptions that
correlate with mass extinction events (e.g. Courtillot and Renne, 2003). The volume of the Roza
lava in the Columbia River Flood Basalt Province is ~1300 km3 (compared to the Laki flow
volume of 14.7 km3). The duration of emplacement of the Roza lava and by inference the
duration of the fissure eruption may have been as short as years to decades (Thordarson and
Self, 1998).

12
3. Characteristics of large‐volume fissure eruptions in Iceland
3.1 LAKI
3.1.1 The 1783‐4 eruption of Grímsvötn (Laki craters) is the best‐characterised historical large‐
volume basaltic fissure eruption in Iceland. It was the second largest fissure eruption
worldwide in the last 2000 years (after the ~935AD eruption of Eldgjá). Some characteristics of
the eruption based on the literature are presented below.
Eruption character
3.1.2 The Laki eruption of 1783‐4 occurred from a 27 km long volcanic fissure in an ice‐free portion
of the Grímsvötn volcanic system (Fig. 1). It produced ~14.7 km3 of lava (error ~15% see Table
5) that flowed to cover an area of ~565 km2 and about 0.4 km3 of tephra. This is the second
biggest tephra fall deposit by any Icelandic eruption in the last 250 years (Thordarson and Self,
1993; Thordarson and Self, 2003).
3.1.3 The calculated erupted volume for the Laki eruption is reasonably well‐constrained as the
lavas and tephra are well‐exposed, the errors arise mainly from a need to recreate the pre‐
1783 topography (Table 5; Thordarson pers. comm.).
3.1.4 The Laki eruption began on June 8, 1783 and lasted eight months (Thorarinsson, 1969;
Thordarson and Self, 1993). The eruption occurred as 10 distinct episodes of activity, each
starting with a short‐lived Strombolian to sub‐Plinian explosive phase (eruption rate <7000
m3/s) followed by a long‐lived phase of lava‐fountaining (eruption rate 1000‐3000 m3/s)
(Thordarson and Larsen, 2007). Some of the first explosions were phreatomagmatic, probably
caused by groundwater influx to the vent (Thordarson and Larsen, 2007).
3.1.5 Theoretical models suggest that eruption columns reached heights >13 km during the more
intense phases and columns >10 km high were maintained during the first 3 months of activity
(Woods, 1993). The altitude of the atmospheric tropopause in the region of Iceland is typically
9‐10 km so these explosive episodes almost certainly injected materials into the stratosphere.
This height, character and persistence of the eruption columns is believed to have had an
impact on global atmosphere and environment with reports of aerosol clouds over north‐
eastern North America, Central Asia and Siberia (e.g. IPCC 3rd Assessment Report, 2001; Fiacco
et al., 1994; Thordarson and Self, 2003).
Volatile emissions
3.1.6 Thordarson et al. (1996) calculated the total mass of major gas species emitted during the
Laki eruption using petrological studies as shown in Table 6. Of this mass, it is calculated that
about 96% was released during the first 5 months of activity (Figure 3). The first three fissure‐
opening episodes lasted just 10 days in total and released 40% of the total SO2. About 60% of
the SO2 mass was released in the first six weeks.
3.1.7 The SO2 release from Laki yields a theoretical sulphuric aerosol (H2SO4) mass of ~250 Tg (1
teragram (Tg) = 1 x 10⁹ kg = 1 megatonne (Mt)), assuming a composition of 75 wt % H2SO4 and

13
25 wt % H2O for the aerosols (Thomason and Osborne, 1992) and a complete conversion of
SO2 to H2SO4 aerosols (Thordarson et al., 1996).
3.1.8 For comparison, 76 Tg of SO2 was ejected by burning fossil fuel and industry in 2001 (from all
sources globally over 12 months) and induced 122 Tg of sulphate aerosols (IPCC 3rd Assessment
Report, 2001). There were global anthropogenic SO2 emissions of approximately 115 Tg during
the year 2005 (Smith et al., 2011).
SO2 H2O HCl HF
Laki ~122 235 235 15
Table 6 Estimates of the amount of SO2, H2O, HCl and HF released by the Laki eruption into the
atmosphere in Tg (1 Tg = 1 x 10⁹ kg = 1 Mt), from Thordarson et al. (1996).
Figure 3. a) Time series showing each fissure opening episode, explosive phases and relative
magma discharge rate. b) The SO2 mass released by individual episodes, lava degassing and
cumulatively through the eruption (1Mt = 1Tg). Modified from Thordarson and Self (2003), ©2003
American Geophysical Union. This material is reproduced with permission of John Wiley & Sons,
Inc.

14
3.1.9 Most of the SO2 mass was released at the vents (80%) and was transported by eruption
columns to lower stratospheric altitudes (>9 km; Thordarson and Self, 2003). About 20% of the
SO2 mass was released from the lava flows at heights estimated to be up to around 5 km and
there were observations of a low altitude cloud and tephra deposits across eastern Iceland
(Figure 1; Thordarson and Self, 1993).
3.1.10 The mass of magmatic water released into the atmosphere by the activity at the Laki
fissures exceeded the amount of SO2 by a factor of 1.9 (Thordarson and Self, 2003).
3.1.11 The winds transported the plumes eastward and the eruption maintained a sulphuric
aerosol veil that affected the Northern Hemisphere for >5 months (e.g. Stothers, 1996, 1999;
Thordarson and Self, 2003).
3.2 ELDGJÁ
3.2.1 The Eldgjá eruption which started in Iceland in 934 AD is one of the most voluminous basaltic
fissure eruptions worldwide in historical time (Miller, 1989; Larsen 2000; Table 5). A total of
18.3 km3 of lava and ~1.3 km3 of tephra was erupted (Larsen 2000) but this is partially covered
by Laki deposits so errors are larger than for Laki and the duration of the eruption is not well‐
constrained due to less complete contemporary records (Table 5).
3.2.2 The 75 km‐long Eldgjá fissure vents extend from Myrdalsjökull glacier in the southwest to
Vatnajökull glacier to the northeast and are part of the Katla volcanic system (Thordarson et al.
2001). The subglacial nature of parts of the fissures at least partially explains the large volume
of tephra (there was effective magma fragmentation due to magma‐water interaction).
Eruption character
3.2.3 The Eldgjá eruption is less‐well reported than the Laki eruption, so deductions about the
character of the eruption have been drawn largely from the stratigraphy of the tephra deposits
and near‐vent accumulations (Larsen, 1993, 2000; Miller, 1989, Thordarson et al., 2001).
3.2.4 Thordarson et al., (2001) suggested that the Eldgjá eruption had a near identical eruption
character to Laki, with several discrete episodes of activity each starting with vigorous
explosive activity releasing >80% of the volatile mass. There may have been as many as 35
separate episodes.
3.2.5 Deposits suggest phases of vigorous explosive activity and intense lava fountaining (similar to
Laki). Proximal spatter deposits have been found capping surrounding topographic highs (50‐
200m above base level; Thordarson et al. 2001). Tephra deposits around the vents record
strombolian activity from the subaerial part of the fissure system.
3.2.6 More than 96% of the total erupted volume was subaerial (no ice and minimal groundwater
interaction). The subaerial part of the fissure system also produced much of the lava. The
southwestern end of the fissure system was dominated by phreatomagmatic activity (<4%
total volume) due to interaction with meltwater from Myrdalsjökull (Thordarson et al. 2001).
3.2.7 The large volume of tephra (~1.3 km3) had a wide dispersal, with 0.5 cm thick deposits
located up to 100 km from the source (Larsen 1993, 2000; Thordarson et al. 2001).

15
3.2.8 It has been suggested that the initial phreatomagmatic (subglacial) eruption columns for
Eldgjá are likely to have reached 14‐16 km above vent (Larsen, 1993), based on the plume
observations from the 1918 summit eruption of Katla.
Volatile emissions
3.2.9 Several studies have sought to estimate the sulphur yield of the eruption. Petrologic
estimates by Palais and Sigurdsson (1989) produced 55 Mt SO2. Hammer et al (1980) and
Zielinski et al. (1995) used acidity data from ice‐cores in Greenland to estimate the H2SO4
aerosol loading at 165 and 93 Mt respectively. However, the most recent analysis of
Thordarson et al. (2001) suggests magma degassing occurred in two stages, releasing ~184 Mt
SO2 at the vent site, with a further ~35 Mt emitted from the lava flow surface and a H2SO4
aerosol yield of ~450 Mt.
3.3 THJÓRSÁ
3.3.1 The Thjórsá lavas are part of the Veidivötn fissure system that extends ~80km to the SW of
Bárðabunga , one of the most productive volcanic systems in Iceland in the Holocene
(Thordarson et al., 2003).
3.3.2 The Thjórsá lavas were erupted c.8600 BP and are the earliest of the Veiðivötn fissure
eruptions, with a volume of ~22‐25 km3 (Thordarson et al. 2003) they are the most voluminous
lavas in Iceland and the largest fissure eruption on Earth in the Holocene (Halldorsson et al.
2008). The Thjorsá lavas are buried by multiple deposits and have experienced erosion so there
is some uncertainty on the total erupted volume.
Eruption character and volatile emissions
3.3.3 Thordarson et al. (2003) report c.150 Mt of SO2 produced during this eruption (using
petrological methods) and they suggest that this eruption had a similar dynamic character to
Laki.
3.3.4 Characterisation of the eruptive activity is difficult because the vents for these lavas are
covered by younger lavas. There is also uncertainty on the duration of the eruption (Table 5).
16
4. Atmospheric dispersion and chemical transformation
4.1 Background
4.1.1 During a large‐volume basaltic fissure eruption, gases and particles will be released from
eruptive vents over a prolonged period of time forming a ‘volcanic plume’ that may, during
intense explosive episodes, reach the stratosphere and have far‐reaching effects (see section
3). Eruptive stratospheric plumes and their atmospheric impacts are the subject of much study
(e.g., Robock, 2000; Robock and Oppenheimer, 2003) but we will not consider climatic effects
in detail here, we focus instead on the troposphere.
4.1.2 Volcanic plumes are characterised by the atmospheric dispersal of volcanic gases and
aerosols which undergo complex chemical and physical transformations in the troposphere
during transport. The rates of reactions in a plume may be very different to the background
atmosphere, reflecting higher temperatures, humidity, aerosol content and possibly radical
production (e.g. Gerlach, 2004).
4.1.3 A volcanic plume interacts with the atmosphere in several ways including both physical and
chemical processes. The prevalent meteorology, in particular wind direction, dictates where a
plume is transported to and at what rate, it also controls critical factors such as cloud cover,
humidity and removal mechanisms such as wet deposition (see section 4.2). Chemical
reactions include gas‐phase reactions (homogeneous reactions) and reactions on, in or
between suspended gas, solid and liquid particles (heterogeneous reactions). Understanding
the chemistry is critical to understanding how the constituents of a plume are transformed
with time.
4.1.4 Volcanic plumes contain mostly gaseous water (H2O) and carbon dioxide (CO2) and volatile
acidic gas species such as sulphur dioxide (SO2), hydrogen sulphide (H2S),hydrogen
chloride(HCl), hydrogen fluoride (HF) and hydrogen bromide (HBr) (Symonds et al., 1994).
Although H2O is emitted in the gas phase (and is hence invisible), plumes contain abundant
potential condensation nuclei, so liquid water droplets condense to give the distinctive cloudy
appearance. The presence of these water droplets is significant to the fate of the more soluble
gas species (Horrocks et al., 2003) see section 4.3.
4.1.5 Information about the processes and rates of removal of acid gas species such as SO2, HCl
and HF from the gas‐phase is most important for volcanoes and volcanic impacts. Carbon
dioxide can be considered relatively inert during dilution in the atmosphere (e.g. Aiuppa et al.
2006).
4.2 Meteorological effects
4.2.1 Weather conditions directly affect the fate of volcanic plumes by controlling their dispersion,
transport and deposition. The ambient atmosphere around a volcano influences how high into
the atmosphere plume material can be lofted. Much depends on the strength of the eruption;
the weaker it is the more scope there is for atmospheric variations, such as wind‐shear and
stability to have an impact and reduce the eruption height. However, even for strong
eruptions, where the plume extends into the stratosphere, the stability of the stratosphere will

17
eventually cap its rise and upper level winds will determine its distribution (Petersen et al.,
2012).
4.2.2 The far‐field dispersal of a volcanic plume depends on the wind speeds and wind directions
that the plume encounters at altitude. These winds are governed by the mean wind field,
which is primarily determined by the large (synoptic) scale meteorology. Strong winds promote
rapid transport of the plume away from source whereas light winds result in the plume staying
near the source. The distance of transport is also determined by various in‐cloud processes
that occur as the volcanic cloud moves, including processes affecting the aggregation and
sedimentation rate of volcanic particles (Petersen et al., 2012). Atmospheric water content
determines the rate of wet deposition of particles from the plume and two main processes are
involved: washout where material is swept out of the atmosphere by falling precipitation and
rainout where material is absorbed directly into cloud droplets as the particles act as cloud
condensation nuclei.
4.2.3 Typically, the evolution of a plume will be influenced by differences in wind speed and
direction at different heights and one part of the plume may be transported faster or in a
different direction to other parts. The evolution of the plume is also influenced by synoptic
scale features, such as frontal uplift or subsidence due to high pressure systems (Dacre et al.,
2011). This can cause plumes to move upwards in the atmosphere or to become “trapped”
behind frontal features.
4.2.4 Chemical reactions in plumes are influenced by atmospheric temperature, humidity,
precipitation, cloud cover and the amount of sunlight (UV) reaching the plume. Atmospheric
water droplets are a medium for conversion of gas phase SO2 to aqueous phase sulphate
aerosol. In the boundary layer, a cycle of condensation on aerosols at night and evaporation
by day can greatly increase the concentrations of pollutants in the droplets (Oppenheimer,
2011). Temperature inversions overnight can act to trap boundary‐layer plumes at ground‐
level leading to concentration peaks during the night and early morning (demonstrated to
occur at the degassing volcano Masaya in Nicaragua, Oppenheimer et al., 2011).
4.2.5 All of these processes are represented either in Numerical Weather Prediction (NWP) models
or atmospheric dispersion models (that take NWP data as input) to varying degrees of detail.
All stages from the specification of the eruption source term, the initialisation of the NWP
forecast and the parameterisations within the models contribute to the level of confidence in
model predictions.
4.3 Chemical and physical reactions – SO2
4.3.1 Recent studies including von Glasow (2009) have demonstrated how volcanic plumes are
highly oxidising relative to the background troposphere and this is critical to the fate of species
such as SO2.
4.3.2 In the gas phase, SO2 oxidation occurs by reaction with hydroxyl radicals (OH) to form SO3
and then sulphuric acid (H2SO4) but this reaction is relatively slow. Möller (1980) calculated
tropospheric e‐folding times for homogeneous gas phase oxidation by OH of 12 days (i.e. the
time taken for SO2 abundance to decay exponentially to 1/2.718 of its initial level). Sulphuric

18
acid is hygroscopic so rapidly condenses to either add to existing liquid aerosols or to create
new ones (Fig. 4).
4.3.3 Oxidation of SO2 in the troposphere is faster via multiphase reactions when it partitions into
the aqueous phase (i.e. in cloud droplets or pre‐existing liquid aerosols) where it reacts with
dissolved hydrogen peroxide (H2O2) or ozone (O3) to form sulphate (SO4). This is a rapid
process, especially if the condensed water content of the plume is high and Möller (1980)
calculated mean tropospheric e‐folding times of <6 hours for oxidation within liquid particles.
The reaction with O3 is rapid in the liquid aerosol but more pH‐dependent than the reaction
with H2O2 (e.g. Hewitt, 2001).
4.3.4 Very short e‐folding times of just minutes at Montserrat (Oppenheimer et al., 1998) have
been explained by the high humidity tropics promoting SO2 oxidation in liquid particles
(Rodriguez et al., 2008). The influence of increased humidity on SO2 oxidation rates was also
observed at power stations (e.g. Finlayson‐Pitts and Pitts, 1986).
4.3.5 Other reactions for SO2 oxidation in the troposphere may include transition metal catalysis
(e.g. Fe2+ or Mn2+) or via homogenous liquid aerosol reactions (e.g. Horrocks et al., 2003;
Oppenheimer et al., 2011).
4.3.6 Photodissociation of SO2 in the gas phase to SO and O cannot occur in the troposphere
because UV solar radiation at the necessary wavelengths doesn’t penetrate this far but it is
important at higher levels in the atmosphere (Horrocks et al., 2003).
4.3.7 Sulphate aerosols tend to increase in size with time due to nucleation, coagulation and
condensation (Fig. 4). Volcanic sulphate aerosols act as cloud nuclei allowing condensation of
water to form clouds and often inducing rain near a volcano (e.g. Mather et al., 2003, 2004).
4.3.8 Sulphate aerosols may also lead to changes in existing clouds such as decreased particle size
and increased particle number which can be detected by satellite (e.g. Gassó, 2008). The
presence of sulphate in a plume tends to cause acidification of pre‐existing atmospheric
aerosol (von Glasow et al., 2009) and may lead to increased rates of acid‐catalyzed aqueous
reactions and revolatilisation of acidic gases (e.g. HCl, HBr, HF, HNO3).
4.3.9 Sulphate aerosol may also act as a medium for other reactions to take place within and on
the aerosol. This has been highlighted in kinetic models (e.g. Roberts et al. 2009; von Glasow,
2010). Von Glasow (2010) also shows how SO2 may have a role in mercury speciation which
may lead to elevated and harmful levels of mercury deposition around active volcanoes
(Oppenheimer et al. 2011).
4.3.10 Heterogeneous reactions (those occurring on the surface of a solid) and multiphase
reactions (those occurring within an aqueous medium) are usually more important at
controlling concentrations of soluble gases in a plume than slower homogenous gas phase
reactions (Ravishankara, 1997).

19
Figure 4 Diagram showing the main aerosol processes and tendency of aerosols to increase in size
with time (making them more visible to satellites) but many still remain in the PM2.5 and PM10
range. Based on a figure by J. Kazil, © Jan Kazil, University of Colorado/NOAA.
4.1.11 Sulphate aerosols affect Earth’s radiation balance because they backscatter incoming
radiation (Charlson et al., 1992) and absorb outgoing long wave radiation, the competition
between these two depends on particle size (Oppenheimer et al., 2011). Sulphate aerosols also
affect the hydrological cycle (Penner et al., 2001) by promoting cloud condensation (Graf et
al., 1997), by modifying the albedo of clouds (Twomey, 1977) and by modifying microphysical
properties and the lifetime of existing clouds (Jones et al., 2001). Suspended aerosols in the
troposphere and stratosphere also control atmospheric heating rates and photochemical
processes (e.g. Grainger and Highwood, 2003; Horrocks et al., 2003).
4.4 Chemical and physical reactions – HCl and HF
4.4.1 HCl is not a criterion air quality indicator like SO2 and so is less well‐studied (even though
chlorine is important in the stratosphere, Oppenheimer et al. 2003). HCl is much more soluble
in water than SO2 (Horrocks et al. 2003 based on Seinfeld, 1986) and its high solubility may
mean that there are fewer reaction pathways for HCl to get into solution than for SO2.
4.4.2 Uptake of HCl on aerosol and rain droplets is probably more important than dry deposition
for HCl and the rate of HCl removal is likely to be more strongly affected by liquid water than

20
SO2 due to its higher solubility. Johnson and Parnell (1986) showed that the pH of acid
rainwater at Masaya Volcano (in the tropics) was controlled by the amount of dissolved HCl
which was almost all removed from the plume by proximal rainfall, whereas SO2 was still
available for dissolution at long distances downwind.
4.4.3 Aiuppa et al. (2007) used observations and model predictions to show only minor HCl
chemical processing during plume transport at Etna in low humidity (cloud‐free) conditions
and over the short term (minutes). They proposed that chlorine partitioning into the liquid
phase is initially limited by the high acidity of the aerosol particles in the near‐field but
becomes important when the gas phase concentration is reduced by dilution. Even during
rainy periods there was not substantial HCl removal from the plume over the short term (e.g.
Aiuppa et al. 2006).
4.4.4 Delmelle et al. (2005) looked at the dynamics and kinetics of gas (SO2, HCl, HF) uptake by and
subsequent release from volcanic ash particles. They found that the presence of a water
coating on ash enhances scavenging (i.e. surface adsorption) of HCl and HF – such a coating is
highly likely in a ‘humid’ plume. They pointed out the need to assess how the gases interact
with particles coated with ice.
4.4.5 Delmelle et al. (2007) noted that reactions between gases/aerosols and silicate ash particles
remain poorly understood and this remains the case at the time of writing.
4.5 Deposition processes
4.5.1 Dry deposition is the removal of particles or molecules by settling on or sticking to ground‐
level surfaces (e.g. soils, vegetation, water, vehicles, infrastructure). Dry deposition rates
depend on the nature of the surface so for example, rates of acid deposition increase if leaf
surfaces are wet. Dry deposition velocities depend on the reactivity of the species, so in
experiments, HF (with high reactivity) has a deposition velocity of 1‐4 cm/s and SO2 of 0.1‐2
cm/s (Seinfeld, 1986). Delmelle et al. (2001) showed that SO2 and HCl had similar deposition
rates of c. 1.6 cm/s at Masaya volcano, Nicaragua.
4.5.2 Deposition of SO2 direct onto surfaces is likely if the plume is at ground level or there are a
high proportion of dry particles (e.g. ash particles) in the plume. It’s also enhanced in dry, cool
conditions.
4.5.3 Wet deposition is mainly about precipitation (Fig. 5). Aerosols, particles and gases are all
efficiently removed by rainfall. In an environment rich in condensed atmospheric water,
scavenging of the gas phase will be controlled by rates of reaction for different species.
Scavenging rates for HCl and HF are likely to be higher than SO2 which relies on chemical
reaction in preference to physical dissolution (Horrocks et al., 2003). These rates have
implications for monitoring.
4.5.4 Tabazedeh and Turco (1993) modelled the wet deposition from the 1991 Pinatubo eruption.
Once water began to condense, HCl dissolved rapidly to form solutions of 1‐5 wt% HCl. Large
volcanic eruptions often induce rainfall so removal of HCl may in general be efficient.

21
Figure 5. Factors relevant to aqueous removal of acid species from a volcanic gas plume. Reaction
rates depend upon diffusion, liquid phase reactions and solubilities. Local meteorology controls
atmospheric water content, and affects gas‐phase diffusion. A range of other possible catalysts and
reaction pathways are available in the real troposphere. Modified from Horrocks et al. (2003), © The
Geological Society of London, 2003.
4.6 Chemistry and models
4.6.1 Atmospheric concentrations do not relate linearly to emissions because there is significant
spatial and temporal variation in the local lifetimes of sulphur and other compounds in the
atmosphere. To link emissions to concentrations, complex atmospheric models are generally
understood to be required.
4.6.2 There are many different chemistry models in use for different purposes. Comparing
different models and their outcomes on specific scenarios can be very valuable.
4.6.3 There may be situations when focusing on first‐order transport of gases and particles (rather
than chemistry) can be of value and the chemistry can be ‘switched off’ to allow faster model
runs. Such models would forecast the pathways of volcanic emissions. Hydrogen fluoride, for
example may act as a tracer and SO2 will also act as a tracer once oxidants are used up.
Alternatively, a decay constant can be used to describe SO2 behaviour.
4.6.4 Ensemble modelling cannot currently be used in an operational situation but such
approaches can be used to provide bounds for impact assessments. Models using defined
source parameters (probability distributions) run over multiple years of numerical
meteorological data can provide suitable probabilistic bounds for risk assessments.

22
4.6.5 The lifetime of sulphate aerosols and SO2 in the troposphere is variable and depends on
altitude and season, being of the order of 5‐10 days at low altitudes between UK and Iceland
(Stevenson et al. 2003a; Figure 5). Given northwesterly winds, the travel time of volcanic
clouds between Iceland and UK is critical and may on rare occasions be as low as 6 hours for
northern Scotland with travel times varying on a daily basis. The sustained supply of gas and
aerosol from the source and unfavourable meteorology is necessary to maintain long‐term
(months) direct impacts in the UK.
4.6.6 Heard et al. (2012) tested the NAME model ability to model the release and dispersion of
volcanic SO2 and transformation to sulphate aerosol. The results suggest that the current
chemistry scheme shows promise as a tool for modelling SO2 and sulphate from volcanoes.

23
5. Observations, modelling and impacts of Laki 1783
5.1 Observations in Iceland and Europe in 1783
5.1.1 In Iceland, most of the grazing livestock was killed by chronic fluorosis following the Laki
fissure eruption (Figure 1, Thordarson and Self, 2003). About 25% of the island’s population
died in the aftermath of the eruption as a result of induced illness, environmental stress and
famine (Thorarinsson, 1979, 1981; Steingrimsson, 1998).
5.1.2 The first known observations of a volcanic haze in Europe were from the UK on 12 June
1783 (King and Ryskamp, 1981) and France on 14 June 1783 (Thordarson and Self, 2003) giving
a maximum travel time of pollutants from Iceland to Europe of 5‐7 days.
5.1.3 Accounts of health and environmental impacts throughout Europe and beyond have been
collected from historical documents including White (1789) and Montredon (1784) who quickly
concluded that the persistent haze across Europe was dry and sulphur‐rich, his first
descriptions imply high sulphur levels (Chenet et al. (2005). There were reports of extreme
heat, dry ‘sulphurous’ fogs and extreme thunder storms, ball lightning and large hailstones
(e.g. Durand & Grattan, 1999; Grattan et al 2003 and references therein; Brayshay and Grattan,
1999; Thordarson and Self, 2003; Table 7).
5.1.4 Ground frosts reported to have turned crops yellow in July 1783 were interpreted by
Brayshay and Grattan (1999) as anomalous cold snaps (further references in Thordarson and
Self (2003) and Grattan et al. (2003) but the ‘frosts’ may have been dry deposition.
5.1.5 Grattan et al (2003) collated observations of the weather and records of damaged vegetation
across Europe in the summer of 1783 (Table 7).
5.1.5 There was an unusually hot summer in Europe in 1783 and an unusually severe winter (1783‐
4) in the northern hemisphere (Thordarson and Self, 2003). Franklin (1784) was the first to link
volcanic activity with the unusually cold winter of 1783‐4.
5.1.6 Kington (1988) reconstructed the weather patterns in the 1780s and demonstrated that a
series of high‐pressure air masses were positioned over northwest Europe throughout the
summer.
5.1.7 Thordarson and Self (2003) present detailed historical observations of the European haze and
coincident temperature anomalies. They proposed that Laki aerosols were delivered to the
ground surface by subsiding air masses within anticyclones.
5.1.8 Highwood and Stevenson (2003) point out and summarise some uncertainties in earlier
studies concerning the altitude of the reported haze and dry fog across Europe which in some
accounts is at ground level but appears elsewhere to have been a higher altitude
phenomenon. They point out though (following Robock, 2000), that the geographical pattern
of any response to the volcanic aerosols, particularly temperature, would be spatially very
complex.

24
Location Observed weather Summary of symptoms of damage
Source
England ‘Uncommon gloom’ Smoky fog
Cereal crops: yellowedBarley: withered awns Oats: withered Rye: mildewed in appearance Beans: whitened and dying Pasture: dried Trees: shedding leaves and appear scorched as if by fire
Cullum (Grattan & Charman, 1994) Ipswich Journal, 12 July 1783 Cambridge Chronicle and Journal, 5 July 1783 Sherbourne Mercury, 14 July 1783
France Sulphurous dry fog Vine flowers: burnedOlives: fruit burned and falling Peas: badly damaged Melons: badly damaged Tree leaves: damaged Damaged the corn, which yielded hardly any crop
Rabartin & Rocher (1993)
Italy Dry fog Damaged wheat, empty ears, dried ears
Camuffo & Enzi (1995)
Netherlands Persistent ‘strong’ fog with a sulphurous smell
Leaves of bean and pear trees ‘affected’ ‘Changes to plants’ bleached leaves Leaf and fruit fall Drying and bleaching of leaves, some developing spots Leaf fall
Swinden (2001) Brugmans (1787)
Norway Smoky fog, ‘acrid rain’ Withered vegetationTree leaves ‘partly burnt’ Grass blackened
Thorarinsson (1981)
Sweden Smoky fog Crops destroyedVery poor harvest
Thorarinsson (1981)
Table 7 Observations and symptoms of damage on plants and crops in the summer of 1783 from
Grattan et al., 2003. © The Geological Society of London, 2003.
5.2 Analysis of the Laki eruption
5.2.1 The reconstructions of the Laki event by Thordarson and Self (1993; 2003) together with the
detailed compilations of observations from historical documents (e.g. Grattan et al., 2003)
enabled the first atmospheric modelling to attempt to recreate the observed events (e.g.
Stevenson et al., 2003b).

25
5.2.2 Volcanic aerosol was almost certainly the main cause of the haze over Europe as none of the
major volcanic gases absorb or scatter visible light significantly (Ammann and Burtscher, 1993).
Witham and Oppenheimer (2005) summarised that if the Laki emissions were a cause of
mortality in England in 1783‐4, the plume would need to a) be transported over England, b) be
present in the atmospheric boundary layer, c) contain harmful concentrations of pollutants.
There is sufficient evidence for a) and b) but c) can only be ascertained by modelling.
5.2.3 Thordarson and Self (2003) calculated that an estimated 200 Mt of H2SO4 aerosols were
produced by the eruption and caused the visible dry fog that affected Europe and other
regions in 1783, 175 Mt were removed as acid precipitation and the remaining ~25 Mt
remained at tropopause levels for >1 year.
5.2.4 Grattan et al. (2003) reviewed understanding of the human health response to volcanogenic
pollution and dry fog events and stated that in many respects the events of 1783 may have
been typical of twentieth century severe air‐pollution events in the UK. High air temperatures
may have intensified any physiological impacts of the particulate matter in the dry fog.
5.2.5 Grattan et al. (2003) gave evidence for elevated degrees of illness and mortality in England
coincident with the early stages of the eruption, suggesting an episode of crisis mortality in
summer 1783 where mortality was greater than 10% in excess of the moving 51 year mean
(Wrigley and Schofield, 1989). The apparent impacts varied considerably across England and
were dependent on micro‐meteorological and topographic features (Grattan and Charman,
1994).
5.2.6 Even bigger impacts were proposed in France based on anomalous peaks in mortality in
many areas of France between August – October 1783 (40% above monthly average).
5.2.7 Witham and Oppenheimer (2004) analysed monthly burial data throughout England and
Wales (404 parishes in 39 counties) and based on monthly analysis found evidence for two
periods of crisis mortality during the Laki eruption: one peak in August‐September 1783 (40%
higher than the 50 year mean) and a second peak in January‐February 1784 with above normal
mortality for the subsequent two months (23% higher than the 50 year mean) (Fig. 6).
Assuming the parish findings are representative of England as a whole, they represent ~19,700
extra deaths during this period. They state that the unusual monthly mortality pattern
indicates a forcing on mortality unrelated to normal seasonal trends and potentially unique in
a fifty year series. Nevertheless, the authors are cautious to ascribe a cause for the deaths.
They also point out that the two periods of crisis mortality were not felt equally over the whole
country.
5.2.8 Grattan et al (2003) and Witham and Oppenheimer (2004) draw attention to the fact that the
summer mortality peak in England in 1783 lags behind the appearance of the haze (Fig. 6).
Adverse health effects from volcanic gases are generally acute and would occur during contact
with the gas. Witham and Oppenheimer (2004) go on to conclude that sulphate aerosols are
more likely than volcanic gases to have had a direct effect on health in 1783. There is evidence
of a fever epidemic in some eastern counties and high temperatures may have increased
summer enteric diseases. Witham and Oppenheimer (2004) found no evidence for food
shortages.

26
Figure 6. Comparison of monthly mortality Z‐scores (series have been normalised by month) for the
period 1782‐1785 and the 50 year mean, both calculated with respect to the calendar year mean.
Arrows indicate the timing of significant phenomena related to the Laki eruption and the shading
shows the duration of the eruption. Modified from Witham and Oppenheimer (2004). © 2004,
Springer‐Verlag. With kind permission of Springer Science+Business Media.
5.2.9 Witham and Oppenheimer (2004) ascribe the winter 1783‐4 mortality peak to the severe
winter temperatures for which there is documentary evidence (Fig. 7). They summarise that
the different causes of mortality in 1783‐4 are complex and although the gas/aerosol may have
weakened people through late summer, leaving them weak and more prone to disease and
cold weather in the winter, this link cannot be conclusively made.
5.2.10 Witham and Oppenheimer (2004) point out that if the two mortality peaks in England were
caused directly or indirectly by the Laki eruption, then the total known deaths ascribed to the
eruption would make it the third most fatal eruption in history after Tambora (1815) and
Krakatao (1883).

27
a
b
Figure 7. a) Monthly temperatures (oC) in 1783 and 1784 compared to the mean of the 10‐year
period 1769‐1798. (b) Monthly temperature and burial anomalies in 1783 and 1784 with respect to
the 50‐year means. Modified from Witham and Oppenheimer (2004). © 2004, Springer‐Verlag. With
kind permission of Springer Science+Business Media.
5.2.11 Unfortunately, published reports relating to 1783‐4 cannot be critically analysed by
standard epidemiological methods as used in air pollution research today. It is not possible to
reliably infer the short‐term exposure levels of people to individual air pollutants from the
historical reports of odour, haze or vegetation damage. The currently available data are also
inadequate for calculating age‐specific death rates, or doing time‐series analyses from the
parish numbers of deaths, which are also known to be highly unstable in many parishes due to
28
the high prevalence of endemic infectious diseases no longer seen in Britain today, and the
much lower expectation of life from birth then.
5.2.12 For future Laki‐type eruptions, modelling ambient air concentrations of specific air
pollutants would be required to provide first order estimates of all‐cause and disease specific
mortality and morbidity using exposure‐response data for SO2 and particulate matter (PM2.5
and PM10) from clinical and epidemiological studies (e.g., Schmidt et al., 2011; see below).
5.3 Previous modelling studies of a Laki‐type eruption
5.3.1 Some of the first atmospheric modelling of a Laki eruption scenario used general circulation
models and considered the impact of sulphate aerosol on climate. Stevenson et al. (2003b)
and Highwood and Stevenson (2003) suggested that the boundary layer concentrations of SO2
during the eruption were less than 20ppb, much lower than the detectable odour range of
about 0.5 to 1.5ppm (Baxter 2000, Wellburn, 1994). However, they didn’t use the meteorology
known at the time of the eruption or represent the full eruption chronology, although a variety
of injection heights for SO2 were used.
5.3.2 Chenet et al. (2005) modelled the sulphate aerosol pollution using an atmospheric general
circulation model (AGCM) and a coupled atmospheric chemistry module that simulates
atmospheric transport and fallout of sulphate and tephra in space and time. They used the
ECMWF humidity, temperature and winds from 2000‐2001 and a theoretical value of 200Mt of
sulphate aerosol (Thordarson and Self, 2003). They used smoothed monthly mean injection
rates (20% sulphate aerosol at 5 km and 80% at 10 km) and had to start the eruption (in model
runs) two weeks in advance. Despite several other limitations and assumptions their model
was consistent with many of the observations. They proposed that a visible haze forms at 5x10‐
9kg sulphate aerosol per kg of air or 5 ppb.
5.3.3 Oman et al (2006a) simulated the chemical transformation of ~122Tg of SO2 and the
subsequent sulphate aerosol dispersion using a global circulation model coupled with a sulphur
chemistry scheme. They attempted to reconstruct the eruption evolution as presented by
Thordarson and Self (2003). They estimated a yield of 163‐166Tg of total volcanic sulphate
aerosol (assuming 75% H2SO4 and 25%H2O from Thordarson and Self, 2003) and calculated a
significant peak net radiative forcing at the top of atmosphere of ‐27 Wm‐2 in August.
5.3.4 Oman et al. (2006b) found that the Laki eruption weakened the Indian and Asian monsoon
systems and they demonstrated that this may be a consequence of many moderate‐large‐
volume high latitude volcanic eruptions.
5.3.5 Gauci et al. (2008) found that the presence and deposition of excessive amounts of volcanic
sulphate aerosol during the Laki eruption resulted in a significant suppression of the northern
wetland methane (CH4) source.
5.3.6. Timmreck et al. (2010) pointed out that fully coupled chemistry and microphysics models
must be used in order to simulate the volcanic aerosol size distribution and correctly constrain
the effect of large eruptions on temperature and environmental impact.

29
5.3.7 Schmidt et al. (2010) studied the impact on aerosol microphysical processes including the
nucleation of new particles and their growth to cloud condensation nuleii (CCN) using the
Global Model of Aerosol Processes (GLOMAP) which also includes microphysical processes
such as hygroscopic growth, coagulation and cloud processing (oxidation of dissolved SO2 to
SO4 in cloud droplets). This model allows an analysis of the evolution of aerosol size
distribution. They found that the Laki eruption had the potential to dramatically impact global
CN and CCN concentrations with an increase in total particle concentration in the upper
troposphere over large parts of the Northern Hemisphere by a factor of ~16 during the first
three months of the eruption.
5.3.8 Schmidt et al. (2010) also showed that the effects are strongly dependent on season with a
summertime eruption having the biggest impact on upper tropospheric CCN concentrations.
SO2 rises into the troposphere and the subsequently formed H2SO4 vapour causes rapid
nucleation of new particles at low temperatures, these grow by coagulation and condensation
of further vapour during transport. Schmidt et al. (2010) found that particle concentrations in
the boundary layer increased by a factor of 2‐5 as far away as the Middle East, Asia and North
America.
5.3.9 The meteorology used to force GLOMAP influences the magnitude of total SO4 deposition
however, different meteorologies produce similar patterns of deposition. Different models
have different parameterisation of wet removal processes. The GLOMAP model may remove
particles too efficiently in the Arctic due to simplification of nucleation scavenging but it is
reliable over Europe (Schmidt et al. 2010).
5.3.10 Schmidt et al (2011) went on to quantify the potential health effects in Europe during a
future ‘Laki‐type’ eruption using a global aerosol model together with concentration‐response
functions derived from modern epidemiological studies. They found that the concentration of
PM2.5 particulate matter (<2.5 micron) is likely to double across central, western and northern
Europe during the first three months of the eruption. The World Health Organisation PM2.5 air
quality guideline would be exceeded an additional 36 days on average during the eruption.
They calculate this could result in 142,000 additional cardiopulmonary fatalities in Europe
(with a 95% confidence interval 52,000‐228,000).
5.3.11 Schmidt et al. (2011) ran the GLOMAP model for a year with a low incidence of
northwesterly air flow (2003) and a year with a high incidence (2005), to quantify health
effects they used concentration‐response (C‐R) functions appropriate for PM2.5 (Pope et al.
2002; Ostro, 2004). They considered only a subset of health outcomes associated with PM.
They found that the meteorology made only a slight difference to the total European excess
mortality rate.
5.3.12 Schmidt et al. (2011) compared the estimated excess mortality rates for the UK, France,
Germany, Ireland, Belgium and Netherlands in the year following a Laki‐type eruption with
baseline reported by the WHO for the year 2004. For the low northwesterly airflow case
(2003), this equated to an increase in excess cardiopulmonary mortality of 8.2% (95% C.I 3.0‐
13.1) and for the high northwesterly airflow case (2005) an increase of 8.6% (95% C. I. 3.2‐
13.8).

30
5.3.13 Based on the modelling by Schmidt et al. (2011), the UK had an increase in mortality of the
modern population of 3.5% (20,900 additional cardiopulmonary fatalities due to eruption on
top of 595,800 all‐cause deaths in the UK in 2004), smaller than the 10‐20% increase in
summer mortality in 1783 in England calculated by Grattan et al. (2003). This may be due in
part to the better health and resilience to air pollution of modern populations (Schmidt et al.
(2011).
5.3.14 Schmidt et al. (2011) found that summertime maximises total mortality due to more
effective photochemical processing compared to a wintertime eruption.
5.4 The Laki eruption in a global context
5.4.1 Anthropogenic sources contribute about 70% of all sulphur emissions (60‐100 Tg(S) per year),
whereas volcanoes contribute on average about 6‐20Tg (S) per year based on a 50 year
running average (Penner et al. 2001). Halmer et al. (2002) estimated the global volcanic SO2
emission as 15‐21 Tg/year between 1971 and 2000. The Laki eruption in 1783‐4 produced ~120
Tg SO2 over 8 months, with most emitted in the first 4 months (Thordarson and Self, 2003).

31
6. Monitoring and operational activities
6.1 Qualitative discussions
6.1.1 One of the elements of the workshop was to prepare and discuss a number of quantitative
and qualitative questions that had been circulated in draft form before the meeting. Some of
the qualitative questions addressed issues around monitoring and suggestions, responses and
resources are documented in this chapter. The quantitative questions and responses are
presented in Chapter 7.
6.2 Monitoring near‐source
Early warning
6.2.1 The monitoring of volcanoes in Iceland is the operational responsibility of the Icelandic
Meteorological Office with specialist support provided by the University of Iceland. There is a
well‐established emergency response system in place in Iceland led by the Icelandic Civil
Protection (National Commissioner of Icelandic Police).
6.2.2 The Icelandic Meteorological Office runs a real‐time network of seismometers, continuous
GPS stations and strainmeters for the purpose of supporting early warning. Much of the data is
available online (http://en.vedur.is/earthquakes‐and‐volcanism/earthquakes/).There is also
campaign‐style monitoring of gas emissions and water chemistry to identify changes that may
precede eruptions. The outflow from glaciers is also monitored in order to identify potential
increases in geothermal gradient beneath ice sheets and regular ground‐based, airborne and
remote‐sensing observations of volcanoes are made.
6.2.3 There were 3‐4 weeks of felt earthquakes (volcano seismicity) before the Laki eruption began
in 1783 (Thordarson pers. comm.). It is very likely, given that the largest magnitude
earthquakes were felt in 1783, that the sensitive modern seismic networks would detect
smaller earthquakes well in advance of a future eruption. Signs of significant geophysical
unrest beneath a volcano would lead the Icelandic Meteorological Office to increase the
aviation colour code (http://www.icao.int/icaonet/dcs/9766/9766_cons_en.pdf).
6.2.4 Nevertheless, it is still not possible to reliably predict the precise start of an eruption and
high levels of seismic activity (‘seismic crises’) do not always lead to eruptions. Magma may
move through the crust but then stagnate before it reaches the surface. Anticipating and
identifying the actual eruption onset within reasonable uncertainty bounds is a challenge being
addressed by the FUTUREVOLC EU FP7 research consortium (Appendix I) a ‘Supersite’ project
that will install ground‐based monitoring equipment to generate close to real‐time data that
can be integrated with in‐situ and satellite data to enhance forecasting and early warning
capability.
6.2.5 If precursors are not recognised, or if magma moves very quickly through the crust, it is
possible that an eruption could begin with no or little warning. It is also uncertain if scientists
would recognise the likely scale of a large‐volume fissure eruption at the eruption onset.

32
Real‐time source parameters
6.2.6 Providing real‐time source parameters for the purpose of operational ash/gas/aerosol
dispersal modelling is extremely challenging (e.g. Bonadonna et al. 2011a,b). Quite apart from
the technical challenges, logistics will also be problematic on the ground with access likely to
be difficult and hazardous.
6.2.7 The heights of ash/gas/aerosol plumes and fire fountains would be calculated using a
combination of a mobile ash‐sensitive radar, Keflavik weather radar ( e.g. Oddson et al. 2012)
and other observational techniques including static cameras, pilot reports and satellite
methods. It should be noted that gas is typically injected several km higher in the atmosphere
than ash/tephra.
6.2.8 Knowledge of the height at which gases and aerosol are injected into the atmosphere and
their vertical distribution is a key to realistic modelling. Most models assume an even vertical
distribution from vent to top of eruption column height. Stevenson et al. (2003a) described
vertical distribution as the largest uncertainty in modelling the fate of volcanic SO2. Chin et al.
(2000) used only the top one‐third of the eruptive column for modelling.
6.2.9 Several methods to better understand source characteristics and support dispersal modelling
are under development. Research consortia such as the EU Futurevolc consortium are
developing new technologies specifically aimed at assessing particle size distributions for ash
and other essential source parameters (Appendix I).
6.2.10 Vertical distribution in a dispersing plume near‐source (rather than directly above the vent)
can be targeted using UAVs, LiDAR, balloon‐sondes and the Differential Absorption LiDAR
(DIAL) shows promise. The ‘near‐source’ is defined as up to 50‐100km from the vent. None of
the techniques would give a high resolution time‐series unless coordinated campaigns by
multiple institutions could be organised (e.g as planned by the EU Futurevolc and NERC
VANAHEIM consortia).
6.2.11 Eckhardt et al. (2008) used a combination of SO2 satellite column measurements and
inverse transport modelling to establish a vertical profile.
6.2.12 The NERC VANAHEIM consortium is also developing modelling approaches (e.g. Woodhouse
et al. 2012) and is also investigating the Eyjafjallajökull plume with respect to altitude‐
dependent layering which is persistent for great distances (Appendix I).
6.2.13 Calculation of the mass eruption rate of magma in Iceland (in order to assess first order SO2
emission rates) during fissure eruptions might use a combination of techniques including
ground‐based, satellite and airborne observations. Modelling approaches to better understand
controls on plumes above lava flows (e.g. Kaminski et al. 2011) provide complementary
methods.
6.2.14 Measurements of SO2, HCl and HF are needed if a dispersion model is to forecast
transformation of these and related aerosols. In particular, peak concentrations are needed.
6.2.15 Oppenheimer and McGonigle (2004) summarised the state‐of‐the‐art in ground‐based
optical sensing for volcanic gases (near‐source) in 2004 and such technology has since been

33
developed further (Table 8). These techniques are only generally useful if there is only a little
ash, or preferably no ash as they rely on the sun as a source, however useful data can be
collected during weaker phases of an eruption and in more distal locations when most ash has
fallen out (and before SO2 conversion). Most of the techniques (especially airborne and
satellite methods and LiDAR) would be useful both near‐source and in the UK.
6.2.16 Open path Fourier transform infrared spectroscopy (OP‐FTIR) is currently the most effective
way to establish the composition of the gas phase of a volcanic plume but spectroscopy will
not detect particles or aerosols.
6.2.17 Since HCl (and therefore probably HF) has such a high dissolution rate into water droplets,
the measured gas phase composition will reflect rates of scavenging so SO2/HCl or SO2/HF
ratios (measured by OP‐FTIR) will tend to increase with distance from the source (e.g.
Oppenheimer et al. 2003; Aiuppa et al. 2007). However, once water droplets in a plume are
saturated with respect to acid gases, there is little scope for more compositional change
(though see Oppenheimer et al., 2006 and Roberts et al., 2009).
Instrument Transport methods Volcanic gas species detectable
Flux measurements (Yes/No)
COSPEC (UV) Car, aircraft, boat SO2 Yes UV grating spectrometers (e.g. Ocean Optics USB 2000)
On foot, car, aircraft, boat
SO2, H2S, BrO Yes
FTIR (e.g. Brucker OPAG 22, MIDAC AM
series)
Car CO2, CO, OCS, CH4, SO2, H2O, HCl, HF, SiF4
Yes (with sun tracker)
Other NDIR (e.g. LI‐COR CO2 analysers)
On foot, aircraft CO2, H2O Yes (by plume profiling or ground flux surveys)
DIAL (i.e. using atmospheric backscatter to return signal)
Truck, ship SO2, other species feasible
Yes
Laser spectroscopy (short path, extractive)
car As FTIR plus isotopes No
Table 8. An overview of spectroscopic methods (UV, IR and laser) for ground‐based optical sensing
of volcanic gases from Oppenheimer and McGonigle (2004). The COSPEC is no longer routinely
used. The UV and IR spectrometers are operational but DIAL and laser spectroscopy are still at
research stage.
6.2.18 Given the likely broad area of the source during a fissure eruption, poor accessibility, poor
visibility and abundance of tephra during explosive phases, assessments of the dispersing
ash/gas cloud height, vertical structure and gas composition further than 50‐100 km downwind

34
(i.e. in the north Atlantic) might be useful (e.g. using UAVs, balloon sondes, planes, ships etc).
Locating equipment in the Faeroe Islands may also be of value.
6.2.19 Coordination of all the available resources and accessibility of data would be an ideal
situation for rapid operational and research analysis.
Direct sampling
6.2.20 Direct sampling (i.e. sample collection) of volatiles at fumaroles and vents can be very
effective before an eruption if there is detectable degassing (e.g. Giggenbach and Goguel,
1989) but is too dangerous during an eruption and is not real‐time.
6.2.21 A suite of diffusion tubes can be left near gas sources to give an idea of plume dispersion
and exposure at ground level (e.g. Aspinall et al. 2002; Aiuppa et al. 2006, 2007). Rainwater
collectors and sulphation plates have been used to investigate deposition (e.g. Delmelle et al.
2001, 2003; Edmonds et al. 2003). These methods require laboratory analysis so are not real‐
time monitoring but are good for process understanding and quantifying concentrations for
impact assessments.
6.2.22 Particle filters can be used to study the aerosol phase of volcanic emissions, and further
development allows characterisation of the aerosol size distribution and chemistry (Mather et
al. 2004; Martin et al. 2008; Ilyinskaya et al. 2010). The filters require analysis so this is not
real‐time monitoring but rapid analysis could be organised.
6.2.23 Volatiles scavenged by ash particles can be studied analytically by leaching samples with
distilled water (e.g. Edmonds et al. 2003; Witham et al. 2005). This is dependent on good
sampling and appropriate storage of samples for reliable results. The leachate analysis takes
some days.
6.2.24 As part of the EU FP7 FUTUREVOLC consortium, the University of Iceland intends to
establish a mobile lab to provide rapid chemical, grain size and leachate analyses of ash for
distribution to relevant authorities in Iceland and beyond.
In‐situ sensors
6.2.25 Electrochemical sensors show a great deal of promise in that they are cheap and mass‐
produced but they are unable to target gases, for example H2S sensors are cross‐sensitive to
SO2. However by using them in appropriate configurations they have been found to be reliable
for measuring SO2, H2S and other species (e.g. Roberts et al. 2012). Long term installations
using wifi, mobile networks or satellite telemetry are beginning to provide near‐ real‐time
insights into the relationships between surface emissions and magmatic processes (e.g. Aiuppa
et al. 2007a,b).
6.2.26 The portable gas chromatograph is described by Oppenheimer et al. (2011) as a promising
technique established some time ago but not yet widely used in volcanology. It is sensitive and
able to measure a wide range of species including H2S and H2.

35
UV spectroscopy
6.2.27 Galle et al (2010) have set up successful scanning DOAS spectrometers at many volcanoes
worldwide attesting to the value of this technique. Its main advantage is the capability for
rapid SO2 flux measurements during daylight hours. A system is being developed in Iceland.
6.2.28 Further developments include the use of tomography to reconstruct the plume’s cross
sectional area since identification of the plume height is critical (e.g. Wright et al. (2008) and
other references in Oppenheimer et al. (2011)). Use of two‐dimensional CCD detectors enables
a user to build an image giving information on gas distribution in a plume (e.g. Louban et al.
2009) and use of UV cameras gives an even higher time resolution (Oppenheimer et al. 2011
and references therein). Two spectrometers with two slightly different fields of view offers a
new approach that can provide accurate SO2 flux measurements at very high time resolution
and could in theory provide a real‐time SO2 flux meter (Boichu et al., 2010).
6.2.29 Further work is needed to establish the extent to which the interaction of the volcanic gases
with the atmosphere affects spectroscopy measurements (e.g. Kern et al., 2010).
Broadband IR
6.2.30 OP‐ FTIR can detect multiple gases (Table 7; 6.2.16; 6.2.17) and can be used downwind from
source during vigorous events to reveal insights into magma transport, degassing and
compositional variation in the gas plume (Horrocks et al. 2011 and references therein). H2S has
not been detected in a plume by IR absorption spectroscopy.
Laser spectroscopy
6.2.31 LiDAR has been used to estimate concentrations and fluxes (by traverses) of sulphate
aerosol as well as ash. Parallel gas sampling and aerosol measurement can enable estimation
of gas to particle conversion rates (e.g for SO2 to SO42‐; Rose et al. 1986). Further LiDAR
capacity in Iceland might be useful.
6.2.32 Differential absorption lidar (DIAL) can reveal plume structure/vertical distribution but is
costly, heavy and bulky so requires some innovation before it becomes a regular volcanological
tool. It can remotely measure the concentration of a gas species by scanning a vertical plane in
the atmosphere. DIAL can also measure flux (i.e. the emission rate) of the gases.
6.2.33 Near and mid‐infrared diode based lasers can make sensitive measurements of isotopic
abundances (Oppenheimer et al. 2011 and references therein).
Satellite remote sensing
6.2.34 OMI (NASA satellite‐borne Ozone Monitoring Instrument) has a reasonable correlation at
stratosphere levels with actual SO2 emissions. Comparing AIRS (Atmospheric Infrared
Sounder), MODIS (Moderate Resolution Imaging Spectroradiometer) and OMI, OMI is the most
sensitive satellite payload to SO2 in the troposphere and the only sensor capable of resolving
low altitude cloud (e.g. Carn et al., 2009; Yang et al. 2007). However, most of these satellites
just provide data once or twice a day. SEVIRI is a geostationary satellite (over the equator)
producing data on both ash and SO2 every 15 minutes (Prata and Kerkmann, 2007) but it is not

36
so good at retrievals over Iceland due to the low angle. IASI is an IR polar orbiting satellite that
produces data day and night (e.g. Clarisse et al., 2008).
6.2.35 McCormack et al. (2012) have compared total SO2 output calculated on the basis of OMI
which is sensitive to passive degassing in the lower troposphere as well as the stratosphere
with the total extrapolated using DOAS (Differential Optical Absorption UV Spectrometer).
Neither technique is continuous hence the need for extrapolation. The OMI SO2 output is ~20%
of the total extrapolated from DOAS (at volcanic arcs). There is also uncertainty due to
chemical processing of SO2, dilution of SO2 before satellite overpass, OMI reduced sensitivity to
low levels in boundary layer, meteorological cloud interference etc.
6.2.36 IASI and AIRS can be used at night for both SO2 and ash. The techniques for IASI and AIRS for
detecting and quantifying ash are not as advanced as for the broadband sensors (e.g. MODIS
and SEVIRI).
6.2.37 The EU FP7 EVOSS project uses SEVIRI, MODIS, IASI, OMI and GOME‐2 to provide close to
real‐time products on ash and SO2 via a web portal when there is an eruption. There are
significant ongoing efforts to make this sustainable (see Appendix I). Retrieval algorithms are
undergoing rapid refinement in the research community.
6.2.38 Meteosat 3rd Generation (MTG) due for launch in the 2020's will have a thermal infrared
interferometer (MTG‐IRS) onboard capable of detecting volcanic ash and SO2.
6.2.39 A payload specifically for monitoring ash, gas and aerosol from Iceland on, for example, a
telecommunications satellite would make a significant difference to the monitoring capability.
Assessing sulphur content
6.2.40 Based on empirical evidence, Blake (2003) proposed that for explosive eruptions, the
emitted SO2 correlates well with mass of erupted magma. The SO2 yield is 0.1‐1% by mass of
magma irrespective of composition. Mass S02 (Mt) = 1.77 (mass magma Gt)0.64. This becomes a
useful method to provide a first order assessment of SO2 yield in an eruption if mass eruption
rate can be calculated.
6.2.41 A petrological method using the difference between melt inclusion and matrix glass method
works well for Iceland, the analytical error is ~5%, so the overall error for Laki is ~20‐25%
(Thordarson and Self, 2003). When the petrological method has been tested against remote
sensing on small basaltic eruptions in Iceland, the two methods give similar results. It works
better for basalt than more silicic lavas. This is not a real‐time method but it’s a tool to
combine with other measurements including remote sensing for validation.
6.3 Monitoring in the far‐field
At altitude
6.3.1 The spectroscopy and remote sensing methods described in section 6.1 can also be used in
the far‐field.

37
6.3.2 The UK has access to the newly acquired Met Office Civil Contingency Aircraft (MOCCA) that
is on 24hr call out notice.
6.3.3 The UK research plane operated by the Facility for Airborne Atmospheric Measurements
(FAAM), a collaboration between NERC and the Met Office http://www.faam.ac.uk/, and the
NERC Airborne Research and Survey Facility (ARSF) Dornier 228 research aircraft may be
available but are not guaranteed .
6.3.4 The Facility for Ground‐based Atmospheric Measurements (FGAM) operates two field sites at
Chilbolton and Cardington equipped with an extensive set of ground‐based remote‐sensing
and in‐situ instruments used for atmospheric science research including Doppler radars,
Doppler LiDARs, high power UV Raman LiDAR, radiometers and meteorological instruments. A
mobile facility for campaigns with capability for meteorology and dynamics, aerosol and gas
phase measurements is available from FGAM. http://www.ncas.ac.uk/fgam/
6.3.5 The Met Office ‘Met Research Unit’ at Cardington operates Doppler LiDARs, one of which is
mobile.
6.3.6 The ideal is a network of multi‐wavelength LiDARs which would allow estimation of mass
loadings and size distributions, but such devices are not yet available commercially.
6.3.7 The existing upward looking ground‐based LiDAR network includes an instrument on the
Faeroe Islands and this may be a useful site for further instrumentation for the purposes of
model validation. Engagement with North Atlantic shipping might also be valuable for
additional observations and data.
6.3.8 When monitoring airborne particles, there is a need to know both where the plume is, the
concentrations and vertical distribution. Satellite remote sensing is good for location
(IASI/SEVIRI); LiDAR, sondes, UAVs and planes are needed for concentrations and vertical
distribution – with the same difficulties of temporal and spatial resolution as near‐source.
6.3.9 The research planes could attempt coordination to give a time series of measurements,
although any flight is valuable. SO2 is a potential hazard to plane crew in unpressurised cabins,
so masks with filters to enable flights could be arranged.
At ground level
6.3.10 In the UK there are many different air quality and environmental monitoring networks, the
main ones (e.g. coordinated by DEFRA) are summarised here and in Appendix F with
recommendations for enhancement in order to deal with a Laki‐type scenario.
6.3.11 The Automatic Urban and Rural Network (AURN) is the UKs largest automatic monitoring
network and is used for compliance reporting against the Ambient Air Quality Directives. There
are 131 sites that measure oxides of nitrogen (NOx), sulphur dioxide (SO2), ozone (O3), carbon
monoxide (CO) and particles (PM10, PM2.5) hourly and data is available online. Mercury (Hg)
content of the air is also available hourly. An hourly map of concentrations could be made
using this data. http://uk‐air.Defra.gov.uk/networks/network‐info?view=aurn

38
6.3.12 The DEFRA UK Eutrophying and Acidifying atmospheric pollutants (UKEAP) network
measures air pollutants at rural sites across the UK including precipitation and the Acid Gas
and Aerosol Network (AGANet) which measures monthly gas phase SO2, HNO3, HCl and major
particulate phase inorganic anions and cations at 30 sites.
http://pollutantdeposition.Defra.gov.uk/ukeap
6.3.13 The UK contributes to the European Monitoring and Evaluation Programme (EMEP) which
has two supersites funded by the DEFRA UKEAP project which make high frequency
measurements of water‐soluble gases and particles at PM2.5 and PM10, mercury in air and
ions in precipitation (including fluoride since 2012). http://www.emep.int/
6.3.14 A DEFRA report summarising the current understanding of pollutant concentrations and
deposition across the UK was released in June 2012 and is available at
http://www.rotap.ceh.ac.uk/home.
6.3.15 For an assessment of the current UK air quality and environmental capabilities including
AURN sites, UKEAP and the ECN network and recommendations on how they can be enhanced
to deal with a Laki‐style event, see Appendix F.
6.3.16 In terms of new technology, a mobile DIAL system could be developed for use in the UK to
be mobilised in areas forecast to be badly affected.
6.3.17 There may be ash fall in Europe associated with a Laki eruption scenario and a strategy for
ash collection (following from experience during Eyjafjallajökull and Grimsvötn eruptions e.g.
Stevenson et al. 2012) and subsequent analysis is proposed in this document (Appendices F
and H). A protocol for leachate analysis is available on the IVHHN website www.ivhhn.org. The
DEFRA‐led Volcanic Ash Network would coordinate activities in a crisis situation.
6.3.18 Rainwater collection networks would serve to collect ash as well as other depositing species
(Met Office, CEH, SEPA and DEFRA). The rainwater needs to be sampled routinely for pH and
soluble species, especially in areas where surface water or groundwater derived from meteoric
water may be used for drinking (common in parts of the Scottish Highlands). See Appendix F
for current monitoring networks.

39
7. Expert elicitation
7.1 Quantitative elicitation: proceedings
7.1.1 One of the main elements of the workshop was the structured elicitation of expert
judgements to provide quantitative guidance on uncertainties associated with selected impact
modelling factors and parameters, principally those that relate to volcanological source
conditions and their characterization. The purpose behind the derivation of these uncertainty
distributions is to use them provisionally with related inputs to any modelling aimed at
estimating potential volcanic effects and impacts on UK due to a prolonged Icelandic fissure
eruption scenario.
7.1.2 During the workshop, discussion in this context focussed on about sixty quantitative and
qualitative questions that had been assembled in draft form and circulated before the
meeting. In terms of the quantitative uncertainty‐related items, the list was reduced to
twenty‐eight in number, with others deferred to off‐line consideration with Icelandic
colleagues, or removed as duplicates or of marginal consequence to the current issue. The
qualitative questions were dealt with separately (see section 7.4).
7.2 Expert calibration
7.2.1 In terms of individual calibrations based on responses to the ‘Seed Items’ (questions to test
ability to estimate uncertainty), the profile of the derived performance‐based scores, expert by
expert, produced no major surprises: those who achieved the heavier weights amongst the
group are recognized as being particularly knowledgeable among their peers.
7.2.2 The rationale behind weighted pooling of opinions is that this expresses the collective group
view on uncertainties on an objective basis and with appropriate maximal informativeness. The
upshot is that the Performance Weights solutions for the quantitative questions (‘Target
Items’) in the present elicitation mostly (but not invariably ‐ see Table 9 and Appendix C) have
tighter credible interval distributions for the associated uncertainty than do the counterpart
Equal weights solutions. Averaging the views of the whole group almost inevitably involves
integrating over a much wider range of opinions and, whilst ‘democratic’, does not represent a
rational consensus.
7.3 Target Item results: summary
7.3.1 Of the twenty‐eight quantitative questions (‘Target Items’), the majority (22 in number) were
essentially volcanological in nature – to some extent this reflected the preponderance of the
specialists present, but also the roots of the original conception and purpose of the meeting,
which was to address, inter alia, factors affecting the volcanological source term in a modelling
context. The remaining six Items were associated with plume chemical processes.
7.3.2 With two exceptions, the volcanological questions (‘Target Items’) were responded to by
between eleven and all fourteen experts, whilst the plume processes questions were tackled
by between eight and eleven experts. The two notable exceptions in the former category

40
were, surprisingly, questions concerning the maximum and expected rates of magma discharge
during an explosive phase of a Laki‐like eruption. These attracted just seven and five valid sets
of responses, respectively.
7.3.3 Overall, twenty of the twenty‐two volcanological questions (‘Target Items’) provided pooled
results from the performance‐based weights Decision Maker (PerfWt DM) that appear to
represent rational consensus outcomes for determining the associated uncertainty
distributions. (Equal weights ‐ EqWt DM ‐ solutions are also produced as counterparts – see
Appendix C).
7.3.4 Two volcanological questions13 exhibit apparent major systemic discrepancies, with question
definition issues, major uncertainty and knowledge gap connotations (see Table 8). Of the
other twenty satisfactory Item results, about ten indicate that possible knowledge gaps may
exist, eight are marked by very wide uncertainty spreads (which may be knowledge‐related or
due to genuine aleatoric randomness) and five may benefit from better question definition or
terminological clarity.
7.3.5 In the cases of the plume process Items, on the face of it, all six provide convincing rational
consensus outcomes, with one giving notably wide but plausible uncertainty bounds, two with
features indicating possible knowledge gaps, and two possibly affected by
terminology/definition issues.
7.3.6 These various features of the twenty‐eight solicited questions, attributed by the facilitator
from his elicitation experience, are summarized on Table 9. Cells highlighted by shading
indicate aspects of the pooled expert opinion solutions which might be improved by further
discussion of wording and technical issues, and by re‐elicitation. Others, in the right‐hand
column, identify questions (‘ Target Items’) that have particularly large, but perhaps
irreducible, uncertainty ranges.
7.4 Expert elicitation ‐ conclusions
7.4.1 Taken all together, the results exhibit collective traits that are quite usual for an expert
elicitation of this type, when subject matter topics are addressed that are data‐poor, extreme
or exceptional.
7.4.2 The consequent identification of where potential knowledge gaps exist, and the diagnosis of
terms and definitions that may be ambiguous or ill‐defined are two valuable assets of the
present structured elicitation method.
13 Item 10b_2 After the initial explosive phase (ie first days), what is the likely maximum sustained plume
height for gases above the vent for the remainder of the active episode?
Item 15_1 What is the likely upper limit for the percentage of total SO2 emissions that is released from
vents?

41
7.4.3 The main accomplishment of the present exercise is that it offers quantified, provisional but
objective uncertainty distributions for a number of inputs for modelling a large‐volume fissure
eruption scenario in Iceland, and thus suggests an initial enumerated start‐point for simulation
purposes. Indubitably, some of the uncertainties, ambiguities and expert response variability
could be reduced by further discussion of the issues, and by re‐elicitation – but that is in the
nature of this sort of exercise. Such elicitations are seldom absolute or final, but can be
updated with new data or theoretical insights.
7.4.4 The present elicitation exercise can be viewed as a productive first step and certainly proved
successful in engaging the interest of specialists in research institutes, academia and those
who may have an operational role during an eruption. However, all such elicitations are just
snapshots of informed expert judgement at a given moment, and require updating from time‐
to‐time as knowledge, data and understanding advance.
7.5 Qualitative questions
7.5.1 A second element of the workshop in London was to seek the opinion of a group of experts
on a number of qualitative questions. The intention here was to identify areas where the group
are generally comfortable with current understanding, published values or state‐of‐the‐art and
where there are areas of concern and/or uncertainty, clear knowledge gaps or areas for future
research. It also enables those in one discipline to understand which
papers/parameters/uncertainties are well‐characterised and well‐regarded by peers in another
discipline.
7.5.2 These questions were posed during the workshop and about 10 minutes assigned for
discussion following which each individual wrote down their key points. The questions were
distributed in advance of the workshop. Notes were taken by three attendees during the
discussion, the paperwork was collected at the end of the meeting and results used to compile
the report. The questions are listed in Appendix D.
Table 9 (overleaf) Summary of inferences about elicited Target Item solution

42
Type Code Target Item Rational consensus?
Knowledge issues?
Terminology issues?
Wide uncertainty?
Volc source 8
What is the likelihood that in the next Laki-like eruption there is an episode which releases 10 times more SO2 on the same timescale as the peak eruption episode during Laki? [express as %age?]
Yes No No No
Volc source 9_1 Given an eruption like Laki 1783-4 (flood lava eruption), what maximum total lava
volume should be used for scenario modelling (in km3)? Yes No No No
Volc source 9_2 Given an eruption like Laki 1783-4 (flood lava eruption), what expected (i.e. mean)
total lava volume should be used for scenario modelling (in km3)? Yes ?? No No
Volc source 10_1 What is the likely maximum explosion column height above vent during individual
eruptive episodes (fissure opening)? Yes No No No
Volc source 10_2 What is the likely mean explosion column height above vent during individual
eruptive episodes (fissure opening)? Yes No No No
Volc source 10b_1 After the initial explosive phase (ie first days), what is the likely average sustained
plume height for gases above the vent for the remainder of the active episode? Yes ?? No Yes
Volc source 10b_2
After the initial explosive phase (ie first days), what is the likely maximum sustained plume height for gases above the vent for the remainder of the active episode?
?? ?? Yes Yes
Volc source 11_1 What is the likely upper limit amount of SO2 released from the explosive vents per
unit of lava volume (Tg of SO2 per km3 of lava erupted)? Yes No No No

43
Type Code Target Item Rational consensus?
Knowledge issues?
Terminology issues?
Wide uncertainty?
Volc source 11_2 What are the likely average amount of SO2 released from the explosive vents per
unit of lava volume (Tg of SO2 per km3 of lava erupted)? Yes No No No
Volc source 12_1 What is the maximum rate of magma discharge in an explosive phase? (cubic
metres / second) Yes ?? No No
Volc source 12_2 What is the expected average rate of magma discharge in an explosive phase?
(cubic metres / second) Yes No No Yes
Volc source 15_1 What is the likely upper limit for the percentage of total SO2 emissions that is
released from vents? ?? Yes ?? Yes
Volc source 15_2 What is the likely lower limit for the percentage of total SO2 emissions that is
released from vents? Yes No No No
Volc source 16_1 What is the likely maximum number of fissure opening explosive phases during
an eruption on the scale of Laki? Yes No ?? No
Volc source 16_2 What is the likely average number of fissure opening explosive phases during an
eruption on the scale of Laki? Yes No No Yes
Volc source 16_3 What is the likely minimum number of fissure opening explosive phases during
an eruption on the scale of Laki? Yes ?? ?? No

44
Type Code Target Item Rational consensus?
Knowledge issues?
Terminology issues?
Wide uncertainty?
Volc source 17 What is the likely duration of the explosive phase of a fissure-opening episode? Yes ?? No No
Volc source 18 What is the typical gap between major gas outburst episodes?
Yes No No Yes
Volc source 19_1 For phreatomagmatic activity, what is the likely % of total erupted volume? Yes ?? ?? No
Volc source 19_3 For phreatomagmatic activity, what is likely maximum eruption column height? Yes ?? No No
Volc source 24_1 What is the expected minimum ash volume produced w.r.t. the total erupted
tephra volume (answer in % of the total erupted tephra volume)? Yes ?? No Yes
Volc source 24_2 What are the expected maximum ash volume produced w.r.t. the total erupted
tephra volume (answer in % of the total erupted tephra volume)? Yes No Yes Yes
Plume 42_1 What is the typical e-folding time of SO2 in the atmosphere (troposphere) in the winter within a Laki-like plume? Yes No No No
Plume 42_2 What is the typical e-folding time of SO2 in the atmosphere (troposphere) in the summer within a Laki-like plume? Yes No No Yes

45
Type Code Target Item Rational consensus?
Knowledge issues?
Terminology issues?
Wide uncertainty?
Plume 43_1 What is the e-folding time of SO4 in the atmosphere (troposphere) in winter within a Laki-like plume? Yes ?? No No
Plume 43_2 What is the e-folding time of SO4 in the atmosphere (troposphere) in summer within a Laki-like plume? Yes ?? No No
Plume 45S By how much [expressed as %] does proximal adsorption on ash reduce the volcanic gas concentrations of S in the plume? Yes No Yes No
Plume 45F By how much [expressed as %] does proximal adsorption on ash reduce the volcanic gas concentrations of F in the plume? Yes No Yes No
Notes to table:
“Rational consensus? = Yes” indicates the Decision Maker expert range graphs and solution distribution(s) do not evince major systemic discrepancies,
egregious opinions or other evidence of suspect reasoning.
“Knowledge issues? = Yes or ??” identify possible knowledge gaps or hints of a dichotomy of expert knowledge.
“Terminology issues? =Yes or ??” point out Target Items where the question wording or terms may be ambiguous or convey different meanings to
different people.
“Wide uncertainty? = Yes” flags Target Items where, prima facie, the associated uncertainty spreads are very substantial and could have a crucial effect
for modelling impact.

46
8. Brief discussion on impacts
8.1 Health impacts (human and animal)
8.1.1 There is considerable evidence linking PM2.5 (particulate matter smaller than 2.5 microns) and
PM10 (particulate matter smaller than 10 microns) in the atmosphere with daily mortality and
hospital admissions, exacerbation of asthma and non‐fatal heart attacks (e.g. Pope and
Dockery, 2006; Schwartz, 2001). Current evidence indicates that short‐term (days) and long‐
term (months to years) exposure to PM2.5 is associated with all‐cause and cardiopulmonary
mortality (Brook et al., 2010).
8.1.2 The smaller PM2.5 can penetrate deeper into the lungs and so an increase in these fine
particles has a more significant impact on health than PM10.Tropospheric volcanic sulphate
particles are typically <2.5 micron (PM2.5) in diameter (Allen et al. 2002; Mather et al. 2003:
Figure 4) and such particles can be present in the boundary layer far from the source volcano.
8.1.3 Several studies find strong associations between SO4 air pollution and premature mortality
(e.g. Pope and Dockery, 2006 and Pope et al. 2002). However, most studies on the exposure
effects of particulate matter and aerosol are based on urban air pollution, rather than volcanic
‘pollution’.
8.1.4 Hansell & Oppenheimer (2004) carried out a review of the health hazards of volcanic gases
although most documented evidence is from proximal environments.
8.1.5 Details about volcanic gases and particulate matter (PM) and aerosol, exposure effects,
current guidelines, volcanic incidents and examples, and references can be found on the
website of the International Volcanic Health Hazard Network http://www.ivhhn.org/. For
example, the health effects of exposure to hydrogen fluoride gas are documented (e.g. Baxter,
2000) and there are occupational guidelines.
8.1.6 Halogen and some sulphate aerosols are acidic, and it is thought that acidic PM may pose a
greater risk to health than non‐acidic. Metals contained in volcanic plumes, such as mercury,
iridium, arsenic, and others, can catalyse reactions, and particularly in combination with acid
gases and aerosols, increase health effects.
8.1.7 The analysis of F in surface waters and drinking water as well as vegetation would be
important to ensure no risk of fluorosis (e.g. Baxter, 2000; Cronin and Sharp, 2002; Appendix
F).
8.1.8 The International Volcanic Ash Task Force (IVATF) reported in June 2012 on task TF‐SCI06:
Health effects on aircraft occupants of exposure to volcanic SO2. They stated that ‘more
research should be conducted to better understand the airworthiness effects, potential
significant risk of sulphur dioxide to aircraft occupants, and any associated expeditious
mitigation of the risk’.

47
8.1.9 There are several locations worldwide where populations live with active volcanoes and the
responses of individuals to volcanic gases are documented (e.g. Miyakeshima Island, Japan:
Ishigami et al. 2008; Kajino et al. 2004).
8.1.10 In Hawaii, the effects of exposure to SO2 and particulate matter are well‐documented
(Longo, et al. 2005; Longo et al. 2008; Longo, 2009; Longo et al. 2010). There are established
procedures for dealing with ‘vog’ and an SO2 colour code system
http://governor.hawaii.gov/emergency‐information/important‐information‐about‐vog/
8.2 Environmental impacts
8.2.1 Any volcanic acid gases and aerosols that reach the UK are likely to be deposited (by settling
or sticking) on any surface, including soils, vegetation, crops, buildings and critical
infrastructure, vehicles and so on, and – importantly ‐ into lakes, reservoirs and streams. This
will occur through wet deposition (including rain and snow) or dry deposition.
8.2.2 The impacts will depend on pre‐existing conditions, the concentrations of the acidic
compounds and whether or not they can be quickly removed (eg for example by
uncontaminated rainwater or hosing). Grazing animals could be kept indoors to reduce
exposure.
8.2.3 Delmelle (2003) reviews and presents evidence of impacts of volcanic gas plumes on
vegetation in near‐volcano environments. In terms of gas, the little available data suggests that
atmospheric levels of HCl are too low to cause direct damage (Smith, 1990). However, SO2 and
HF may both be present at phytotoxic concentrations even though there is much less HF than
SO2 in most plumes.
8.2.4 Smith (1990) lists relative sensitivity of plants to damage by SO2 or HF although Delmelle
(2003) notes that different environmental conditions, weather, plant age, species and so on
can affect sensitivity.
8.2.5 As well as better understanding what concentrations of SO2 gas could be possible in UK
airspace and at ground level, it’s also necessary to carry out some modelling to establish
whether or not HF gas could pose a risk in the UK and if so under what conditions.
8.2.6 Acidic wet deposition has an effect on vegetation with the greatest impact due to acidified
fog and cloud with solute concentrations up to 10 times higher than rain (Cape, 1993). Hilly
areas exposed to orographic clouds or coastal fog may be worst affected.
8.2.7 Sustained additions of acidic compounds to soil may lead to soil acidification. In the case of
volcanic activity, the fate of sulphur, chlorine and fluorine in soil is also of importance. If
groundwater is derived largely from meteoric water this can also be affected.
8.2.8 The UK has greatly reduced anthropogenic concentrations of sulphur and levels of acidity in
the atmosphere, soils and freshwater since the mid‐twentieth century, but recovery in some
areas is slow (RoTAP, 2012) so any further deposition of acids may add to legacy issues.
8.2.9 Elevated SO2, HF and sulphate aerosols in ambient air are probably the main causative agents
of vegetation damage downwind of volcanic gas sources. However more extensive fieldwork

48
and laboratory work is needed for detailed analysis of the combined effect of these pollutants
on natural and cultivated vegetation (Delmelle, 2003).
8.2.10 Delmelle (2003) states that in order to understand the impacts of volcanic degassing on the
terrestrial and atmospheric environment we need: 1) systematic 2D and 3D measurements of
volcanic plumes, 2) development of general physical and chemical models to describe the fate
of volcanic gases and aerosols during transport in the troposphere, and 3) investigation of the
response of diverse ecosystems to volcanogenic air pollution.
8.2.11 Poisoning in sheep is likely to occur when the fluorine content of dried grass exceeds 250
ppm (IVHHN). Poisoning can occur where only 0.5mm of ash has been deposited. As stated in
chapter two it is entirely possible that this eruption scenario becomes vigorously explosive
resulting in volcanic ash which is a vehicle for volcanic HF. We propose some recommendations
in Appendix F.
8.3 Aviation impacts
8.3.1 SO2 and sulphate (in the form of sulphuric acid) can cause damage to airframes and sulphate
deposits can accumulate in turbines blocking cooling holes and leading to overheating as
observed after the eruption of Mount Pinatubo in the Phillippines in 1991 (Carn et al., 2009).
8.3.2 Sulphate aerosols also accelerate corrosion thus requiring increased maintenance and
decreasing engine lifetime; helicopters flying routinely in volcanic areas (e.g. for volcano
observatories) have thorough daily maintenance regimes.
8.3.3 Miller and Casadevall (2000) reported that an aircraft suffered engine power loss in 1992 due
to sulphate deposition in the engines from the eruption of Mount Pinatubo the previous year.
8.3.4 There is also the possibility of crew and passengers being exposed to toxic gases on the
plane/helicopter if SO2 for example has not fully oxidised in the atmosphere (see section 4.3).
8.3.5 The International Volcanic Ash Task Force (IVATF) was established by the International Civil
Aviation Organisation in May 2010 in response to the disruptions of civil aviation that resulted
from the eruption of the Eyjafjallajokull volcano in April‐May the same year. The airworthiness
effects of sulphur dioxide and other constituents of a volcanic cloud was considered an area
that requires more research.
8.4 Other sectors
8.4.1 A volcanic haze or ‘vog’ is likely to lead to reduced visibility and could impact different
sectors including transport. Volcanic particulates and gases can penetrate into mechanical and
computer equipment, systems and buildings, and potential effects on modern electronics, for
instance, are not clearly understood.
8.4.2 There is little current understanding of the potential impacts of metals contained in volcanic
plumes such as mercury, iridium, arsenic, and others. As stated above, these can catalyse
reactions, and combined with acid gases and aerosols could have impacts in several sectors.

49
9. Summary of results
9.1 Key findings
Here we summarise key findings based on the objectives of the exercise, starting with a definition of, and parameters for, a ‘Laki‐type’ eruption scenario. 1. Characterise a ‘Laki‐type’ eruption scenario in terms of a range of suitable ‘source’
parameters for modelling.
The Laki‐type eruption scenario is defined here as a sustained large‐volume fissure eruption (>1km3
erupted magma) in Iceland (see Chapter 2). It was assumed during this exercise that the duration of
this scenario is fixed as for the Laki eruption in 1783‐4 at eight months but with most volcanic
activity in the first five months.
We have collated some published parameters (see Chapter 3) and the expert elicitation has
generated distributions for various additional parameters as summarised in Table 10. Participants
new to the expert elicitation process were asked to consider the likely range of parameters given
‘100 runs of a Laki‐type scenario’.
The summary presents the mean of the weighted expert opinion – Table 9 contains details about any
ambiguities and Appendix C should be consulted for a comparison with ‘equal‐weighted’ expert
opinion.
2. Establish likely eruption location, duration and dynamic evolution.
About 79% of magma erupted in historical time in Iceland (the last ~1100 years) has been produced
in the Eastern Volcanic Zone. About 77% was erupted at just four volcanoes in the EVZ: Grímsvötn,
Barðarbunga/Veidivötn, Hekla and Katla (see Chapter 2). On this basis, the Eastern Volcanic Zone is
the most likely area to produce a future large‐volume fissure eruption. Other volcanoes with
potentially active fissure systems are located in the Northern Volcanic Zone and the Western
Volcanic Zone, the Öræfi Volcanic Zone and the Snæfellsnes Volcanic Zone.
The duration of historical and Holocene (last 12,000 years) fissure eruptions is poorly constrained,
except for the Laki eruption itself at eight months (Table 5).
Some aspects of the potential future dynamic evolution of a Laki‐type eruption scenario were
elicited (e.g. possible number of fissure‐opening episodes, duration of vigorously explosive phases
see above) and are shown in Tables 9 and 10. A reconstructed time‐series representation of the
actual eruption (Thordarson and Self, 2003) is presented in Fig. 3.
Table 10. Overleaf. Elicited source parameters for a future Laki scenario (large‐volume basaltic
fissure eruption) giving the median and 5% and 95% values based on weighted opinions.
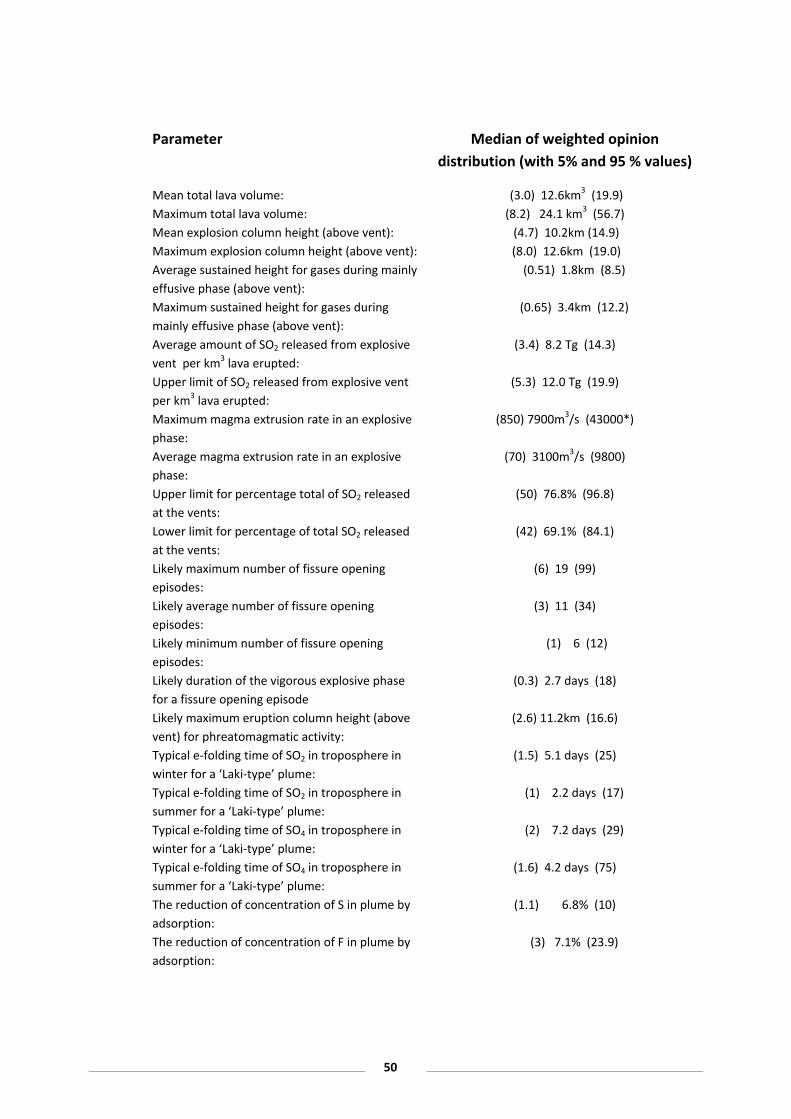
50
Parameter Median of weighted opinion
distribution (with 5% and 95 % values)
Mean total lava volume: (3.0) 12.6km3 (19.9)
Maximum total lava volume: (8.2) 24.1 km3 (56.7)
Mean explosion column height (above vent): (4.7) 10.2km (14.9)
Maximum explosion column height (above vent): (8.0) 12.6km (19.0)
Average sustained height for gases during mainly
effusive phase (above vent):
(0.51) 1.8km (8.5)
Maximum sustained height for gases during
mainly effusive phase (above vent):
(0.65) 3.4km (12.2)
Average amount of SO2 released from explosive
vent per km3 lava erupted:
(3.4) 8.2 Tg (14.3)
Upper limit of SO2 released from explosive vent
per km3 lava erupted:
(5.3) 12.0 Tg (19.9)
Maximum magma extrusion rate in an explosive
phase:
(850) 7900m3/s (43000*)
Average magma extrusion rate in an explosive
phase:
(70) 3100m3/s (9800)
Upper limit for percentage total of SO2 released
at the vents:
(50) 76.8% (96.8)
Lower limit for percentage of total SO2 released
at the vents:
(42) 69.1% (84.1)
Likely maximum number of fissure opening
episodes:
(6) 19 (99)
Likely average number of fissure opening
episodes:
(3) 11 (34)
Likely minimum number of fissure opening
episodes:
(1) 6 (12)
Likely duration of the vigorous explosive phase
for a fissure opening episode
(0.3) 2.7 days (18)
Likely maximum eruption column height (above
vent) for phreatomagmatic activity:
(2.6) 11.2km (16.6)
Typical e‐folding time of SO2 in troposphere in
winter for a ‘Laki‐type’ plume:
(1.5) 5.1 days (25)
Typical e‐folding time of SO2 in troposphere in
summer for a ‘Laki‐type’ plume:
(1) 2.2 days (17)
Typical e‐folding time of SO4 in troposphere in
winter for a ‘Laki‐type’ plume:
(2) 7.2 days (29)
Typical e‐folding time of SO4 in troposphere in
summer for a ‘Laki‐type’ plume:
(1.6) 4.2 days (75)
The reduction of concentration of S in plume by
adsorption:
(1.1) 6.8% (10)
The reduction of concentration of F in plume by
adsorption:
(3) 7.1% (23.9)

51
3. Evaluate the eruptive gases, aerosols, and ash that may be produced and could ultimately
lead to impacts in the UK.
Volcanic degassing releases mainly H2O, CO2 (largely inert) and volatile acidic gas species such as
sulphur dioxide (SO2), hydrogen sulphide (H2S) and hydrogen halides (hydrogen chloride ‐HCl,
hydrogen fluoride ‐ HF, hydrogen bromide ‐ HBr) into the atmosphere. These gases will cool, mix
with the ambient atmosphere and concentrations will be diluted downwind, they also undergo a
range of physical and chemical processes (including gas‐gas reactions, or gas‐liquid‐solid reactions) depending on conditions. These processes control rates of conversion of gases to aerosols and also
deposition rates (removal from the atmosphere). Volcanic gases that could potentially be produced
in sufficient quantities to reach the UK under certain meteorological conditions (ie rapid transport)
might include SO2 and HF. Aerosols would include sulphuric acid (H2SO4) particles formed by
oxidation of SO2, other particulates might include sulphates, chlorides, bromides, trace metals and
fine ash (the latter formed only during vigorous explosive episodes). How this combination of gases
and aerosols might chemically interact with anthropogenic pollutants in the UK ambient air is
unclear. Precipitation may remove gases, fluoride, acids, and other aerosols from the atmosphere
and deliver them to the Earth’s surface (e.g. acid rain falling on soils, vegetation). There may also be
dry deposition of gases and aerosols, in particular acids in the absence of precipitation. See
Appendix F.
4. Establish what chemical reactions, physical processes and meteorology should be included
in modelling of plume transport.
There is much we don’t yet know about plume chemistry and the controls on it. It was agreed that
simple dispersal models without chemistry have value because they can address the first order
problem of getting toxic species to the UK at flight levels or into the atmospheric boundary layer (the
lowest part of the atmosphere in contact with the Earth’s surface). We need to better understand
the role of important physical and chemical processes such as SO2 oxidation, oxidant limitation,
adsorption, coagulation, nucleation, and wet and dry deposition using suitable models. Species such
as HF and HCl may act like tracers (for short time periods of minutes to a few hours under certain
conditions) so simple models may be adequate for them, species such as SO2 can be considered
using a decay constant to represent oxidation for example. In general, further study of the reactions
that might be involved in volcanic plumes and their kinetics is essential in order to assess residence
times and deposition rates and thus to facilitate more detailed modelling and quantitative
assessment of impacts. A variety of meteorological scenarios should be used when modelling to
inform impact assessments.
5. Establish what the wet and dry deposition rates might be.
A much improved understanding of plume chemistry and reactions is needed to understand the
residence times and deposition rates of gases and acid compounds. Hydrogen chloride and hydrogen
fluoride are more soluble in water than sulphur dioxide, and hence wet deposition may cause major
depletion of these species from the plume (especially during the night or in wet periods).Dry
deposition velocities depend on the reactivity of the species, so in experiments hydrogen fluoride
(with high ash absorptivity) is 1‐4 cm/s and SO2 0.1‐2 cm/s (Seinfeld, 1986). Delmelle et al. (2001)
showed that SO2 and HCl (hydrogen chloride) had similar dry deposition rates of c. 1.6 cm/s at

52
Masaya volcano (in the tropics). Wet deposition is mainly about precipitation so in environments
where there is much condensed water in the atmosphere (cloud), it is controlled by the rates of
reaction of different species. For example, HCl and HF are likely to have higher wet deposition rates
than SO2, because SO2 relies on chemical reaction in preference to physical dissolution
(Oppenheimer et al., 2003). Much more research is needed on both dry and wet deposition.
6. Characterise likely concentrations in the UK based on current knowledge.
Much more research and modelling are needed to address this (see Chapter 5 for a review of
published results). Chenet et al. (2005) suggested that a visible haze forms at 5 x 10‐9 kg sulphate
aerosol per kg of air (equivalent to 5ppb). Haze was present for prolonged periods in Europe during
the Laki eruption. Based on modelling using GLOMAP, Schmidt et al. (2011) suggested that aerosol
pollution (PM2.5) would double in concentration across Western Europe during the first three
months of a ‘Laki‐type’ eruption. This equates to 36 more days above the WHO PM2.5 guidelines
during the eruption.
7. Identify what the optimum monitoring and observation networks might look like from
source to UK.
In Iceland, a new EUFP7 ‘Supersite’ project is focusing significant European scientific effort on
monitoring the Eastern Volcanic Zone, magma tracking to improve eruption forecasting, early
warning, eruption source characterisation in near real‐time, and plume monitoring. Several UK
institutions including BGS, UK Met. Office and Cambridge University are participating in this project.
The UK government through BGS is also investing in real‐time geophysical monitoring in Iceland. The
NERC‐funded Vanaheim consortium led by Leeds University is working on connecting the near‐field
and far‐field observation capability. In the UK we need to coordinate our existing ground, air and
space resources, develop new technologies, in particular to better understand the vertical structure
of volcanic clouds or haze, address remote sensing limitations and improve the spatial and temporal
resolution of real‐time ground monitoring and subsequent analysis. Particular gaps include air
quality monitoring and SO2 monitoring in rural areas or in northwestern parts of the UK and any
ability to monitor H2S. This is discussed in Chapter 6 and Appendix F.
8. Understand what data on concentrations and deposition are required by health,
environment and infrastructure experts.
Air quality guidelines are well‐established in the UK and EU for SO2 which would be the main
constituent gas in the erupted plume and which in high enough concentrations would trigger acute
respiratory symptoms in asthma sufferers and aggravate the condition of patients with chronic lung
problems. To assess the effect on such individuals, peak concentrations measured over 15 minutes
would be compared with existing guideline values, and therefore short duration peaks are the most
important to model for health purposes. Sulphate aerosol, other volcanogenic aerosols and possible
fine ash would add to the existing particle concentrations in the atmosphere and at ground level
would be measured in routine monitoring networks as PM10 and PM2.5 (hourly and 24 hr means).
These would be compared with existing guideline values. Deposition maps can be produced using
existing capability (Appendix F). Further planning for critical infrastructure, environment and health
is recommended once some preliminary modelling has been carried out.

53
9.2 Knowledge gaps
9.2.1 Knowledge gaps were identified throughout the elicitation workshop and some of the main
issues are identified below but this list is not exhaustive:
We cannot measure HCl, HF and some other key species from satellite.
More work is needed to develop databases of satellite data for comparison and analysis to better understand processes and uncertainties in existing data.
Air and ground‐based methods are needed for comparison/validation of satellite methods. Improved and coordinated remote sensing including ground‐, air‐ and space‐based resources would significantly help source characterisation. More data from known eruptions is needed.
We’re lacking near‐source observations near the ground to establish in‐plume processes and could investigate specially designed spectrometers / radars to monitor in real‐time.
Numerical modelling of different eruption types such as lava fountaining to capture the physics of eruptions other than Plinian explosions. This should help with assessment of eruption rates, particle size distribution etc.
Processes in the eruption column change what actually ends up in the distal cloud (in terms of gas and aerosol) but we have a poor understanding of them: adsorption, coating of particles, high T gas phase chemistry...
How significant would the lava heat source be in terms of local meteorology and the impact on entrainment of ambient air?
Processes in the dispersing plume including adsorption, aggregation and their impact on gas/aerosol content of the plume are poorly understood.
Trace metals are present in plumes but we don’t understand much about them, their transformation, deposition or potential impact (e.g. mercury, iridium, arsenic).
Wet deposition coefficients are not sufficiently known.
The numerical modelling of ash fallout requires more sophistication.
Identify a HF scavenging co‐efficient process and any techniques for dealing with this and HCl.
Understand the role of fine ash particles on the oxidation of SO2 and identify if this is important enough to take into account.
Whether SO2 reaches ground levels in the UK (or is first converted to SO4 aerosol) is partly dependent on oxidant limitation but we don’t know enough about it or the controls on it.
Research is needed to evaluate if a Laki‐type scenario would increase the likelihood of extreme weather in the UK (drought, heatwave, severe winter, severe storms as seen in 1783‐4 but was this coincident)?
We have not yet sufficiently understood the likely far‐field health impacts of the Laki eruption and more thorough assessment is needed.
How do volcanic and anthropogenic pollutants interact and what is their combined impact on health?
54
9.3 Research and monitoring needed
Source term
1. High resolution monitoring campaigns are needed of future eruptions, from proximal to distal environments using multiple techniques to build knowledge and datasets.
2. Detailed process modelling (alongside 1). 3. Conduct lab experiments and theoretical work to define source term processes (alongside 1 and
2). 4. Develop models to capture the physics of different eruption types (e.g. lava fountaining). 5. Evaluate the influence of lava flows on buoyancy and entrainment of the plume (linked to 4). 6. Characterise the processes active within the column for reactivity and uptake in the column to
define the distal plume. 7. Evaluate the properties of the Laki tephra and compare what is in the explosive phase and the
effusive phase – develop modelling of lava fountaining.
Dispersion models
8. Getting gas and particles to respirable level in the atmosphere is most important – transport is first order. Need to run multiple models under different conditions to establish probabilities. Try models with chemistry and without, with SO2 and PM (Met Office and Leeds are working together to assess aspects of modelling for large SO2 eruptions).
9. Establish a method for evaluating dispersion models to ensure that they are producing realistic and necessary data for impact studies.
10. Identify what is sufficient to inform the decision making and planning process. 11. Create forecasts of quantities and concentrations, although it should be noted that one cannot
model health impacts directly from dispersion model outputs because we do not know who is at risk from PM (it is always multifactorial).
12. Models can produce concentrations of gases at the rate needed for health impacts (e.g. 15 minute WHO thresholds for SO2) but crucially it is not known how accurate they may be.
UK environment impacts
13. Identify the species of sulphate being dispersed and the degree to which there may be some neutralisation and the timescale of this process.
14. Establish: the fate of fluoride and the combination of sulphate and fluoride that may influence
reactivity and longevity and the impact on vegetation etc.
15. Understand the role of fine ash (produced for example during hydromagmatic explosions),
catalysis of SO2, impact on e‐folding time etc.
16. Investigate interaction of plume constituents with anthropogenic pollution, also halogen impact
on oxidant limitation, trace metals and toxicity, reaction of organics to create new compounds.
17. Conduct vegetation and crops resistivity work.
18. Constrain values for HF and fluoride (during Laki) and identify to what extent the impacts were
due to these species. HF is possible given a 6 hour travel time from Iceland to UK.
19. Need better understanding of wet deposition coefficients.
20. Evaluate the potential for a Laki scenario to increase the possibility of having extreme weather events in the UK.
Health impacts
21. A full review of historical and modern knowledge to increase understanding of what happened in 1783 in the UK (including Scotland where no analysis has been carried out), Europe and

55
Iceland based on a modern understanding of air pollution. Negative reporting is as important as positive reporting but is not included in recent compilations.
22. Undertake a critical evaluation of published reports on mortality from Laki in 1783.
23. Evaluate what the role of mixing volcanic pollutants with anthropogenic pollutants would be to
increasing pollution, reactivity and producing new polluting compounds.
24. Do volcanic particles (ash and sulphate aerosol) differ in their toxicity from particulate matter
already present in the ambient air and derived from anthropogenic sources?
25. Can we estimate the mortality impacts in the UK from a future Laki‐like eruption?
Monitoring
26. Fill in gaps in UK monitoring capability (see Chapter 6 and Appendix F).
27. Review UK remote sensing capabilities and the accuracy of the measurements that we can make for both gas and particle loads.
28. Establish a long‐term strategy for sampling, ash collection and analyses including leachates
(Appendices F and H, I).
29. Enhance linkages between NERC facilities (ground, airborne and space monitoring). 30. Investigate new remote‐sensing instruments with ability to detect HCl, HF and other species that
we can’t currently detect for satellite payloads. 31. Investigate possibility of a dedicated ‘Laki‐SAT’ or several with small payloads on for example
telecommunications satellites. The aim would be higher temporal and spatial resolution than the
geostationary SEVIRI (for which Iceland is at high latitudes therefore very high angle).
9.4 Response needed
Emergency response
1. Establish an emergency response plan with timescales.
2. Establish a response plan and public advice to raise UK resilience to long‐term impacts (much
work has already been undertaken by the Health Protection Agency).
9.5 Recommendations
1. The research and monitoring recommendations described above should be encouraged and facilitated, inevitably funding opportunities are required. Some projects are now already underway as a result of the meeting at the Cabinet Office in May 2012 to establish some preliminary modelling results but a multi‐disciplinary effort across the scientific community is needed for longer term progress. Impact studies on environment and infrastructure including aviation are particularly important.
2. Given the current limited evidence on which to base public health and environmental actions
in the event of a future large‐volume fissure eruption, it is recommended that a precautionary approach is taken and it is assumed that the toxicity of volcanic particulate air pollution (including ash and sulphate aerosol) is similar to ambient air particulate for monitoring and health surveillance purposes. In a scenario of the plume fumigating at ground level it is the peak levels of short duration (minutes) of SO2 which are of main concern to human health , in particular asthma sufferers. It is suggested that UK impacts would be variable spatially and temporally. Improved near real‐time monitoring of SO2 and other gases is needed in the UK and guidance needs to be prepared in advance for the public and for those sensitive to air pollution (e.g. asthmatics).

56
3. Additional advice should be sought from an expert advisory group (perhaps specially convened for this purpose), including calculating estimates of short and long‐term mortality for Laki‐type episodes lasting over many months, with calculations for ambient air levels of PM2.5, PM10 and SO2 extrapolated beyond those adopted for the current air quality guidelines. The toxicity of the volcanic particles (ash and sulphate aerosols) would require specific evaluation by expert judgement by the Committee.
4. UK air quality guidelines are set on health criteria and provide a wide margin of safety in the population. In a natural event outside regulatory control, the guidelines for particulate matter and SO2 could be temporarily relaxed and additional information provided to the public based on actual daily levels from the air monitoring network. Thus, advice for chest patients could include when to stay indoors, when to wear a suitable mask if going outdoors, or when asthma sufferers should increase their medication with their doctor’s knowledge to control symptoms.
5. Special measures for the general population and patients, including the type of advice
mentioned in the preceding paragraph, need to be planned for in advance and prepared for rapid dissemination by the media in the event of a fissure eruption which could grow into a Laki event. The small volcanic island of Myakejima, south of Tokyo, is instructive as an example of a population living on a volcano emitting large quantities of SO2 from its summit. Warning systems (loudspeakers, flashing traffic lights) inform the people (issued with gas masks) if the gas levels are rising. Many houses and all public buildings, including schools, have been fitted with special ventilation systems which filter out SO2 and can be switched on if required (Kajino et al., 2004; Ishigama et al., 2008). Above all, there is a high level of understanding about the hazard in the population.
6. Difficulties in predicting source terms before the fissure eruption and in the modelling of the dispersion of the plume, as well as the limits to our understanding of the chemical reactions in the plume during its transport, may lead to quite uncertain forecasts of exposure in the UK population. Order of magnitude levels of SO2 from 0.02 ppm to 0.2 ppm to 2 ppm, for example, would mean different levels of acute response in susceptible people, and would be a broad but adequate basis for producing planning advice by emergency managers.

57
10. References
Aiuppa A., Franco, A., von Glasow, R., Allen, A. G., D’Alessandro, W., Mather, T. A., Pyle, D. M., and
Valenza, M. 2004. The tropospheric processing of acidic gases and hydrogen sulphide in
volcanic gas plumes as inferred from field and model investigations. Atmos. Chem. Phys.
Discuss., 6, 11653–11680.
Aiuppa, A., Moretti, R., Federico, C., Giudice, G., Gurrieri, S., Liuzzo, M., Papale, P., Shinohara, H.
And Valenza, M. 2007a. Forecasting Etna eruptions by real‐time observation of volcanic gas
composition. Geology, 35,(12), 1115‐1118.
Aiuppa A., A. Franco, A., von Glasow, R., Allen, A. G., D’Alessandro, W., Mather, T. A., Pyle, D. M.,
and Valenza, M. 2007b. The tropospheric processing of acidic gases and hydrogen sulphide in
volcanic gas plumes as inferred from field and model investigations Atmos. Chem. Phys., 7,
1441–1450.
Allen, A. G., Oppenheimer, C., Ferm, M., Baxter, P. J., Horrocks, L. A., Galle, B., McGonigle, A. J. S.,
Duffell, H. J. 2002. J. Geophys. Res., 107. doi: 10.1029/2002JD002120
Ammann, M. and H. Burtscher, Aerosol dynamics and light‐scattering properties of a volcanic
plume, J. Geophys. Res., 98, 19,705‐19,711, 1993.
Aspinall, W. P. A., Loughlin, S. C., Michael, F. V., Miller, A. D., Norton, G. E., Rowley, K. E., Sparks, R.
S. J. and Young, S. Y. 2002. The Montserrat Volcano Observatory, its evolution, organisation,
role and activities, In: Druitt, T. H. and Kokelaar, B. P. (eds) The eruption of Soufrière Hills
Volcano, Montserrat from 1995 to 1999. Geological Society of London, Memoirs, 21, 71‐91.
Baxter, P. J. 2000. Impacts of eruptions on human health. In: Encyclopedia of Volcanoes, H.
Sigurdsson, B. F. Houghton, S. R. McNutt, H. Rymer, and J. Stix (eds). Academic, London, 1035‐
1043.
Bellomo, S., Alessandro, W.D. and Longo, M. 2003. Volcanogenic fluorine in rainwater around
active degassing volcanoes: Mt. Etna and Stromboli Island, Italy. Sci. Total Environ., 301, 175–
185.
Blake, S. 2003. Correlations between eruption magnitude, SO2 yield, and surface cooling. In: C.
Oppenheimer, D.M. Pyle, J. Barclay (Eds.), Geol. Soc. Spec. Pub., 213,371‐380.
doi:10.1144/GSL.SP.2003.213.01.22.
Blake, S., Self, S., Sharma, K., Sephton, S. 2010. Sulphur release from the Columbia River Basalts
and other flood lava eruptions constrained by a model of sulphide saturation. Earth Planet. Sci.
Lett., 299, 328‐338.
Bobrowski, N., von Glasow, R., Aiuppa, A., Inguaggiato, S., Louban, I., Ibrahim, O.W. and Platt, U.
2007. Reactive halogen chemistry in volcanic plumes, J.Geophys. Res., 112, D06311.
Boichu, M., Oppenheimer, C., Tsanev, V. and Kyle, P. R. 2010. High temporal resolution SO2 flux
measurements at erebus volcano, Antarctica, J. Volcanol. Geotherm. Res., 190, 325‐336.

58
Bonadonna C, Folch A., Loughlin S, Puempel H, (2011a) Future developments in modelling and
monitoring of volcanic ash clouds: outcomes from the first IAVCEI‐WMO workshop on Ash
Dispersal Forecast and Civil Aviation (Geneva, Switzerland, 18‐20 October 2010), Short
Scientific Communication, Bulletin of Volcanology, 74 (1), 1‐10.
(http://www.springerlink.com/content/h01x16460482134w/)
Bonadonna C., Folch A, Loughlin S (2011b) Future developments in modelling and monitoring of
volcanic ash clouds: Outcomes from the first IAVCEI‐WMO workshop on Ash Dispersal Forecast
and Civil Aviation (Geneva, Switzerland, 18‐20 October 2010), EOS, Vol. 92, No. 10.
Brayshay, M. and Grattan, J. 1999. Environmental and social responses in Europe to the 1783
eruption of the Laki fissure volcano in Iceland: a consideration of contemporary documentary
evidence. Geol. Soc. Spec. Pub., 161,173‐187.doi:10.1144/GSL.SP.1999.161.01.12.
Brook, R. D., Rajagopalan, S., Pope, C. A. 3rd, Brook, J. R., Bhatnagar, A., Diez‐Roux, A. V., Holguin,
F., Hong, Y., Luepker, R. V., Mittleman, M. A., Peters, A., Siscovick, D., Smith, S. C. Jr, Whitsel, L.,
Kaufman, J. D. 2010. Particulate matter air pollution and cardiovascular disease: An update to
the scientific statement from the American Heart Association. Circulation, 121, 2331‐2378.
Camuffo, D. and Enzi S. 1995. Impact of the clouds of volcanic aerosols in Italy during the last 7
centuries, Nat. Haz., 11, 135‐161.
Carn, S.A., Krueger, A.J., Krotkov, N.A., Yang, K., Evans, K. 2009. Tracking volcanic sulfur dioxide
clouds for aviation hazard mitigation. Natural Hazards, 51 (2), 325‐343. doi: 10.1007/s11069‐
008‐9228‐4.
Charlson, R.J., Schwartz, S.E., Hales, J.M., Cess, R.D., Coakley, J.A., Hansen, J.E. and Hoffman, D.J.
1992: Climate forcing by anthropogenic aerosols. Science, 255, 423‐430,
doi:10.1126/science.255.5043.423.
Chenet, A‐L., Fluteau, F., Courtillot, V. 2005. Modelling massive sulphate aerosol pollution
following the large 1783 Laki basaltic eruption. Earth Planet. Sci. Lett., 236, 721‐731.
Chin, M., Rood, R. B., Li, S‐J. 2000. Atmospheric sulphur cycle simulated in the global model
GOCART: Model description and global properties. J. Geophys. Res., 105, D20, 24,671‐24,687.
Clarisse, L., Coheur, P. F., Prata, A. J., Hurtmans, D., Razavi, A., Phulpin, T., Hadji‐Lazaro, J. And
Clerbaux, C. 2008. Tracking and quantifying volcanic SO2 with IASI, the September 2007
eruption at Jebel al Tair. Atmos. Chem. Phys., 8, 7723‐7734. doi:10.5194/acp‐8‐7723‐2008.
Courtillot, V. E. And Renne, P. R. 2003. On the ages of flood basalt events. Comptes Rendus
Geoscience, 335, 113‐140.
Cronin, S.J., and Sharp, D.S. 2002. Environmental impacts on health from continuous volcanic
activity at Yasur (Tanna) and Ambrym, Vanuatu, Int. J. Environ. Heal. R., 12, 109‐123.
Dacre, H. F.,Grant, A. L. M., Hogan, R. J., Belcher, S. E., Thomson, D. J., Devenish, B., Marenco, F.,
Hort, M. C., Haywoood, J. M., Ansmann, A., Mattis, I., Clarisse, L. . 2011. Evaluating the
structure and magnitude of the ash plume during the initial phase of the 2010 Eyjafjallajökull

59
eruption using lidar observations and NAME simulations. J. Geophys. Res., 116, D00U03,
doi:10.1029/2011JD015608.
D’Arrigo,. R., Seager, R., Smerdon, J. E., LeGrande, A. N. 2011. The anomalous winter of 1783‐1784:
Was the Laki eruption or an analog of the 2009‐2010 winter to blame? Geophys. Res. Lett., 38,
L05706 doi:10.1029/2011GL046696.
Delmelle, P. 2003 Environmental impacts of tropospheric volcanic gas plumes. In: C. Oppenheimer,
D.M. Pyle, J. Barclay (Eds.), Geol. Soc. Spec. Pub., 213,381‐399.
doi:10.1144/GSL.SP.2003.213.01.23.
Delmelle, P., Stix, J., Bourque, C. P. A., Baxter, P., Garcia‐Alvarez, J., Barquero, J. 2001. Dry
deposition and heavy acid loading in the vicinity of Masaya volcano, a major sulfur and chlorine
source in Nicaragua. Environ. Sci. Technol. 7,1289‐1293
Delmelle, P., Stix, J., Baxter, P. J., Garcia‐Alvarez, J., Barquero, J. 2002. Atmospheric dispersion,
environmental effects and potential health hazard associated with the low‐altitude gas plume
of Masaya volcano, Nicaragua, Bull. Volcanol., 64, 423‐434.
Delmelle P. Villiéras F. Pelletier M. 2005. Surface area, porosity and water adsorption properties of
fine volcanic ash particles. Bull.Volcanol., 67,160‐169.
Delmelle, P., Lambert, M., Dufrene, Y., Gerin, P., Oskarsson, N. 2007. Gas/aerosol‐ash interaction in volcanic plumes: new insights from surface analysis of fine volcanic ash. Earth Planet. Sci. Lett., 259,159‐170.
Durand, M. and Grattan, J. 1999. Extensive respiratory health effects of volcanogenic dry fog in
1783 inferred from European documentary sources. Environmental Geochemistry and Health
21, 371‐376.
Eckhardt, S. , Prata, A. J., Seibert, P., Stebel, K. And Stohl, A. 2008. Estimation of the vertical profile
of sulphur dioxide injection into the atmosphere by a volcanic eruption using satellite column
measurements and inverse transport modelling, Atmos. Chem. Phys., 8, 3881‐
3897.doi:10.5194/acp‐8‐3881‐2008.
Edmonds, M., Oppenheimer, C., Pyle, D. M. and Herd, R. 2003. Rainwater and ash leachate analysis
as proxies for plume chemistry at Soufrière Hills volcano, Montserrat. Geological Society,
London, Special Publications 2003, v. 213, p. 203‐218. Doi:10.1144/GSL.SP.2003.213.01.12
European Food Safety Authority. 2010. Statement of EFSA on the possible risks for public and
animal health from the contamination of the feed and food chain due to possible ash‐fall
following the eruption of the Eyjafjallajökull volcano in Iceland – urgent advice. EFSA Journal
8(4), 1593.Fiacco, R.J., Thordarson, T., Germani, M.S., Self, S., Palais, J. M., Whitlow, S. and
Grootes, P. 1994. Atmospheric loads and transport due to the 1783–84 Laki eruption in
Iceland, interpreted from ash particles and acidity in the GISP2 Ice Core. Quat. Res., 42, 231–
240.Fujita, S., Sakurai, T., Matsuda, K. 2003. Wet and dry deposition of sulphur associated with
the eruption of Miyakejima volcano, Japan, J. Geophys. Res., 108 (D15),
444.doi:10.1029/2002JD003064.

60
Franklin, B. 1784. Meteorological imaginations and conjectures, Mem. Lit. Philos. Soc. Manchester,
2, 373–377.
Galle, B., Johansson, M., Rivera, C., Zhang, Y., Kihlman, M., Kern, C., Lehmann, T., Platt, U.,
Arellano, S., Hidalgo, S. 2010. Network for Observation of Volcanic and Atmospherci Change
(NOVAC) – A global network for volcanic gas monitoring: Network layout and instrument
description. J. Geophys. Res., 115, D05304.
Garnier, E. 2011. The Laki fog of 1783. Volcanic activity and health crises in Europe. Bulletin de
L’Academie Nationale de Medecine, 195 (4‐5), 1043‐1055.
Gauci, V., Blake, S., Stevenson, DS, and Highwood, E. 2008. Halving of the Northern wetland CH4
source by a large Icelandic volcanic eruption. J.Geophys. Res., 113, G00A11.
doi:10.1029/2007JG000499.
Gerlach, T. M. 2004.Volcanic sources of tropospheric ozone‐depleting trace gases, Geochem.
Geophys.Geosyst., 5, Q09007, doi:10.1029/2004GC000747.
Gerlach, T.M., and McGee, K.A. 1994. Total sulfur dioxide emissions and pre‐eruption vapor‐
saturated magma at Mount St. Helens, 1980‐88: Geophys. Res. Lett., 21, 25, 2833‐2836.
Giggenbach, W.F. and Goguel, R.L. 1989, Collection and analysis of geothermal and volcanic water and gas discharges, DSIR report CD 2401, 4th ed., Pentone, New Zealand.
Goff, F., Janik, C.J., Delgado, H., Werner, C., Counce, D., Stimac, J.A., Siebe, C., Love, S.P., Williams,
S.N., Fischer, T. and Johnson, L. 1998. Geochemical surveillance of magmatic volatiles at
Popocatpetl Volcano, Mexico. Geol. Soc. Am. Bull., 110(6), 695‐710.
Graf, H‐F., Feichter, J., Langmann, B. 1997. Volcanic sulphur emissions: Estimates of source
strength and its contribution to the global sulfate distribution. J. Geophys. Res. 102 (D9),
10,727‐10,738.
Grainger, R., Highwood, E. 2003. Changes in Stratospheric Composition, Chemistry, Radiation and
Climate Caused by Volcanic Eruption, Volcanic Degassing, in: C. Oppenheimer, D.M. Pyle, J.
Barclay (eds.), Geol. Soc. Spec. Publ., 213,329–347.
Grattan, J. P. and Charman, D. J. 1994. Non–climatic factors and the environmental impact of
volcanic volatiles: implications of the Laki Fissure eruption of AD 1783. The Holocene, 4(1),
101–106.
Grattan, J. and Sadler, J. 1999a. Regional warming of the lower atmosphere in the wake of volcanic
eruptions: the role of the Laki fissure eruption in the hot summer of 1783. Geol. Soc. Spec.
Publ., 161,161‐171, doi:10.1144/GSL.SP.1999.161.01.11.
Grattan, J.P. and Pyatt, F.B. 1999b. Volcanic eruptions, dry fogs and the European
palaeoenvironmental record; localised phenomena or hemispheric impacts? Glob. Planet.
Change, 21, 173–179.

61
Grattan, J., Brayshay, M., Sadler, J. 1998. Modelling the distal impacts of past volcanic gas
emissions: evidence of Europe‐wide environmental impacts from gases emitted during the
eruption of Italian and Icelandic volcanoes in 1783. Quaternaire, 9, 25–35.
Grattan, J., Gilbertson, D., Charman, D., 1999. Modelling the impact of Icelandic volcanic eruptions
upon the prehistoric societies and environment of northern and western Britain. Geol. Soc.
Spec. Publ., 161,109‐124, doi:10.1144/GSL.SP.1999.161.01.08.
Grattan, J., Durand, M., Taylor, S. 2003. Illness and elevated human mortality in Europe coincident
with the Laki Fissure eruption. In: C. Oppenheimer, D.M. Pyle, J. Barclay (Eds.), Geol. Soc. Spec.
Publ., 213, 401‐414, doi:10.1144/GSL.SP.2003.213.01.24.
Grattan, J.P., Rabartin, R., Self, S., Thordarson, T. 2005. Volcanic air pollution and mortality in
France 1783–84 C. R. Geosci., 337, 641–651.
Gudmundsson, M. T., Thordarson, T., Höskuldsson, Á., Larsen, G., Björnsson, H., Prata, F. J.,
Oddsson, B., Magnússon, E., Högnadóttir, T., Petersen, G., Hayward, C. L., Stevenson, J. A. and
Jónsdóttir, I. 2012. Ash generation and distribution from the April‐May 2010 eruption of
Eyjafjallajökull, Iceland. Sci. Rep., 2, 572. doi: 10.1038/srep00572.
Halmer, M. M., Schmincke, H‐U., Graf, H‐F. 2002. The annual gas input into the atmosphere, in
particular into the stratosphere: a global data set for the past 100 years. J. Volcanol. Geotherm.
Res., 15, 511‐528.
Hammer, C. U., Clausen, B., Dansgaard, W. 1980. Greenland ice sheet evidence of postglacial
volcanism and its climatic impact. Nature, 288, 230‐235.
Hansell, A., Oppenheimer, C. 2004. Health hazards from volcanic gases: a systematic literature
review. Arch. Environ. Health. 59 (12), 628‐639.
Heard, I.P.C., Manning, A. J., Haywood, J. M., Witham, C., Redington, A., Jones, A., Clarisse, L.,
Bourassa, A. 2012. A comparison of atmospheric dispersion model predictions with
observations of SO2 and sulphate aerosol from volcanic eruptions. J. Geophys. Res., 117,
D00U22. doi:10.1029/2011JD016791.
Hewitt, C. N. 2001. The atmospheric chemistry of sulphur and nitrogen in in power station plumes.
Atmos. Env., 35, 1155‐1170.
Highwood, E. J., Stevenson, D. S. 2003. Atmospheric impact of the 1783–1784 Laki Eruption: Part II.
Climatic effect of sulphate aerosol Atmos. Chem. Phys., 3, 1177–1189.
Horrocks, L. A., Oppenheimer, C., Burton, M. R., and Duffell, H. J. 2003. Compositional variation in
tropospheric volcanic gas plumes: evidence from ground‐based remote sensing. In:
Oppenheimer, C., Pyle D. and Barclay, J. (eds). Volcanic Degassing, Geological Society Special
Publications, 213, 349–369.
Ilyinskaya, E., Oppenheimer, C., Mather, T.A., Martin, R.S. and Kyle P.R. 2010. Size‐resolved
chemical composition of aerosol emitted by Erebus volcano, Antarctica, Geochem. Geophys.
Geosys., 11, Q03017. doi:10.1029/2009GC002855.

62
IPCC Third Assesment Report, In: J.T. Houghton,. Y. Ding,D.J. Griggs, M. Noguer, P.J. vander Linden,
X. Dai, K. Maskell, C.A. Johnson (eds.), Climate Change 2001: The Scientific Basis, Cambridge
University Press, 2001.
Ishigama, A., Kikuchi, Y., Iwasawa, S., Nishiwaki, Y., Takebayashi, T., Tanaka, S. Omae, K. 2008.
Volcanic sulphur dioxide and acute respiratory symptoms on Miyakejima island. Public and
Environmental Health Research Unit, London School of Hygiene and Tropical Medicine.
Jóhannesson, H. And Sæmundsson, K. 1998. Geological Map of Iceland, 1:500,000. Bedrock
Geology. Icelandic Institute of Natural History and Iceland Geodetic Survey, Reykjavík.
Jones, P. D., Osborn, T. J. And Briffa, K. R. 2001. The Evolution of Climate Over the Last Millenium.
Science, 292 (5517), 662
Jude‐Eton, T., Thordarson, T., Gudmundsson, M. T. 2011. Dynamics, Stratigraphy, and Proximal
Dispersal 1 of Supraglacial Tephra during the Ice‐confined 2004 Eruption at Grímsvötn Volcano,
Iceland based on field, observational, and tremor data. Bull. Volcanol., 74, 1057 – 1082.
Kajino, M., Uedo, H., Satsumabayashi, H., An, J. 2004. Impacts of the eruption of Miyakejima
Volcano on air quality over far east Asia. J. Geophys. Res., 109, D21204. doi:
10.1029/2004JD004762.
Kaminski, E., Chenet, A.‐L., Jaupart, C., Courtillot, V. 2011. Rise of volcanic plumes to the
stratosphere aided by penetrative convection above large lava flows, Earth Planet. Sci. Lett.,
301, 1–2, 171‐178, ISSN 0012‐821X, 10.1016/j.epsl.2010.10.037.
Kern, C., Deutschmann, T., Vogel, L., Wöhrbach, M., Wagner, T., Platt, U. 2010. Radiative transfer
corrections for accurate spectroscopic measurements of volcanic gas emissions. Bull Volcanol ,
72, 233–24. doi 10.1007/s00445‐009‐0313‐7.
King, J. and C. Ryskamp, 1981. The letters and prose writings of William Cowper. Vol. II. Clarendon
Press, Oxford.
Lanciki, A., J. Cole‐Dai, J., Thiemens, M. H., and Savarino, J. 2012. Sulfur isotope evidence of little or
no stratospheric impact by the 1783 Laki volcanic eruption, Geophys. Res. Lett., 39, L01806.
doi:10.1029/2011GL050075.
Larsen, G. 1984. Recent volcanic history of the Veidivotn fissure swarm, southern Iceland – an
approach to volcanic risk assessment. J. Volcanol. Geoth. Res., 22, 33‐58.Larsen, G. 1993.
Tephra layer from the 10th century Eldgjá fissure eruption in South Iceland, EOS, 74, 132–133.
Larsen, G. 1993. Tephra layer from the 10th century Eldgjá fissure eruption in South Iceland, EOS,
74, 132–133.
Larsen, G. 2000. Holocene eruptions within the Katla volcanic system, south Iceland:
characteristics and environmental impact. Jökull, 49, 1‐28.
Longo, B. 2009. The Kilauea Volcano Adult Health Study, Nurs. Res., 58, 23‐31

63
Longo, B.M., Grunder, A., Chuan, R., and Rossignol, A. 2005. SO2 and fine aerosol dispersion from
the Kilauea plume, Kau district, Hawaii, USA, Geology, 33, 217‐220
Longo, B., A. Rossignol, and J. Green (2008), Cardiorespiratory health effects associated with
sulphurous volcanic air pollution, Public Health, 122, 809‐820
Longo, B.M., Yang, W., Green, J.B., Crosby, F.L. and Crosby, V.L. 2010. Acute health effects
associated with exposure to volcanic air pollution (vog) from increased activity at Kilauea
Volcano in 2008., J. Toxicol. Env. Health, 73, 1370‐1381.
Louban, I., Bobrowski, N., Rouwet, D., Inguaggiato, S., and Platt, U.2009. Imaging DOAS for
volcanological applications, B. Volcanol., 71, 753–765, doi:10.1007/s00445‐008‐0262‐6.
Martin, R. S., Mather T. A., and Pyle, D. M. 2006. Modeling the chemistry of high temperature
mixtures of magmatic and atmospheric gases, Geochem. Geophys. Geosys., 7, Q04006,
doi:10.1029/2005GC001186.
Martin, R. S., Mather, T. A., Pyle, D. M., Power, M., Allen, A.G., Aiuppa, A., Horwell, C.J. and Ward,
E.P.W. 2008. Composition‐resolved size distributions of volcanic aerosols in the Mt. Etna
plumes, J.Geophys.Res., 113, D17211. doi:10.1029/2007JD009648.
Martin, R. S., Mather, T. A., Pyle, D. M., Watt, S. F. L., Day, J. A., Collins, S. J., Wright, T. E., Aiuppa,
A., Calabrese. 2009. Sweet chestnut (Castanea sativa) leaves as a bio‐indicator of volcanic gas,
aerosol and ash deposition onto the flanks of Mt Etna in 2005‐2007. J. Volcanol. Geotherm.
Res. 179, 107‐119.
Martin, R. S. M, Mather, T. A., Pyle, D. M., Day, J.A., Witt, M. L. I., Collins, S.J., Hilton, R.G. 2010.
Major and trace element distributions around active volcanic vents determined by analyses of
grasses: implications for element cycling and bio‐monitoring, Bull.Volcanol., 72(8), 1009‐1020.
doi:10.1007/s00445‐010‐0374‐7.
Martin, R. S., Wheeler, J. C., Ilyinskaya, E., Braban, C. F., Oppenheimer, C. 2012. The uptake of
halogen (HF, HCl, HBr and HI) and nitric (HNO3) acids into acidic sulphate particles in quiescent
volcanic plumes. Chem. Geol., 296‐297, 19‐25.
Mather, T.A. 2008. Volcanoes and the atmosphere: the potential role of the atmosphere in
unlocking the reactivity of volcanic emissions, Philos. T. Roy. Soc., A 366, 4581‐4595.
Mather, T.A., Pyle, D.M. and Oppenheimer, C. 2003. Tropospheric volcanic aerosols, in Volcanism and the Earth’s Atmosphere, Geophysical Monograph Series, 139, edited by A. Robock and C. Oppenheimer, AGU, 189–212.
Mather, T.A., Oppenheimer, C., Allen, A.G. and McGonigle,A.J.S. 2004. Aerosol chemistry of emissions from three contrasting volcanoes in Italy, Atmos. Environ., 38, 5637 – 5649. doi:10.1016/j.atmosenv.2004.06.017
McCormick, B.T., Edmonds, M., Mather, T.A., Carn, S.A. 2012. First synoptic analysis of volcanic
degassing in Papua New Guinea. Geochem. Geophy. Geosy.,13 (3).

64
McGonigle, A. J. S. and Oppenheimer, C. 2003. Optical sensing of volcanic gas and aerosol
emissions. In: Oppenheimer, C., Pyle, D.M. & Barclay, J. (eds) Volcanic Degassing. Geological
Society, London, Special Publications, 213, 149‐168.
McGonigle, A. J. S., Delmelle, P., Oppenheimer, C., Tsanev, V. I., Delfosse, T., Williams‐Jones, G.,
Horton, K., and Mather, T. A. 2004.SO2 depletion in tropospheric volcanic plumes, Geophys.
Res. Lett., 31, L13201. doi:10.1029/2004GL019990.
Metrich, N., Sigurdsson, H., Meyer, P. S., Devine, J. D. The 1783 Lakagigar eruption in Iceland:
geochemistry, CO2 and sulfur degassing (1991) Contrib.Mineral. Petr. 107 (4), 435‐447. doi:
10.1007/BF00310678.
Miller, D.J. 1989. The 10th century eruption of Eldgjá, Southern Iceland. Nordic Volcanological
Institute Publication 8903, Reykjavik, Iceland. 30 bls.
Miller, T.P., and Casadevall, T.J., 2000, Volcanic ash hazards to aviation, in, Sigurdsson, H., ed.,
2000, Encyclopedia of Volcanoes: San Diego, Academic Press, p. 915‐930.
Montredon, M. M. 1784. Recherches sur l’origine et la nature des vapeurs qui ont régné dans
l’atmosphère pendant l’été de 1783. Mém. Acad. R. Sci., Paris 1784 754–773
Möller, D. 1980. Kinetic model of atmospheric SO2 oxidation based on published data. Atmos. Env.,
14, 1067‐1076.
Oddsson, B., Gudmundsson, M.T., Larsen, G., Karlsdottir, S. 2012. Monitoring of the plume from
the basaltic phreatomagmatic 2004 Grímsvötn eruption—application of weather radar and
comparison with plume models. Bull. Volcanol., 74(6), 1395-1407.
Oman, L., Robock, A., Stenchikov, G. L., Thordarson, T. 2006. High‐latitude eruptions cast shadow
over the African monsoon and the flow of the Nile. Geophys. Res. Lett., 33, L18711,
doi:10.1029/2006GL027665.
Oman, L., Robock, A., Stenchikov, G. L., Thordarson, T., Kich, D., Shindell, D. T., Gao, C. 2006.
Modelling the distribution of the volcanic aerosol cloud from the 1783‐1784 Laki eruption. J.
Geophys. Res., 111, D12209, doi:10.1029/2005JD006899.
Oppenheimer, C., Scaillet, B., Martin, R.S. 2011 Sulphur degassing from volcanoes: source
conditions, surveillance, plume chemistry and earth system impacts. Rev. Mineral. Geochem.,
73, 363‐421. doi: 10.2138/rmg.2011.73.13
Oppenheimer, C., Tsanev, V. I., Braban, C. F., Cox, R. A., Adams, J. W., Aiuppa, A., Bobrowski,N.,
Delmelle, P., Barclay, J., and McGonigle, A. J. S. 2006. BrO formation in volcanic plumes,
Geochim. Cosmochim. Acta, 70, 2935–2941.
Oppenheimer, C. and McGonigle, A. J. S. 2004. Exploiting ground‐based optical sensing
technologies for volcanic gas surveillance. Ann. Geophys., 47, 1455‐1470.

65
Oppenheimer, C., Francis, P., and Stix, J. 1998. Depletion rates of SO2 in tropospheric volcanic
plumes, Geophys. Res. Lett., 25, 2671–2674.
Oskarsson, N. 1980. The interaction between volcanic gases and tephra: Fluorine adhering to
tephra of the 1970 Hekla eruption, J. Volcanol. Geotherm. Res., 8, 251– 266.
Ostro, B. 2004. Outdoor air pollution: Assessing the environmental burden of disease at national
and local levels. WHO Environmental Burden of Disease Series, No. 5, (WHO, Geneva).
Palais, M. And Sigurdsson, H. 1989. Petrogic evidence of volatile emissions from major historic and
pre‐historic volcanic eruptions. In: A. Berger, R. E. Dickinson and J. W. Kidson (eds), IUGG vol. 7.
Understanding Climate Change (Geophys. Monogr., 52). Am. Geophys. Union, Washington, DC,
31‐53.
Parfitt, E. A. & Wilson, L. 2008. Fundamentals of Physical Volcanology. xxi + 230 pp. Oxford:
Blackwell. doi:10.1017/S0016756809006074
Payne, R. J., Edwards, K. J., Blackford, J. J. 2012. Volcanic impacts on the Holocene vegetation
history of Britain and Ireland? A review and meta‐analysis of the pollen evidence. Veget. Hist.
Archaeobot., 1‐12.
Penkett, S. A., Jones, B. M. R., Brice, K. A., and Eggleton, A. E. J. 1979. The importance of
atmospheric ozone and hydrogen peroxide in oxidising sulphur dioxide in cloud and rainwater,
Atmos. Environ., 13, 123–137.
Petersen, G. N., Bjornsson, H., Arason, P. 2012. The impact of the atmosphere on the
Eyjafjallajokull 2010 eruption plume. J. Geophys. Res., 117, D00U07,
doi:10.1029/2011JD016762.
Pope, C. A., Burnett, R. T., Thun, M. J., Calle, E. E., Krewski, D., Ito, K., Thurston, G. D. 2002. Lung
cancer, cardiopulmonary mortality and long‐term exposure to fine particulate air pollution. J.
Am. Med. Assoc., 287, 1132‐1141.
Pope, C.A. and Dockery, D.W. 2006. Health effects of fine particulate air pollution: lines that
connect' , J. Air Waste Manage., 56, 709‐742.
Prata, A. J. and Kerkmann, J. 2007. Simultaneous retrieval of volcanic ash and SO2 using MSG‐
SEVIRI measurements, Geophys. Res. Lett., 34, L05813, doi: 10.1029/2006GL028691.
Ravishankara, A. R. 1997.Heterogeneous and multiphase chemistry in the troposphere, Science,
276, 1058–1065.
Renard, J. J., Calidonna, S. E., Heley, M.V. 2004. Fate of ammonia in the atmosphere – a review for
applicability for hazardous releases. J. Hazard. Mater., B108, 29‐60.
Rabartin, R. and Rocher, P. 1993. Les Volcans et la Revolution Francaise.L’Association
Volcanologique Européene, Paris.

66
Roberts, T. J., Braban, C. F., Martin, R. S., Oppenheimer, C., Adams, J. W., Cox, R. A., Jones, R. L.,
Griffiths, P. T. 2009. Modelling reactive halogen formation and ozone depletion in volcanic
plumes. Chem. Geol., 263, 151‐163.
Roberts, T. J., Braban, C. F., Oppenheimer, C., Freshwater, R., Martin, R..S, Dawson, D. H., Griffiths,
P. T., Cox, R. A., Safell, J. R., Jones, R. L. 2012. Electrochemical sensing of volcanic gases. Chem
Geol (332‐333), 74‐91.
Robock, A. 2000. Volcanic Eruptions and Climate, Rev. Geophys. 38, 191–220,
doi:10.1029/1998RG000054.
Robock, A. and Oppenheimer, C. (eds.). 2003.Volcanism and the Earth’s atmosphere, AGU
Geophysical monograph, 139, doi:10.1029/139GM03.
Rose, W. I., Chuan, R. L., Giggenbach, W. F., Kyle, P. R., Symonds, R. B. 1986. Rates of sulphur
dioxide and particle emissions from White Island volcano, New Zealand, and an estimate of the
total flux of major gseousspecies. Bull. Volcanol. 48, 181‐188.
RoTAP. 2012. Review of Transboundary Air Pollution: Acidification, Eutrophication, GroundLevel
Ozone and Heavy Metals in the UK. Summary for Policy Makers. Contract Report to the
Department for Environment, Food and Rural Affairs. Centre for Ecology & Hydrology.
Sadler, J.P., Grattan, J. P. 1999. Volcanoes as agents of past environmental change, Glob. Planet.
Change, 21, 181–196.
Sæmundsson, K. Outline of the geology of Iceland. Jökull, 29, 7‐28.
Schmidt, A., Carslaw, K. S., Mann, G. W., Wilson, M., Breider, T. J., Pickering, S. J., and Thordarson,
T. 2010. The impact of the 1783?1784 AD Laki eruption on global aerosol formation processes
and cloud condensation nuclei, Atmos. Chem. Phys., 10, 6025‐6041, doi:10.5194/acp‐10‐6025‐
2010.
Schmidt, A., Ostro, B., Carslaw, K.S., Wilson, M., Thordarson, T., Mann, G.W., Simmons, A.J. 2011.
Excess mortality in Europe following a future Laki‐style Icelandic eruption. Proc. Natl. Acad. Sci.
U. S. A., 108 (38), 15710‐15715.
Schwartz, J. 2001. Air pollution and blood markers of cardiovascular risk. Environ. Health Perspect.,
109, 405‐409.
Seinfeld, J. H. 1986. Atmospheric Chemistry and Physics of Air Pollution. John Wiley & Sons, 738pp.
Self, S., Thordarson, T., Keszthelyi, L. P., Walker, G. P. L., Hon, K., Murphy, M. T., Long, P.,
Finnemore, S. 1996. A new model for the emplacement of the Columbia River Basalt as large
inflated pahoehoe lava flow fields. Geophys. Res. Lett., 23, 2689‐2692.
Self, S., Thordarson, T., Keszthelyi, L. P. 1997. Emplacement of continental flood basalt lava flows.
In: J.J. Mahoney and M.F. Coffin (eds), Large Igneous Provinces: Continental, Oceanic and
Planetary Flood Volcanism. AGU Geophys Monogr. AGU, Washington D. C. 381‐410.

67
Self, S., Gertisser, R., Thordarson, T., Rampino, M. R., Wolff, J. A. 2004. Magma volume, volatile
emissions, and stratospheric aerosols from the 1815 eruption of Tambora – revisited. Geophys.
Res. Lett., 31, L20608, doi:10.1029/2004GL020925.
Self, S., Thordarson, T., Widdowson, M. 2005. Gas fluxes from flood basalt eruptions. Elements 1:
283‐287.
Self, S., Widdowson, M., Thordarson, T., Jay, Anne.E. 2006.Volatile fluxes during flood basalt
eruptions and potential effects on the global environment: A Deccan perspective Earth and
Planetary Science Letters, 248 (1‐2), 517‐531. doi: 10.1016/j.epsl.2006.05.041.
Smith, W. H. 1990. Air Pollution and Forests: Interaction Between Air Contaminants and Forest
Ecosystems. Springer‐Verlag, New York, 618pp.
Smith, S. J., van Aardenne, J., Klimont, Z., Andres, R. J., Volke, A., Delgado Arias,S. . 2011.
Anthropogenic sulphur dioxide emissions: 1850‐2005. Atmos. Chem. Phys. 11,1101‐1116.
Steingrimsson, J. 1998. Fires of the Earth: the Laki eruption 1783‐1784. University of Iceland Press,
Reykjavik.
Stevenson, D.S., Johnson, C.E., Collins, W.J., Derwent, R.G. 2003a. The tropospheric sulphur cycle
and the role of volcanic SO2. Geological Society of London Spec. Publ., 213, 295‐305.
Stevenson, D.S., Johnson, C.E., Highwood, E.J., Gauci, V., Colins, W.J., Derwent, R.G. 2003b.
Atmospheric impact of the 1783–1784 Laki eruption: Part I. Chemistry modelling. Atmos.
Chem. Phys., 3, 551–596.
Stevenson, J. A., Loughlin, S. C., Rae, C., Thordarson, T., Milodowski,A., Gilbert, J. S.,
Harangi, S., Lukács, R., Højgaard, B., Árting, U. Pyne‐O’Donnell, S., MacLeod, S.,
Whitney, B., and Cassidy, M. 2012 Distal deposition of tephra from the Eyjafjallajökull 2010 summit eruption, J. Geophys. Res., 117, B00C10, doi:10.1029/2011JB008904.
Stoiber, R.E., Williams, S.E., Huebert, B. 1987. Annual contribution of sulphur dioxide to the
atmosphere by volcanoes. J. Volc. Geotherm. Res., 33, 1‐8.
Stothers, R.B. 1996. The great dry fog of 1783. Clim. Chang., 32, 79‐89.
Stothers, R.B. 1999. Volcanic dry fogs, climate cooling and plague pandemics in Europe and the
Middle East. Clim. Chang., 42, 713‐723.
Symonds, R., Rose, W. I., Bluth, G. J. S., and Gerlach, T. M. 1994. Volcanic‐gas studies: methods,
results and applications, in Volatiles in Magmas, edited by: Carroll, M. R. and Halloway, J.R.,
Rev. Mineralogy, 30, 1–66.
Tabazedeh, A. and Turco, R. P. 1993. Stratospheric chlorine injection by volcanic eruptions: HCl
scavenging and implications for ozone, Science, 260, 1082‐1086.
Thomason, L. W., and Osborne, M. T. 1992. Lidar conversions parameters derived from SAGE II
extinction measurements, Geophys. Res. Lett., 19,1655 – 1658.

68
Thorarinsson, S. 1969. The Lakagígar eruption of 1783, Bull. Volc., 33 (3), 910‐929.
Thordarson, T., 2003. 1783‐85 Laki‐Grímsvötn eruptions I: A critical look at contemporary
chronicles. Jökull, 51, 1‐10.
Thordarson, T. 2005. Environmental and climatic effects from atmospheric SO2 mass‐loading by
Icelandic flood lava eruptions. Iceland –In: Modern Process and Past Environments. C.
Caseldine, A. Russell, J. Hardadottir and O. Knudsen. Amsterdam, Elsevier. Quat. Sci. 5, 205‐
220.
Thordarson, T. 2009. Eruptions: Laki and Tambora. In Encyclopedia of Islands, 263‐271.
Thordarson, T. and Lintleman, S. 2001. Original essay by Professor S.P. van Swinden on
‘Observations on the cloud (dry fog), which appeared in June 1783’, translated and prepared
for publication by T. Thordarson and S. Lintleman. Jökull, 50, 73‐80.
Thordarson, T. and Self, A. 1993. The Laki (Skaftár Fires) and Grímsvötn eruptions in 1783–1785.
Bull. Volcanol., 55, 233–263.
Thordarson, T. and Self S. 1996. Sulfur, chlorine and fluorine degassing and atmospheric loading by
the Roza eruption, Columbia River Basalt Group, Washington, USA. J. Volc. Geotherm. Res., 74,
49‐73.
Thordarson, T. and Self, S. 1998. The Roza Member, Columbia River Basalt Group ‐ a gigantic
pahoehoe lava flow field formed by endogenous processes. J. Geophys Res ‐ Solid Earth, 103,
27411‐ 27445.
Thordarson, T. and Self, S. 2001. Real‐time observations of the Laki sulfuric aerosol cloud in Europe
1783 as documented by Professor S. P. van Swinden at Franeker, Holland. Jökull, 50: 65‐72.
Thordarson, T. and Self, S. 2003. Atmospheric and environmental effects of the 1783‐1784 Laki
eruption: A review and reassessment.2003. J. Geophys. Res. D: Atm., 108 (1), pp. AAC 7‐1 AAC
7‐29.
Thordarson, T. and Larsen, G. 2007. Volcanism in Iceland in historical time: Volcano types, eruption
styles and eruptive history. J.Geodyn. 43, 118‐152.
Thordarson, T. and Höskuldsson, Á. 2008. Postglacial volcanism in Iceland. Jökull, 58, 197‐228.
Thordarson, T. and Sigmarsson, O. 2009. Effusive activity in the 1963‐67 Surtsey eruption, Iceland:
flow emplacement and growth of small lava shields In Thordarson et al (eds), Studies in
Volcanology: The Legacy of George Walker. Spec. Publ. IAVCEI No 3; 53‐84.
Thordarson,T., Self, S., Óskarsson, N., Hulsebosch, T. 1996. Sulphur, chlorine, and fluorine
degassing and atmospheric loading by the 1783–1784 AD Laki (Skaftár Fires) eruption in
Iceland. Bull. Volcanol., 58, 205–225.
Thordarson, T., Miller, D. J., Larsen, G., Self, S., Sigurdsson, H. 2001. New estimates of sulfure
degassing and atmospheric mass‐loading by the 934 AD Eldgjá eruption, Iceland. J. Volcanol.
Geotherm. Res. 108, 33‐54.
69
Thordarson, T.,Larsen, G., Steinthorsson, S., Self, S. 2003a. 1783‐85AD Laki‐Grímsvötn eruptions II:
Appraisal based on contemporary accounts. Jökull, 51, 11‐48.
Thordarson, T., Self, S., Miller, D.J., Larsen, G., Vilmundardóttir. 2003b. Sulphur release from flood
lava eruptions in the Veidivötn, Grímsvötn and Katla volcanic systems, Iceland. In:
Oppenheimer, C., Pyle, D.M. & Barclay, J. (eds) Volcanic Degassing. Geological Society, London,
Special Publications, 213, 103‐121.
Thordarson, T., Rampino, M., Keszthelyi, L., Self, S. 2009. Effects of megascale eruptions on Earth
and Mars, in Chapman, M.G., and Keszthelyi, L., eds., Preservation of random megascale
events on Mars and Earth: Influence on geologic history: Geol. Soc. Am. Spec. Paper 453, 37–
53, doi:10.1130/2009.453(04).
Timmreck, C., Graf, H‐F., Lorenz, S. J., Niemeier, U., Zanchettin, D., Matei, D., Jungclaus, J. H.,
Crowley, T. J. 2010. Aerosol size confines climate response to volcanic super‐eruptions.
Geophys. Res. Lett., 37, L24705, doi:10.1029/2010GL045464.
Trigo, R.M., Vaquero, J.M., Stothers, R.B. 2010. Witnessing the impact of the 1783‐1784 Laki
eruption in the Southern Hemisphere. Clim. Chang., 99,535‐546.
Twomey, S. The influence of Pollution on Shortwave Albedo of Clouds. 1977. J. Atmos. Sci. 34 (7):
1149–52.
von Glasow, R. 2010. Atmospheric chemistry in volcanic plumes. Proc. Natl. Acad. Sc., 107, 6594 –
6599.
von Glasow, R., Sander, R., Bott, A., and Crutzen, P. 2002. Modeling halogen chemistry in the
marine boundary layer. 1. Cloud‐free MBL, J. Geophys. Res., 107, 4,
doi:10.1029/2001JD000942.
von Glasow, R., Bobrowski, N., Kern, C. 2009. The effects of volcanic eruptions on atmospheric
chemistry. Chem. Geol., 263, 131‐142.
Wallace, P.J. 2001. Volcanic SO2 emissions and the abundance and distribution of exsolved gas in
magma bodies, J. Volcanol. Geotherm. Res., 108 (1‐4), pp. 85‐106. doi: 10.1016/S0377‐
0273(00)00279‐1.
Watson, I.M., Realmuto, V.J., Rose, W.I., Prata, A.J., Bluth, G.J.S., Gu, Y., Bader, C.E., Yu, T. 2004.
Thermal infrared remote sensing of volcanic emissions using the moderate resolution imaging
spectroradiometer. J. Volcanol. Geotherm. Res., 135: 75‐89.
Wei, L., Mosley‐Thompson, E., Gabrielli, P., Thompson, L.G. Barbante, C. 2008. Synchronous
deposition of volcanic ash and sulfate aerosols over Greenland in 1783 from the Laki eruption
(Iceland). Geophys. Res. Lett., 35, L16501.White, G. 1789. The Natural History and Antiquities
of Selborne, B.White, London.
Witham, C.S. and Oppenheimer, C. 2004. Mortality in England during the 1783–4 Laki Craters
eruption, Bull. Volcanol., 67: 15–26.

70
Witham, C. S., Oppenheimer, C., and Horwell, C. J. 2005. Volcanic ash‐leachates: a review and
recommendations for sampling methods. J. Volcanol. Geotherm. Res., 141, 299‐326.
Woodhouse, M. J., Hogg, A. J., Phillips, J. C. C. and Sparks, R. S. J. 2012. Interaction between
volcanic plumes and wind during the 2010 Eyjafjallajokull eruption, Iceland. J. Geophys. Res.
doi:10.1029/2012JB009592
Woods, A.W. 1993. A model of the plumes above basaltic fissure eruptions. Geophys. Res. Lett.,
20: 1115–1118.
Wright, T. E., Burton, M., Pyle, D. M., Caltabiano, T. 2008. Scanning tomography of SO2 distribution
in a volcanic gas plume. Geophys. Res. Lett., 35, L17811.
Wrigley, E. A. And Schofield, R. S. 1989. The population history of England 1541‐1871: A
reconstruction Cambridge University Press, Cambridge, UK, pp 794.
Yang, K., Krotkov, N. A., Krueger, A. J., Carn, S. A., Bhartia, P. K., Levelt, P. F. 2007. Retrieval of large
SO2 columns from the AURA Ozone Monitroing Instrument: Comparison and Limitations. J.
Geophys. Res., 112, D24S43.
71
APPENDIX A: Meeting and elicitation participants
List of Participants
Willy Aspinall Aspinall and Associates / University of Bristol
Peter Baxter University of Cambridge
Steve Blake Open University
Christine Braban Centre for Ecology and Hydrology (NERC)
Antonio Costa University of Reading
Pierre Delmelle Université Catholique de Louvain Anjan Ghosh Health Protection Agency14
Matthew Hort UK Met Office
Robie Kamanyire Health Protection Agency13
Ishani Kar‐Purkayastha Health Protection Agency13
Sue Loughlin British Geological Survey (NERC)
Tamsin Mather Oxford University
Virginia Murray Health Protection Agency
Clive Oppenheimer University of Cambridge
Anja Schmidt Leeds University
David Stevenson Edinburgh University
Thor Thordarson Edinburgh University
Roland von Glasow University of East Anglia
Charlotte Vye British Geological Survey (NERC)
Geoff Wadge University of Reading
Claire Witham UK Met Office
Twenty one people attended the Workshop. Of these, fifteen were present throughout and
fourteen took part in the elicitation and undertook the Classical Model calibration exercise and
hence could participate as weighted contributors in the structured elicitation of selected
questions (‘Target Items’). The purpose of the elicitation exercise was to obtain quantified
uncertainty distributions that could be ascribed to related inputs in any modelling intended to
estimate potential volcanic effects and impacts on UK.
The fourteen Experts are tabulated here as A to N, but appear in various combinations and with
varying numbered guises in Appendix C summarising the elicitation results. Two Experts (J and K)
provided responses to all twenty‐eight Target Items, and all Experts answered at least 18
questions. Ten Target Items were evaluated by all fourteen Experts, while the least subscribed
Item (concerning the expected average rate of magma discharge in an explosive phase)
surprisingly had just five legible, complete and valid appraisals.
14 From 1st April 2013, HPA became part of Public Health England.

72
ItemExpert
A B C D E F G H I J K L M N No.by item
Q8 1 1 1 1 1 1 1 1 1 1 1 1 1 1 14 Q9_1 1 1 1 1 1 1 1 1 1 1 1 11 Q9_2 1 1 1 1 1 1 1 1 1 1 1 11 Q10_1 1 1 1 1 1 1 1 1 1 1 1 1 1 1 14 Q10_2 1 1 1 1 1 1 1 1 1 1 1 1 12 Q10B_1 1 1 1 1 1 1 1 1 1 1 1 1 1 1 14 Q10B_2 1 1 1 1 1 1 1 1 1 1 1 1 1 1 14 Q11_1 1 1 1 1 1 1 1 1 1 1 1 11 Q11_2 1 1 1 1 1 1 1 1 1 1 1 11 Q12_1 1 1 1 1 1 1 1 7 Q12_2 1 1 1 1 1 5 Q15_1 1 1 1 1 1 1 1 1 1 1 1 1 1 1 14 Q15_2 1 1 1 1 1 1 1 1 1 1 1 1 1 1 14 Q16_1 1 1 1 1 1 1 1 1 1 1 1 1 1 1 14 Q16_2 1 1 1 1 1 1 1 1 1 1 1 1 1 13 Q16_3 1 1 1 1 1 1 1 1 1 1 1 1 1 1 14 Q17 1 1 1 1 1 1 1 1 1 1 1 1 1 1 14 Q18 1 1 1 1 1 1 1 1 1 1 1 1 1 1 14 Q19_1 1 1 1 1 1 1 1 1 1 1 10 Q19_3 1 1 1 1 1 1 1 1 8 Q24_1 1 1 1 1 1 1 1 1 1 1 1 11 Q24_2 1 1 1 1 1 1 1 1 1 1 1 11 Q42_1 1 1 1 1 1 1 1 1 1 1 1 11 Q42_2 1 1 1 1 1 1 1 1 1 1 1 11 Q43_1 1 1 1 1 1 1 1 1 8 Q43_2 1 1 1 1 1 1 1 1 8 Q45S 1 1 1 1 1 1 1 1 1 9 Q45F 1 1 1 1 1 1 1 1 1 9 No. by Expert 20 18 22 20 21 20 26 20 27 28 28 22 25 20
Table 11 Summary of elicitation participation , by Expert (A‐N) and by Item (questions answered).

73
APPENDIX B: Expert Judgment Elicitation – a briefing note
Prepared by Willy Aspinall15, 8 May 2012
1 Preamble This note is based on the author’s experiences of facilitating expert judgment elicitations in several
topic areas in science, engineering and medicine. Conduct of those elicitations has been strongly
influenced by the guidance given in Cooke and Goossens (1999) and Cooke and Goossens (2000) –
see Appendix for a reprint of the latter paper.
2 Essentials
Expert opinion is almost invariably sought when scientific uncertainty impacts on an important
decision process. Because such uncertainty is ubiquitous in scientific knowledge – if it were not, a
decision would be obvious – there is the inescapable corollary that the experts themselves cannot be
absolutely certain, and thus total agreement with one another is unattainable. This is especially true
where such uncertainty is substantial, or where the consequences of the decision are particularly
serious or onerous.
In circumstances where scientific uncertainty impinges on the determination of an issue, soliciting
expert advice is not new. Generally, however, this has been pursued on an informal basis, and an
unstructured approach is rarely, if ever, found entirely satisfying to all parties. Neither is it likely to
be immune to legitimate criticism, from one side or another. To counteract these shortcomings, a
structured expert judgment elicitation refers to the deliberate effort to tie the whole process to
transparent methodological rules, with the goal of treating expert judgments as scientific data in a
formal decision process.
Various methods for assessing and combining expert uncertainty are described in the literature.
Until recently, the most familiar approach has been one that advocates a group decision‐
conferencing framework for eliciting opinions, but other approaches now exist for carrying out this
process more objectively. Prominent amongst the latter is the expert weighting procedure known as
the Classical Model, formulated by Cooke (1991), which can be implemented with the computer
package EXCALIBUR to analyse opinions obtained through a structured elicitation procedure. The
unique feature of this particular approach is that it is the only one in which distinct and different
weights are given to individual experts, based statistically on their ability to judge uncertainties. This
skill is measured empirically by performance metrics derived from control questions. The theoretical
basis and principles of the Classical Model are expounded in Cooke (1991), and a recent summary of
case histories using the procedure is given in Cooke and Goossens (2008).
15 Aspinall & Associates / School of Earth Sciences, University of Bristol [[email protected]]

74
2.1 The elicitation procedure
The main top‐level steps in the procedure for applying the EXCALIBUR procedure in practice, most of
which are common with other elicitation approaches, can be summarized as follows (but see
Appendix for more detailed discussion by Cooke & Goossens, 2000):
A group of experts are selected, usually by the ‘problem‐owner’; the latter sometimes takes additional external advice as to individual expert’s qualifications, experience and suitability to act as a panel expert in the context of the problem.
The selected experts will be elicited individually, strictly within their domain of expertise, regarding the uncertainty they would ascribe over the results of questions which, in theory, could be determined by possible measurements or observations that are not feasible for practical, time‐constraint or ethical reasons.
In the procedure, the selected experts also assess other variables within their field, the true values of which are known or become known post hoc – these are termed ‘seed items’.
The experts’ opinion are treated as statistical hypotheses and are scored with regard to statistical likelihood (often called ‘calibration’) and informativeness.
These scores are combined to form weights. These weights are constructed to be ‘strictly proper scoring rules’ in an appropriate asymptotic sense: experts receive their maximal expected long‐run weight by, and only by, stating their true degrees of belief. With these weights, statistical accuracy strongly dominates informativeness – one cannot compensate poor statistical performance by very high information.
Likelihood and informativeness scores are used to derive performance‐ based weighted combinations of the experts’ uncertainty distributions.
The key feature of this method is the performance‐based combination of expert uncertainty
distributions. When it comes to attempting to resolve differences in expert judgments, people who
seek to find a harmony of views by conciliation can be disconcerted by this approach, but extensive
experience overwhelmingly confirms that experts grow to favour it because its performance‐based
measure is entirely objective and amenable to diagnostic examination.
This encourages experts wary of getting involved in policy advice to participate in important decision
issues: the structured, neutral procedure and the collective, de‐personalized nature of the result
reassure experts. Key to achieving this is the facilitator, who needs to be impartial and able to deal
with differences of opinion with tact, to prevent individual experts from hijacking the debate, and to
avoid other pitfalls, such as asking misconstrued or leading questions, or prompting the experts. At
the same time, the facilitator needs the knack of keeping all participants fully engaged and focused
throughout the elicitation in order to achieve a balanced and justifiable outcome.
The facilitator also needs to be aware of certain practical expedients. For instance, asking people to
provide their responses into a computerized form, such as Excel, makes life much easier for the
facilitator when processing the responses, but experience shows that this actually discourages
experts from reflecting on, or re‐considering, whatever values they enter: with a computer form,

75
people tend just to enter a number and move on. Thus, a paper questionnaire and a pencil and
eraser are valuable tools to provide to participants so that they can more easily update their entries
as they progress the elicitation.
2.2 Combining expert assessments
A combination of expert assessments is often referred to as a “decision maker” (DM), in the sense of
linear pooling. With a set of several seed items (usually about ten in number), a group of experts
can be ranked according to the product of their individual calibration and information scores. With
these latter weights to hand, it is then possible to elicit from the same group of experts their
quantile‐based distributions for items of interest to the problem‐owner (i.e. for questions for which
an expert consensus is sought), and these individual response distributions can be linearly pooled,
applying the individual weights. It should be noted that a weighted combination distribution,
obtained in this way, is seldom if ever identical to the distribution of any one contributing expert,
but does represent a rational consensus of the information provided by members of the group as a
whole, differentiated by their performance on the seed items.
In this context, "good expertise" corresponds to good calibration (high statistical likelihood the
expert’s distributions reflect true values) and superior information. Strong weights reward good
expertise, and pass these virtues on to the decision maker. The reward aspect of weights is very
important. An expert's influence on the outcome from the group should not appear haphazard, and
he/she should be discouraged from attempting to game the system by trying to tilt assessments to
achieve a desired outcome. Thus it is necessary to impose a strictly proper scoring rule constraint on
the weighting scheme. This means that an expert achieves his maximal expected weight by, and only
by, stating assessments in conformity with his/her true beliefs.
3 Remarks
In the Classical Model, calibration and information are combined to yield an overall or combined
score (“performance‐based weight”) with the following attributes:
1. Individual expert assessments, realizations and scores can be recorded. This enables any reviewer to check the application of the method, in compliance with the principle of accountability / scrutability.
2. Performance is measured and hopefully validated, in compliance with the principle of empirical control. An expert's weight is determined by performance on seed items.
3. The score is a long run proper scoring rule for average probabilities, in compliance with the principle of neutrality.
4. Experts are treated equally, prior to the performance measurement, in compliance with the principle of fairness.
Whilst expert names and qualifications should be part of the documentation of every expert
judgment study, they are not usually associated directly with identifiable individual assessments in
the open literature. However, the experts’ reasonings should be recorded along with their quantile

76
estimates, and these arguments are usually collated from the group and reported in supporting
documentation as expert rationales.
There is no mathematical theorem which states that performance‐based weights will out‐perform
equal weights or out‐perform the best expert in any particular elicitation. Indeed, it is not difficult to
construct artificial examples where this is not the case. Selecting which of weighting scheme to use is
a matter of experience but, in practice, performance‐based weights are found to be systematically
better, statistically and in information terms, over the long run. Good performance on a one‐off
basis for a single individual data set is not convincing – what is convincing is good performance on a
large diverse data set, such as the TU Delft expert judgment database (Cooke and Goossens, 2008).
In practice a method should be easy to apply, easy to explain, should do better than equal weighting,
and should never do something ridiculous. Given the body of experience with structured expert
judgment that has now accumulated, the performance‐based Classical Model approach is well
established: simply using traditional equal weights (“one man, one vote”) for scientific uncertainty
quantification no longer seems to be a convincing alternative.
Upon reflection, it should be evident that equal weighting has one very serious drawback. As the
number of experts increases, the equal weight combination typically becomes increasingly diffuse,
until it represents no one’s belief and is useless for decision support (e.g. the PEGASOS Project for
seismic hazard in Switzerland). This syndrome is frequently seen when the number of experts
exceeds, say, ten. The viability of equal weighting is sustained only by sharply restricting the number
of experts who will be treated equally, leaving others outside the process. It appeals to a
‘democratic consensus’ ideal – progress in science, however, is driven by rational consensus.
Ultimately, therefore, consensus is an equilibration of power: in science, more than any other
endeavour, it is not the power of the ballot but the power of argument that counts (Kurowicka and
Cooke, 2006), and this can be made manifest through the EXCALIBUR structured elicitation
procedure. When scientists disagree, any attempt to impose agreement, other than through a
rationalizing approach, will promote confusion between consensus and certainty. The goal should be
to quantify uncertainty, not to remove it from the decision process. The Classical Model approach is
most useful when there is no other sensible way to make risk‐based decisions – apart from resorting
to the precautionary principle, or, even less helpfully, evading an answer by simply agreeing to
disagree.
4. Bibliography
Cooke, R. M., 1991. Experts in Uncertainty ‐ Opinion and Subjective Probability in Science. Environmental
Ethics and Science Policy Series. Oxford University Press, ISBN 0195064658.
Cooke, R. M. and L. H. J. Goossens (1999). Procedures Guide for Structured Expert Judgment.
Luxembourg/Brussels, The Commission of European Communities Directorate‐general XI (Environment
and Nuclear Safety) Directorate D (DG 11 CCJH). Report EUR18820. 50pp.

77
Cooke, R. M. and L. H. J. Goossens (2000). Procedures Guide for Structured Expert Judgement in Accident
Consequence Modelling. Radiat Prot Dosimetry 90: 303‐309.
Cooke, R.M. and Goossens, L.L.H.J., 2008. TU Delft expert judgment data base. Reliability Engineering &
System Safety. In press, corrected proof. doi:10.1016/j.ress.2007.03.005.
Kurowicka, D. and Cooke, R., 2006. Uncertainty Analysis with High Dimensional Dependence Modelling.
Wiley, Series in Probability and Statistics, Chichester: 284pp

78
APPENDIX C: Elicitation Results
Elicited Target Items – range graphs and quantile solutions Notes: Expert identity numbering changes from one item to another. Some solution values are given to more precision than is justified, and should be rounded
appropriately.
8. What is the likelihood that in the next Laki‐like eruption there is an episode which releases 10
times more SO2 on the same timescale as the peak eruption episode during Laki? [express as
%age?]
Performance-based DM solution: 5% quantile: 0.23% median: 5.0% 95% quantile: 19.2% Equal weights DM solution: 5% quantile: 0.02% median: 2.8% 95% quantile: 32.2%
Comments: the two Decision Maker (DM) solutions appear reasonably consistent with one another – the Equal weights solution has wider uncertainty than the Performance-

79
based weights solution, as expected. Seemingly Expert 7 is not going to be surprised if the next Laki-like eruption entails a much greater amount of SO2 than the 1783 event
9_1 Given an eruption like Laki 1783‐4 (flood lava eruption), what maximum total lava volume
should be used for scenario modelling (in km3)?
Performance-based DM solution: 5% quantile: 8.2 km3 median: 24.1 km3 95% quantile: 56.7 km3 Equal weights DM solution: 5% quantile: 5.9 km3 median: 25.3 km3 95% quantile: 84.1 km3 Comments: the two DM solutions appear reasonably consistent with one another – the
Equal weights solution has wider uncertainty than the Performance-based weights solution, as expected. The credible intervals of Experts 2 and 9 are greater and displaced relative to the rest of the group, suggesting that they hold the view any scenario modelling should accommodate this possibility.

80
9_2 Given an eruption like Laki 1783‐4 (flood lava eruption), what expected (i.e. mean) total lava
volume should be used for scenario modelling (in km3)?
Performance-based DM solution: 5% quantile: 3.0 km3 median: 12.6 km3 95% quantile: 19.9 km3 Equal weights DM solution: 5% quantile: 1.2 km3 median: 12.1 km3 95% quantile: 26.3 km3
Comments: the two DM solutions appear consistent with one another – the Equal weights solution has wider uncertainty than the Performance-based weights solution, as expected. The low medians of the distributions of Experts 1and 6 may indicate a possible knowledge gap issue, or that scenario modelling should include this eventuality.

81
10_1 What is the likely maximum explosion column height above vent during individual eruptive
episodes (fissure opening)?
Performance-based DM solution: 5% quantile: 8.0km median: 12.6km 95% quantile: 19.0km Equal weights DM solution: 5% quantile: 5.2km median: 13.6km 95% quantile: 22.7km
Comments: the two solutions appear consistent with one another – the Equal weights solution has wider uncertainty than the Performance-based weights solution, as expected.
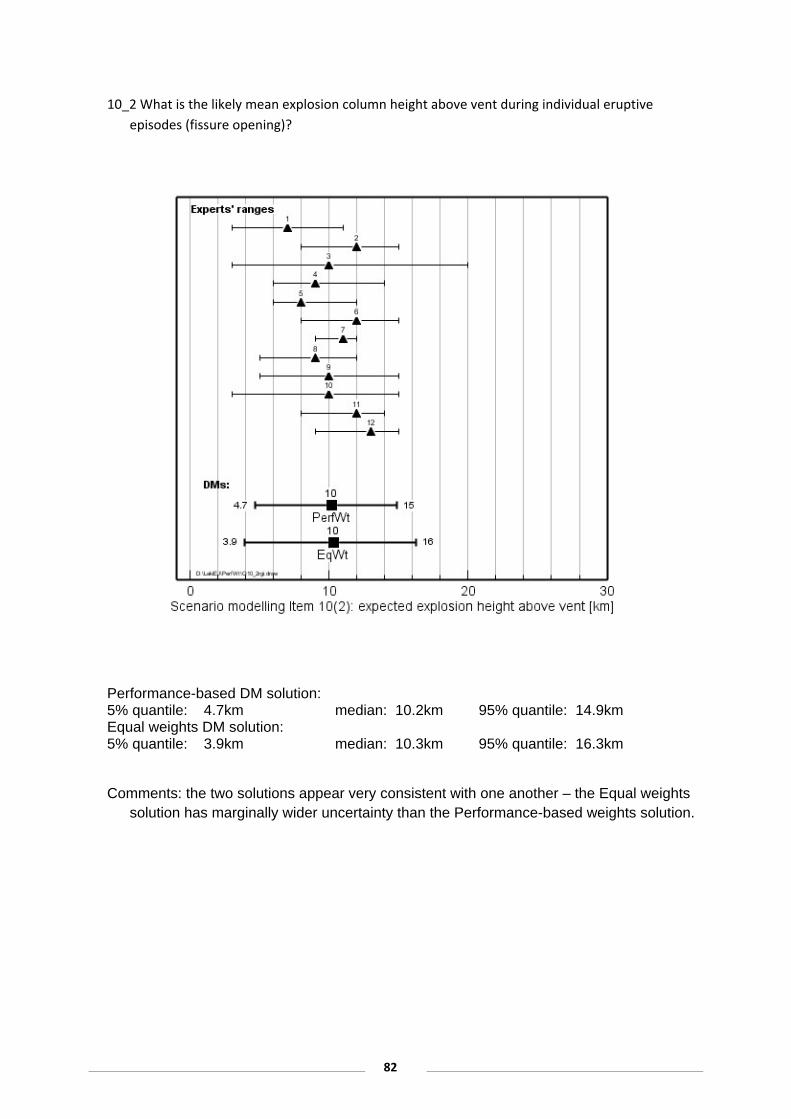
82
10_2 What is the likely mean explosion column height above vent during individual eruptive
episodes (fissure opening)?
Performance-based DM solution: 5% quantile: 4.7km median: 10.2km 95% quantile: 14.9km Equal weights DM solution: 5% quantile: 3.9km median: 10.3km 95% quantile: 16.3km
Comments: the two solutions appear very consistent with one another – the Equal weights solution has marginally wider uncertainty than the Performance-based weights solution.
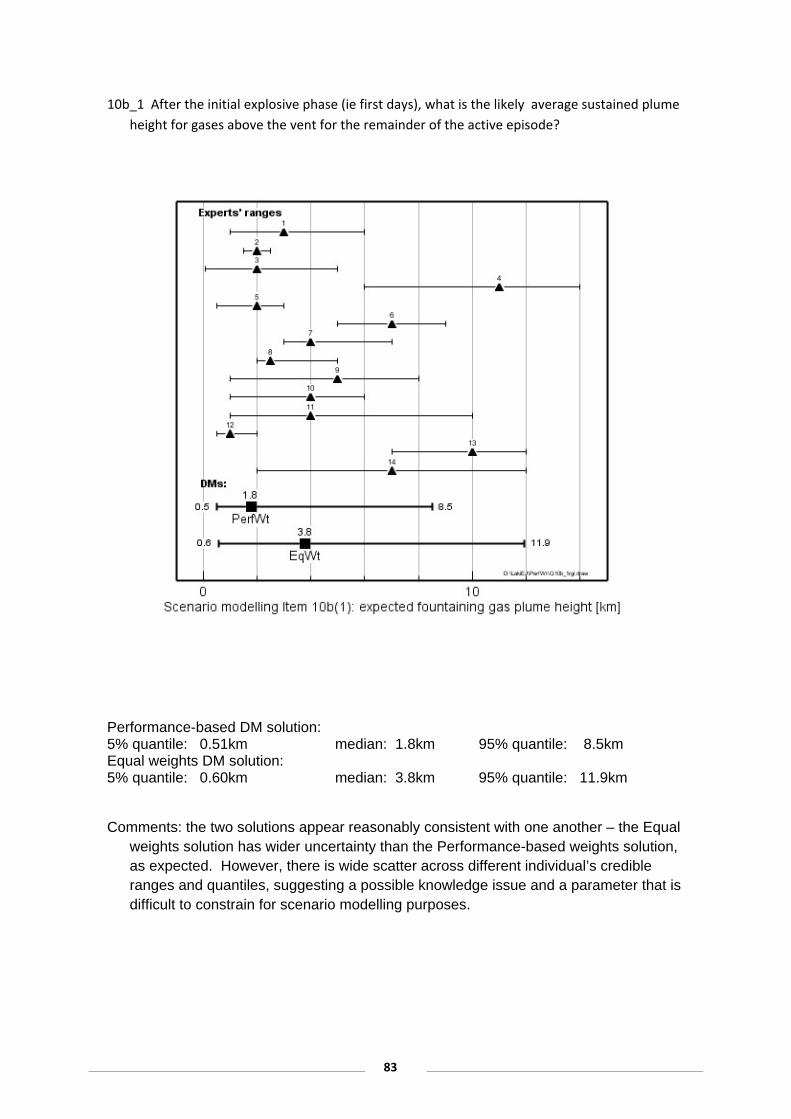
83
10b_1 After the initial explosive phase (ie first days), what is the likely average sustained plume
height for gases above the vent for the remainder of the active episode?
Performance-based DM solution: 5% quantile: 0.51km median: 1.8km 95% quantile: 8.5km Equal weights DM solution: 5% quantile: 0.60km median: 3.8km 95% quantile: 11.9km
Comments: the two solutions appear reasonably consistent with one another – the Equal weights solution has wider uncertainty than the Performance-based weights solution, as expected. However, there is wide scatter across different individual’s credible ranges and quantiles, suggesting a possible knowledge issue and a parameter that is difficult to constrain for scenario modelling purposes.

84
10b_2 After the initial explosive phase (ie first days), what is the likely maximum sustained plume
height for gases above the vent for the remainder of the active episode?
Performance-based DM solution: 5% quantile: 0.65km median: 3.4km 95% quantile: 12.2km Equal weights DM solution: 5% quantile: 0.53km median: 3.9km 95% quantile: 13.2km
Comments: the two solutions appear consistent with one another – the Equal weights solution has marginally wider uncertainty than the Performance-based weights solution. This said, both DM credible ranges are very wide, and both long-tailed to higher height values, reflecting mainly the views of Experts 1, 13 and 14. These results suggest further consideration needs to be given to the way this is parameterized for scenario modelling, as it is important in relation to the likelihood of large amounts of gas being transportable to UK.

85
11_1 What is the likely upper limit amount of SO2 released from the explosive vents per unit of
lava volume (Tg of SO2 per km3 of lava erupted)?
Performance-based DM solution: 5% quantile: 5.3 Tg median: 12.0 Tg 95% quantile: 19.9 Tg Equal weights DM solution: 5% quantile: 4.9 Tg median: 10.4 Tg 95% quantile: 36.5 Tg
Comments: the two solutions appear reasonably consistent with one another – the Equal weights solution has much wider uncertainty than the Performance-based weights solution, due to the opinion of Expert 1. Quantification of uncertainty on this factor may benefit from further discussion with Expert 1, to establish whether they have strong reasoning for their upper tail uncertainty.

86
11_2 What are the likely average amount of SO2 released from the explosive vents per unit of lava
volume (Tg of SO2 per km3 of lava erupted)?
Performance-based DM solution: 5% quantile: 3.4 Tg median: 8.2 Tg 95% quantile: 14.3 Tg Equal weights DM solution: 5% quantile: 2.4 Tg median: 7.1 Tg 95% quantile: 13.2 Tg
Comments: the two solutions appear very consistent with one another, although the Performance weights DM unusually exhibits the same uncertainty range as the Equal weights distribution, rather than less. Otherwise, differences are not meaningful.

87
12_1 What is the maximum rate of magma discharge in an explosive phase? (cubic metres /
second)
Performance-based DM solution: 5% quantile: 0.85 m3/s median: 7.9 m3/s 95% quantile: 43 m3/s Equal weights DM solution: 5% quantile: 1.2 m3/s median: 8.1 m3/s 95% quantile: 79 m3/s
Comments: note log scale for x-axis and only seven experts’ responses. The two DM solutions appear reasonably consistent with one another – the Equal weights solution has wider uncertainty than the Performance-based weights solution, as expected (partly masked by log scale plotting). Expert 3 provides a credible interval and median value implying a much higher maximum discharge rate than the rest of the group; ideally, this would be explored further for reasoning.

88
12_2 What is the expected average rate of magma discharge in an explosive phase? (cubic metres
/ second)
Performance-based DM solution: 5% quantile: 0.07 m3/s median: 3.1 m3/s 95% quantile: 9.8 m3/s Equal weights DM solution: 5% quantile: 0.13 m3/s median: 3.2 m3/s 95% quantile: 17.0 m3/s
Comments: note log scale plotting, and only five respondents. The solutions suggest that in any modelling large uncertainty should be associated with this parameter.

89
15_1 What is the likely upper limit for the percentage of total SO2 emissions that is released from
vents?
Performance-based DM solution: 5% quantile: 50.0% median: 76.8% 95% quantile: 96.8% Equal weights DM solution: 5% quantile: 53.0% median: 86.2% 95% quantile: 99.7%
Comments: there is significant uncertainty associated with ascribing an upper bound to this variable for modelling purposes, as evinced by the spreads on the two DM solutions, and the difference in medians. Some Experts (i.e. 2, 7, 8 and 9, with weaker support from 5 and 7) favour much higher values than the rest of their colleagues. There may be a knowledge topic to address here.

90
15_2 What is the likely lower limit for the percentage of total SO2 emissions that is released from
vents?
Performance-based DM solution: 5% quantile: 42.0% median: 69.1% 95% quantile: 84.1% Equal weights DM solution: 5% quantile: 25.1% median: 70.9% 95% quantile: 90.0%
Comments: the two solutions appear reasonably consistent with one another – the Equal weights solution has wider uncertainty than the Performance-based weights solution, mainly due to the influence of Expert 2. The latter, however, has a very wide credible range that has little net effect on the Performance-based weights DM solution.

91
16_1 What is the likely maximum number of fissure opening explosive phases during an eruption
on the scale of Laki?
Performance-based DM solution: 5% quantile: 6 median: 19 95% quantile: 99 Equal weights DM solution: 5% quantile: 4 median: 26 95% quantile: 472
Comments: note log scale. The two DM solutions appear consistent with one another – the Equal weights solution has wider uncertainty than the Performance-based weights solution, due mostly to the distribution of Expert 2. The credible ranges of Experts 2 and 13 are very incongruous, and could suggest an issue with the definition of “explosive phases” in the question.

92
16_2 What is the likely average number of fissure opening explosive phases during an eruption on
the scale of Laki?
Performance-based DM solution: 5% quantile: 3 median: 11 95% quantile: 34 Equal weights DM solution: 5% quantile: 3 median: 10 95% quantile: 39
Comments: the two DM solutions appear reasonably consistent with one another – the Equal weights solution has wider uncertainty than the Performance-based weights solution. Note log scale compresses appearance of individual uncertainty spreads.

93
16_3 What is the likely minimum number of fissure opening explosive phases during an eruption
on the scale of Laki?
Performance-based DM solution: 5% quantile: 1 median: 6 95% quantile: 12 Equal weights DM solution: 5% quantile: 0 median: 3 95% quantile: 14
Comments: the two DM solutions appear reasonably consistent with one another – the Equal weights solution has wider uncertainty than the Performance-based weights solution. Across the expert group there is a hint of a three-way split, in terms of the number of explosive phases to adopt for modelling purposes. Again, this may stem from issues with question definitions, and might benefit from further consideration.

94
17. What is the likely duration of the explosive phase of a fissure‐opening episode?
Performance-based DM solution: 5% quantile: 0.3 days median: 2.7 days 95% quantile: 18.0 days Equal weights DM solution: 5% quantile: 0.1 days median: 2.9 days 95% quantile: 15.8 days
Comments: this Item is unusual in that the performance-based weights DM solution has a slightly greater uncertainty spread than the Equal weights counterpart, due to the distribution provided by Expert 10. This excepted, the two DM solutions are very similar.

95
18. What is the typical gap between major gas outburst episodes?
Performance-based DM solution: 5% quantile: 0.5 days median: 5.2 days 95% quantile: 30 days Equal weights DM solution: 5% quantile: 0.1 days median: 7.2 days 95% quantile: 183 days
Comments: note log scale. There are very wide uncertainties expressed in relation to this factor. The performance weights DM solution suggests the typical (i.e. average) duration would be about 5 days, with a 90% confidence range spanning half-a-day to 30 days for the variety of durations. The Equal weights DM solution encompasses a much wider range, but with similar median value (7 days).

96
19_1 For phreatomagmatic activity, what is the likely % of total erupted volume?
Performance-based DM solution: 5% quantile: 0.02% median: 1.9% 95% quantile: 18.4% Equal weights DM solution: 5% quantile: 0.14% median: 5.0% 95% quantile: 20.0%
Comments: note log scale. The Performance-based DM solution is strongly influenced in this case by Expert 9 – in particular with regard to a long tail to low percentage values. This does not seem irrational if the possibility exists that, under certain circumstances, there may be little or no phreatomagmatic activity during the scenario eruption; other experts may not have considered this, or may have reasons for arguing it is extremely unlikely. Thus, there is a knowledge/judgement issue here.

97
19_3 For phreatomagmatic activity, what is likely maximum eruption column height?
Performance-based DM solution: 5% quantile: 2.6km median: 11.2km 95% quantile: 16.6km Equal weights DM solution: 5% quantile: 2.1km median: 9.3km 95% quantile: 17.6km
Comments: the two solutions appear reasonably consistent with one another – the Equal weights solution has fractionally wider uncertainty than the Performance-based weights solution, as is usual. The individual medians suggest a hint of a “two schools of thought” issue here for phreatomagmatic activity column height expectations.

98
24_1 What is the expected minimum ash volume produced w.r.t. the total erupted tephra volume
(answer in % of the total erupted tephra volume)?
Performance-based DM solution: 5% quantile: 0.02% median: 0.7% 95% quantile: 10.8% Equal weights DM solution: 5% quantile: 0.09% median: 6.7% 95% quantile: 19.7%
Comments: note log scale. This is clearly a very uncertain and debatable aspect for scenario modelling, and may benefit from discussion and clarification of controlling factors.

99
24_2 What are the expected maximum ash volume produced w.r.t. the total erupted tephra
volume (answer in % of the total erupted tephra volume)?
Performance-based DM solution: 5% quantile: 0.05% median: 0.9% 95% quantile: 43.0% Equal weights DM solution: 5% quantile: 0.3% median: 37.1% 95% quantile: 68.9%
Comments: note log scale. As with the minimum volume proportion of ash to tephra Item (24_1) above, this is clearly a very uncertain and debatable aspect for scenario modelling, and may benefit from clarification of controlling factors.

100
42_1 What is the typical e‐folding time of SO2 in the atmosphere (troposphere) in the winter
within a Laki‐like plume?
Performance-based DM solution: 5% quantile: 1.5 days median: 5.1 days 95% quantile: 25 days Equal weights DM solution: 5% quantile: 1.5 days median: 14 days 95% quantile: 74 days
Comments: note log scale. The two DM solutions differ somewhat from one another; the Equal weights solution has a higher median and much wider uncertainty than the Performance-based weights solution.

101
42_2 What is the typical e‐folding time of SO2 in the atmosphere (troposphere) in the summer
within a Laki‐like plume?
Performance-based DM solution: 5% quantile: 1.0 days median: 2.2 days 95% quantile: 17 days Equal weights DM solution: 5% quantile: 1.0 days median: 8.4 days 95% quantile: 38 days
Comments: : note log scale. Again, as with the previous Item, the two DM solutions differ from one another; the Equal weights solution has a higher median and wider uncertainty than the Performance-based weights solution

102
43_1 What is the e‐folding time of SO4 in the atmosphere (troposphere) in winter within a Laki‐
like plume?
Performance-based DM solution: 5% quantile: 2.0 days median: 7.2 days 95% quantile: 29 days Equal weights DM solution: 5% quantile: 0.6 days median: 8.4 days 95% quantile: 270 days
Comments: note log scale. Here, the two DM solutions differ from one another significantly in terms of uncertainty spreads, even though the medians are similar. Expert 4 may have grounds for believing SO4 is long-lived, and this apparent knowledge gap might be explored.
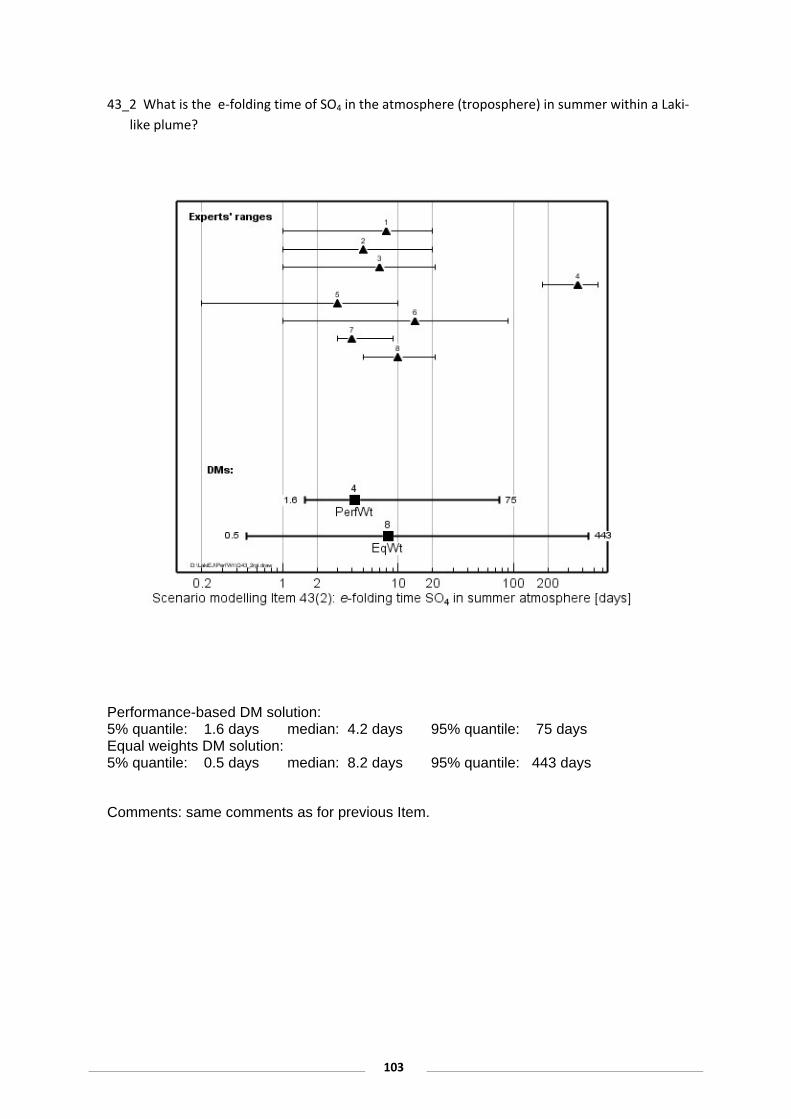
103
43_2 What is the e‐folding time of SO4 in the atmosphere (troposphere) in summer within a Laki‐
like plume?
Performance-based DM solution: 5% quantile: 1.6 days median: 4.2 days 95% quantile: 75 days Equal weights DM solution: 5% quantile: 0.5 days median: 8.2 days 95% quantile: 443 days
Comments: same comments as for previous Item.

104
45S By how much [expressed as %] does proximal adsorption on ash reduce the volcanic gas
concentrations of S in the plume?
Performance-based DM solution: 5% quantile: 1.1% median: 6.8% 95% quantile: 10.0% Equal weights DM solution: 5% quantile: 0.1% median: 6.4% 95% quantile: 38.2%
Comments: in this Item, two Experts (5, 9) with relatively low individual weights provide distributions which encompass a prospective situation in which there might be negligible adsorption of S onto ash in the initial conduit/plume phase; this suggests some clarification of the circumstances, and perhaps also the question definition, would be helpful.

105
45F By how much [expressed as %] does proximal adsorption on ash reduce the volcanic gas
concentrations of F in the plume?
Performance-based DM solution: 5% quantile: 3.0% median: 7.1% 95% quantile: 23.9% Equal weights DM solution: 5% quantile: 0.8% median: 10.0% 95% quantile: 45.6%
Comments: in this Item, Expert 5 offers a different judgement compared to his/her view on Item 45S above, whereas Expert 9 persists with a distribution which encompasses negligible adsorption of F onto ash in the initial conduit/plume phase (albeit with a much higher median value). Again, this suggests some clarification of the circumstances, and perhaps also the question definition, would be helpful.

106
APPENDIX D. Qualitative questions
These questions were posed during a qualitative session where participants discussed the questions
and completed a form with written answers. The feedback from this session is incorporated into the
report, especially Chapter 6 and the recommendations.
1. How can air concentrations of gas/aerosol a) at the source and b) in the far‐field be effectively monitored using research or other aircraft, sondes, lidars etc?
2. What is UK capability to monitor far‐field concentrations of SO2, SO4 and other species, with a sufficiently fast repeat sampling rate?
3. Is there always a relationship between erupted magma volume and gas emission for flood lavas or is excess sulphur possible (eg from degassed, unerupted shallow intrusions)?
4. What are the upper and lower standard errors on the SO2 estimates when using different methods for historic eruptions (eg petrological)?
5. What is the time variation by species in the rate of emission of gases throughout a fissure‐opening episode and through an entire flood lava sequence?
6. Which species [H2O, CO2, SO2, H2S, HBr, HI, Hg, HNO3, HCl, HF, NH3, H2, He, N2, Ar, others ….] can actually be monitored?
7. In terms of the numerical modelling of the far‐field impacts of a Laki‐type eruption, for (a) degassing and (b) ash production, what geometry in terms of shape/dimensions best represents the (i) fissure; (ii) lava flows; (iii) explosive vent (e.g., area source, line source, point source)?
8. What chemical reactions are most relevant in the near‐field plume/far‐field plume for modelling? Supplementary question ‘What species can be modelled effectively without considering the chemical reactions or by considering them in some greatly simplified way?
9. What mechanisms are important for vertical (up and down) transport and which removal processes dominate for individual species (SO2, SO4 aerosol, H2S, HCl, HF, NH3, etc,)? Alternative wording: What model processes, other than chemistry and deposition which are dealt with separately, are important?
10. Is it important to account for the physical and chemical interactions (e.g., adsorption) between volcanic gases and volcanic ash when using numerical models in order to correctly predict deposition/airborne concentrations in the UK during Laki‐type events?
11. What is the role of processes such as aggregation during explosive phases of Laki‐type events in comparison to say Eyjafjallajokull 2010?
12. Is it important to account for aerosol microphysical processes such as nucleation, coagulation and condensation when using numerical models in order to correctly predict volcanic sulphate aerosol concentrations/SO2 mixing ratios?

107
13. What is air pollution in the UK going to ‘look like’, will it be patchy temporally and spatially, or persistent and what would be the main control on this?
14. Is eruption season/time of day important for atmospheric dispersion/in‐plume and far‐field plume chemistry?
15. How many meteorological situations need to be considered to give a plausible range of model outcomes?
16. How do we validate models for species added to chemistry schemes? 17. What influence would the lava heat source have on local meteorology? 18. Can these local impacts be incorporated into the source term information? 19. For considering long‐range impacts, what temporal/spatial resolution of the source characteristics is required to accurately simulate concentrations of sulphur species/halogens in (i) the near‐field, and (ii) a far‐field plume? 20. For considering long‐range impacts, what temporal/spatial model resolution is required to accurately simulate SO2 and SO4 aerosol concentrations in the near‐field/far‐field plume? 21. What level of modelling is required and is it possible to answer some/certain questions with more ‘limited’ modelling? For example: performing non chemically reactive simulations is much faster and easier. These results would: inform regarding the probability of UK impact; allow some concentrations to be evaluated; etc. 22. While this is not perfect it may be adequate and stimulates the further question: Is it practicable to consider some of the chemical species without using chemical reactions?

108
APPENDIX E: Glossary
Acid rain Rain with a pH ranging from 2 to 4. Pure water in equilibrium with atmospheric CO2
has a pH of 5.6.
Aerosol Suspension of solid or liquid particles in the air ranging in size from a few
nanometres (nm) to around 100 micrometres (μm) in diameter.
Albedo The term ‘surface albedo’ refers to the reflectivity of the surface, ranging from 0
(perfectly absorbing) to 1 (perfectly reflecting), which is important in determining surface
temperature. The Earth’s planetary albedo is the fraction of the Sun’s incoming radiation that
reflects off the Earth and back into space.
Ash (volcanic) Fine fragments of volcanic rock smaller than 2mm in diameter produced
during explosive eruptions.
Basalt/Basaltic Volcanic rock or magma with relatively low total SiO2 content (45 – 52 wt%),
relatively low Na2O and K2O and relatively high FeO and MgO.
Central volcano A volcanic edifice constructed over time by the eruption of lava flows and
fragmental pyroclastic material. There may be considerable variation in the composition of
erupted magmas.
Cloud Condensation Nuclei (CCN) Hygroscopic aerosol particles onto which water vapour can
condense to form cloud drops.
Conduit A subsurface passage followed by magma in a volcanic system.
Continental flood basalt (CFB) provinces Large volumes of basalts of predominantly tholeiitic
(Tholeiite) composition forming extensive sheet flows with a few intervening sedimentary
deposits. CFBs are thought to have been erupted in geologically short periods of time at high
extrusion rates.
Degassing The process by which magma loses its dissolved volatile species and gases are
released to the atmosphere. A volcano can degas with no ongoing extrusion of magma (passive
degassing).
Dense Rock Equivalent (DRE) Erupted magmas vary substantially in terms of bubble content, so
erupted magma volumes are often calculated assuming no bubble content to enable
comparison. See Eruption size (volume).
Dry deposition The removal of particles or molecules by settling on or sticking to ground‐
level surfaces (e.g. soils, vegetation, water, vehicles, infrastructure).
Dyke A dyke is a sheet‐like body of magma that rises through an existing fracture or
creates a new crack as it rises to the surface.

109
Effusive eruption An eruption dominated by the outpouring of lava onto the ground is
sometimes referred to as an effusive eruption. Here we use the definition of Thordarson and
Larsen, 2007 (>95% of the erupted magma is lava). See also ‘explosive eruption’.
Eruption size (magnitude) A very good way to compare different types of eruption is to use the
formula Magnitude = log10 (erupted mass, kg) – 7 (Pyle, 2000).
Eruption size (volume) A widely accepted measure of the size of an eruption is the volume
of magma ejected as pumice and ash (tephra) during an explosive phase or the volume of lava
extruded during an effusive phase. Eruption volumes are commonly expressed in cubic
kilometers (km3). One km3 is roughly equivalent to 0.24 cubic miles. Estimates of the tephra
volumes are usually obtained by mapping the distribution and thickness of the tephra deposits
on the ground after the eruption is over. Tephra volumes measured in this way must then be
corrected for void spaces (bubbles within the pumice, empty spaces between individual chunks
of pumice or ash) to get an estimate of the original volume of lava erupted. This correction can
be made by comparing the bulk density of the tephra deposit with the known density of the
rock‐type that makes up the tephra. The result is referred to as the "dense rock equivalent" or
DRE of the erupted volume.
Explosive eruption Any eruption in which the magma is torn into fragments (fragmentation) by
gas pressure or interaction with water as it leaves the vent. A definition used in this report
assumes >95% of the erupted magma is tephra in order for the eruption to be described as
explosive.
Fire fountain/Lava fountain A jet of lava sprayed into the air by the rapid expansion of gas
bubbles and fragmentation of magma. Lava fountains typically range from about 10 to 100 m
in height, but occasionally reach more than 500 m.
Fissure A fissure is an elongate fracture or crack at the Earth’s surface from which an
eruption occurs. Multiple parallel eruption fissures produced by multiple eruptions or eruption
episodes form an elongate fissure swarm.
Fissure eruption An eruption from an elongate fissure rather than a central vent that
commonly comprises lava flows and fire fountains (small magnitude explosions). After a period
of hours or days activity tends to focus at a number of central vents along the fissure.
Flood lava/basalt Very large‐volume eruptions of basaltic lava flows linked to some extinction
events(see also continental flood basalt provinces).
Fragmentation Magma may be fragmented within the eruptive conduit and during eruption
by a rapidly expanding gas phase. At depth the gas is dissolved in the magma, during
decompression as the magma rises, the gas exsolves to form bubbles. If the magma is low
viscosity (e.g. basalts) and rising slowly, the gas may escape before eruption leading to only
minor fragmentation during eruption (e.g. fire fountains). However, if magma is viscous
(silicic), or rising quickly, the bubbles remain in‐situ and continue to expand and blast the
magma apart during eruption. If magma interacts with ground or surface water this also results
in explosions that effectively fragment the magma/lava.

110
Holocene Geological epoch which commenced ~ 11,700 years before present.
Hydromagmatic eruption An eruption involving the interaction of water and magma.
Lava Molten rock expelled at the Earth’s surface by volcanic processes.
Lava fountain/fire fountain A jet of lava sprayed into the air by the rapid expansion of
gas bubbles and fragmentation of magma. Lava fountains typically range from about 10 to 100
m in height, but occasionally reach more than 500 m.
Mafic rocks Contain high proportions of minerals rich in MgO, FeO, and CaO, i.e. olivine,
pyroxene, amphibole and biotite. Basalt is a mafic rock.
Magma Natural silicate melt with or without suspended crystals and bubbles.
Mortality rate A measure of the frequency of occurrence of death in a defined population
during a specified time interval (Centre for Disease Control and Prevention, 2011).
Orographic clouds Clouds that develop in response to the forced lifting of air by the earth's
topography causing cooling of air and condensation of water vapour.
Petrological studies (SO2 calculation) A method that uses the difference between the volatile
component in a pre‐eruptive melt (glassy melt inclusion) and in a post‐eruptive melt (matrix
glass) used to determine the amount of a volatile component released per kg of erupted
magma.
Phreatomagmatic Explosive volcanic activity resulting from e interaction between magma/lava
and groundwater, surface water or ice meltwater. The original definition referred only to the
interaction of magma and groundwater but it is now widely used for any explosive activity
caused by water‐magma/lava interaction.
Pyroclastic Pyroclastic rocks (consolidated) or deposits (unconsolidated) are fragmentary or
‘clastic’ and made entirely of volcanic material. The size of the fragments is important for
classification: ‘volcanic ash’ (<2mm), ‘lapilli’ (2‐64mm) and ‘volcanic bombs’ (>64mm) are the
specific terms for fragments of different sizes. See also ‘tephra’.
Rift zone A rift zone is an elongate system of crustal fractures associated with an area that has
undergone extension (ground has spread apart). A rift zone consists of many different features
associated with the rise and eruption of magma from narrow dykes, including eruptive fissures,
cinder and spatter cones, spatter ramparts, pit craters, lava flows, ground cracks, and normal
faults.
Scoria Pyroclasts containing bubbles which are typically several millimetres in diameter.
Spatter cones / rampart Lava fountains that erupt from an elongate fissure will build broad
embankments of spatter, called spatter ramparts, along both sides of the fissure.
Stratosphere The region of the atmosphere above the troposphere between 10–17 km and 50 km.

111
Strombolian eruption Eruption with a low‐viscosity basaltic magma featuring a
series (often rhythmical) of moderate explosions and/or fountaining of lava above a vent or
crater.
Subaerial Volcanism that occurs at the Earth’s surface with no water or ice present.
(Sub‐)Plinian activity A type of explosive eruption that typically generates sustained high
convective ash plumes.
Tephra When magma is erupted explosively it breaks up into fragments of various sizes, the
collective term for fragments that have fallen to the ground from the air and are
unconsolidated is tephra, regardless of the size of the fragments.
Troposphere The lowermost portion of the atmosphere from the Earth’s surface to the
tropopause. The troposphere is the portion of the atmosphere where most the clouds and
weather occurs.
Tropopause Boundary between the troposphere and stratosphere ranging from 9 km at high
latitudes to around 16 km in the tropics.
Volatile An element or compound such as H2O or CO2 that forms a gas at relatively low
pressure and magmatic temperatures. Volatiles can be dissolved in silicate melts and can occur
as bubbles of exsolved gas.
Volcano The definition of "volcano" has varied widely, with "volcano" applied to individual
vents, measured in meters, through volcanic edifices measured in tens of kilometers, to
volcanic fields measured in hundreds of kilometers. In Iceland, ‘volcanic system’ is commonly
used to describe both central volcanoes and their associated fissure swarms.
Volcanic activity Includes the transport of magma through the Earth’s crust and its expulsion
in the form of lava and/or pyroclasts at the surface of a planet.
Volcanism Processes linked to volcanic activity.
Vent Surface opening from which volcanogenic material is erupted.
Volcanic sulphate aerosol Small droplets of sulphuric acid (H2SO4) formed in the atmosphere
from oxidation of sulphur‐rich gases. A composition of 75wt% of H2SO4 and 25wt% of H2O is
commonly assumed for volcanic sulphate aerosol in the stratosphere. It is assumed that the
volcanic aerosol exists as H2SO4.2H2O which is equivalent to 73wt% of H2SO4 and 27wt% of
H2O.
Wet deposition Removal of aerosols, particles and gases present in the atmosphere through
precipitation such as rainfall.

112
APPENDIX F: Volcanic Gas and Ash UK Ground level Monitoring
Capability
1. Introduction
In the event of a volcanic eruption there are certain information prerequisites which should allow the UK to forecast the impact on the UK surface environment and to monitor the actual impact of the volcano plume as an eruption event proceeds, specifically to allow the risks to humans, agriculture, animals and ecosystems to be assessed in a timely fashion. One way the prerequisites categorised is the following: 1. The” initial” plume chemical composition (gas and particulate) 2. Physical plume transport to the UK 3. Chemical transformation processes in the volcano plume during plume transport and as it mixes with background air 4. the background composition of the UK air and surface constituents(including vegetation and surface waters) 5. Prepared plan for obtaining the relevant environmental information as the volcano plume (or its ash fallout) reach the UK ground level. This appendix outlines the current capabilities and some issues which need to be addressed for prerequisite 1, 4 and 5 to be sufficient to enable the UK to respond to a future volcanic eruption. For the purposes of this report, the plume is understood to consist of gases, refractory particulate (volcanic ash), and other non‐refractory aerosol (such as primary sulphuric acid aerosol, often referred to in the literature as sulphate aerosol).
2. Initial plume composition
The plume composition can potentially be measured at any point from when the plume enters the
atmosphere, i.e. at the vent of the volcano, through when the plume is at the height at which the
plume hast neutral buoyancy and begins to be entrained in the atmospheric circulation, anywhere
downwind, including grounding points in the UK. These measurements are not the primary focus of
this report.
The major potential constituents of a volcano plume, a range approximate near field concentrations
and relevant measurement techniques are summarised in Table 1. The capability to initialise models
by using direct measurements from the Icelandic volcanoes which were accurate would allow a
better understanding of the chemical evolution of the plume downwind.
3. Normal UK atmospheric composition and current environment
monitoring activities relevant to volcano plume constituents.
3.1 Atmosphere
The major potential constituents of a volcano plume, a range approximate far field (i.e. UK surface)
concentrations and relevant measurement techniques are summarised in Table 2. There is a
considerable uncertainty as to which chemical species may reach the UK at sufficient concentrations

113
to cause local effects. The three constituents which are most likely to have measureable levels and
impacts are SO2, ash particulate and sulphate particulate. It is also likely that HF whether in the gas
phase or adsorbed onto the ash is of primary concern given the potential health and environmental
impacts. Several species are likely to be present and of concern but the understanding of these are
less certain, these include HCl, HBr, H2S and Hg.
In the UK Defra, the Devolved Administration and various UK Governmental Agencies fund air quality
monitoring activities. This report does not attempt to summarise all of these activities, but notes the
major UK wide monitoring networks whose data would be of use in the event of a volcano plume
affecting the UK surface environment. These can be separated into two types of monitoring site –
those with high resolution (hourly or daily information) and more time average information (weekly
– monthly measurements).
3.1.1 High time resolution measurement: UK capabilities
The AURN is the UK's largest automatic monitoring network and is the main network used for
compliance reporting against the Ambient Air Quality Directives. The AURN sites provide hourly
concentration information which is available in real time. The AURN monitoring stations measure
oxides of nitrogen (NOx), sulphur dioxide (SO2), ozone (O3), carbon monoxide (CO) and particles
(PM10, PM2.5). The AURN site classifications and number of sites are summarised in Table 12. Further
information on the AURN can be obtained from http://uk‐air.Defra.gov.uk/networks/network‐
info?view=aurn and Bureau Veritas who operate the network.
In the event of a volcano plume grounding in the UK the SO2 signal would be the clearest observable
atmospheric chemical change, particularly if the increase was not accompanied by a significant
increase in NOx concentrations (which may indicate a polluted air mass rather than a volcanic signal).
One may expect in addition that PM levels would increase however the relative change to
background may be highly dependent on the type of monitoring site, for example the urban traffic
sites would be the most difficult sites at which to interpret an increase in PM. There is also a small
network of particle focussed measurements in the Particle Numbers and Concentrations Network
Table 12: AURN sites
Site Classification Number of sites
Rural Background 13
Rural Background Agricultural 3
Rural Background Natural 7
Suburban Background 8
Urban Background 57
Urban Background Residential & Industrial 1
Urban Industrial 6
Urban traffic 36

114
The UK contributes to the European Monitoring and Evaluation Programme, which is a programme
under the Convention on Long‐range Transboundary Air Pollution for international co‐operation to
solve transboundary air pollution problems. The UK has two Level II EMEP sites, located at
Auchencorth Moss (SE Scotland) and Harwell (Central England) which are funded via the Defra
UKEAP project (http://pollutantdeposition.Defra.gov.uk/ukeap) and make a large suite of
measurements, including being part of the AURN networks.
Table 13: Relevant high frequency measurements made at UK EMEP Supersites
Measurement Method Frequency
Water‐soluble gases and particles at PM2.5 and PM10 IC Hourly
Mercury (elemental) in air CVAF hourly
Mercury (speciated) in air (Auchencorth only) CVAF hourly
Ions in precipitation Including fluoride Daily wet‐only collector: I.C., pH, conductance
Daily
Particle size distribution (Auchencorth and Harwell)
http://uk‐air.defra.gov.uk/networks/network‐info?view=particle
SMPS hourly
3.1.2 Low time resolution measurement: UK capabilities
The major UK monitoring networks which make measurements relevant to volcano plume
constituents are listed in Table 14. In particular UKEAP monitors the fortnightly inorganic ion
composition of rain (though not fluoride) and the monthly average concentrations of HCl, SO2 and
particulate sulphate and chloride. The ECN network (http://www.ecn.ac.uk/) has measured the
fluoride concentration in precipitation in addition to the standard ion suite since 2010.
Although weekly and fortnightly average measurements are not useful in an first phase response, in
the case of a longer term Laki type eruption, these measurements will be the core measurement
networks which would be sued to assess the national impact of concentrations and dry and wet
deposition of volcanic constituents, from which impacts on ecosystems and agricultural land could
be derived.
Table 14. Relevant high frequency measurements made in the UK
Network Measurement Frequency
UKEAP Ions in precipitation Fortnightly
Acid gases and aerosol composition
monthly
ECN Ions in precipitation including fluoride
weekly
Heavy Metals Hg in air weekly
Heavy metals in particulates monthly
Heavy metals in precipitation monthly

115
3.1.3 Mobile atmospheric measurement response capability
Though mobile atmospheric measurement capabilities are not deployed for routine monitoring,
there are capabilities both within the Environment Agency , NERC, and other government sectors
and the University to deploy mobile platforms.
3.1.4 Atmospheric Deposition
From all precipitation measurements it is possible to calculate a wet deposition value. With dry
particulate and gas phase chemicals a deposition velocity is required to calculate the rate of
deposition to a particular surface, and in particular the surface resistance varies significantly
between vegetation, rock, soil etc.
3.2 Fresh water, Vegetation and Soils
CEH (NERC) has an analytical facility which in addition to other chemical species has a validated
method to determine F‐ by ion chromatography in aqueous media
(http://www.ceh.ac.uk/products/analyticalcapabilities.html). This method is susceptible to
interferences from low molecular weight organic acids but it has an LOD of 15ug/L.
There are methods to determine fluoride in soil and plant material although these have not been
used for 20 years since analysis of samples from aluminium smelters. CEH has reference samples in
store and the method for F analysis was validated in 2010 as part of vegetation analysis during the
Eyjafjallajökull eruption.
Detection limit would be in the region of 1 ug/g‐ this is based on the lowest standard and taking a
sample mass of 10g air dried herbage sample.
Throughput is of the order of 25 samples / day – it is a relatively slow and labour intensive process.
Turnaround time based on giving this work top priority over other work is 5‐10 working days – assuming receipt of a dried and ground sample ready for processing.
3.2.1 Soil and Herbage samples
CEH have a range of vegetation samples archived from various long term field sites and monitoring programmes which cover different habitat types. These could be used as baseline for a re‐sampling programme however many protocols demand washing of the vegetation prior to analysis which would remove particulates and therefore their value here is unknown at present. There are a >3000 archived topsoil samples from Countryside Survey 2007 which could be analysed for total fluoride (http://www.ceh.ac.uk/collaboration/countrysidesurvey.html). There are ca. 300 current‐year shoot vegetation samples for heather and moss from the 2007 Countryside Survey archived which could be used as a baseline with open‐access squares used for re‐sampling.

116
Unfortunately vegetation samples are not routinely stored in ECN but soil samples are available and ECN staff are already sampling all grassland vegetation when present.
BGS holds a dataset of soil samples collected on a systematic grid across a large portion of
the country at a sample density of 1 per 2 km2 in rural areas and 1 per 500m in urban areas.
To date 27 urban areas have been sampled. Soil data are available from Yorkshire
southwards in England except for the very far south of England that will be surveyed in the
next 2 years; for the whole of Northern Ireland and for the Clyde Basin in Scotland. These
samples are not analysed for fluoride or sulphate but the sample archive is available for
reanalysis for these parameters.
For information about the BGS G‐BASE survey and data holdings see:
http://www.bgs.ac.uk/gbase/
National Soil Inventory datasets– these are held by the Soil Survey at Cranfield for England
and Wales and by the James Hutton Institute for Scotland. They have been collected at a
sample density of 1 per 25 km2 across both countries.
Scotland: http://www.hutton.ac.uk/about/facilities/national‐soils‐archive
England and Wales:
http://www.cranfield.ac.uk/sas/nsri/information/information_holdings.html
3.2.2 Freshwaters Intensive sampling is underway for a range of catchments to identify potential acidification episodes
in freshwaters. The Acid Waters Monitoring Network (http://awmn.defra.gov.uk/) is coordinated by
ENSIS/Environmental Change Research Centre at University College London. CEH have 20‐30 year
records for a number of lakes and rivers in acid sensitive areas plus intensive 7 hourly sampling in
some catchments (e.g. Plynlimon which illustrate the dynamism of the signal
http://www.ceh.ac.uk/sci_programmes/plynlimonchemistry.html) which should provide a good
baseline record.
BGS also has a validated method to determine F‐ by ion chromatography in aqueous media with a
LOD of 10 µg/L and has been analysing fluoride in stream water samples across the UK for the last 40
years as part of the Geochemical Baseline Survey of the Environment (G‐BASE) project, which is the
national geochemical survey of the UK. Sulphate concentrations have also been determined in the
waters for about the last 25 years. Stream water samples are collected from every 2 km of first and
second order stream length across the country. This is a systematic spatial survey that will complete
coverage of the whole country in two years time. To date, all but the far south of England has been
surveyed. The data provide a national baseline showing the variation in fluoride and sulphate
concentrations in surface waters across the country. The variation is controlled by factors such as
the underlying geology, climate, prevailing environmental conditions and pollution. Any assessment
of the impact of volcanic deposition from Iceland would have to take account of this pre‐existing
variability in concentration. G‐BASE is not a time‐series monitoring survey but samples sites could be
re‐sampled and analysed to assess the impact compared to the known baseline conditions.

117
4. Obtaining the relevant environmental information
Schematic of effects of a volcano plume on the UK ground level
A simple coordinated sampling and analysis strategy is needed after the information is received that
an Icelandic volcano plume is going to affect the UK. See Appendix H for the recommended IVHHN
ash and leachate analysis protocol.
Level 1 : Ash fall/sedimentation
Require:
1. Fluoride content of the ash (mg/kg)A,B
2. Mass of ash fall/m2 at key sitesB
3. Forecasting of ash fall across the UK.
4. Guidance on locations of maximum deposition.
5. Use land use maps as to where ash fall areas co‐locate with sensitive agricultural activities, in
particular the UK dairy herd and N. Scotland sheep.
6. Provide ashfall prediction maps to DA’s and Defra for agricultural response plan.
7. Information websites, such as APIS, widely publicised, for up to date information on acid
deposition and effects.
Notes
A. First measurements of fluoride content of ash would be likely to come from the Icelandic authorities with fresh ash. B. Pre‐identified UK atmospheric monitoring stations deploy ash collection equipment supplied by BGS, and courier to designated laboratories (e.g. CEH Lancaster who have UKAS accredited fluoride measurement, BGS labs for crystallographic/ identification capabilities etc).

118
4.1 Recommendations:
For the UK to be correctly prepared for a future volcanic eruption some further work would be
useful:
a. Method and network put in place and test for efficient enacting of (1) and (2).
Suggestion:
20 sites to be identified at which the AURN monitors SO2, PM and are co‐located or close to a
Precipitation monitoring site, allowed enhanced levels of sulphur to be observed and deposition
quantified . Currently the AURN is co‐located at 7 UKEAP Precip‐Net sites: Auchencorth Moss,
Eskdalemuir, Harwell, High Muffles, Lough Navar, Strathvaich Dam, Yarner Wood. Further work
would be needed to added further sites, with a distrubition which would allow a deposition map of
the UK to be produced from the measurements. It is suggested that one important site would be
Shetland, which is an AURN site, but not a Precip‐Net site.
Once sites are identified, an SOP should be developed and communicated to the LSOs for those sites
to allow them to be prepared. A practice exercise as suggested in (b) below should be carried out.
b. Methodology development and background mineral dust deposition rate characterisation.
Suggestion: Once sites for first response ash collection network are identified, sampling equipment
should be designed, prepared and tested in a trial for 3 ‐ 6 month, to check method and response
SOP. This exercise would also be useful to characterise background deposition of mineral particulate
at these sites for both mineralogy and leachate.
c. Development of EMEP4UK model (Defra and CEH funded model) to complement Met Office
modelling activites.
In the event of a Laki type eruption there will be significant pressures on the NAME model. It would
be prudent to have an established model used for UK deposition experiments to be available for
forecasting plume deposition. It is suggested that the EMEP4UK model would be appropriate for
this: EMEP4UK is a development of the EMEP UM to enable application at 5 km resolution over a
British Isles inner domain (nested within the main EMEP UM 50 km domain (Vieno et al., 2010;Vieno
et al., 2009). A small amount of work would allow this model to be used in forecast mode.
The EMEP Unified Model (www.emep.int/OpenSource/) is a grid‐based chemistry‐transport model
comprising a collection of model pre‐processors and post‐processors that work together to produce
a detailed representation of the physical and chemical state of the atmosphere at 50 km × 50 km
horizontal resolution over a region encompassing Europe, the north Atlantic, North Africa, the
Caucasus and parts of Russia (Simpson et al., 2012).
d. Ensure information resources for UK are in place:
i) Update fluoride sections of APIS to include volcano plume related literature.
ii) Ensure fact sheets are available to stakeholders including DAs, Defra vets, farm advisors etc.
Website directing should be clear.

119
e. Impact on the freshwaters of the UK for a Laki type eruption: Model assessment.
This exercise would need to identify the UK models available for (i) assessing the input of volcanic
acids into the UK waters over an 8 month period, (ii) identifying where the highest risks are (both to
human water supply, and to agricultural water supplies (iii) quantifying the response time for
information needs.
f. Plan for freshwater sampling
Measurement plan for Laki type eruption to focus water sampling on catchments and freshwater
systems where there is a good baseline record (e.g. Pymlimon). Again, identification of networks
where sampling is on‐going should be used, and SOP setup for LSOs. This is important so that
sampling is focussed and relevant, rather than an over sampling leading to redundant information.
g. Risk assessment of food security with respect to UK dairy herd and arable sector activites.
i. Method developed and disseminated for grass/crop sampling
ii. Laboratories identified for sampling and analysis. If Laki type eruption there would need to be
sufficient lab capacity identified.

120
APPENDIX G: Gas Guidelines
See http://www.ivhhn.org/images/pdf/gas_guidelines.pdf

121
APPENDIX H: IVHHN Ash analysis protocol

122
APPENDIX I: Some ongoing relevant research projects
1. FUTUREVOLC
An EU FP7 funded research consortium project to develop a ‘volcano supersite’ in Iceland. It
is led by Freysteinn Sigmundsson at the University of Iceland with the Icelandic
Meteorological Office. UK partners include the British Geological Survey, the Met Office,
Cambridge University and Bristol University.
The project objectives are:
PO1. Establish an innovative volcano monitoring system and strategy, integrating
multidisciplinary knowledge.
PO2. Develop new methods for near real‐time integration of multi‐parametric datasets and
the development of innovative instrumentation.
PO3. Apply a seamless transdisciplinary approach to further scientific understanding of
physical processes.
PO4. Improve delivery, quality and timeliness of information from monitoring scientists to
civil protection and governing authorities, locally and internationally.
www.futurevolc.hi.is
2. VANAHEIM
A NERC‐funded research consortium to characterise volcanic plumes in the near to far‐field.
It is led by Leeds University (NCAS) and includes many UK institutes and universities as well
as stakeholders. BGS and the Met Office are both partners.
The project aims to improve monitoring, modelling and ash/aerosol characterisation for
remote sensing both in Iceland and the UK. The main impact objectives are:
1. Work with the Icelandic Meteorological Office in building capacity for future volcanic
observations.
This will be achieved working with the Met Office under the 2010 4‐way MoU between IMO,
Met Office, NCAS and BGS.
2. Feed into the continued development of the UK Met Office's volcanic ash dispersion
forecasting and other international developments.
3. Tailor our research to address the Met Office requirements for development of
algorithms for operational data assimilation schemes.
http://www.ncas.ac.uk/index.php/en/vanaheim‐introduction

123
3. European Volcano Observatory Space Services (EVOSS)
An EU FP7 funded project that has developed an operational system that provides close to
real‐time volcanic ash, SO2, thermal and deformation products to volcano observatories and
Volcanic Ash Advisory Centres (e.g. the UK Met Office).
It is currently led by IPGP, France.
The operational system was developed in this research project but discussions are underway
on how to make this service sustainable and develop it further – it operates across Europe,
the Caribbean and Africa.
www.evoss.eu
Recommended


