liimm /£, 3H UCRL-52393
IO*-SELECTIVE ELECTRODES IN ORGANIC ELEMENTAL AND FUNCTIONAL GROUP ANALYSIS: A REVIEW
W. Selig
November 8, 1977
Work performed under the auspices of the U S Department of Energy by the UCLLL under contract number W-7405-ENG-48
LAWRENCE LIVERMORE LABORATORY University o! California Lcvermore
Distribution Category UC-4
US LAWRENCE LIVERMORE LABORATORY
UniversityolCaktomia/Livermore,Calilomia/94550
UCRL-52393
ION-SELECTIVE ELECTRODES IN ORGANIC ELEMENTAL AND FUNCTIONAL GROUP
ANALYSIS: A REVIEW
W. Selig
MS. date: November 8, 1977
- NOTICE-Thli report wii piepiied u in iccouni of work ipwiwred by the Untied Smet Government. Neither the United suit* HOI the United Stiiei Deputnwni of Energy, nor >ny of their rroploytci, nor iny of then conwiciori, lubcontncron. or their emptoywi. mjkn My *unnly. expieu or impllid. or .Burnt, jny leal lubllily or leipaniibilily for ill. i«u racy, complete ntu « uscfulnew of any infornalioii, «ppinj;ui, product or procw aiicloKd. 01 repreienu Ihil in u* would nol infringe primely owned rfghu.
DISTRIBUTION OF THIS DOCUMENT IS LlNLUL'TJSD
in
CONTENTS
Abstract 1 Introduction 1
References 2 Elemental Analysis 3
Anions 3 Fluorine 3 References 23 Sulfur 2 5
Determination as Sulfate " Determination as Sulfide " References 33 Halogens J* References 44 Phosphorus and Arsenic " References 48 Boron as Tetrafluoroborate -*0 References 50 Organic Anions 5 1
References °° Cations 6 1
Metals 6 1
References " 2
Nitrogen as Ammonium Ion "•* References 63 Organic Cations 6 * References 69
Surfactants and Detergents 7 1
78 fin Functional Group Analysis
Divalent Sulfur Functions Thiols
References Analysis
80 80
Disulfides 8 9
Thioureas 8 9
Thioacetamlde 91 iii
Mercaptopyrimidines 92 Xanthates 92 Carbon Disulfide 93 References 93
Epoxides 96 References 99
Hydroxyl groups 100 Hydroxyl in Polymers 100 Vicinal Glycols 100 Carbohydrates 101 Formaldehyde 102 Primary Amino Groups 102 Carboxylic Acids in the Presence of Acyl Chloride 102 Cyanamide 103 p-Urazine 104 References , 104 Physiologically Active Compounds . . 106
Chymotrypsin 106 Cyanogenic Glycosides 106 Cyanocobalamine 106 Choline Esters 107 Ephedrine and Methylephedrine . . . . 107 Saccharin • 108 Vitamins 108 Proteins 109
Miscellaneous 109 Colloid Titration 109 Miscellaneous Drugs 110 l-Fluoro-2,4-Dinitrobenzene Ill
References Ill Ion-Selective Electrodes as Detectors in Chromatography 112
Gas-Chrcmatography 112 Liquid-Chromatography 124
References 127 Acknowledgments 127
iv
ION-SELECTIVE ELECTRODES IN ORGANIC ELEMENTAL AND FUNCTIONAL GROUP
ANALYSIS: A REVIEW
ABSTRACT
The literature on the use of ion-selective electrodes in organic elemental and functional group analysis is surveyed in some detail. The survey is complete through Chemical Abstracts, Vol. 83 (1975).
INTRODUCTION
Since the development of the fluoride ion-selective electrode (ISE) in 1966, the number of papers dealing with the theory and applications of ISE's has increased every year at a nearly exponential rate. Most of the applications have been in the field of inorganic analysis. There have, however, been some applications of ISE's to organic elemental and functional group analysis. These applications have as yet not been incorporated into the newer texts dealing with organic analysis, but some may be found in the
2-0 reviews. In this review, methods using ISE's in organic elemental and functional group analysis are collected, while methods using enzyme electrodes are not included. Some suggestions for further applications are made that, in some instances, will be rather obvious to Lhe user.
The use of ISE's as detectors in gas chromatography is also described.
The techniques commonly used with ISE's may be classified as direct
potentiometric measurement, based on the Nernstian logarithmic relationship between electromotive force (emf) and activity, and potentiometric titration, which is usually more accurate and precise (but at the cost of increased time and difficulty).
A serious problem in both techniques is the slow establisf =nt of equilibrium potentials. In potentiometric titrations, especially, this is found near the endpoint of the titration. It is, therefore, advantageous to use an automatic titrator capable of delivering the titrant at a slow t.id constant rate. Also, to minimize possible errors, standardization of the titrant and determination
1
of the sample should be performed In nearly Identical fashions.
In direct emf measurement, establishing equilibrium emf is slow, especially at very low concentrations. One solution to this problem may be the use of the recently introduced time-response paper. According to Warner and Bressan, drifting emf's show a changing activity at the interface, which is most frequently due to the mixing of contaminants from various sources. According to these workers, dirty beakers and electrode surfaces are a subtle and very persistent cause of an apparent inability to reach low-level emf's. Given a clean beaker and clean electrodes, an electrode equilibrated at
10 M of sodium fluoride (-5 mV) and then inserted into distilled water containing 0.28 ppb of fluoride will register the following emf's at the given times with two water changes:
Time - min 2
20 45
Emf - mV +200 +237 +244 (= 1.7 ppb)
In this review, the literature is surveyed in some detail to present a critical choice to the potential user. Readers will also want to consult the recent study by Baiulescu and
12 Cosofret. This literature survey is complete through Chemical Abstracts
83, (1975). Addenda to this review will be issued biennially.
References
1. M. S. Frant and J. W. Ross, Jr., Science, 154, 1553 0966). 2. K. Camman, Naturaiss, 57, 298 (1970). 3. W. Simon, H. Wuhrmann, M. Vasak, L. A. R. Pioda, R. Dohner, and
Z. Stefanac, Angew. Chem., J52, 433 (1970). 4. E. C. Toren Jr., and R. P. Buck, Anal. Chem., 42, 284R (1970). 5. R. P. Buck, Anal. Chem., ^4 270R (1972). 6. R. P. Buck, Anal. Chem., 46, 28R (1974). 7. N. I sh ibashi , Kagaku Ho. Ryoiki, 29, 153 (1975); through Chem. Abstr.,
83, 187999m (1975).
8 . K. Toth and E. Pungor, Sung. Sci. Instrum., 25, 15 (1972); through Chem.
Abstr., _78, 143572J (1973).
9. J . Koryta, Analyt. Chim. Acta, 61 , 320 (1972).
10. Orion Research, Inc. Newsletter, 2» 8 (1971).
1 1 . T. B. Warner and D. J . Bressan, Analyt. Chim. Aata, j !3 , 165 (1973).
12. G. E. Baiulescu and V. V. Cosofret, Applications of Jon-Selective
Membrane Electrodes in Organic Analysis (Halsted Press , New York, 1977).
ELEMENTAL ANALYSIS
Anions
Fluorine
A thorough discussion of the analysis of fluorine in organic compounds is given in Ma's monograph. As
2 recently as 1965 MacDonald, in a review of organic microanalytical methods, was unable to recommend any particular method as distinctly preferable to others for fluorine and stated that "in the analysis for fluorine, faith in one's method seems to be as important as scientific rectitude." It is thus commonly accepted that fluorine is one of the most difficult elements to determine in organic compounds, particularly on the microscale. The thorium nitrate titration has been the most popular method of determining fluoride.
Papers dealing with this method still 3 continue to appear, but the method
has its limitations. The separation of interfering ions
(of particular interest in organic analysis are sulfate and phosphate) is usually accomplished by the
L Willard-Winter distillation in which fluoride is separated as fluosilicic acid. The distillation procedure, however, is rather time-consuming and often yields inaccurate results.
A second group of methods for eliminating interference in fluorine anal
ysis is ion-exchange. These methods, up to 1961, are summarized in Horton's ' monographs.
A third group may be termed "chemical methods." For the separation of sulfate, some of the methods are precipitation by benzidine, separation as silver sulfate,' and precipitation with cadmium and mercuric
9 nitrate. For the separation of phosphate, precipitation as silver phosphate ' or with cadmium and
9 mercuric nitrate, and adsorption by
12 either zinc carbonate or zinc 13 oxide have been suggested. Most of
these methods, however, require at least one filtration step and thus are time-consuming.
Horton has invited efforts toward the direct determination of fluoride without separation. We believe that, with the advent of the fluoride ISE, this goal is now in sight. The usefulness of this electrode in chemical analysis and in kinetic studies is evident from the number of papers citing it that have appeared since 1967.
More papers have appeared on the analysis of fluorine in organic compounds than for any other element. This applies also to the use of ISE's in the analysis of organic compounds. The first paper, by Light and
14 Mannion, appeared in 1969. The
electrodes required for this determination are a fluoride ion-selective indicator electrode (Orion 94-09 or equivalent) and a single-junction reference electrode (Orion 90-01, with Orion 90-00-01 filling solution, or equivalent).
Light and Mannion recommended combustion of the organic sample in an oxygen-flask made of polycarbonate (Nalgene No. 4103). It has previously been confirmed that results obtained with quartz flasks are more accurate
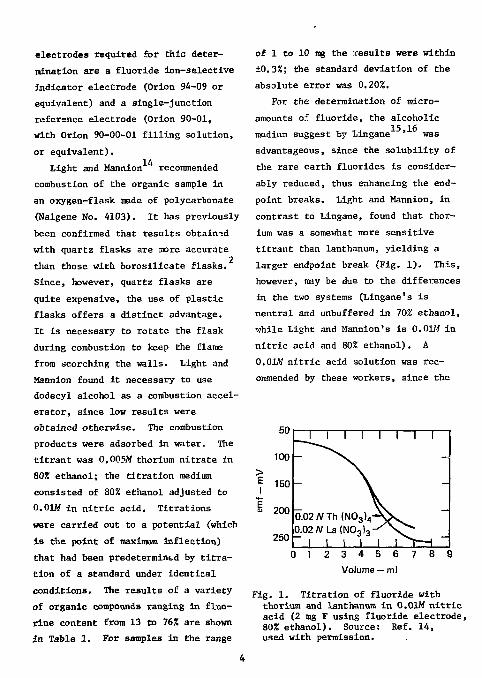
2 than those with borosilicate flasks. Since, however, quartz flasks are quite expensive, the use of plastic flasks offers a distinct advantage. It is necessary to rotate the flask during combustion to keep the flame from scorching the walls. Light and Mannion found it necessary to use dodecyl alcohol as a combustion accelerator, since low results were obtained otherwise. The combustion products were adsorbed in water. The titrant was 0.005M thorium nitrate in 80% ethanol; the titration medium consisted of 80% ethanol adjusted to 0.01M in nitric acid. Titrations were carried out to a potential (which Is the point of maximum Inflection) that had been predetermined by titration of a standard under identical conditions. The results of a variety of organic compounds ranging in fluorine content from 13 to 76% are shown In Table 1. For samples In the range
of 1 to 10 mg the results were within ±0.3%; the standard deviation of the absolute error was 0.20%.
For the determination of micro-amounts of fluoride, the alcoholic medium suggest by Lingane ' was advantageous, since the solubility of the rare earth fluorides is considerably reduced, thus enhancing the end-point breaks. Light and Mannion, in contrast to Lingane, found that thorium was a somewhat more sensitive titrant than lanthanum, yielding a larger endpoint break (Fig. 1). This, however, may be due to the differences in the two systems (Lingane's is neutral and unbuffered in 70% ethanol, while Light and Mannion's is 0.01M in nitric acid and 80% ethanol). A 0.01M nitric acid solution was recommended by these workers, since the
100
150 > I
i 200
250 0.02/VTh (N0 3) 4-0.02/VLa(N03)3-
I 0 1 2 3 4 5 6
Volume — ml
Fig. 1. Titration of fluoride with thorium and lanthanum in 0.01M nitric acid (2 mg F using fluoride electrode, 80% ethanol). Source: Ref. 14, used with permission.
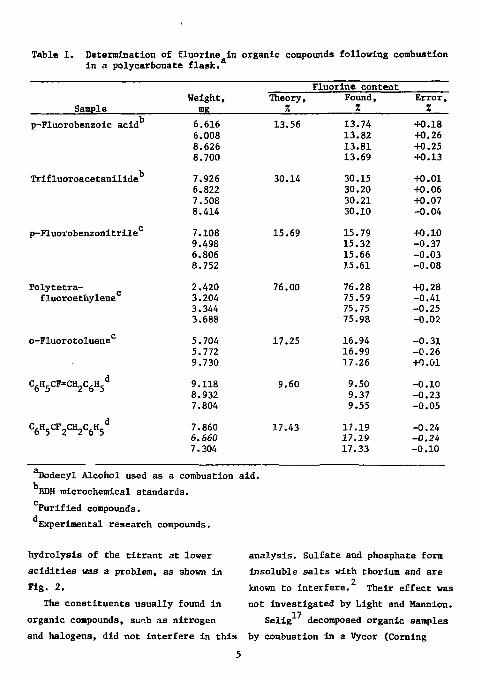
Table 1. Determination of fluorine In organic compounds following combustion In a polycarbonate flask.
Weight, mj?
Fluorine content
Sample Weight,
mj? Theory,
% Found,
7. Error,
7. p-Fluorobenzoic acid 6.616
6.008 8.626 8.700
13.56 13.74 13.82 13.81 13.69
+0.18 +0.26 +0.25 +0.13
Trifluoroacetanillde 7.926 6.822 7.508 8.414
30.14 30.15 30.20 30.21 30.10
+0.01 +0.06 +0.07 -0.04
p-Fluorobenzonitrile 7.108 9.498 6.806 8.752
15.69 15.79 15.32 15.66 15.61
+0.10 -0.37 -0.03 -0.08
Polytetra-fluoroethylene
2.420 3.204 3.344 3.688
76.00 76.28 75.59 75.75 75.98
+0.28 -0.41 -0.25 -0.02
o-Fluorotolueue 5.704 5.772 9.730
17.25 16.94 16.99 17.26
-0.31 -0.26 +0.01
C 6H 5CF=CH 2C 6H 5d 9.118
8.932 7.804
9.60 9.50 9.37 9.55
-0.10 -0.23 -0.05
C 6 H 5 C F 2 C H 2 C 6 H 5 7.860 6.660 7.304
17.43 17.19 17.19 17.33
-0.24 -0.24 -0.10
TJodecyl Alcohol used as a combustion aid. BDH microchemical standards. Purified compounds. Experimental research compounds.
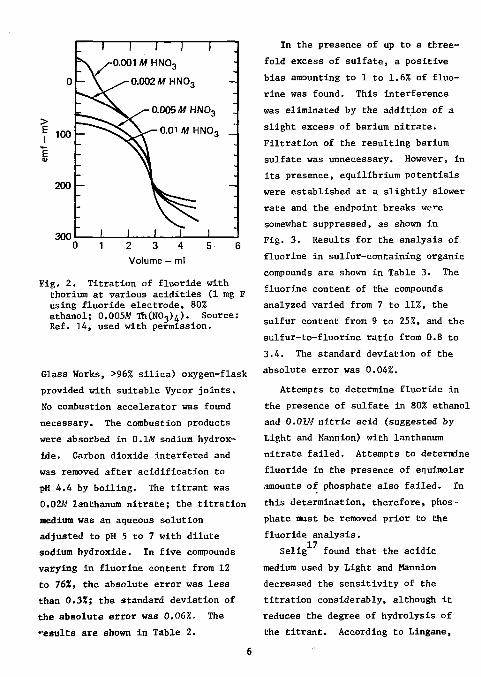
hydrolysis of the titrant at lower acidities was a problem, as shown in Fig. 2.
The constituents usually found in organic compounds, such as nitrogen
analysis. Sulfate and phosphate form insoluble salts with thorium and are
2 known to interfere. Their effect was not investigated by Light and Mannion.
Selig decomposed organic samples and halogens, did not interfere in this by combustion in a Vycor (Corning
5
1 I I 1 1 ..
\ /-0.001 M HN03 -
0 - X ^ - 0.002 MHNO3 -V ^ . / - 0.005 M HNO3 -
100 ^ 0 \ ^ 0.01 M HNO3 -
200 -
-win I I I I I -
0 1 2 3 4 5 6 Volume — ml
Fig. 2. Titration of fluoride with thorium at various acidities (1 mg F using fluoride electrode, 80% ethanol; 0.005M TMNOj)^). Source: Ref. 14, used with permission.
Glass Works, >96% silica) oxygen-flask provided with suitable Vycor joints. No combustion accelerator was found necessary. The combustion products were absorbed in 0.1M sodium hydroxide. Carbon dioxide interfered and was removed after acidification to pH 4.4 by boiling. The titrant was 0.02M lanthanum nitrate; the titration medium was an aqueous solution adjusted to pH 5 to 7 with dilute sodium hydroxide. In five compounds varying in fluorine content from 12 to 76%, the absolute error was less than 0.33!; the standard deviation of the absolute error was 0.06%. The results are shown in Table 2.
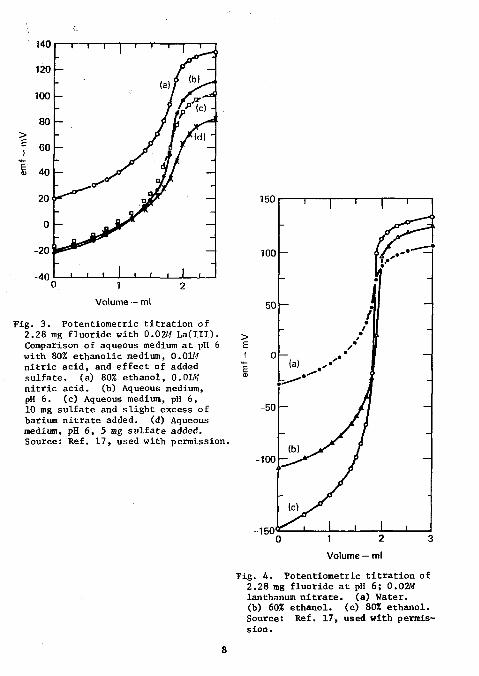
In the presence of up to a threefold excess of sulfate, a positive bias amounting to 1 to 1.6% of fluorine was found. This interference was eliminated by the addition of a slight excess of barium nitrate. Filtration of the resulting barium sulfate was unnecessary. However, in its presence, equilibrium potentials were established at a slightly slower rate and the endpoint breaks were somewhat suppressed, as shown in Fig. 3. Results for the analysis of fluorine in sulfur-containing organic compounds are shown in Table 3. The fluorine content of the compounds analyzed varied from 7 to 11%, the sulfur content from 9 to 25%, and the sulfur-to-fluorine ratio from 0.8 to 3.4. The standard deviation of the absolute error was 0.04%.
Attempts to determine fluoride in the presence of sulfate in 80% ethanol and 0.01M nitric acid (suggested by Light and Mannion) with lanthanum nitrate failed. Attempts to determine fluoride in the presence of equimolar amounts of phosphate also failed. In this determination, therefore, phosphate must be removed prior to the fluoride analysis.
17 Selig found that the acidic medium used by Light and Mannion decreased the sensitivity of the titration considerably, although it reduces the degree of hydrolysis of the titrant. According to Lingane,
6
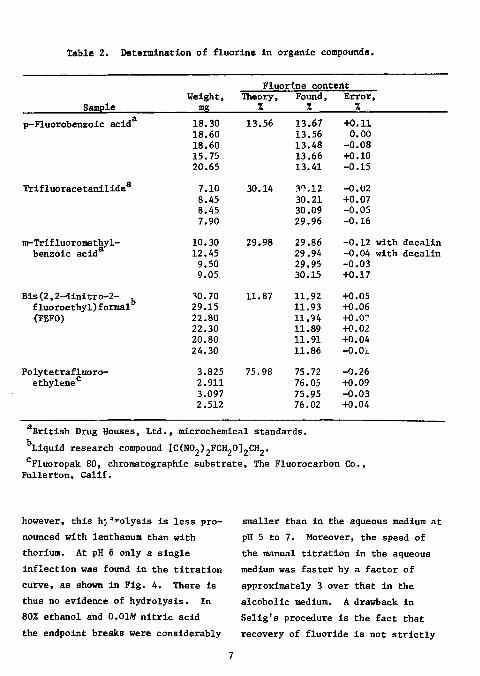
Table 2. Determination of fluorine In organic compounds.
Weight, Fluorine content
Weight, Theory, Found, Error, Sample mg Z Z 7.
p-Fluorobenzoic acid 18.30 13.56 13.67 +0.11 18.60 13.56 0.00 18.60 13.48 -0.08 15.75 13.66 +0.10 20.65 13.41 -0.15
Trifluoracetanilidea 7.10 30.14 30,12 -0.02 8.45 30.21 +0.07 8.45 30.09 -0.05 7.90 29.96 -0.16
m-Trifluoromethyl- 10.30 29.98 29.86 -0.12 with decalin benzoic acid 12.45 29.94 -0.04 with decalin
9.50 29.95 -0.03 9.05 30.15 +0.17
Bis(2,2-dinitro-2-fluoroethy1)formal
• 0.70 11.87 11.92 +0.05 Bis(2,2-dinitro-2-fluoroethy1)formal 29.15 11.93 +0.06 (FEFO) 22.80 11.94 +0.07
22.30 11.89 +0.02 20.80 11.91 +0.04 24.30 11.86 -0.01
Polytetrafluoro- 3.825 75.98 75.72 -0.26 ethylene 2.911 76.05 +0.09
3.097 75.95 -0.03 2.512 76.02 +0.04
British Drug Houses, Ltd., microchemical standards. Liquid research compound [CCNOp.FCH-Ol-CH-. Fluoropak 80, chromatographic substrate, The Fluorocarbon Co.
Fullerton, Calif.
however, this hj'rolysis is less pronounced with lanthanum than with thorium. At pH 6 only a single inflection was found in the titration curve, as shown in Fig. 4. There is thus no evidence of hydrolysis. In 80% ethanol and 0.01M nitric acid the endpoint breaks were considerably
smaller than in the aqueous medium at pH 5 to 7. Moreover, the speed of the manual titration in the aqueous medium was faster by a factor of approximately 3 over that in the alcoholic medium. A drawback in Selig's procedure is the fact that recovery of fluoride is not strictly
- 4 0 < ' I I ' ' ' ' ' L 0 1 2
Volume — ml
Fig. 3 . Potentiometric t i t r a t i o n of 2.28 mg f luoride with 0.02M L a ( I I I ) . Comparison of aqueous medium a t pH 6 with 80% ethanol ic medium, 0.01M n i t r i c ac id , and effect of added s u l f a t e , (a) 80% ethanol , 0.01W n i t r i c ac id . (b) Aqueous medium, pH 6. (c) Aqueous medium, pH 6, 10 mg su l fa te and s l i g h t excess of barium n i t r a t e added, (d) Aqueous medium, pH 6, 5 mg su l f a t e added. Source: Ref. 17, used with permission.
Volume — ml
J i g . 4 . Potentiometric t i t r a t i o n of 2.28 mg f luoride a t pH 6; 0.02M lanthanum n i t r a t e , (a) Water, (b) 60% ethanol . (c) 80% ethanol . Source: Ref, 17, used with permiss ion.
8
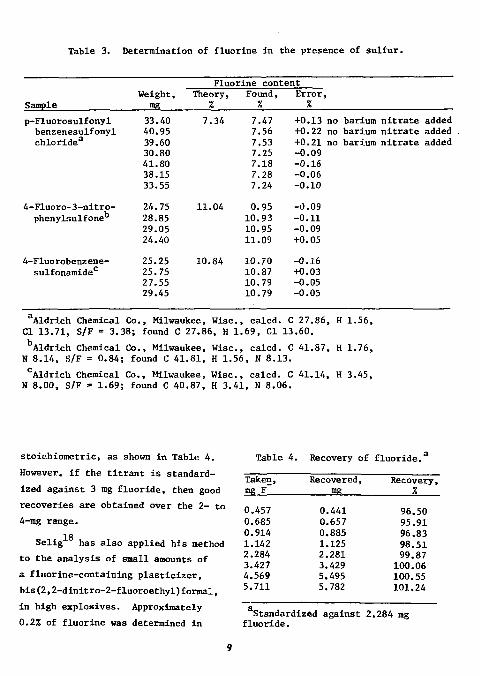
Table 3. Determination of fluorine in the presence of sulfur.
Fluorine content
Sample Weight,
mg Theory,
% Found,
X Error,
p-Fluorosulfonyl benzenesulfonyl chloride3
4-Fluoro-3-nitro-phenylsulfone°
4-Fluorobenz ene-sulfonamide
33 .40 40 .95 39. .60 30, .80 41, .80 38, .15 33. .55 24. .75 28. .85 29. .05 24. .40 25. 25 25. 75 27. ,55 29. ,45
7.34
11.04
10.84
7.47 +0.13 no barium nitrate added 7.56 +0.22 no barium nitrate added 7.53 +0.21 no barium nitrate added 7.25 -0.09 7.18 -0.16 7.28 -0.06 7.24 -0.10
0.95 -0.09 10.93 -0.11 10.95 -0.09 11.09 +0.05
10.70 -0.16 10.87 +0.03 10.79 -0.05 10.79 -0.05
Aldrich Chemical Co., Milwaukee, Wise, calcd. C 27.86, H 1.56, CI 13.71, S/F = 3.38; found C 27.86, H 1.69, CI 13.60.
bAldrich Chemical Co., Milwaukee, Wise, calcd. C 41.87, H 1.76, N 8.14, S/F = 0.84; found C 41.81, H 1.56, N 8.13.
cAldrich Chemical Co., Milwaukee, Wise, calcd. C 41.14, H 3.45, N 8.00, S/F = 1.69; found C 40.87, H 3.41, N 8.06.
stoichiometric, as shown in Table 4. However, if the titrant is standardized against 3 mg fluoride, then good recoveries are obtained over the 2- to 4-mg range.
18 Selig has also applied his method to the analysis of small amounts of a fluorine-containing plasticizer, bis(2,2-dinitro-2-fluoroethyl)formal, in high explosives. Approximately 0.2% of fluorine was determined in
Table 4. Recovery of fluoride.
Taken, Recovered, Recovery, mK F mg % 0.457 0.441 96 .50 0.685 0.657 95 .91 0.914 0.885 96 .83 1.142 1.125 98. .51 2.284 2.281 99. .87 3.427 3.429 100. .06 4.569 5.495 100. ,55 5.711 5.782 101, ,24
Standardized against 2.284 mg fluoride.
9
1-g samples of the explosive after combustion in a platinum-lined oxygen bomb.
19 Francis et al. decomposed organic samples by burning them in a hot-flask combustion apparatus whose design was
20 based on the work of Kirsten (Arthur H. Thomas Co., Philadelphia, Pa., catalog no. 4857-Q10). The absorbing solution consisted of 5 ml of water containing 2.5 mW of sodium hydroxide; n-dodecanol was used as combustion accelerator. The titrant was lanthanum nitrate, although the authors feel that thorium nitrate would serve equally well. Titrations were carried out at pH 4.0 in order to eliminate the interference of carbon dioxide. Although titrations were feasible in a wholly aqueous medium, 60% 2-propanol is recommended in order to increase the endpoint breaks. Unlike titrations performed in water, however, titrations in a partially nonaqueous medium were rate-dependent. Therefore, a slow and constant titration rate is recommended; this can readily be achieved by means of an automatic titrator.
Pavel et al. determined fluorine in organic compounds by the direct measurement of the fluoride concentration following combustion. Materials were decomposed by hot-flask combustion. The sample size was from 1.5 to 4 mg; the fluorine content of the samples ranged from 0.5 to 2 mg. Combustion products were absorbed in water. After absorption and cooling, 4 ml of 0.05W potassium hydrcxide was added and the solution diluted to
22 50 ml with TISAB . Standards were prepared by weighing 1 to 4 mg of sodium fluoride and diluting to 50 ml with 6 ml of water and TISAB. Routinely, all solutions were assayed the same day, together with several standard solutions. Emf's were read after stirring for 3 mln. Prior to the determinations, the fluoride ISE was conditioned in TISAB containing approximately 5 x 10 M fluoride. A calibration curve covering the range
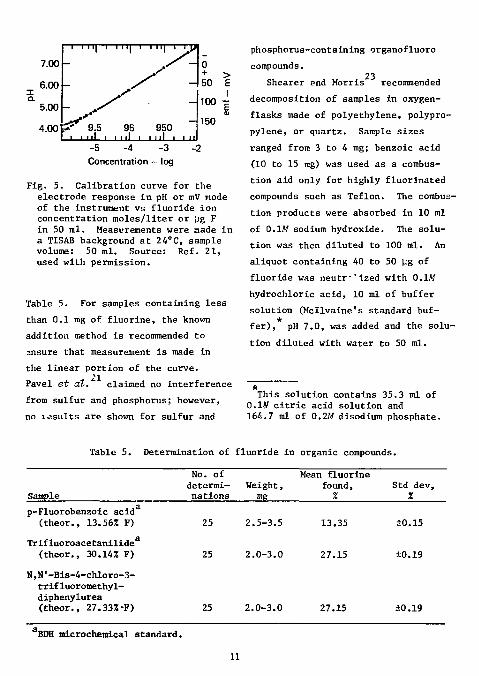
-2 -6 of 10 to 10 M fluoride is shown in Fig. 5. Although the slope of the linear part of the curve proved to be constant as well as close to the theoretical Nernstian response, the intercepts of the curve varied slightly from day to day. Thus the standards should be run every day.
The average error for 25 determinations of each of three standard compounds was less than 0.2Z. A slight negative bias was evident in the results, which are shown in
According to Francis et al., sulfate in equimolar amounts did not affect the results, while phosphate appeared to interfere significantly. However, no data on interferences and no results of fluorine analysis were presented.
10
7.00
6.00
— n rny i i I IJ i i i i | r ' T y
0 + 50
> E
5.00
rny i i I IJ i i i i | r ' T y
100 E
4.00 9.5 95 950 • •I i i i il i i i il i i n
150
Concentration - log
Fig. 5. Calibration curve for the electrode response in pH or mV node of the instrument vs fluoride ion concentration moles/liter or pg F in 50 ml. Measurements were made in a TISAB background at 24°C, sample volume: 50 ml. Source: Ref. 21, used with permission.
Table 5. For samples containing less than 0.1 mg of fluorine, the known addition method is recommended to ansure that measurement is made in the linear portion of the curve. Pavel et at. claimed no interference from sulfur and phosphorus; however, no lesults are shown for sulfur and
phosphorus-containing organofluoro compounds.
23 Shearer end Morris recommended decomposition of samples in oxygen-flasks made of polyethylene, polypropylene, or quartz. Sample sizes ranged from 3 to 4 mg; benzoic acid (10 to 15 mg) was used as a combustion aid only for highly fluorinated compounds such as Teflon. The combustion products were absorbed in 10 ml of 0.1W sodium hydroxide. The solution was then diluted to 100 ml. An aliquot containing 40 to 50 yg of fluoride was neutr~"ized with 0.1M hydrochloric acid, 10 ml of buffer solution (Mcllvaine's standard buf-fer), pH 7.0, was added and the solution diluted with water to 50 ml.
This solution contains 35.3 ml of 0.1W citric acid solution and 164.7 ml of 0.2M disodium phosphate.
Sample
Table 5. Determination of fluoride in organic compounds. No. of Mean fluorine determi- Weight, found, Std dev, nations mg % 7.
p-Fluorobenzoic acid (theor., 13.56% F)
Trifluoroacetanilide (theor., 30.14% F)
N,N'-Bis-4-chloro-3-trifluoromethyl-diphenylurea (theor., 27.33%-F)
25
25
25
2.5-3.5
2.0-3.0
2.0-3.0
13.35
27.15
27.15
±0.15
±0.19
±0.19
BDH microchemical standard.
11
Fluoride was then determined by direct emf measurement, after stirring for 5 min. The working standards were chosen so as to bracket the value found in the sample. As also reported
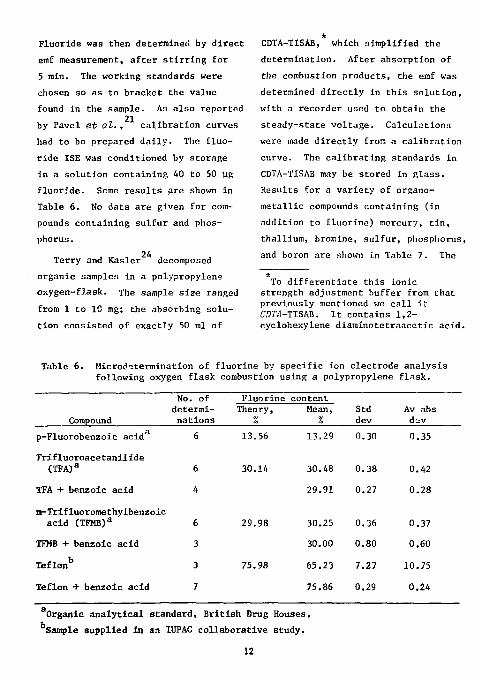
21 by Pavel et at. , calibration curves had to be prepared daily. The fluoride ISE was conditioned by storage in a solution containing 40 to 50 yg fluoride. Some results are shown in Table 6. No data are given for compounds containing sulfur and phosphorus.
24 Terry and Kasler decomposed organic samples in a polypropylene oxygen-flask. The sample size ranged from 1 to 10 mg; the absorbing solution consisted of exactly 50 ml of
CDTA-TISAB, which simplified the determination. After absorption of the combustion products, the emf was determined directly in this solution, with a recorder used to obtain the steady-state voltage. Calculations were made directly from a calibration curve. The calibrating standards in CDTA-TISAB may be stored in glass. Results for a variety of organo-metallic compounds containing (in addition to fluorine) mercury, tin, thallium, bromine, sulfur, phosphorus, and boron are shown in Table 7. The
To differentiate this ionic strength adjustment buffer from that previously mentioned we call it-
CKM-TISAB. It contains 1,2-cyclohexylene diaminotetraacetic acid.
Table 6. Microdetermination of fluorine by specific ion electrode analysis following oxygen flask combustion using a polypropylene flnsk.
Compound
No. of determinations
Fluorine content Theory,
% Mean,
% Std dev
Av abs d- v
p-Fluorobenzoic acid 6 13.56
Trifluoroacetanilide
(TFA) a 6 30.14
TFA + benzoic acid 4
m-Trifluoromethylbenzoic acid (TFMB) a 6 29.98
TFMB + benzoic acid 3
Teflonb 3 75.98
Teflon + benzoic acid 7
13.29 0.30 0.35
30.48 0.38 0.42
29.91 0.27 0.28
30.25 0.36 0.37
30.00 0.80 0.60
65.23 7.27 10.75
75.86 0.29 0.24
Organic analytical standard, British Drug Houses. Sample supplied in an 1UPAC collaborative study.
12
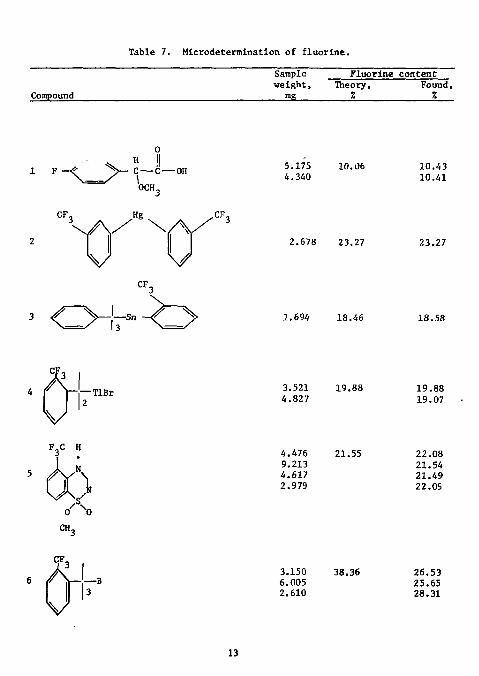
Table 7. Microdetermination of fluorine.
Compound
Sample weight,
mR
Fluorine content Theory,
% Found, %
1 F • C — C — OH \ OCH„
5.175 4.340
10.06 10.43 10.41
2.678 23.27
1.694 18.46
23.27
18.58
3.521 4.827
4.476 9.213 4.617 2.979
19.88
21.55
19.88 19.07
22.08 21.54 21.49 22.09
CH,
3.150 6.005 2.610
38.36 26.53 25.65 28.31
13
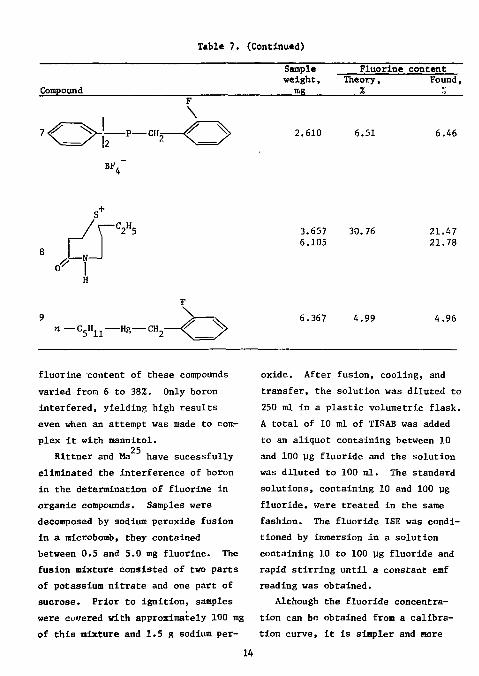
Table 7. (Contlnutd)
Compound
Sample weight, SB
Fluorine content Theory,
% Found,
• o 4 BF,
-CHs
F \
2.610 6.51 6.46
3.657 30.76 6.105
6.367 4.99
21.47 21.78
4.96
fluorine content of these compounds varied from 6 to 38%. Only boron interfered, yielding high results even when an attempt was made to complex it with mannitol.
25 Rlttner and Ma have sucessfully eliminated the Interference of boron in the determination of fluorine in organic compounds. Samples were decomposed by sodium peroxide fusion in a microborab, they contained between 0.5 and 5.0 mg fluorine. The fusion mixture consisted of two parts of potassium nitrate and one part of sucrose. Prior to Ignition, samples were covered with approximately 100 mg of this mixture and 1.5 g sodium per
oxide. After fusion, cooling, and transfer, the solution was diluted to 250 ml in a plastic volumetric flask. A total of 10 ml of TISAB was added to an aliquot containing between 10 and 100 ug fluoride and the solution was diluted to 100 ml. The standard solutions, containing 10 and 100 lJg fluoride, were treated in the same fashion. The fluoride ISE was conditioned by immersion In a solution containing 10 to 100 lig fluoride and rapid stirring until a constant emf reading was obtained.
Although the fluoride concentration can be obtained from a calibration curve, it is simpler and more
14
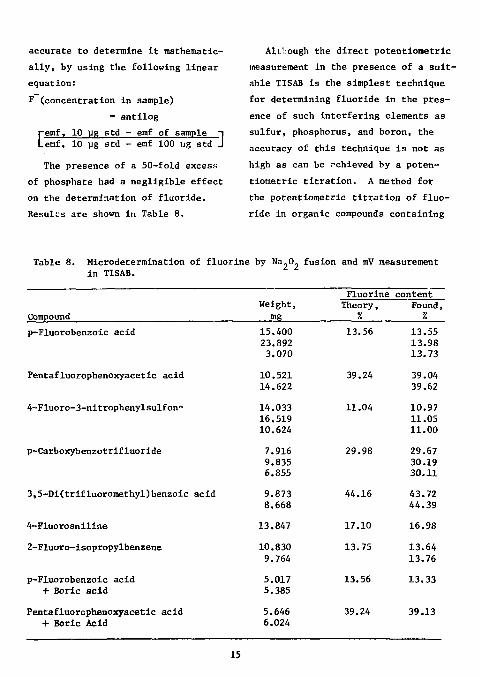
accurate to determine it mathematically, by using the following linear equation: F (concentration in sample)
" antilog
Cemf, 10 yg std - emf of sample ~| emf, 10 pg std - emf 100 ug std J
The presence of a 50-fold excess of phosphate had a negligible effect on the determination of fluoride. Results are shown in Table 8.
Although the direct potentiometric measurement in the presence of a suitable TISAB is the simplest technique for determining fluoride in the presence of such interfering elements as sulfur, phosphorus, and boron, the accuracy of this technique is not as high as can be .-chieved by a potentiometric titration. A method for the potentiometric titration of fluoride in organic compounds containing
Table 8. Microdetermination of fluorine by Na.O fusion and mV measurement in TISAB.
Compound
Fluorine content Weight,
mg Theory,
% Found,
% 15.400 23.892 3.070
13.56 13.55 13.98 13.73
10.521 14.622
39.24 39.04 39.62
14.033 16.519 10.624
11.04 10.97 11.05 11.00
7.916 9.835 6.855
29.98 29.67 30.19 30.11
9.873 8.668
44.16 43.72 44.39
13.847 17.10 16.98
10.830 9.764
13.75 13.64 13.76
5.017 5.385
13.56 13.33
5.646 6.024
39.24 39.13
p-Fluorobenzoic acid
Pentafluorophenoxyacetic acid
4-Fluoro-3-nitrophenylsulfon"
p-Carboxybenzotrifluoride
3,5-Di(trifluoromethyl)benzoic acid
4-Fluoroaniline
2-Fluoro-isopropylbenzene
p-Fluorobenzoic acid + Boric acid
Pentafluorophenoxyacetic acid + Boric Acid
15
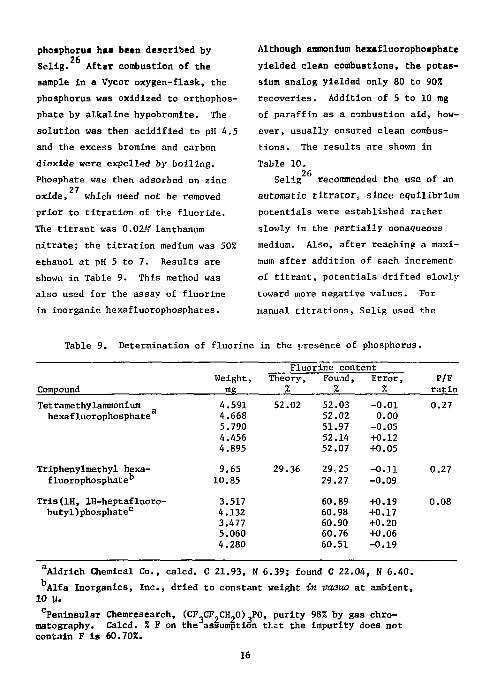
phosphorus h»i been described by 26 Selig. After combustion of the
sample in a Vycor oxygen-flask, the phosphorus was oxidized to orthophos-phate by alkaline hypobromite. The solution was then acidified to pH 4.5 and the excess bromine and carbon dioxide were expelled by boiling. Phosphate was then adsorbed on zinc
27 oxide, which need not be removed prior to titration of the fluoride. The titrant was 0.02M lanthanum nitrate; the titration medium was 50% ethanol at pH 5 to 7. Results are shown in Table 9. This method was also used for the assay of fluorine in inorganic hexafluorophosphates.
Although ammonium hexafluorophosphate yielded clean combustions, the potassium analog yielded only 80 to 907. recoveries. Addition of 5 to 10 mg of paraffin as a combustion aid, however, usually ensured clean combustions. The results are shown in Table 10.
Selig recommended the use of an automatic titrator, since equilibrium potentials were established rather slowly in the partially nonaqueous medium. Also, after reaching a maximum after addition of each increment of titrant, potentials drifted slowly toward more negative values. For manual titrations, Selig used the
Table 9. Determination of fluorine in the presence of phosphorus.
Compound Fluorine content
Weight, Theory, Foil/id, Error, P/F mg % % % ratio
Tetramethylammonium hexafluorophosphate
4.591
5.790 4.456 4.895
Triphenylmethyl hexafluorophosphate''
9.65 Triphenylmethyl hexafluorophosphate'' 10.85
Tris(1H, lH-heptafluoro- 3.517 butyl)phosphate0 4.132
3.477 5.060 4.280
52.02
29.36
52.03 -0.01 52.02 0.00 51.97 -0.05 52.14 +0.12 52.07 +0.05 29,25 -0.11 29.27 -0.09 60.89 +0.19 60.98 +0.17 60.90 +0.20 60.76 +0.06 60.51 -0.19
0.27
0.27
0.08
Aldrich Chemical Co., calcd. C 21.93, N 6.39; found C 22.04, N 6.40. Alfa Inorganics, Inc., dried to constant weight in vaeuo at ambient,
10 u. cPeninsular Chemresearch, (CF.CF.CH.O),P0, purity 98% by gas chro
matography. Calcd. % F on the assumption that the impurity does not contain F is 60.70%.
16
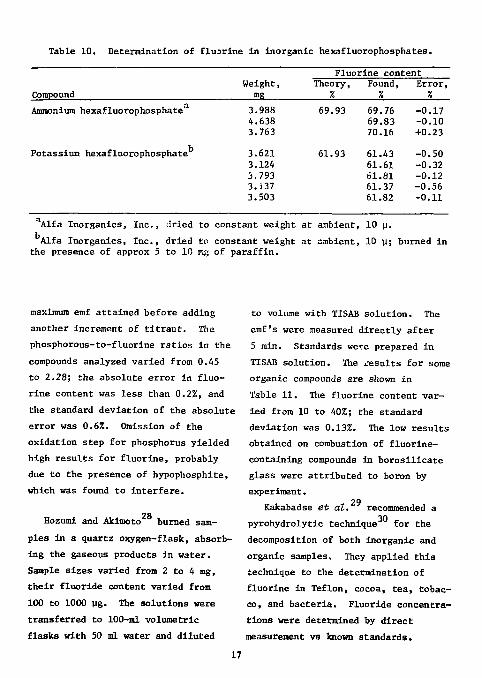
Table 10. Determination of fluorine in inorganic hexafluorophosphates.
Fluorine content
Compound Weight, Theory,
% Found, Error,
% Ammonium hexafluorophosphate
Potassium hexafluorophosphate
988 638 763
621 124 793 137
69.93
61.93
3.503
69.76 -0 .17 69.83 -0.10 70.16 +0.23
61.43 -0.50 61.61 -0.32 61.81 -0.12 61.37 -0.56 61.82 -0 .11
Alfa Inorganics, Inc., dried to constant weight at ambient, 10 y. Alfa Inorganics, Inc., dried to constant weight at ambient, 10 y; burned in
the presence of approx 5 to 10 my, of paraffin.
maximum emf attained before adding another increment of titrant. The phosphorous-to-fluorine ratios in the compounds analyzed varied from 0.45 to 2.28; the absolute error in fluorine content was less than 0.2%, and the standard deviation of the absolute error was 0.6%. Omission of the oxidation step for phosphorus yielded high results for fluorine, probably due to the presence of hypophosphite, which was found to interfere.
28 Hozumi and Akimoto burned sam
ples in a quartz oxygen-flask, absorbing the gaseous products in water. Sample sizes varied from 2 to 4 mg, their fluoride content varied from 100 to 1000 yg. The solutions were transferred to 100-ml volumetric flasks with 50 ml water and diluted
to volume with TISAB solution. The emf's were measured directly after 5 min. Standards we're prepared in TISAB solution. The results for some organic compounds are shown in Table 11. The fluorine content varied from 10 to 40%; the standard deviation was 0.13%. The low results obtained on combustion of fluorine-containing compounds in borosilicate glass were attributed to boron by experiment.
29 Kakabadse et al. recommended a 30 pyrohydrolytic technique for the
decomposition of both inorganic and organic samples. They applied this technique to the determination of fluorine in Teflon, cocoa, tea, tobacco, and bacteria. Fluoride concentrations were determined by direct measurement vs known standards.
17
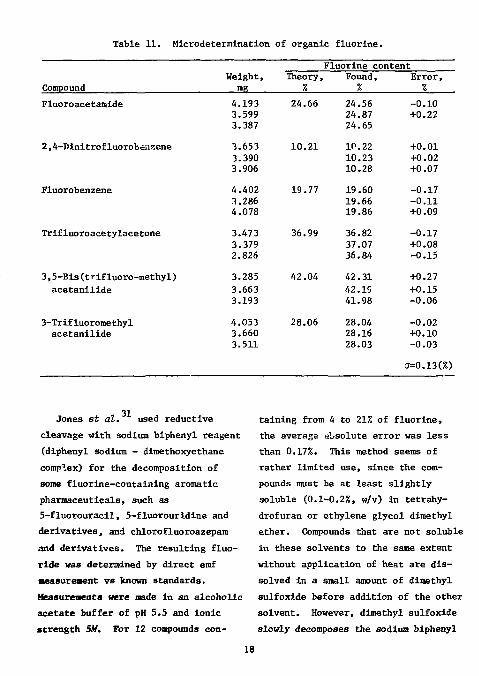
Table 11. Microdetermination of organic fluorine.
Weight, mR
Fluorine content
Compound Weight, mR
Theory, %
Found, %
Error, %
Fluoroacetamide 4.193 3.599 3.387
24.66 24.56 24.87 24.65
-0.10 +0.22
2,4-Dinitrofluorobenzene 3.653 3.390 3.906
10.21 10.22 10.23 10.28
+0.01 +0.02 +0.07
Fluorobenzene 4.402 3.286 4.078
19.77 19.60 19.66 19.86
-0.17 -0.11 +0.09
Trifluoroacetylacetone 3.473 3.379 2.826
36.99 36.82 37.07 36.84
-0.17 +0.08 -0.15
3,5-Bis(trifluoro-methyl) acetanilide
3.285 3.663 3.193
42.04 42.31 42. IS 41.98
+0.27 +0.15 -0.06
3-Trifluoromethyl acetanilide
4.053 3.660 3.511
28.06 28.04 28.16 28.03
-0.02 +0.10 -0.03
(J=0.13(%)
31 Jones et at. used reductive cleavage with sodium biphenyl reagent (diphenyl sodium - dimethoxyethane complex) for the decomposition of some fluorine-containing aromatic pharmaceuticals, such as 5-fluorouracil, 5-fluorouridine and derivatives, and chlorofluoroazepam and derivatives. The resulting fluoride was determined by direct emf measurement vs known standards. Measurements were made in an alcoholic acetate buffer of pH 5.5 and ionic strength 5M. For 12 compounds con
taining from 4 to 21? of fluorine, the average absolute error was less than 0.17%. This method seems of rather limited use, since the compounds must be at least slightly soluble (0.1-0.2%, w/v) in tetrahy-drofuran or ethylene glycol dimethyl ether. Compounds that are not soluble in these solvents to the same extent without application of heat are dissolved in a small amount of dimethyl sulfoxide before addition of the other solvent. However, dimethyl sulfoxide slowly decomposes the sodium biphenyl
18
reagent. Also, these latter compounds require, after destruction of the excess biphenyl reagent, oxidation with hydrogen peroxide under reflux for one hour. This method has been applied only to a limited number of compounds; no materials containing more than 21% of fluorine were determined.
32 Helesic decomposed samples in an oxygen-flask, not stating however, the material of the flask. Liquid samples were sealed in polyethylene capillaries; solid samples were weighed into small polyethylene bags prior to wrapping in the sample carrier. Samples contained 1 to 2 mg of fluorine; the absorbing medium was water. Solutions were neutralized with 0.05M sodium hydroxide to the bromcresol purple endpoint (pH 6.8) and carbon dioxide was removed by flushing with nitrogen. Fluoride was titrated potentiometrically with 0.01M lanthanum nitrate in a medium containing 80% ethanol. Similar titration curves were obtained with praseodymium-, gadolinium-, and ytterbium nitrates. For highly fluorinated compounds, the carrier paper was impregnated with potassium nitrate as a combustion aid. Results for eight compounds (shown in Table 12) were within ±0.3% absolute. None of the compounds contained sulfur or phosphorus. Helesic agrees with Selig that increasing acidity (nitric acid)
decreases the sensitivity of the titration but recommends closer pH control (pH 6.8) than that recommended by Selig (pH 5 to 7).
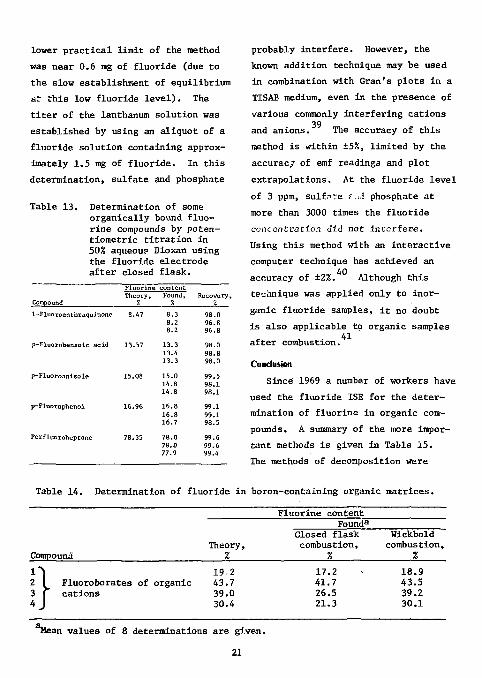
33 Hassan examined the response of an Orion fluoride ISE in various partially nonaqueous media. He found a 50:50 (v/v) mixture of dioxane and water the best medium for both the direct and potentiometric procedures. Organic compounds were combusted in a polyethlene oxygen-flask and the gaseous products absorbed in distilled water. The optimum pH was betwe2n 3 and 6. The titrant was 0.005M thorium nitrate. The results obtained for five organic compounds are shown in Table 13. The average recovery was 99.1% and the mean absolute error was ±0.3%.
Schreiber and Frei described the microdeterminacion of fluorine in organic fluoroborates. Samples were combusted by the Wickbold oxyhydrogen technique and absorbed in 1M sodium hydroxide. The solution was then evaporated to dryness; 20 ml TISAB was added and the pH adjusted to 5.5 with hydrochloric acid. Fluoride was determined by direct eraf measurement after preparation of a calibration curve with s£anda:ds. Some results are shown in Table 14, from which it can be seen that the oxygen-flask combustion yielded low results. From 0.1 to 5 mg fluoride were determined with a coefficient of variation of 1%.
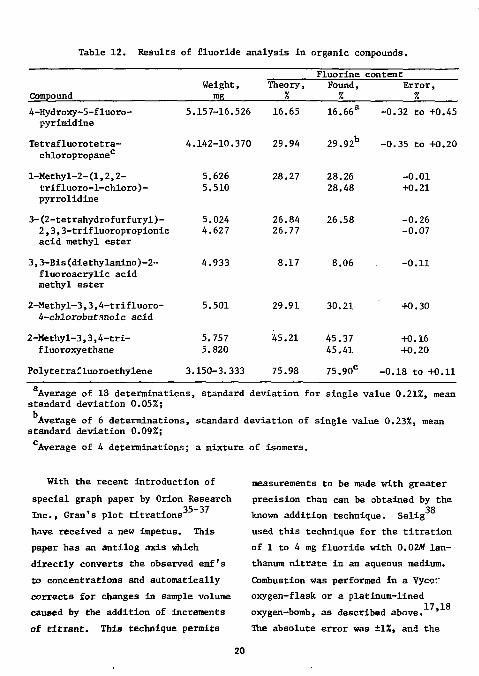
Table 12. Results of fluoride analysis in organic compounds.
Weight mg
> Fluorine content
Compound Weight mg
> Theory, %
Found, %
Error, %
4-Hydroxy~5-fluoro-pyrimidine
5.157-16. 526 16.65 16.66a -0.32 to +0.45
Tetrafluorotetra-chloropropanec
4.142-10. 370 29.94 29.92 b -0.35 to +0.20
l-Methyl-2-(1,2,2-trifluoro-1-chloro)-pyrrolidine
5.626 5.510
28.27 28.26 28.48
-0.01 +0.21
3-(2-tetrahydrofurfuryl)-2,3,3-trifluoropropionic acid methyl ester
5.024 4.627
26.84 26.77
26.58 -0.26 -0.07
3,3-Bis(diethylamino)-2-fluoroacrylic acid methyl ester
4.933 8.17 8.06 -0.11
2-Methyl-3,3,4-trifluoro-4-chlorobutanoic acid
2-Methyl-3,3,4-tri-fluoroxyethane
Polytetrafluoroethylene
5.501
5.757 5.820
3.150-3.333
29.91
45.21
75.98
30.21 +0.30
45.37 +0.16 45.41 +0.20
75.90c -0.18 to +0.11
Average of 18 determinations, standard deviation for single value 0.21%, mean standard deviation 0.05%; Average of 6 determinations, standard deviation of single value 0.23%, mean
standard deviation 0.09%; Average of 4 determinations; a mixture of isomers.
With the recent introduction of special graph paper by Orion Research
35-37 Inc., Gran's plot titrations have received a new impetus. This paper has an antilog axis which directly converts the observed emf's to concentrations and automatically corrects for changes in sample volume caused by the addition of increments of titrant. This technique permits
measurements to be made with greater precision than can be obtained by the
38 known addition technique. Selig used this technique for the titration of 1 to 4 mg fluoride with 0.02M lanthanum nitrate in an aqueous medium. Combustion was performed in a Vycc:: oxygen-flask or a platinum-lined
17 18 oxygen-bomb, as described above. * The absolute error was ±1%, and the
20
lower practical limit of the method was near 0.6 mg of fluoride (due to the slow establishment of equilibrium at this low fluoride level). The titer of the lanthanum solution was established by using an aliquot of a fluoride solution containing approximately 1.5 mg of fluoride. In this determination, sulfate and phosphate
Table 13. Determination of some organically bound fluorine compounds by poten-tiometric titration in 50% aqueous Dioxan using the fluoride electrode after closed flask.
Compound
F l u o r i n e Theory ,
Z
c o n t e n t Found,
7. Recovery, %
1 - F l u o r o a n t h r a q u i n o n e 8.47 8 . 3 8.2 8.2
98 .0 9 6 . 8 96 .8
p - F l u o r o b e n z o i c a c i d 1 3 . 5 7 1 3 . 3 13 .4 1 3 . 3
9 8 . 0 9 8 . 8 98 .0
p - F l u o r o a n i s o l e 15 .08 1 5 . 0 1 4 . 8 1 4 . 8
9 9 . 5 9 8 . 1 9 8 . 1
p - F l u o r o p h e n o l 16 .96 1 6 . 8 1 6 . 8 1 6 . 7
9 9 . 1 9 9 . 1 98 .5
P e r f l u o r o h e p t a n e 78 .35 7 8 . 0 78 .0 77 .9
99 .6 99 .6 99 .4
probably interfere. However, the known addition technique may be used in combination with Gran's plots in a TISAB medium, even in the presence of various commonly interfering cations
39 and anions. The accuracy of this method is within ±5%, limited by the accuracy of emf readings and plot extrapolations. At the fluoride level of 3 ppm, sulfate r.i.i phosphate at more than 3000 times the fluoride concentration did not interfere. Using this method with an interactive computer technique has achieved an
40 accuracy of ±2%. Although this technique was applied only to inorganic fluoride samples, it no doubt is also applicable to organic samples
41 after combustion.
Conclusion
Since 1969 a number of workers have used the fluoride ISE for the determination of fluorine in organic compounds. A summary of the more important methods is given in Table 15. The methods of decomposition were
Table 14. Determination of fluoride in boron-containing organic matrices.
Fluor ine content Found 3
Closed f l a s k Wickbold Theory, combustion, combustion,
Compound % % %
i-i 1 9 . 2 17 .2 1 8 . 9 2 [ F luoroborates of organic 4 3 . 7 4 1 . 7 4 3 . 5 3 | c a t i o n s 3 9 . 0 2 6 . 5 3 9 . 2
*J 30 .4 2 1 . 3 3 0 . 1
ilean values of 8 determinations are given.
21
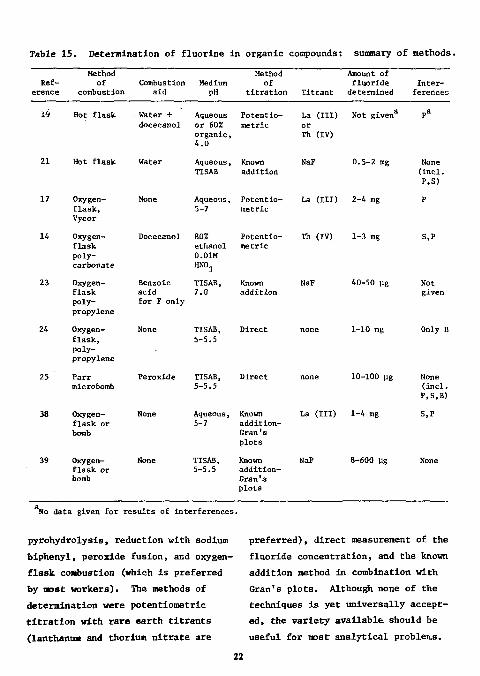
Table 1 5 . Determination of f l u o r i n e i n organic compounds: summary of methods.
Method Method Ref- of Combustion Medium of
erence combustion aid pH t i t r a t i o n
Amount of fluoride In te r -
Titrant determined ferences
19 Hot flask Water + Aqueous Potentio-docecanol or 60% metric
organic, 4.0
21 Hot flask Water Aqueous, TISAB
Known addition
17 Oxygen-flask, Vycor
None Aqueous, 5-7
Po tensometric
14 Oxygen-flask polycarbonate
Docecanol 80% ethanol 0.01M HN0 3
Potentio-metric
23 Oxygen-flask polypropylene
Benzoic acid for F only
TISAB, 7.0
Known addition
24 Oxygen-flask, polypropylene
None TISAB, 5-5.5
Direct
25 Parr microbomb
Peroxide TISAB, 5-5.5
Direct
38 Oxygen-flask or bomb
None Aqueous, 5-7
Known addition-Gran ' s plots
39 Oxygen- None TISAB, Known flask or 5-5.5 addi t ion-bomb Gran's
plots
La ( I I I ) Not given or Th (IV)
NaF 0.5-2 mg
La ( I I I ) 2-4 mg
Th (IV) 1-3 rag
NaF 40-50 lig
none 1-10 mg
none 10-100 pg
La ( I I I ) 1-4 mg
NaF 8-600 ug
None ( inc l . P,S)
S,P
Not given
Only B
None ( inc l . P,S,B)
S,P
None
so data given for r e su l t s of interferences.
p y r o h y d r o l y s i s , r educt ion w i t h sodium
b i p h e n y l , perox ide f u s i o n , and oxygen-
f l a s k combustion (which i s pre ferred
by n o s t workers ) . The methods of
de terminat ion were p o t e n t i o m e t r i c
t i t r a t i o n w i t h rare e a r t h t i t r a n t s
(lanthanum and thorium n i t r a t e are
p r e f e r r e d ) , d i r e c t measurement of the
f l u o r i d e c o n c e n t r a t i o n , and the known
a d d i t i o n method i n combination w i t h
Gran's p l o t s . Although none of the
techniques i s y e t u n i v e r s a l l y a c c e p t
ed , the v a r i e t y a v a i l a b l e should be
u s e f u l for most a n a l y t i c a l problems.
22
References 1. T. S. Ma, "Organic Analysis: Fluorine," in Treatise on Analytical Chem
istry, Part II, Vol. 12, I. M. Kolthoff and P. J. Elving, Eds. (Inter-science, New York, 1965), p. 117.
2. A. M. G. MacDonald, "The Oxygen-Flask Method," in Advances in Analytical Chemistry and Instrumentation, Vol. 4, C. N. Reilly, Ed. (Interscience, New York, 1965), p. 103.
3. Analytical Methods Committee Report, Analyst, 9J_, 734 (1972). 4. H. H. Willard and 0. B. Winter, Ind. Eng. Chem., Anal. Ed., _5» 7 (1933). 5. C. A. Horton, "Trends in the Determination of Fluorine," in Advances in
Analytical Chemistry and Instrumentation, Vol. 1, C. N. Reilly, Ed. (interscience, New York, 1960), p. 164.
6. C. A. Horton, "Fluorine," in Treatise on Analytical Chemistry, Part II, Vol. ?, I. M. Kolthoff and P. J. Elving, Eds. (Interscience, New York, 1961), p. 246.
7. F. H. Oliver, Analyst, 91, 771 (1966). 8. H. S. Clark and 0. W. Rees, Illinois State Geol. Survey Sept. Invest.,
No. 169 (1954). 9. R. H. Shoup, Anal. Chem., 29_, 1216 (1957). 10. T. R. F. W. Fennell, Chemistry and Industry, 1955, 1404. 11. A. F. Colson, Analyst, 88, 26 (1963). 12. R. Belcher and A. M. G. MacDonald, Mikrochim. Acta, 1956, 899. 13. R. Belcher and A. M. G. MacDonald, Mikrochim. Acta, 1957, 510. 14. T. S. Light and R. F. Mannion, Anal. Chem., 41 , 107 (1969), 15. J. J. Lingane, Anal. Chem., J39, 881 (1967). 16. J. J. Lingane, Anal. Chem., 4£, 935 (1968). 17. W. Selig, Z. analyt. Chem., 249, 30 (1970). 18. W. Selig, Lawrence Livermore Laboratory, Livermore, Calif,, Rept, UCID-
15452 (1969); cf. Chem. Abstr., 70, 116758c (1969). 19. H. J. Francis, J. H. Deomarine, and D. D. Persing, Microchem. J., 14, 580
(1969). 20. H. J. Kirsten, Miaroahem. J., 7_, 34 (1963). 21. J. Pavel, R. Kuebler, and H. Wagner, Miarochem. J,, 15., 192 (19-70). 22. M. S. Frant and J. W. Ross, Jr., Anal. Chem., 40, 1169 (1968), 23. D. A. Shearer and G. F. Morris, Microchem. J., .15, 199 (1970). 24. M. B. Terry and F. Kasler, Mikrochim. Acta, 1971, 569, 25. R. C. Rittner and T. S. Ma, Mikrochim. Acta, 1972, 404,
23
26. W. Selig, Mikroahim. Acta, 1970, 337. 27. R. Belcher and A. M. G. MacDonald, Mikroahim. Aata, 1957, 510. 28. K. Hozumi and N. Akimoto, Japan Analyst, 20, 467 (1971); through Analyt.
Abstr., ^3, No. 340 (1972). 29. G. J. Kakabadse, B. Manohin, J. M. Bather, E. C. Weller, and P. Woodbridge,
Nature, 229., 626 (1971). 30. A. C. D. Newman, Analyst, ^3_, 827 (1968). 31. B. C. Jones, J. E. Heveran, and B. Z. Senkowski, J. Pharm. Sai., 60, 1036
(1971). 32. L. Helesic, Coll. Czech. Chem. Comntun., 37, 1514 (1972). 33. S. S. M. Hassan, Mikroahim. Acta, 1974, 889. 34. B. Schreiber and R. W. Frei, Mikroahim. Acta, 1975 I, 219. 35. G. Gran, Analyst, T]_, 661 (1952). 36. Orion Research Inc. Newsletter, 2_, 49 (1970). 37. Orion Research, Inc., Newsletter, _3, 1 (1971). 38. W. Selig, Lawrence Livermore Laboratory, Livermore, Calif., Rept. UCRL-
51167 (1972); cf. Chem. Abstr., 77, 109154u (1972). 39. W. Selig, Mikroahim. Acta, 1973, 87. 40. J. W. Frazer, A. M. Kray, W. Selig, and R. Lim, Anal. Chem., ^7, 869
(1975). 41. W. Selig, Mikroohim. Acta, 1974, 515.
24
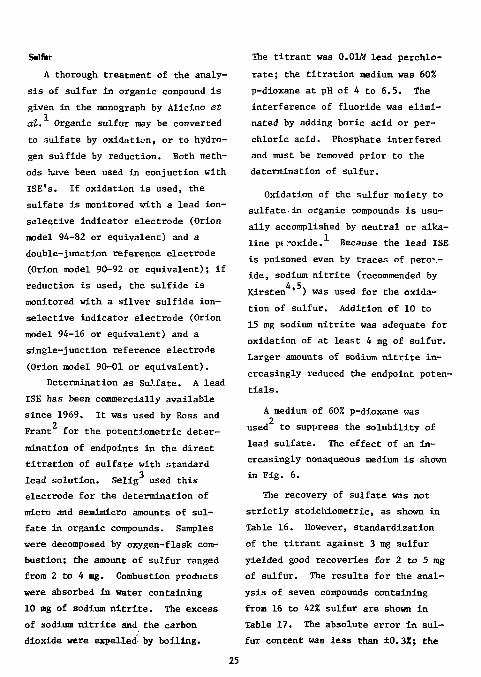
Sulfur A thorough treatment of the analy
sis of sulfur in organic compound is given in the monograph by Alicino e* dl. Organic sulfur may be converted to sulfate by oxidation, or to hydrogen sulfide by reduction. Both methods have been used in conjuction with ISE's. If oxidation is used, the sulfate is monitored with a lead ion-selective indicator electrode (Orion model 94-82 or equivalent) and a double-junction reference electrode (Orion model 90-92 or equivalent); if reduction is used, the sulfide is monitored with a silver sulfide ion-selective indicator electrode (Orion model 94-16 or equivalent) and a single-junction reference electrode (Orion model 90-01 or equivalent).
Determination as Sulfate. A lead ISE has been commercially available since 1969. It was used by Ross and
2 Frant for the potentiometric determination of endpoints in the direct titration of sulfate with standard
3 lead solution. Selig used this electrode for the determination of micro and semimicro amounts of sulfate in organic compounds. Samples were decomposed by oxygen-flask combustion; the amount of sulfur ranged from 2 to 4 mg. Combustion products were absorbed in water containing 10 mg of sodium nitrite. The excess of sodium nitrite and the carbon dioxide were expelled by boiling.
The titrant was 0.01M lead perchlo-rate; the titration medium was 60% p-dioxane at pH of 4 to 6.5. The interference of fluoride was eliminated by adding boric acid or perchloric acid. Phosphate interfered and must be removed prior to the determination of sulfur.
Oxidation of the sulfur moiety to sulfate•in organic compounds is usually accomplished by neutral or alkaline p< roxide. Because the lead ISE is poisoned even by traces of peroxide, sodium nitrite (recommended by Kirsten ' ) was used for the oxidation of sulfur. Addition of 10 to 15 mg sodium nitrite was adequate for oxidation of at least 4 mg of sulfur. Larger amounts of sodium nitrite increasingly reduced the endpoint potentials.
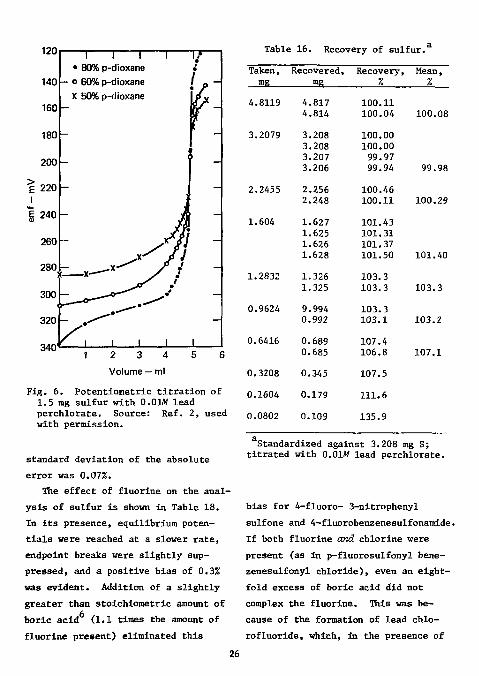
A medium of 60% p-dioxane was 2
used to suppress the solubility of lead sulfate. The effect of an increasingly nonaqueous medium is shown in Fig. 6.
The recovery of sulfate was not strictly stoichiometric, as shown in Table 16. However, standardization of the titrant against 3 mg sulfur yielded good recoveries for 2 to 5 mg of sulfur. The results for the analysis of seven compounds containing from 16 to 42% sulfur are shown in Table 17. The absolute error in sulfur content was less than ±0.3%; the
120
140
160
180
200
~ i — i — r • 80% p-dioxane
l - o 60% p-dioxane X 50% p-dioxane
Table 16. Recovery of sulfur.
2 3 4 Volume — ml
Fig. 6. Potentiometric titration of 1.5 mg sulfur with 0.0W lead perchlorate. Source: Ref. 2, used with permission.
standard deviation of the absolute error was 0.07%.
The effect of fluorine on the analysis of sulfur is shown in Table 18. In its presence, equilibrium potentials were reached at a slower rate, endpoint breaks were slightly suppressed, and a positive bias of 0.3% was evident. Addition of a slightly greater than stoichiometric amount of boric acid (1.1 times the amount of fluorine present) eliminated this
Taken, Recovered, Recovery, Mean, mg rag % %
4.8119 4.817 100.11 4.814 100.04 100.08
3.2079 3.208 100.00 3.208 100.00 3.207 99.97 3.206 99.94 99.98
2.2455 2.256 100.46 2.248 100.11 100.29
1.604 1.627 101.43 1.625 101.31 1.626 101.37 1.628 101.50 101.40
1.2832 1.326 103.3 1.325 103.3 103.3
0.9624 9.994 103.3 0.992 103.1 103.2
0.6416 0.689 107.4 0.685 106.8 107.1
0.3208 0.345 107.5
0.1604 0.179 111.6
0.0802 0.109 135.9
Standardized against 3.208 mg S; titrated with 0.01W lead perchlorate.
bias for 4-fluoro- 3-nitrophenyl sulfone and 4-fluorobenzenesulfonamide. If both fluorine and chlorine were present (as in p-fluorosulfonyl bene-zenesulfonyl chloride), even an eightfold excess of boric acid did not complex the fluorine. This was because of the formation of lead chlo-rofluoride, which, in the presence of
26
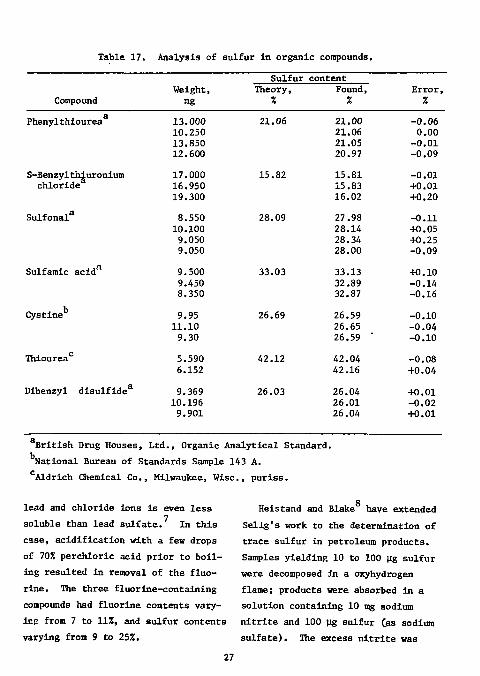
Table 17. Analysis of sulfur in organic compounds.
Weight, mg
Sulfur content
Compound Weight, mg
Theory, %
Found, %
Error, %
a Phenylthiourea 13.000
10.250 13.850 12.600
21.06 21.00 21.06 21.05 20.97
-0.06 0.00
-0.01 -0.09
S-Benzylthiuronium chloride
17.000 16.950 19.300
15.82 15.81 15.83 16.02
-0.01 +0.01 +0.20
Sulfonal 8.550 10.100 9.050 9.050
28.09 27.98 28.14 28.34 28.00
-0.11 +0.05 +0.25 -0.09
Sulfamic acid' 9.500 9.450 8.350
33.03 33.13 32.89 32.87
+0.10 -0.14 -0.16
Cystine 9.95 11.10 9.30
26.69 26.59 26.65 26.59 '
-0.10 -0.04 -0.10
Thiourea 5.590 6.152
42.12 42.04 42.16
-0.08 +0.04
Dibenzyl disulfide 9.369 10.196 9.901
26.03 26.04 26.01 26.04
+0.01 -0.02 +0.01
British Drug Houses, Ltd., Organic Analytical Standard. National Bureau of Standards Sample 143 A. Aldrich Chemical Co., Milwaukee, Wise, puriss.
lead and chloride ions is even less soluble than lead sulfate. In this case, acidification with a few drops of 70% perchloric acid prior to boiling resulted in removal of the fluorine. The three fluorine-containing compounds had fluorine contents varying from 7 to 11%, and sulfur contents varying from 9 to 25%.
Q
Heistand and Blake have extended Selig's work to the determination of trace sulfur in petroleum products. Samples yielding 10 to 100 ug sulfur were decomposed in a oxyhydrogen flame; products were absorbed in a solution containing 10 mg sodium nitrite and 100 ng sulfur Cas sodium sulfate). The excess nitrite was
27
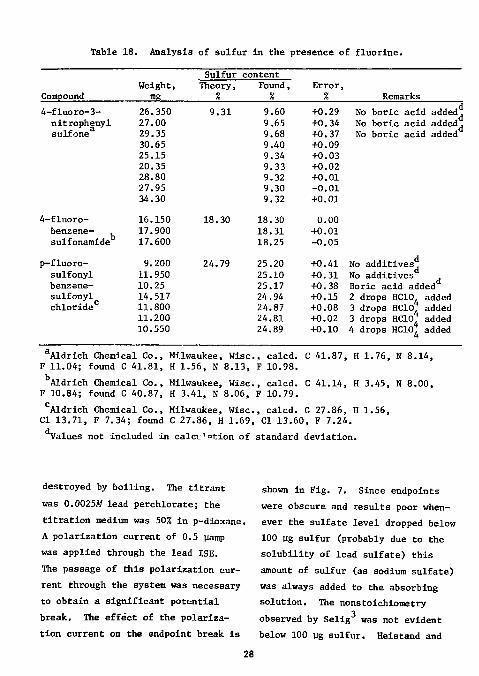
Table 18. Analysis of sulfur in the presence of fluorine.
Sulfur content Weight, Theory, Found, Error,
Compound mg % 7. % Remarks 4-fluoro-3- 26.350 9.31 9.60 +0.29 No boric acid added
No boric acid added, No boric acid added
nitrophenyl 27.00 9.65 +0.34 No boric acid added No boric acid added, No boric acid added sulfone 29.35 9.68 +0.37
No boric acid added No boric acid added, No boric acid added
30.65 9.40 +0.09 25.15 9.34 +0.03 20.35 9.33 +0.02 28.80 9.32 +0.01 27.95 9.30 -0.01 34.30 9.32 +0.01
4-fluoro- 16.150 18.30 18.30 0.00 benzene-sulfonamide
17.900 18.31 +0.01 benzene-sulfonamide 17.600 18.25 -0.05
p-fluoro- 9.200 24.79 25.20 +0.41 No additives No additives Boric acid added
sulfonyl 11.950 25.10 +0.31 No additives No additives Boric acid added benzene- 10.25 25.17 +0.38
No additives No additives Boric acid added
sulfonyl 14.517 24.94 +0.15 2 drops HC10 added 3 drops HCIO* added 3 drops HC107 added 4 drops HCIO* added
chloride 11.800 24.87 +0.08 2 drops HC10 added 3 drops HCIO* added 3 drops HC107 added 4 drops HCIO* added
11.200 24.81 +0.02
2 drops HC10 added 3 drops HCIO* added 3 drops HC107 added 4 drops HCIO* added 10.550 24.89 +0.10
2 drops HC10 added 3 drops HCIO* added 3 drops HC107 added 4 drops HCIO* added
Aldrich Chemical Co., Milwaukee, Wise, calcd. C 41.87, H 1.76, N 8.14, F 11.04; found C 41.81, H 1.56, N 8.13, F 10.98. Aldrich Chemical Co., Milwaukee, Wise, calcd. C 41.14, H 3.45, N 8.00,
F 10.84; found C 40.87, H 3.41, N 8.06, F 10.79. °Aldrich Chemical Co., Milwaukee, Wise, calcd. C 27.86, H 1.56, CI 13.71, F 7.34; found C 27.86, H 1.69, CI 13.60, F 7.24. Values not included in calculation of standard deviation.
destroyed by boiling. The titrant was 0.0025M lead perchlorate; the titration medium was 507. in p-dioxane. A polarization current of 0.5 uamp was applied through the lead ISE. The passage of this polarization current through the system was necessary to obtain a significant potential break. The effect of the polarization current on the endpoint break is
shown in Fig. 7. Since endpoints were obscure and results poor whenever the sulfate level dropped below 100 ug sulfur (probably due to the solubility of lead sulfate) this amount of sulfur (as sodium sulfate) was always added to the absorbing solution. The nonstoichiometry
3 observed by Selig was not evident below 100 yg sulfur. Heistand and
28
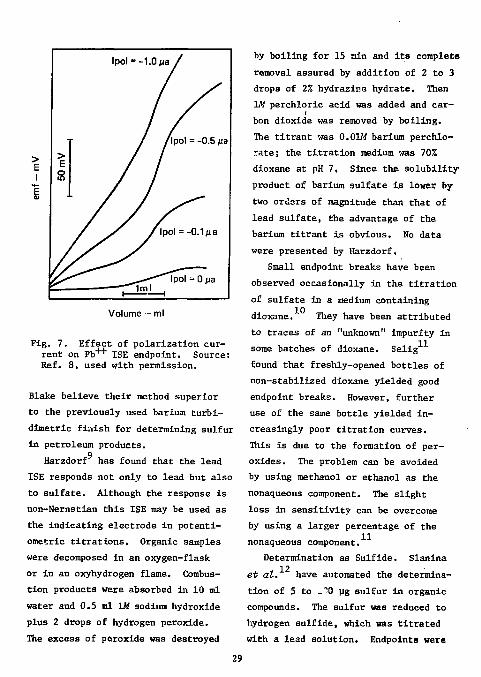
Volume — ml
Fig. 7. Effect of polarization current on PD"*-1" ISE endpoint. Source: Ref. 8, used with permission.
Blake believe their method superior to the previously used barium turbi-dimetric finish for determining sulfur in petroleum products.
9 Harzdorf has found that the lead
ISE responds not only to lead but also to sulfate. Although the response is non-Nernstian this ISE may be used as the indicating electrode in potenti-ometric titrations. Organic samples were decomposed in an oxygen-flask or in an oxyhydrogen flame. Combustion products were absorbed in 10 ml water and 0.5 ml 1W sodium hydroxide plus 2 drops of hydrogen peroxide. The excess of peroxide was destroyed
by boiling for 15 min and its complete removal assured by addition of 2 to 3 drops of 2% hydrazine hydrate. Then 1M perchloric acid was added and car-
i bon dioxide was removed by boiling. The titrant was 0.01W barium perchlo-rate; the titration medium was 70% dioxane at pH 7, Since the solubility-product of barium sulfate is lower by-two ordsrs of magnitude than that of lead sulfate, the advantage of the barium titrant is obvious. No data were presented by Harzdorf.
Small endpoint breaks have been observed occasionally in the titration of sulfate in a medium containing dioxane. They have been attributed to traces of an "unknown" impurity in some batches of dioxane. Selig found that freshly-opened bottles of non-stabilized dioxane yielded good endpoint breaks. However, further use of the same bottle yielded increasingly poor titration curves. This is due to the formation of peroxides. The problem can be avoided by using methanol or ethanol as the nonaqueous component. The slight loss in sensitivity can be overcome by using a larger percentage of the nonaqueous component.
Determination as Sulfide. Slanina 12
et at. have automated the determination of 5 to _">0 ug sulfur in organic compounds. The sulfur was reduced to hydrogen sulfide, which was titrated with a lead solution. Endpoints were
detected with a silver sulfide ISE. The auttTatic titrator has a mV controller »hat activates the titrant delivery pump if the signal of the pH meter exceeds the set-point. In this way, the added sulfide is titrated to a constant sulfide concentration. The mV controller is equipped with a proportional band of 3 mV to avoid overshoot. The optimum set-point depends on the proportional band of the mV controller, the pump rate, and concentration of titrant. Slanina et
12 at. found that for a proportional band of 3 mV, a pump rate of 70 pg/ min, and a concentration of 0.01M lead, the best set-point was near 800 mV relative to a saturated calomel electrode (SCE).
Samples were reduced by hydrogen (100 ml/min flow rate) over a platinum catalyst at 900°C within 4 min. The reduction apparatus was connected directly with the titration vessel, which was swept with nitrogen to exclude air.
The absorbing solution consisted of W potassium hydroxide and lAf hydToxylanine. The titrant was 0.01M lead nitrate (it takes two days for the titrant to stabilize at pH 2). The sulfide solution was 0.035M at pH 14. About 100 ul of this solution was added to the absorbing solution, the optimum potential for the mV controller was selected and the sulfide was titrated.
30
Thirty seconds after the beginning of combustion, the first hydrogen sulfide appears in the titration vessel. The titration is completed after about 8 min. The whole cycle thus takes about 10 min. Results of some determinations are shown in Table 19. The standard deviation for all determinations was 0.14% absolute, or 0.7% relative. Sulfate, chloride, iodide, and cyanide did not interfere.
This procedure was extended in a 13
later paper to the automated determination of traces of sulfur in organic compounds. Only small changes were made in the original procedure. Samples contained 100 to 500 ppm of sulfur. The titrant was a 0.0002M lead (II) solution. Samples were hydrogenated in a wide tube in a stream of hydrogen at 1050°C over quartz wool. Titrations were carried out automatically until the preset signal of a silver sulfide ISE was reached. Total analysis time was about 5 to 6 min. For samples containing more than 5 ppm of sulfur, the standard deviation was less than 3% relative to the mean value. Nitrogen compounds interfere only if present in large amounts.
14 Volodina and Martynova deter
mined sulfur in organic compounds by pyrolysis in a stream of ammonia in a quartz tube at 800°C. The absorbing solution was 1M potassium hydroxide containing 5% glycerol as antioxidant.
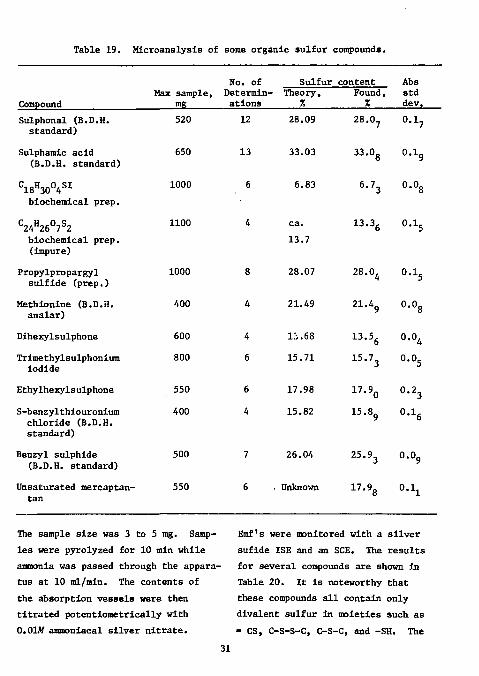
Table 19. Microanalysis of some organic sulfur compounds.
Max sample, mg
No. of Determinations
Sulfur content Abs
Compound Max sample,
mg
No. of Determinations
Theory, %
Found, 7.
std dev.
Sulphonal (B.D.H. standard)
520 12 28.09 28.0 ? o.i 7
Sulphamic acid (B.D.H. standard)
650 13 33.03 33.0 g O.lg
C18 H30°4 S I
biochemical prep. 1000 6 6.83 6.73 0.0g
C24 H26°7 S2 biochemical prep, (impure)
1100 4 ca. 13.7
13.3 g o.i 5
Propylpropargyl sulfide (prep.)
1000 8 28.07 28.0 4 o.i 5
Methionine (B.D.H. analar)
400 4 21.49 21.4 9 o.o 8
Dihexylsulphone 600 4 1.;.68 13.5fi o.o4
Trimethylsulphonium iodide
800 6 15.71 15.7 3 o.o5
Ethylhexylsulphone 550 6 17.98 17.9 Q 0.2 3
S-benzylthiouronium chloride (B.D.H. standard)
400 4 15.82 15.8 9 o.i 6
Benzyl sulphide 500 (B.D.H. standard)
Unsaturated mercaptan- 550 tan
26.04 25.9 3 0.09
Unknown 17.9. 0.1, o 1
The sample size was 3 to 5 mg. Samples were pyrolyzed for 10 min while ammonia was passed through the apparatus at 10 ml/rain. The contents of the absorption vessels were then titrated potentiometrically with 0.01W ammoniacal silver nitrate.
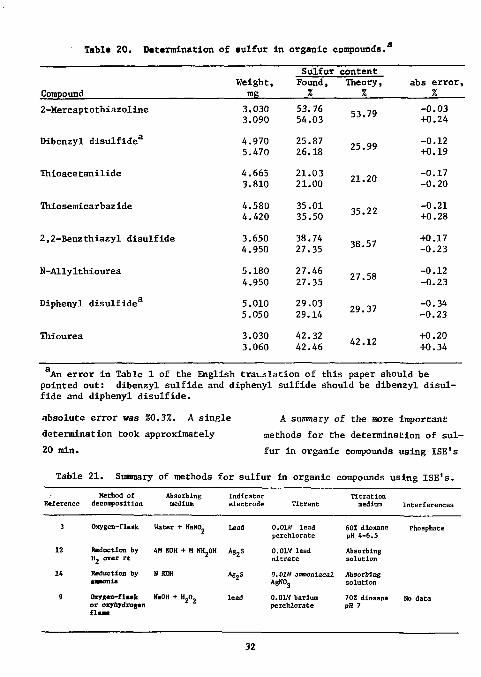
Emf's were monitored with a silver sufide ISE and an SCE. The results for several compounds are shown in Table 20. It is noteworthy that these compounds all contain only divalent sulfur in moieties such as » CS, C-S-S-C, C-S-C, and -SH. The
31
Tabic 20. Determination of sulfur in organic compounds.
Sulfur content
Compound Weight,
mg Found, %
Theory, %
abs error, %
2-Mercaptothiazoline
Dibenzyl disulfide3
Thioacetanilide
Thiosemicarbaz ide
2,2-Benzthiazyl disulfide
N-Allylthiourea
Diphenyl disulfide3
Thiourea
3.030 53.76 3.090 54.03
4.970 25.87 5.470 26.18
4.665 21.03 3.810 21.00
4.580 35.01 4.420 35.50
3.650 38.74 4.950 27.35
5.180 27.46 4.950 27.35
5.010 29.03 5.050 29.14
3.030 42.32 3.060 42.46
53.79
25.99
21.20
35.22
38.57
27.58
29.37
42.12
-0.03 +0.24
-0.12 +0.19
-0.17 -0.20
-0.21 +0.28
+0.17 -0.23
-0.12 -0.23
-0.34 -0.23
+0.20 +0.34
An error in Table 1 of the English tra:.jlation of this paper should be pointed out: dibenzyl sulfide and diphenyl sulfide should be dibenzyl disulfide and diphenyl disulfide.
absolute error was £0.3%. A single determination took approximately 20 min.
A summary of the more important methods for the determination of sulfur in organic compounds using ISE's
Table 21. Summary of methods for sulfur in organic compounds using ISE's.
R e f e r e n c e Method of
d e c o m p o s i t i o n Abso rb ing
medium I n d i c a t o r e l e c t r o d e T i t r a n t
T i t r a t i o n medium I n t e r f e r e n c e s
3 O x y g e n - f l a i k Water + KaHO Lead O.OLVf l e a d p e r c h l o r a t e
60% d i o x a n e pH 4 - 6 . 5
P h o s p h a t e
12 R e d u c t i o n by H, o v e r P t
4M KOH + M NH-0H Ag 2 S 0.01AT l e a d n i t r a t e
Abso rb ing s o l u t i o n
14 R e d u c t i o n b y •MBonia
H KOH A g 2 S 0.01M a m n o n i a c a l AgN0 3
Absorb ing s o l u t i o n
9 Oxygen- f lMk o r oxyhydrogen f l a a e
NaOH + H 2 0 2 l e a d 0 . 0 1 / / b a r i u n p e r c h l o r a t e
70Z d i o x a n e pH 7
No d a t a
32
is given in TaBle 21. The sulfur was finish was by potentiometrlc titration in all cases. A lead ISE was used to converted either by oxidation to sul'
fate (oxygen-flask or oxyhydrogen monitor the titration of sulfate with lead or barium perchlorate; a silver
flame) or by reduction to hydrogen s u l f i d e I S E w a s u s e d to monitor the sulfide (by hydrogen or ammonia at titration of sulfide with lead nitrate high temperature). The method of or ammoniacal silver nitrate.
References
1. J. F. Alicino, A. I. Cohen, and M. E. Everhard, "Organic Analysis: Sulfur," in Treatise on Analytical Chemistry, Part II, Vol. 12, I. M. Kolthoff and P. J. Elving, Eds. (Interscience, New York, 1965), p. 57.
2. J. W. Ross, Jr., and M. S. Frant, Anal. Chem., 41, 967 (1969). 3. W. Selig, Mikrochim. Acta, 1970, 168. 4. W. Kirsten, Mikrochim. Acta, 1960, 272. 5. W. J. Kirsten, K. Hansson, and S. K. Nllsson. Analyt. Chim. Acta, 28, 101
(1963). 6. R. Belcher and A. M. G. MacDonald, Talanta, 1_, 185 (1958). 7. C. A. Horton, in Treatise on Analytical Chemistry, Part II, Vol. 7, I. M.
Kolthoff and P. J. Elving, Eds. (Interscience, New York, 1961), p. 257. 8. R. N. Heistand and C. T. Blake, Mikrochim. Acta, 1972, 212. 9. C. Harzdorf, Z. Anal. Chem., 262, 167 (1972). 10. Orion Research Inc., Newsletter, J5, 27 (1971). 11. W. Selig and A. Salomon, Mikrochim. Acta, 1974, 663. 12. J. Slanina, J. Agterdenbos, and B. Griepink, Mikroahim. Acta, 1970, 1225. 13. J. Slanina, P. Vermeer, J. Agterdenbos, and B. Griepink, Mikrochim. Acta,
1973, 607. 14. M. A. Volodina and G. A. Martynova, Zh. Analit. Khim., J26, 1002 C1971);
through J. Anal. Chem. USSR, 26_, 896 (1971).
33
HakftM A thorough treatment of the analy
sis of halides In organic compounds is given in the monograph by Olson. Nonionic halogen is usually converted to halide by combustion of the compound in oxygen, either in a closed flask, or in a tube over a catalyst. The resulting halide has been most frequently monitored with a silver sulfide ion-selective indicator electrode (Orion model 94-16 or equivalent) ; however, the individual halide electrodes (Orion models 94-17, 94-35, and 94-53 or equivalent) may also be used.
2 3 Krijgsman and co-workers * have automated the determination of microgram amounts of halogen in organic compounds. The combustion chamber, measuring apparatus, and electronic circuitry are similar to that
.. 4 described by Slanina et at. for the determination of sulfur in organic compounds. The mV controller was equipped with a proportional band of 4 mV; the pump rate was 70 pl/min. The absorbing solution was saturated prior to starting the first determination by dissolving 10 yg halide and titrating to the predetermined emf. This emf was 300 mV relative to the reference electrode for chloride and 210 mV for bromide and iodide.
Between 0.1 and 10 pequiv of halogen could be determined in a sample of 10 to 500 yg. The procedure is
34
similar to that previously described for the determination of halide in an inorganic matrix. Samples were burned in a tube in a stream of oxygen at 900 to 1000"C over platinum, palladium, and quartz. The gaseous combustion products were absorbed in 80% acetic acid containing 1% hydrogen peroxide and 1% hydrazine. The latter speeds up the titration of iodide and Improves the results of this titration. Halides were automatically titrated with 0.003M silver nitrate using a silver sulfide ISE. One determination took approximately 3 to 6 min. The results for several compounds are shown in Table 22. The standard deviation was less than 0.35% absolute. Sulfur, nitrogen, phosphorus, and arsenic did not interfere.
o In another paper Krijgsman et at.
described an automated procedure for the determination of chlorine in organic compounds. The equipment and procedures were essentially the same
2 as described above. The method was suitable for 5 to 100 ug of chlorine. The absorbing and titration medium consisted of 75% acetic acid and 1% hydrogen peroxide; the titrant was O.OlAf silver nitrate. One determination took approximately 5 min. A small amount of stearic acid was added as a combustion aid to highly chlorinated compounds such as hexa-chlorobenzene. For such compounds,
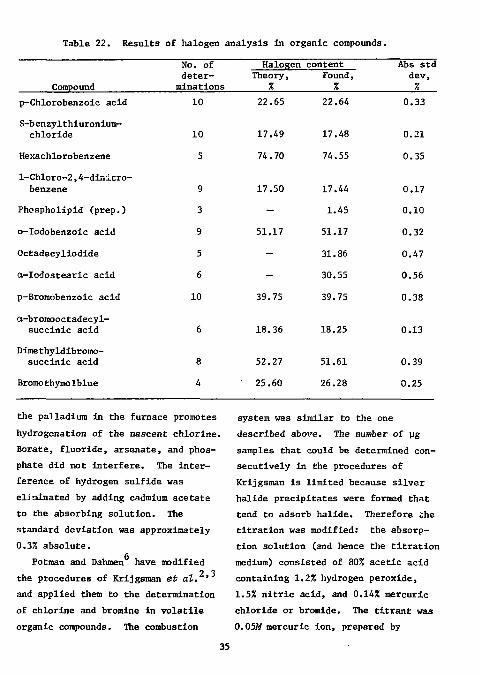
Table 22. Results of halogen analysis in organic compounds.
Compound
No. of deter
minations
Halogen Theory,
% content
Found, %
Abs std dev, %
p-Chlorobenzoic acid 10 22.65 22.64 0.33
S-benzylthiuronium-chloride 10 17.49 17.48 0.21
Hexachlorobenzene 5 74.70 74.55 0.35
l-Chloro-2,4-dinitro-benzene 9 17.50 17.44 0.17
Phospholipid (prep.) 3 - 1.45 0.10
o-Iodobenzoic acid 9 51.17 51.17 0.32
Octadecyliodide 5 - 31.86 0.47
cc-Iodostearic acid 6 - 30.55 0.56
p-Broraobenzoic acid 10 39.75 39.75 0.38
a-bromooctadecyl-succinic acid
Dimethyldibromo-succinic acid
Bromothymolblue
18.36 18.25 0.13
52.27 51.61 0.39
25.60 26.28 0.25
the palladium in the furnace promotes hydrogenation of the nascent chlorine. Borate, fluoride, arsenate, and phosphate did not interfere. The interference of hydrogen sulfide was eliminated by adding cadmium acetate to the absorbing solution. The standard deviation was approximately 0.3% absolute.
Potman and Dahmen have modified 2 3 the procedures of Krijgsman et at. '
and applied them to the determination of chlorine and bromine in volatile organic compounds. The combustion
system was similar to the one described above. The number of |jg samples that could be determined consecutively in the procedures of Krijgsman is limited because silver halide precipitates were formed that tend to adsorb halide. Therefore ihe titration was modified: the absorption solution (and hence the titration medium) consisted of 802 acetic acid containing 1.2% hydrogen peroxide, 1.5% nitric acid, and 0.14% mercuric chloride or bromide. The titrant was 0.05M mercuric ion, prepared by
35
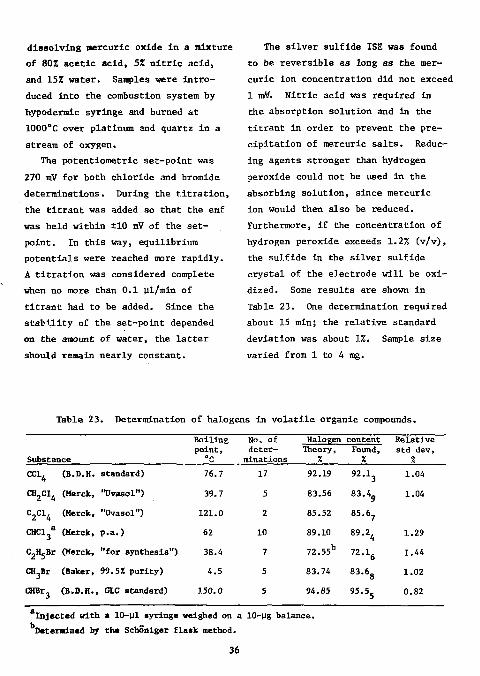
dissolving mercuric oxide in a mixture of 80X acetic acid, 5Z nitric acid, and 15% water. Samples were introduced into the combustion system by hypodermic syringe and burned at 1000°C over platinum and quartz in a stream of oxygen.
The potentiometric set-point was 270 mV for both chloride and bromide determinations. During the titration, the titrant was added so that the emf was held within ±10 mV of the set-point. In this way, equilibrium potentials were reached more rapidly. A titration was considered complete when no more than 0.1 ul/min of titrant had to be added. Since the stability of the set-point depended on the amount of water, the latter should remain nearly constant.
The silver sulfide ISE was found to be reversible as long as the mercuric ion concentration did not exceed 1 mff. Nitric acid was required in the absorption solution and in the titrant in order to prevent the precipitation of mercuric salts. Reducing agents stronger than hydrogen peroxide could not be used in the absorbing solution, since mercuric ion would then also be reduced. Furthermore, if the concentration of hydrogen peroxide exceeds 1.2% (v/v), the sulfide in the silver sulfide crystal of the electrode will be oxidized. Some results are shown in Table 23. One determination required about 15 min; the relative standard deviation was about 1%. Sample size varied from 1 to 4 mg.
Table 23. Determination of halogens in volatile organic compounds.
Substance
Boiling No. of Halogen content Relative point, deter- Theory, Found, std dev, "C minations % % %
CC1, (B.D.H. standard)
CH 2C1 4 (Merck, "Dvasol")
C 2C1 4 (Merck, "Uvasol")
CHCl 3a (Merck, p.a.)
C 2H 5Br (Merck, "for synthesis")
CH Br (Baker, 99.5% purity)
CHBr, (B.D.H., G1C standard)
76.7
39.7
121.0
62
38.4
4.5
3.50.0
17
5
2
10
7
5
5
92.19
83.56
85.52
89.10
72.55b
83.74
94.85
92.1,
83.4„ 85.6,
89.2, 72.1,
83.6„ 95.5C
1.04
1.04
1.29
1.44
1.02
0.82
Injected with a 10-pl syringe weighed on a 10-ug balance. Determined by the Schoniger flask method.
36
Experiments were performed to clarify the mechanism of the interaction of mercuric ion with the silver sulfide electrode. A one-electron Nerstian slope of 60 mV was observed with mercuric ions, which can be explained by the assumption that the following ion-exchange process occurs on the surface of the silver sulfide crystal:
H g 2 + + Ag 2S (crystal)
(AgHgS)+ (crystal) + Ag +
The presence of mercury on the surface of a silver sulfide crystal was confirmed by ;:-ray fluorescence measurements. The mercury response disappears when the crystal is polished with emery paper.
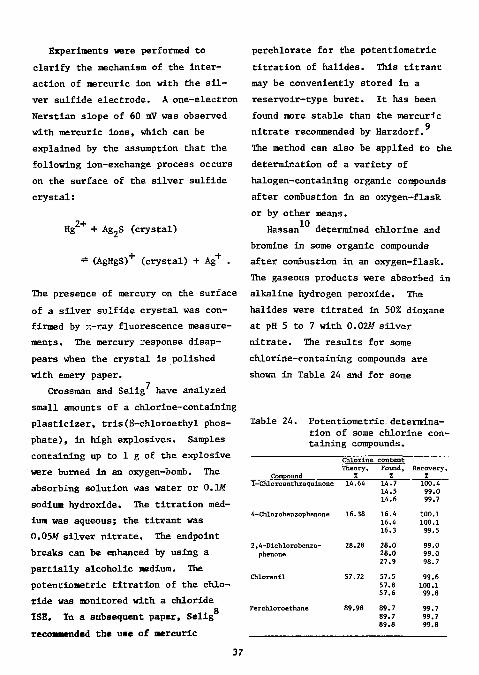
Crossman and Selig have analyzed small amounts of a chlorine-containing plasticizer, tris(8-chloroethyl phosphate), in high explosives. Samples containing up to 1 g of the explosive were burned in an oxygen-bomb. The absorbing solution was water or O.lAf sodium hydroxide. The titration medium was aqueous; the titrant was 0.05W silver nitrate. The endpoint breaks can be enhanced by using a partially alcoholic medium. The potentiometric titration of the chloride was monitored with a chloride
o ISE. In a subsequent paper, Selig recommended the use of mercuric
37
perchlorate for the potentiometric titration of halides. This titrant may be conveniently stored in a reservoir-type buret. It has been found more stable than the mercuric
9 nitrate recommended by Harzdorf. The method can also be applied to the determination of a variety of halogen-containing organic compounds after combustion in an oxygen—flask or by other means.
Hassan determined chlorine and bromine in some organic compounds after combustion in an oxygen-flask. The gaseous products were absorbed in alkaline hydrogen peroxide. The halides were titrated in 50% dioxane at pH 5 to 7 with 0.02M silver nitrate. The results for some chlorine-containing compounds are shown in Table 24 and for some
Table 24. Potentiometric determination of some chlorine containing compounds.
Compound
Chlorine Theory,
% content Found, % Recovery,
X 1-Chloroanthraquinone 14.64 14.7
14.5 14.6
100.4 99.0 99.7
4-Chlorobenzophenone 16.38 16.4 16.4 16.3
100.1 100.1 99.5
2,4-Dichlorobenzo-phenone
28.28 28.0 28.0 27.9
99.0 99.0 98.7
Chloranil 57.72 57.5 57.8 57.6
99.6 100.1 99.8
Perchloroethane 89.98 89.7 89.7 89.8
99.7 99.7 99.8
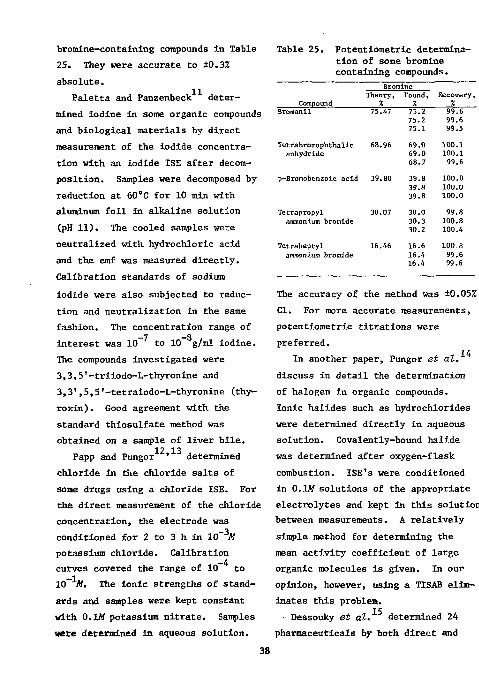
bromine-containing compounds in Table 25. They were accurate to ±0.32 absolute.
Paletta and Panzenbeck determined iodine in some organic compounds and biological materials by direct measurement of the iodide concentration with an iodide ISE after decomposition. Samples were decomposed by reduction at 60"C for 10 min with aluminum foil in alkaline solution (pH 11). The cooled samples were neutralized with hydrochloric acid and the emf was measured directly. Calibration standards of sodium iodide were also subjected to reduction and neutralization in the same fashion. The concentration range of
—7 —S interest was 10 to 10 g/ml iodine. The compounds investigated were 3,3,5'-triiodo-L-thyronine and 3,3', 5,5'-tetraiodo-L-thyronine (thyroxin). Good agreement with the standard thiosulfate method was obtained on a sample of liver bile.
12 13 Papp and Pungor ' determined chloride in the chloride salts of some drugs using a chloride ISE. For the direct measurement of the chloride concentration, the electrode was conditioned for 2 to 3 h in 10 M
potassium chloride. Calibration -4 curves covered the range of 10 to
10 M. The ionic strengths of standards and samples were kept constant with 0.1M potassium nitrate. Samples were determined in aqueous solution.
Table 25. Potentiometric determination of some bromine containing compounds.
Bromine Compound
Theory, Found, 7, 7.
Recovery, 7.
Bromanil 75.47 75.2 75.2 75.1
99.6 99.6 99.5
Tetrabromophthalic 68.96 69.0 100.1 anhydride 69.0 100.1
68.7 99.6 p-Bromobenzoic acid 39.80 39.8 100.0
39.« 100.0 39.8 100.0
Tetrapropyl 30.07 30.0 99.8 ammonium bromide 30.3 100.8
30.2 100.4 letraheptyl 16.46 16.6 100 8 ammonium bromide 16.4 99.6
16.4 99.6
The accuracy of the method was ±0.05% CI. For more accurate measurements, potentiometric titrations were preferred.
In another paper, Pungor et at.
discuss in detail the determination of halogen in organic compounds. Ionic halides such as hydrochlorides were determined directly in aqueous solution. Covalently-bound halide was determined after oxygen-flask combustion. ISE's were conditioned in 0.1M solutions of the appropriate electrolytes and kept in this solution between measurements. A relatively simple method for determining the mean activity coefficient of large organic molecules is given. In our opinion, however, using a TISAB eliminates this problem.
Dessouky et at. determined 24 pharmaceuticals by both direct and
38
indirect potentiometric methods. As 14 above, dissociated halides were
determined directly; covalently-Bound halide, after oxygen-flask combustion. The solutions were neutralized after combustion with 2Af nitric acid to the methyl red endpoint and diluted to a known volume. The ionic strength was calculated and adjusted to that of the standards, which were maintained at 0.1A? by means of sodium nitrate. Again, the use of a T1SAB would eliminate the necessity of calculating the ionic strength. The compounds investigated fall into the following groups: Group A: Medical dyes. Group B: Anticancer or cytostatic
compounds. Group C: Antibiotics. Group D: Official pharmaceutical com
pounds whose molecules contain both dissociated and undissociated halogen.
Group E: Official pharmaceutical compounds whose molecules contain both dissociated and undissociated different halogens.
Group F: Official pharmaceutical compounds containing only undissociated halogen.
Group G: Official pharmaceutical compounds containing undissociated different halogens.
Group H: Miscellaneous pharmaceutical compounds.
The ISE's were pretreated before _3
use in 10 M solutions of the appropriate halide. For compounds containing iodine and chlorine, iodine was first determined using an iodide ISE without interference from the chloride. Before the determination of chloride, the iodide had to be completely removed or deactivated. This was accomplished by taking a suitable aliquot, acidifying with nitric acid, and adding permanganate solution until the solution began to turn pink. The solution was then neutralized with potassium hydroxide and diluted to volume; the chloride content was measured with a chloride ISE. The values were not as accurate as those obtained by potentionetric titration; they were, however, within 2 to 3% of these values. Potentiometric titrations were carried out with standard silver nitrate in a slightly acid solution. If the solution contained more than one halide ion, e.g. chloride and iodide, the titrations were carried out with an iodide ISE. Results of the analyses are shown in Table 26. The standard deviation for the results By potentiometric titration was 0.56%.
Kalman et at. have determined some alkaloid halides by potentiometric titration with 0.01W silver nitrate in an aqueous medium acidified with nitric acid. The hydrochlorides of ethylmorpholine, quinine,
39
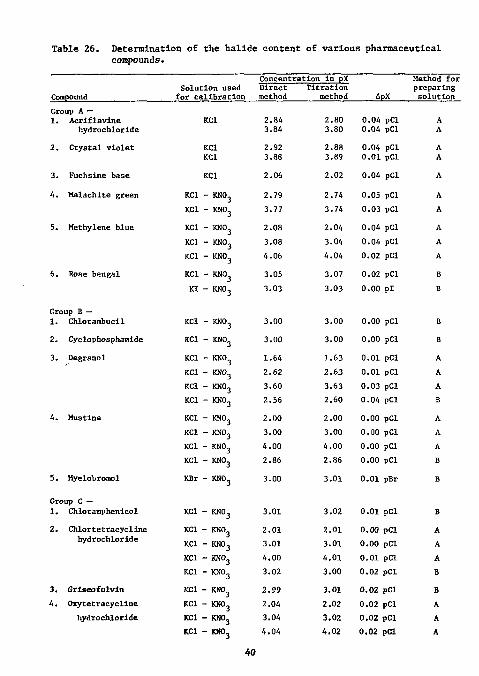
Table 26. Determination of the hallde content of various pharmaceutical compounds.
Compound Solution used
for calibration
Concentration in pX Direct Titration method method ZlpX
Method for preparing solution
Group A — 1. Acriflavine
hydrochloride KCl 2.84
3.84 2.80 3.80
0.04 pCl 0.04 pCl
A A
2. Crystal violet KCl KCl
2.92 3.88
2.88 3.89
0.04 pCl 0.01 pCl
A A
3. Fuchsine base KCl 2.06 2.02 0.04 pCl A 4. Malachite green KCl - KN0 3 2.79 2.74 0.05 pCl A
KCl - KN0 3 3.77 3.74 0.03 pCl A 5. Methylene blue KCl - KNO 2.08 2.04 0.04 pCl A
KCl - KNOj 3.08 3.04 0.04 pCl A KCl - KN0 3 4.06 4.04 0.02 pCl A
6. Rose bengal KCl - KNO 3.05 3.07 0.02 pCl B KI - KN0 3 3.03 3.03 0.00 pi B
Group B — 1. Chlorambucil KCl - KNO, 3.00 3.00 0.00 pCl B 2. Cyclophosphamide KCl - KNO 3.00 3.00 0.00 pCl B 3. Degranol KCl - KNO 1.64 1.63 0.01 pCl A
KCl - KNOj 2.62 2.63 0.01 pCl A KCl - KNOj 3.60 3.63 0.03 pCl A KCl - KN0 3 2.56 2.60 0.04 pCl B
4. Mustine KCl - KN0 3 2.00 2.00 0.00 pCl A KCl - KNOj 3.00 3.00 0.00 pCl A KCl - KN0 3 4.00 4.00 o.oo pci A KCl - KNOj 2.86 2.86 0.00 pCl B
5. Myelobromol KBr - KNOj 3.00 3.01 0.01 pBr B
Group C — 1. Chloramphenicol KCl - KNOj 3.01 3.02 0.01 pCl B 2. Chlortetracycline
hydrochloride KCl - KNO KCl - KN0 3
2.01 3.01
2.01 3.01
o.oo pci 0.00 pCl
A A
KCl - KN0 3 4.00 4.01 0.01 pCl A KCl - KN0 3 3.02 3.00 0.02 pCl B
3. Griseofulvin KCl - KNO 2.99 3.01 0.02 pCl B 4. Oxy tetracycline KCl - KJK>3 2.04 2.02 0.02 pCl A
hydrochloride KCl - KN0 3 3.04 3.02 0.02 pCl A KCl - KNO, 4.04 4.02 0.02 pCl A
40
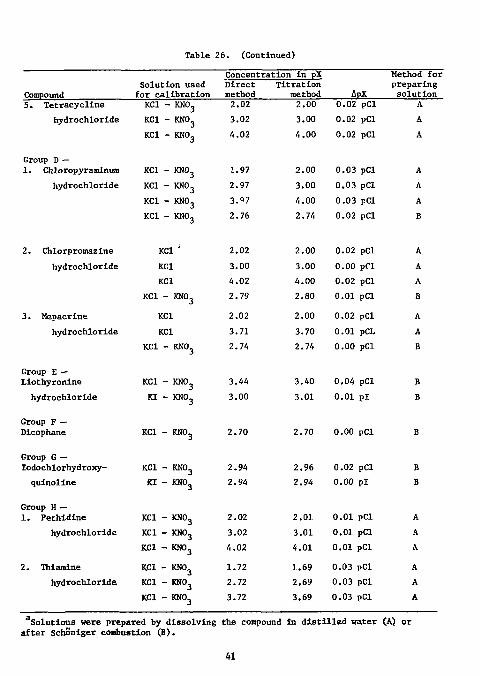
Table 26. (Continued)
Compound Solution used for calibration
Concentration in pX Direct Titration method method ApX
Method for preparing solution
5. Tetracycline KC1 - KNO, 2.02 2.00 0.02 pCl A hydrochloride KC1 - KNOj 3.02 3.00 0.02 pCl A
KC1 - KN0 3 A.02 4.00 0.02 pCl A
Group D — 1. Chloropyraminura KC1 - KNO. 1.97 2.00 0.03 pCl A
hydrochloride KC1 - KNO, 2.97 3.00 0.03 pCl A KC1 - KNO, 3."7 4.00 0.03 pCl A KC1 - KNOj 2.76 2.74 0.02 pCl B
2. Chlorpromazine KC1 ' 2.02 2.00 0.02 pCl A hydrochloride KC1 3.00 3.00 0.00 pCl A
KC1 4.02 4.00 0.02 pCl A KC1 - KNO, 2.79 2.80 0.01 pCl B
3. Mepacrine KC1 2.02 2.00 0.02 pCl A hydrochloride KC1 3.71 3.70 0.01 pCL A
KC1 - KH0 3 2.74 2.74 0.00 pCl B
Group E — Liothyronine KC1 - KN0 3 3.44 3.40 0.04 pCl B hydrochloride KI - KN0 3 3.00 3.01 0.01 pi B
Group F — Dicophane KC1 - KNOj 2.70 2.70 0.00 pCl B
Group G — Iodochlorhydroxy- KC1 - KNOj 2.94 2.96 0.02 pCl B quinoline KI - KNOj 2.94 2.94 0.00 pi B
Group H — 1. Pethidine KC1 - KNOj 2.02 2.01 0.01 pCl A
hydrochloride KC1 - KN0 3 3.02 3.01 0.01 pCl A KC1 - KN0 3 4.02 4.01 0.01 pCl A
2. Thiamine KC1 - KNO, 1.72 1.69 0.03 pCl A hydrochloride KC1 - KN0 3 2.72 2.69 0.03 pCl A
KC1 - KN0 3 3.72 3.69 0.03 pCl A
aSolutions were prepared by dissolving the compound in distilled water CA) or after Schb'niger combustion (B).
41
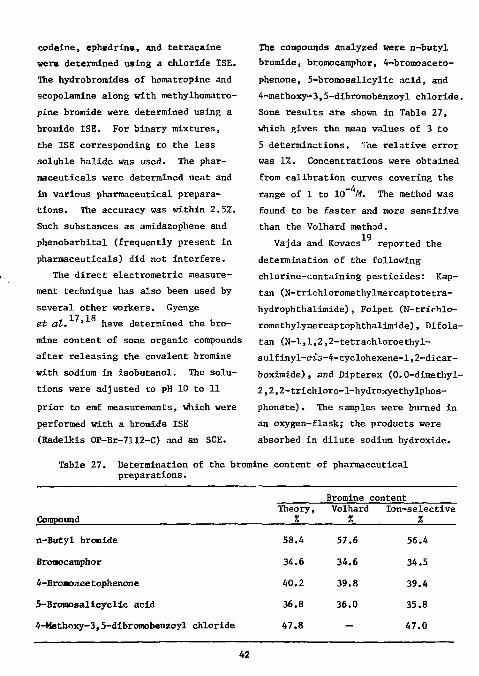
codeine, ephedrine, and tetracaine were determined using a chloride ISE. The hydrobromides of homatropine and scopolamine along with methylhomatro-pine bromide were determined using a bromide ISE. For binary mixtures, the ISE corresponding to the less soluble halide was used. The pharmaceuticals were determined neat and in various pharmaceutical preparations. The accuracy was within 2.5%. Such substances as amidazophene and phenobarbital (frequently present in pharmaceuticals) did not interfere.
The direct electrometric measurement technique has also been used by several other workers. Gyenge
17 18 et al. ' have determined the bromine content of some organic compounds after releasing the covalent bromine with sodium in isobutanol. The solutions were adjusted to pH 10 to 11 prior to emf measurements, which were performed with a bromide ISE (Radelkis OP-Br-7112-C) and an SCE.
The compounds analyzed were n-butyl bromide, bromocamphor, 4-bromoaceto-phenone, 5-bromosalicylic acid, and 4-methoxy-3,5-dibromobenzoyl chloride. Some results are shown in Table 27, which gives the mean values of 3 to 5 determinations, 'ihe relative error was 1%. Concentrations were obtained from calibration curves covering the range of 1 to 10 M. The method was found to be faster and more sensitive than the Volhard method.
19 Vajda and Kovacs reported the
determination of the following chlorine-containing pesticides: Kap-tan (H-trichloromethylmercaptotetra-hydrophthalimide), Folpet (N-trichlo-romethylymercaptophthalimide), Difola-tan (N-l,l,2,2-tetrachloroethyl-sulfinyl-eis-4-cyclohexene-l,2-dicar-boximide), and Dipterex (0.0-dimethyl-2,2,2-trichloro-1-hydroxyethylphos-phonate). The samples were burned in an oxygen-flask; the products were absorbed in dilute sodium hydroxide.
Table 27. Determination of the bromine content of pharmaceutical preparations.
Bromine content
Compound Theory, % Volhard
% Ion-selective
%
58.4 57.6 56.4
34.6 34.6 34.5
40.2 39.8 39.4
36.8 36.0 35.8
47.8 — 47.0
n-Butyl bromide
Bronocamphor
4-Broaoacetophenone
5-Bromosalicyclic acid
4-Methoxy-3,5-dibromobenzoyl chloride
42
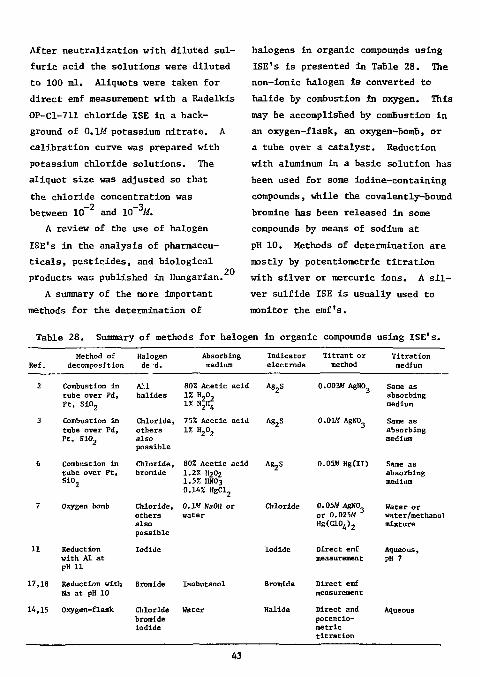
After neutralization with diluted sulfuric acid the solutions were diluted to 100 ml. Aliquots were taken for direct emf measurement with a Radelkis 0P-C1-711 chloride ISE in a background of 0.1M potassium nitrate. A calibration curve was prepared with potassium chloride solutions. The aliquot size was adjusted so that the chloride concentration was between 10~ 2 and 10 - 3M.
A review of the use of halogen ISE's in the analysis of pharmaceuticals, pesticides, and biological products was published in Hungarian.
A summary of the more important methods for the determination of
20
halogens in organic compounds using ISE's is presented in Table 28. The non-ionic halogen is converted to halide by combustion in oxygen. This may be accomplished by combustion in an oxygen-flask, an oxygen-bomb, or a tube over a catalyst. Reduction with aluminum in a basic solution has been used for some iodine-containing compounds, while the covalently-bound bromine has been released in some compounds by means of sodium at pH 10, Methods of determination are mostly by potentiometric titration with silver or mercuric ions. A silver sulfide ISE is usually used to monitor the emf's.
Tabl e 28. Summary of methods for halogen in organic compounds using ISE 's .
Ref. Method of
decomposit ion Halogen
de :d. Absorbing
medium I n d i c a t o r e l e c t r o d e
T i t r a n t o r method
T i t r a t i o n medium
2 Combustion in cube over Fd, P t , S i 0 2
All h a l i d e s
80% Acet ic ac id 1% H-0 ?
1% NjKj
Ag 2S 0.003W AgNO Same as absorbing medium
3 Combustion In tube over Pd, P t , S i 0 2
Chlor ide , o t h e r s a l s o p o s s i b l e
75% Acet ic ac id 1% H 2 0 2
Ag2S 0 .OUtf AgNO Same as absorbing medium
6 Combustion in tube over P t , S i 0 2
Chlor ide , bromide
80% Acet ic ac id 1.2% H 2 0 2
1.5% HN03
0.14% HgCl 2
Ag 2S 0.05M Hg(II) Same a s absorb ing medium
7 Oxygen bomb Chlor ide , o t h e r s a l s o p o s s i b l e
0.1W NaOH o r water
Chloride 0.05M AgNO or 0.025W J
Hg<C10 4) 2
Water o r water /methanol mixture
11 Reduction wi th Al a t pH 11
Iodide Iodide Di rec t emf measurement
Aqueous, pH 7
17,18 Reduction wi th Na a t pH 10
Bromide Isobutanol Bromide Di rec t emf measurement
1^,15 Oxygen-flask
111 Water Hal ide Di rec t and p o t e n t l o -roetric t i t r a t i o n
Aqueous
43
References
1. E. C. Olsen, "Organic Analysis: Chlorine, Bromine, and Iodine," in Txeati.se on Analytical Chemistry, Part II, Vol. 14, I. M. Kolthoff and P. J. Elving, Eds. (Interscience, New York, 1971) p. 1.
2. W. Krijgsman, B. Griepink, J. F. Mansveld, and W. J. van Oort, Mikroohim. Acta, 1970, 793.
3. W. Krijgsman and B. Griepink, 6th International Symposium on Microtechniques, Graz, Austria, Sept. 7-11, 1970, p. 129.
4. J. Slanina, J. Agterdenbos, and B. Griepink, Mikroohim. Acta, 1970, 1225. 5. W. Krijgsman, J. F. Mansveld, and B. Griepink, Z. Anal. Chem., 249, 368
(1970). 6. W. Potman and E. A. M. F. Dahmen, Mikroohim. Aata, 1972, 303. 7. G. L. Crossman and W. Selig, Lawrence Livermore Laboratory, Livermore,
Calif., Rept. UCID-15444 (1969); cf. Chem. Abstr. 71, 5025n (1969). 8. W. Selig and G. L. Crossman, Lawrence Livermore Laboratory, Livermore,
Calif., Rept. UCID-15623 (1970). 9. C. Harzdorf, Z. anal. Chem., 215, 246 (1966). 10. S. S. M. Hassan, Z. anal. Chem., ^66, 272 (1973). 11. B. Paletta and K. Panzenbeck, Clin. Chim. Aata, 26_, 11 (1969). 12. E. Papp and E. Pungor, Z. anal. Chem., 250, 31 (1970). 13. E. Papp and E. Pungor, Magy. Kern. Foly., J7J5, 573 (1970); through Chem.
Abstr., 74_, 57358e (1971). 14. E. Pungor, K. Toth, and M. K. Papay, Chem. Analit. (Warsaw), 17_, 947
(1972) ; cf. Chem. Abstr., 78, 92293J (1973). 15. Y. M. Dessouky, K. Toth, and E. Pungor, Analyst, 95_, 1027 (1970). 16. J. Kalman, K. Toth, and D. Kuttel, Acta Pharm. Hung., 41, 267 (1971);
through Chem. Abstr., 76, 50003t (1972). 17. R. Gyenge, J. Liptak, and J. Szava, Lucr. Conf. Nat. Chim. Anal., 3rd, \ ,
639 (1971); through Chem Abstr., T±, 148573d (1972). 18. R. Gyenge and J. Liptak, Proa. Conf. Appl. Phys. Chem., 2nd, 1, 639 (1971);
through Chem. Abstr., 76, 67951y (1972). 19. L. Vajda and J. Kovacs, Hung. Sai. Instruments, 20_, 31 (1971). 20. D. Kuettel, Kern. Kozlem., 38, 235 (1972); through Chem. Abstr., jHS,
88628e (1973).
44
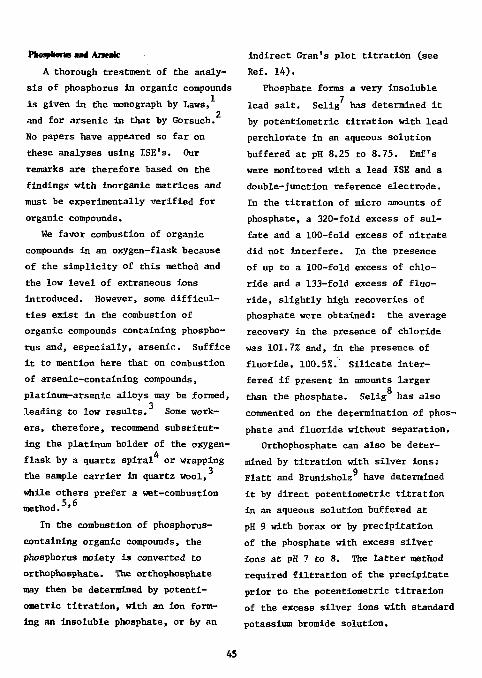
Pfcoapkone ami Anemc A thorough treatment of the analy
sis of phosphorus in organic compounds is given in the monograph by Laws,
2 and for arsenic in that by Gorsuch. No papers have appeared so far on these analyses using ISE's. Our remarks are therefore based on the findings with inorganic matrices and must be experimentally verified for organic compounds.
We favor combustion of organic compounds in an oxygen-flask because of the simplicity of this method and the low level of extraneous ions introduced. However, some difficulties exist in the combustion of organic compounds containing phosphorus and, especially, arsenic. Suffice it to mention here that on combustion of arsenic-containing compounds, platinum-arsenic alloys may be formed,
3 leading to low results. Some workers, therefore, recommend substituting the platinum holder of the oxygen-
4 flask by a quartz spiral or wrapping 3 the sample carrier in quartz wool, while others prefer a wet^combustion method. 5' 6
In the combustion of phosphorus-containing organic compounds, the phosphorus moiety is converted to orthophosphate. The orthophosphate may then be determined by potenti-ometric titration, with an ion forming an insoluble phosphate, or by an
indirect Gran's plot titration (see Ref. 14).
Phosphate forms a very insoluble lead salt. Selig has determined it by potentiometric titration with lead perchlorate in an aqueous solution buffered at pH 8.25 to 8.75. Emf's were monitored with a lead ISE and a double-junction reference electrode. In the titration of micro amounts of phosphate, a 320-fold excess of sulfate and a 100-fold excess of nitrate did not interfere. In the presence of up to a 100-fold excess of chloride and a 133-fold excess of fluoride, slightly high recoveries of phosphate were obtained: the average recovery in the presence of chloride was 101.1% and, in the presence of fluoride, 100.5%.' Silicate interfered if present in amounts larger
Q
than the phosphate. Selig has also commented on the determination of phosphate and fluoride without separation.
Orthophosphate can also be determined by titration with silver ions:
g Flatt and Brunisholz have determined it by direct potentiometric titration in an aqueous solution buffered at pH 9 with borax or by precipitation of the phosphate with excess silver ions at pH 7 to 8. The latter method required filtration of the precipitate prior to the potentiometric titration of the excess silver ions with standard potassium bromide solution.
45
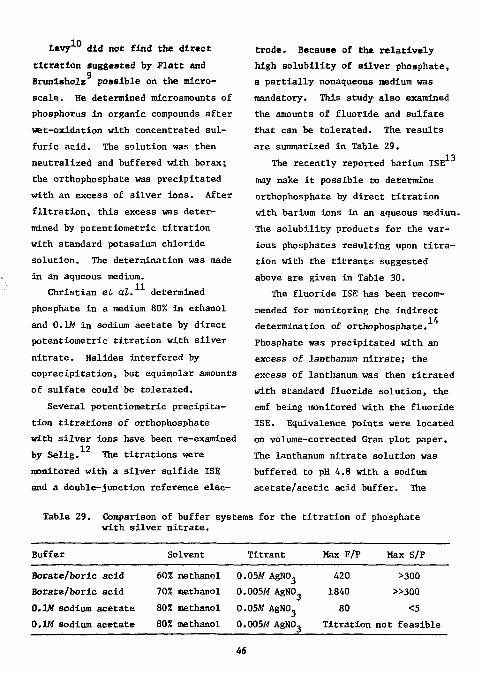
Levy 1 0 did not find the direct titration suggested by Flats and
9 Brunisholz possible on the micro-scale. He determined microamounts of phosphorus in organic compounds after wet-oxidation with concentrated sulfuric acid. The solution was then neutralized and buffered with borax; the orthophosphate was precipitated with an excess of silver ions. After filtration, this excess was determined by potentiometric titration with standard potassium chloride solution. The determination was made in an aqueous medium.
Christian et at. determined phosphate in a medium 80% in ethanol and 0.1W in sodium acetate by direct potentiometric titration with silver nitrate. Halides interfered by coprecipitation, but equimolar amounts of sulfate could be tolerated.
Several potentiometric precipitation titrations of orthophosphate with silver ions have been re-examined
12 by Selig. The titrations were monitored with a silver sulfide ISE and a double-junction reference elec
trode. Because of the relatively high Bolubility of silver phosphate, a partially nonaqueous medium was mandatory. This study also examined the amounts of fluoride and sulfate that can be tolerated. The results are summarized in Table 29,
13 The recently reported barium ISE may make it possible to determine orthophosphate by direct titration with barium ions in an aqueous medium. The solubility products for the various phosphates resulting upon titration with the titrants suggested above are given in Table 30.
The fluoride ISE has been recommended for monitoring the indirect
14 determination of orthophosphate. Phosphate was precipitated with an excess of lanthanum nitrate; the excess of lanthanum was then titrated with standard fluoride solution, the emf being monitored with the fluoride ISE. Equivalence points were located on volume-corrected Gran plot paper. The lanthanum nitrate solution was buffered to pH 4.8 with a sodium acetate/acetic acid buffer. The
Table 29. Comparison of buffer systems for the titration of phosphate with silver nitrate.
Buffer Solvent Titrant Max F/P Max S/P
Borate/boric acid Borate/boric acid 0.1W sodium acetate 0.1M sodium acetate
60% methanol 0.05W AgNO. 70% methanol 0.005M AgN0 3
80% methanol 0.05M AgNO, 80% methanol 0.005M AgNOj
420 >300 1840 »300
80 <5 Titration not feasible
46
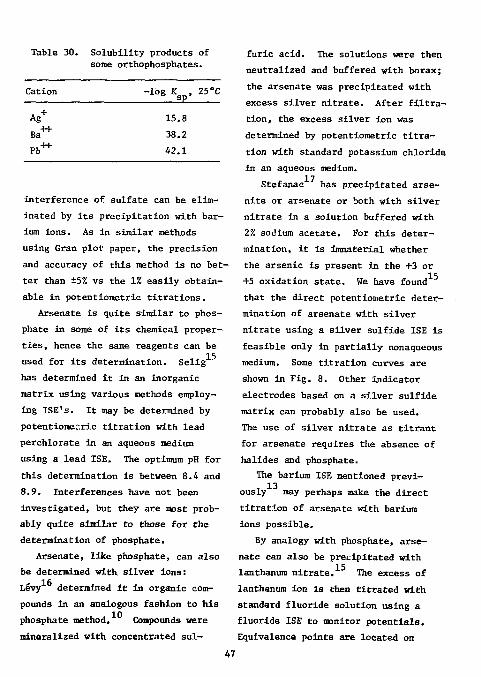
Table 30. Solubility products of some orthophosphates.
Cation -log K , 25 °C SP
Ba +
Pb +
15.8 38.2 42.1
interference of sulfate can be eliminated by its precipitation with barium ions. As in similar methods using Gran plot paper, the precision and accuracy of this method is no better than ±5% vs the 1% easily obtainable in potentiometric titrations.
Arsenate is quite similar to phosphate in some of its chemical properties, hence the same reagents can be used for its determination. Selig has determined it in an inorganic matrix using various methods employing ISE's. It may be determined by potentiomeiric titration with lead perchlorate in an aqueous medium using a lead ISE. The optimum pH for this determination is between 8.4 and 8.9. Interferences have not been investigated, but they are most probably quite similar to those for the determination of phosphate.
Arsenate, like phosphate, can also be determined with silver Ions: Levy determined It In organic compounds in an analogous fashion to his phosphate method. Compounds were mineralized with concentrated sul
furic acid. The solutions were then neutralized and buffered with borax; the arsenate was precipitated with excess silver nitrate. After filtration, the excess silver ion was determined by potentiometric titration with standard potassium chloride in an aqueous medium.
Stefanac has precipitated arse-nite or arsenate or both with silver nitrate in a solution buffered with 2% sodium acetate. For this determination, it is immaterial whether the arsenic is present in the +3 or +5 oxidation state. We have found that the direct potentiometric determination of arsenate with silver nitrate using a silver sulfide ISE is feasible only in partially nonaqueous medium. Some titration curves are shown in Fig. 8. Other indicator electrodes based on a silver sulfide matrix can probably also be used. The use of silver nitrate as titrant for arsenate requires the absence of halides and phosphate.
The barium ISE mentioned previ-13 ously may perhaps make the direct
titration of arsenate with barium ions possible.
By analogy with phosphate, arsenate can also be precipitated with lanthanum nitrate. The excess of lanthanum ion is then titrated with standard fluoride solution using a fluoride ISE to monitor potentials. Equivalence points are located on
47
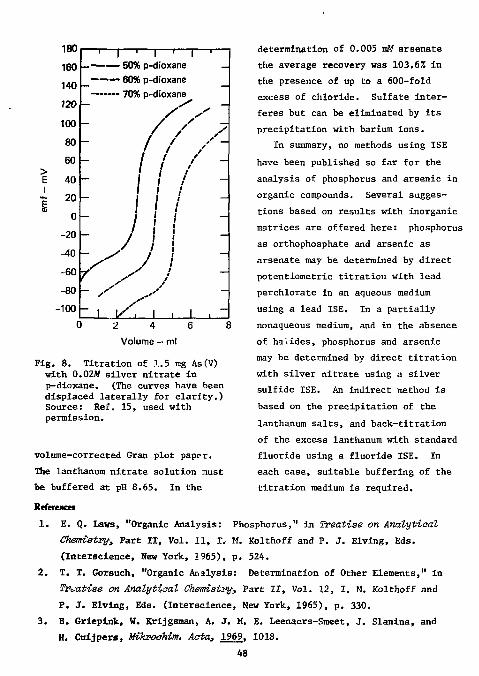
180
160
I | I | . | i
- — — 50% p-dioxane _ _ — 60% p-dioxane
140
120 S* -
/ X 100
80 - / / -60
> : / / " E 40 1 / -E 2 0 1 i " 0
; / -20 t y i | : -40 t y i | : / y / -60 r X J -80 - / y -100 i i / , i , i ,
C 2 4 6 8
Volume — ml
Fig. 8. Titration of 1.5 mg As(V) with 0.02M silver nitrate in p-dioxane. (The curves have been displaced laterally for clarity.) Source: Ref. 15, used with permission.
determination of 0.005 mW arsenate the average recovery was 103.6% in the presence of up to a 600-fold excess of chloride. Sulfate interferes but can be eliminated by its precipitation with barium ions.
In summary, no methods using ISE have been published so far for the analysis of phosphorus and arsenic in organic compounds. Several suggestions based on results with inorganic matrices are offered here: phosphorus as orthophosphate and arsenic as arsenate may be determined by direct potentiometric titration with lead perchlorate in an aqueous medium using a lead ISE. In a partially nonaqueous medium, and in the absence of halides, phosphorus and arsenic may be determined by direct titration with silver nitrate using a silver sulfide ISE. An indirect method is based on the precipitation of the lanthanum salts, and back-titration of the excess lanthanum with standard fluoride using a fluoride ISE. In each case, suitable buffering of the titration medium is required.
volume-corrected Gran plot paper. The lanthanum nitrate solution must be buffered at pH 8.65. In the
References
1. E. Q. Laws, "Organic Analysis: Phosphorus," in Treatise on Analytical
Chemistry, Part XI, Vol. 11, r. M. Kolthoff and P. J. Elving, Eds. (Interscience, New York, 1965), p. 524.
2. T. T. Gorsuch, "Organic Analysis: Determination of Other Elements," in Treatise on Analytical Chemistry, Part II, Vol. 12, I. M. Kolthoff and P. J. Elving, Eds. (Interscience, New York, 1965), p. 330.
3. B. Griepink, W. Krijgsman, A. J. M. E. Leenaers-Smeet, J. Slanina, and H. Cuijpers, Mikroohim. Acta, 1969. 1018.
48
4. W. Merz, Mikrochim. Acta, 1959, 456. 5. R. Belcher, A. M. G. MacDonald, and T. S. West, Talanta, 1, 408 (1958). 6. M. M. Tuckerman, J. D. Hodecker, B. C. Southworth, and K. D. Fleischer,
Analyt. Chim. Acta, 21, 463 (1959). 7. W. Selig, Mikrochim. Acta, 1970, 564. 8. W. Selig, Mikrochim. Acta, 1974, 515. 9. R. Flatt and G. Brunisholz, Analyt. Chim. Acta, 1_, 124 (1947).
10. R. Levy, Compt. fend., 236, 1781 (1953). 11. G. D. Christian, E. C. Rnoblock, and W. C. Purdy, Anal. Chem., J5_, 1869
(1963). 12. W. Selig, Mikrochim. Acta, 1976 II, 9. 13. R. J. Levins, Mikrochim. Acta, 43_, 1045 (1971). 14. Orion Research, Inc., Newsletter, 2> 6 (1971). 15. W. Selig, Mikrochim. Acta, 1973, 349. 16. R. Levy, Compt. rend., 238, 2320 (1954). 17. 2. Stefanac, Mikrochim. Acta, 1962, 1115.
49
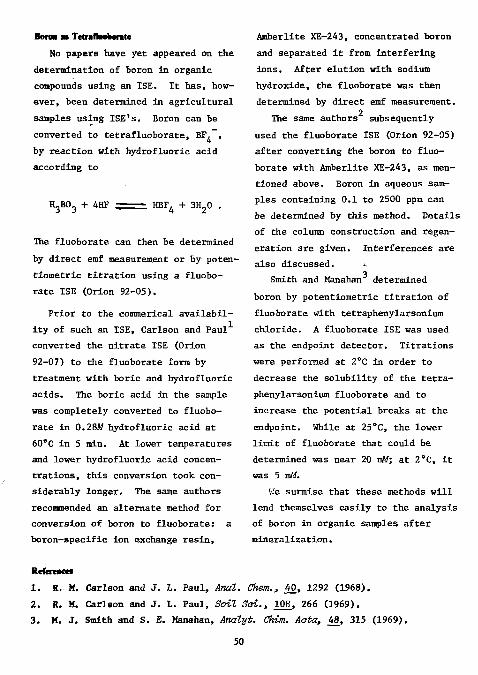
Boron is Tetaflwhorate No papers have yet appeared on the
determination of boron in organic compounds using an ISE. It has, however, been determined in agricultural samples using ISE's. Boron can be converted to tetrafluoborate, BF, , by reaction with hydrofluoric acid according to
H,B0, + 4HF HBF^ + 3H„0
The fluoborate can then be determined by direct emf measurement or by poten-tiometric titration using a fluoborate ISE (Orion 92-05).
Prior to the commerical availability of such an ISE, Carlson and Paul converted the nitrate ISE (Orion 92-07) to the fluoborate form by treatment with boric and hydrofluoric acids. The boric acid in the sample was completely converted to fluoborate in 0.28W hydrofluoric acid at 60°C in 5 min. At lower temperatures and lower hydrofluoric acid concentrations, this conversion took considerably longer. The same authors recommended an alternate method for conversion of boron to fluoborate: a boron-specific ion exchange resin,
Amberlite XE-243, concentrated boron and separated it from interfering ions. After elution with sodium hydroxide, the fluoborate was then determined by direct emf measurement.
2 The same authors subsequently used the fluoborate ISE (Orion 92-05) after converting the boron to fluoborate with Amberlite XE-243, as mentioned above. Boron in aqueous samples containing 0.1 to 2500 ppm can be determined by this method. Details of the column construction and regeneration are given. Interferences are also discussed. *. 3 Smith and Manahan determined boron by potentiometric titration of fluoborate with tetraphenylarsonium chloride. A fluoborate ISE was used as the endpoint detector. Titrations were performed at 2°C in order to decrease the solubility of the tetraphenylarsonium fluoborate and to increase the potential breaks at the endpoint. While at 25°C, the lower Unit of fluoborate that could be determined was near 20 mW; at 2°C, it was 5 mM.
We surmise that these methods will lend themselves easily to the analysis of boron in organic samples after mineralization.
RHereacef 1. E. M. Carlson and J. L. Paul, Anal. Ckem., 40, 1292 (1968). 2. R. M. Carlson and J. L. Paul, Soil Sai., 10B, 266 (1969). 3. M. J. Smith and S. E. Manahan, Analyt. Chim. Aota, ^ 8 , 315 (1969).
50
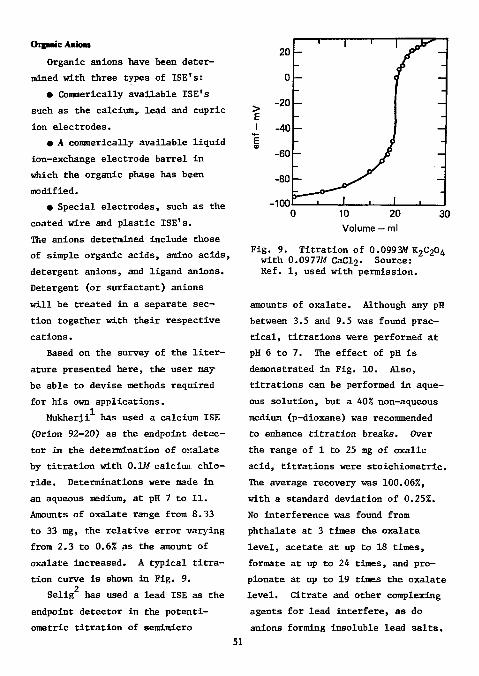
Organic Aiiioiu
Organic anions have been determined with three types of ISE's:
• Comnerically available ISE's such as the calcium,, lead and cupric ion electrodes.
• A commerically available liquid ion-exchange electrode barrel in which the organic phase has been modified.
• Special electrodes, such as the coated wire and plastic ISE's. The anions determined include those of simple organic acids, amino acids, detergent anions, and ligand anions. Detergent (or surfactant) anions will be treated in a separate section together with their respective cations.
Based on the survey of the literature presented here, the user may be able to devise methods required for his own applications.
Mukherji has used a calcium ISE (Orion 92-20) as the endpoint detector in the determination of oxalate by titration with O.lAf calciun chloride. Determinations were made in an aqueous medium, at pH 7 to 11. Amounts of oxalate range from 8.33 to 33 mg, the relative error varying from 2.3 to 0.6% as the amount of oxalate increased. A typical titration curve is shown in Fig. 9.
2 Selig has used a lead ISE as the
endpoint detector in the potenti-ometric titration of semimicro
20
0 : p > " 2 0
E J. ~40
1 -60
-80
-100 " 1 I 1
-
10 20 Volume — ml
30
Fig. 9. Titration of 0.0993M K 2 C 2 0 4
with 0.0977M CaCl2. Source: Ref. 1, used with permission.
amounts of oxalate. Although any pH between 3.5 and 9.5 was found practical, titrations were performed at pH 6 to 7. The effect of pH is demonstrated in Fig. 10. Also, titrations can be performed in aqueous solution, but a 40% non—aqueous medium (p-dioxane) was recommended to enhance titration breaks. Over the range of 1 to 25 mg of oxalic acid, titrations were stoichiometric. The average recovery was 100.06%, with a standard deviation of 0.25%. No interference was found from phthalate at 3 times the oxalate level, acetate at up to 18 times, formate at up to 24 tines, and propionate at up to 19 times the oxalate level. Citrate and other completing agents for lead interfere, as do anions forming insoluble lead salts.
51
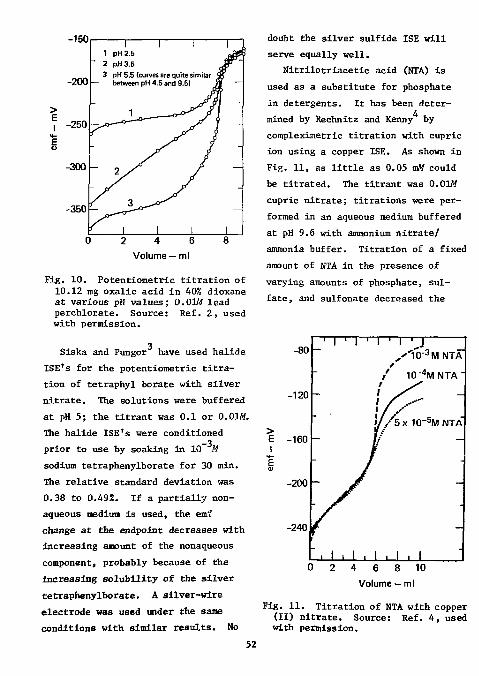
> £ I
4 -E
-150
-200
-250
-300
-350
— i i r 1 pH2.5 2 pH3.5 3 pH 5.5 (curves are quite similar
between pH 4.5 and 9.5)
Fig. 10. Potentiometric titration of 10.12 mg oxalic acid in 40% dioxane at various pH values; 0.01M lead perchlorate. Source: Ref. 2, used with permission.
3 Siska and Pungor have used halide ISE's for the potentiometric titration of tetraphyl borate with silver nitrate. The solutions were buffered at pH 5; the titrant was 0.1 or 0.01M. The halide ISE's were conditioned
_3 prior to use by soaking in 10 M sodium tetraphenylborate for 30 min. The relative standard deviation was 0.38 to 0.49%. If a partially nonaqueous medium is used, the emf change at the endpoint decreases with increasing amount of the nonaqueous component, probably because of the increasing solubility of the silver tetraphenylborate. A silver-wire electrode was used under the same conditions with similar results. No
doubt the silver sulfide ISE will serve equally well.
Nitrilotriacetic acid (NTA) is used as a substitute for phosphate in detergents. It has been deter-4 mined by Rechnitz and Kenny by compleximetric titration with cupric ion using a copper ISE. As shown in Fig. 11, as little as 0.05 mM could be titrated. The titrant was 0.01M cupric nitrate; titrations were performed in an aqueous medium buffered at pH 9.6 with ammonium nitrate/ ammonia buffer. Titration of a fixed amount of NTA in the presence of varying amounts of phosphate, sulfate, and sulfonate decreased the
-80 J ' ' I ' I ' I 'J , " ' 1 0 - 3 M N T A
/ 1 0 - 4 M N T A _
> E I
-120
-160
- '
' JS
J IS >//Sx 1 0 - 5 M N T A
emf - /
-200 Jr —
-240 -
" i l l I . I , I . I 0 2 4 6 8 10
Volume — ml
Fig. 11. Titration of NTA with copper (II) nitrate. Source: Ref. 4, used with permission.
52
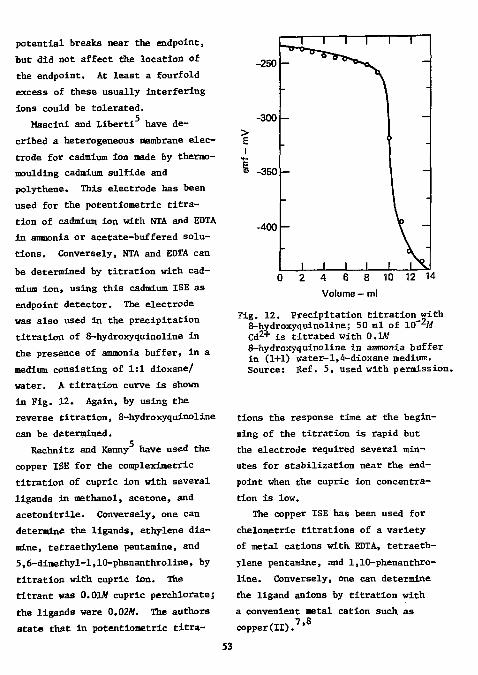
potential breaks near the endpoint, tut did not affect the location of the endpoint. At least a fourfold excess of these usually interfering Ions could be tolerated.
Mascini and Liberti have de-cribed a heterogeneous membrane electrode for cadmium ion made by thermo-moulding cadmium sulfide and polythene. This electrode has been used for the potentiometric titration of cadmium ion with NTA and EDTA in ammonia or acetate-buffered solutions. Conversely, NTA and EDTA can be determined by titration with cadmium ion, using this cadmium ISE as endpoint detector. The electrode was also used in the precipitation titration of 8-hydroxyquinoline in the presence of ammonia buffer, in a medium consisting of 1:1 dioxane/ water. A titration curve is shown in Fig. 12. Again, by using the reverse titration, 8-hydroxyquinoline can be determined.
Rechnitz and Kenny have used the copper ISE for the compleximetric titration of cupric ion with several ligands in methanol, acetone, and acetonitrile. Conversely, one can determine the ligands, ethylene diamine, tetraethylene pentamine, and 5,6-dimethyl-l,10-phenanthroline, by titration with cupric ion. The titrant was 0.01M cupric perchlorate; the ligands were 0.02M. The authors state that in potentiometric titra-
> I
-250 h-
-300 h
-350
-400 H
0 2 4 6 8 10 12 14 Volume — ml
Fig. 12. Precipitation titration with 8-hydroxyquinoline; 50 ml of 10 M C d 2 + is titrated with 0.1M 8-hydroxyquinoline in ammonia buffer in (1+1) water-l,4-dioxane medium. Source: Ref. 5, used with permission.
tions the response time at the beginning of the titration is rapid but the electrode required several minutes for stabilization near the end-point when the cupric ion concentration is low.
The copper ISE has been used for chelometric titrations of a variety of metal cations with EDTA, tetraethylene pentamine, and 1,10-phenanthroline. Conversely, one can determine the ligand anions by titration with a convenient metal cation such as
7 8 copper(II). '
53
Many other anions that react with species that can be measured with ISE's can, no doubt, be determined very readily. An example is the determination of citrate by titra-
9 tion with cupric nitrate. This titration can be monitored with a copper ISE at pH 10 to 12.
Some organic anions have been determined by using commercially available electrode barrels, mainly the Orion calcium electrode (92-90). In each case, the organic phase of the commercial electrode was replaced with one specially prepared.
Coetzee and Freiser described anion-responsive electrodes based on ion-association extraction systems. The following organic salts (a variety of inorganic salts are also discussed) of methyl tricaprylyl ammonium ion (Aliquat 336S) dissolved in 1-decanol functioned as the liquid phases: acetate, formate, propionate, oxalate, benzoate, p-toluenesulfonate, and salicylate. The aqueous reference phase consisted of 0.1M sodium chloride and 0.1M of the appropriate sodium or potassium salt of the organic anion. An Orion 92-20 membrane was used to separate organic and aqueous phases. The organic phase consisted of 10Z (v/v) of Aliquat 336S in 1-decanol, which was converted to the proper form by shaking repeatedly with, an aqueous solu
tion of the sodium salt of the appropriate anion.
Electrodes were conditioned in 0.1M solution of the appropriate ion for 2 to 3 h. Near-Nernstian response was obtained over the range of 10
-4 to 10 M for all the anions with the exception of salicylate, which was linear only to 10 M. Constant emf readings were usually obtained within 1 min; readings were reproducible within ±0.2 mV. The useful life span of the electrodes was one month or longer.
In further work Coetzee and Freiser studied the pH dependency and the effect of interfering anions on the response of their anion selective electrodes. In addition to the previously discussed electrodes, those for m- and p-toluate are described. Electrodes were prepared as described previously. Linear responses were obtained from 10 to -3 -4
10 M, and in some cases to 10 M.
Equilibrium potentials were reached within 20 to 60 s. Changing the Aliquat concentration from 1 to 25% (v/v) did not affect the electrode response. The useful lifespan of the electrodes was from one to two months. Although these electrodes cannot be considered as highly selective, a wide range of useful measurements can be made with them. 12 Haynes and Wagenknecht have described an ISE for measuring the
unreacted salicylate ion concentration during the electroreduction of salicylic acid. As above, an Orion liquid membrane electrode barrel was used with a 92-19 porous membrane separating the organic phase from the test solution. The organic phase was prepared by dissolving tetraheptyl ammonium iodide in 1-decanol and exchanging the iodide for salicylate by repeatedly shaking with an aqueous solution of 0.2M sodium salicylate. The aqueous reference phase was 0.1W in sodium chloride and sodium salicylate. Electrodes were conditioned by soaking overnight in aqueous 0.2M sodium salicylate.
Measurements of emf vs concentration yielded a Nernstian slope (58 mV) from 1 0 - 1 to 10 - 3M, of 51 mV from 10 1 to 1M, and of 48 mV from 10~ 3 to -4 10 M. The response time of the
electrodes was almost instantaneous; measurements were made after 3 min. Samples were adjusted to pH 8.5 before analysis to minimize hydrogen ion interference. The known addition technique was used. Ions such as benzoate and p-hydroxybenzoate respond to the same extent as salicylate; thus, they interfere.
13 Back studied a series of anion-selective electrodes with respect to selectivity characteristics and examined the data in terms of theory of liquid-membrane electrodes. He also used an Orim calcium electrode bar
rel in which the organic liquid phase and the water reference phase were placed using Orion 92-20 membranes as separators. The organic phase consisted of 1M n-tetrahexyl ammonium picrate in methylene chloride. The aqueous phase was O.lAf sodium chloride and 1M sodium perchlorate. The electrodes were conditioned for several hours by immersion in a 1M solution of the salt to be measured. Emf measurements were made under constant conditions: 50 ml of solution was thermostated at 25 ± 0.1°C, electrodes were immersed to a constant depth, and stirring rates were constant.
The picrate ISB.-was tested in pure solutions of the following interfering ions: chloride, nitrate, bromide, iodide, and perchlorate. The activity range examined was from 10 to IM. Equilibrium potentials were established within 20 to 60 s and values were reproducible to ±0.2 mV.
-4 -1 Over the range of 10 to 10 M, all response curves were Nernstian with a slope of 59 mV per activity decade.
The response of the Orion nitrate (Ho. 92-07) and perchlorate (No. 92-81) ISE's to a series of substituted benzoates and phenylacetate ions was
14 studied by Hirsch and Olderman. The relative response was determined by the nature and the extent of interaction between the solutes and the aqueous solvent; the response depends on the size of the substituent,
as well as the position of substitution. The results are comparable to ion-exchange elution sequences and the relative order of liquid extraction equilibrium constants. Since the electrodes are not very specific, a preliminary separation is required before a particular anion can be determined in a mixture. In fact, the response of these ISE's to a mixture of anions is additive. Detection limit- range from 5 x 10™ M
to 2 x l(f 2M. Ishibashi and Jyo prepared a
trifluoroacetate-selective electrode by using an organic solvent solution of the trifluoroacetate salt of crystal violet or of bis(bathophenan-throline)-iron(II)chelate. The
-3 response was linear from 10 to 3 x io~ M, with a slope of 60 mV per decade at 29°C. Potentials were stable within ±0.2 mV over three days; the response time was several seconds. Divalent anions, chloride, fluoride, and acetate did not interfere. Iodide, perchlorate, and thiocyanate interfered seriously.
Jyo et at. ' prepared Ion-selective electrodes responding to maleic and phthalic acids. Membranes were prepared from the organic solvent solution of the ion-pair of the respective acid anion with crystal violet or the tris(ba-thophenanthroline)iron(ir) ion. The electrode response was linear from
56
10 to 10 M for maleic acid at pH 3 to 5, and from 10~ 2 to 1 0 _ 4 , 5 W phthalic acid at pH 3.8 to 4.2. Equilibrium potentials were established within a few seconds and were reproducible within ±0.2 mV.
The electrodes responded only to the monovalent anions of the acids. This is analytically advantageous because the slope of the calibration curve catjube expected to be twice that of the divalent maleate or phthalate ions. Interference from acetate, benzoate, and chloride was extremely low; iodide and perchlorate, however, interfered seriously. Fumaric acid does not interfere with the maleic acid electrode. Iso-phthalic and terephthalic acids do not interfere with the phthalic acid electrode.
"I O
Shigematsu et at. prepared liquid membrane electrodes responding to organic anions used in antiseptics and artificial sweeteners. The organic phase consisted of a 10% solution of the raethyltrioctylammo-nium salts of the corresponding anion in 1-decanol. Nerstian response was obtained over the range of 10 to -3
10 M for dehydroacetate, benzoate, p-hydroxybenzoate, salicylate, cyclo-hexylsulfamate, and o-benzosulfimide. The electrodes, however, were not very selective.
19 James et at examined the appli
cability of coated wire ISE's in
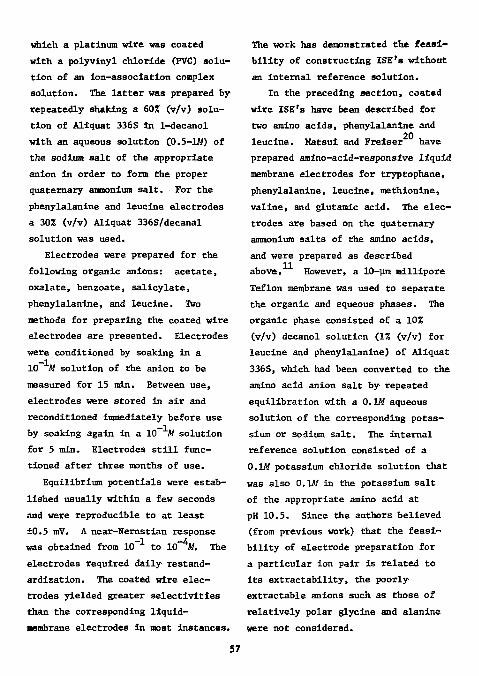
which a platinum wire was coated with a polyvinyl chloride (PVC) solution of an ion-association complex solution. The latter was prepared By repeatedly shaking a 60% (v/v) solution of Allquat 336S in 1-decanol with an aqueous solution C0.5-1M) of the sodium salt of the appropriate anion in order to form the proper quaternary ammonium salt. For the phenylalanine and leucine electrodes a 30% (v/v) Aliquat 336S/decanal solution was used.
Electrodes were prepared for the following organic anions: acetate, oxalate, benzoate, salicylate, phenylalanine, and leucine. Two methods for preparing the coated wire electrodes are presented. Electrodes were conditioned by soaking in a 10 Af solution of the anion to be measured for 15 min. Between use, electrodes were stored in air and reconditioned immediately before use by soaking again in a 10~ Af solution for 5 min. Electrodes still functioned after three months of use.
Equilibrium potentials were established usually within a few seconds and were reproducible to at least ±0.5 mV. A near-Nernstian response
-1 -4 was obtained from 10 to 10 Af. The electrodes required daily restand-ardization. The coated wire electrodes yielded greater selectivities than the corresponding liquid-membrane electrodes In most Instances.
The work has demonstrated the feasibility of constructing ISE's without an internal reference solution.
In the preceding section, coated wire ISE's have been described for two amino acids, phenylalanine and
20 leucine. Matsul and Frelser have prepared amino-acld-responslve liquid membrane electrodes for tryptophane, phenylalanine, leucine, methionine, valine, and glutamic acid. The electrodes are based on the quaternary ammonium salts of the amino acids, and were prepared as described above. However, a 10-vm millipore Teflon membrane was used to separate the organic and aqueous phases. The organic phase consisted of a 10% (v/v) decanol solution (1% (v/v) for leucine and phenylalanine) of Aliquat 336S, which had been converted to the amino acid anion salt by repeated equilibration with a O.lAf aqueous solution of the corresponding potassium or sodium salt. The internal reference solution consisted of a 0.1M potassium chloride solution that was also 0.U1/ in the potassium salt of the appropriate amino acid at pH 10.5. Since the authors believed (from previous work) that the feasibility of electrode preparation for a particular ion pair is related to its extractability, the poorly extractable anions such as those of relatively polar glycine and alanine were not considered.
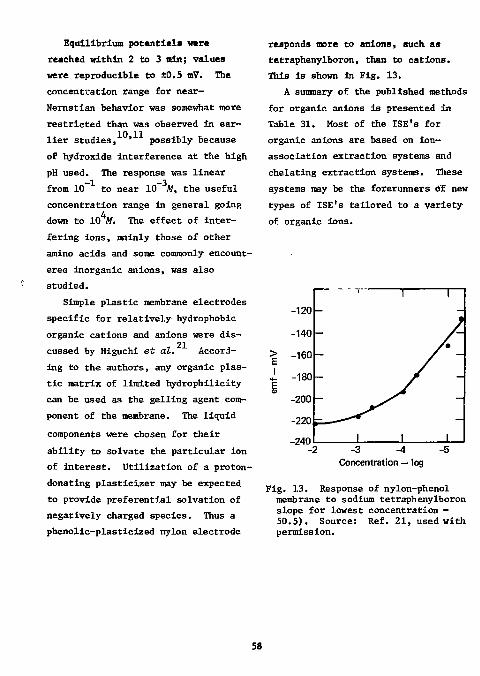
Equilibrium potentials ware reached within 2 to 3 tain; values were reproducible to ±0.5 mV. The concentration range for near-Nernstian behavior was somewhat more restricted than was observed in earlier studies, ' possibly because of hydroxide interference at the high pH used. The response was linear
-1 -3 from 10 to near 10 M, the useful concentration range in general going
i down to 10 M. The effect of interfering ions, mainly those of other amino acids and some commonly encount-erea inorganic anions, was also studied.
Simple plastic membrane electrodes specific for relatively hydrophobic organic cations and anions were dis-21 cussed by Higuchi et at. According to the authors, any organic plastic matrix of limited hydrophilicity can be used as the gelling agent component of the membrane. The liquid components were chosen for their ability to solvate the particular ion of interest. Utilization of a proton-donating plasticizer may be expected to provide preferential solvation of negatively charged species. Thus a phenolic-plasticized nylon electrode
responds more to anions, such as tetraphenylboron, than to cations. This is shown in Fig. 13.
A summary of the published methods for organic anions is presented in Table 31. Most of the ISE's for organic anions are based on ion-association extraction systems and chelating extraction systems. These systems may be the forerunners of new types of ISE's tailored to a variety of organic ions.
> E I
-120
I I
-140 /-
-160 /•
-180 --200 --220 --240 I I I -240
2 -3 -4 -5 Concentration — log
Fig. 13. Response of nylon-phenol membrane to sodium tetraphenylboron slope for lowest concentration -50.5). Source: Ref. 21, used with permission.
58
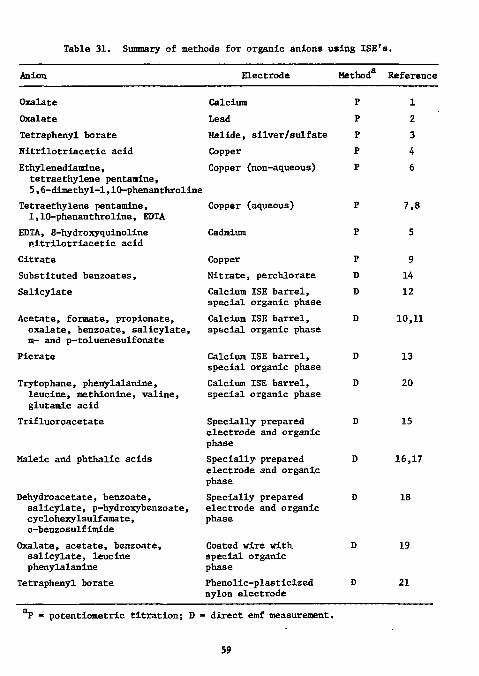
Table 31. Summary of methods for organic anions using ISE's.
Anion Electrode Method8 Reference
Oxalate Calcium P 1 Oxalate Lead P 2 Tetraphenyl borate Halide, silver/sulfate P 3 Nitrilotriacetic acid Copper P 4 Ethylenediamlne, Copper (non-aqueous) tetraethylene pentanine, 5,6-dimethyl-l,10-phenanthroline
P 6
Tetraethylene pentamine, 1,10-phenanthroline, EDTA
Copper (aqueous) P 7,8
EDTA, 8-hydroxyquinoline nitrilotriacetic acid
Cadmium P 5
Citrate Copper P 9 Substituted benzoates, Nitrate, perchlorate D 14 Salicylate Calcium ISE barrel,
special organic phase D 12
Acetate, formate, propionate, oxalate, benzoate, salicylate, m- and p-toluenesulfonate
Calcium ISE barrel, special organic phase
D 10,11
Picrate Calcium ISE barrel, special organic phase
D 13
Trytophane, phenylalanine, leucine, methionine, valine, glutamic acid
Calcium ISE barrel, special organic phase
D 20
Trifluoroacetate Specially prepared electrode and organic phase
D 15
Maleic and phthallc acids Specially prepared electrode and organic phase
D 16,17
Dehydroacetate, benzoate, salicylate, p-hydroxybenzoate, cyclohexylsulfamate, o-benzosulfimide
Specially prepared electrode and organic phase
D 18
Oxalate, acetate, benzoate, salicylate, leucine phenylalanine
Coated wire with special organic phase
D 19
Tetraphenyl borate Phenolic-plasticized nylon electrode
D 21
*P • potentiometric titration; D - direct emf measurement.
59
KcffTMCCf
1. A. K. Mukherji, Analyt, Chim. Aata, 40, 354 (1968). 2. W. Selig, Mioroahem. J., 15. 452 (1970). 3. E. Siska and E. Pungor, Z. analyt. Chem., 257, 12 (1971). 4. G. A. Eechnitz and N. C. Kenny, Anal. Letters, Z_, 509 (1970). 5. M. Mascini and A. Liberti, Analyt. Chim. Aota, 64, 63 (1973). 6. G. A. Rechnitz and N. C. Kenny, Anal. Letters, 2_, 395 (196S). 7. J. W. Ross, Jr. and M. S. Frant, Anal. Chem., 41, 1900 (1969). 8. A. Vannl, Ann. Chim. (Rome), 6J3, 887 (1973); through Chem. Abstr., 83,
21380c (1975). 9. Orion Research, Inc., Appliaations Bulletin, 4th ed., p. 16 (1972).
10. C. J. Coetzee and H. Freiser, Anal. Chem., 40_, 2071 (1968). 11. C. J. Coetzee and H. Freiser, Anal. Chem., 41, 1128 (1969). 12. W. M. Haynes and J. H. Wagenknecht, Anal. Letters, k_, 491 (1971).
413. S. G. Back, Anal. Letters, 4_, 793 (1971). 14. R. F. Hlrsch and G. M. Olderman, Anal. Chem., 48_, 771 (1976). 15. N. Ishibashl and A. Jyo, Miaroahem. J., 1J5, 220 (1973). 16. N. Ishibashi, A. Jyo, and M. Yonemitsu, Chem. Lett., 1973, 483. 17. A. Jyo, M. Yonemitsu, and N. Ishibashi, Bull. Chem. Soa. Japan, 4j , 3734
(1973). 18. T. Shigematsu, A. Ota, and M. Matusi, Bull. Inst. Chem. Res., Kyoto Vniv.,
51, 268 (1973); cf. Chem. Abstr., 81, 72303w (1974). 19. H. James, G. Carmack, and H. Freiser, Anal. Chem., 44, 856 (1972). 20. M. Matsui and H. Freiser, Anal. Letters, J3, 161 (1970). 21. T. Higuchi, C. R. Illian, and J. L. Tossounian, Anal. Chem., 42, 1674
(1970).
60
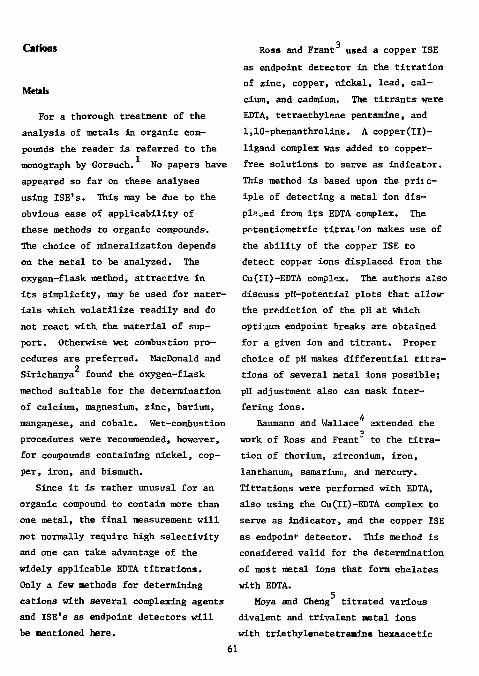
Cations
Metals
For a thorough treatment of the analysis of metals in organic compounds the reader is referred to the monograph by Gorsuch. No papers have appeared so far on these analyses using ISE's. This may be due to the obvious ease of applicability of these methods to organic compounds. The choice of mineralization depends on the metal to be analyzed. The oxygen-flask method, attractive in its simplicity, may Be used for materials which volatilize readily and do not react with the material of support. Otherwise wet combustion procedures are preferred. MacDonald and
2 Sirichanya found the oxygen-flask method suitable for the determination of calcium, magnesium, zinc, barium, manganese, and cobalt. Wet-combustion procedures were recommended, however, for compounds containing nickel, copper, iron, and bismuth.
Since it is rather unusual for an organic compound to contain more than one metal, the final measurement will not normally require high selectivity and one can take advantage of the widely applicable EDTA titrations. Only a few methods for determining cations with several complexlng agents and ISE's as endpolnt detectors will be mentioned here.
Ross and Frant used a copper ISE as endpoint detector in the titration of zinc, copper, nickel, lead, calcium, and cadmium. The titrants were EDTA, tetraethylene pentamine, and 1,10-phenanthroline. A copper(II)-ligand complex was added to copper-free solutions to serve as indicator. This method Is based upon the prii c-iple of detecting a metal ion displaced from its EDTA complex. The pctentiometric tltrat'on makes use of the ability of the copper ISE to detect copper ions displaced from the Cu(II)-EDTA complex. The authors also discuss pH-potential plots that allow the prediction of the pH at which optiiium endpoint breaks are obtained for a given ion and titrant. Proper choice of pH makes differential titrations of several metal ions possible; pH adjustment also can mask interfering ions.
4 Baumann and Wallace extended the
•3
work of Ross and Frant" to the titration of thorium, zirconium, iron, lanthanum, samarium, and mercury. Titrations were performed with EDTA, also using the Cu(II)-EDTA complex to serve as indicator, and the copper ISE as endpoinf detector. This method Is considered valid for the determination of most metal ions that form chelates with EDTA.
Moya and Cheng titrated various divalent and trlvalent netal ions with triethylenetetramine hexaacetic
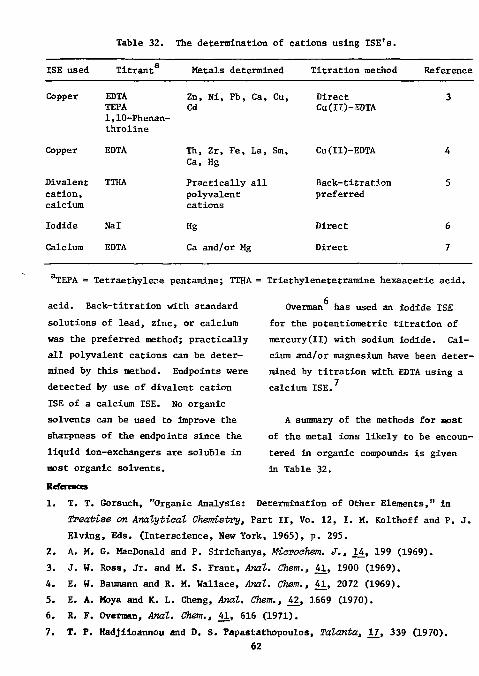
Table 32. The determination of cations using ISE's.
ISE used Titrant3 Metals determined Titration method Reference
Copper EDTA TEPA 1,10-Phenan-throline
Zn, Ni, Pb, Ca, Cu, Cd
Direct Cu(II)-EDTA
3
Copper EDTA Th, Zr, Fe, La, Sm, Ca, Hg
Cu(II)-EDTA 4
Divalent cation, calcium
TTHA Practically all polyvalent cations
Back-titration preferred
5
Iodide Nal Hg Direct 6 Calcium EDTA Ca and/or Mg Direct 7
TEPA = Tetraethyler.e pentamxne; TTHA = Triethylenetetramine hexaacetic acid.
Overman has used an Iodide ISE for the potentiometric titration of mercury(II) with sodium iodide. Calcium and/or magnesium have been determined by titration with EDTA using a calcium ISE.
A summary of the methods for most of the metal ions likely to be encountered in organic compounds is given in Table 32.
acid. Back-titration with standard solutions of lead, zinc, or calcium was the preferred method; practically all polyvalent cations can be determined by this method. Endpoints were detected by use of divalent cation ISE of a calcium ISE. No organic solvents can be used to improve the sharpness of the endpoints since the liquid ion-exchangers are soluble in most organic solvents. References 1. T. T. Gorsuch, "Organic Analysis: Determination of Other Elements," in
Treatise on Analytical Chemistry, Part II, Vo. 12, I. M. Kolthoff and P. J. Elving, Eds. (Interscience, New York, 1965), p. 295.
2. A. M. G. HacDonald and P. Sirichanya, Miamahem. J., 14, 199 (1969). 3. J. W. Ross, Jr. and M. S. Frant, Anal. Chem., £1, 1900 (1969). 4. E. W. Baumann and R. M. Wallace, Anal. Chem., 41, 2072 (1969). 5. E. A. Moya and K. L. Cheng, Anal. Chem., 42, 1669 (1970). 6. R. F. Overman, Anal. Chem., 4>1, 616 (1971). 7. T. P. Hadjiioannou and D. S. Papastathopoulos, Talanta, 17, 339 (1970).
62
Nitrogen as Awuniwn I M A review of the Kjeldahl method
for the determination of nitrogen in organic compounds was recently published by Bradstreet. In this method, the sample is oxidized by digestion with sulfuric acid. Carbon and hydrogen are expelled as carbon dioxide and water, while the nitrogen present in aminoid linkages is converted and retained in the digest as ammonia. Non-aminoid nitrogen may require modified procedures for quantitative conversion to ammonia. Mercuric ion is usually employed as catalyst, although many others have been recommended. When the conversion of nitrogen to ammonia is complete, the digest is made alkaline and the ammonia is distilled into standard acid for determination.
The distillation step in the nitrogen analysis of soil has been eliminated by using an ammonia ISE (Orion 95-10) for the determination of the ammonium ion formed by digestion of
2 the soil sample. A calibration curve was constructed by using ali-quots of an ammonium standard in the required analytical range and treat-Keferaices 1.
ing in the same fashion as the sample. After adding alkali, the pH was 13.0 to 13.2. The ammonium analysis of the digests and standards by the ISE procedure should be performed soon after adding alkali because ammonium ion may be lost as ammonia gas if samples are allowed to stand too long. Since mercuric ion, usually used as catalyst in the Kjeldahl procedure, forms a complex with ammonia in alkaline solutions, it should be removed
by addition of sodium iodide. Bremner 2 and Tabatabai, however, have used a
selenium catalyst in their procedure.
The ISE method can of course also be applied to the determination of organic nitrogen directly in the
3 digest by the Kjeldahl procedure. A Deschreider and Meaux carried out
a statistical study to compare the determination of ammonia nitrogen after Kjeldahl digestion by the Orion ammonia electrode (95-10) with the usual Kjeldahl method. The repeatability and agreement between methods as applied to agricultural products was acceptable; the permissible error was not exceeded.
R. B. Bradstreet, The Kjeldahl Method for Organic Nitrogen, Academic Press, New York, 1965. J. M. Bremner and M. A. Tabatabai, Comm. Soil Sei. Plant Anal., 3^ 159 (1972). Orion Research, Inc., Newsletter, 4 , 17 (1972). A. R. Deschreider and R. Meaux, Analysis, 2_, 442 (1973).
63
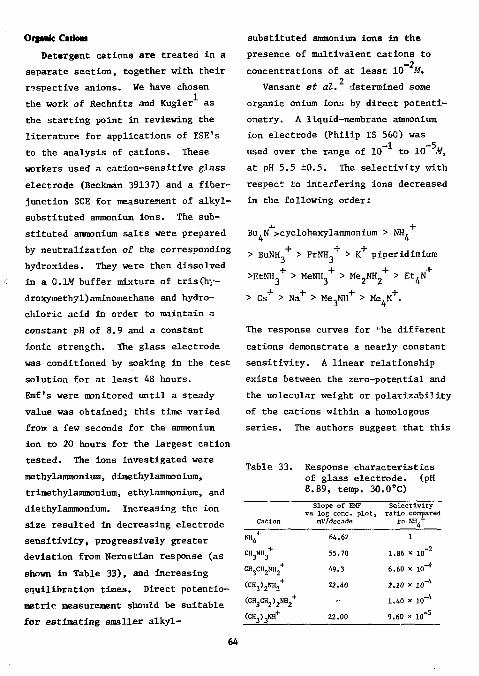
Organic Cations Detergent cations are treated in a
separate section, together with their respective anions. We have chosen the work of Rechnitz and Kugler as the starting point in reviewing the literature for applications of ISE's to the analysis of cations. These workers used a cation-sensitive glass electrode (Beckman 39137) and a fiber-junction SCE for measurement of alkyl-substituted ammonium ions. The substituted ammonium salts were prepared by neutralization of the corresponding hydroxides. They were then dissolved in a 0.1M buffer mixture of tris(hy-droxymethyl)aminomethane and hydrochloric acid in order to maintain a constant pH of 8.9 and a constant ionic strength. The glass electrode was conditioned by soaking in the test solution for at least 48 hours. Emf's were monitored until a steady value was obtained; this time varied from a few seconds for the ammonium ion to 20 hours for the largest cation tested. The ions investigated were methylammonium, dimethylammonium, trimethylammonium, ethylammonium, and diethylammonium. Increasing the ion size resulted in decreasing electrode sensitivity, progressively greater deviation from Nernstian response (as shown in Table 33), and increasing equilibration times. Direct potentio-metric measurement should be suitable for estimating smaller alkyl-
substituted ammonium ions in the presence of multivalent cations to
_2 concentrations of at least 10 M. 2 Vansant et at. determined some organic onium ions by direct potenti-ometry. A liquid-membrane ammonium ion electrode (Philip IS 560) was used over the range of 10 to 10 M,
at pH 5.5 ±0.5. The selectivity with respect to interfering ions decreased in the following order:
Bu.N >cyclohexylammonium > NH,
> BuNH. + > PrNH, + > K + piper id inium
>EtNH + > MeNH + > Me 2NH + > Et 4N
> Cs + > Na + > Me,NH + > Me,N+. 3 4
The response curves for -he different cations demonstrate a nearly constant sensitivity. A linear relationship exists between the zero-potential and the molecular weight or polarizabillty of the cations within a homologous series. The authors suggest that this
Table 33. Response characteristics of glass electrode. (pH 8.89, temp. 30.0°C)
Cation
Slope of EMF vs log cone, plot,
mV/decade
Selectivity ratio compar*
to NH + 4 NH, + 64.62 1 CH 3NH 3
+ 55.70 1.86 x l O - 2
CH 3CH 2NH 2+ 49.3 6.60 x 10~ 4
(CH 3) 2NH, + 22.40 2.10 x 10" 4
(CH 3CH 2) 2NH 2+ - 1.40 x 10" 4
(CH3)3(JH+ 22.00 9.60 x 10" 5
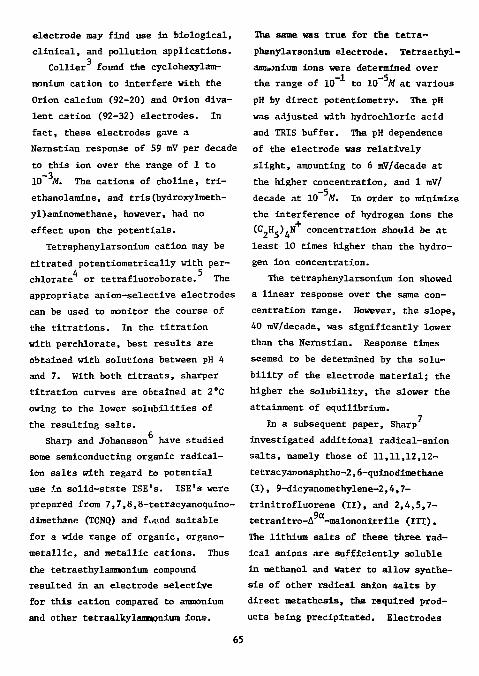
electrode may find use In biological, clinical, and pollution applications. 3 Collier found the cyclohexylam-monium cation to interfere with the Orion calcium (92-20) and Orion divalent cation (92-32) electrodes. In fact, these electrodes gave a Nernstian response of 59 mV per decade to this ion over the range of 1 to -3 10 M. The cations of choline, tri-
ethanolamine, and tris(hydroxylmeth-yDaminomethane, however, had no effect upon the potentials.
Tetraphenylarsonium cation may be titrated potentiometrically with per-
4 5 chlorate or tetrafluoroborate. The appropriate anion-selective electrodes can be used to monitor the course of the titrations. In the titration with perchlorate, best results are obtained with solutions between pH 4 and 7. With both titrants, sharper titration curves are obtained at 2°C owing to the lower solubilities of the resulting salts.
Sharp and Johansson have studied some semiconducting organic radical-ion salts with regard to potential use in solid-state ISE's. ISE's were prepared from 7,7,8,8-tetracyanoquino-dimethane (TCNQ) and found suitable for a wide range of organic, organo-metallic, and metallic cations. Thus the tetraethylammonium compound resulted in an electrode selective for this cation compared to ammonium and other tetraalkylammonium ions.
The same was true fox the tetraphenylarsonium electrode. Tetraethyl-annuoriium ions were determined over the range of 10 to 10~ M at various pH by direct potentiometry. The pH was adjusted with hydrochloric acid and TRIS buffer. The pH dependence of the electrode was relatively slight, amounting to 6 mV/decade at the higher concentration, and 1 mV/ decade at 10 Af. In order to minimize the interference of hydrogen ions the (C H ) N concentration should be at
least 10 times higher than the hydrogen ion concentration.
The tetraphenylarsonium ion showed a linear response over the same concentration range. However, the slope, 40 mV/decade, was significantly lower than the Nernstian. Response times seemed to be determined by the solubility of the electrode material; the higher the solubility, the slower the attainment of equilibrium.
In a subsequent paper, Sharp investigated additional radical-anion salts, namely those of 11,11,12,12-tetracyanonaphtho-2,6-quinodimethane (I), 9-dicyanomethylene-2,4,7-trinitrofluorene (II), and 2,4,5,7-
9a tetranitro-A -malononitrile (III). The lithium salts of these three radical anions are sufficiently soluble in methanol and water to allow synthesis of other radical anion salts by direct metathesis, the required products being precipitated. Electrodes
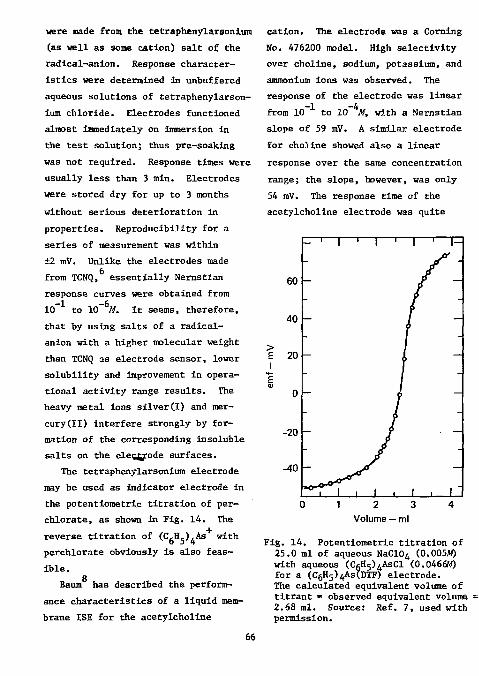
were made from the tetraphenylarsonium (as well as some cation) salt of the radical-anion. Response characteristics were determined in unbuffered aqueous solutions of tetraphenylarsonium chloride. Electrodes functioned almost immediately on immersion in the test solution; thus pre-soaking was not required. Response times were usually less than 3 min. Electrodes were stored dry for up to 3 months without serious deterioration in properties. Reproducibility for a series of measurement was within ±2 mV. Unlike the electrodes made from TCNQ, essentially Nernstian response curves were obtained from 10 to 10 M. It seems, therefore, that by using salts of a radical-anion with a higher molecular weight than TCNQ as electrode sensor, lower solubility and improvement in operational activity range results. The heavy metal ions silver(I) and mercury (II) interfere strongly by formation of the corresponding insoluble salts on the elecjjode surfaces.
The tetraphenylarsonium electrode may be used as indicator electrode in the potentiometric titration of per-chlorate, as shown in Fig. 14. The reverse titration of (C6H5),As with perchlorate obviously is also feasible.
Baum has described the performance characteristics of a liquid membrane ISE for the acetylcholine
cation. The electrode was a Corning No. 476200 model. High selectivity over choline, sodium, potassium, and ammonium ions was observed. The response of the electrode was linear
-1 -4 from 10 to 10 M, with a Nernstian slope of 59 mV. A similar electrode for choline showed also a linear response over the same concentration range; the slope, however, was only 54 mV. The response time of the acetylcholine electrode was quite
> E I
- ' 1 ' 1 1 1 ' 1-
60 -
( - • 40
20
-
\ :
0 - 1
-20 ? -
-40
* ° 7 I i 1 . 1 . 1 " 0 1 2 3 4
Volume — ml
Fig. 14. Potentiometric t i t r a t i o n of 25.0 ml of aqueous NaC104 (0.005M) with aqueous (CgH5)4AsCl (0.0466W) for a (C6H5)4As(DTF) e lec t rode . The calculated equivalent volume of t i t r a n t • observed equivalent volume 2.68 ml. Source: Ref. 7, used with permission.
66
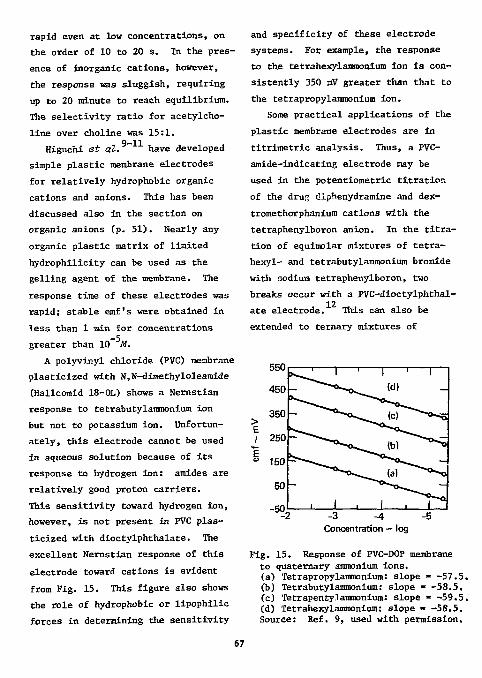
rapid even at low concentrations, on the order of 10 to 20 s. In the presence of inorganic cations, however, the response was sluggish, requiring up to 20 minute to reach, equilibrium. The selectivity ratio for acetylcholine over choline was 15:1.
9-11 Higuchi et at. have developed simple plastic membrane electrodes for relatively hydrophobic organic cations and anions. This has been discussed also in the section on organic anions (p. 51). Nearly any organic plastic matrix of limited hydrophilicity can be used as the gelling agent of the membrane. The response time of these electrodes was rapid; stable emf's were obtained in less than 1 min for concentrations greater than 10 M,
A polyvinyl chloride (PVC) membrane plasticized with N,N-dimethyloleamide (Hallcomid 18-0L) shows a Nernstian response to tetrabutylammonium ion but not to potassium ion. Unfortunately, this electrode cannot be used in aqueous solution because of its response to hydrogen ion: amides are relatively good proton carriers. This sensitivity toward hydrogen ion, however, is not present in PVC plasticized with dioctylphthalate. The excellent Nernstian response of this electrode toward cations is evident from Fig. 15. This figure also shows the role of hydrophobic or lipophilic forces in determining the sensitivity
and specificity of these electrode systems. For example, the response to the tetrahexylammonium ion is consistently 350 mV greater than that to the tetrapropylammonium ion.
Some practical applications of the plastic membrane electrodes are in titrlroetric analysis. Thus, a PVC-amide-indicating electrode may be used in the potentiometric titration of the dru™ diphenydramine and dex— tromethorphanium cations with the tetraphenylboron anion. In the titration of equimolar mixtures of tetra-hexyl- and tetrabutylammonium bromide with sodium tetraphenylboron, two breaks occur with a PVC-dioctylphthal-
12 ate electrode. This can also be extended to ternary mixtures of
-3 -4 -5 Concentration — log
Fig. 15. Response of PVC-DOP membrane to quaternary ammonium ions. (a) Tetrapropylammonium: slope - -57.5. (b) Tetrabutylammonium: slope - -58.5. (c) Tetrapenty.l ammonium: slope » -59.5. (d) Tetrahexylammonium: slope » -58.5. Source: Ref. 9, used with permission.
67
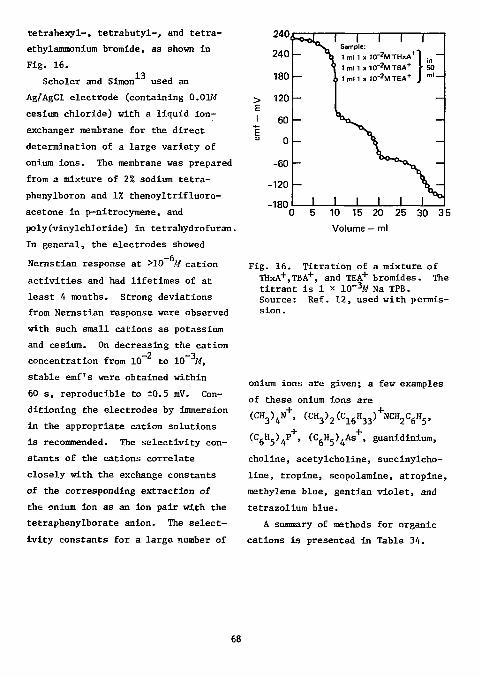
tetrahexyl-, tetrabutyl-, and tetra-ethylammonium bromide, as shown in Fig. 16.
13 Scholer and Simon used an Ag/AgCl electrode (containing 0.01M cesium chloride) with a liquid ion-exchanger membrane for the direct determination of a large variety of onlum ions. The membrane was prepared from a mixture of 2% sodium tetra-phenylboron and 1% thenoyltrifluoro-acetone in p-nitrocymene, and poly(vinylchloride) in tetrahydrofuran. In general, the electrodes showed
Nernstian response at >10 M cation activities and had lifetimes of at least 4 months. Strong deviations from Nernstian response were observed with such small cations as potassium and cesium. On decreasing the cation
-2 -3 concentration from 10 to 10 M,
stable emf's were obtained within 60 s, reproducible to ±0.5 mV. Conditioning the electrodes by immersion in the appropriate cation solutions is recommended. The selectivity constants of the cations correlate closely with the exchange constants of the corresponding extraction of the onium ion as an ion pair with the tetraphenylborate anion. The selectivity constants for a large number of
240
240
180
> 120 E 1 60 h CD 0
-60
-120
-180
I I I I v Sample:
1 T j 1 ml 1 x 10" 2 M T H x A +
9 I m l l x 1 C T 2 M T B A + •so
I I
I i t m l l x 1CT 2 MTEA + .
I I
I
1 1 1 1 f\ 1
1
5 10 15 20 25 30 35 Volume — ml
Fig. 16. Titration of a mixture of THxA+,TBA+, and TEA + bromides. The titrant is 1 x 10" % Na TPB. Source: Ref. 12, used with permission.
onium ions are given; a few examples of these onium ions are (CH 3) 4N +, (CH 3) 2(C 1 6H 3 3) +NCH 2C 6H 5,
+ + (C,H„),P , (C,H_),As , guanidinium, choline, acetylcholine, succinylcho-line, tropine, scopolamine, atropine, methylene blue, gentian violet, and tetrazolium blue.
A summary of methods for organic cations is presented in Table 34.
68
Table 34. Summary of methods for organic cations using ISE's.
Cation Electrode Method Reference
Methyl-, dimethyl-, and triraethylammonium, ethyl-, and diethylammonlum
Organic onium ions
Cyclohexylararaonium
Tetraphenylarsoniura
Tetraethylammonium Tetraphenylarsonium
Acetylcholine Choline
Diphenhydramine Dextromethorphanium
Tetrapropylammonium Tetrabutylammonium Tetrapentylammonium Tetrahexylammonium
Large number of onium ions
Beckman 39137
Liquid-membrane ammonium electrode
Calcium divalent cation
D 3
Perchlorate tetrafluoroborate
P 4,5
Solid state TCNQ and other salts
D D,P
6,7
Corning 476200 D 8
PVC-amide plastic electrode
P 9,12
PVC-amide plastic electrode
D 9,12
Liquid ion-exchange in PVC membrane
D 13
= direct emf measurement; P = potentiometric titration.
References 1. G. A. Rechnitz and G. Kugler, Z. analyt. Chem., 210, 174 (1965). 2. E. P. Vansant, H. Deelstra, and R. Dewolfs, Talanta, 21, 608 (1974). 3. H. B. Collier, Anal. Chem., 4£, 1443 (1970). 4. R. J. Baczuk and R. J. DuBois, Anal. Chem., 40, 685 (1968). 5. M. J. Smith and S. E. Manahan, Analyt. Chim. Acta, 48, 315 (1969). 6. M. Sharp and G. Johansson, Analyt. Chim. Acta., 54_, 13 (1971). 7. M. Sharp, Analyt. Chim. Aata., _59, 137 (1972). 8. B. Baum, Analyt. Letters, 3, 105 (1970).
69
9. T. Higuchi, C. R. Illian, and J. L. Tossounian, Anal. Chem., A2_, 1674 (1970).
10. T. Higuchi, U.S. Pat. 3,843,505 (22 Oct. 1974); cf. Chem Abstr., 82, 25497y (1975).
11. T. Higuchi, U.S. Pat. 3,843,490 (22 Oct. 1974); cf. Chem Abstr., 82, 25501y (1975).
12. C. R. Illian, from Diss. Abstr. Int B, J32_, 2045 (1971); cf. Chem Abstr., 76, 67335a (1972).
13. R. Scholer and W. Simon, Helv. Chim. Acta, 55, 1801 (1972).
70
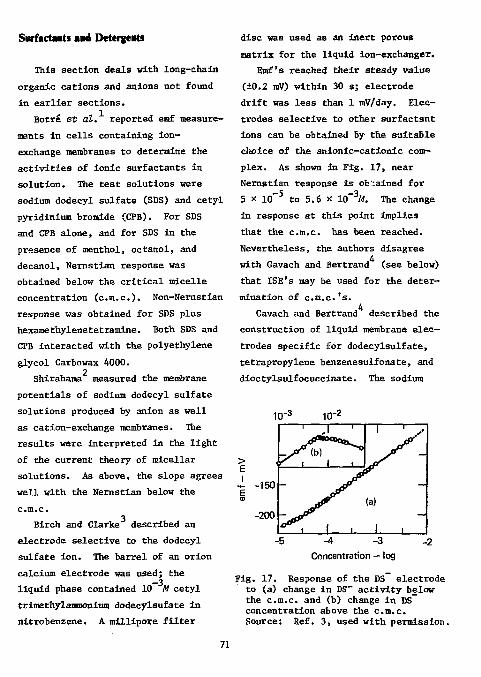
Surfactaats and Detergents
This section deals with long-chain organic cations and anions not found in earlier sections.
Botre &t at. reported emf measurements in cells containing ion-exchange membranes to determine the activities of ionic surfactants in solution. The test solutions were sodium dodecyl sulfate (SDS) a n d cetyl pyridinium bromide (CPB). For SDS and CPB alone, and for SDS in the presence of menthol, octanol, and decanol, Nernstian response was obtained below the critical micelle concentration (c.m.c.). Non-Nernstian response was obtained for SDS plus hexamethylenetetramlne. Both SDS and CPB interacted with the polyethylene
glycol Carbowax 4000. 2
Shirahama measured the membrane potentials of sodium dodecyl sulfate solutions produced by anion as well as cation-exchange membranes. The results were interpreted in the light of the current theory of micellar solutions. As above, the slope agrees well with the Nernstian below the c.m.c.
3 Birch and Clarke described an electrode selective to the dodecyl sulfate ion. The barrel of an orion calcium electrode was used; the
_3 liquid phase contained 10 M cetyl erimethylanmoniunt dodecylsufate in nitrobenzene. A millipore filter
disc was used as an inert porous matrix for the liquid ion-exchanger.
Emf's reached their steady value (±0.2 mV) within 30 s; electrode drift was less than 1 mV/day, Electrodes selective to other surfactant ions can be obtained by the suitable choice of the anionic-cationic complex. As shown in Fig. 17, near Nernstian response is obtained for 5 x i o - 5 to 5.6 x 10 _ 3M. The change in response at this point implies that the c.m.c. has been reached.
Nevertheless, the authors disagree 4 with Gavach and Bertrand (see below)
that ISE's may be used for the determination of c.m.c.'s.
4 Gavach and Bertrand described the construction of liquid membrane electrodes specific for dodecylsulfate, tetrapropylene benzenesulfonate, and dioctylsulfocuccinate. The sodium
> I
10"3 10 - 2
' i ' ' '
l i
-1
-150
-200 i 1 i
(a)
1
i
-1 -5 -4 -3 Concentration — log
Fig. 17. Response of the DS electrode to (a) change in DS~ activity below the c.m.c. and (b) change in DS concentration above the c.m.c. Source: Ref. 3, used with permission.
71
salts of these anions are common detergents. If the sodium is replaced by a long-chain alkylpyridinium cation, the resulting salt is soluble in nitrobenzene but insoluble in water. Electrodes made from this salt respond both to the alkylpyridinium cation and to the anionic detergent in aqueous solution down to 5 x 10~ M. Electrodes for one detergent anion respond in a non-Nernstian manner to other detergent anions and also to sodium chloride. Since emf's show little variation in the micellar region (see Fig. 17 above), the authors believe that the c.m.c. can be thus determined.
Besides the direct emf measurement, anionic detergent solutions can also be titrated potentiometrically with hexadecylpyridinium bromide as titrant. An excess of sodium chloride can be tolerated. The total anionic detergent can also be titrated potentiometrically; however, no differentiation is possible.
Gavach and Seta determined the following cations by potentiometric titration in aqueous solution:
+ • Dodecyltrimethylammonium, DTA . • Tetradecyltrimethylammonium,
TTA+. + • Hexadecyltrimethylammoniutn, HTA . + • Tetrabutylamnonium, TBA .
Electrodes were constructed in a similar fashion to those previously
4 described by Gavach and Bertrand for
72
detergent anions. The picrates or tetraphenylborates of these cations are insoluable in water; electrodes made from these salts in nitrobenzene respond to the cations. A description of the electrode construction is given elsewhere.
The cations DTA f, TTA +, and TBA +
can be titrated potentiometrically with either sodium tetraphenylborate, or sodium or potassium picrate. Larger potential breaks are obtained with the tetraphenylborate. HTA , however, can be titrated only with picrate because of the more lipophilic character of this cation.
For the titration of DTA +, TTA +, and TBA , the lower limit is near 10~ M with 0.01W titrant. The precision depends on the cation concen— tration, ranging from ±0.1% at 10 M
to ±0.5% at 2 x 10 M. These cations can also be determined in the presence of an excess of salts such as sodium chloride, whose cations are not precipitated by the tetraphenylborate (shown in Fig. 18). However, even though potassium tetraphenylborate is insoluble in water, DTA can be titrated in the presence of low con-
_3 centrations (10 M) of potassium ion.
The lower limit for the titration of HTA with picrate is near 3 x 10~ M. The precision of this titration is less satisfactory, ranging from ±0.5% at ImM to ±2% at O.OSmM.
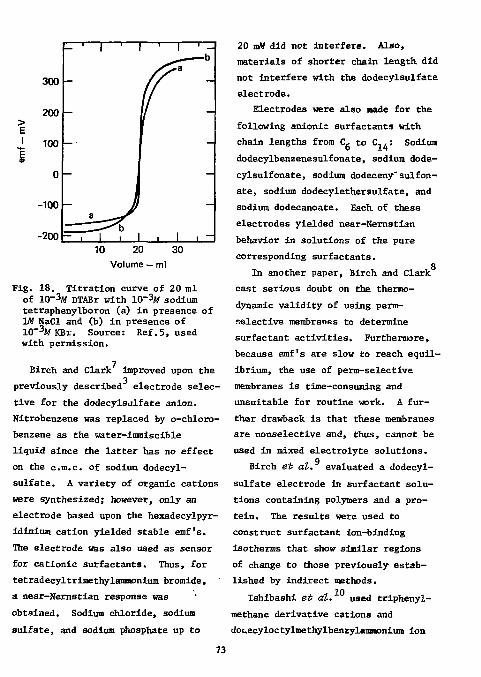
300 -
200 -
J. 100 -
-100 -
-200 E 10 20 30
Volume — ml
Fig. 18. Titration curve of 20 ml of 1 0 - % DTABr with 1 0 ~ % sodium tetraphenylboron (a) in presence of lAf NaCl and (b) in presence of 1 0 - % K B r . Source: Ref.5, used with permission.
Birch and Clark improved upon the 3
previously described electrode selective for the dodecylsulfate anion. Nitrobenzene was replaced by o-chloro-benzene as the water-immiscible liquid since the latter has no effect on the c.m.c. of sodium dodecylsulfate. A variety of organic cations were synthesized; however, only an electrode based upon the hexadecylpyr-idinium cation yielded stable emf's. The electrode was also used as sensor for cationic surfactants. Thus, for tetradecyltrimethylamnonium bromide, a near-Nernstian response was obtained. Sodium chloride, sodium sulfate, and sodium phosphate up to
8
20 vM did not interfere. Also, materials of shorter chain length did not interfere with the dodecylsulfate electrode.
Electrodes were also made for the following anionic surfactants with chain lengths from C, to C.,: Sodium dodecylbenzenesulfonate, sodium dode-cylsulfonate, sodium dodeceny"sulfonate, sodium dodecylethersulfate, and sodium dodecanoate. Each of these electrodes yielded near-Nernstiar. behavior in solutions of the pure corresponding surfactants.
In another paper, Birch and Clark' cast serious doubt on the thermodynamic validity of using perm-selective membranes to determine surfactant activities. Furthermore, because emf's are slow to reach equil ibrium, the use of perm-selective membranes is time-consuming and unsuitable for routine work. A further drawback is that these membranes are nonselective and, thus, cannot be used in mixed electrolyte solutions,
q Birch et al. evaluated a dodecyl
sulfate electrode in surfactant solutions containing polymers and a protein. The results were used to construct surfactant ion-binding isotherms that show similar regions of change to those previously established by indirect methods.
Ishibashi et al. used triphenyl-methane derivative cations and docecyloctylmethylbenzylammonium ion
73
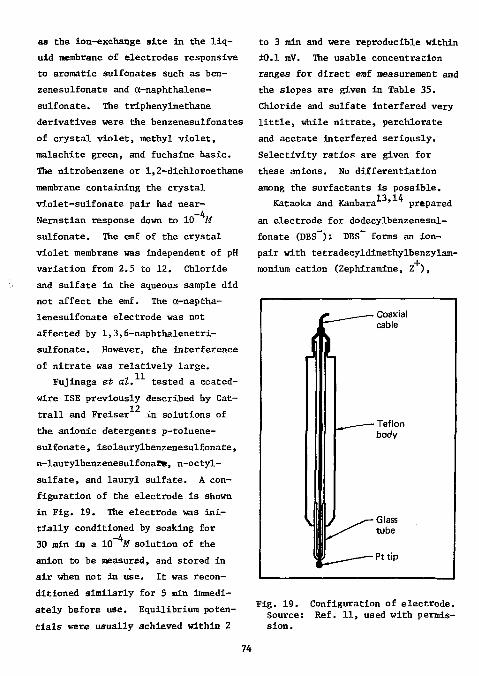
as the ion-exchange site in the liquid membrane of electrodes responsive to aromatic sulfonates such as ben-zenesulfonate and a-naphthalene-sulfonate. The triphenylmethane derivatives vere the benzenesulfonates of crystal violet, methyl violet, malachite green, and fuchsine basic. The nitrobenzene or 1,2-dichloroethane membrane containing the crystal violet-sulfonate pair had near-
-4 Nernstian response down to 10 M
sulfonate. The emf of the crystal violet membrane was independent of pH variation from 2.5 to 12. Chloride and sulfate in the aqueous sample did not affect the emf. The a-naptha-lenesulfonate electrode was not affected by 1,3,6-naphthalenetri-sulfonate. However, the interference of nitrate was relatively large.
Fujinaga et at. tested a coated-wire ISE previously described fay Cat-
12 trail and Preiser in solutions of the anionic detergents p-toluene-sulfonate, isolaurylbenzenesulfonate, n-laurylbenzenesulfonaee, n-octyl-sulfate, and lauryl sulfate. A configuration of the electrode is shown in Fig. 19. The electrode was initially conditioned by soaking for
-4 30 min in a 10 M solution of the anion to be measured, and stored in air when not in use. It was reconditioned similarly for 5 min immediately before use. Equilibrium potentials ware usually achieved within 2
to 3 min and were reproducible within ±0.1 mV. The usable concentration ranges for direct emf measurement and the slopes are given in Table 35. Chloride and sulfate interfered very little, while nitrate, perchlorate and acetate interfered seriously. Selectivity ratios are given for these anions. No differentiation among the surfactants is possible.
13 14 Kataoka and Kambara ' prepared an electrode for dodecylbenzenesul-fonate (DBS -): DBS - forms an ion-pair with tetradecyldimethylbenzylam-monium cation (Zephiramine, Z ),
J
Coaxial cable
__ Teflon body
^—Glass s ^ tube
^ ^ - Pt tip
Fig. 19. Configuration of electrode. Source: Ref. 11, used with permission.
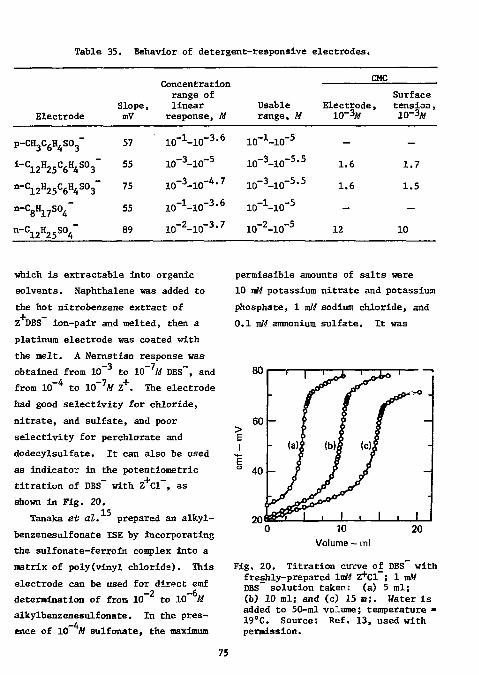
Table 35. Behavior of detergent-responsive electrodes.
Slope, mV
Concentration range of linear
response, M Usable range, M
CMC
Electrode Slope, mV
Concentration range of linear
response, M Usable range, M
Electrode, 10~%
Surface tension, 10"3tf
p-CH3C6HAS03" 57 i o - 1 - i o " 3 , 6 10 _ 1-10 - 5 — — i- C12 H25 C6 H4 S 03 _ 55 -3 -5 10 -10 3 io - 3-io~ 5 , 5 1.6 1.7
n - C12 H25 C6 H4 S 03~ 75 io- 3-io-*- 7 -3 -5 5 10 -10 3* 3 1.6 1.5
n- C8 H17 S 04 _ 55 i o - 1 - i o - 3 - 6 10 _ 1-10 - 5 - -«- C
1 2H 2 5S0 4- 89 -? -3 7 10 -10 i m l -2 -5 10 -10 3 12 10
which is extractable into organic solvents. Naphthalene was added to the hot nitrobenzene extract of Z DBS ion-pair and melted, then a platinum electrode was coated with the melt. A Nernstian response was
-3 -7 -obtained from 10 to 10 M DBS , and —4 -7 + from 10 to 10 M Z . The electrode
had good selectivity for chloride, nitrate, and sulfate, and poor selectivity for perchlorate and dodecylsulfate. It can also be used as indicator in the potentiometric titration of DBS- with Z Cl~, as shown in Fig. 20.
Tanaka et at. prepared an alkyl-benzenesulfonate ISE by incorporating the sulfonate-ferroin complex into a matrix of poly(vinyl chloride). This electrode can be used for direct emf determination of from 10~ to 10" M alkylbenzenesulfonate. In the pres-
-4 ence of 10 M sulfonate, the maximum
permissible amounts of salts were 10 mW potassium nitrate and potassium phosphate, 1 mAf sodium chloride, and 0.1 mM ammonium sulfate. It was
> E I
ou -
1 1 1 J> 1 ^LyO 1
60 -
- <a)f (b)| (c)| -
40
tf&\ i 1 • 1 • 1 10
Volume — ml 20
Fig. 20. T i t ra t ion curve of DBS with freshly-prepared ImM Z+C1 ; 1 mW DBS- so lut ion taken: (a) 5 ml; (b) 10 ml; and (c) 15 in;. Water i s added to 50-ml volume; temperature -19°C. Source: Ref. 13, used with permission.
75
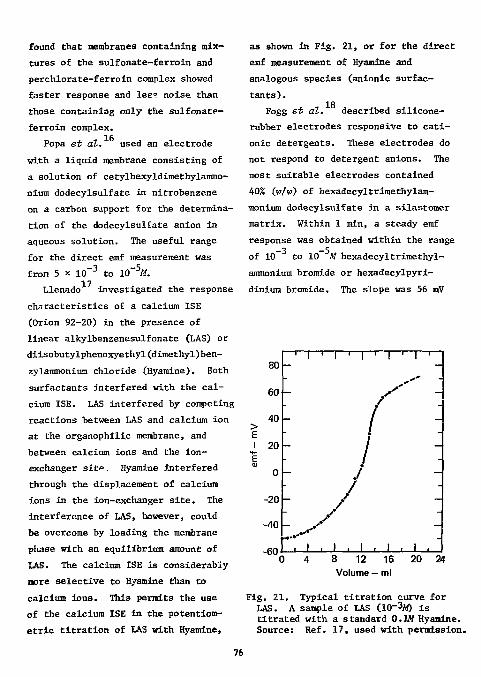
found that membranes containing mixtures of the sulfonate-ferroin and perchlorate-ferroin complex showed faster response and les* noise than those containing only the sulfonate-ferroin complex.
Popa et at. used an electrode with a liquid membrane consisting of a solution of cetylhexyldimethylammo-nium dodecylsulfate in nitrobenzene on a carbon support for the determination of the dodecylsulfate anion in aqueous solution. The useful range for the direct emf measurement was from 5 x 10~ 3 to 10~5M.
17 Llenado investigated the response characteristics of a calcium ISE (Orion 92-20) in the presence of linear alkylbenzenesulfonate (LAS) or diisobutylphenoxyethyl(dimethyl)ben-zylammonium chloride (Hyamine). Both surfactants interfered with the calcium ISE. LAS interfered by competing reactions between LAS and calcium ion at the organophilic membrane, and between calcium ions and the ion-exchanger sitp. Hyamine interfered through the displacement of calcium ions in the ion-exchanger site. The interference of LAS, however, could be overcome by loading the membrane phase with an equilibrium amount of LAS. The calcium ISE is considerably more selective to Hyamine than to calcium ions. This permits the use of the calcium ISE in the potentiom-etric titration of LAS with Hyamine,
as shown in Fig. 21, or for the direct emf measurement of Hyamine and analogous species (anionic surfactants) .
18 Fogg et al. described silicone-rubber electrodes responsive to cati-onic detergents. These electrodes do not respond to detergent anions. The most suitable electrodes contained 40% (w/w) of hexadecyltriroethylam-monium dodecylsulfate in a silastomer matrix. Within 1 min, a steady emf response was obtained within the range
-3 -5 of 10 to 10 M hexadecyltrimethyl-ammonium bromide or hexadecylpyri-diniura bromide. The slope was 56 mV
> E I
80 i | i | i | i | . | i
x*" ' . 60 - _
/ _ 40
/ -
20 : /
-
0 J -/ -
-20 " / — • ~ 40
: . . - - --
Rn . i . i . i . i . i f
0 4 8 12 16 20 24 Volume — ml
Fig. 21. Typical titration curve for LAS. A sample of LAS (10 _ 3M) is titrated with a standard 0.1M Hyamine. Source: Ref. 17, used with permission.
76
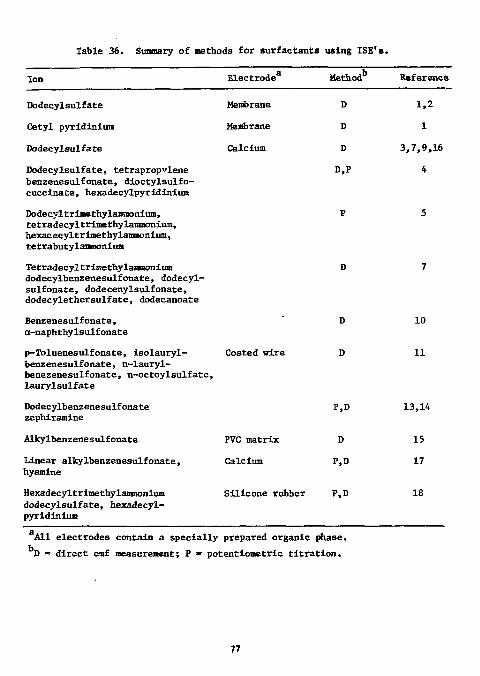
Table 36. Summary of methods for surfactants using ISE's.
Ion Electrode Method Reference
Dodecylsulfate
Cetyl pyridinium
Dodecylsulfate
Dodecylsulfate, tetrapropvlene benzenesulfonate, dioctylsulfo-cucctnate, hexadecylpyridinium
Dodecyltrimethylammonium, tetradecyltrimethylamraonium, hexacecyltrimethylanoonium, tetrabutylammonium
Tetradecyltrimethylammonium dodecylbenzenesulfonate, dodecyl-sulfonate, dodecenylsulfonate, dodecylethersulfate, dodecanoate
Benzenesulfonate, cc-naphthylsulfonate
p-Toluenesulfonate, isolauryl-benzenesulfonate, n-lauryl-benezenesulfonate, n-octoylsulfate, laurylsulfate
Membrane D 1,2 Membrane D 1 Calcium D 3,7,9,16
D,P 4
Coated wire
10
11
Dodecylbenzenesulfonate zephiramine
P,D 13,14
Alkylbenzenesulfonate PVC matrix D 15 Linear alkylbenzenesulfonate, hyamine
Calcium P,D 17
Hexadecyltrimethylanmonium dodecylsulfate, hexadecyl-pyridinium
Silicone rubber P,D 18
All electrodes contain a specially prepared organic phase. D « direct emf measurement; P ™ potentiometric titration.
77
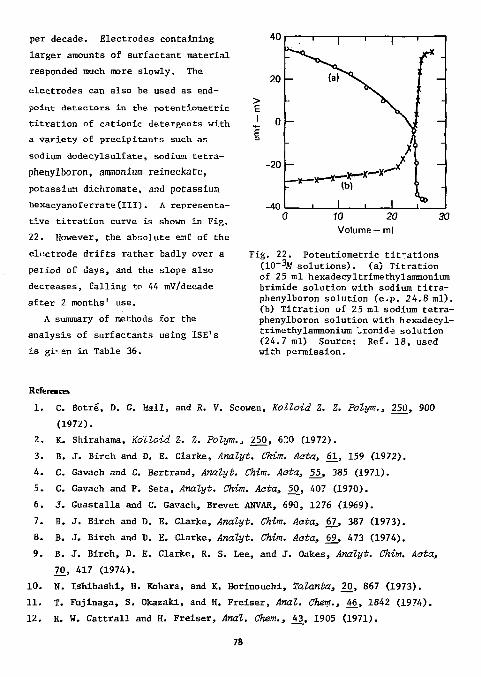
per decade. Electrodes containing larger amounts of surfactant material responded much more slowly. The electrodes can also be used as end-point detectors in the potentioinetric titration of cationic detergents with a variety of precipitants such as sodium dodecylsulfate, sodium tetra-phenylboron, ammonium reineckate, potassium dichromate, and potassium hexacyanoferrate(IXI). A representative titration curve is shown in Fig. 22. However, the absolute emf of the electrode drifts rather badly over a period of days, and the slope also decreases, falling to 44 mV/decade after 2 months' use.
A summary of methods for the analysis of surfactants using ISE's is gi\ an in Table 36.
References
1. C. Botre, D. G. Hall, and R. V. Scowen, Kolloid Z. Z. Polym., 250, 900 (1972).
2. K. Shirahama, Kolloid Z. Z. Polym., 250, 6P.0 (1972). 3. B. J. Birch and D. E. Clarke, Analyt. Chim. Aata, 61, 159 (1972). 4. C. Gavach and C. Bertrand, Analyt. Chim. Acta, 55, 385 (1971). 5. C. Gavach and P. Seta, Analyt. Chim. Aata, 50, 407 (1970). 6. J. Guastalla and C. Gavach, Brevet ANVAR, 690, 1276 (1969). 7. B. J. Birch and D. E. Clarke, Analyt. Chim. Aata, 67, 387 (1973). 8. B. J. Birch and D. E. Clarke, Analyt. Chim. Aata, 69, 473 (1974). 9. B. J. Birch, D. E. Clarke, R. S. Lee, and J. Oakes, Analyt. Chim. Aata,
70, 417 (1974). 10. N. Ishibashi, H. Kohara, and K. Horinouchi, Talanta, 20, 867 (1973). 11. T. Fujinaga, S. Okazaki, and H. Freiser, Anal. Chem., 46, 1842 (1974). 12. R. W. Cattrall and H. Freiser, Anal. Chem., 43, 1905 (1971).
78
Volume — ml
Fig. 22. Poteiitiometric tit-ations (10"% solutions). (a) Titration of 25 ml hexadecyltrimethylammonium brimide solution with sodium titra-phenylboron solution (e.p. 24.8 ml). (b) Titration of 25 ml sodium tetra-phenylboron solution with hexadecyltrimethylammonium bromide solution (24.7 ml) Source: Ref. 18, used with permission.

13. M. Kataoka and T. Kambara, Bunaeki Kagaku, 21_, 1081 (1974); cf. Chem. Abator., 82. «W27x (1975).
14. M. Kataolca and T. Kambara, Denki Kagaku Oydbi Kogyo Busuri Kagaku, £3, 209 (1975); through Chem. Abstr., 83, 195644g (1975).
15. T. Tanaka, K. Hiiro, and A. Kawahara, Anal. Letters, 7_, 173 (1974). 16. G. Popa, B. Geafar, and C. Luca, Rev. Chim. (Buaharest), 25j 748 (1974);
through Chem. Abstr., 83, 12719t (1975). 17. R. A. Llenado, Anal. Chem., 47, 2243 (1975). 18. A. G. Fogg, A. S. Pathan, and D. T. Burns, Analyt. Chim. Acta, 69, 238
(1974).
79
FUNCTIONAL GROUP ANALYSIS
Divalent Sulfur Functions
A thorough treatment of the analysis of divalent sulfur functions in organic compounds is given in the
1 2 monographs by Karchmer ' and Siggia. This section deals mainly with the determination of thiols using ISE's, although several other divalent sulfur functions, such as disulfides and thiourea, are also mentioned. Thiols
Papp and Havas in 1970 first used .-in ISE as endpoint detector in the potentiometric titration of thiols. The titrants were 0.02 and 0.05M mercuric chloride; the ISE was a sulfide-selective membrane electrode (Radelkis Type OP-S-711) that behaved reversibly toward mercuric ions. The thiols determined were methyl mer-captan, potassium thiophenolate, mer-captoethanol, and thiocresol. Water-soluble thiols were determined in 0.1M sodium hydroxide, while water-insoluble thiols were determined in ethanol. The mercuric chloride titrant was considered more suitable for the determination of thiols than silver nitrate, since the latter may form complexes leading to high results. Kolthoff and Eisenstadter also found mercury mercaptides to be considerably more stable than silver
mercaptides. In additional papers, 6 7 Papp ' deals with the determination
of thiols in the presence of other sulfur-containing moieties found in alkaline pulping liquors. As above, thiols were precipitated as mercury mercaptides with mercuric chloride. A sulfide ISE was used to monitor the titrations.
o Gruen and Harrap determined some
thiols by potentiometric titration with 0.1W silver nitrate. Titrations were monitored with a silver sulfide electrode (Orion 94-16). The thiols determined at pH 2.5 to 9 in an aqueous medium were mercaptoethanol, glutathione, and L-cyste'ine. These workers noted very little change in einf until the endpoint was almost reached. In the vicinity of the end-point the electrode response was very slow; up to 2 min were required to establish the equilibrium potentials. Beyond the endpoint the emf rose rapidly because of the excess of silver ions, giving a Nernstian exponential relation between emf and volume of excess silver ion. Points in the immediate vicinity of the endpoint were ignored, and the endpoint was determined as the intersection of the baseline with the curve of potential vs excess silver ions, as shown in Fig. 23.
60
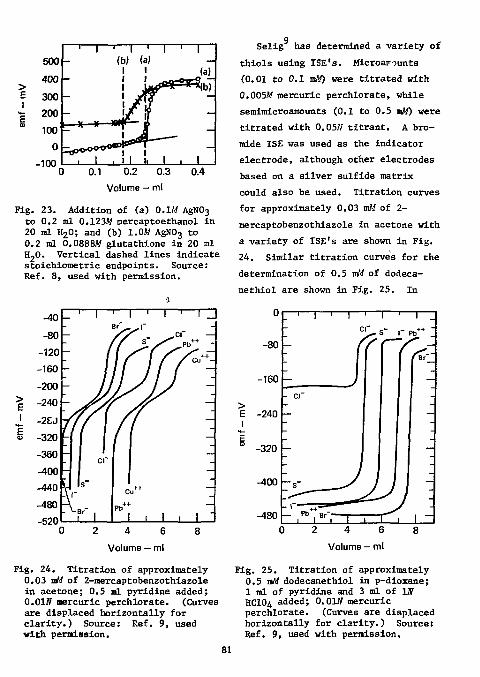
> E
500
400
300
1 - 1 1 1 (W
1 1 1 1 J
- r (a) 1 l
i 1
< 4 -
E 200
100
-1 .
y 1 1 200
100 1 .
y 1 1
0
-100 t
1 , ! | i i, i 1
0
-100 t ) 0.1 0.2 0.3 0.4
Volume ml
Fig. 23. Addition of (a) 0.1M AgN0 3
to 0.2 ml 0.123M mercaptoethanol in 20 ml H 20; and (b) 1.0M AgN0 3 to 0.2 ml 0.0888M glutathione in 20 ml H,0. Vertical dashed lines indicate stoichiometric endpoints. Source: Ref. 8, used with permission.
Selig has determined a variety of thiols using ISE's. Microarounts (0.01 to 0.1 mM) were titrated with 0.005M mercuric perchlorate, while seraimicroaroounts (0.1 to 0.5 mW) were titrated with 0.05N titrant, A bromide ISE was used as the indicator electrode, although other electrodes based on a silver sulfide matrix could also be used. Titration curves for approximately 0.03 mM of 2-mercaptobenzothiazole in acetone with a variety of ISE's are shown in Fig. 24. Similar titration curves for the determination of 0.5 mM of dodeca-nethiol are shown in Fig. 25. In
> E I
2 4 6 Volume — ml
u . ' I ' I i ' i
-80
n -•"
rr
7 s~ r
|7 S" '-
-160
-240 11
II
11
1
> E 1
-160
-240
- CI
11
II
11
1
emf
-320
-400 ~s° */ i
i i I i i
i-pr
-480 r r"^.++-T 1_
L
-480 , i D - , i i 2 4 6 8
Volume - ml
Fig. 24. Titration of approximately Fig. 25. Titration of approximately 0.03 mM of 2-mercaptobenzothiazole in acetone; 0.5 ml pyridine added; 0.01J? nercuric perchlorate. (Curves are displaced horizontally for clarity.) Source: Ref. 9, used with permission.
0.5 mM dodecanethiol in p-dioxane; 1 ml of pyridine and 3 ml of Iff HCIO4 added; Q.01N mercuric perchlorate. (Curves are displaced horizontally for clarity.) Source: Ref. 9, used with permission.
81
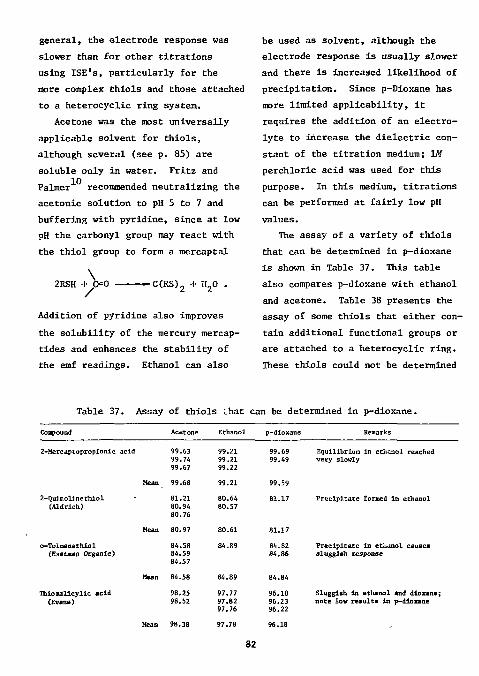
general, the electrode response was slower than for other titrations using ISE's, particularly for the more complex thiols and those attached to a heterocyclic ring system.
Acetone was the most universally applicable solvent for thiols, although several (see p. 85) are soluble only in water. Fritz and Palmer recommended neutralizing the acetonic solution to pH 5 to 7 and buffering with pyridine, since at low pH the carbonyl group may react with the thiol group to form a mercaptal
2ESH + C=0 -C(RS) 2 + H 20 .
Addition of pyridine also improves the solubility of the mercury mercap-tides and enhances the stability of the emf readings. Ethanol can also
be used as solvent, although the electrode response is usually slower and there is increased likelihood of precipitation. Since p-Dioxane has more limited applicability, it requires the addition of an electrolyte to increase the dielectric constant of the titration medium; W
perchloric acid was used for this purpose. In this medium, titrations can be performed at fairly low pH values.
The assay of a variety of thiols that can be determined in p-dioxane is shown in Table 37. This table also compares p-dioxane with ethanol and acetone. Table 38 presents the assay of some thiols that either contain additional functional groups or are attached to a heterocyclic ring. These thiols could not be determined
Table 37. Assay of thiols Lhat can be determined in p-dioxane.
Conpound Acetone Ethanol p-dloxane Remarks
2-Mercaptopropionic acid 99.63 99.74 99.67
99.21 99.21 99.22
99.69 99.49
Equilibrium In ethanol reached very slowly
Mean 99.68 99.21 99.59
2-Quinolinethiol (Aldrich)
81.21 80.94 80.76
80.64 80.57
81.17 Precipitate formed in ethanol
Mean 80.97 80.61 81.17
o-Toluenethiol (Eastnan Organic)
84.58 84.59 84.57
84.89 84.82 84.86
Precipitate In ethanol causes sluggish response
Mean 84.58 84.89 84.84
Thiosalicyllc acid (Evans)
98.25 98.52
97.77 97.82 97.76
96.10 96.23 96.22
Sluggish in ethanol and dloxane; note low results in p-dioxane
Mean 98.38
32
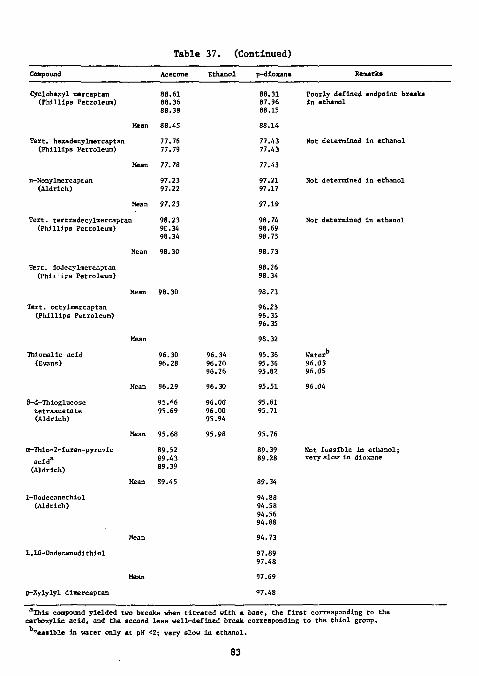
Table 37. (Continued)
Compound Ettunol p-dlox«ne
Cyclohexyl mercaptan (Phillips Petroleum)
88.61 88.36 88.38
Mean 88.45
Tert. hexadecylnercaptan (Phillips Petroleum)
77.76 77.79
Mean 77.78
n-Nonylmercaptan (Aldrich)
97.23 97.22
Mean 97.23
Tert. tertradecylmercaptan (Phillips Petroleum)
98.23 9E.34 98.34
Mean 98.30
Tert. dodecylmercaptan (phii;ips Petroleum)
88.31 87.96 88. IS
77.43 77.43
97.21 97.17
98.74 98.69 98.75
98.26 98.34
Poorly defined endpoint brealcs in ethanol
Not determined in ethanol
Not determined in ethanol
Not determined in ethanol
Mean 98.30
Tert. octylmercaptan (Phillips Petroleum)
96.25 96.35 96.35
98.32
Thiomalic acid (Evans)
B-d-Thioglucose tetraacetate (Aldrich)
96.30 96.28
Mean 96.29
95. «6 95.69
96.34 96.20 96.26
96.00 96.00 95.94
95.36 95.36 95.82
95.51
95.81 95.71
Water" 96.03 96.05
96.04
Mean 95.68
a-Thio-2-furan-pyruvic acid 3
{Aldrich)
89.52 89.43 89.39
Mean 89.45
89.39 89.28
89.34
Not feasible in ethanol; very slow in dioxane
1-Dodecanethiol (Aldrich)
94.88 94.58 94.56 94.88
94.73
1,10-Dodecanedithiol 97.89 97.48
p-Xylylyl dimercaptan
97.69
97.48
^This compound yielded two breaks when titrated with a carboxylic acid, and the second less well-defined break
"easible in water only at pH <2; very slow In ethanol.
base, the first corresponding to the corresponding to the thiol group.
83
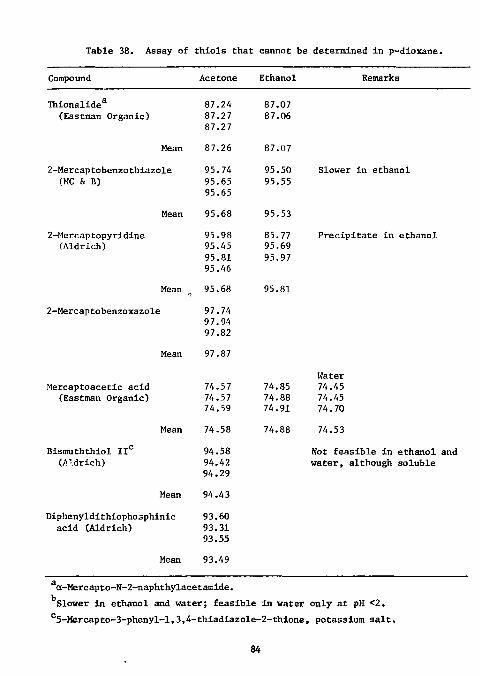
Table 38. Assay of thiols that cannot be determined in p-dioxane.
Compound Acetone Ethanol
Thionalide3
(Eastman Organic) 87.24 87.27 87.27
87.07 87.06
Mean 87.26 87.07
2-Mercaptobenzothiazole (MC & B)
95.74 95.65 95.65
95.50 95.55
Mean 95.68 95.53
2-Mercap topyridine f/Vldrich)
95.98 95.45 95.81 95.46
85.77 95.69 95.97
Mean 95.68 95.81
2-Mercaptobenzoxazole 97.74 97.94 97.82
Remarks
Slower in ethanol
Precipitate in ethanol
Mean 97.87
Mercaptoacetic acid (Eastman Organic)
74.57 74.57 74.59
74, 74. 74,
.85
.88
.91
Water 74.45 74.45 74.70
Mean 74.58 74. .88 74.53
Bismuththiol II C
(^.drich) 94.58 94.42 94.29
Not fe; water,
Mean 94.43
Diphenyldlthiophojphinic acid (Aldrich)
93.60 93.31 93.55
Not feasible in ethanol and
Mean 93.49
a-Mercapto-N-2-naphthylacetamide. Slower in ethanol and water; feasible in water only at pH <2.
c5-Mercapto-3-phenyl-l,3,4-thiadiazole-2-thione, potassium salt.
84
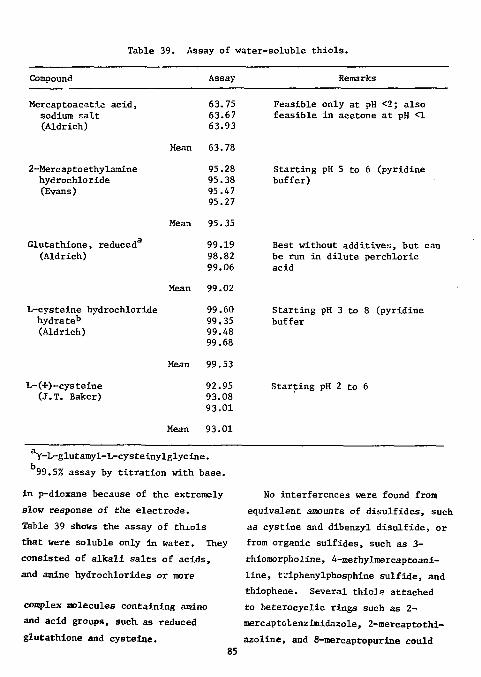
Table 39. Assay of water-soluble thiols.
Compound Assay Remarks
Mercaptoacetn.c acid, sodium salt (Aldrich)
63.75 63.67 63.93
Feasible only at pH <2; also feasible in acetone at pH <1
Mean 63.78
2-Mercaptoethylaroine hydrochloride (Evans)
95.28 95.38 95.47 95.27
Starting pH 5 to 6 (pyridine buffer)
Mean 95.35
Glutathione, reduced (Aldrich)
99.19 98.82 99.06
Best without additives, but can be run in dilute perchloric acid
Mean 99.02
L-cysteine hydrochloride hydrateb
(Aldrich)
99.60 99.35 99.48 99.68
Starting pH 3 to 8 (pyridine buffer
Mean 99.53
L- (+)-cysteine (J.T. Baker)
92.95 93.08 93.01
Starting pH 2 to 6
Mean 93.01
Y-L-glutamyl-L-cysteinylglyclne. 99.5% assay by titration with base.
in p-dioxane because of the extremely slow response of the electrode. Table 39 shows the assay of thiols that were soluble only in water. They consisted of alkali salts of acids, and amine hydrochlorides or more
complex molecules containing amino and acid groups, such as reduced glutathione and cysteine.
85
No interferences were found from equivalent amounts of disulfides, such as cystine and dibenzyl disulfide, or from organic sulfides, such as 3-thiomorpholine, 4-methylmercaptoani-line, triphenylphosphine sulfide, and thiophene. Several thiols attached to heterocyclic rings such as 2-
mercaptctenzimidazole, 2-raercaptothi-azoline, and 8-mercaptopurine could
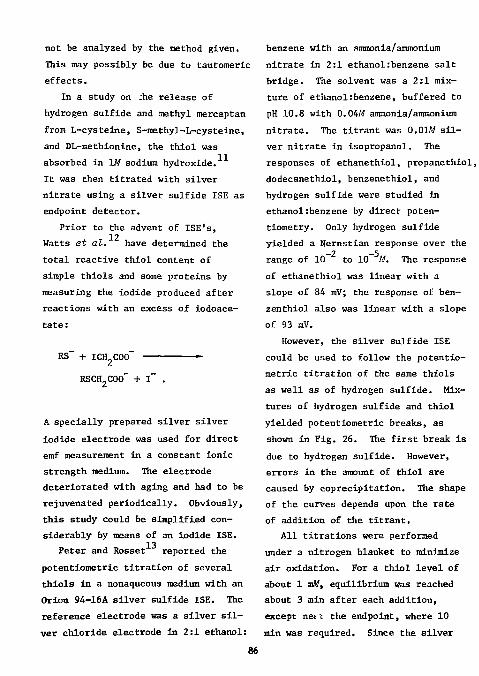
not be analyzed by the method given. This may possibly be due to tautomeric effects.
In a study on ;he release of hydrogen sulfide and methyl mercaptan from L-cysteine, S-methyl-L-cysteine, and DL-methionine, the thiol was absorbed in \M sodium hydroxide. It was then titrated with silver nitrate using a silver sulfide ISE as endpoint detector.
Prior to the advent of ISE's, 12 Watts et at, have determined the
total reactive thiol content of simple thiols and some proteins by measuring the iodide produced after reactions with an excess of iodoace-tate:
RS" + ICH COO - -
RSCH2COO~ + I" .
benzene with an ammonia/ammonium nitrate in 2:1 ethanol:benzene salt bridge. The solvent was a 2:1 mixture of ethanol:benzene, buffered to pH 10.8 with 0.04W ammonia/ammonium nitrate. The titrant was 0.01W silver nitrate in isopropanol. The responses of ethanethiol, propanethiol, dodecanethiol, benzenethiol, and hydrogen sulfide were studied in ethanol:benzene by direct poten-tiometry. Only hydrogen sulfide yielded a Nernstian response over the
-2 -5 range of 10 to 10 M. The response of ethanethiol was linear with a slope of 84 mV; the response of ben-zenthiol also was linear with a slope of 93 mV.
However, the silver sulfide ISE could be used to follow the potentio-metric titration of the same thiols as well as of hydrogen sulfide. Mixtures of hydrogen sulfide and thiol yielded potentiometric breaks, as shown in Fig. 26. The first break is due to hydrogen sulfide. However, errors in the amount of thiol are caused by coprecipitation. The shape of the curves depends upon the rate of addition of the titrant.
All titrations were performed under a nitrogen blanket to minimize air oxidation. For a thiol level of about 1 mM, equilibrium was reached about 3 min after each addition, except ne;r the endpoint, where 10 min was required. Since the silver
A specially prepared silver silver iodide electrode was used for direct emf measurement in a constant ionic strength medium. The electrode deteriorated with aging and had to be rejuvenated periodically. Obviously, this study could be simplified considerably by means of an iodide ISE.
13 Peter and Eosset reported the potentiometric titration of several thiols in a nonaqueous medium with an Orion 94-16A silver sulfide ISE. The reference electrode was a silver silver chloride electrode in 2:1 ethanol:
86
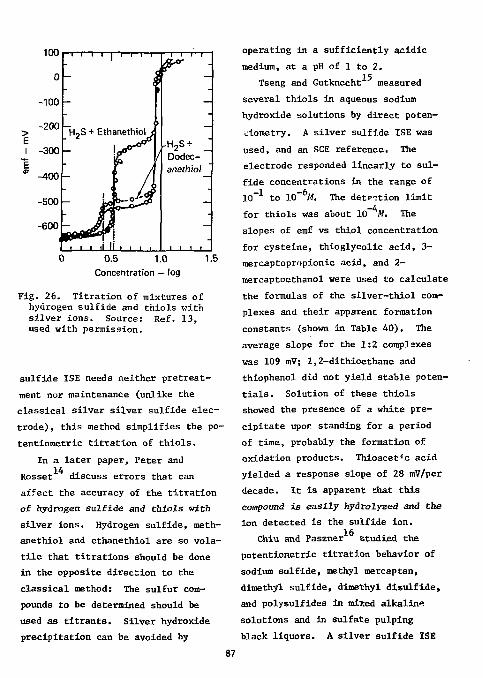
1.5 0.5 1.0 Concentration — log
Fig. 26. Titration of mixtures of hydrogen sulfide and thiols with silver ions. Source: Ref. 13, used with permission.
sulfide ISE needs neither pretreat-ment nor maintenance (unlike the classical silver silver sulfide electrode) , this method simplifies the po-tentiometric titration of thiols.
In a later paper, Peter and 14 Rosset discuss errors that can
affect the accuracy of the titration of hydrogen sulfide and thiols with silver ions. Hydrogen sulfide, meth-anethiol and ethanethiol are so volatile that titrations should be done in the opposite direction to the classical method: The sulfur compounds to be determined should be used as titrants. Silver hydroxide precipitation can be avoided by
operating in a sufficiently acidic medium, at a pH of 1 to 2.
Tseng and Gutknecht measured several thiols in aqueous sodium hydroxide solutions by direct poten-ciometry. A silver sulfide ISE was used, and an SCE reference. The electrode responded linearly to sulfide concentrations in the range of —t 6 10 to 10 M. The detp-.tion limit
-4 for thiols was about 10 M. The slopes of emf vs thiol concentration for cysteine, thioglycolic acid, 3-mercaptoprnpionic acid, and 2-mercaptoethanol were used to calculate the formulas of the silver-thiol complexes and their apparent formation constants (shown in Table 40). The average slope for the 1:2 complexes was 109 mV; 1,2-dithioethane and thiophenol did not yield stable potentials. Solution of these thiols showed the presence of a white precipitate upor. standing for a period of time, probably the formation of oxidation products. Thioacetrc acid yielded a response slope of 28 mV/per decade. It is apparent that this compound is easily hydrolyzed and the ion detected is the sulfide ion.
Chiu and Paszner studied the potentiometric titration behavior of sodium sulfide, methyl mercaptan, dimethyl sulfide, dimethyl disulfide, and polysulfides in mixed alkalin". solutions and in sulfate pulping black liquors. A silver sulfide ISE
87
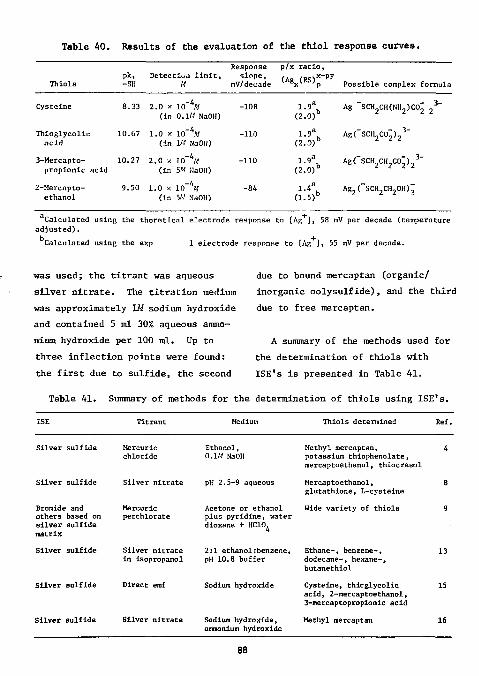
Table 40. Results of the evaluation of the thiol response curves. Response p/x ratio,
pk, Detection limit, slope, ,. rR<nx~Pv
-SH M mV/decade krtgx^'°-'p Possible complex formula
Cysteine
T h i o g l y c o l i c a c i d
8 ,33 2 . 0 * 10 "M ( in 0.1W NaOH)
10.67 1.0 x 10 - A W ( i n 1M NaOH)
3-Mercapto- 10.27 2 .0 x 10 tf p r o p i o n i c a c i d ( i n 5M NaOH)
2-Mercapto-e t h a n o l
9.50 1.0 x 10 M ( in 5/-.' NaOH)
-108 ( 2 . 0 ) b
(2.0) b
1.9* ( 2 . 0 ) b
( 1 . 5 ) b
Ag SCH_CH(NH„)CO.
Ag( SCH 2 CO~) 2
3
Ag("SGH CH,C0")_ 3
r 3-
C a l c u l a t e d u s i n g the t h o r e t i c a l e l e c t r o d e r e sponse to [Ag ] , 58 mV per decade ( t e m p e r a t u r e a d j u s t e d ) .
C a l c u l a t e d us ing the exp 1 e l e c t r o d e response to [Ag ] , 55 mV pe r decade .
was used; the t i f r a n t was aqueous due to bound raercaptan (organic/ s i l v e r n i t r a t e . The t i t r a t i o n medium inorganic oo lysu l f ide) , and the th i rd was approximately litf sodium hydroxide due to free mercaptan. and contained 5 ml 30% aqueous ammonium hydroxide per 100 ml. Up to three in f l ec t ion points were found: the f i r s t due to su l f ide , the second
A summary of the methods used for the determination of t h io l s with ISE's i s presented in Table 41 .
Table 41 . Summary of methods for the determination of t h i o l s using ISE's .
;E T i t r a n t Medium Thiols determined Ref
S i l v e r s u l f i d e
S i l v e r s u l f i d e
Bromide and o t h e r s based on s i l v e r s u l f i d e Tiatrix
S i l v e r s u l f i d e
S i l v e r s u l f i d e
S i l v e r s u l f i d e
Mercuric c h l o r i d e
S i l v e r n i t r a t e
Mercuric p e r c h l o r a t e
S i l v e r n i t r a t e in isopropanol
S i l v e r n i t r a t e
Ethanol , 0.1M NaOH
pH 2.5-9 aqueous
Acetone or ethanol plus pyridine, water dioxane + HC10,
Methyl raercaptan, potassium thiophenolate, raercaptoethanol, thiocresol
Mercaptoethanol, glutathione, L-cysteine
Wide variety of thiols
2:1 ethanol:benzene, Ethane-, benzene-, pH 10.8 buffer dodecane-, hexane-
butanethiol
Sodium hydroxide
Sodium hydroxide, ammonium hydroxide
Cysteine, thicglycolic acid, 2-mercaptoethanol, 3-mercaptopropionic acid
Methyl mercaptan
88
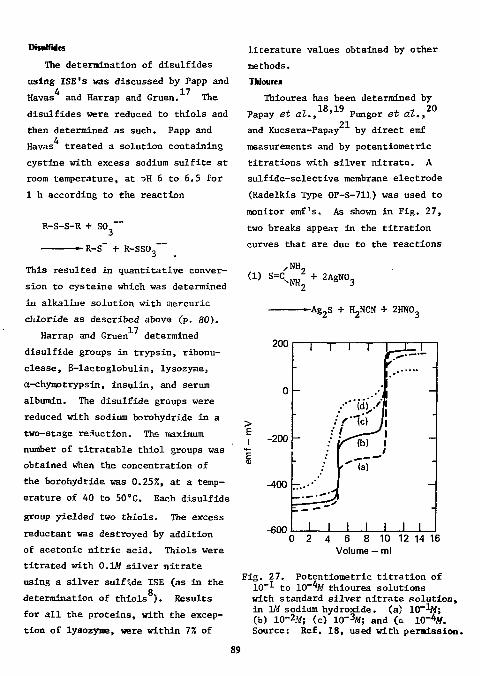
DisuHMcs The determination of disulfides
using ISE's was discussed by Papp and A 17
Havas and Harrap and Gruen. The disulfides were reduced to thiols and then determined as such. Papp and Havas treated a solution containing cystine with excess sodium sulfite at room temperature, at oH 6 to 6.5 for 1 h according to the reaction
R-S-S-R + SO ~
-R-S + R-SS03
This resulted in quantitative conversion to cysteine which was determined in alkaline solution with mercuric chloride as described above (p. 80).
Harrap and Gruen determined disulfide groups in trypsin, rlbonu-clease, 8-lactoglobulin, lysozyme, a-chymotrypsin, insulin, and serum albumin. The disulfide groups were reduced with sodium borohydride in a two-stage reduction. The maximum number of titratable thiol groups was obtained when the concentration of the borohydride was 0.25%, at a temperature of 40 to 50°C. Each disulfide group yielded two thiols. The excess reductant was destroyed by addition of acetonic nitric acid. Thiols were titrated with 0.1W silver nitrate using a silver sulfide ISE (as in the
o determination of thiols ). Results for all the proteins, with the exception of lysozyme, were within 7% of
literature values obtained by other methods. Thiourea
Thiourea has been determined by 18 19 20
Papay et al., ' Pungor et at., 21 and Kucsera-Papay by direct emf
measurements and by potentiometric titrations with silver nitrate. A sulfide-selective membrane electrode (Radelkis Type 0P-S-711) was used to monitor emf's. As shown in Fig. 27, two breaks appear in the titration curves that are due to the reactions
(1) S=C -NH 2
NH„ + 2AgN0.
-Ag2S + H2NCN + 2HN0 3
200
> E I
-200
-400
-600
1 1 l 1 L_J_L 0 _^"~'~ . r i.--i
.-•'* "1 ..••"id"),.'' i
•Vic) j\ • i si :' t^ lb) 1
I ?
/ l-'Tal
ziz^d i i i i i i i
0 2 4 6 8 10 12 14 16 Volume — ml
Fig. 27. Potentiometric t i t r a t i o n of 10" 1 to 10"%f thiourea solu t ions with standard s i l v e r n i t r a t e so lu t ion , in 1W sodium hydroxide, (a) lO'-'-W; (b) 10-2.V; (c) 10"%; and (c 10"4tf. Source: Ref. 18, used with permission.
89
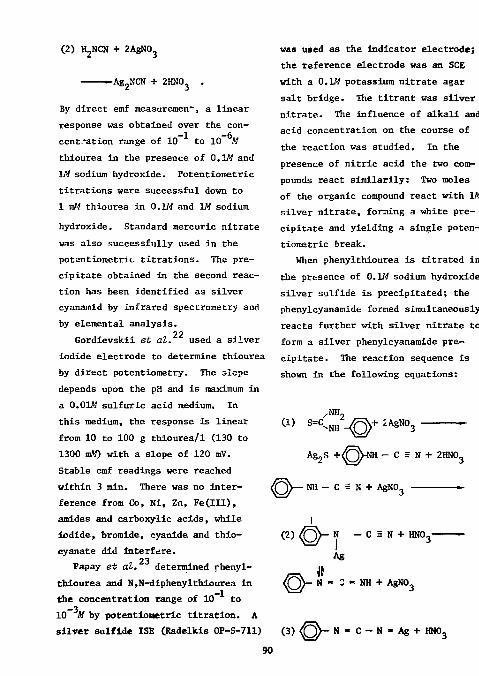
C2) H2NCN + 2AgN03
-Ag NCN + 2HN0
By direct emf measurement, a linear response was obtained over the concentration range of 10 tc 10 M thiourea in the presence of 0.1W and 1M sodium hydroxide. Potentioroetric titrations were successful down to 1 mW thiourea in 0.1M and lAf sodium hydroxide. Standard mercuric nitrate was also successfully used in the potantiometric titrations. The precipitate obtained in the second reaction has been identified as silver cyanamid by infrared spectrometry and by elemental analysis.
22 Gordievskii et al. used a silver iodide electrode to determine thiourea by direct potentiometry. The slope depends upon the pH and is maximum in a 0.01M sulfuric acid medium. In this medium, the response is linear from 10 to 100 g thiourea/1 (130 to 1300 mM) with a slope of 120 mV. Stable emf readings were reached within 3 min. There was no interference from Co, Ni, Zn, Fe(III), amides and carboxylic acids, while iodide, bromide, cyanide and thio-cyanate did interfere.
23 Papay et al. determined rhenyl-thiourea and N,N-diphenylthiourea in the concentration range of 10~ to _3 10 M by potentiometric titration. A silver sulfide ISE (Radelkis 0P-S-711)
was used as the indicator electrode; the reference electrode was an SCE with a 0.1M potassium nitrate agar salt bridge. The titrant was silver nitrate. The influence of alkali and acid concentration on the course of the reaction was studied. In the presence of nitric acid the two compounds react similarily: Two moles of the organic compound react with lA silver nitrate, forming a white precipitate and yielding a single potentiometric break.
When phenylthiourea is titrated in the presence of 0.1W sodium hydroxide silver sulfide is precipitated; the phenylcyanamide formed simultaneously reacts further with silver nitrate to form a silver phenylcyanamide precipitate. The reaction sequence is shown in the following equations:
CD S=C. ,m2
-NH
o-
•/^y- iAgNo3
Ag2S + ^ 3 " N H - C = N + 2HN03
C = N + AgN03 NH
(2)<P^N - C = N + HNO, Ag
^ \ - H - " - NH + AgN03
(3) ^ - N - C - N - A g + HN03
90
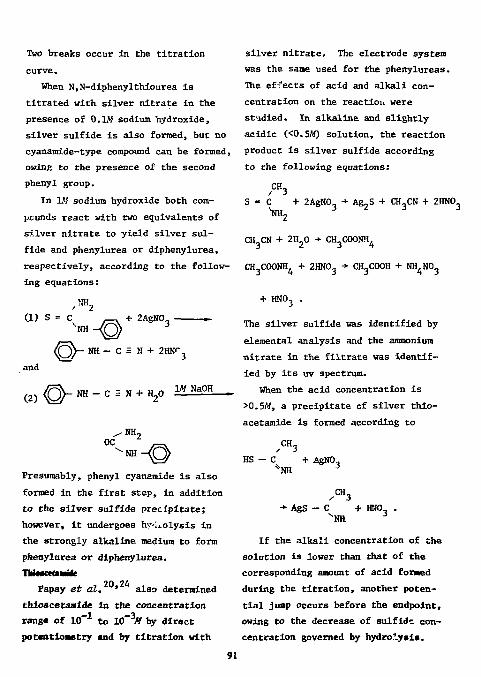
Two breaks occur in the titration curve.
When N,N-diphenylthiourea is titrated with silver nitrate in the presence of 0.1M sodium hydroxide, silver sulfide is also formed, but no cyanamide-type compound can be formed, owing to the presence of the second phenyl group.
In lflf sodium hydroxide both compounds react with two equivalents of silver nitrate to yield silver sulfide and phenylurea or diphenylurea, respectively, according to the following equations:
a) s = c ,™2
and < ^
' " — @ + 2AgN0
NH - C = N + 2W_
(2) {f%- NH - C = S + H20 W NaOH
-NH, OC
-NH -o Presumably, phenyl cyanamide is also formed in the first step, in addition to the silver sulfide precipitate; however, it undergoes hy-uolysls in the strongly alkaline medium to form phenylurea or diphenylurea.
Fapay et a t . ' also determined thioacetaaide in the concentration rang* of 10 to 10 ff by direct potentiometry and by titration with
silver nitrate. The electrode system was the same used for the phenylureas. The effects of acid and alkali concentration on the reaction were studied. In alkaline and slightly acidic (<0.5A0 solution, the reaction product is silver sulfide according to the following equations:
CH-/ 3 S = C + 2AgN0 + Ag.S + CH CN + 2HN0
"NH2 i * J J
CH,CN + 2H 20 + CH 3COONH 4
CH,C00NH4 + 2HN0, •* CH3C0OH + NH NOj
+ HNO, .
The silver sulfide was identified by elemental analysis and the ammonium nitrate in the filtrate was identified by its uv spectrum.
When the acid concentration is >0.5W, a precipitate of silver thio-acetamide is formed according to
CH, HS — C + AgNO,
*NH J
CH, AgS + HHO.
"NH 3 •
If the alkali concentration of the solution is lower than that of the corresponding amount of acid formed during the titration, another potential jump occurs before the endpoint, owing to the decrease of sulfide concentration governed by hydrolysis.
91
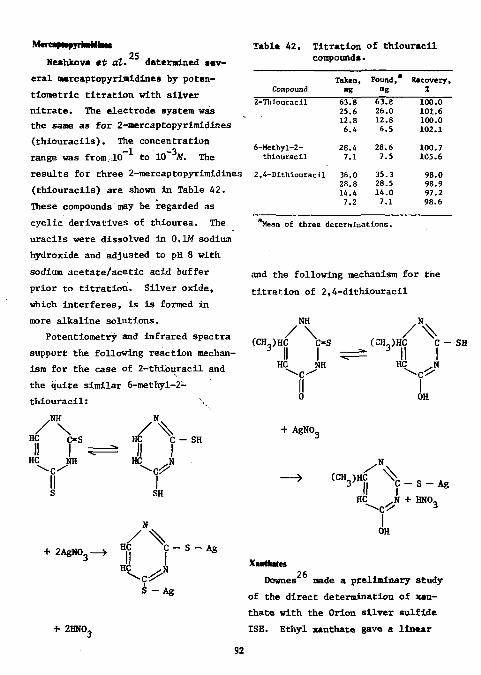
MircssntarheMtoii 25
Neshkova at at. determined several mercaptopyrintdines by poten-tiometrlc titration with sliver nitrate. The electrode system was the same as for 2-mercaptopyrimidines (thiouracils). The concentration
-1 -3 range was from^10 to 10 M. The results for three 2-mercaptopyrimidines (thiouracils) are shown in Table 42. These compounds may be regarded as cyclic derivatives of thiourea. The uracils were dissolved In 0.1W sodium hydroxide and adjusted to pH 8 with sodium acetate/acetic acid buffer prior to titration. Silver oxide, which interferes, is is formed in more alkaline solutions.
Potentiometry and Infrared spectra support the following reaction mechanism for the case of 2-thiouracil and the quite similar 6-methyl-2-thiouracil:
Table 42.
y \ HC OS II I HC m
N. HC \ C - SH
+ 2AgN0,
HC N \c^" I SH N
HC NC - S - Ag
S - A g
Titration of thlouracil compounds.
Compound Taken, Found, Recovery,
»ig ™g % 2-Thiouracil 63.8 63.8 100.0
25.6 26.0 101.6 12.8 12.8 100.0 6.4 6.5 102.1
6-Methyl-2- 28.4 28.6 100.7 thlouracll 7.1 7.5 105.6
2,4-Dlthiouracil 36.0 35.3 98.0 28.8 28.5 98.9 14.4 14.0 97.2 7.2 7.1 98.6
^ean of three determinations.
and the f o l l o w i n g mechanism f o r the
t i t r a t i o n of 2 , 4 - d i t h i o u r a c i l
(CH.)HC 3 II
HC
NH
/ \ C-S I
NH
/"%
II 0
+ AgNO,
(CH,)HC C - SH
: 3 II I HC ^N
^ C ^ I OH
/ (CH3)HC \
S - A g
HC .N + HNO,
OH
+ 2 H N 0 ,
Xantiiates 26 Downes made a preliminary study
of the direct determination of xan-thate with the Orion silver sulfide XSE. Ethyl xanthate gave a linear
92
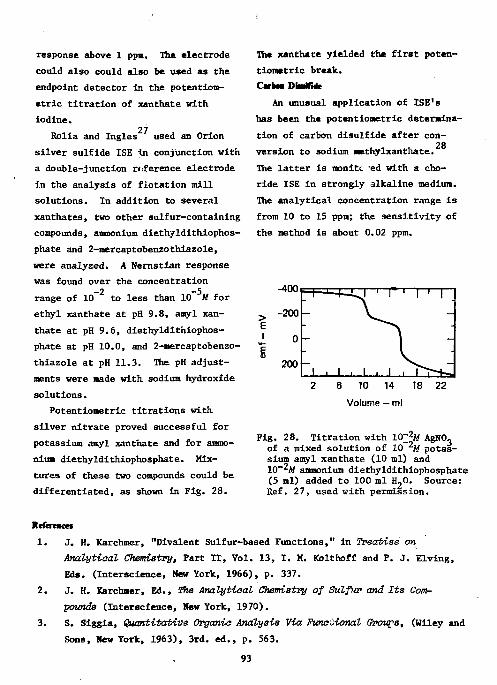
response above 1 ppm. The electrode could also could also be used as the endpoint detector in the potentiom-etric titration of xanthate with iodine.
27 Rolia and Ingles used an Orion silver sulfide ISE in conjunction with a double-junction reference electrode in the analysis of flotation mill solutions. In addition to several xanthates, two other sulfur-containing compounds, ammonium diethyldithiophos-phate and 2-mercaptobenzothiazole, were analyzed. A Nernstian response was found over the concentration
-2 -5 range of 10 to less than 10 M for ethyl xanthate at pH 9.8, amyl xanthate at pH 9.6, diethyldithiophos-phate at pH 10.0, and 2-mercaptobenzo-thiazole at pH 11.3. The pH adjustments were made with sodium hydroxide solutions.
Potentiometric titrations with silver nitrate proved successful for potassium amyl xanthate and for ammonium diethyldithiophosphate. Mixtures of these two compounds could be differentiated, as shown in Fig. 28.
The xanthate yielded the first potentiometric break. Carton DbaMMe
An unusual application of ISE's has been the potentiometric determination of carbon disulfide after con-
28 version to sodium aethylxanthate. The latter is monitc ed with a cho-ride ISE in strongly alkaline medium. The analytical concentration range is from 10 to 15 ppm; the sensitivity of the method is about 0.02 ppm.
6 10 14 18 22
Volume — ml
Fig. 28. T i t r a t i on with KTf-M AgNO, of a mixed solut ion of 10 ^U po tas sium amyl xanthate (10 ml) and 10~*M ammonium diethyldithiophosphate (5 ml) added to 100 ml H-0. Source: Ref. 27, used with permission.
•teiercacn
1. J. H. Karchmer, "Divalent Sulfur-based Functions," in Treatise on
Analytical Chemistry, Part II, Vol. 13, I. M. Kolthoff and P. J. Elving, Eds. (Interscience, New York, 1966), p. 337.
2. J. H. Karchaer, Ed., The Analytical Chemistry of Sulfur and Its Com
pounds (Interscience, Mew York, 1970). 3. S. Siggia, Quantitative Organic Analysis Via Functional Groups, (Wiley and
Sons, Mew York, 1963), 3rd. ed., p. 563.
93
4. J. Papp and J. Havas, Proc. Srd Analyt. Chemistry Conf., Publishing House of the Hungarian Academy of Sciences, Budapest, 1970, Vol. 2, p. 41.
5. I. M. Kolthoff and J. Eisenstadter, Analyt. Ckim. Acta, 24., 83 (1961). 6. J. Papp, Cellul. Chem. Technol., 5_, 147 (1971); cf. Chem. Abstr., 75,
78333d (1971). 7. J. Papp, Svensk Papperstidn., 74_, 310 (1971); cf. Chem. Abstr., 75,
30575k (1971). 8. L. C. Gruen and B. S. Harrap, Anal. Biochem., ^2_, 377 (1971). 9. W. Selig, Mikrochim. Acta, 1973, 453. 10. J. S. Fritz and T. A. Palmer, Anal. Chem., 3_, 98 (1961). 11. D. W. Gruenwedel and R. K. Patnaik, J. Agr. Food Chem., 19_, 775 (1971);
through Chem. Abst., T5_, 71311m (1971). 12. D. C. Watts, B. R. Rabin, and E. M. Crook, Biochim. Biophys. Acta, 48,
380 (1961). 13. F. Peter and R. Rosset, Analyt. Chim. Acta, 64^ 397 (1973). 14. F. Peter and R. Rosset, Analyt. Ckim. Acta, 70, 149 (1974). 15. P. K. C. Tseng and W. F. Gutknecht, Anal. Chem., 47, 2316 (1975). 16. S-t Chiu and L. Paszner, Anal. Chem., A7_, 1910 (1975). 17. B. S. Harrap and L. C. Gruen, Anal. Bioehem., VI, 398 (1971). 18. M. K. Papay, K. Toth, and E. Pungor, Analyt. Chim. Acta, 5_6_, 291
(1971). 19. M. K. Papay, K. Toth, and E. Pungor, Ion-Selea. Electrodes, Symp., 1972,
225; cf.Chem. Abstr., 7£, 26917k (1973). 20. E. Pungor, K. Toth, and M. K. Papay, Chem. Anal. (Warsaw), 1]_, 947
(1972). 21. M. Kucsera-Papay, Kern. Kozlim., 39, 35 (1973); cf. Chem. Abstr., 79,
73358; (1973). 22. A. V. Gordievskii, 0. A. Zamskaya, N. I. Sawin, V. S. Shterman, and
A. Ya. Syrchenkov, Zh. Anal. Kkim., 29_, 164 (1974). 23. M. K. Papay, V. P. Izvekov, K. Toth, and E. Pungor, Analyt. Chim. Aeta,
69, 173 (174). 24. M. K. Papay, K, Toth, V. Izvekov, and E. Pungor, Analyt. Chim. Aeta,
64., 409 (1973). 25. K. T. Neshkova, V. P. Izvekov, M. K. Papay, K. Toth, and E. Pungor,
Analyt. Chim. Acta, 75, 439 (1975).
94

26. K. W. Downes, Admin. Report ADM 68-1, Canada Dept. of Energy, Mines and Resources, p. 19 (1968).
27. E. Rolia and J. C. Ingles, Can. Mining J., f2_, 94 (1971). 28. R. Swierczek, Zesz. Nauk Politah. Slask., Chem., No. 50, 306, (1970);
through Chem. Abstr., 7±, 119819s (1971).
95
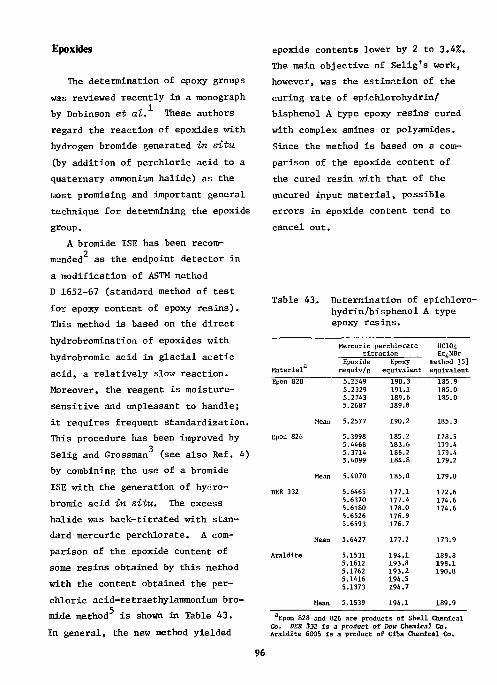
Epoxides
The determination of epoxy groups was reviewed recently in a monograph by Dobinson et at. These authors regard the reaction of epoxides with hydrogen bromide generated in situ
(by addition of perchloric acid to a quaternary ammonium halide) as the most promising and important general technique for determining the epoxide group.
A bromide ISE has been recom-2
mended as the endpoint detector in a modification of ASTM method D 1652-67 (standard method of test for epoxy content of epoxy resins). This method is based on the direct hydrobromination of epoxides with, hydrobromic acid in glacial acetic acid, a relatively slow reaction. Moreover, the reagent is moisture-sensitive and unpleasant to handle; it requires frequent standardization. This procedure has been improved by
3 Selig and Grossman (see also Eef. 4) by combining the use of a bromide ISE with the generation of hynro-bromic acid in situ. The excess halide was back-titrated with standard mercuric perchlorate. A comparison of the epoxide content of some resins obtained by this method with the content obtained the perchloric acid-tetraethylammonium bromide method is shown in Table 43. In general, the new method yielded
epoxide contents lower by 2 to 3.4%. The main objective of Selig's work, however, was the estimation of the curing rate of epichlorohydrin/ bisphenol A type epoxy resins cured with complex amines or polyamides. Since the method is based on a comparison of the epoxide content of the cured resin with that of the uncured input material, possible errors in epoxide content tend to cancel out.
Table 43. Determination of epichloro-hydrin/bisphenol A type epoxy resins.
Mercuric perchlorate titration
HCIO4 Et 4NBr
Material3
Epoxide mequiv/g
Epoxy equivalent
method [5] equivalent
Epon 828 5.2549 5.2329 5.2743 5.2687
190.3 191.1 189.6 189.8
185.9 185.0 185.0
Mean 5.2577 190.2 185.3
Epon 826 5.3998 5.4468 5.3714 5.4099
185.2 183.6 186.2 184.8
178.5 179.4 179.4 179.2
Mean 5.4070 185.0 179.0
DER 332 5.6465 5.6370 5.6180 5.6526 5.6593
177.1 177.4 178.0 176.9 176.7
172.6 174.6 174.6
Mean 5.6427 177.2 173.9
Araldlte 5.1531 5.1612 5.1762 5.1416 5.1373
194.1 193.8 193.2 194.5 194.7
189.8 198.1 190.8
Mean 5.1539 194.1 189.9
**Epon 828 and 826 are products of Shell Chemical Co. DER 332 is a product of Dov Chemical Co. Araldlte 6005 is a product of ClBa Chemical Co.
96
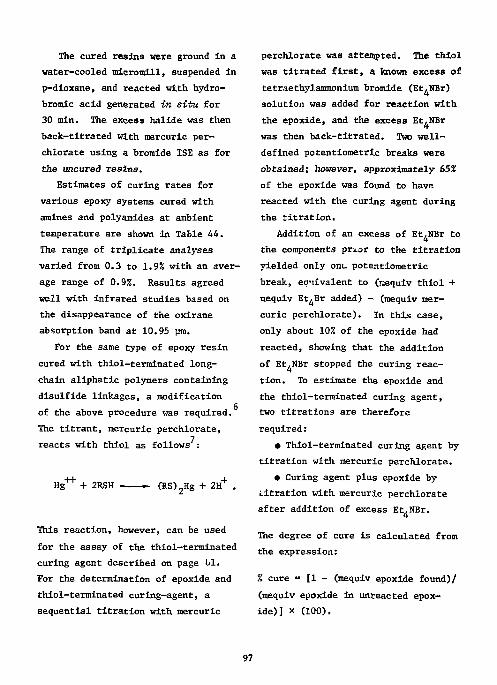
The cured resins were ground in a water-cooled mlcromill, suspended in p-dioxane, and reacted with, hydro-bromic acid generated in situ for 30 min. The excess halide was then back-titrated with mercuric perchlorate using a bromide ISE as for the uncured resins.
Estimates of curing rates for various epoxy systems cured with amines and po.lyamides at ambient temperature are shown in Table 44. The range of triplicate analyses varied from 0.3 to 1.9% with an average range of 0.9%. Results agreed well with infrared studies based on the disappearance of the oxirane absorption band at 10.95 pm.
For the same type of epoxy resin cured with thiol-terminated long-chain aliphatic polymers containing disulfide linkages, a modification of the above procedure was required. The titrant, mercuric perchlorate, reacts with thiol as follows :
H g + + + 2RSH - (RS)2Hg + 2H + .
This reaction, however, can be used for the assay of the thiol-terminated curing agent described on page til. For the determination of epoxide and thiol-terminated curing-agent, a sequential titration with mercuric
perchlorate was attempted. The thiol was titrated first, a known excess of tetraethylammonium bromide (Et.NBr) solution was added for reaction with the epoxide, and the excess Et.NBr was then back-titrated. Two well-defined potentiometrtc breaks were obtained; however, approximately 65% of the epoxide was found to have reacted with the curing agent during the titration.
Addition of an excess of Et.NBr to 4
the components prior to the titration yielded only ont. potentiometric break, eq-iivalent to (mequiv thiol + mequiv Et.Br added) - (mequiv mercuric perchlorate). In this case, only about 10% of the epoxide had reacted, showing that the addition of Et.NBr stopped the curing reaction. To estimate the epoxide and the thiol-terminated curing agent, two titrations are therefore required:
• Thiol-terminated curing agent by titration with mercuric perchlorate.
• Curing agent plus epoxide by titration with mercuric perchlorate after addition of excess Et,NBr.
4 The degree of cure is calculated from the expression:
% cure = [1 - (mequiv epoxide found)/ (mequiv epoxide in unreacted epoxide)] x (100).
97
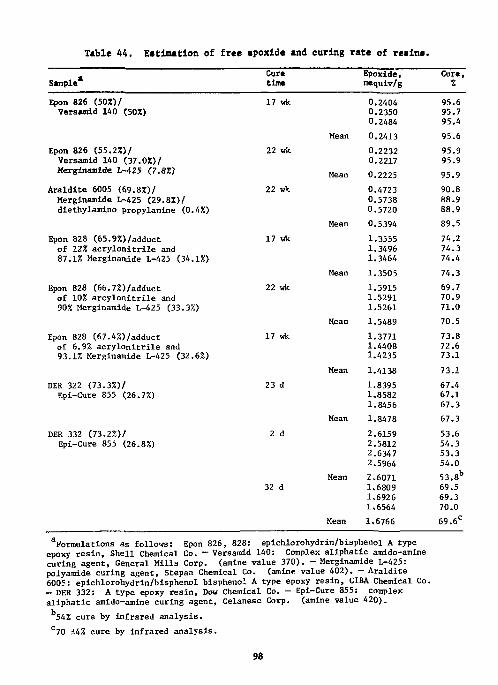
Table 44. Estimation of free epoxide and curing rate of resins.
Sample
Epon 826 (50%)/ Veraamld 140 (50%)
Epon 826 (55.2%)/ Versamid 140 (37.0%)/ Merginamide 1,-425 (7.SZ)
Araldite 6005 (69.8%)/ Merginamide L-425 (29.8%)/ diethylamino propylamine (0.4%)
Epon 828 (65.9%)/adduct of 12% acrylonitrile and 87.1% Merginamide L-425 (34.1%)
Epon 828 (66.7%)/adduct of 10% arcylonitrile and 90% Merginamide L-425 (33.3%)
Epon 828 (67.4%)/adduct of 6.9% acrylonitrile and 93.1% Merginamide L-425 (32.6%)
DER 322 (73.3%)/ Epi-Cure 855 (26.7%)
DER 332 (73.2%)/ Epi-Cure 855 (26.8%)
Cure time
17 wk
22 wk.
22 wk
17 wk
22 wk
Mean
Mean
Mean 23 d
2 d
32 d
Mean
Epoxide, mequiv/g
Cure, %
0.2404 0.2350 0.2484
95.6 95.7 95.4
0.2413 95.6 0.2232 0.2217
95.9 95.9
0.2225 95.9 0.4723 0.5738 0.5720
90.8 88.9 88.9
0.5394 89.5 1.3555 1.3496 1.3464
74.2 74.3 74.4
1.3505 74.3 1.5915 1.5291 1.5261
69.7 70.9 71.0
1.5489 70.5 1.3771 1.4408 1.4235
73.8 72.6 73.1
1.4138 73.1 1.8395 1.8582 1.8456
67.4 67.1 67.3
1.8478 67.3 2.6159 2.5812 2.6347 2.5964
53.6 54.3 53.3 54.0
2.6071 1.6809 1.6926 1.6564
53.8* 69.5 69.3 70.0
1.6766 69.6 C
Formulations as follows: Epon 826, 828: epichlorohydrln/bisphenol A type epoxy resin, Shell Chemical Co. — Versamid 140: Complex aliphatic araido-amine curing agent, General Mills Corp. (amine value 370). — Merginamide L-425: polyaraide curing agent, Stepan Chemical Co. (amine value 402). —Araldite 6005: epichlorohydrin/hisphenol bisphenol A type epoxy resin, CIBA Chemical Co. — DER 332: A type epoxy resin, Dow Chemical Co. — Epi-Cure 855: complex aliphatic amido-amine curing agent, Celanese Corp. (amine value 420).
54% cure by infrared analysis. c70 ±4% cure by infrared analysis.
98
References
1. B. Doblnson, W. Hofmann, and B. P. Stark, "The Determination of Epoxide Groups", In Monographs in Organic Functional Group Analysis, Vol. 1, R. Belcher and W. Anderson, Eds. (Pergamon, New York, 1969).
2. Orion Research, Inc., Application Bulletin Ho. 10, Cambridge, Mass. 3. W. Sellg and G. L. Crossman, Z. analyt. Chem., 253, 279 (1971). 4. W. Selig, Z. analyt, Chem., 255, 130 (1971). 5. R. R. Jay, Anal. Chem., J36, 667 (1964). 6. Analytical Chemistry Quarterly Report, 3rd Quarter, 1970, Lawrence
Llvermore Laboratory, Llvermore, Calif., Rept. UCID-15644-70-3 (1970), p. 7. 7. J. S. Fritz and T. A. Palmer, Anal. Chem., _33, 98 (1961).
99
Hydroxyl Groups (3) ClCgH4NH2 • HC1 + AgN0 3 + AgCl
Hydroxyl in Polymers
A specialized application of ISE's is the titrimetric finish of the determination of hydroxyl groups in polymers. Phosgene has been used for this determination by Bush et at.
The hydroxyl-containing material was reacted with an excess of phosgene in a suitable solvent to form the chloroformate (reaction 1). After removal of the excess reagent, the chloroformate was hydrolyzed and the chloride content of the hydrolyzate, which is equivalent to the original hydroxyl content, was determined by titration with, silver nitrate, Selig has modified the original procedure, applied it on the micro-scale, and simplified the hydrolysis and titration steps: the chloroform-ate was reacted with an excess of m-chloroaniline (reaction 2), yielding an equivalent amount of m-chloroaniline hydrochloride. The latter was titrated with standard silver nitrate (reaction 3), using a chloride ISE to monitor the titration in a partially nonaqueous medium.
0 II
(1) ROH + C0C1 2 + R0CC1 + HC1 0 0 II II
(2) R0CC1 + 2C1C 6H 4NH 2 + ROCNHCgH^Cl
+ C1C 6H 4NH 2 • HC1
+ C1C 6H 4NH 2 • HN0 3 .
This method has been applied to the determination of hydroxyl groups in polyesters, poly(ethylene oxides), and oi-epoxides. Advantages of the method are that water does not interfere and that, in contrast to all acetylation procedures, it is direct and thus capable of greater accuracy and precision. Limitations of the method are the requirements that the chloroformate formed must be sufficiently stable to withstand the application of vacuum (necessary to remove traces of phosgene and hydrogen chloride) and that samples must be soluble in a suitable aprotic solvent.
Similar modifications may be made in other analytical procedures where the final step consists of the titration of ionic halide. Vicinal Glycols
3 Efstathiou and Hadjiioannou described an automatic potentiometric reaction rate method for the determination of ethylene-, propylene--, and butylene glycol. The vicinal glycols were oxidized with periodate, and the reaction rate was followed with an Orion 92-81 perchlorate ISE. This electrode exhibits Nernstian behavior
—1 —5 at concentrat ns of 10 to 10 U in the pH range between 4 and 6, The
time required for the reaction to consume a fixed amount of periodate, and therefore for the emf to increase by a preselected amount C25 mV), was measured automatically and related directly to the vicinal glycol concentration. The three glycols in the range of 1.4 * 10~ 3 to 7.0 x 10~3M in a total volume of 28 ml were determined with relative errors of about 0.7%. Measurement times were only 15 to 150 s. A direct potentiometric method for the determination of ethylene glycol was also described. Ethylene glycol was reacted with a known excess of periodate. The unreacted periodate was then determined with a perchlorate ISE and the amount of ethylene glycol was calculated from the amount of periodate consumed. The relative error for the determination of 6 to 9 mg ethylene glycol was about 0.3%.
Carbohydrates
Honda et at. determined the periodate consumption of several carbohydrates by direct potentiometry. An iodide ISE (Toa Denpa 1-125) and a double-junction reference electrode were used to monitor emf's. The basis of this determination is the redox reaction between periodate and iodide
I0~ + 2I~ + H 20 - I0~ + I 2 + 20H".
The carbohydrates determined were D-sorbltol, D-glucose, D-glucosamine hydrochloride, D-glucuronic acid, D-glucuronic acid a-lactone, and methyl 01-D-glucopyranoside.
Samples contained 0.01 to 0.5 wM
of carbohydrate. A 10% excess of 1 x 10 M potassium iodide in 0.1M
acetate buffer (pH 5 to 6) was added to the sample solutions containing 0.5 to 2.5 x 10 M of periodate in the same buffer. After 5 min, the mixtures were extracted with carbon tetrachloride and the concentration of iodide was determined with the iodide ISE. The amount of periodate consumed was calculated from this. The results from this indirect potentiometric method agree well with those obtained by uv spectrophotometry. A consumption of 4.7 to 5.1 mole of periodate was found per mole of carbohydrate. Only methyl a-D-glucopyranoside showed a lower consumption, of 0.76 M mole periodate per mole.
Abou El-Kheir and Ahmad described a potentiometric titration for reducing sugars such as glucose. The glucose was heated with O.lAf mercuric chloride-EDTA disodium salt solution. The unconsumed mercuric ion was determined without filtration by adding an excess of 0.1W alkaline sodium sulfide solution and back-titrating the excess sulfide ion with 0.1M mercuric chloride-EDTA solution. The
endpoints were monitored potentiomet-rically by a sulfide ISE (Radelkis OP-S-712C) and an SCE reference electrode. Between 12 and 42 mg of glucose were determined with an average error of ±1-2%. Formal&hyde
Ikeda has used an Orion iodide ISE (94-53) and an SCE in the determination of formaldehyde. The sample was treated with iodine-iodide solution, and the excess iodide was titrr.ted potentiometrically with silver ions:
HCHO + I 2 + 2K0H + 2KI + HCOOH + H 20
KI + AgNO -»• Agl + KNO
HCHO = 2KI = 2AgN0 3
according to the sequence of reactions given above. Some results are presented in Table 45. Formic acid and methanol in equimolar amounts to the formaldehyde did not interfere, even ten times that amount gave rise
to a positive error of less than 1%. Since acetone and acetaldehyde react with iodine, however, they interfere strongly. Primary Amino Groups
Hassan has determined some primary aromatic amines by forming their hydrochloride salts in ether with gaseous hydrogen chloride. An Orion chloride If C94-17A) and a double-junction reference electrode were used to measure emf's directly or to monitor the potentiometric titration with silver nitrate. Some results are shown in Table 46. The method cannot be applied in the presence of alkali metal or ammonium salts of carboxylic and sulfonic acids, or when the amino compounds are insoluble in ether. Carboxylic Acids in the Presence of Acyl Chlorides
A similar sequence of reactions to that used for the determination of hydroxyl groups in polymers has been employed in a procedure for the semi-microdetermination of carboxylic acids in the presence of a large
o excess of acyl chloride :
Table 45. Determination of formaldehyde in dilute solutions.
:entration, M HCHO
Rel. error, %
Rel. std Cone :entration, M Taken,
mg Found, mg
Rel. error, %
dev, HCHO, 10 ml I2-KI, 10 ml AgN0 3
Taken, mg
Found, mg
Rel. error, % %
0.05 0.1 0.2 15.76 15.75 -0.06 0.1 0.005 0.01 0.2 1.576 1.577 +0.06 0.2 0.0005 0.001 0.01 0.158 0.170 +7.6 0.4
102
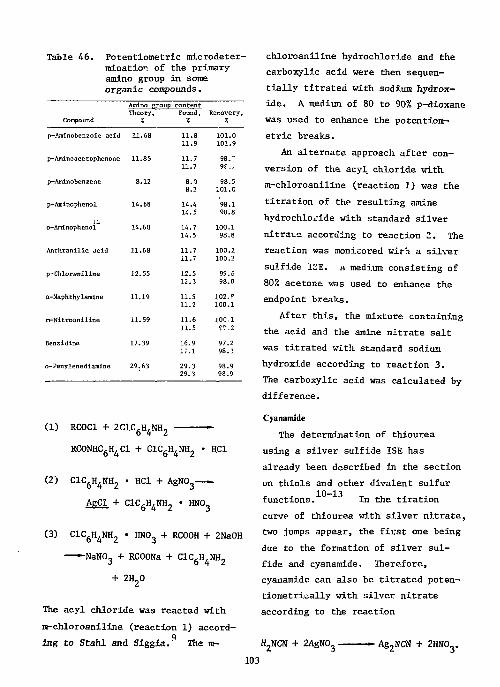
Table 46. Potentiometric microdeter-minatior. of the primary amino group in some organic compounds.
Compound
Amino group Theory,
Z
content Found,
7. Recovery, ;:
p-Aminobenzoic acid 11.68 11.8 11.9
101.0 101.9
p-Aminoacetophenone 11.85 11.7 11.7
98." 9f ..
p-Aminobenzene 8.12 8.0 8.2
98.5 101.0
p-Aminophenol 14.68 14.4 14.5
98.1 98.8
JO o-Aminophenol 14.68 14.7 14.5
100.1 98.8
Anthranilic acid 11.68 11.7 11.7
100.2 100.2
p-Chloraniline 12.55 12.5 12.3
99.6 98.0
a-Naphthylamine 11.19 11.5 11.2
102. P 100.1
m-Nitroaniline 11.59 11.6 11.5
10C.1 9?.2
Benzidine 17.39 16.9 17.1
97.2 98.3
o-Penylenediamine 29.63 29.3 29.3
98.9 98.9
chloroaniline hydrochloride and the carboxylic acid were then sequentially titrated with sodium hydroxide. A medium of 80 to 90% p-dioxane was used to enhance the potentiometric breaks.
An alternate approach after conversion of the acyl chloride with, m-chloroaniline (reaction 1) was the titration of the resulting amine hydrochloride with standard silver nitrate according to reaction 2. The reaction was monitored wirh a silver sulfide ISE. A medium consisting of 80% acetone was used to enhance the endpoint breaks.
After this, the mixture containing the acid and the amine nitrate salt was titrated with standard sodium hydroxide according to reaction 3. The carboxylic acid was calculated by difference.
(1) RC0C1 + 2C1C 6H 4NH 2 -
RC0NHC 6H 4C1 + CICgH.NH, • HC1
(2) C1C 6H 4NH 2 • HC1 + A g N 0 3 — -AgCl + C1C 6H 4NH 2 • HN0 3
(3) C1C 6H 4NH 2 • HN0 3 + RC00H + 2Na0H — - N a N 0 3 + RCOONa + ClCgH.NHj
+ 2H 20
The acyl chloride was reacted with m-chloroaniline (reaction 1) accord-
q ing to Stahl and Siggia. The m-
Cyanamide The determination of thiourea
using a silver sulfide ISE has already been described in the section on thiols and other divalent sulfur functions. In the tiration curve of thiourea with silver nitrate, two jumps appear, the first one being due to the formation of silver sulfide and cyanamide. Therefore, cyanamide can also be titrated poten-tiometrically with silver nitrate according to the reaction
H 2NCN + 2AgN0 3 - • Ag 2NCN + 2HN0 3. 103
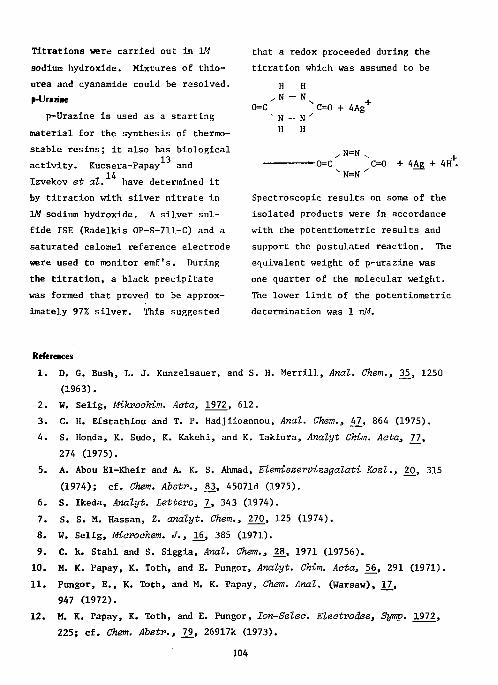
Titrations were carried out in \M
sodium hydroxide. Mixtures of thiourea and cyanamide could be resolved. p-IJriniK
p-Urazine is used as a starting material for the synthesis of thermostable resins; it also has biological
13 activity. Kucsera-Papay and 14 Izvekov et al. have determined it
by titration with silver nitrate in 1W sodium hydroxide. A silver sulfide ISE (Radelkis 0P-S-711-C) and a saturated calomel reference electrode were used to monitor emf's. During the titration, a black precipitate was formed that proved to be approximately 97% silver. This suggested
that a redox proceeded during the titration which was assumed to be
0=C C=0 + 4Ag
-0=C C=0 + 4Ag + 4H . N N=N '
Spectroscopic results on some of the isolated products were in accordance with the potentiometric results and support the postulated reaction. The equivalent weight of p-urazine was one quarter of the molecular weight. The lower limit of the potentiometric determination was 1 mM.
References 1. D. G. Bush, L. J. Kunzelsauer, and S. H. Merrill, Anal. Chem., 35., 1250
(1963). 2. W. Selig, Mikrockim. Acta, 1972, 612. 3. C. H. Efstathiou and T. P. Hadjiioannou, Anal. Chem., W]_, 864 (1975). 4. S. Honda, K. Sudo, K. Kakehi, and K. Taklura, Analyt Chim. Acta, ]T_,
274 (1975). 5. A. Abou El-Kheir and A. K. S. Ahmad, Elemiszervizsgalati Kozl., ^0_, 315
(1974); cf. Chem. Abstr., 83, 45071d (1975). 6. S. Ikeda, Analyt. Letters, ]_, 343 (1974). 7. S. S. M. Hassan, Z. analyt. Chem., 2_70, 125 (1974). 8. W. Selig, Microohem. J., 16, 385 (1971). 9. C. R. Stahl and S. Siggia, Anal. Chem., 28, 1971 (19756).
M. K. Papay, K. Toth, and E. Pungor, Analyt. Chim. Aota, 5_6_, 291 (1971). Pungor, E., K. Toth, and M. K. Papay, Chem. Anal. (Warsaw), 17, 947 (1972). M. K. Papay, K. Toth, and E. Fungor, Ion-Seleo. Electrodes, Symp. 1972, 225; cf. Chem. Abstr., T±, 26917k (1973).
104
10 11
12

13. M. Kucsera-Papay, Kern. Kozlem., 39_, 35 (1973); cf. Chem. Abstv., 79, 73358p (1973).
14. V. P. Izvekov, M. Kucsera-Papay, K. Toth, and E. Pungor, Analyst, 9T_, 634 (1972).
105
Physiologically Active Compounds
This section describes the application of ISE's to the analysis of a variety of physiologically active compounds such as proteins, vitamins, etc. Some physiological compounds may also be found in preceding sections, as shown in the following summary:
Compound page
Thyroxin, 3,3,5'-triiodo-L-thyronine 38
Chloride salts of some drugs, chlorine- in pharmaceuticals 38-39
Chlorine-containing pesticides 42 Antiseptics, artificial sweeteners
Amino acids Acetylcholine Diphenhydramine, dextro-methorphanium cation
56 56-57 65
66 Choline, acetylcholine, topine, scopolamine, atropine 67
Glutathione, cysteine 80 Trypsin, ribonuclease, insulin, etc. 89
Carbohydrates 101
Chymotrypsin. A simple direct titration of active a-chymotrypsin makes use of a fluoride ISE. Measurement of as little as 0.03 mM of the enzyme is possible with about 3% precision. The specific reagent diphenylcarbamyl fluoride (DPCF) inactivates the enzyme, liberating an equimolar amount of fluoride ion that
is determined by the ISE. The reaction is
DPCF + chymotrypsin •*
uPC-chymotrypsin + F
This technique is three times more sensitive than previously used methods. StandarL curves were constructed by determining emf's at various fluoride concentrations in the presence of equimolar quantities of chymotrypsin. Solutions ranged from 50 to 0.002 mM. They also contained 1% methanol, which was required to keep the DPCF in solution.
Cyanogenic Glycosides. Cyanide resulting from the hydrolysis of cyanogenic glycosides in Sudan grass has been determined with a cyanide
2 ISE. After accelerated hydrolysis with emulsin, the cyanide was determined by direct potentiometric measurement in the hydrolyzate. The medium was 0.05W in potassium acid phthalate and 0.022W in sodium hydroxide. A linear response was obtained over the range of 10 to —6 '
10 M cyanide. Cyanocobalamine. Another applica
tion of the cyanide ISE is in the analysis of cyanocobalamine. Equimolar amounts of hydrogen cyanide are liberated either by quantitative reduction or by illumination. The reduction can be carried out with ascorbic acid, with stannous chloride 106
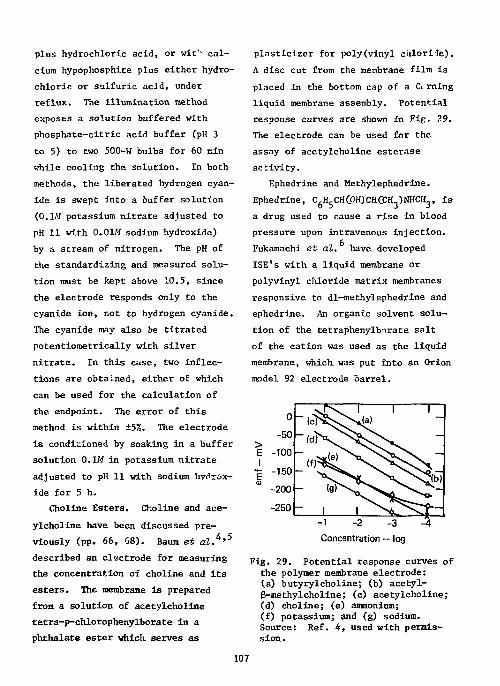
plus hydrochloric acid, or wit'- calcium hypophosphite plus either hydrochloric or sulfuric acid, under reflux. The illumination method exposes a solution buffered with phosphate-citric acid buffer (pH 3 to 5) to two 500-W bulbs for 60 min while cooling the solution. In both methods, the liberated hydrogen cyanide is swept into a buffer solution (0.1/'/ potassium nitrate adjusted to pH 11 with O.OlAf sodium hydroxide) by a stream of nitrogen. The pH of the standardizing and measured solution must be kept above 10.5, since the electrode responds only to the cyanide ion, not to hydrogen cyanide. The cyanide may also be titrated potentiometrically with silver nitrate. In this case, two inflections are obtained, either of which can be used for the calculation of the endpoint. The error of this method is within ±5%. The electrode is conditioned by soaking in a buffer solution 0.1M in potassium nitrate adjusted to pH 11 with sodium hydroxide for 5 h.
Choline Esters. Choline and ace-ylcholine have been discussed previously (pp. 66, 68). Baura et at.**'5
described an electrode for measuring the concentration of choline and its esters. The membrane is prepared from a solution of acetylcholine tetra-p-chlorophenylborate in a phthalate ester which, serves as
plasticizer for poly(vinyl chloride). A disc cut from the membrane film is placed in the bottom cap of a 6 rning liquid membrane assembly. Potential response curves are shown in Fig. 29. The electrode can be used for the assay of acetylcholine esterase activity.
Ephedrine and Methylephedrine. Ephedrine, C6H5CH(OH)CHCCH3)NHCH3, ±s
a drug used to cause a rise in blood pressure upon intravenous injection. Fukamachl et at. have developed ISE's with a liquid membrane or polyvinyl chloride matrix membranes responsive to dl-methylephedrine and ephedrine. An organic solvent solution of the tetraphenylborate salt of the cation was used as the liquid membrane, which, was put into an Orion model 92 electrode barrel.
0 -50
-100 -150 -200 -250
-(c>5^> 1 1
S^a) 1 _
~ ( d N ^ —
> <
^ "^X^bj
~ 1 i T "sr -1 -2 Concentration -
-3 log
Fig. 29. Potential response curves of the polymer membrane electrode: (a) butyrylcholine; (b) acetyl-g-methylcholine; (c) acetylcholine; (d) choline; (e) ammonium; (f) potassium; and (g) sodium. Source: Ref. 4, used with permission.
107
The polyvinyl chloride iiatrix membrane was prepared as follows: A 20?, (w/w) of PVC in tetrahydrofuran, dioctylphthalate, and the tetraphen-ylborate salt of the cation were mixed in the weight ratio 25:10:2. The mixture was spread on a glass plate and dried by evaporation. A disc cut from this membrane was affixed tc an Orion model 92 electrode barrel.
The methylephedrine ISE exhibited an approximately Nernstian response
-A down to 10 14. The ephedrine ISE showed Nernstian response down to 10 M. The emf's of both ISE's were independent of pH from 1.5 to 8.0. The interference of sodium, potassium, ammonium, and calcium ions was extremely low for both ISE's. Caffeine, antipyrine, aspirin, aminopy-rine, vitamin C, and sulpyrine, which are usually present in drugs, did not interfere with the methylephedrine ISE. Diphenhydramine and chlorpheniramine ions, however, interfered seriously. The polyvinyl chloride membrane electrode was also used as the indicator electrode in the precipitation titration of methylephedrine with tetraphenylborate.
Saccharin. Hazemoto et at. prepared an ISE responsive to saccharin (o-sulfobenzoic acid imide). The liquid membrane was prepared as follows: 60u mole of bathophenanthro-line was dissolved in 100 ml nitro-
—4 benzene, 50 ml 3 x 10 It aqueous ferrous ammonium sulfate was added to form the iron(II) chelate of bathophenanthroline. Then, 200 ml _2 10 M aqueous sodium saccharin vis
added and the mixture was shaken for 10 min. The nitrobenzene solution was separated from the aqueous phase and used as the liquid membrane. The ISE prepared with this membrane showed a linear response of 57 mV/ decade over the range of 10 to 10 M. Other sweetening substances such as saccharose, glucose, sodium cyclamate, and sorbitol did not interfere. A stable emf was developed within 2 to 3 s, and was stable for at least 1 h. The emf was not appreciably affected by pH variations between 3 and 10. The presence of large amounts of benzoic acid and of salicylic acid causes appreciable errors. These compounds can be masked by aluminum sulfate, or by passing the sample solution through a Sephadex column.
8 9 Vitamins. Ishibashi et at. ' prepared ISE's for vitamin B. (thiamine) and B, (pyridoxine). The liquid membranes were prepared by using ion-association extraction systems. Vitamins B, and B,. were
1 6 extracted into organic solvents such as 1,2-dichloroethane or nitrobenzene with tetraphenylborate or dipicryla-mine respectively, in an aqueous medium at pH 3 to 5. The organic
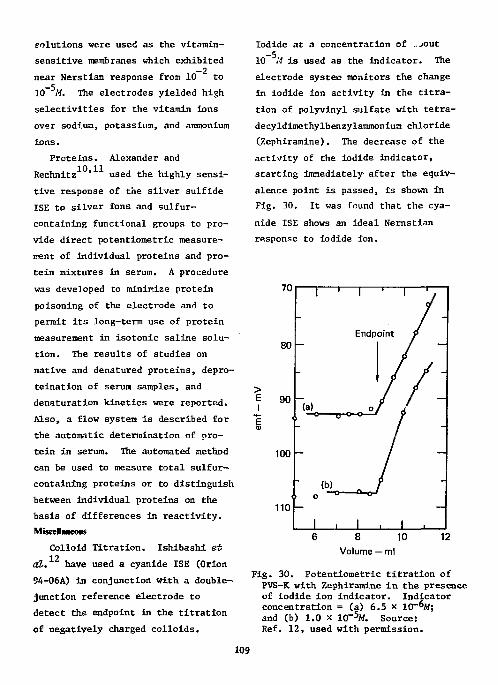
solutions were used as the vitamin-sensitive membranes which exhibited
-2 near Nerstian response from 10 to 10~ M. The electrodes yielded high selectivities for the vitamin ions over sodium, potassium, and ammonium ions.
Proteins. Alexander and Rechnitz ' used the highly sensitive response of the silver sulfide ISE to silver ions, and sulfur-containing functional groups to provide direct potentiometric measurement of individual proteins and protein mixtures in serum. A procedure was developed to minimize protein poisoning of the electrode and to permit its long-term use of protein measurement in isotonic saline solution. The results of studies on native and denatured proteins, depro-teination of serum samples, and denaturation kinetics were reported. Also, a flow system is described for the automatic determination of protein in serum. The automated method can be used to measure total sulfur-containing proteins or to distinguish between individual proteins on the basis of differences in reactivity. Miscellaneous
Colloid Titration. Ishibashi et 12 at. have used a cyanide ISE (Orion
94-06A) in conjunction with a double-junction reference electrode to detect the endpoint in the titration of negatively charged colloids.
Iodide at a concentration of -jout 10~ li is used as the indicator. The electrode systen monitors the change in iodide ion activity in the titration of polyvinyl sulfate with tetra-decyldimethylbenzylammonium chloride CZephiramine). The decrease of the activity of the iodide indicator, starting Immediately after the equivalence point is passed, is shown in Fig. 30. It was found that the cyanide ISE shows an ideal Nernstian response to iodide ion.
8 10 Volume — ml
Fig. 30. Potentiometric titration of PVS-K with Zephiramine in the presence of iodide ion indicator. Indicator concentration = (a) 6.5 x 10~6M; and (b) 1.0 x 10~5W. Source: Ref. 12, used with permission.
109
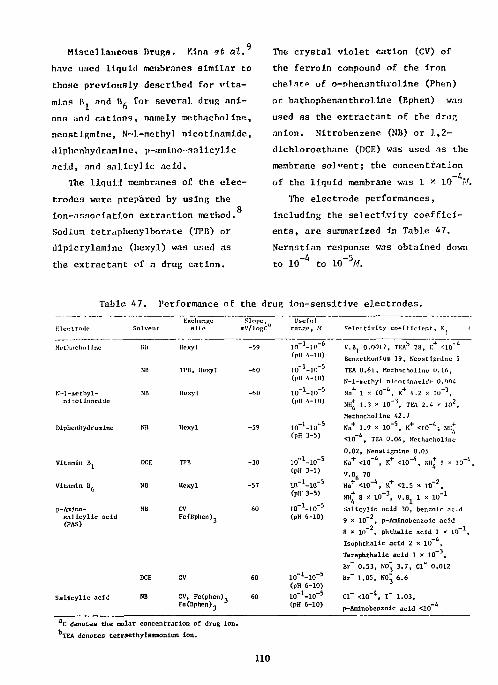
Miscellaneous "rugs. Kina et at. have used liquid mcfnbranes similar to those previously described for vitamins B, and B, for several drug ani-
1 n ons and cations, namely methacholine, neostigmine, N-1-methyl nicotinamide, diphenhydramine, p-amino-salicylic acid, and salicylic acid.
The liquid membranes of the electrodes were prepared by using the
P ion-association extraction method. Sodium tetr.iphenylborate (TPB) or dipicrylamlne (hexyl) was used as the extractant of a drug cation.
The crystal violet cation (CV) of the ferroln compound of the iron chelate uf o-nhenanthroline (Phen) or bathophenanthroline (Bphen) wa3 used as the extractant of the drug anion. Nitrobenzene (NB) or 1,2-dichloroethane (DCE) was used as the membrane solvent; the concentration
-4. of the liquid membrane was 1 * 10 /•/. The electrode performances,
including the selectivity coefficients, are summarized in Table 47. Nernstian response was obtained down to lO - 4 to W~5M.
Table 47. Performance of the drug ion-sensitive electrodes. Exchange Slope, Useful
Electrode Solvent site mV/loRC'"1 ranRc, M Selectivity coefficient, K i
Mftll.-ichoUnc Nil Hexyl -59 io- ]-jo" 6
(pH 4-10) V.Bj 0.0017, TEAb 28, K + <I0~ 4
Benzethonlum 19, Neostigmines 5 m TJ'B, Hexyl -60
(pH 4-10) TEA 0.6l, MethachoHnu 0.16, t.'-l-methyl nicotinamide 0.00/,
N-l-wethyl- NB llexy] -60 10"" 1 - 1 0 - 5 Na + 1 y- 10"*, K + S.2 x 10~ 3, nicotinamlde (pit 4-10) MH* 1.3 * 10" 3, TEA 2.4 x 10 2,
Methacholine 42.7 Diphenhyd ramine N'B Hexyl -59 io - 1-i(T 5 Na + 1.9 * 1 0 - 5 , K + <10~S mi*
<10~\ TEA 0.04, Methacholine (pH 3-5) Na + 1.9 * 1 0 - 5 , K + <10~S mi* <10~\ TEA 0.04, Methacholine 0.02, Neostigmine 0.05
Vitamin B DCE TI'B -30 io~ 1-io - 5 + -4 + -4 + -4 Ha <10 , K <10 , NHj 1 * 10 , V.B, 70 + -4 + -2 Ha <10 , K <2.5 x 10 *,
Vitamin B (pit 3-5)
+ -4 + -4 + -4 Ha <10 , K <10 , NHj 1 * 10 , V.B, 70 + -4 + -2 Ha <10 , K <2.5 x 10 *, Vitamin B , NB Hexyl -57 1 0 _ 1 - 1 0 ~ 5
+ -4 + -4 + -4 Ha <10 , K <10 , NHj 1 * 10 , V.B, 70 + -4 + -2 Ha <10 , K <2.5 x 10 *, Vitamin B ,
(pH 3-5) NH* 8 * 10~ 3, V.Bn 1 x 10" 1
4 1 Salicylic acid 30, benzoic ac.d p~Amino KB CV 60 IO^-IO"5
NH* 8 * 10~ 3, V.Bn 1 x 10" 1
4 1 Salicylic acid 30, benzoic ac.d
salicylic acid <PAS)
Fe(Bphen)- (pH 6-10) -2 9 x 10 , p-Aminobenzoic acid
8 x l o " 2 , phtlialic acid 1 * 1 0 - 1 ,
Isophthalic acid 2 x 10~ ,
Terephthalic acid 1 x 10~ ,
Br~ 0.53, N 0 ~ 3.7, C l ~ 0.012
Br" 1.05, NO" 6.6 DCE CV 60 10" 1-10~ 5
-2 9 x 10 , p-Aminobenzoic acid
8 x l o " 2 , phtlialic acid 1 * 1 0 - 1 ,
Isophthalic acid 2 x 10~ ,
Terephthalic acid 1 x 10~ ,
Br~ 0.53, N 0 ~ 3.7, C l ~ 0.012
Br" 1.05, NO" 6.6
Salicylic acid »B CV, Fe(phen). Fe(Bphen)3
(pH 6-10)
(pH 6-10) Cl~ <10 , I 1.03, p-Aminobenzoic acid <10~
a C denotes the molar concentration of drug ion. TEA denotes tetraethylammonium ion.
110
The methacholine ISE vas also used ISE also responds to non-Ionic 1-in the potentiometric titration of fluoro-2,4-dinitrobenzene and to cal-methacholine chloride with sodium cium ions. A linear relationship was tetraphenylborate. The results found between emf and the logarithm agreed well with the argentimetric of the concentration of l-fluoro-2,4-titration of the chloride ion, dinltrobenzene. However, the analo
gous chloro compound, l-chloro-2,4-l-Fluoro-2,4-dinitrobenzene. dinitrobenzene had no effect on the
13 Zentner found that the fluoride chloride ISE. References
1. B. F. Erlanger and R. A. Sack, Anal. Bioohem., 33^, 318 (1970). 2. W. J. Blaedel, D. B. Easty, L. Anderson, and T. L. Farrell, Anal. Chem.,
43, 90 (1971). 3. Y. M. Dessouky and E. Pungor, Analyst, %., 442 (1971). 4. G. Baum, M. Lynn, and F. B. Ward, Analyt. Cki-m. Acta, j>5, 385 (1973). 5. G. Baum and M. Lynn, U.S. Pat. 3,840,452 (8 Oct. 1974); cf. Chem. Abstr.,
82 , 121269w (1975). 6. K. Fukamachi, R. Nakagaws, M. Morimoto, and N. Ishibashi, Bunseki Kagaku,
24, 428 (1975). 7. N. Hazemoto, N. Kamo, and Y. Kobatake, J. Assoc. Off. Anal. Chem., 57,
1205 (1974). 8. N. Ishibashi, K. Kina, and N. Maekawa, Chem. Letters, 1973, 119. 9. K. Kina, N. Maekawa, and N. Ishibashi, Bull. Chem. Soa. Japan, ^6, 2772
(1973). 10. P. W. Alexander and G. A. Rechnitz, Anal. Chem., 46, 250 (1974). 11. P. W. Alexander and G. A. Rechnitz, Anal. Chem., 46^ 860 (1974). 12. N. Ishibashi, K. Kina, and K. Tamura, Anal. Letters, JS, 867 (1975). 13. H. Zentner, Chem. Ind. (London), 1973, 480.
Ill
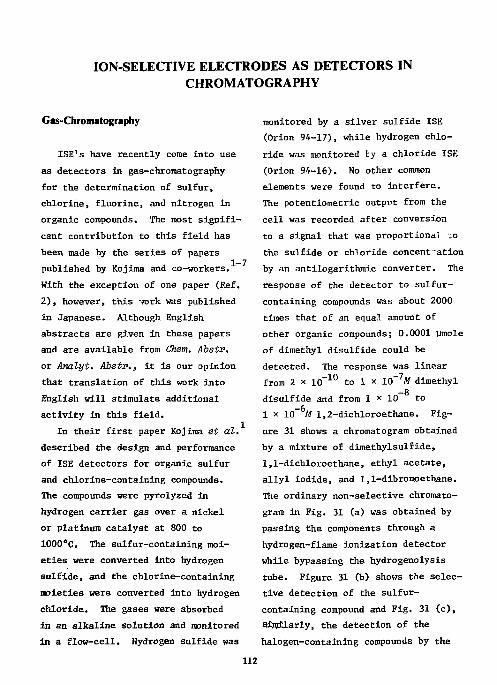
ION-SELECTIVE ELECTRODES AS DETECTORS IN CHROMATOGRAPHY
Gas-Chromatography
ISE's have recently come into use as detectors in gas-chromatography for the determination of sulfur, chlorine, fluorine, and nitrogen in organic compounds. The most significant contribution to this field has been made by the series of papers published by Kojima and co-workers. With the exception of one paper (Ref. 2), however, this -fork was published in Japanese. Although English abstracts are given in these papers and are available from Chem. Abstr. or Analyt. Abstr. 3 it is our opinion that translation of this work into English will stimulate additional activity in this field.
In their first paper Kojima et at. described the design and performance of ISE detectors for organic sulfur and chlorine-containing compounds. The compounds were pyrolyzed in hydrogen carrier gas over a nickel or platinum catalyst at 800 to 1000oC. The sulfur-containing moieties were converted into hydrogen sulfide, and the chlorine-containing moieties were converted into hydrogen chloride. The gases were absorbed in an alkaline solution and monitored in a flow-cell. Hydrogen sulfide was
monitored by a silver sulfide ISE (Orion 94-17), while hydrogen chloride was monitored ty a chloride ISE (Orion 94-16). No other common elements were found to interfere. The potentiometric output from the cell was recorded after conversion to a signal that was proportional ;o the sulfide or chloride concent-ation by an antilogarithmic converter. The response of the detector to sulfur-containing compounds was about 2000 times that of an equal amount of other organic compounds; 0.0001 pinole of dimethyl disulfide could be detected. The response was linear from 2 x 1 0 ~ 1 0 to 1 x 10 W dimethyl
—8 disulfide and from 1 x 10 to 1 x 10~ M 1,2-dichloroethane. Figure 31 shows a chromatogram obtained by a mixture of dimethylsulfi.de, 1,1-dichloroethane, ethyl acetate, allyl iodide, and 1,1-dibromoethane. The ordinary non-selective chromatogram in Fig. 31 (a) was obtained by passing the components through a hydrogen-flame ionization detector while bypassing the hydrogenolysis tube. Figure 31 (b) shows the selective detection of the sulfur-containing compound and Fig. 31 (c), similarly, the detection of the halogen-containing compounds by the
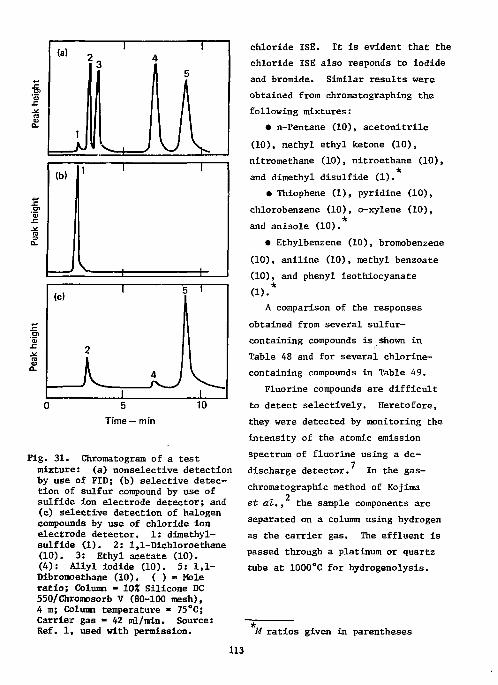
(a)
1 K ! ..U
Time — min
Fig. 31. Chromatogram of a test mixture: (a) nonselective detection by use of FID; (b) selective detection of sulfur compound by use of sulfide Ion electrode detector; and (c) selective detection of halogen compounds by use of chloride ion electrode detector. 1: dimethyl-sulflde (1). 2: 1,1-Dichloroethane (10). 3: Ethyl acetate (10). (4): Allyl iodide (10). 5: 1,1-Dibronoethane (10). ( ) = Mole ratio; Column - 102 Silicone DC 550/Chromosorb V (80-100 mesh), 4 m; Column temperature - 75"C; Carrier gas » 42 ml/rain. Source: Ref. 1, used with permission.
chloride ISE. It is evident that the chloride ISE also responds to iodide and bromide. Similar results were obtained from chromatographing the following mixtures:
• n-Pentane (10), acetonitrile (10), methyl ethyl ketone (10), nitromethane (10), nitroethane (10), * and dimethyl disulfide (1).
• Thiophene (1), pyridine (10), chlorobenzene (10), o-xylene (10), * and anisole (10).
• Ethylbenzene (10), bromobenzene (10), aniline (10), methyl benzoate (10), and phenyl isothiocyanate * (1).
A comparison of the responses obtained from several sulfur-containing compounds is shown in Table 48 and for several chlorine-containing compounds in Table 49.
Fluorine compounds are difficult to detect selectively. Heretofore, they were detected by monitoring the intensity of the atomic emission spectrum of fluorine using a dc-discharge detector. In the gas-chroma tographic method of Kojima
2 et at., the sample components are separated on a column using hydrogen as the carrier gas. The effluent is passed through a platinum or quartz tube at 1000°C for hydrogenolysis.
M ratios given in parentheses
113
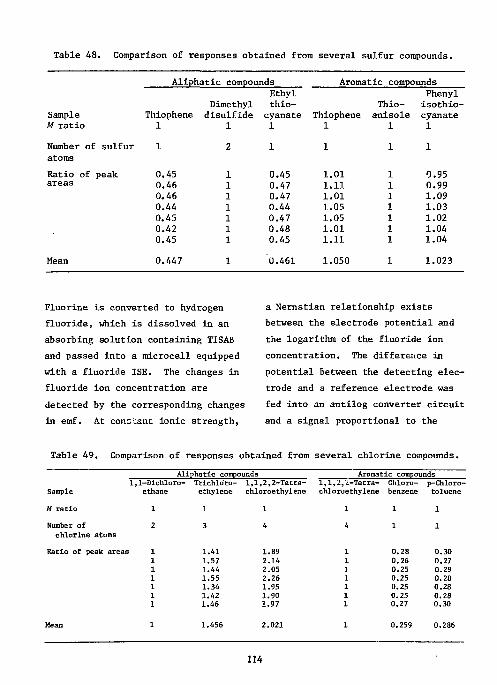
Table 48. Comparison of responses obtained from several sulfur compounds.
A l i p h a t i c compounds Aromat ic compounds
Sample M r a t i o
Thiophene 1
Dimethyl d i s u l f i d e
1
E t h y l t h i o -
c y a n a t e 1
Thiophene 1
T h i o -a n i s o l e
1
Pheny l i s o t h i o -c y a n a t e
1
Number of s u l f u r 1 2 1 1 1 1 atoms
R a t i o of peak a r e a s
0 .45 0 .46 0 .46 0 .44 0 .45 0.42 0 .45
1 1 1 1 1 1 1
0 .45 0 .47 0 .47 0 .44 0 .47 0 .48 0 .45
1 .01 1.11 1 .01 1.05 1.05 1 .01 1.11
1 1 1 1 1 1 1
0 .95 0 .99 1.09 1.03 1.02 1.04 1.04
Mean 0 .447 1 0 .461 1.050 1 1.023
Fluorine is converted to hydrogen fluoride, which is dissolved in an absorbing solution containing TISAB and passed into a microcell equipped with a fluoride ISE. The changes in fluoride ion concentration are detected by the corresponding changes in emf. At constant ionic strength,
a Nernstian relationship exists between the electrode potential and the logarithm of the fluoride ion concentration. The difference in potential between the detecting electrode and a reference electrode was fed into an antilog converter circuit and a signal proportional to the
Table 49. Comparison of responses obtained from several chlorine compounds. Al ipha t i c compounds Aromatic compounds
1, Sample
,1 -Dichloro-ethane
T r i c h l o r o -e thylene
1 , 1 , 2 , 2 - T e t r a -ch lo roe thy lene
1 , 1 , 2 , 2 - T e t r a -ch loroe thy lene
Chloro-benzene
p-Chloro-to luene
M r a t i o 1 1 1 1 1 1
Number of c h l o r i n e atoms
2 3 4 4 1 1
Rat io of peak a r ea s 1 1 1 1 1 1 1
1.41 1.57 1.44 1.55 1.34 1.42 1.46
1.89 2.14 2.05 2.26 1.95 1.90 1.97
1 1 1 1 1 1 1
0.28 0.26 0.25 0.25 0.25 0.25 0.27
0.30 0.27 0.29 0.28 0.28 0.28 0.30
Mean 1 1.456 2.021 1 0.259 0.286
114
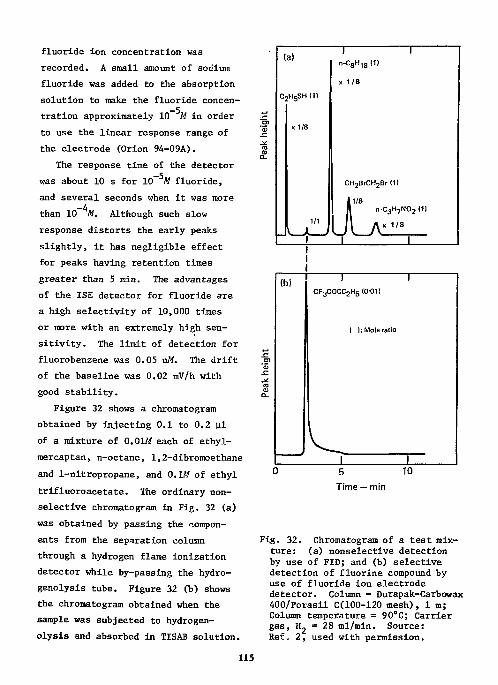
fluoride ion concentration was recorded. A small amount of sodium fluoride was added to the absorption solution to make the fluoride concentration approximately 10 M in order to use the linear response range of the electrode (Orion 94-09A).
The response time of the detector was about 10 s for 10~ M fluoride, and several seconds when it was more
-4 than 10 M. Although such slow response distorts the early peaks slightly, it has negligible effect for peaks having retention times greater than 5 min. The advantages of the ISE detector for fluoride are a high selectivity of 10,000 times or more with an extremely high sensitivity. The limit of detection for fluorobenzene was 0.05 nM. The drift of the baseline was 0.02 mV/h with good stability.
Figure 32 shows a chromatogram obtained by injecting 0.1 to 0.2 ul of a mixture of 0.01W each of ethyl-mercaptan, n-octane, 1,2-dibromoethane and 1-nitropropane, and 0.1M of ethyl trifluoroacetate. The ordinary nonselective chromatogram in Fig. 32 (a) was obtained by passing the components from the separation column through a hydrogen flame ionization detector while by-passing the hydro-genolysis tube. Figure 32 (b) shows the chromatogram obtained when the sample was subjected to hydrogen-olysis and absorbed in TISAB solution.
(a)
C2H5SH(1)
CH 2 BrCH 2 Br(1)
11/8 II n-C 3H 7N0 2(1l
. A A ' 1 ' 8
(b) T 1 C F 3 C 0 C C 2 H 5 (0-01)
I I; Mole ratio
5 Time-
10
Fig. 32. Chromatogram of a test mixture: (a) nonselective detection by use of FID; and (b) selective detection of fluorine compound by use of fluoride ion electrode detector. Column = Durapak-Carbowax 400/Porasil C(100-120 mesh), 1 m; Column temperature = 90°C; Carrier gas. Ref.
H„ 28 ml/min. Source: 2, used with permission.
115
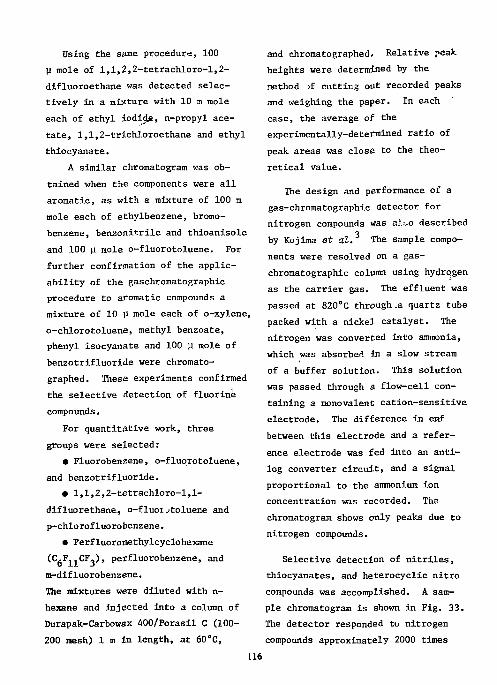
Using the same procedure, 100 u mole of l,l,2,2-tetrachloro-l,2-difluoroethane was detected selectively in a mixture with 10 m mole each of ethyl iodi<Je, n-propyl acetate, 1,1,2-trichloroethane and ethyl thiocyanate.
A similar chromatogram was obtained when the components were all aromatic, as with a mixture of 100 m mole each of ethylbenzene, bromo-benzene, benzonitrile and thioanisole and 100 y mole o-fluorotoluene. For further confirmation of the applicability of the gaschromatographic procedure to aromatic compounds a mixture of 10 u mole each of o-xylene, o-chlorotoluene, methyl benzoate, phenyl isocyanate and 100 y mole of benzotrifluoride were chromato-graphed. These experiments confirmed the selective detection of fluorine compounds.
For quantitative work, three groups were selected:
• Fluorobenzene, o-fluorotoluene, and benzotrifluoride.
• l,l,2,2-tetrachloro-l,l-difluorethane, o-fluoi^toluene and p-chlorofluorobenzene.
• Perfluoronethylcyclohexane (C,Fj-CF,), perfluorobenzene, and m-difluorobenzene. The mixtures were diluted with n-hexane and injected into a column of Durapak-Carbowax 400/Porasil C (100-200 mesh) 1 m in length, at 60°C,
and chromatographed. Relative peak heights were determined by the method jf cutting out recorded peaks and weighing the paper. In each case, the average of the experimentally-determined ratio of peak areas was close to the theoretical value.
The design and performance of a gas-chromatographic detector for nitrogen compounds was ai^o described
3 by Kojima et al. The sample components were resolved on a gaschromatographic column using hydrogen as the carrier gas. The effluent was passed at 820°C through .a quartz tube packed with a nickel catalyst. The nitrogen was converted into ammonia, which was absorbed in a slow stream of a buffer solution. This solution was passed through a flow-cell containing a monovalent cation-sensitive electrode. The difference in emf between this electrode and a reference electrode was fed into an anti-log converter circuit, and a signal proportional to the ammonium ion concentration was recorded. The chromatogram shows only peaks due to nitrogen compounds.
Selective detection of nitriles, thiocyanates, and heterocyclic nitro compounds was accomplished. A sample chromatogram is shown in Fig. 33. The detector responded tu nitrogen compounds approximately 2000 times
116
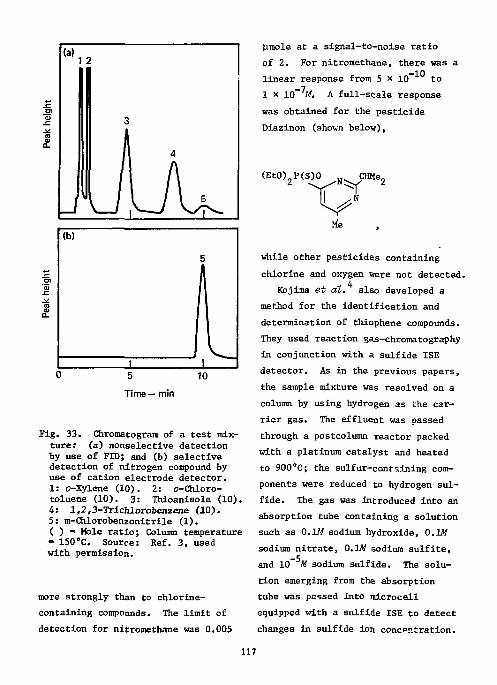
Fig. 33. Chromatogram of a test mixture: (a) nonselective detection by use of FID; and (b) selective detection of nitrogen compound by use of cation electrode detector. 1: c-Xylene (10). 2: o-Chloro-toluene (10). 3: Thioanisole (10). 4; 1,2,3-Tricnlorobenzene (10). 5: m-Chlorobenzonltrile (1). ( ) - Male ratio; Column temperature = 150^. Source: Ref. 3, used with permission.
more strongly than to chlorine-containing compounds. The limit of detection for nitromethane was 0.005
Umole at a signal-to-noise ratio of 2. For nitromethane, there was a linear response from 5 x 10 to 1 x 10~ M. A full-scale response was obtained for the pesticide Dlazinon (shown below),
(Et0)2P(S)0 N^ 0™^ ^ Me
while other pesticides containing chlorine and oxygen were not detected.
Kojima et at. also developed a method for the identification and determination of thiophene compounds. They used reaction gas-chromatography in conjunction with a sulfide ISE detector. As in the previous papers, the sample mixture was resolved on a column by using hydrogen as the carrier gas. The effluent was passed through a postcolumn reactor packed with a platinum catalyst and heated to 900°C; the sulfur-cont~ining components were reduced to hydrogen sulfide. The gas was introduced into an absorption tube containing a solution such as 0.1M sodium hydroxide, 0.1M sodium nitrate, 0.1M sodium sulfite, and 10 M sodium sulfide. The solution emerging from tha absorption tube was passed into microcell equipped with a sulfide ISE to detect changes in sulfide ion concentration.
117
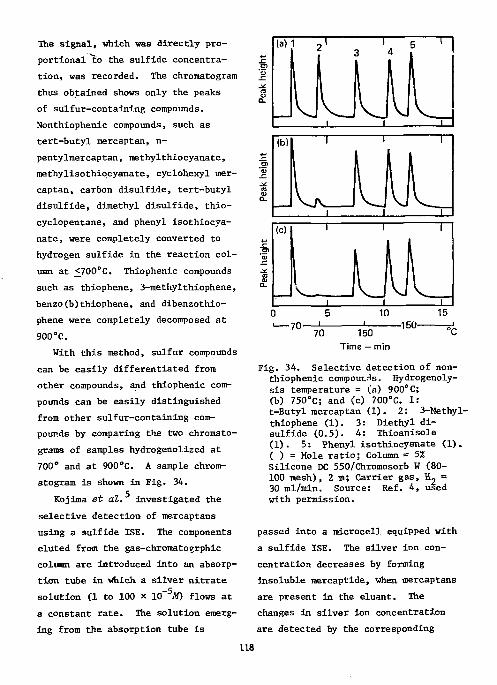
The signal, which was directly proportional to the sulfide concentration, was recorded. The chromatogram thus obtained shows only the peaks of sulfur-containing compounds. Nonthiophenic compounds, such as tert-butyl mercaptan, n-pentylmercaptan, methylthiocyanate, methylisothiocyanate, cyclohexyl mercaptan, carbon disulfide, tert-butyl disulfide, dimethyl disulfide, thio-cyclopentane, and phenyl isothiocya-nate, were completely converted to hydrogen sulfide in the reaction column at <700°C. Thiophenic compounds such as thiophene, 3-methylthiophene, benzo(b)thiophene, and dibenzothio-phene were completely decomposed at 900°C.
With this method, sulfur compounds can be easily differentiated from other compounds, and thiophenic compounds can be easily distinguished from other sulfur-containing compounds by comparing the two chromato-grams of samples hydrogenolized at 700" and at 900°C. A sample chrom-atogram is shown in Fig. 34.
Kojima et at. investigated the selective detection of mercaptans using a sulfide ISE. The components eluted from the gas-chromatogrphic column are introduced into an absorption tube in which a silver nitrate solution (1 to 100 x 10 AQ flows at a constant rate. The solution emerging from the absorption tube is
Fig. 34. Selective detection of nonthiophenic compounds. Hydrogenoly-sis temperature = (a) 900°C; (b) 750°C; and (c) 700°C. 1: t-Butyl mercaptan (1). 2: 3-Methyl-thiophene (1). 3: Diethyl disulfide (0.5). 4: Thioanisole (1). 5: Phenyl isothiocyanate (1). ( ) = Mole ratio; Column = 5% Silicone DC 550/Chromosorb W (80-100 mesh), 2 TO; Carrier gas, H„ = 30 ml/min. Source: Ref. 4, used with permission.
passed into a microcell equipped with a sulfide ISE. The silver ion concentration decreases by forming insoluble mercaptide, when tnercaptans are present in the eluant. The changes in silver ion concentration are detected by the corresponding
118
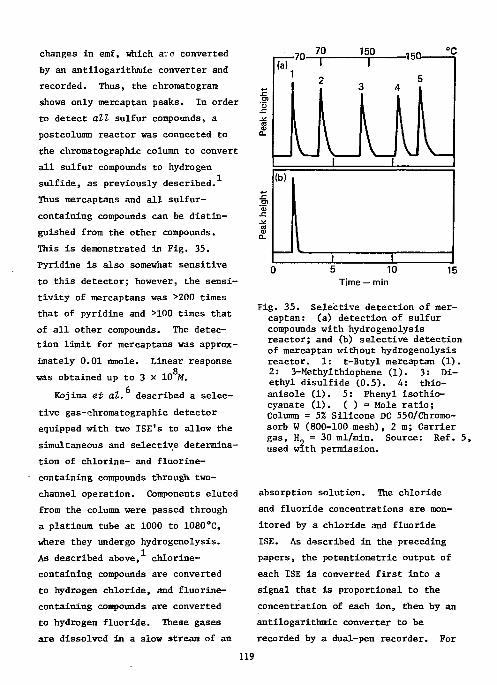
changes in emf, which aie converted by an antilogarithiuic converter and recorded. Thus, the chromatogram shows only mercaptan peaks. In order to detect all sulfur compounds, a postcolumn reactor was connected to the chromatographic column to convert all sulfur compounds to hydrogen sulfide, as previously described. Thus mercaptans and all sulfur-containing compounds can be distinguished from the other compounds. This is demonstrated in Fig. 35. Pyridine is also somewhat sensitive to this detector; however, the sensitivity of mercaptans was >200 times that of pyridine and >100 times that of all other compounds. The detection limit for mercaptans was approximately 0.01 nmole. Linear response
g was obtained up to 3 x 10 M.
Kojima et al. described a selective gas-chromatographic detector equipped with two ISE's to allow the simultaneous and selective determination of chlorine- and fluorine-containing compounds through two-channel operation. Components eluted from the column were passed through a platinum tube at 1000 to 1080oC, where they undergo hydrogenolysis. As described above, chlorine-containing compounds are converted to hydrogen chloride, and fluorine-containing compounds are converted to hydrogen fluoride. These gases are dissolved in a slow stream of an
(a) -70-70 150 -150-
5 10 Time — min
15
Fig. 35. Selective detection of mercaptan: (a) detection of sulfur compounds with hydrogenolysis reactor; and (b) selective detection of mercaptan without hydrogenolysis reactor. 1: t-Butyl mercaptan (1). 2: 3-Methylthiophene (1). 3: Diethyl disulfide (0.5). 4: thio-anisole (1). 5: Phenyl isothio-cyanate (1). ( ) = Mole ratio; Column = 5% Silicone DC 550/Chromo-sorb W (800-100 mesh), 2 m; Carrier gas, H. = 30 ml/min. Source: Ref. 5, used wxth permission.
absorption solution. The chloride and fluoride concentrations are monitored by a chloride and fluoride ISE. As described in the preceding papers, the potentiometric output of each ISE is converted first into a signal that is proportional to the concentration of each ion, then by an antilogarithmic converter to be recorded by a dual-pen recorder. For
119
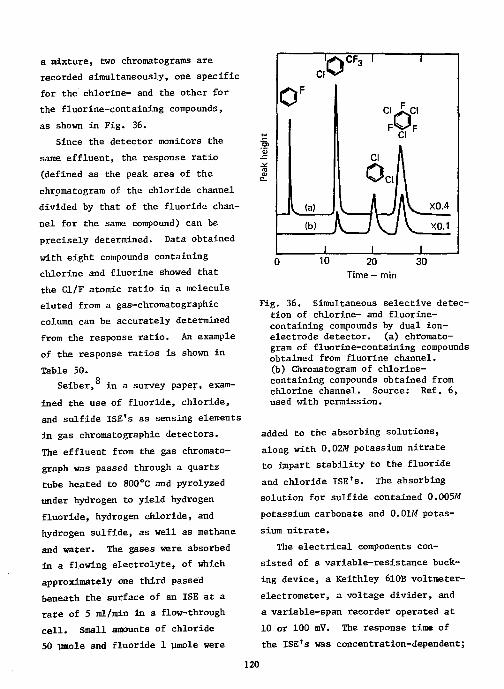
a mixture, two chromatograms are recorded simultaneously, one specific for the chlorine- and the other for the fluorine-containing compounds, as shown in Fig, 36,
Since the detector monitors the same effluent, the response ratio (defined as the peak area of the chrpmatogram of the chloride channel divided by that of the fluoride channel for the same compound) can be precisely determined. Data obtained with eight compounds containing chlorine and fluorine showed that the Cl/F atomic ratio in a molecule eluted from a gas-chromatographic column can be accurately determined from the response ratio. An example of the response ratios is shown in Table 50.
o Seiber, in a survey paper, exam
ined the use of fluoride, chloride, and sulfide ISE's as sensing elements in gas chromatographic detectors. The effluent from the gas chromato-graph was passed through a quartz tube heated to 800°C and pyrolyzed under hydrogen to yield hydrogen fluoride, hydrogen chloride, and hydrogen sulfide, as well as methane and water. The gases were absorbed in a flowing electrolyte, of which approximately one third passed beneath the surface of an ISE at a rate of 5 ml/min in a flow-through cell. Small amounts of chloride 50 pnole and fluoride 1 |lmole were
JO"' , ' i
0 F
ci JLci
ol ^ M . A A J A \ _ X0.4
(b)
1 0 10 20 30
Time — min
Fig. 36. Simultaneous selective detection of chlorine- and fluorine-containing compounds by dual ion-electrode detector. (a) chromatogram of fluorine-containing compounds obtained from fluorine channel, (b) Chromatogram of chlorine-containing compounds obtained from chlorine channel. Source: Ref. 6, used with permission.
added to the absorbing solutions, along with 0.02M potassium nitrate to impart stability to the fluoride and chloride ISE's. The absorbing solution for sulfide contained 0.005A7 potassium carbonate and 0.01M potassium nitrate.
The electrical components consisted of a variable-resistance bucking device, a Keithley 610B voltmeter-electrometer, a voltage divider, and a variable-span recorder operated at 10 or 100 mV. The response time of the ISE's was concentration-dependent;
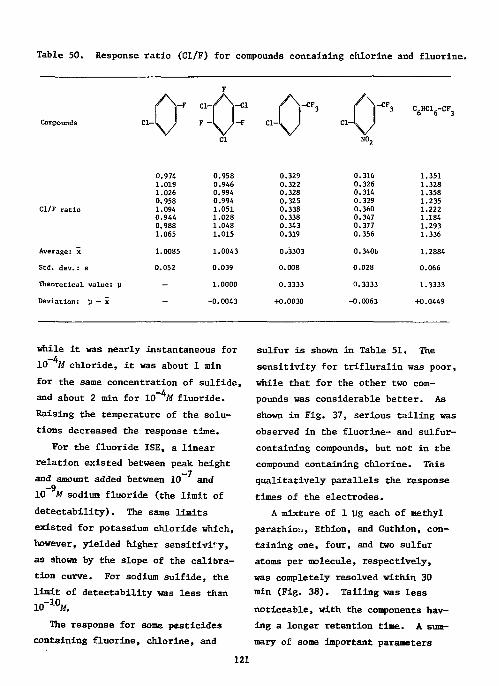
Table 50. Response ratio (Cl/F) for compounds containing chlorine and fluorine.
j \ F
jf.
Cr CI vr A-3 Or- C 6HC1 6-CF 3
Compounds "V F •
Cl
c i V N02
0.974 0.958 0.329 0.316 1.351 1.019 0.946 0.322 0.326 1.328 1.026 0.994 0.328 0.314 1.358 0.958 0.994 0.325 0.329 1.235
Cl/F r a t i o 1.094 1.051 0.338 0.360 1.222 0.944 1.028 0.338 0.347 1.184 0.988 1.048 0.343 0.377 1.293 1.065 1.015 0.319 0.356 1.336
Average: x 1.0085 1.0043 0.'3303 0.3406 1.2884
Std. d e v . : s 0.052 0.039 0.008 0.028 0.066
Theoret ical va lue: \i - 1.0000 0.3333 0.3333 1.3333
Deviation: P -- x - -0.0043 +0.0030 -0.0063 +0.0449
while it was nearly instantaneous for -4 10 M chloride, it was about 1 min
for the same concentration of sulfide, and about 2 min for 10 M fluoride. Raising the temperature of the solutions decreased the response time.
For the fluoride ISE, a linear relation existed between peak height and amount added between 10 and -9 10 M sodium fluoride (the limit of
detectability). The same limits existed for potassium chloride which, however, yielded higher sensitivity, ao shown by the slope of the calibration curve. For sodium sulfide, the limit of detectability was less than 10-10Af.
The response for some pesticides containing fluorine, chlorine, and
sulfur is shown in Table 51. The sensitivity for trifluralin was poor, while that for the other two compounds was considerable better. As shown in Fig. 37, serious tailing was observed in the fluorine- and sulfur-containing compounds, but not in the compound containing chlorine. This qualitatively parallels the response times of the electrodes.
A mixture of 1 ug each of methyl parathior., Ethion, and Guthion, containing one, four, and two sulfur atoms per molecule, respectively, was completely resolved within 30 min (Fig. 38). Tailing was less noticeable, with the components having a longer retention time. A summary of some important parameters
121
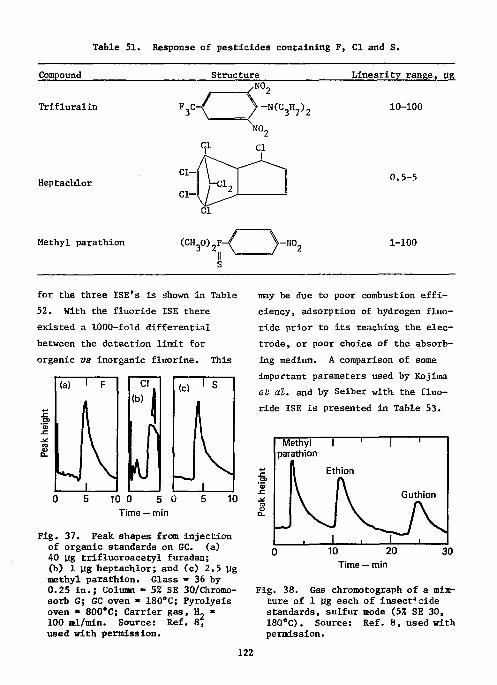
Table 51. Response of pesticides containing F, CI and S.
Compound Structure Linearity range, ug
Trifluralin
Heptachlor
Methyl parathion
,N0.
F3C < 3 " H < C 3 H 7 ) 2 X N 0 2
S1 Cl 1
C I -) -c i 2
^ ~ \ ) -c i 2
c l \L^ Cl
N0 2 ( C H 3 0 ) 2 P - / V N0 2
10-100
0.5-5
1-100
for the three ISE's is shown in Table 52. With the fluoride ISE there existed a 1000-fold differential between the detection limit for organic vs inorganic fluorine. This
T
Fig. 37. Peak shapes from injection of organic standards on G C (a) 40 ug trifluoroacetyl furadan; (b) 1 Jig heptachlor; and (c) 2.5 ug methyl parathion. Glass = 36 by 0.25 in.; Column - 5% SE 30/Chromo-sorb G; GC oven - 180°C; Pyrolysis oven - 800°C; Carrier gas, H 2 -100 nl/min. Source: Ref. 8, used with permission.
may be due to poor combustion efficiency, adsorption of hydrogen fluoride prior to its reaching the electrode, or poor choice of the absorbing medium. A comparison of some important parameters used by Kojima et at. and by Seiber with, the fluoride ISE is presented in Table 53.
Methyl T parathion
Ethion
Guthion
10 20 Time — min
Fig. 38. Gas chromotograph of a mixture of 1 ug each of insect* cide s tandards, sulfur mode (5Z SE 30, 180°C). Source: Ref. 8 , used with permission.
122
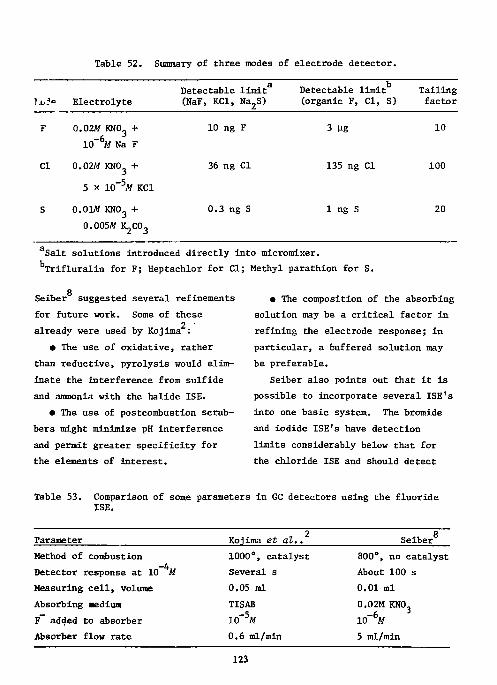
Table 52. Summary of three modes of electrode detector.
}JU*» Electrolyte Detectable limit (NaF, KC1, Na 2S)
Detectable limit (organic F, CI, S)
Tailing factor
CI
0.02M KNO + 10~6M Na F
0.02M KNO +
5 x 10"5Af KC1
0.01AJ KNO, + 0.005M K 2C0 3
10 ng F
36 ng CI
0.3 ng S
3 Ug
135 ng CI
1 ng S
10
100
20
Salt so lu t ions introduced d i r e c t l y into micromixer. T r i f lu ra l in for F; Heptachlor for CI; Methyl parathion for S.
o Seiber suggested several refinements for future work. Some of these
2 ' already were used by Kojima : • The use of oxidative, rather
than reductive, pyrolysis would eliminate the interference from sulfide and ammonia with the halide ISE.
• The use of postcombustion scrubbers might minimize pH interference and permit greater specificity for the elements of interest.
• The composition of the absorbing solution may be a critical factor in refining the electrode response; in particular, a buffered solution may be preferable.
Seiber also points out that it is possible to incorporate several ISE's into one basic system. The bromide and iodide ISE's have detection limits considerably below that for the chloride ISE and should detect
Table 53. Comparison of some parameters in GC detectors using the fluoride ISE.
Parameter Kojima et at.. Seiber
„-'*,. Method of combustion Detector response at 10 "'M Measuring cell, volume Absorbing medium F added to absorber Absorber flow rate
1000°, catalyst 800°, no catalyst Several s About 100 s 0.05 ml 0.01 ml TISAB 0.02M KNO
10 _ 6« 10" 5W 0.02M KNO 10 _ 6«
0.6 ml/min 5 ml/min
123
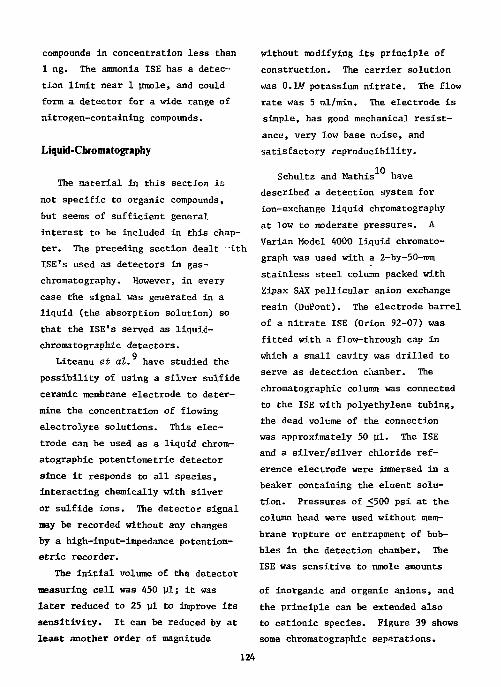
compounds in concentration less than 1 ng. The ammonia ISE has a detection limit near 1 umole, and could form a detector for a wide range of nitrogen-containing compounds.
Liquid-Chromatography
The material in this section is not specific to organic compounds, but seems of sufficient general interest to be included in this chapter. The preceding section dealt "ith ISE's used as detectors in gas-chromatography. However, in every case the signal was generated in a liquid (the absorption solution) so that the ISE's served as liquid-chromatographic detectors.
a Liteanu et at. have studied the
possibility of using a silver sulfide ceramic membrane electrode to determine the concentration of flowing electrolyte solutions. This electrode can be used as a liquid chromatographic potentiometric detector since it responds to all species, interacting chemically with silver or sulfide ions. The detector signal may be recorded without any changes by a high-input-impedance potentiometric recorder.
The initial volume of the detector measuring cell was 450 pi; it was later reduced to 25 pi to improve its sensitivity. It can be reduced by at least another order of magnitude
without modifying its principle of construction. The carrier solution was 0.1M potassium nitrate. The flow rate was 5 ml/min. The electrode is simple, has good mechanical resistance, very low base nuise, and satisfactory reproducibility.
Schultz and Mathis have described a detection system for ion-exchange liquid chromatography at low to moderate pressures. A Varian Model 4000 liquid chromato-graph was used with a 2-by-50-mm stainless steel column packed with Zipax SAX pellicular anion exchange resin (DuPont). The electrode barrel of a nitrate ISE (Orion 92-07) was fitted with a flow-through cap in which a small cavity was drilled to serve as detection chamber. The chromatographic column was connected to the ISE with polyethylene tubing, the dead volume of the connection was approximately 50 pi. The ISE and a silver/silver chloride reference electrode were immersed in a beaker containing the eluent solution. Pressures of 500 psi at the column head were used without membrane rupture or entrapment of bubbles in the detection chamber. The ISE was sensitive to nmole amounts
of inorganic and organic anions, and the principle can be extended also to cationic species. Figure 39 shows some chromatographic separations.
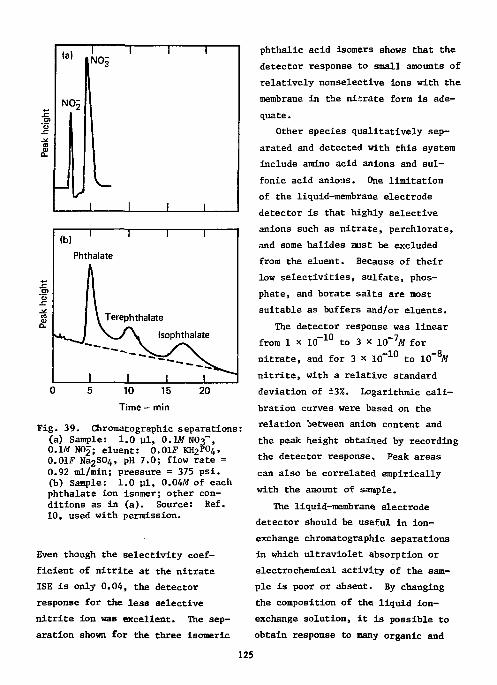
0 5 10 15 20 Time — min
Fig. 39. Chromatographic separations: (a) Sample: 1.0 ul, O.LV NOi", 0.1M NOJ; eluent: 0.01F KH2PO4, 0.01F Na 2S04, pH 7.0; flow rate = 0.92 ml/min; pressure = 375 psi. (b) Sample: 1.0 yl, 0.04Af of each phthalate Ion isomer; other conditions as in (a). Source: Ref. 10, used with permission.
Even though the selectivity coefficient of nitrite at the nitrate ISE is only 0.04, the detector response for the less selective nitrite ion was excellent. The separation shown for the three isomeric
phthalic acid isomers shows that the detector response to small amounts of relatively nonselective ions with the membrane in the nlxrate form is adequate.
Other species qualitatively separated and detected with this system include amino acid anions and sulfonic acid anions. One limitation of the liquid-membrane electrode detector is that highly selective anions such as nitrate, perchlorate, and some halides must be excluded from the eluent. Because of their low selectivities, sulfate, phosphate, and borate salts are most suitable as buffers and/or eluents.
The detector response was linear from 1 x 1 0 - 1 0 to 3 x 10~ 7M for nitrate, and for 3 x 1 0 - 1 0 to 10~8Af nitrite, with a relative standard deviation of ±3%. Logarithmic calibration curves were based on the relation between anion content and the peak height obtained by recording the detector response. Peak areas can also be correlated empirically with the amount of sample.
The liquid-membrane electrode detector should be useful in ion-exchange chromatographic separations in which ultraviolet absorption or electrochemical activity of the sample is poor or absent. By changing the composition of the liquid ion-exchange solution, it is possible to obtain response to many organic and
inorganic cations and anions and to enhance the selectivity for a selected group of ions.
Franks and Pullen have described a technique for the determination of trace amounts of halides in the presence of other ions. The mixed anions are separated by liquid chromatography on an ion exchange resin in the metal form. The detector system consisted of two silver/silver chloride electrodes, one was used as a reference, while the other was placed in the flowing stream. This permitted the determination of ng amounts of halide. Figure 40 shows the separation of chloride, bromide, and iodide in the presence of fluoride, sulfate, and nitrate.
By a suitable choice of eluting agent and stationary phase, it is possible to separate chloride from excess sulfide, to separate and determine chloride, bromide, and iodide, and to determine chloride i: boiler waters. The technique readily lends itself to automation and an apparatus for rapid, repetitive analyses has been designed. The system has also been used to determine halogens in solutions resulting from Schoniger flask and Wickboldt apparatus combustions.
By using the cadmium acetate chromatographic system and a silver/ silver chloride electrode, thiosul-fate and cyanide in the ppm region
Bromide
Chloride -
Nitrate and fluoride
h- 30min H Time
Fig. 40. Separation of chloride bromide, atid iodide in presence of fluoride, sulfate, and nitrate. Stationary phase, Zeo-Karb 225, cadmium form; mobile phase, 0.0025A? cadmium acetate, flow rate -0.4 ml/min. Sample 50 yl, containing 1000 ppm of sulfate, nitrate, and fluoride with 1 ppm each of the other halides. Source: Ref. 11, used with permission.
were determined. With a chloride liquid-state ISE (Orion 92-17) as detector, nitrate and perchlorate in the ppm range were detected.
The combination of a lead amalgam electrode and cellulose-column chromatography has permitted the separation and determination of sulfate and phosphate ions. By means of a barium-sulfate-impregnated silicone-rubber electrode, trace amounts of sulfate and phosphate in solution were determined.
The authors state that there are many possibilities for devising other chromatographic-potentiometrlc systems.
126
References 1. T. Kojima, M. Ichise, and Y. Seo, Bunseki Kagaku, 2£, 20 (1971); cf.
Chem. AbstT., 75, 58422d (1971). 2. T. Kojiraa, M. Ichise, and Y. Seo, Talanta , 19, 539 (1972). 3. T. Kojima, M. Ichise, and Y. Seo, Bunseki Kagaku, 22_, 208 (1973);
cf. Chem. Abstv., _79, 74739a (1973). 4. T. Kojima, Y. Seo, and J. Sato, Bunseki Kagaku, 23, 1389 (1974); cf.
Chem. Abstv., 82, 149028r (1975). 5. T. Kojima, Y. Seo, and J. Sato, Bunseki Kagaku, ^4, 772 (1975); cf.
Chem. AbstT., J54, 144328v (1976). 6. T. Kojima, M. Ichise, and Y. Seo, Bunseki Kagaku, 2±, 7 (1975); cf.
Chem Abstv., 83_, 21957w (1975). 7. E. A. Bramen and A. Dynako, Anal. Chem., 40, 95 (1968). 8. J. N. Seiber, presented at Eastern Analytical Symposium, Atlantic City,
N. J., Fall 1972. 9. C. Liteanu, I. C. Popescu, and H. Nascu, Rev. Roum. Chim., 17, 1615
(1972). 10. F. A. Schultz and D. E. Mathis, Anal. Chem., 46_, 2253 (1974). 11. M. C. Franks and D. L. Pullen, Analyst, j)9, 503 (1974).
ACKNOWLEDGMENTS
The author is indebted to the Department of Energy for a professional research and teaching leave, to the late Professor E. D. Bergmann of the Hebrew University of Jeru
salem for a research grant, and to Mrs. Miriam Goldstein and her staff for making his stay at the Hebrew
University a p1^asant one.
JRS 127
Recommended


