www.elsevier.com/locate/anucene
Annals of Nuclear Energy 34 (2007) 120–129
annals of
NUCLEAR ENERGY
Long life small CANDLE-HTGRs with thorium
Ismail *, Yasunori Ohoka, Peng Hong Liem, Hiroshi Sekimoto
Research Laboratory for Nuclear Reactors, Tokyo Institute of Technology, 2-12-1 N1-17, O-okayama, Meguro-ku, Tokyo 152-8550, Japan
Received 19 May 2006; accepted 31 October 2006Available online 29 December 2006
Abstract
CANDLE (constant axial shape of neutron flux, nuclide densities and power shape during life of energy producing reactor) burnupstrategy is applied to small (30 MWth) block-type high temperature gas-cooled reactors (HTGRs) with thorium fuel. The CANDLE bur-nup is adopted in this study since it has several promising merits such as simple and safe reactor operation, and the ease of designing along life reactor core. Burnup performances of thorium fuel (233U, 232Th)O2 are investigated for a range of enrichment 615%. Dis-charged fuel burnup and burning region motion velocity are major parameters of its performances in this study. The reactors with tho-rium fuel show a better burnup performance in terms of higher discharged fuel burnup and slower burning region motion velocity (longercore lifetime) compared to the reactors with uranium fuel.� 2006 Elsevier Ltd. All rights reserved.
1. Introduction
The issue of global warming, as a consequence of CO2
emission, is becoming a major and unavoidable elementof the present world energy policy. Nowadays, billionstones of CO2 are annually released into the air by burningof fossil fuels utilized in human activities and it will signif-icantly increases over years if we do not change the energypolicy to the clean energy source utilization. It is well-known that nuclear energy is the only technology availabletoday for the intensive production of energy without CO2
emission. Therefore, the nuclear energy utilization wouldbe a good way to overcome the global warming and otherenvironmental problems caused by fossil fuel energysources utilization.
For separated or isolated small areas or islands, theenergy demand can be effectively provided by small reac-tors with a long core lifetime. Small power feature providesan ease on supplying fresh fuel. Long life feature providesan operation capability without refueling activity in a sig-nificantly long period. It reduces operation cost. In thispoint of view, the long life small reactors will be a challengefor nuclear reactor technology development.
0306-4549/$ - see front matter � 2006 Elsevier Ltd. All rights reserved.
doi:10.1016/j.anucene.2006.10.006
* Corresponding author. Tel./fax: +81 3 5734 2955.E-mail address: [email protected] (Ismail).
In the present study, we investigate the burnup perfor-mance, in terms of fuel burnup level and core life time,of a long life small high temperature gas-cooled reactors(HTGRs) with thorium fuel under a new burnup strategyCANDLE (constant axial shape of neutron flux, nuclidedensities and power shape during life of energy producingreactor). Coated fuel particles of HTGRs enable the reac-tors to be maintained up to high burnup and excellent per-formance to confine fission products (FPs) inside theparticles. The use of thorium fuel provides high fuel bur-nup level while CANDLE burnup strategy is expected toprovide long core life.
A detail description of CANDLE burnup strategy, char-acteristic, merits and application are given in Section 2.The mathematics and calculation method are presented inSection 3. Then calculation conditions, results and discus-sion are provided in Section 4. And finally, conclusionsof this study are stated in Section 5.
2. CANDLE burnup strategy
2.1. Principles of CANDLE burnup
A new reactor burnup strategy CANDLE was pro-posed (Sekimoto et al., 2001), where neutron flux shape,nuclide density distribution shapes and power profile
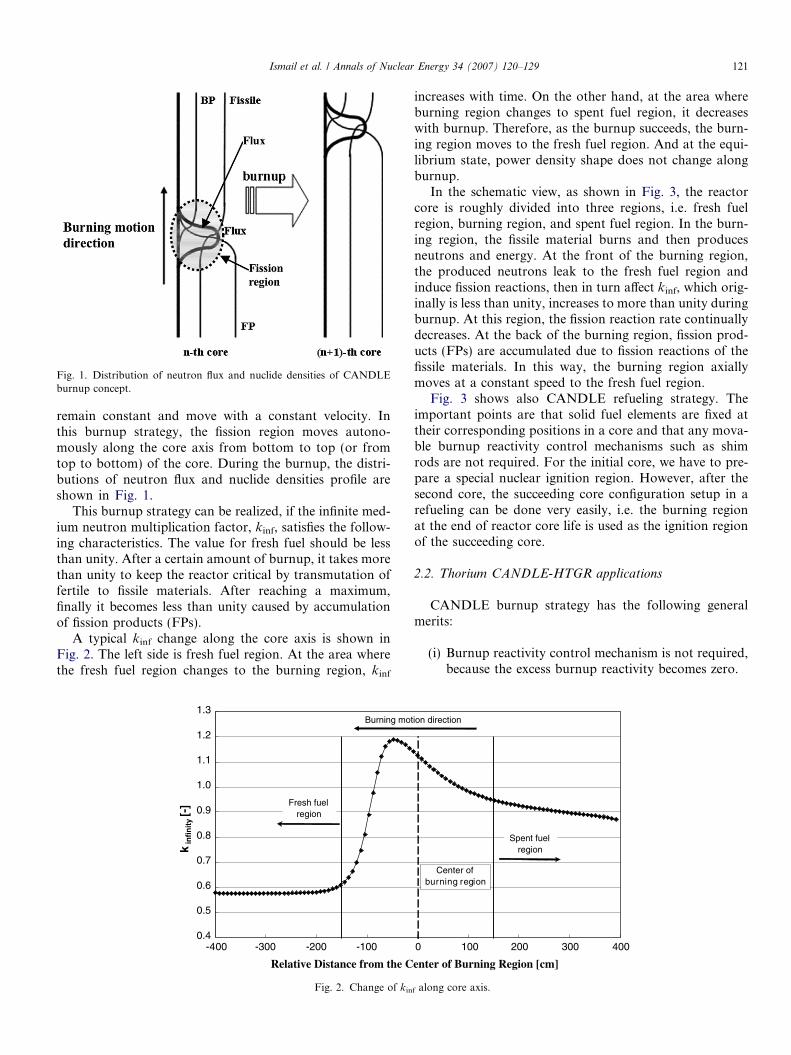
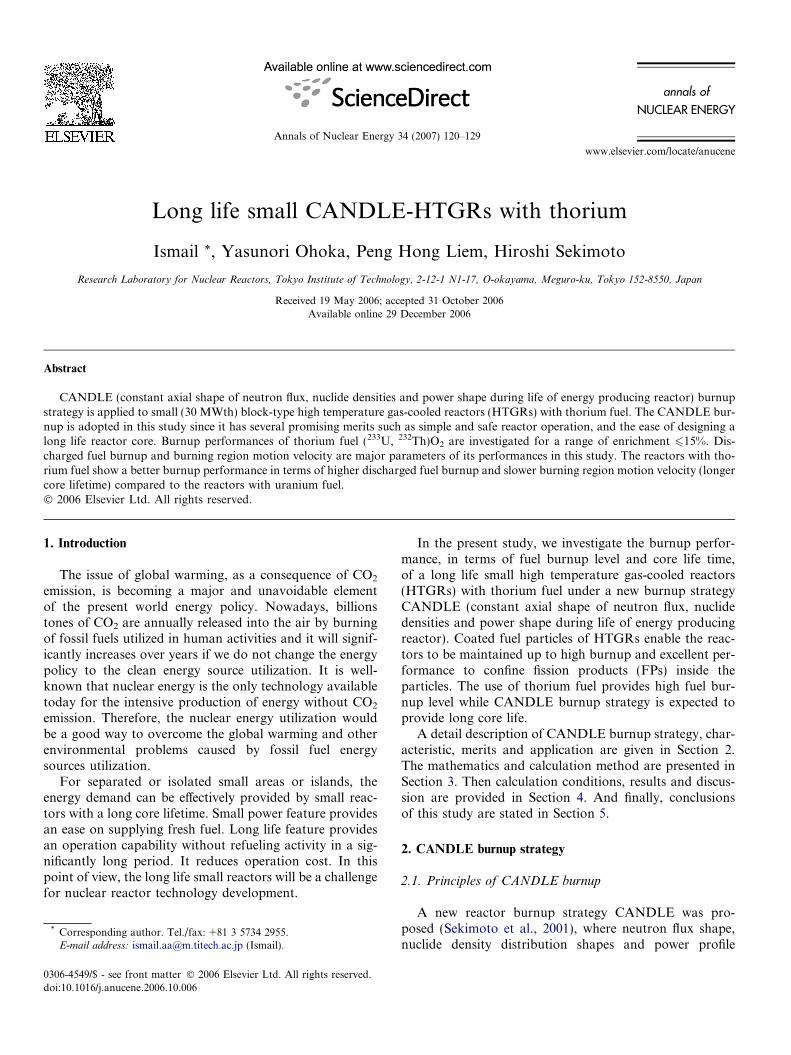
Fig. 1. Distribution of neutron flux and nuclide densities of CANDLEburnup concept.
Ismail et al. / Annals of Nuclear Energy 34 (2007) 120–129 121
remain constant and move with a constant velocity. Inthis burnup strategy, the fission region moves autono-mously along the core axis from bottom to top (or fromtop to bottom) of the core. During the burnup, the distri-butions of neutron flux and nuclide densities profile areshown in Fig. 1.
This burnup strategy can be realized, if the infinite med-ium neutron multiplication factor, kinf, satisfies the follow-ing characteristics. The value for fresh fuel should be lessthan unity. After a certain amount of burnup, it takes morethan unity to keep the reactor critical by transmutation offertile to fissile materials. After reaching a maximum,finally it becomes less than unity caused by accumulationof fission products (FPs).
A typical kinf change along the core axis is shown inFig. 2. The left side is fresh fuel region. At the area wherethe fresh fuel region changes to the burning region, kinf
0.4
0.5
0.6
0.7
0.8
0.9
1.0
1.1
1.2
1.3
-400 -300 -200 -100
Relative Distance from the C
kin
fin
ity [-
]
Burning mot
Fresh fuelregion
Fig. 2. Change of kin
increases with time. On the other hand, at the area whereburning region changes to spent fuel region, it decreaseswith burnup. Therefore, as the burnup succeeds, the burn-ing region moves to the fresh fuel region. And at the equi-librium state, power density shape does not change alongburnup.
In the schematic view, as shown in Fig. 3, the reactorcore is roughly divided into three regions, i.e. fresh fuelregion, burning region, and spent fuel region. In the burn-ing region, the fissile material burns and then producesneutrons and energy. At the front of the burning region,the produced neutrons leak to the fresh fuel region andinduce fission reactions, then in turn affect kinf, which orig-inally is less than unity, increases to more than unity duringburnup. At this region, the fission reaction rate continuallydecreases. At the back of the burning region, fission prod-ucts (FPs) are accumulated due to fission reactions of thefissile materials. In this way, the burning region axiallymoves at a constant speed to the fresh fuel region.
Fig. 3 shows also CANDLE refueling strategy. Theimportant points are that solid fuel elements are fixed attheir corresponding positions in a core and that any mova-ble burnup reactivity control mechanisms such as shimrods are not required. For the initial core, we have to pre-pare a special nuclear ignition region. However, after thesecond core, the succeeding core configuration setup in arefueling can be done very easily, i.e. the burning regionat the end of reactor core life is used as the ignition regionof the succeeding core.
2.2. Thorium CANDLE-HTGR applications
CANDLE burnup strategy has the following generalmerits:
(i) Burnup reactivity control mechanism is not required,because the excess burnup reactivity becomes zero.
0 100 200 300 400
enter of Burning Region [cm]
ion direction
Spent fuelregion
Center ofburning region
f along core axis.
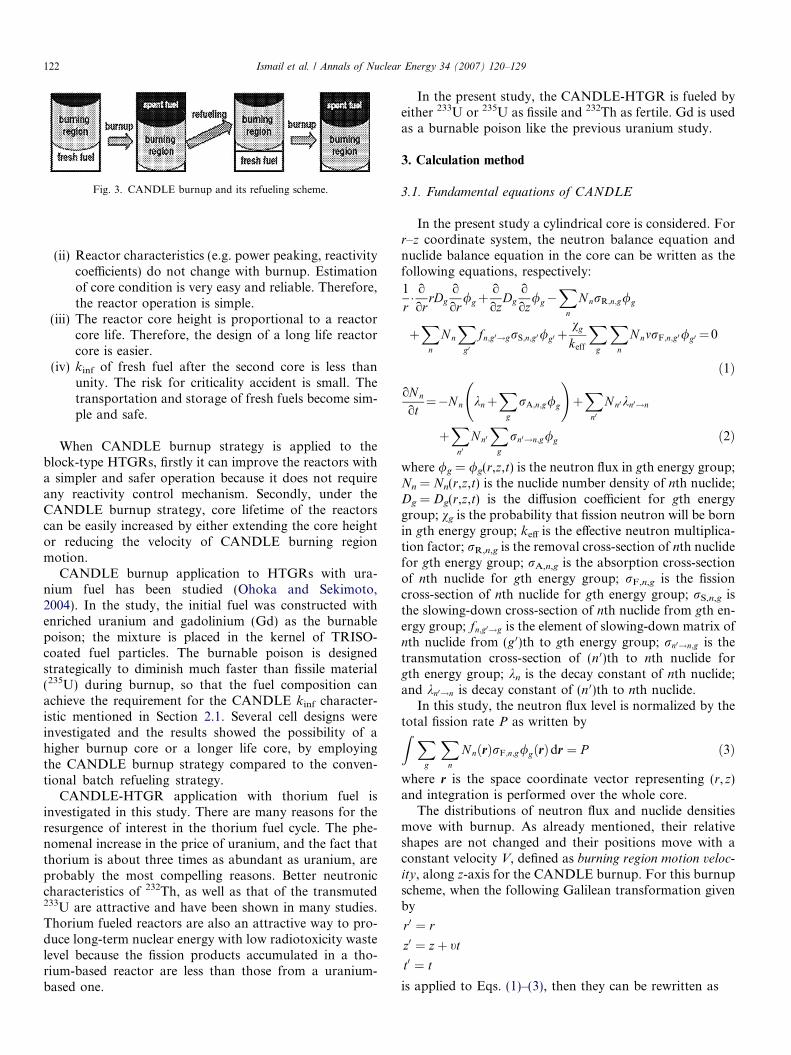
Fig. 3. CANDLE burnup and its refueling scheme.
122 Ismail et al. / Annals of Nuclear Energy 34 (2007) 120–129
(ii) Reactor characteristics (e.g. power peaking, reactivitycoefficients) do not change with burnup. Estimationof core condition is very easy and reliable. Therefore,the reactor operation is simple.
(iii) The reactor core height is proportional to a reactorcore life. Therefore, the design of a long life reactorcore is easier.
(iv) kinf of fresh fuel after the second core is less thanunity. The risk for criticality accident is small. Thetransportation and storage of fresh fuels become sim-ple and safe.
When CANDLE burnup strategy is applied to theblock-type HTGRs, firstly it can improve the reactors witha simpler and safer operation because it does not requireany reactivity control mechanism. Secondly, under theCANDLE burnup strategy, core lifetime of the reactorscan be easily increased by either extending the core heightor reducing the velocity of CANDLE burning regionmotion.
CANDLE burnup application to HTGRs with ura-nium fuel has been studied (Ohoka and Sekimoto,2004). In the study, the initial fuel was constructed withenriched uranium and gadolinium (Gd) as the burnablepoison; the mixture is placed in the kernel of TRISO-coated fuel particles. The burnable poison is designedstrategically to diminish much faster than fissile material(235U) during burnup, so that the fuel composition canachieve the requirement for the CANDLE kinf character-istic mentioned in Section 2.1. Several cell designs wereinvestigated and the results showed the possibility of ahigher burnup core or a longer life core, by employingthe CANDLE burnup strategy compared to the conven-tional batch refueling strategy.
CANDLE-HTGR application with thorium fuel isinvestigated in this study. There are many reasons for theresurgence of interest in the thorium fuel cycle. The phe-nomenal increase in the price of uranium, and the fact thatthorium is about three times as abundant as uranium, areprobably the most compelling reasons. Better neutroniccharacteristics of 232Th, as well as that of the transmuted233U are attractive and have been shown in many studies.Thorium fueled reactors are also an attractive way to pro-duce long-term nuclear energy with low radiotoxicity wastelevel because the fission products accumulated in a tho-rium-based reactor are less than those from a uranium-based one.
In the present study, the CANDLE-HTGR is fueled byeither 233U or 235U as fissile and 232Th as fertile. Gd is usedas a burnable poison like the previous uranium study.
3. Calculation method
3.1. Fundamental equations of CANDLE
In the present study a cylindrical core is considered. Forr–z coordinate system, the neutron balance equation andnuclide balance equation in the core can be written as thefollowing equations, respectively:
1
r� oor
rDgo
or/gþ
o
ozDg
o
oz/g�
Xn
NnrR;n;g/g
þX
n
N n
Xg0
fn;g0!grS;n;g0/g0 þvg
keff
Xg
Xn
N nmrF;n;g0/g0 ¼0
ð1Þ
oN n
ot¼�Nn knþ
Xg
rA;n;g/g
!þX
n0Nn0kn0!n
þX
n0Nn0X
g
rn0!n;g/g ð2Þ
where /g = /g(r,z,t) is the neutron flux in gth energy group;Nn = Nn(r,z,t) is the nuclide number density of nth nuclide;Dg = Dg(r,z,t) is the diffusion coefficient for gth energygroup; vg is the probability that fission neutron will be bornin gth energy group; keff is the effective neutron multiplica-tion factor; rR,n,g is the removal cross-section of nth nuclidefor gth energy group; rA,n,g is the absorption cross-sectionof nth nuclide for gth energy group; rF,n,g is the fissioncross-section of nth nuclide for gth energy group; rS,n,g isthe slowing-down cross-section of nth nuclide from gth en-ergy group; fn;g0!g is the element of slowing-down matrix ofnth nuclide from (g 0)th to gth energy group; rn0!n;g is thetransmutation cross-section of (n 0)th to nth nuclide forgth energy group; kn is the decay constant of nth nuclide;and kn0!n is decay constant of (n 0)th to nth nuclide.
In this study, the neutron flux level is normalized by thetotal fission rate P as written byZ X
g
Xn
NnðrÞrF;n;g/gðrÞdr ¼ P ð3Þ
where r is the space coordinate vector representing (r,z)and integration is performed over the whole core.
The distributions of neutron flux and nuclide densitiesmove with burnup. As already mentioned, their relativeshapes are not changed and their positions move with aconstant velocity V, defined as burning region motion veloc-
ity, along z-axis for the CANDLE burnup. For this burnupscheme, when the following Galilean transformation givenby
r0 ¼ r
z0 ¼ zþ tt
t0 ¼ t
is applied to Eqs. (1)–(3), then they can be rewritten as
Ismail et al. / Annals of Nuclear Energy 34 (2007) 120–129 123
1
r0� o
or0r0D0g
o
or0/0gþ
o
oz0D0g
o
oz0/0g�
Xn
N 0nrR;n;g/0g
þX
n
N 0nX
g0fn;g0!grS;n;g0/
0g0 þ
vg
keff
Xg
Xn
N 0nmrF;n;g0/0g0 ¼ 0
ð4ÞoN 0not0¼�t
oN 0noz0�N 0n knþ
Xg
rA;n;g/0g
!þX
n0N 0n0kn0!n
þX
n0N 0n0X
g
rn0!n;g/0g ð5Þ
andZ Xg
Xn
N nðr0ÞrF;n;g/gðr0Þdr0 ¼ P ð6Þ
where t is the relative velocity of the transformed coordi-nate system to the original system. If t = V, the distribu-tions of nuclide densities and neutron flux stand still forthe transformed coordinate system, and Eq. (5) becomes
� VoN 0noz0� N 0n kn þ
Xg
rA;n;g/0g
!þX
n0N 0n0kn0!n
þX
n0N 0n0X
g
rn0!n;g/0g ¼ 0: ð7Þ
It can be expected from this equation that the velocity ofburning region, V, is proportional to the flux level, if theeffects of radioactive decay of nuclides can be neglected.And core lifetime of the reactor can be calculated by addi-tional core height divided by the burning region speed.
There are two equations, Eqs. (4) and (7), which shouldbe solved simultaneously with the flux normalization con-dition (6) for obtaining the equilibrium CANDLE burnupstate. The detailed calculation method is described in thereference Sekimoto and Udagawa (2006).
3.2. Group-constants preparation
Equilibrium states under the CANDLE burnup schemeare obtained by using a dedicated code for CANDLE bur-nup analysis, in which critical calculations are performed
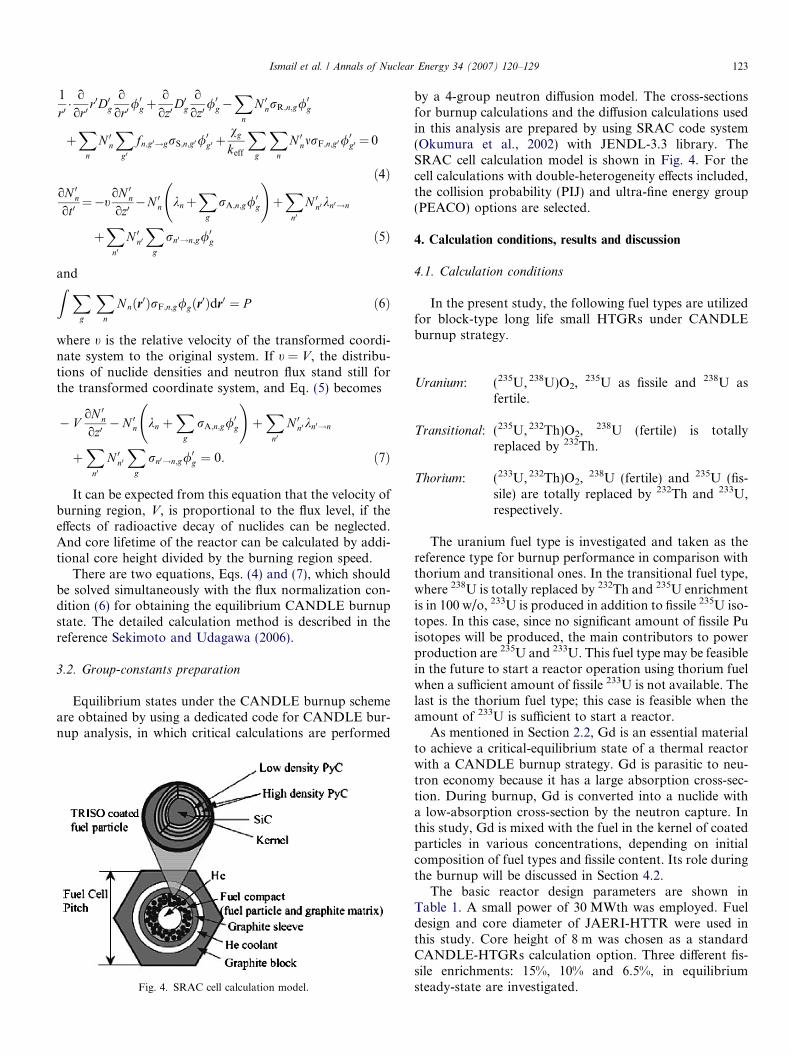
Fig. 4. SRAC cell calculation model.
by a 4-group neutron diffusion model. The cross-sectionsfor burnup calculations and the diffusion calculations usedin this analysis are prepared by using SRAC code system(Okumura et al., 2002) with JENDL-3.3 library. TheSRAC cell calculation model is shown in Fig. 4. For thecell calculations with double-heterogeneity effects included,the collision probability (PIJ) and ultra-fine energy group(PEACO) options are selected.
4. Calculation conditions, results and discussion
4.1. Calculation conditions
In the present study, the following fuel types are utilizedfor block-type long life small HTGRs under CANDLEburnup strategy.
Uranium: (235U, 238U)O2, 235U as fissile and 238U asfertile.
Transitional: (235U, 232Th)O2, 238U (fertile) is totallyreplaced by 232Th.
Thorium: (233U, 232Th)O2, 238U (fertile) and 235U (fis-sile) are totally replaced by 232Th and 233U,respectively.
The uranium fuel type is investigated and taken as thereference type for burnup performance in comparison withthorium and transitional ones. In the transitional fuel type,where 238U is totally replaced by 232Th and 235U enrichmentis in 100 w/o, 233U is produced in addition to fissile 235U iso-topes. In this case, since no significant amount of fissile Puisotopes will be produced, the main contributors to powerproduction are 235U and 233U. This fuel type may be feasiblein the future to start a reactor operation using thorium fuelwhen a sufficient amount of fissile 233U is not available. Thelast is the thorium fuel type; this case is feasible when theamount of 233U is sufficient to start a reactor.
As mentioned in Section 2.2, Gd is an essential materialto achieve a critical-equilibrium state of a thermal reactorwith a CANDLE burnup strategy. Gd is parasitic to neu-tron economy because it has a large absorption cross-sec-tion. During burnup, Gd is converted into a nuclide witha low-absorption cross-section by the neutron capture. Inthis study, Gd is mixed with the fuel in the kernel of coatedparticles in various concentrations, depending on initialcomposition of fuel types and fissile content. Its role duringthe burnup will be discussed in Section 4.2.
The basic reactor design parameters are shown inTable 1. A small power of 30 MWth was employed. Fueldesign and core diameter of JAERI-HTTR were used inthis study. Core height of 8 m was chosen as a standardCANDLE-HTGRs calculation option. Three different fis-sile enrichments: 15%, 10% and 6.5%, in equilibriumsteady-state are investigated.
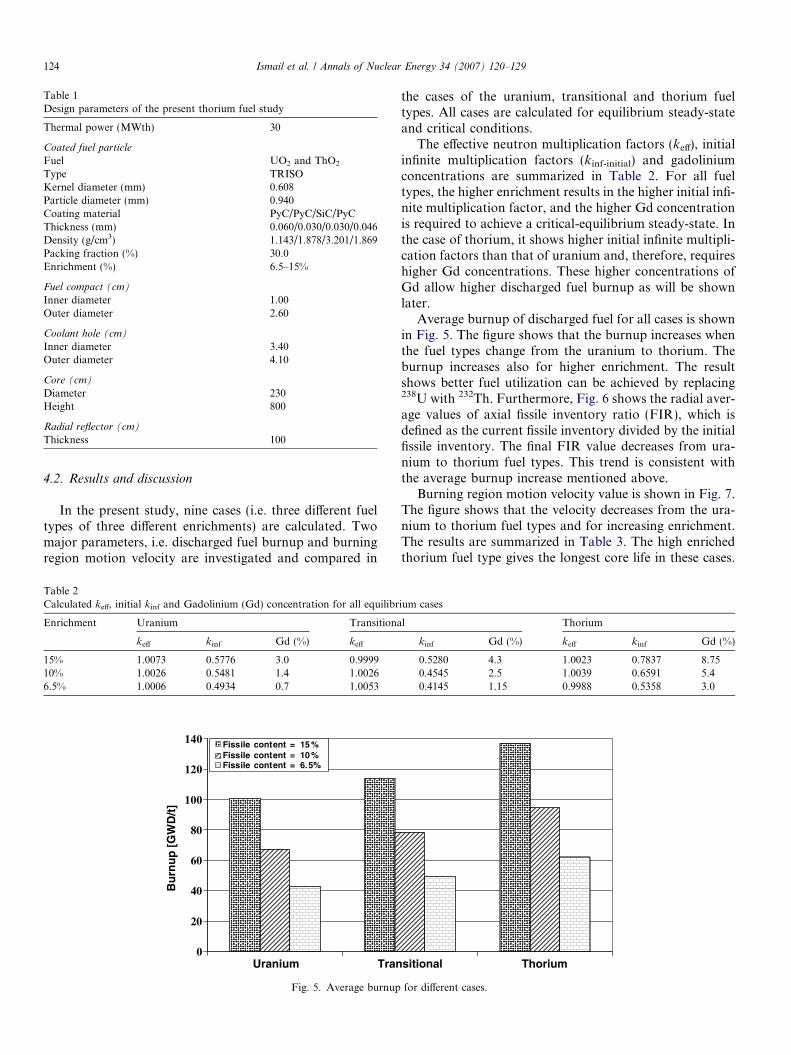
Table 1Design parameters of the present thorium fuel study
Thermal power (MWth) 30
Coated fuel particle
Fuel UO2 and ThO2
Type TRISOKernel diameter (mm) 0.608Particle diameter (mm) 0.940Coating material PyC/PyC/SiC/PyCThickness (mm) 0.060/0.030/0.030/0.046Density (g/cm3) 1.143/1.878/3.201/1.869Packing fraction (%) 30.0Enrichment (%) 6.5–15%
Fuel compact (cm)
Inner diameter 1.00Outer diameter 2.60
Coolant hole (cm)
Inner diameter 3.40Outer diameter 4.10
Core (cm)
Diameter 230Height 800
Radial reflector (cm)
Thickness 100
124 Ismail et al. / Annals of Nuclear Energy 34 (2007) 120–129
4.2. Results and discussion
In the present study, nine cases (i.e. three different fueltypes of three different enrichments) are calculated. Twomajor parameters, i.e. discharged fuel burnup and burningregion motion velocity are investigated and compared in
Table 2Calculated keff, initial kinf and Gadolinium (Gd) concentration for all equilibr
Enrichment Uranium Transitiona
keff kinf Gd (%) keff
15% 1.0073 0.5776 3.0 0.999910% 1.0026 0.5481 1.4 1.00266.5% 1.0006 0.4934 0.7 1.0053
0
20
40
60
80
100
120
140
Uranium Tran
Bu
rnu
p [
GW
D/t
]
Fissile content = 15 %Fissile content = 10 %Fissile content = 6.5%
Fig. 5. Average burnup
the cases of the uranium, transitional and thorium fueltypes. All cases are calculated for equilibrium steady-stateand critical conditions.
The effective neutron multiplication factors (keff), initialinfinite multiplication factors (kinf-initial) and gadoliniumconcentrations are summarized in Table 2. For all fueltypes, the higher enrichment results in the higher initial infi-nite multiplication factor, and the higher Gd concentrationis required to achieve a critical-equilibrium steady-state. Inthe case of thorium, it shows higher initial infinite multipli-cation factors than that of uranium and, therefore, requireshigher Gd concentrations. These higher concentrations ofGd allow higher discharged fuel burnup as will be shownlater.
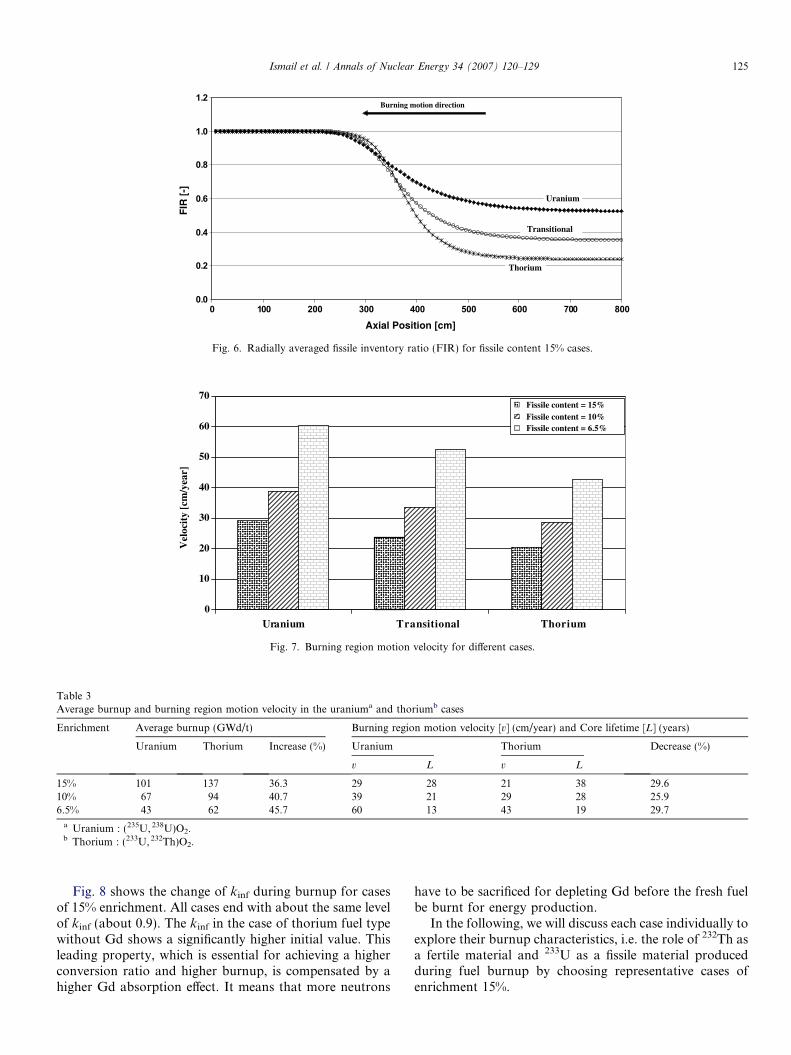
Average burnup of discharged fuel for all cases is shownin Fig. 5. The figure shows that the burnup increases whenthe fuel types change from the uranium to thorium. Theburnup increases also for higher enrichment. The resultshows better fuel utilization can be achieved by replacing238U with 232Th. Furthermore, Fig. 6 shows the radial aver-age values of axial fissile inventory ratio (FIR), which isdefined as the current fissile inventory divided by the initialfissile inventory. The final FIR value decreases from ura-nium to thorium fuel types. This trend is consistent withthe average burnup increase mentioned above.
Burning region motion velocity value is shown in Fig. 7.The figure shows that the velocity decreases from the ura-nium to thorium fuel types and for increasing enrichment.The results are summarized in Table 3. The high enrichedthorium fuel type gives the longest core life in these cases.
ium cases
l Thorium
kinf Gd (%) keff kinf Gd (%)
0.5280 4.3 1.0023 0.7837 8.750.4545 2.5 1.0039 0.6591 5.40.4145 1.15 0.9988 0.5358 3.0
sitional Thorium
for different cases.
0.0
0.2
0.4
0.6
0.8
1.0
1.2
0 100 200 300 400 500 600 700 800
Axial Position [cm]
FIR
[-]
Burning motion direction
Uranium
Thorium
Transitional
Fig. 6. Radially averaged fissile inventory ratio (FIR) for fissile content 15% cases.
0
10
20
30
40
50
60
70
Uranium Transitional Thorium
Vel
ocit
y [c
m/y
ear]
Fissile content = 15%Fissile content = 10%Fissile content = 6.5%
Fig. 7. Burning region motion velocity for different cases.
Table 3Average burnup and burning region motion velocity in the uraniuma and thoriumb cases
Enrichment Average burnup (GWd/t) Burning region motion velocity [v] (cm/year) and Core lifetime [L] (years)
Uranium Thorium Increase (%) Uranium Thorium Decrease (%)
v L v L
15% 101 137 36.3 29 28 21 38 29.610% 67 94 40.7 39 21 29 28 25.96.5% 43 62 45.7 60 13 43 19 29.7
a Uranium : (235U, 238U)O2.b Thorium : (233U, 232Th)O2.
Ismail et al. / Annals of Nuclear Energy 34 (2007) 120–129 125
Fig. 8 shows the change of kinf during burnup for casesof 15% enrichment. All cases end with about the same levelof kinf (about 0.9). The kinf in the case of thorium fuel typewithout Gd shows a significantly higher initial value. Thisleading property, which is essential for achieving a higherconversion ratio and higher burnup, is compensated by ahigher Gd absorption effect. It means that more neutrons
have to be sacrificed for depleting Gd before the fresh fuelbe burnt for energy production.
In the following, we will discuss each case individually toexplore their burnup characteristics, i.e. the role of 232Th asa fertile material and 233U as a fissile material producedduring fuel burnup by choosing representative cases ofenrichment 15%.
0.4
0.5
0.6
0.7
0.8
0.9
1.0
1.1
1.2
1.3
1.4
0 100 200 300 400 500 600 700 800
Axial Position [cm]
kin
fini
ty [
-]
kinf without Gd (Fresh fuel) :
Uranium = 1. 55059 Transitional = 1. 60446 Thorium = 1. 83499
Burning motion direction
Uranium
Transitional
T horium
Fig. 8. kinf for fissile content = 15%.
1.E+16
1.E+17
1.E+18
1.E+19
1.E+20
1.E+21
1.E+22
0 100 200 300 400 500 600 700 800
Axial Position [cm]
Nuc
lide
Den
sity
[at
oms
/cm
3 ]
0.0E+00
5.0E+12
1.0E+13
1.5E+13
2.0E+13
2.5E+13
Flu
x [n
eutr
on /c
m2 .
s ]
Burning motion direction
Total fissile
Total fertile
Thermal flux
Gd-157
U-235
Pu-239
Pu-241
Fig. 9. Nuclide densities and thermal neutron flux of the uranium case for fissile content of 15% (Gd = 3%).
1.E+16
1.E+17
1.E+18
1.E+19
1.E+20
1.E+21
1.E+22
0 100 200 300 400 500 600 700 8000.0E+00
5.0E+12
1.0E+13
1.5E+13
2.0E+13
2.5E+13
3.0E+13
3.5E+13
4.0E+13Burning motion direction
Total fissile
Total fertile
Thermal flux
Gd-157U-235
U-233
Axial Position [cm]
Nuc
lide
Den
sity
[at
oms
/cm
3 ]
Flu
x [n
eutr
on /c
m2 .
s ]
Fig. 10. Nuclide densities and thermal neutron flux of the transitional case for fissile content 15% (Gd = 4.3%).
126 Ismail et al. / Annals of Nuclear Energy 34 (2007) 120–129
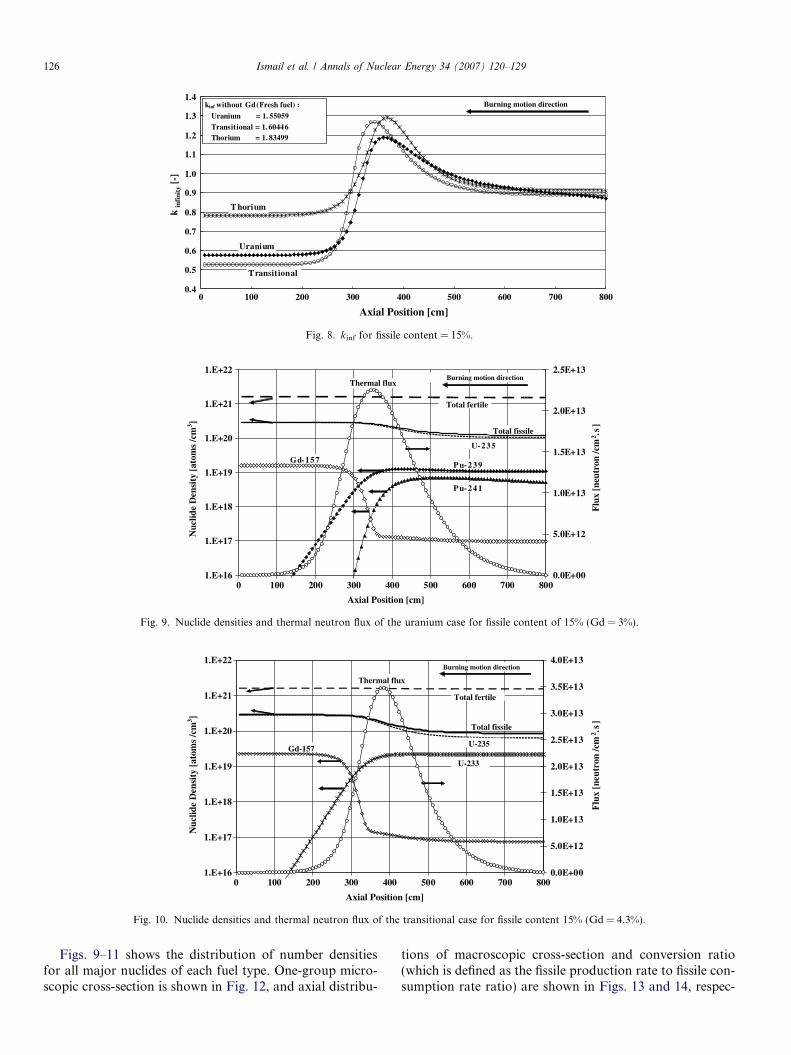
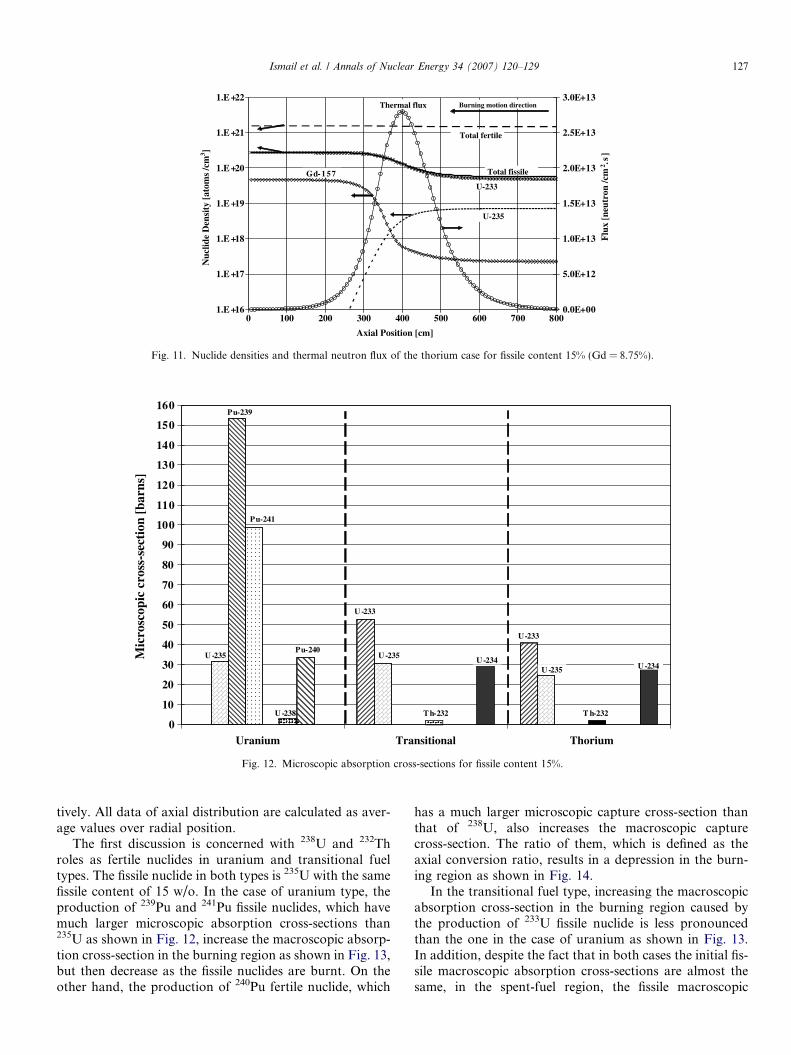
Figs. 9–11 shows the distribution of number densitiesfor all major nuclides of each fuel type. One-group micro-scopic cross-section is shown in Fig. 12, and axial distribu-
tions of macroscopic cross-section and conversion ratio(which is defined as the fissile production rate to fissile con-sumption rate ratio) are shown in Figs. 13 and 14, respec-
1.E+16
1.E+17
1.E+18
1.E+19
1.E+20
1.E+21
1.E+22
0 100 200 300 400 500 600 700 8000.0E+00
5.0E+12
1.0E+13
1.5E+13
2.0E+13
2.5E+13
3.0E+13Burning motion direction
Total fissile
Total fertile
Thermal flux
Gd-157
U-235
U-233
Axial Position [cm]
Nuc
lide
Den
sity
[at
oms
/cm
3 ]
Flu
x [n
eutr
on /c
m2 .
s ]
Fig. 11. Nuclide densities and thermal neutron flux of the thorium case for fissile content 15% (Gd = 8.75%).
0
10
20
30
40
50
60
70
80
90
100
110
120
130
140
150
160
Uranium Transitional Thorium
Mic
rosc
opic
cro
ss-s
ecti
on [
barn
s]
U -233
U-233
U -235
Pu-239
Pu-241
T h-232 T h-232
U -235
U -238
Pu-240
U -235 U -234U -234
Fig. 12. Microscopic absorption cross-sections for fissile content 15%.
Ismail et al. / Annals of Nuclear Energy 34 (2007) 120–129 127
tively. All data of axial distribution are calculated as aver-age values over radial position.
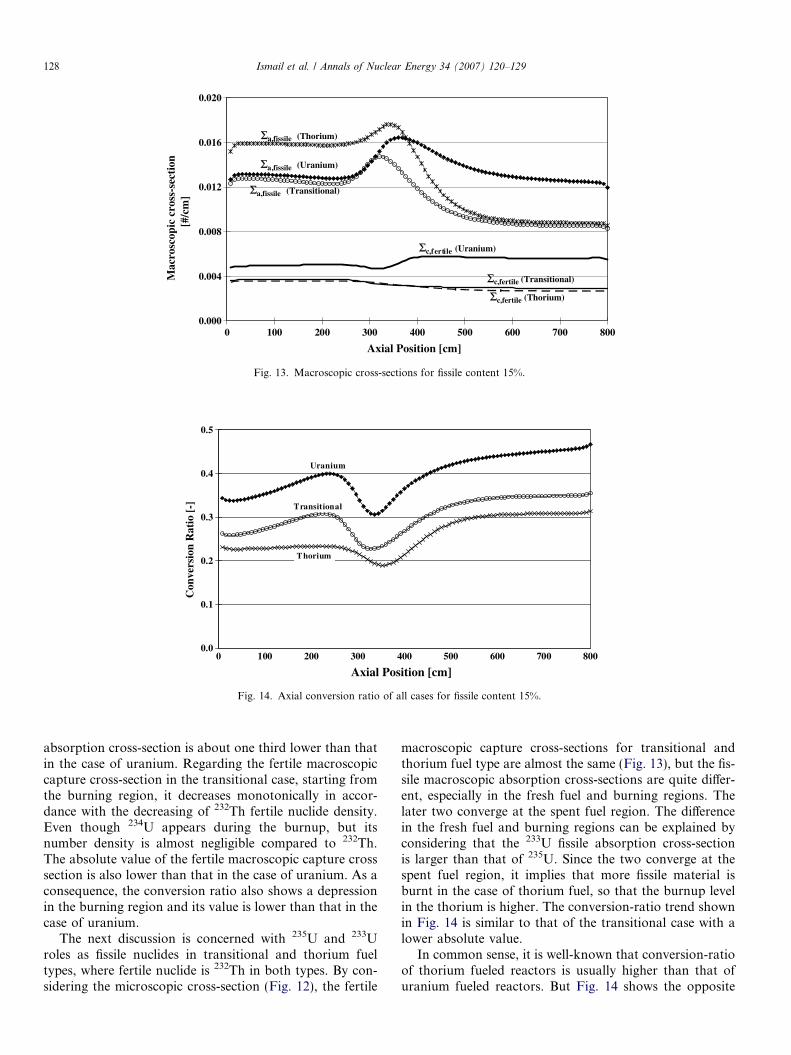
The first discussion is concerned with 238U and 232Throles as fertile nuclides in uranium and transitional fueltypes. The fissile nuclide in both types is 235U with the samefissile content of 15 w/o. In the case of uranium type, theproduction of 239Pu and 241Pu fissile nuclides, which havemuch larger microscopic absorption cross-sections than235U as shown in Fig. 12, increase the macroscopic absorp-tion cross-section in the burning region as shown in Fig. 13,but then decrease as the fissile nuclides are burnt. On theother hand, the production of 240Pu fertile nuclide, which
has a much larger microscopic capture cross-section thanthat of 238U, also increases the macroscopic capturecross-section. The ratio of them, which is defined as theaxial conversion ratio, results in a depression in the burn-ing region as shown in Fig. 14.
In the transitional fuel type, increasing the macroscopicabsorption cross-section in the burning region caused bythe production of 233U fissile nuclide is less pronouncedthan the one in the case of uranium as shown in Fig. 13.In addition, despite the fact that in both cases the initial fis-sile macroscopic absorption cross-sections are almost thesame, in the spent-fuel region, the fissile macroscopic
0.000
0.004
0.008
0.012
0.016
0.020
0 100 200 300 400 500 600 700 800
Axial Position [cm]
Mac
rosc
opic
cro
ss-s
ecti
on[#
/cm
]
Σa,fissile (Uranium)
Σa,fissile (Transitional)
Σa,fissile (Thorium)
Σc,fertile (Uranium)
Σc,fertile (Transitional)
Σc,fertile (Thorium)
Fig. 13. Macroscopic cross-sections for fissile content 15%.
0.0
0.1
0.2
0.3
0.4
0.5
0 100 200 300 400 500 600 700 800
Axial Position [cm]
Con
vers
ion
Rat
io [
-]
Uranium
Transitional
Thorium
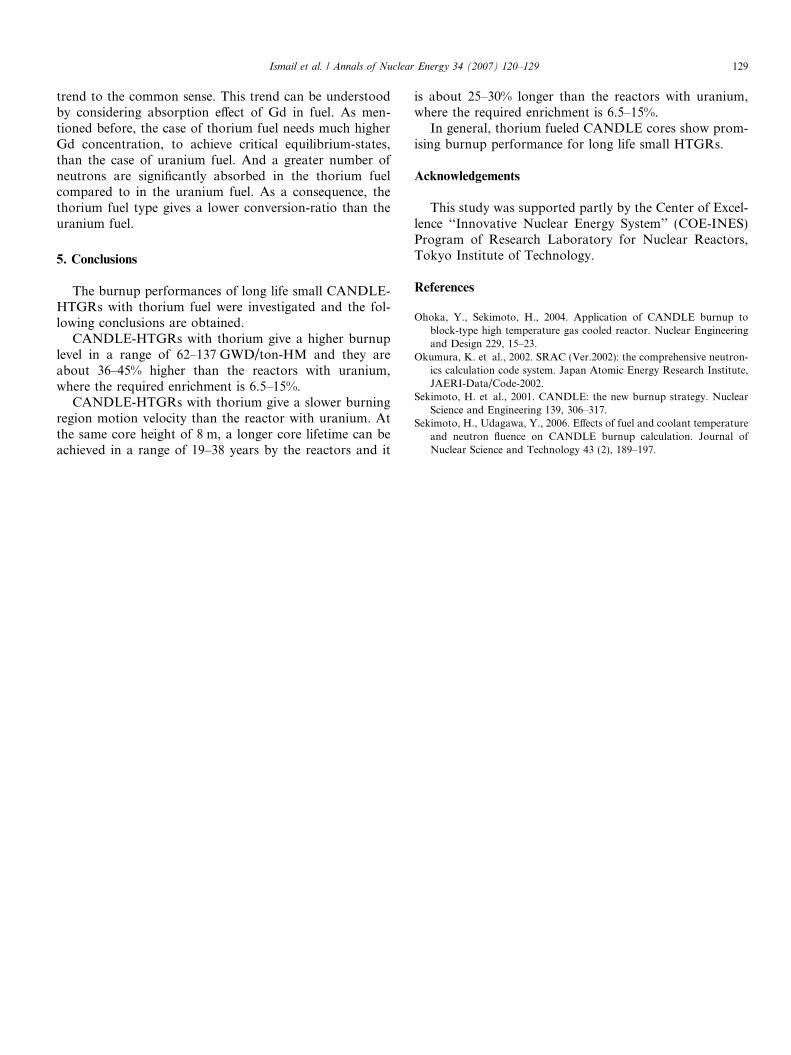
Fig. 14. Axial conversion ratio of all cases for fissile content 15%.
128 Ismail et al. / Annals of Nuclear Energy 34 (2007) 120–129
absorption cross-section is about one third lower than thatin the case of uranium. Regarding the fertile macroscopiccapture cross-section in the transitional case, starting fromthe burning region, it decreases monotonically in accor-dance with the decreasing of 232Th fertile nuclide density.Even though 234U appears during the burnup, but itsnumber density is almost negligible compared to 232Th.The absolute value of the fertile macroscopic capture crosssection is also lower than that in the case of uranium. As aconsequence, the conversion ratio also shows a depressionin the burning region and its value is lower than that in thecase of uranium.
The next discussion is concerned with 235U and 233Uroles as fissile nuclides in transitional and thorium fueltypes, where fertile nuclide is 232Th in both types. By con-sidering the microscopic cross-section (Fig. 12), the fertile
macroscopic capture cross-sections for transitional andthorium fuel type are almost the same (Fig. 13), but the fis-sile macroscopic absorption cross-sections are quite differ-ent, especially in the fresh fuel and burning regions. Thelater two converge at the spent fuel region. The differencein the fresh fuel and burning regions can be explained byconsidering that the 233U fissile absorption cross-sectionis larger than that of 235U. Since the two converge at thespent fuel region, it implies that more fissile material isburnt in the case of thorium fuel, so that the burnup levelin the thorium is higher. The conversion-ratio trend shownin Fig. 14 is similar to that of the transitional case with alower absolute value.
In common sense, it is well-known that conversion-ratioof thorium fueled reactors is usually higher than that ofuranium fueled reactors. But Fig. 14 shows the opposite
Ismail et al. / Annals of Nuclear Energy 34 (2007) 120–129 129
trend to the common sense. This trend can be understoodby considering absorption effect of Gd in fuel. As men-tioned before, the case of thorium fuel needs much higherGd concentration, to achieve critical equilibrium-states,than the case of uranium fuel. And a greater number ofneutrons are significantly absorbed in the thorium fuelcompared to in the uranium fuel. As a consequence, thethorium fuel type gives a lower conversion-ratio than theuranium fuel.
5. Conclusions
The burnup performances of long life small CANDLE-HTGRs with thorium fuel were investigated and the fol-lowing conclusions are obtained.
CANDLE-HTGRs with thorium give a higher burnuplevel in a range of 62–137 GWD/ton-HM and they areabout 36–45% higher than the reactors with uranium,where the required enrichment is 6.5–15%.
CANDLE-HTGRs with thorium give a slower burningregion motion velocity than the reactor with uranium. Atthe same core height of 8 m, a longer core lifetime can beachieved in a range of 19–38 years by the reactors and it
is about 25–30% longer than the reactors with uranium,where the required enrichment is 6.5–15%.
In general, thorium fueled CANDLE cores show prom-ising burnup performance for long life small HTGRs.
Acknowledgements
This study was supported partly by the Center of Excel-lence ‘‘Innovative Nuclear Energy System’’ (COE-INES)Program of Research Laboratory for Nuclear Reactors,Tokyo Institute of Technology.
References
Ohoka, Y., Sekimoto, H., 2004. Application of CANDLE burnup toblock-type high temperature gas cooled reactor. Nuclear Engineeringand Design 229, 15–23.
Okumura, K. et al., 2002. SRAC (Ver.2002): the comprehensive neutron-ics calculation code system. Japan Atomic Energy Research Institute,JAERI-Data/Code-2002.
Sekimoto, H. et al., 2001. CANDLE: the new burnup strategy. NuclearScience and Engineering 139, 306–317.
Sekimoto, H., Udagawa, Y., 2006. Effects of fuel and coolant temperatureand neutron fluence on CANDLE burnup calculation. Journal ofNuclear Science and Technology 43 (2), 189–197.
Recommended


