Measuring thePotential ofUnilateral CDM- A Pilot Study -
Michael JahnAxel MichaelowaStefan RaubenheimerHolger Liptow
HWWA DISCUSSION PAPER
263Hamburgisches Welt-Wirtschafts-Archiv (HWWA)
Hamburg Institute of International Economics2004
ISSN 1616-4814

Hamburgisches Welt-Wirtschafts-Archiv (HWWA)Hamburg Institute of International EconomicsNeuer Jungfernstieg 21 - 20347 Hamburg, GermanyTelefon: 040/428 34 355Telefax: 040/428 34 451e-mail: [email protected]: http://www.hwwa.de
The HWWA is a member of:
• Wissenschaftsgemeinschaft Gottfried Wilhelm Leibniz (WGL)•••• Arbeitsgemeinschaft deutscher wirtschaftswissenschaftlicher Forschungsinstitute
(ARGE)•••• Association d’Instituts Européens de Conjoncture Economique (AIECE)

HWWA Discussion Paper
Measuring the Potential ofUnilateral CDM - A Pilot Study -
Michael JahnAxel Michaelowa
Stefan RaubenheimerHolger Liptow
HWWA Discussion Paper 263http://www.hwwa.de
Hamburg Institute of International Economics (HWWA)Neuer Jungfernstieg 21 - 20347 Hamburg, Germany
e-mail: [email protected]
This paper was financed through the Climate Protection Programme (CaPP) of theDeutsche Gesellschaft für Technische Zusammenarbeit (GTZ) and written within theHWWA-Programme „International Climate Policy“.
Edited by the Department World EconomyHead: PD Dr. Carsten Hefeker

HWWA DISCUSSION PAPER 263January 2004
Measuring the Potential ofUnilateral CDM - A Pilot Study -
ABSTRACT
The Clean Development Mechanism (CDM) was originally seen as an instrument with a bilateral charac-ter where an entity from an industrialised country invests in a project in a developing country (DC). Also,multilateral funds were envisaged that would bundle investments to spread project risks. The sluggish im-plementation of incentives for industrialised country companies to embark on CDM projects and low car-bon prices led to a preference of just buying Certified Emission Reductions (CERs) instead of investing inprojects. Thus a third option has gained prominence – the unilateral option where the project developmentis planned and financed within the DC. We propose that a project should be called “pure unilateral” if itinvolves no foreign direct investment (FDI), only has the approval of the Designated National Authority(DNA) of the host country and sells its CERs after certification directly to an industrialised country. Uni-lateral projects can become attractive if the host country risk premium for foreign investors is high despitea high human, institutional and infrastructure capacity and domestic capital availability. Moreover, trans-action costs can be reduced compared to foreign investments that have to overcome bureaucratic hurdles.On the other hand, technology transfer is likely to be lower, capacity building has to be done by the hostcountry and all risks have to be carried by host country entities.The potential to carry out unilateral CDM projects strongly varies among DCs. Whereas several countriesfrom Asia and Latin America might well be able to design projects autonomously, most of the Sub-Saharan countries rely on foreign support. International donors of capacity building grants should in-creasingly address those DCs that are not in the focus of foreign investors and support them in the designof projects.
JEL Classification: Q25, O13Key words: Clean Development Mechanism, unilateral, institutions, project partici-pants, financing, risk premium
Michael JahnAxel MichaelowaHamburg Institute of International Economics, Neuer Jungfernstieg 21, 20347 Ham-burg, Germany, Phone +49 40 42834 309, Fax +49 40 42834 451, [email protected]
Stefan RaubenheimerSouthSouthNorth, South Africa Office, 138 Waterkant Street, Greenpoint, 8001 CapeTown, South Africa, [email protected]
Holger LiptowGTZ, Dag-Hammerskjöld-Weg 1-5, 65726 Eschborn, Germany, [email protected]

I
Contents
CONTENTS .............................................................................................................................. I
OVERVIEW OF FIGURES AND TABLES....................................................................... III
ABBREVIATIONS................................................................................................................ IV
1 OVERVIEW OF THE POLICY FRAMEWORK..........................................................1
1.1 INTERNATIONAL CLIMATE CHANGE POLICY – FROM RIO TO KYOTO...............................11.2 THE KYOTO MECHANISMS..............................................................................................1
2 THE CLEAN DEVELOPMENT MECHANISM...........................................................3
2.1 RULES FOR THE CDM.....................................................................................................32.1.1 Participation criteria ...............................................................................................32.1.2 CDM institutions ....................................................................................................32.1.3 Project eligibility criteria ........................................................................................32.1.4 Eligible project categories ......................................................................................42.1.5 Small-scale projects ................................................................................................42.1.6 The CDM Project Cycle .........................................................................................4
2.2 RISKS IN CDM PROJECTS ...............................................................................................6
3 A LOOK AT THE MARKET FOR CERS......................................................................8
3.1 THE DEMAND FOR CERS ................................................................................................83.2 CURRENT SUPPLY OF CDM PROJECTS ............................................................................9
4 APPROACHING THE UNILATERAL DESIGN........................................................13
4.1 UNILATERAL CDM IN THE INTERNATIONAL RULES......................................................134.2 THE HISTORY OF THE DEBATE ON UNILATERAL CDM...................................................144.3 TRIGGERS FOR UNILATERAL CDM PROJECTS ...............................................................15
4.3.1 Origin of Investment.............................................................................................154.3.2 Purchase agreements.............................................................................................154.3.3 DNA approval.......................................................................................................17
4.4 UNILATERAL PROJECTS UNDER THE CURRENT CIRCUMSTANCES...................................17
5 ADVANTAGES OF UNILATERAL CDM...................................................................19
5.1 LOWER RISK PERCEPTION BY THE HOST........................................................................195.2 REDUCTION OF TRANSACTION COSTS ...........................................................................20
5.2.1 Market transaction costs .......................................................................................20

II
5.2.2 Project cycle TAC ................................................................................................215.3 MORE SMALL-SCALE PROJECTS ....................................................................................215.4 KEEPING CDM RENT IN HOST COUNTRIES....................................................................22
6 DISADVANTAGES OF UNILATERAL CDM ............................................................23
6.1 HIGHER KYOTO RISK....................................................................................................236.2 DOWNWARD CER PRICE RISK FOR LOCAL PROJECT DEVELOPERS.................................236.3 CAPACITY BUILDING COSTS TO BE BORNE BY HOST COUNTRY ......................................236.4 LESS TECHNOLOGY TRANSFER......................................................................................246.5 DELAY OF FINANCIAL INFLOWS ....................................................................................246.6 RISK OF MORE NON-ADDITIONAL PROJECTS..................................................................24
7 REQUIREMENTS FOR UNILATERAL CDM...........................................................25
7.1 MOBILISATION OF DOMESTIC CAPITAL .........................................................................257.1.1 Joint action of financial institutions and establishment of financial standards ....257.1.2 Project risk management capability......................................................................257.1.3 Financing instruments...........................................................................................267.1.4 Financial capacity building for local developers and financing institutions ........27
7.2 MINIMUM HUMAN, INFRASTRUCTURE AND INSTITUTIONAL CAPACITIES.......................277.3 PROJECT EXPERIENCE...................................................................................................28
8 MEASURING THE POTENTIAL OF UNILATERAL CDM....................................29
8.1 METHODOLOGY............................................................................................................298.1.1 Selection of empirical indicators ..........................................................................298.1.2 Collection of data..................................................................................................328.1.3 Scaling of data ......................................................................................................328.1.4 The determination of threshold values .................................................................33
8.2 DATA EVALUATION ......................................................................................................348.2.1 Regional differences in the potential of unilateral CDM .....................................358.2.2 Case studies ..........................................................................................................38
9 CONCLUSION AND RECOMMENDATIONS...........................................................44
APPENDIX A: IMPACTS OF A DIFFERENT RISK PERCEPTION ONMITIGATION PROJECTS...................................................................................................45
APPENDIX B: DATA COLLECTION AND SCALE INDEX VALUES.........................47
REFERENCES .......................................................................................................................52

III
Overview of figures and tables
Figure 1: Stages of the CDM Project Cycle ...............................................................................5Figure 2: Current demand on the CDM and JI market (million $).............................................9Figure 3: Distribution of projects among CER buyers (number of projects) ...........................10Figure 4: Amount of future CERs claimed by different buyers (Mt CO2 equivalent) .............10Figure 5: Distribution of projects among host countries (number of projects) ........................11Figure 6: Amount of future CERs generated by host countries (Mt CO2 equivalent)..............11Figure 7: Share of different project types (percentage) ............................................................12Figure 8: Share of future CERs generated by a specific project type (percentage)..................12Figure 9: Indicator profile – China ...........................................................................................38Figure 10: Indicator profile - Brazil .........................................................................................40Figure 11: Indicator profile – South Africa ..............................................................................41Figure 12:Indicator profile - Iran..............................................................................................43Figure 13: Effects of risk premium for foreign CDM investment............................................45Figure 14: Exogenous world market price and bi- vs. unilateral CDM ...................................46
Table 1: Examples of eligible project categories and types .......................................................4Table 2: Influence of Annex B buyers on locally developed projects – PCF and CERUPT ...18Table 3: Transaction cost groups of CDM projects and their cost components.......................20Table 4: Selection of empirical indicators ................................................................................30

IV
Abbreviations
$ Dollar§ ParagraphAAU Assigned Amount UnitAIJ Activities Implemented JointlyBCF Bio Carbon FundCDCF Clean Development Carbon FundCDM Community Development MechanismCER Certified Emission ReductionCERUPT Certified Emission Reduction Procurement TenderCH4 MethaneCO2 Carbon DioxideCOP Conference of the PartiesCOP/MOP Conference of the Parties serving as the Meeting of the Parties to the Kyoto
ProtocolDNA Designated National AuthorityERU Emission Reduction UnitEU European UnionFDI Foreign Direct InvestmentG GigaGHG Greenhouse gasesGWh Gigawatt hourHFCs HydroflurocarbonsIPCC Intergovernmental Panel on Climate ChangeIRR Internal Rate of ReturnJI Joint Implementationk kiloKP Kyoto Protocolkt kilotonnekWh kilowatthourM MegaMA Marrakech AccordsMW MegawattN2O Nitrous oxideNCDF Netherland’s Carbon Development FacilityNGO Non Governmental OrganizationOE Designated Operational EntityPCF Prototype Carbon FundPDD Project Design DocumentPFCs PerfluorocarbonsSF6 SulphurhexafluorideTAC Transaction costsUNFCCC United Nations Framework Convention on Climate ChangeUNDP United Nations Development ProgrammeWDI World Development Indicators

1
1 Overview of the policy framework
1.1 International climate change policy – from Rio to Kyoto
During the 1980s first evidence of human influence on the climate system increased theawareness of climate issues among governments and organisations. In 1988 the WorldMeteorological Organisation and the United Nations Environment Programme created theIntergovernmental Panel on Climate Change (IPCC) to evaluate scientific information and toadvise policy makers on this subject. In its first assessment report, published in 1990, theIPCC stated that climate change was a real threat. Later that year the IntergovernmentalNegotiating Committee was formed to work out an international treaty addressing theproblem of climate change. The treaty is known as the United Nations FrameworkConvention on Climate Change (UNFCCC) and was opened for signature at the EarthSummit in Rio de Janeiro in 1992. Since it came into force 1994 the Parties to the Conventionmeet annually at the Conference of the Parties (COP). According to the UNFCCC theindustrialised countries pledged to reduce their greenhouse gas (GHG) emissions by the year2000 to 1990 levels. As listed in Annex I of the Convention, this group of countries is knownas Annex I countries. However, this self-commitment was not legally binding and it soonbecame clear that the reduction goals would not be attained.
At COP-3 held in Kyoto in 1997 the industrialised countries including the Eastern Europeancountries with economies in transition finally adopted legally binding constraints by agreeingto reduce GHG emissions by 5.2 per cent below their 1990 level on average over a firstcommitment period 2008-2012. As listed in Annex B of the Kyoto Protocol (KP) this groupof countries is known as Annex B countries1 (see UNFCCC 2003a, p. 3ff).
1.2 The Kyoto mechanisms
In order to reduce emissions in a cost efficient way the KP provides three market-basedflexible mechanisms. The three mechanisms are known as International Emission Trading(see UNFCCC 1997, Article 17 KP), which allows for emission trading of Assigned AmountUnits (AAUs)2 between Annex B countries, and the project-based mechanisms JointImplementation (JI) (see UNFCCC 1997, Article 6 KP) and Clean Development Mechanism(CDM) (see UNFCCC 1997, Article 12 KP). Whereas JI refers to project activities withinAnnex I countries, the CDM allows for generating greenhouse gas emission credits throughinvestment in emission reduction or sequestration projects in developing countries (DCs)
1 Annex B consists of all of those countries listed in Annex I with the exception of Turkey and Czechoslovakia.New countries added to Annex B include Croatia, the Czech Republic, Liechtenstein, Monaco, Slovakia andSlovenia (see Michaelowa and Koch 2001, p.11).2 The Assigned Amount is a nation’s emissions budget under the first commitment period, measured in tons ofCO2 equivalent. AAUs are the parts of that amount used for emissions trading (see Michaelowa and Koch 2001,p. 12).

2
(Non-Annex I countries) without emission targets. The emission credits generated through JIare called “Emission Reduction Units” (ERUs). Credits generated through the CDM arecalled “Certified Emission Reductions” (CERs) respectively. Annex B countries can reachcompliance with their commitments by implementing domestic abatement measures or byusing AAUs, ERUs and CERs3.
3 AAUs, ERUs and CERs are equal to one metric tonne of CO2 equivalent (see UNFCCC 2001a, 17/CP.7,Annex A, §1).

3
2 The Clean Development Mechanism
2.1 Rules for the CDM
The KP and the decisions taken at the seventh Conference of the Parties (COP-7), known asMarrakech Accords (MA), lay down certain rules for the CDM. They have been refined bythe CDM Executive Board (see 2.1.2).
2.1.1 Participation criteria
In order to be eligible for the CDM, both DCs that host a project activity and participatingAnnex B countries must have ratified the KP and have established a national focal point,called Designated National Authority (DNA), responsible for approving and evaluating CDMprojects. Besides Annex B countries have to meet additional methodological and reportingcriteria. Participation in a CDM project is voluntary (see UNFCCC 2001a, 17/CP.7, AnnexF).
2.1.2 CDM institutions
The CDM is administered by two bodies, the Conference of the Parties serving as Meeting ofthe Parties (COP/MOP) and the Executive Board. The COP/MOP is the supreme body to theCDM. It shall provide guidance to the Executive Board and take decisions on modalities andprocedures of the CDM (see UNFCCC 2001a, 17/CP.7, Annex B). The Executive Board shallsupervise the CDM and is fully accountable to the COP/MOP. It is comprised by 10 membersfrom Parties to the KP and charged with a number of approving and accrediting tasks to beperformed during the preparation and operating time of a CDM project (see UNFCCC 2001a,17/CP.7, Annex C).
2.1.3 Project eligibility criteria
A project activity has to result in the reduction or sequestration of GHG gases covered inAnnex A of the KP (CO2, CH4, N2O, SF6, HFCs, PFCs). The emission reductions and thus thewhole project activity have to be additional compared with a business as usual scenario whichdoes not include the implementation of the CDM (see UNFCCC 2001a, 17/CP.7, Annex G,§43). In order to prove that emission reductions are additional, project developers have todraw up a baseline, i.e. a scenario which presents the GHG emissions that would occur in theabsence of the project, and compare it with actual project emissions. Furthermoreadditionality has to be proved by identifying barriers that would have prevented the projectfrom being implemented without the CDM. A distinction is drawn between technological,organisational, legal and financial barriers. Finally the project should meet the host country’ssustainable development criteria (see UNFCCC 1997, Article 12.2 KP) and not result inunacceptable impacts on the environment.

4
2.1.4 Eligible project categories
All CDM projects aim at lowering the concentration of GHGs in the atmosphere. This can bereached by reducing/avoiding GHG emissions or by sequestering CO2 through the process ofphotosynthesis. In the MA eligible project categories for the first commitment period havebeen restricted by the exclusion of certain sequestration project types and the decision not touse CERs from nuclear energy generation (see UNFCCC 2001a, 17/CP.7). The rules forforestry projects have been defined at COP-9 in Milan. Examples for eligible CDM projectcategories and specific types of projects are listed in the table below (see Eyzaguirre 2002, p.75).
Table 1: Examples of eligible project categories and types
Project category Project typeRenewable energyEnergy generationCo-generationHigh efficiency lighting, cooling systemsEnergy efficiencyHigh efficiency motorsAlternative fuel vehiclesTransportationMass transit improvementsMethane capture from solid wasteWaste managementMethane capture from oil and gas productionAfforestationLand use (CO2 Sequestration)Reforestation
2.1.5 Small-scale projects
Among the eligible project categories small-scale projects are defined as:• Renewable energy projects with a maximum output capacity of up to 15 MW• Energy efficiency projects which reduce energy consumption by up to 15 GWh/year• Other projects that reduce emissions and emit less than 15 kt of CO2 annuallyCompared with larger projects small-scale projects are subject to simplified procedures andmodalities (see UNFCCC 2001a, 17/CP.7, §6).
2.1.6 The CDM Project Cycle
In order to allow for the creation of carbon credits, the reduction of GHGs that result from aproject has to be measured and audited. Therefore all projects running under the CDM mustfollow a standardised procedure commonly known as the CDM Project Cycle. The ProjectCycle has five basic stages: project identification and formulation, national approval,validation and registration, monitoring, verification and certification (see Figueres and Gowan

5
2002, p.24). A project is implemented after registration. So far no CDM projects have beenregistered yet.
Figure 1: Stages of the CDM Project Cycle
Projectidentification and
formulation
Nationalapproval
Validation andregistration
Monitoring
Verificationand
Certification
Project Cycle
• Project identification and formulationAs a first step project developers have to identify their project idea. Once they have chosen tocarry it out they have to formulate their intentions following a format established by the COP,the so called Project Design Document (PDD). It includes a description of the project, apresentation of the baseline4, a description of how the project reduces GHG emissions belowthe baseline, an environmental impact assessment, comments of possibly affected groups andindividuals and a monitoring plan5. Monitoring refers to the collection and archiving of allrelevant data necessary for determining the baseline, and for measuring the GHG emissionsoccurring over the crediting period6 of a project (see UNFCCC 2001a, 17/CP.7, Appendix B).
4 If for a any project category a baseline is prepared for the first time, the project developers first have to submita methodology to the Executive Board on how the baseline emission can be assessed. The Executive Boarddecides on whether the methodology will be approved or not (see UNFCCC 2001a, 17/CP.7, Annex G § 38).5 If for a any project category a monitoring plan is prepared for the first time, the project developers first have tosubmit a methodology to the Executive Board on how actual emissions can be assessed. The Executive Boarddecides on whether the methodology will be approved or not (see UNFCCC 2001a, 17/CP.7, Annex G § 38).6 The time over which a project generates CERs is called crediting period. The developer can chose between 10and 7 years. A 7 years crediting period can be renewed for another two times so that the maximum creditinglifetime is 21 years (see UNFCCC 2001a, 17/CP.7, Annex G § 49). For forestry projects the crediting period iseither 30 or 20 years, the latter renewable twice (see UNFCCC 2003d, -/CP.9, §23).

6
• National approvalPrior to registration, the host country’s DNA has to give written approval that the projectactivity is consistent with the country’s sustainable development goals. Moreover the DNAsof all (at this point of time) participating countries have to submit a declaration that theyvoluntarily participate in the project (see UNFCCC 2001a, 17/CP.7, Annex G, §40a).
• Validation and registrationBefore a project can be registered an independent third party entity, called DesignatedOperational Entity (OE), has to assess whether the project reduces emissions as supposed bythe developers and whether participation criteria are met. This procedure is called validation.Subsequently the OE submits a validation report to the Executive Board. If the ExecutiveBoard approves the report, the project is registered and can be implemented (see UNFCCC2001a, 17/CP.7, Annex G).
• MonitoringAs soon as the project is operational actual GHG emissions have to be periodically calculatedand documented according to the monitoring plan in a monitoring report that constitutes thebasis of verification and certification (see UNFCCC 2001a, 17/CP.7, Annex H).
• Verification and certificationThe project operator has to submit the monitoring report to another OE that reviews anddeterminates the GHG reductions by subtracting the monitored emissions from the baselineemissions and thus verifies the achieved reductions. Finally the OE certifies the reductions bya written statement. Now the Executive Board can issue the Certified Emission Reductions tothe registry account7 of the project developer (see UNFCCC 2001a, 17/CP.7, Annex I).
2.2 Risks in CDM projects
CDM projects are subject to numerous risks. Beside the conventional project risks, additionalrisks arise from participating in the nascent carbon market. The risks can be categorised asfollows (see Prototype Carbon Fund (PCF) 2002b, p. 1; Jablonski 2003, p. 29)
• Conventional project risksConventional project risks cover all the risks that are linked with the design andimplementation of a traditional project activity. These risks relate to the construction,performance, financial engineering of a project, conclusion of enforceable contracts,creditworthiness of counterparties, environmental and social impacts and force majeure.
7 The Executive Board will establish a register for the holding and transfer of CERs (see UNFCCC 2001a,17/CP.7, Appendix D).

7
• Kyoto riskThe Kyoto risk relates to whether the KP will come into force and whether countries thatparticipate in a CDM project will ratify and comply with its obligations. If the KP fails it isquestionable if generated emission reductions through the CDM can be applied in Non-Kyotoemission trading regimes.
• CER price riskThe CER price risk relates to an uncertain market price for CERs. The market price is drivenby the aggregate supply and demand for the amount of emission reduction credits (AAUs,ERUs, CERs). The demand side depends primarily on the number of countries making use ofthe Kyoto mechanisms. The Kyoto ratification of the United States, for example, would raisethe demand significantly. The supply of emission reduction credits will strongly be influencedby the amount of surplus AAUs coming from the countries with economies in transition, alsoknown as “hot air”. Thus it is very difficult to forecast future prices for CERs (see 3.1).
• CER quantity riskCER quantity risk means that the amount of CERs generated in a project can not be exactlydetermined ex ante. The amount of CERs is derived from the difference between actualemissions and baseline emissions. So the quantity of expected CERs may change for thefollowing reasons (see Deodhar et al. 2003, p. 13):
• The baseline has to be adjusted during the crediting period due to technologicalinnovation, new host country energy or environmental policy (baseline risk).
• Actual project emissions unexpectedly change due to changes in the activity level ofthe project. A change in the activity level could result from a change in demand for theproject output, business interruption etc. (baseline emission risk).Imagine the baseline of a power plant being determined by an emission factor of 1kgof CO2/kWh. The actual emission factor is 0.8kg of CO2/kWh so that the emissionreduction accounted for is 0.2kg of CO2/kWh of generated power. If the power plant isshut down due to an unexpected interruption, the operator does not only lose theconventional power output, but also the associated emission reductions.
• Country riskCDM projects are carried out in DCs, where the political, economic and financial situationgenerally is unstable compared with industrialised countries. Country risk contains the risk ofexpropriation, breach of contracts for political reasons and the risk that emission reductionsmight not be transferred to an Annex B country.

8
3 A look at the market for CERs
Having discussed the principles of how the CDM works and the associated risks we now havea look at the market for CERs. Under the first commitment period of the KP (2008-2012)AAUs, ERUs and CERs can be used by Annex B countries to reach compliance with theirreduction goals. The credits are expected to be traded in an international carbon market,which has still to develop. Up to present the first national emissions trading schemes havebeen set up by countries like the United Kingdom and Denmark and an European EmissionsTrading Scheme is scheduled to start in 2005. Until 2008 the respective schemes are supposedto be linked to the international Kyoto market.
3.1 The demand for CERs
Under the Kyoto market the total demand of emission reductions would amount to 1.1 GtCO2/year8, which equals the total emission reduction requirements of Annex B countrieswithout the United States. Under a standard scenario about one third of the demand would bemet by domestic abatement measures, about one third by the use of surplus AAUs comingfrom the countries with economies in transition (hot air), and one third by the use of creditsaccruing from CDM and JI. The pure CDM demand would amount to ca. 375 Mt CO2/year(see Jotzo and Michaelowa 2002, p. 180-184).
In order to strengthen their market position several governments and multilateral institutionshave already resumed negotiations with future CER suppliers. The World Bank’s PrototypeCarbon Fund (PCF) was launched by the World Bank in January 2000 and will terminate in2012. It is funded by six governments and 17 private sector companies and disposed over atotal capitalisation of $180 million by the end of 2002 for transactions under the CDM and JI(see PCF 2002a, p. 2). Besides, the World Bank initiated the Community DevelopmentCarbon Fund (CDCF), a public/private cooperation, with the aim to purchase CERs fromsmall scale projects that “measurably benefit poor communities and their local environment“(World Bank 2003a, p. 4). Another world bank fund called Bio Carbon Fund (BCF) aims atpurchasing CERs from sequestration projects. Moreover single governments and otherunilateral institutions like the German Kreditanstalt für Wiederaufbau have engaged inforward acquisitions of CERs or are actually preparing to do so. The biggest single marketplayer so far has been the Dutch government. Through the Certified Emissions ReductionsProcurement Tender (CERUPT) the Netherlands provided funds for the acquisition ofCERs. The CDM tender was established by a company called Senter in late 2001 and closedin January 2002 because the Dutch government found the tender procedure of CERUPT tooinflexible and costly. Together with the World Bank it established a new facility to purchaseCERs, the Netherlands Carbon Development Facility (NCDF) (see World Bank 2003a, p.
8 The annual demand refers to the 5-year commitment period between 2008-2012. The amount of necessaryannual emission reductions was defined by the difference between business as usual CO2 emissions in 2010,calculated by the US Department of Energy, and the Kyoto target.
9
3). Figure 2 below shows the current demand on the CDM and JI market (million $). The pureCDM demand is currently about $600 million, i.e. about 150 Mt CO2 equivalent at prices of$3-5/t CO2 equivalent.
Figure 2: Current demand on the CDM and JI market (million $)
3.2 Current supply of CDM projects
Until November 2003, 55 CDM projects have made public a PDD and a baseline study. Thecredits claimed by these projects over their total crediting lifetime amount to approximately144 Mt/ CO2 equivalent. The CERs generated by these projects until 2012, which can be usedfor the first commitment period, would cover about 89 Mt CO2 equivalent.Most of the future CERs generated by these projects will accrue to Japan, CERUPT and PCF(see Figure 4). Most of the projects are located in South America and Asia. Among the 55projects 10 take place in Brazil, 8 in India and 6 in Costa Rica (see Figure 5). The greatestshare of CERs will be generated by Brazil, South Korea9 and India (see Figure 6). Thepredominant project types are renewable energy and gas capturing from landfills (see Figure7). The greatest share of CERs will be generated by gas capture and fuel switching (seeFigure 8) (see CDM Watch 2003).
9 South Korea has a one project burning HFCs that generates almost 30 million CERs over its crediting lifetime.
180
40
40
250
200
50 40 50 5
PCFCDCFBioCFNetherlandsJapanGermanyAustriaDenmarkFinland

10
Figure 3: Distribution of projects among CER buyers (number of projects)
Figure 4: Amount of future CERs claimed by different buyers (Mt CO2 equivalent)
18
14
11
3 2 2 1 CERUPTPCFJapanSwedenNCDFCanadaFinland
45,6
42,4
32,3
17,11,7
1,2
0,08JapanPCFNCDFCERUPTSwedenCanadaFinland

11
Figure 5: Distribution of projects among host countries (number of projects)
Figure 6: Amount of future CERs generated by host countries (Mt CO2 equivalent)
10
8
643222
22
22 10
BrazilIndiaCosta RicaChilePanamaGuatemalaThailandColombiaMalaysiaChinaSouth AfricaVietnamOthers
53,5
29,410,69,56,9
5,44,2
4,13,5
3,1
14,1
BrazilSouth KoreaIndiaSouth AfricaVietnamIndonesiaPanamaChileGuatemalaCosta RicaOthers

12
Figure 7: Share of different project types (percentage)
Figure 8: Share of future CERs generated by a specific project type (percentage)
50
20
14
10 3
21
Methane and HFCcapture and destruction
Fuel Switching
"New" Renewables
Hydro
Avoided fuel switch
Energy efficiency
Waste incineration
45
26
15
88 2 2
"New" Renewables
Methane and HFCcapture and destruction
Hydro
Fuel Switching
Energy efficiency
Avoided fuel switch
Waste incineration

13
4 Approaching the unilateral design
4.1 Unilateral CDM in the international rules
Originally the CDM was designed to initiate joint ventures between partners from aindustrialised country and a DC in a bi- or multilateral institutional framework. In a bilateraldesign an Annex B entity directly invests in the project and in return receives CERs, whichcan be used against the domestic GHG reduction commitment. In the multilateral approachAnnex B entities deposit their money in a centralised investment fund which invests themoney in a portfolio of projects. The depositors would receive generated CERs proportionalto their share in the fund (see Baumert et al. 2000, p. 3ff). As industrialised countries hesitateto invest10 in CDM projects the question has gained prominence if CDM projects can bedeveloped and implemented by DCs unilaterally and the resulting CERs be retained and soldwithout any involvement of industrialised countries.
In the run-up to COP-6, 2nd part in 2001, it was still discussed whether there should be anexplicit reference as to whether or not unilateral CDM projects are permitted and threevariants of text were proposed. It was clearly stated that “in the absence of a provision,unilateral projects would not be excluded” (UNFCCC 2001b, p. 12). The decision at COP-7(17/CP.7) on the CDM judiciously avoided any text that could be seen as embracing orexcluding a specific institutional interpretation. In line with the interpretation given byUNFCCC (2001b), this means that unilateral projects are allowed. Nevertheless, the wordingof the MA has given room for different interpretations and still some governments maintainthat unilateral CDM is not allowed. The key clause in the MA reads as follows (UNFCCC2001a, 17/CP.7, Annex G, §40a): ”The designated operational entity shall prior to thesubmission of the validation report to the executive board, have received from the projectparticipants written approval of voluntary participation from the designated national authorityof each Party involved, including confirmation by the host Party that the project activityassists it in achieving sustainable development.” The apparent reference to “projectparticipants” might create an impression that two parties in a bilateral arrangement arerequired to approach the Executive Board of the CDM for the registration of the project.However, the clause could not have been drafted in the singular, as this would have excludedbilateral projects, which was not the intention. We know that the political intent of theprocedures was not to exclude the unilateral format, and so the clause appears to be a shortcutfor the understanding that the text should be read as “the project participant or participants”.
A proof for the legality of unilateral projects can be found in the Executive Board’s templatefor the Project Design Development, which clearly refers to the possibility of there being onlyone project participant and one Party. The exact wording reads as follows: “Please listParty(ies) and private and/or public entities involved in the project activity...“ (UNFCCC2003c, A.3.). 10 The CER demand described in section 3.1 expresses itself mainly as interest to buy CERs.

14
4.2 The history of the debate on unilateral CDM
As at Kyoto and the years leading up to COP-7 the CDM was believed to lead to a lot offoreign direct investment (FDI) towards DCs, the majority of policymakers and researcherssaw the possibility for DCs to carry out CDM projects on their own was as an idea withoutmuch relevance. Nevertheless, many DCs, especially from South America argued early in theprocess to be able to invest in projects and sell the resulting CERs to Annex B countries (seeInternational Institute for Sustainable Development (IISD) 2000). Within the so calledActivities Implemented Jointly (AIJ), a first pilot phase for CDM and JI launched in 1995after COP-1, Costa Rica pioneered this approach with the creation of “Certified TradableOffsets”11 in 1996 (see Roveda and Merenson 1999, p. 22f). The advocates of unilateral CDM(see Stewart et al. 1999, p. 28) argued that this approach could minimise transaction costs dueto the fact that barriers are better known to the domestic actors than to foreign investors andcan be overcome more easily by the former. A few countries attractive for FDI such as Chinaopposed unilateral CDM (see UNFCCC 2000, p. 49), because they are interested to benefitfrom technology transfer in the CDM context and possibly fear that unilateral CDM worsenstheir comparative CER market advantage. On the other hand South Korea, a country with alot of FDI, has been the most vocal supporter of unilateral CDM12. Zhang (2001) assumes thisis due to the fact that Korea wants to bank CERs for the time when it takes up an emissiontarget. Other participants, especially environmental Non Governmental Organizations(NGOs), have argued that unilateral CDM is going against the spirit of cooperation betweenNorth and South and thus should not be allowed. While Greenpeace (1999) initially acceptedall three models, it later became an opponent of unilateral CDM fearing that it could be usedto get nuclear energy in the CDM. Moreover, it was felt that the risk of non-additionalprojects could be higher under unilateral CDM (see Liu 2001).
Experience has shown that hardly any FDI has been channelled into the CDM by Annex Bcountries. Instead Annex B countries like the Netherlands and multilateral CDM funds suchas the PCF of the World Bank have been seeking to purchase generated CERs by concludingforward agreements with project developers in CDM host countries (local project developers).There are even reasons why Southern project developers may not wish to go the bilateralroute from the very beginning or altogether: an example is that an investor from an Annex Bcountry may be motivated by technology export incentives (as with Japanese CDM investors),whereas the host country developer may have home-grown technology. Moreover it isbelieved that bilateral project negotiations may lead to CER prices that are much too low,compared with the prices that might be achieved through selling of CERs by the host countryproject developers after issuance.
11 Certifed Tradable Offsets are units of GHG emissions reduced or sequestered by an AIJ project, verified andcertified by the government of Costa Rica in 1996. Eventually the use of such credits will be permitted for thefirst commitment period of the KP under the UNFCCC.12 “Korea strongly believes it is necessary to allow developing countries to initiate their own host-generatedunilateral CDM projects” (Kim 2000)

15
So there has been a controversial debate on unilateral CDM going on for a long time. Furtherit has become evident, that - regardless of whether unilateral CDM is considered on par withthe other designs - it has already taken an important position within the CDM.
4.3 Triggers for unilateral CDM projects
As there are links between the three basic CDM approaches, i.e. bi-, multi- and unilateralCDM, it is difficult to define thresholds at which we can call a project unilateral. In effectthere is a smooth transition from a locally developed CDM project – which may end up as aunilateral CDM project – to a bilateral or multilateral CDM project. It can be observed thatmost (so called) bilateral or multilateral projects are maturing out of earlier locally developedproject initiatives.
So far the unilateral design has been defined by analysts by the condition that the actors in thehost country develop, implement and finance a project on their own (see Baumert et al. 2000,p. 6). This definition is not sufficient to describe the characteristics of unilateral CDM andother aspects have to be considered such as the source of investment and the design ofpurchase agreements. The following section suggests criteria for unilateral projects.
4.3.1 Origin of Investment
Investment here is defined as equity capital for the project which might either be entirelyprovided by Annex B investors (FDI) or by host country investors (domestic investment).There is also the possibility that both host country companies and foreign companies invest inthe same project, acting together in a joint venture. The starting criteria for a unilateral projectwould be that all equity is coming from host country entities.
4.3.2 Purchase agreements
Local project developers have to decide whether they want to bank future CERs or to sellthem to Annex B entities.
• BankingThe banking may be most relevant for newly industrialised countries that expectcommitments in the near future. Another reason for banking CERs could be that the projectdevelopers have not found a buyer yet or assume a higher future market price for CERs. TheCERs not sold immediately to an Annex B country need to be registered. Public and privateentities from a DC can open an account in the CDM registry of the Executive Board. Withoutany doubt the banking option corresponds well to the idea of a unilateral project as it does notinvolve any foreign entities.

16
• Direct Purchase AgreementInstead of banking the project developers might want to sell CERs directly ex post afterissuance at the end of the project cycle on an open market. By doing this they wouldsignificantly improve project revenues. Such a contract is called Direct Purchase Agreement(DPA). Before the sale, it is not clear which Annex B country is to get the credits. Thus thissituation is clearly unilateral even if it finally leads to a bilateral transaction. It is unilateral,because all the necessary project cycle activities are under the host country developer’sresponsibility or initiated through him.
• Emission Reduction Purchase AgreementSo far no CDM projects have been registered and no CERs have been issued yet. Thereforeall existing purchase agreements between host country project developers and buyers from anAnnex B country involve a forward transaction. Such contracts are called Emission ReductionPurchase Agreements (ERPAs). With the conclusion of an ERPA the buyer commits topurchasing a certain amount of possibly future generated CERs at a specific price on CERs.Whether a project designed under such a structure can still pass for a unilateral project isdebatable. By all means it can not be seen as a “pure” unilateral project because the ERPAassigns the price risk and the Kyoto risk to the Annex B buyer (see PCF 2002b, p.3).Furthermore an ERPA may have a strong influence on the financial closure of a project in thecase it provides up-front payment that is used by the local project developers for financing theproject’s assets. In addition ERPAs are usually signed according to the interests of Annex Bbuyers, which means they set low carbon prices, eventually involve huge penalties in the caseof non-delivery of CERs and stipulate that the transaction costs, faced by the buyer (e.g. costsfor risk assessment studies or costs for supervision of the project activity), can be deductedfrom the payments to the seller. From this perspective projects involving an ERPA could beregarded as non-unilateral.
However, it was mentioned that an ERPA can be concluded at any point of time beforeissuance of CERs. As the project cycle proceeds, the influence that can be exerted and therisks that can be assumed by an Annex B buyer are reduced. Thus projects that involve a“late” ERPA better relate to the unilateral idea. In this respect registration can be seen as acritical threshold. If an ERPA is negotiated prior to registration, the buyer will make highdemands on the baseline- and monitoring plan and eventually participate in their preparation.Doing so the buyer wants to reduce the risk that the project will not be registered. Under sucha structure a project could be considered as bilateral or multilateral. If an ERPA is negotiatedafter registration, the project has already been developed independently by the local projectdevelopers. The buyer can be assured that the project activity will be implemented and doesnot need to conduct an as comprehensive risk assessment study as in the former case. Here theproject could still be regarded as unilateral.

17
4.3.3 DNA approval
Any project only approved by a host country DNA can be seen as unilateral. The question iswhether buyer countries’ DNAs have to approve projects from which they buy CERs. This iscurrently unclear. The Dutch government, for example, acting as a forward buyer of CERs,has signed Declarations of Approval for the projects, for which an ERPA has been prepared(see Ministry of Housing, Spatial Planning and the Environment of the Netherlands 2003).Contrary, projects of the PCF are without exception only approved by host country DNAs upto the present. The PCF has sought guidance from the UNFCCC secretariat asking forclarification on this issue (see PCF 2003b). We list possible options on how the DNAapproval could be managed for multilateral funds in Box 1.
4.4 Unilateral projects under the current circumstances
According to the above mentioned criteria a “pure” unilateral CDM project does not involveany FDI, only has the approval of the host country DNA, and does not involve Annex Bbuyers prior to certification.
Among the CDM projects that have already reached an advanced stage of preparation(available PDD and baseline study) such pure unilateral projects are hardly represented (seeCDM watch 2003). Though most of the projects show unilateral character to some extent. Inmany cases the project has been prepared by local project developers involving domesticinvestment and home grown technology like it is the case with Indian CDM projects (see
Box 1: DNA approval options for multilateral funds
1. Only host country approves
This option reflects the present situation.
2. Only one buyer DNA approves
In this option the host DNA and one representative Annex B DNA would approve the
projects. This option seems to be reasonable, because it respects approval criteria of a
buyer country but at the same time keeps bureaucracy within a limit.
3. DNAs of all buyer countries have to approve
In this case the host DNA and all buyer DNAs would have to approve the projects,
which would without a doubt raise transaction costs, delay the whole approval
procedure and increase bureaucracy.

18
Krey 2003, p. 70). This heavily promotes the idea of a unilateral project. However, in order toreduce the associated risks, the project developers have concluded ERPAs with Annex Bbuyers at a very early stage of the project cycle (before registration), which adds a bi- ormultilateral component to the originally locally designed project.
Most of such purchase agreements have been signed under the Dutch CERUPT programmeand the World Bank’s PCF. Compared with Senter (i.e. the company that establishedCERUPT on behalf of the Dutch government), the World Bank is more active in preparingprojects because PCF members reserve the right to procure consultancy, to commission thebaseline study and monitoring plan and to supervise the participants in project preparation.(see PCF 2003a, p. 4). In contrast, Senter remains passive in preparing projects, conceding ahigher grade of autonomy to the project developers (see Liese 2001, p. 16-19). In case of non-delivery of CERs Senter imposes a penalty against the contracted entities, which putsadditional pressure on them (see Deodhar et al., p. 15), whereas no penalisation mechanism isimplemented into PCF contracts. From this it can be seen that Annex B buyers differentlyinfluence and promote locally designed CDM projects. Table 2 below briefly compares thePCF with CERUPT in this respect.
Table 2: Influence of Annex B buyers on locally developed projects – PCF and CERUPT
Criteria PCF CERUPTDirect investment/technology transfer no noAgreement design ERPA ERPAProject Supervision yes yesSupport in baseline and monitoring plan preparation yes noContractual fines no yesBuyer Country Approval no yes
In the future more “pure” unilateral projects may emerge if the risks related to the carbonmarket such as the Kyoto- and price risk decrease or entirely disappear as the market matures.Then local project developers might be more willing to assume all the associated risks ontheir own and to carry out a project without involving any Annex B entity before the projecthas generated the first CERs.

19
5 Advantages of unilateral CDM
5.1 Lower risk perception by the host
CDM projects are considered to be risky as they do not only bear general project risks butalso risks linked with the carbon market. This is one of the reasons why foreign investorshave been reluctant to invest in CDM projects so far. Contrary, entities from a DC have beenmore willing to invest in CDM projects as risks are perceived lower. Compared with localinvestors, foreign investors face the additional risk that the host country could breach existingcontracts (e.g. for political reasons) and not honour the commitment to transfer CERs (seePCF 2002b, p. 2). Moreover local investors can better assess the economic and politicalsituation of their country and thus better foresee possible threats like strikes, riots and civilunrest.
Therefore foreign investors prefer investing in countries with low country risk. They will onlyinvest in projects in high risk countries if they realise a higher internal rate of return (IRR)compared to low risk investment options. For example, an investor building a power stationmay be content with an IRR of 5% in Switzerland while he will ask for 30% in India. ManyCDM projects in high-risk countries probably will not be able to deliver a return that is highenough to compensate the high country risk. So the barriers to mobilise foreign capital forprojects in countries with a high perceived country risk are huge. Our above-mentioned powerstation investor asks for 30% IRR in India because depending on a favourable andunfavourable risk assessment he expects the IRR in a corridor of 15 to 30%, so that the risk iscompensated. Being conservative, he chooses 30% as a threshold. However, a local powerplant investor has a much lower IRR “risk spread” of 18 to 22% and thus applies 22% as histhreshold, which results in a risk premium of the foreign investor of 8%13 (30% - 22%). Thisis why local companies and banks are more likely to invest equity or to provide loans. In thecase of public investors, positive externalities accruing to the host country might help todismantle barriers to mobilise local capital as well.
We now assume that the power plant is able to deliver an IRR of 25%. While the foreigninvestor (with a threshold of 30%) would not be willing to participate in the project activityanymore, the host country investor on the other side (with a threshold of 22%) would nothesitate to provide his capital. The example shows that the aversion of foreign financiers toinvest in countries with a high perceived country risk would exclude a big number ofcountries from bi- and multilateral CDM projects. Unilateral CDM is a chance for thosecountries to participate in the CDM and to widen up the international distribution of projects.Bilateral CDM only flowing to a few participants countries would give rise to questionsconcerning equity and the purpose of CDM.
13 A lower risk perception by local project developers can also be demonstrated by a lower marginal abatementcost curve for the host country. See Appendix A for this approach.

20
5.2 Reduction of transaction costs
Transaction costs (TAC) of CDM projects can be defined as the costs that arise from searchand negotiation activities performed by the participants of a project activity (market TAC)and as the costs that arise from the tasks to be performed during the project cycle (CDMproject cycle TAC) (see Krey 2003, p.39).
Table 3: Transaction cost groups of CDM projects and their cost components
CDM Project Cycle Transaction CostsMarket Transaction CostsPre-implementation PhaseTransaction Costs
Implementation PhaseTransaction costs
Search costs PDD Costs Monitoring CostsNegotiation Costs Approval Costs Verification Costs
Validation Costs Certification CostsRegistration Costs Adaptation Fee
Administration CostsSource: Krey, 2003, p. 39
To facilitate the investigation on unilateral TAC we assume the model of a “pure” unilateralproject, where CERs are sold after issuance via a DPA.
5.2.1 Market transaction costs
According to Krey market TAC consist of search and negotiation costs. In the context ofunilateral projects search costs are defined as “the costs that accrue to the seller and the buyerof CERs as they seek out partners for a mutually beneficial exchange of CERs” (Krey 2003,p.40). They contain costs for the search activity and for the early project documentation.Search costs for unilateral projects are assumed to be low as:
• An Annex B entity, buying CERs via a DPA, may require less project documentationcompared to the case where it concludes a forward agreement (ERPA) or directlyinvests in the project. The reason is, that the buyer does not have to fear that theproject will not be registered, implemented or create the expected amount of CERs(see Krey 2003, p. 43). PCF and CERUPT projects, for example, face very high TACin this respect because they are charged with detailed documentation (project ideanote, project concept note (only PCF), letter of endorsement, letter of intent).Moreover the management of CERUPT and PCF has to find viable projects amongst agreat number of proposals which creates additional costs.
• With growing maturity and standardisation of the carbon market, the transfer ofunilaterally generated CERs toward Annex B countries may be simplified and not leadto major costs (see Krey 2003, p. 42).

21
Negotiation costs are the costs that arise when local project developers and the Annex Bbuyer negotiate the purchase agreement for the CERs, or, if an Annex B entity directly investsin a project, the costs that accrue when Annex B investor and local project developersnegotiate how they can realise the project together (see Krey 2003, p. 45).Unilateral projects’ negotiation costs are likely to be lower as:
• Concluding a DPA business partners only have to bargain price and quantity of CERs.• An ERPA would further need stipulations for the case the project fails• Negotiation costs for projects involving FDI would contain costs for the agreement on
project financing, development, construction, sharing of benefits and the detailedobligations of the parties (see Krey 2003, p. 46).
5.2.2 Project cycle TAC
These are costs that accrue from the project cycle activities listed in the table above. They arethe same for unilateral projects as well as for other models, because project cycle activities arelegally binding for all CDM projects. However project cycle TAC could be lower for theunilateral design if host country project developers have access to local OEs, which areresponsible for validation, verification and certification. So far only Annex B entities haveapplied for becoming a OE. For the future local OEs are likely to emerge in host countrieswith a high number of CDM project activities and the necessary human and organisationalcapacity.
5.3 More small-scale projects
With intent to generate a maximum amount of CERs foreign entities mostly prefer to invest inlarge-scale projects whereas unilateral CDM might encourage the development of smallerones. In many respects small-scale projects are better suited to contribute towards sustainabledevelopment in the host country than large ones. Integrated in a community such projectsobviously improve the living conditions and provide access to basic needs like energy supplywithout having negative externalities (see Tippman and Medina-Gómez 2003, p. 12). Moresmaller projects instead of a unique large one also enhance a well-balanced geographicaldistribution of projects inside a country. However, small scale projects face higher specifictransaction costs, as, compared with large scale projects, absolute transaction costs do notdiffer considerably but the amount of generated CERs is much lower14. The simplifiedprocedures and modalities for small-scale projects are not able to reduce the absolutetransaction costs enough to fully compensate for their disadvantage.
14 Imagine the design of a small hydro powerplant faced with TAC of $97,000 reducing 240kt of CO2 over thecrediting lifetime. The specific TAC would be $0.41/tCO2. Contrary the design of a biomass power plant facedwith TAC of $364,000 reducing 5000kt of CO2 would result in $0.07/tCO2, which is almost factor 6 below.These are actual Indian examples (see Krey 2003, p. 102).

22
Project developers of unilateral projects are faced with low transaction costs as explainedabove. Moreover they usually do not have the financing and investing capacity for capitalintensive large projects. Therefore unilateral CDM can better integrate small scale projects.
5.4 Keeping CDM rent in host countries
In unilateral projects CERs and other returns accrue to the host country project owner. Thusthe CER rent which is the difference between the market price and the costs for generatingCERs is kept by the host country. Outside financing always results in a transfer of at least partof the benefits towards the joint venture partner, like it is the case with bi- or multilateralprojects. However, the CER rent will be squeezed by strong competition among sellers. Thisis currently the case due to a demand shortage15. Of course this situation may change in thefuture.
15 The demand shortage for CERs mainly results of the cheap supply of Russian hot air, the exit of the UnitedStates from the KP and the stringent rules imposed on the CDM by the MA.

23
6 Disadvantages of unilateral CDM
6.1 Higher Kyoto risk
Like the other flexible Kyoto mechanisms CDM bears the risk of the KP not coming intoforce. The Russian hesitation shows that this risk is non-negligible. If Kyoto fails, somedomestic climate policy instruments such as the EU emissions trading system will still beimplemented. It is likely that CERs generated by investors from the countries implementingthese instruments can be used while CER import from unilateral projects might not find muchsupport. The voluntary Chicago Climate Exchange trading scheme in the United States, forexample, only accepts certain projects from DCs.
6.2 Downward CER price risk for local project developers
Downward price risk can be a significant problem for unilateral developers. While foreigninvestors facing a domestic GHG constraint will always profit from any deal that is lowerthan their marginal abatement cost at home, the unilateral seller will face the full brunt of theprice decrease. Assume that marginal abatement costs in Germany are 50 €/t CO2 for a largeemitter. This emitter invests in a CDM project at costs of 7 €/t. Even if the price now falls to 3€/t, the investor still has a cost savings of 43 €/t compared to opportunity costs of 4 €/t if hehad invested at the lower price. Contrary for local project developers who want to sell CERsafter certification, an unexpected decrease in the CER price may end up in a disaster,especially if the project is not financially viable anymore without the expected CER returnand loans can not be repaid. For this reason local project developers are used to concludeERPAs that set up a fixed price and thus reduce the downward price risk but at the same timeprevent that local project developers might benefit from upward price movements. Thereforesome more elaborate ERPAs constitute the purchase of a basic amount of CERs at a low priceand further include an option to buy additional CERs at a higher price. This limits downwardprice risk and allows project developers to participate in upward price movements.
6.3 Capacity building costs to be borne by host country
Currently, we see several countries (Canada, Denmark, Japan, Netherlands) providingcapacity building16 to countries from which they want to buy CERs (see Ministry of ForeignAffairs 2002, Deutsche Gesellschaft für Technische Zusammenarbeit (GTZ) 2003, Bhandari2003). In a unilateral design the host country would take more responsibility in providing thenecessary capacity building and thus be faced with higher costs. This is particularly true forthe smaller, less developed countries not seen as attractive CDM suppliers, which results in alack of capacity building activity by foreign donors. Even those donor programmes that donot explicitly aim at buying CERs concentrate on the potentially large CDM suppliers like
16 Capacity building refers to activities that aim at increasing skilled personnel and technical and institutionalcapacity.

24
India and China (for China see Anon. 2003, for India Bhandari 2003). Only some multilateraldonors like the United Nations Development Programme (UNDP) look at smaller hostcountries.
6.4 Less technology transfer
As there is no FDI provided by developed countries one justifiable criticism of unilateralCDM consists in the assertion of non-existing technology transfer from North to South (Liu2001). It could be argued that local project developers still have the possibility to buy foreigntechnology on a global market, but usually most of them cannot provide sufficient capital topurchase foreign technology and do not have the expertise in choosing, adapting andmaintaining it. Therefore local project developers are likely to deploy home-growntechnology in unilateral projects. Sometimes the use of home-grown technology even ispreferred to foreign technology as the host country participants do not want to depend onforeign investors concerning consultance, maintenance of the project, spare parts ect.. In mostcases however local project developers are searching for foreign investors. For the unilateraldesign technology transfer could consist in technical assistance and capacity buildingactivities granted by foreign donors.
6.5 Delay of financial inflows
In the unilateral model the host country project developer has to bear the costs for projectpreparation and design, transaction costs and costs for marketing the CERs on his own. Allthese costs arise before the project owner receives any revenues. That means he may need tohave access to financial markets to get sufficient additional capital for his CDM projectactivity. Being the only one in charge of the project, he runs the full financial risk. In case theproject fails or does not generate the expected amount of CERs, the local project owner willbe into serious financial difficulties.
6.6 Risk of more non-additional projects
Some observers felt that unilateral projects would lead to more non-additional projects as hostcountry investors might try to carry out business as usual projects under the CDM in order toimprove the project revenues. It might be questionable, if local project developers are willingto set up a project, that is only economically viable with the expected CER revenues, whichcannot be guaranteed before Kyoto has not come into force (see Point Carbon 2003, p. 2). Thesame arguments however, apply for any investor, also a bilateral one. As the CDM ExecutiveBoard is applying a quite tough policy concerning additionality determination and asks forspecific additionality tests the risk of non-additional projects is considerably reduced.
25
7 Requirements for unilateral CDM
The design of unilateral projects offers the possibilities to reduce costs and to increase projectreturns. On the other side it requires sufficient capacity in the host country. The followingsection will discuss the requirements of DCs for unilateral CDM.
7.1 Mobilisation of domestic capital
In many DCs, like in several Asian countries, foreign sources, such as foreign bank loans orFDI, finance only a small share of gross capital formation. So it is obvious that a large part ofCDM projects will have to be financed by domestic sources. (see Janssen 2002, p. 46).
The mobilisation of domestic capital requires:• Joint action of financial institutions and establishment of financial standards• The capability to handle project risks• The development/use of financing tools, specific to the needs of project
participants and to the type of project• Financial capacity building for local developers and financing institutions
7.1.1 Joint action of financial institutions and establishment of financial standards
In several DCs, the awareness of the CDM among financial institutions is growing, but ageneral practice and a concerted action for financing projects does not exist. For the case ofIndia, financial institutions discuss to standardise the risk assessment procedures. Suchstandards would allow possible investors to rate and rank CDM projects and thus dismantlelocal investment barriers (see Deodhar et al. 2003, p. 22).
7.1.2 Project risk management capability
As outlined before CDM projects are subject to a variety of conventional and unconventionalproject risks, that have to be borne entirely by the host country participants in a pure unilateraldesign. In order to mobilise the necessary capital it is of great importance for local projectdevelopers to be able to handle the associated risks. A successful risk mitigation strategycould contain the following components:
• Portfolio risk diversificationInvesting in a portfolio of locally developed projects reduces overall investment risks. Ifpossible, the diversification should be “along the sectors and sources (energy, industrialprocesses, agriculture, sinks and waste)” and “the technology (energy-efficiencyimprovement, fuel switching, decarbonisation, CO2 storage and sequestration and switchingto renewable energy)” (Deodhar et al. 2003, p.14). A diversification along host countries atfirst glance would not be possible in a unilateral design. However, CDM project developers inDCs could also invest in unilateral projects in other DCs, a possibility that has been

26
mentioned in some debates in Korea. Finding a term for this type of projects is a challenge,maybe “bilateral developing country CDM project”.
• InsuranceThe insurance of a CDM project against different risk components is a suitable strategy ofrisk mitigation. According to Janssen (2001) the risk components that can be covered byinsurance are baseline emission risk and conventional technological and equipment failurerisks. However, insurance providers are not active in many of the less developed countries, sothat many developers of unilateral projects are likely to face a disadvantage compared to largemultinational investors with a big project portfolio.
• “Late” ERPAsSo far ERPAs have been concluded at a very early stage of project preparation mainlyrespecting buyers requirements. Through the early negotiations Annex B entities have beeninvolved in the design of locally developed projects to a great extent, so that projects undersuch a structure cannot be called unilateral anymore. For the future it seems possible, thatERPAs are signed at a later point of time, after the project has been registered. The conclusionof an ERPA after registration would still reduce the price risk and the Kyoto risk but alsoguarantee a greater independence for the host country participants and thus eventually allowfor contractual conditions that respect well the needs of the host country participants.
• Competent local project developersLocal project developers, that are not well informed about the CDM, run a higher risk ofbaseline methodology or PDD rejection by the validator or the Executive Board compared tobilateral investors with high-quality consultants. So far host country project developers havedone a good job as their submissions to the CDM Executive Board were not generally worsethan those of bilateral investors.
7.1.3 Financing instruments
In many DCs capital markets are underdeveloped and do not provide alternative financialinstruments (see Janssen 2002, p.20). In order to get local investors and lenders on the CDMtrack, financing tools, which suit best for financing locally developed CDM projects, have tobe established.
Examples for project specific financing options for unilateral CDM are:• Host country CDM fundsAccording to the model of carbon funds in the industrialised countries, private and publicsector entities in a host country could establish a national CDM fund, which provides softloans to local project developers or directly invests in the equity of a project (equity versusdebt fund). In return the fund members would receive a portion of the CERs (see Gonzales

27
2001, p.45). Providing loans or equity to several projects would ensure financial riskdiversification.
• CDM bondsAfter a due diligence and risk assessment of a portfolio of CDM projects in a host countryfinancial institutions might develop and float specific CDM project bonds and sell them onthe capital market (see Deodhar et al. 2003, p. 21). The bonds would be secured by theprojects’ assets. The funds that are mobilised through the sale of the bonds would be used tofinance the projects. The interest coupons of the bonds could consist of CERs. The purchaseof CDM bonds with such CER units would be an interesting investment option for all entitiesthat face an emission cap in their home country and are allowed to use CERs for compliance.
7.1.4 Financial capacity building for local developers and financing institutions
Unilateral project design requires the establishment of financial standards, an effective riskmanagement and the awareness of different financing options. Otherwise host countryinvestors and lenders will not recognise the CDM as a lucrative activity field and the scarceresources of DC economies will not be mobilised. In order to attain these goals, financialcapacity building activities should target domestic financial institutions and projectdevelopers and contain the following activities:• Improving the general understanding of the CDM process as a whole• Establishing risk rating practices on the national level• Building the expertise on risk mitigation options• Building the expertise on different financing options and CDM specific insurance
products
7.2 Minimum human, infrastructure and institutional capacities
Besides the availability of domestic capital, CDM projects developed and designed in the hostcountry require a minimum of human, infrastructure and institutional capacities whereasbilateral projects can be “parachuted” into a country to some extent. Most of the projects arein need of highly qualified manpower like engineers and financial experts and basicinfrastructure like transport ways or connection to a power grid. Furthermore host countryproject development needs an adequate institutional framework motivating nationalstakeholders to take action on their projects. This requires that existing structures dealing withclimate change policy are linked in a functioning network and that local project developersare willing to work together with these institutions including the host country government(see Capacity for Sustainable Development 2003, p. 2).
The most critical institutional requirement for the design of unilateral projects is theestablishment of a proactive DNA. “Proactive” means that the function of a DNA is not onlyrestricted to the approval of projects but includes additional tasks, such as providing technical
28
and financial expertise, organising capacity building activities for project participants andmarketing generated CERs. Good examples of proactive DNAs can be found in LatinAmerica (see Figueres and Olivas 2002, p. 33-51). However the promotional role of a DNAhas to be seen as separate. Its principal duty always consists in assessing whether a projectcontributes to national sustainable development.
7.3 Project experience
Countries that want to implement unilateral CDM can greatly benefit from experiences gainedin former project activities in the area of climate change. In countries with on-going bi- andmultilateral CDM projects, for example, local entities become familiar with the mechanismand the problems it involves. After they have learnt from foreign investors how to finance andto realise a project local developers might want to start their own activity. Contrary, incountries having little experience with climate change projects it will be much harder for localdevelopers to carry out a viable project activity. Therefore the providers of capacity buildingshould increasingly address countries, which have so far not been in the focus of foreignproject developers.
29
8 Measuring the potential of unilateral CDM
In the preceding sections unilateral CDM has been theoretically described, the chances andpitfalls as well as the requirements to carry out unilateral projects have been highlighted.However, it is an open question if there is sufficient potential among DCs to carry out CDMprojects on their own. In order to solve this question the following section will develop amethodology to estimate the potential of unilateral CDM in a DC, which will be applied tosome DCs.
8.1 Methodology
The methodology shall facilitate a comparison among host countries. At first empiricalindicators are selected in order to quantify a country’s potential of unilateral CDM. Secondlythe data are collected for several countries. As a next step, for most of the indicators thecollected data are converted to a continuous scale (1 to 10) in order to facilitate a comparisonamong countries. Finally the findings will be demonstrated by the use of some case studies. Itmust be emphasised, that this approach is a first attempt in order to measure the potential ofunilateral CDM. It is not free of subjective assumptions. Particularly the selection of suitableindicators and the scaling of the collected data has been difficult.
8.1.1 Selection of empirical indicators
By the use of empirical indicators a country’s unilateral CDM potential shall be quantified. Itis obvious that such indicators cannot be selected arbitrarily. Most importantly an indicatorhas to provide information about the potential of unilateral CDM. As already outlined beforethis potential depends on various variables like availability of domestic capital or humancapacity. Therefore our indicators cover all the different fields that are important forestimating the potential of unilateral CDM (diversification). For this approach indicators havebeen selected out of the following categories: Awareness of climate change, availability ofdomestic capital, human capacity, project experience, creditworthiness of host country.Moreover it has to be assured that data are available and that they are up-to-date. Finally onehas to think about the appropriate number of indicators. The more indicators are selected, themore aspects can be taken into account and the more differentiated the analysis will be.However complexity has to be kept within a limit. We have finally chosen 10 indicators.
Unfortunately the selection of empirical indicators involves some problems which cannoteasily be solved. The explanatory force of indicators is restricted as only measurable valuescan be recorded. Sometimes one indicator has to be used in combination with other indicatorsin order to derive a reliable statement. The application of indicators to countries of differentsize and with different geographical and cultural background could also lead to questionableresults. Therefore we have used relative and absolute indicators.

30
The following indicators have been chosen:
Table 4: Selection of empirical indicators
Category IndicatorKyoto Ratification (yes or no)Awareness of climate changeDNA operating (yes or no)Gross fixed capital formation (current US$)Gross fixed capital formation (% of GDP)
Availability of domestic capital
Domestic Credit to private Sector (% of GDP)Scientists and technicians in research anddevelopment (per million people)
Human capacity
Number of nominated UNFCCC expertsNumber of realised AIJ projectsProject experienceNumber of CDM projects baseline study andPDD
Creditworthiness of host country Institutional Investor Credit Rating
Both the Ratification of the KP and the establishment of a DNA are legal requirements forparticipating in the CDM. However, several countries have started to develop projects withouthaving a DNA. As many project developers see the CDM as a bottom-up approach theybelieve that once projects are being designed the government will put a DNA into operation.Kyoto ratification and DNA operation indicate whether the government of a DC is willing totake action against climate change respectively whether it has already implemented the CDMby establishing a DNA.With regard to economic requirements it seems most important that a DC is able to makeinvestments and to finance projects and on its own. Gross fixed capital formation (alsogross domestic fixed investment) indicates whether a host country is able to invest in capitalintensive projects. It includes plant, machinery, and equipment purchases, land improvements(fences, ditches, drains, and so on), the construction of transport infrastructure, theconstruction of private, commercial, industrial and public buildings (see World DevelopmentIndicators (WDI) 2003). Here it is important to look at both the absolute value (current US$)and the specific value (% of GDP). If a country, for example, has huge absolute investmentsbecause of its huge population but the investments represent only a very small share of GDP itis likely that those investments are just influent for basic infrastructure needs and hardly forCDM projects. On the other hand if investments represent a great share of GDP but arerelatively small in absolute terms (below one billion $ annually in many DCs) it is clear thatat least large scale CDM projects (which can for example reach a capitalisation of several 100million $ in the energy sector) are not part of the national investment portfolio. Thus the twoindicators have to be used in combination with each other. A high investment potentialdemands both high absolute and specific values. It has to be added that gross capital

31
formation does not exclude FDI. As a unilateral project was defined by the exclusion of FDI itwould have been logical at first glance to deduct FDI from gross capital formation. However acountry with a lot of FDI would profit from bilateral technology transfer and as a next stepcould deploy the new technology in unilateral projects. Therefore FDI may be considered bymeasuring the potential of unilateral CDM.Most of the investments for unilateral CDM projects are undertaken by the private sector.Thus unilateral CDM can only be successful if the private sector has access to project financeon the domestic capital market. In DCs the funds are raised rather by borrowing (debt finance)than by share issue (equity finance). Therefore the domestic credit to private sector ratio(as percentage of GDP) indicates well whether the private sector in a DC is able to acquirethe necessary financing. Domestic credit to private sector refers to financial resourcesprovided to the private sector, such as through loans, purchases of non-equity securities, andtrade credits and other accounts receivable, that establish a claim for repayment (see WDI2003).In order to carry out CDM projects independently, an economy needs well trained manpower.The number of scientists and engineers in research and development per million peoplecan be used as a measure for the human resources of a country. More specifically, thenumber of nominated experts in the UNFCCC roster is a measure for the human capacityof a country on climate change issues. Experts are nominated for the domains of technologyand technology transfer, methodological issues and in-depth review of NationalCommunications (i.e. GHG inventories). These three rosters build the unified UNFCCC rosterof experts (see UNFCCC 2003c). The number of UNFCCC experts is given in absolute termsbecause it is very low, indeed zero for many countries.The project experience a country has already gained through GHG emission abatementprojects is measured by the number of realised AIJ projects and by the number of CDMprojects with available baseline study and PDD. AIJ activities have been carried out since1995 through partnerships between an investor from an Annex I country and a counterpart ina host country. and represent a pilot phase for CDM and JI. The purpose was to test thechallenges involved in implementing joint projects and to foster technology and know-howtransfers albeit without crediting emissions reductions (see Michaelowa et Koch 2001, p. 7).In our days the first real CDM projects are being developed which have to follow the rulesoutlined in the MA. It is obvious that countries which have already successfully implementedAIJ projects or which are preparing to host CDM activities are more likely to be able to carryout a CDM project all by themselves.Finally we look at the creditworthiness of a country which is measured by the InstitutionalInvestor Country Credit Rating, based on information provided by leading internationalbanks. The creditworthiness of countries is rated on a scale of 0 to 100 (highest risk to lowest)and ratings are updated every six months (see WDI 2003). This indicator does not reallymeasure the potential of a country to carry out projects unilaterally. It rather indicates whethera country is able to attract foreign investors. A high risk country with a low index value mightnot be able to get any FDI and therefore be restricted to the unilateral option, whereas a low

32
risk country with a high scale value might attract foreign companies that invest in CDMprojects. For the latter countries unilateral CDM could play a minor role.
8.1.2 Collection of data
Data have been collected for DCs from four regions: Asia and Pacific, Latin America andCaribbean, Sub-Saharan Africa, North Africa and Middle East. In order to limit the number ofcountries for this analysis, only those countries have been selected that overcome a thresholdof one billion $ of gross fixed capital formation. Furthermore the city states Hong Kong andSingapore have not been included as they were thought not to be representative for Non-Annex I countries. Overall data for 61 DCs have been collected. The main source has been theWorld Bank’s World Development Indicators 2003, which represents a structuredcompilation of data from different sources, and the UNFCCC web site which provides actualinformation on climate change issues and the Kyoto mechanisms.Appendix B shows the data for the respective countries and indicators as well as the datasource and the date of data collection for each indicator.
8.1.3 Scaling of data
For each indicator, except for Kyoto ratification and DNA operation, the data have beenconverted using a continuous scale from 1 to 10. This operation makes it possible to make upconcise indicator profiles17 which facilitates the comparison among countries a lot.As the scaling of the data is based on threshold values chosen by the authors it is veryimportant that it is comprehensible and transparent. It works as follows:• The indicator scale is defined using a maximum and a minimum value, which indicate,
from the authors’ point of view, a high, respectively a low potential of unilateral CDM.Average indicator values for high, middle and low income countries, the highest andlowest values within the selected countries and the average value of all selected countriesare used to define the maxima and minima. In case the average values for high, middleand low income countries have not been available other orientation values have beenconsidered. However the determination of the maximum/minimum values does not rely ona specific calculation rule and has to be justified for each single indicator. As thedetermination of these threshold values represents an important and critical step in theanalysis it will be addressed in a separate section.
• The maximum value equals index value 10, the minimum value index value 1. Below theminimum value the index is 0.
• The scaling has to point out the differences in the values among countries in a an adequatemanner. Therefore it has to be decided for each indicator on whether the scale shall beproportional, logarithmic or based on another scaling scheme. For this analysis the scalingscheme for all indicators is directly proportional.
17 Such indicator profiles will be used for the case studies.

33
• The scaling of all relevant data, the determination of maximum/minimum values and theaverage indicator values are documented in Appendix B.
Usually indicators are of different importance and therefore have to be weighted differently(for example by the multiplication with a weighting factor). In this study the indicators havenot been weighted because it was believed to be too subjective to weight indicators of a verydifferent nature (different categories, absolute and specific indicators). This implies that thesingle scale index values should not be added up to an aggregate potential of unilateral CDM.Instead only comparisons between single indicators may be drawn. For example the scaleindex value for domestic credit to private sector is 3 for one country and 7 for anothercountry. Thus the latter country is by far better able to provide credits to its private sector.Moreover, the index for nominated UNFCCC experts amounts to 8 for the first country and to2 for the second, which means the first country has much more experts. In any case the valuesmay not be added up (9 respectively 11) because domestic credit and the number of expertsmight be of different importance with respect to the overall potential of unilateral CDM.
The scaling represents a transformation of the original data into index values which facilitatesto draw comparisons between countries with regard to single indicators. It cannot be used toform a basis of an objective evaluation in order assess the aggregate potential of unilateralCDM. Nevertheless it allows at least for some assessment of the aggregate potential ofunilateral CDM:• If a country has high scale values (approaching 10) for all indicators, it is likely to have a
high aggregate potential to carry out unilateral projects. A country with a low scale valuefor every single one indicator is likely not to be suited for the unilateral CDM design.
• As the indicators cover different categories which are all important for the design ofunilateral projects we feel it is important, that all indicators reach a preferably high indexvalue. It would be no use if for example a country attained high values for economicindicators while it completely lacked the awareness of climate change, project experienceand the needed human capital, expressed by low index values. On the other side a countrythat consistently attains medium index values for all indicators, shows that it has somebasic potential in all for unilateral CDM relevant fields and thus might better cope with itsmultifaceted requirements.
8.1.4 The determination of threshold values
We now discuss the choice of thresholds for each indicator. In the case of Gross fixed capitalformation (current US $) the maximum value was chosen at 50 billion $ which is situatedbetween the average values for middle and high income countries. The minimum value of 5billion $ is average for low income countries. Thus a proportional scale index with steps of 5billion $ can be used. This scaling represents a kind of compromise as some denselypopulated, large countries like China or India by far exceed the maximum value of 50 billion

34
$ while many small countries have investments of only about 1 billion $ or even less. Themajority of the countries that are subject to this study however ranges between 5 and 50billion $.Maximum and minimum values for the specific Gross fixed capital formation aspercentage of GDP conform to the highest and lowest value that could be found within theselected countries, which is 42 respectively 9% of GDP. Defining 10% as a minimum valueand 37% as a maximum value allows for a proportional scaling with steps of 3%.The values of the domestic credit for private sector vary between 2 and 149% of GDPwithin the selected countries. The average value of all selected countries is 38% which issituated between the average value for middle income and low income countries. It seemed tobe reasonable to apply a proportional scaling with a maximum value of 95 and a minimumvalue of 5% which implies steps of 10% of GDP for each index point.The number of scientists and engineers in research and development per million peoplevaries between 24 and 2799 within the selected countries. The average value for middleincome countries is 778. For this indicator we set the maximum at 1500 and the minimum at150 so that 750 is considered to be a medium value. One index point equals 150 persons.The total number of nominated UNFCCC experts lies between 0 and 58 within the selectedcountries. However only three countries have more than 20 nominated UNFCCC experts andthe average value of all selected countries is 5 so that the maximum value was set at 20, theminimum value at 2. The scaling is once again proportional and involves steps of 2 UNFCCCexperts.The number of AIJ as well as of actual CDM projects with existing baseline study andPDD is very low or even equals zero in the majority of countries. There are only 3 countrieswhere the number of AIJ projects exceeds 4. The same is true for CDM projects. Thereforefor both indicators 4 has been chosen as maximum value. One project equals 2 index points.The original Institutional investor country credit rating index ranges from 0 to 100. Thelower a country’s original index value, the worse its investment climate and the more it relieson unilateral CDM. Therefore for this indicator a scale index has been applied which isinverse compared with the original Institutional investor index. Scale index value 10,indicating a high dependency on unilateral CDM, refers to 16 Institutional Investor ratingpoints, which is in the range of the average value for low income countries (18). Scale indexvalue 1, indicating that a country has good chances to attract foreign investors for bi- andmultilateral CDM projects, refers to 70 Institutional investor rating points which is slightlybelow the highest rating within the selected countries (79.2). One index point equals 6Institutional investor rating points.
8.2 Data evaluation
Having explained the procedure in assessing a country’s potential of unilateral CDM we nowpresent the empirical results. At first a distinction is drawn between the four groups of DCsthat have been subject to this analysis belonging to the regions of Asia and Pacific, Latin

35
America and Caribbean, North Africa and Middle East, Sub-Saharan Africa.Subsequently of each of the four regions one country is taken out as a case study. For the casestudies index values for the indicator profiles are derived.
8.2.1 Regional differences in the potential of unilateral CDM
A look at the data demonstrates that the indicator values and thus the potential to carry outunilateral projects strongly differ among the selected DCs.As the countries have been categorised by four regions it is useful to examine whether thereare regional differences before analysing the potential of single countries.
Regarding the figures it is striking that the awareness of climate change within the fourgroups differs strongly. Almost all selected Latin American countries have ratified the KP andmost of them have already established a DNA. Also many of the selected Asian countrieshave ratified and put a DNA into operation. On the other side the Sub-Saharan countries showdeficits in this respect. Though several of them have ratified Kyoto there is only one amongthe selected countries that has an operating DNA, namely Mauritius. Accordingly in thisregion the CDM will not be successfully implemented before the countries have taken moreaction in taking the legal and institutional foundations. An interesting situation exists in theoil exporting states of North Africa and the Middle East. Most of these countries have notratified Kyoto. Nevertheless some countries that have not ratified (Yemen, Syria, Egypt,Lebanon) have already established a DNA. Once the first CDM projects being developed inthese countries are ready for registration by the Executive Board the governments will beunder high pressure to ratify the Protocol.Equally striking are the differences in project experience. Once again the Latin American andCaribbean countries are leading, which is not surprising considering that AIJ projects and thefirst CDM projects have only been developed in the countries that ratified Kyoto. Though thisregion is hosting 36 AIJ projects and 31 CDM projects the projects are concentrated in a fewcountries such as Brazil, Costa Rica, Mexico or Chile. There are some countries with noproject experience at all like Peru, Paraguay or Uruguay. Hosting 13 AIJ projects andcurrently 19 CDM projects Asia has already gained substantial experience with projects.Similar to the Latin American case the projects are not equally distributed among thecountries. At present China, India and Indonesia host most of the projects. The regions ofNorth Africa and Middle East, actually hosting 2 AIJ and 1 CDM projects within the selectedcountries and Sub-Saharan Africa, hosting 6 AIJ and 4 CDM projects hardly have anyexperience with projects. Some countries of the former region at least could be expected todevelop more CDM projects in the future as the DNAs have been established. Among theSub-Saharan countries it is South Africa, Mauritius and Uganda that are hosting projects,among the North African and Middle East countries it is Egypt, Morocco and Jordan.With respect to the availability of domestic capital the regional differences are not as great aswith the awareness of climate change and with project experience. In each region countries

36
with high absolute and specific investments and good access to domestic project finance aswell as countries with bad investing and financing options can be found. However, the highestabsolute gross fixed investments are found in Asian countries (China, South Korea, and India)as these countries are highly populated. Considering that in some of these countries like Chinaor South Korea the gross fixed investments also reach a high specific value (38% of GDP inChina, 27% in South Korea) and that even the credit to private sector ratio exceeds 100% ofGDP (127% for China, 108%) it becomes evident, that the Asian newly industrialisedcountries have the best potential to finance and invest in local CDM projects. Also severalstates of Northern Africa and the Middle East can finance and invest in own CDM projects.The Republic of Iran has the best absolute and specific values for gross fixed investment(around 35 billion $ equalling 30% of GDP) within this group. The best value for domesticcredit for private sector is found in Lebanon (91%). The situation in Latin America stronglydiffers from country to country. There are some large states with high absolute gross fixedinvestment like Brazil and Mexico (both around 100 billion $) that have ordinary specificinvestment values (around 20% of GDP) which might well be able to invest in projects. Thesame is true for a few small states with low absolute investment but high specific values likeJamaica and Panama (30 respectively 26 % of GDP). Jamaica is also the country with thehighest domestic credit to private sector ratio within this group (126% of GDP). Comparedwith Asia and North Africa and Middle East the average values for specific gross investmentand domestic credit are lower. The group of Sub-Saharan countries again ranks on the lastplace among the four groups in this category. Particularly the absolute investments and thecredit to private sector ratio are very low almost among all selected countries. The exceptionsare South Africa and Mauritius. South Africa has the highest absolute investments (17 billion$) and the highest ratio of domestic credit to private sector (149% of GDP!) within this group.In Mauritius, a very small country, absolute investments still exceed 1 billion $ equalling 23%of GDP, which is above-average and the domestic credit is 63% of GDP, the second bestvalue after South Africa.The highest human capacity regarding scientists and engineers in research and developmentand nominated UNFCCC experts can be found in Asia. Apart form South Korea the formerSoviet countries Azerbaijan and Uzbekistan host the most engineers and scientists per millionpeople. This is due to the well developed educational system of the former Soviet Union. It isquestionable whether theses countries can maintain such a high standard in the future.Regarding the absolute number of nominated UNFCCC experts China has taken the lead with58 experts followed by Thailand with 15 and Indonesia with 13. In specific terms however thepicture would change in favour of the less populated countries.Some of the North African and Middle East countries also show considerable human capacity.While Jordan impresses with almost 2000 scientists and engineers per million people the Iranand Lebanon have nominated a high number of UNFCCC experts (23 respectively 10). Inthose Latin American countries, for which data have been available, the number of scientistsand engineers is generally situated in the range of 100 to 500 per million people. There aresome countries with a considerable number of UNFCCC experts like Brazil, Chile and

37
Uruguay (35, 14 and 13). Other countries within this group, though having ratified Kyoto,have not nominated any UNFCCC expert yet. For the Sub-Saharan countries the availabilityof data concerning scientists and engineers in research and development has been insufficient.Data were only available for South Africa, Mauritius and Uganda (992, 360 and 24 permillion people). Compared with the other groups the number of nominated UNFCCC expertsamong these countries is very low. The highest value is found in Ethiopia with 8 experts.Finally looking at the perceived country risk of the selected countries within the four regionsindicated by the Institutional investor credit rating it becomes evident that the risk perceptionstrongly varies from country to country due to different political, economic and financialsituation. While several states in Asia, North Africa and the Middle East and Latin Americareach acceptable values exceeding 50 Institutional investor points, almost all Sub-Saharancountries are represented with very low values below 30 points except for Botswana, SouthAfrica and Mauritius (62.2; 54.6; 53.9).This means that the Sub-Saharan countries are at a double disadvantage by taking part in theCDM. Firstly most of these countries will not be able to attract foreign investors for CDMprojects in a bi- or multilateral design because of the high perceived country risk. Secondlythey might not be able to carry out unilateral projects because they have (according to thisstudy) insufficient potential in nearly all relevant fields.To summarise the regional differences among the four groups of countries we find thatseveral countries in Asia and Latin America are most likely to be able to carry out unilateralCDM projects. Asian countries particularly take the lead in human capacity and investment innew capital. Latin American countries have been the first to ratify Kyoto and to put up DNAs.So far they have gained considerable project experience. Although several countries in NorthAfrica and the Middle East have enough domestic and skilled manpower, most of them seemnot to be very ambitious to implement the CDM.In case of the oil exporting countries this reluctance is certainly related to the concern not tofoster the substitution of fossil fuels through the implementation of the CDM. However it isnot likely that the CDM is really going to affect the demand for crude oil. Thus the oilexporting countries could embark on a double tracked strategy: Promoting oil products on theone hand and implementing measures to reduce GHG emissions under the CDM on the otherhand. One example for the combination of oil production and CDM could consist in capturingand using associated gases that arise from oil production instead of flaring them. Most of theSub-Saharan countries score low in all indicator categories. If CDM shall take off in thesecountries enormous efforts have to be made by local stakeholders and foreign donors. Asforeign investors might shun many Sub-Saharan countries due to the high perceived risks,unilateral CDM might remain as the only option.

38
8.2.2 Case studies
Having discussed the regional differences we now choose one country out of each region andassess the potential of unilateral CDM for these countries on the basis of the collectedindicator values. The use of indicator profiles will facilitate the comparing between countries.
• ChinaChina is today the most populous country on earth and one of the largest economies. Itsmassive economic progress is attributable to the consistent economic restructuring andreforming process over the last two decades.China’s energy use relies heavily on coal. Thus the CDM options for China primarily consistin the substitution of coal by other less carbon intensive fuels, in increasing energy efficiencyand in introducing renewable energies. China is believed to host a great share of future CDMprojects (see Jotzo and Michaelowa 2002, p. 187), but so far China has not put a DNA intooperation which is a requirement for the registration for a CDM project by the ExecutiveBoard.China’s indicator profile looks as follows:
Figure 9: Indicator profile – China
As it can be seen from the figures, China reaches high levels for many of the indicators. It isparticularly characterised by high absolute and specific gross investment (444 billion $
0 1 2 3 4 5 6 7 8 9 10
Scale
Gross f ixed capital formation (absolute)
Gross f ixed capital formation (specif ic)
Domestic credit to private sector
Scientists and engineers in R&D
Number of nominated UNFCCC experts
AIJ Experience
CDM experience
Institutional investor credit rating
China
39
equalling 38% of GDP) and a high credit to private sector ratio (127% of GDP). China hasalso nominated the most UNFCCC experts among all DCs (58). However, the number ofscientists and engineers in research and development per million people (545) is notoutstanding but still higher than in many other DCs. China has already gained some projectexperience (4 AIJ projects and 2 CDM projects, for which a PDD has been made public).Other countries like Brazil and India have been more active in designing CDM projects.Therefore it is very likely that at least for the short run China is not going to be the marketleader for the CDM as it was believed by many observers for a long time. As China is able toattract many foreign investors (institutional investor credit rating of 59.9) unilateral CDMrepresents only one possible option to implement the CDM in this country. Bi- andmultilateral projects might play a bigger role. We conclude that China has a high potential tocarry out CDM projects autonomously because it shows substantial potential in all relevantcategories and even excellent potential in four categories.
• BrazilBrazil is South-America’s largest country. The economic development in the past washampered by high inflation and foreign debt. Economic reforms during the 1990s like theopening of its markets and privatisation were able to stabilise the country’s finances.The main potential for CDM projects in Brazil can be found in the forestry sector. Especiallyplantations seem to be a suitable measure for carbon sequestration. There is a huge supply ofunused or only extensively used land. In the energy sector CDM options are scarce as hydropower is the main source of energy (see Jotzo and Michaelowa 2002, p. 187). Thus e.g. fuelsubstitution projects like in China where coal power plants can be substituted by natural gas-fired ones are not possible on a large scale in Brazil. At least there is some CDM potential inthe energy sector consisting in the application of co-generation and renewable energies (seeAustin and Faeth 2000, p. 7). Like many of the Latin American countries Brazil has ratifiedKyoto and established a DNA.
Concerning the potential of unilateral CDM it can be seen from the indicator profile thatbeing a large country Brazil has high absolute but only average specific gross investment (98billion $, 19% of GDP). The lower specific gross investment can be ascribed to the high debtservice Brazil has to bear (11% of Gross National Income in 2001) (see WDI 2003). Howeverit can be assumed that Brazil has sufficient potential to invest in CDM projects taking intoaccount that forestry projects do eventually not require as much capital as investments in theenergy sector. The domestic credit to private sector ratio (35% of GDP) is slightly better thanthe average value for low income countries (24% of GDP). With 323 scientists and engineersper million people and 6 nominated UNFCCC experts there is some human capacity to designown projects. Brazil’s big advantage over other countries is project experience. Though Brazildid not host any projects during the AIJ phase, there are now already 10 CDM projects thathave reached an advanced stage of preparation. This is rank two after India with 11 advancedCDM projects. The Institutional investor credit rating of 37.1 points indicates that Brazil is

40
perceived as a quite “risky” country among foreign investors. Thus unilateral CDM couldplay a bigger role than it is supposed to play in the first case study China. It could be statedthat Brazil has sufficient potential of unilateral CDM, as it achieves medium scores in allrelevant categories. The establishment of a DNA and the initiated project activities show thatthere is high awareness and fast growing experience with the CDM, which is very importantfor unilateral project design.
Figure 10: Indicator profile - Brazil
• South AfricaThe middle income country South Africa disposes of well developed financial, legal,communications, energy, and transport sectors. However the economy faces a highunemployment rate, high crime and AIDS infection rates and problems that remain from theapartheid area.There is a wide range of options for CDM projects in South Africa in the energy sector,transport, coal mining, industry and agriculture. The first projects are being developed in theenergy sector for example in the recovery and use of landfill gas, energy efficiency measures,the use of clean coal technologies and of renewable energies (see World Bank 2002, p. 196ff).Having ratified Kyoto South Africa still needs to set up its DNA.The absolute gross fixed capital formation in South Africa was about 18 billion $ in 2001equalling 15% of GDP. This is a very high value compared with all other selected Sub-
0 1 2 3 4 5 6 7 8 9 10
Scale
Gross f ixed capital formation (absolute)
Gross f ixed capital formation (specif ic)
Domestic credit to private sector
Scientists and engineers in R&D
Number of nominated UNFCCC experts
AIJ Experience
CDM experience
Institutional investor credit rating
Brazil

41
Saharan countries. The average value for this group was only about 3 billion $. Due to thevery well developed financial sector in South Africa, private entities are able to get bank loansfrom the domestic financial institutions. With 149% of GDP the domestic credit to privatesector ratio even exceeds the average value for high income countries (137%). Thus thereshould be substantial potential to finance and invest in CDM projects within the privatesector.This thesis is proved by looking at the actual development. Though there are only 2 CDMprojects listed with available PDD, which is the best value for Sub-Saharan Africa, there areseveral other CDM projects being developed at the moment, and most importantly all of theseprojects are developed locally, which means that no foreign investor has been involved inthese projects so far. Taking also the 2 AIJ projects into account that have been carried outSouth Africa has gained sufficient project experience to carry out CDM projectsautonomously. 992 scientists and engineers per million people and 5 nominated UNFCCCexperts indicate a considerable human capacity for unilateral CDM. Because of the highInstitutional investor credit rating (54.6 points) it is likely that South Africa will not have torely on the unilateral design but might also attract foreign investment through the CDM in thefuture. South Africa has potential in all categories relevant for unilateral CDM. UnilateralCDM in this country particularly benefits from good financing options for private companiesand a high share of scientists and engineers.
Figure 11: Indicator profile – South Africa
0 1 2 3 4 5 6 7 8 9 10
Scale
Gross f ixed capital formation (absolute)
Gross f ixed capital formation (specif ic)
Domestic credit to private sector
Scientists and engineers in R&D
Number of nominated UNFCCC experts
AIJ Experience
CDM experience
Institutional investor credit rating
South Africa

42
• IranIran’s economy is mainly driven by oil exports to other countries and little progress has beenmade to diversify the economy. Though being a rich country with huge foreign exchangereserves Iran faces structural problems like high unemployment and inflation.With regard to climate policy Iran shows two faces. On the one hand the political awarenessof climate change and of the CDM seems to be low like in almost all oil exporting countriesas Iran has neither ratified Kyoto nor established a DNA. On the other side there are manyIran scientists dealing with climate change and lately some of them have - which isexceptional among the Middle East countries - conducted an assessment study of Iran’s CDMpotential (see Soltanieh 2003). According to this study there is a high potential to reduceGHG emissions in the energy sector (solar and wind energy, geothermal plants, hydro power,energy efficiency measures), the industrial sector (recovery and use of associated gases fromoil production, fuel switch) and forestry sector (stopping desertification through reforestationand afforestation activities).Though there are many possibilities for CDM activities it is questionable if Iran (after havingratified the Protocol and established a DNA) would be able to carry out projects withoutforeign support. Without any doubt Iran has the potential to invest in CDM projects which isindicated by high absolute and specific values for gross fixed capital formation (35 billion $equalling 30% of GDP). However the private sector is underrepresented in the economy andthe few big companies are linked to the oil business. Thus the highest potential to invest incapital intensive assets lies with those who might want to maintain and strengthen the oil-based economy and who might have little incentive to promote the CDM, namely governmentand oil companies. The domestic credit to private sector ratio of 33% of GDP is in the rangeof the average value of all selected countries (38%). Further more the question arises whethera country relying on oil like Iran has been active in the research of new technologies likerenewable energy technology which is needed for certain CDM projects. The high level ofmonetary reserves would allow to purchase foreign technology and expertise from othercountries, too. In any case Iran has considerable human capacity. Beside 590 scientists andengineers per million people there are 23 nominated UNFCCC experts, which is rank threeafter China and Brazil. Iran’s big deficit consists in the lack of project experience. There havebeen neither AIJ projects taken place in this country nor are any CDM projects actuallyprepared. Thus the strategy for Iran should be (after ratification and DNA establishment) firstto host some bi- or multilateral projects, which could be difficult, but not impossible, takinginto account a country credit rating of 36.6 points, to gain project experience and gettechnology transfer (especially important for CDM projects with high technology demands).Consequently private and public entities might invest in own unilateral projects. There is highhuman capacity and potential for investments. The state dominated structure of the economyhowever might hamper investments in CDM projects.
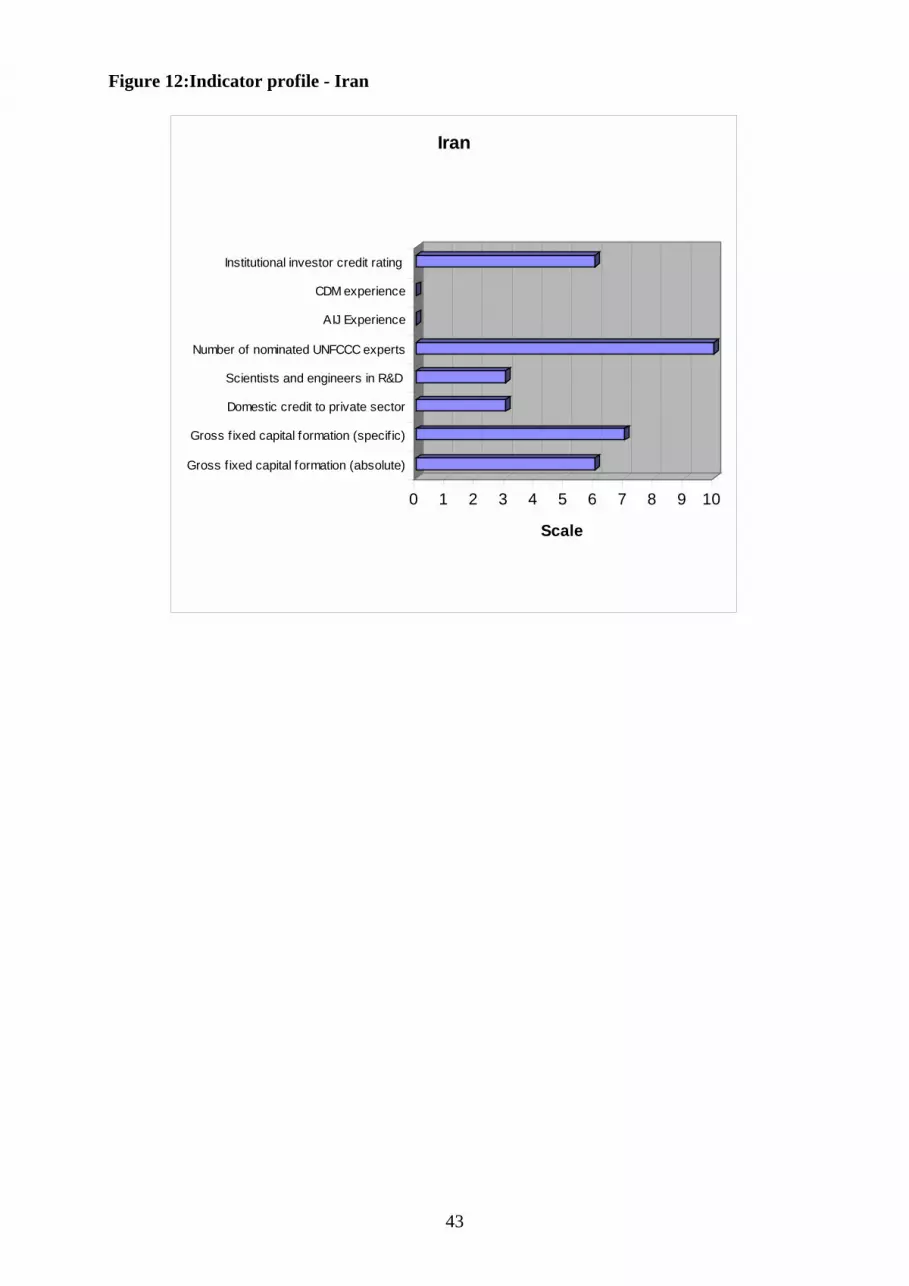
43
Figure 12:Indicator profile - Iran
0 1 2 3 4 5 6 7 8 9 10
Scale
Gross f ixed capital formation (absolute)
Gross f ixed capital formation (specif ic)
Domestic credit to private sector
Scientists and engineers in R&D
Number of nominated UNFCCC experts
AIJ Experience
CDM experience
Institutional investor credit rating
Iran
44
9 Conclusion and recommendations
Many of the currently proposed CDM projects are designed locally, because foreign investorsare reluctant to invest in projects with perceived high risks and transaction costs. Thoughlocally developed CDM projects do usually not involve FDI and do not promote technologytransfer, they are not necessarily at a disadvantage compared with the other designs. Theymay imply a reduction in transaction costs and be better integrated into a national sustainabledevelopment strategy. Even if projects are locally developed, Annex B investors or buyersmight still become involved until CERs accrue. Therefore donors should help Non-Annex Icountries to develop projects locally and at the same time help to cross the threshold thatmakes their projects attractive for Annex B investors or buyers. This requires a capacitybuilding strategy according to the needs of the development of local CDM projects on the onehand, and a strategy to dismantle investment barriers for Annex B investors on the other hand.
Regarding locally developed CDM projects it is most important• to develop proactive DNAs and to evaluate and link existing institutional structures• to foster the understanding of financing mechanisms among the host country participants
in order to mobilise domestic capital• to identify suitable host country project options• to motivate public and private entities to engage in locally developed projects• to offer capacity building activities increasingly to countries that are so far excluded from
bi- and multilateral CDM project development, but have sufficient domestic capacity todevelop projects locally.
In order to get more foreign investors on the CDM track, it might be useful• to increase the awareness of the CDM in the Annex B private sector, especially by
providing incentives• to enable an objective risk assessment by providing detailed information on the economic
and political situation of a host country• to install an information platform, where host country project developers can contact
potential Annex B investors

45
Appendix A: Impacts of a different risk perception on mitigation projects
The impacts of a lower risk perception by local project developers are demonstrated by theuse of a model illustrated in Figure 13 and Figure 14. It is based on the followingassumptions:• Due to a different risk perception the host investor has lower return expectations for CDM
projects than the foreign investor. This can be demonstrated by a higher marginalabatement cost curve for bilateral CDM than for unilateral CDM. The risk premium isreflected by the difference of the two curves and is positive. Thus the bilateral CDMmarginal abatement cost curve is always higher than the unilateral one.
• The Annex B investor currently emits E0, faces domestic emission constraint E1 and can use CERs to offset domestic excess emissions.
Figure 13: Effects of risk premium for foreign CDM investment
The marginal abatement costs are d for a purely domestic reduction, b for a combination ofdomestic reduction and bilateral CDM and u for the optimum mix of unilateral CDM anddomestic reduction. The amount of bilateral CDM is the distance E1–Db while domesticreduction is Db-E0. For the unilateral solution, unilateral CDM amounts to E1–Du anddomestic reduction to Du-E0. Unilateral CDM thus leads to lower abatement costs and agreater share of reductions in DCs.
Let us now assume that both countries face an exogenous world market price p. As long as pis above b, there is no change from the situation shown above. If p is between b and u (seeFigure 14), domestic reduction falls from Db-E0 to Dp-E0. Bilateral CDM amounts to A-Dp
and acquisitions on the world market to E1-A. Whether the amount of CDM de- or increases,
E1 Db Du E0 Emissions
Costs
d
b
u
aggrega-ted bilateral
aggregatedunilateral
unilateral bilateral domestic

46
depends on the slope of the curves. For the unilateral case nothing changes until p becomeslower than u. Then the same reasoning applies as in the bilateral case.
Figure 14: Exogenous world market price and bi- vs. unilateral CDM
E1 A Db Dp Du E0 Emissions
Costs
b
p u
aggrega-ted bilateral
aggregatedunilateral
unilateral bilateral domestic

47
Appendix B: Data collection and scale index values
Country Name Kyoto Ratification
DNA operating
Gross fixed capital formation (current million US$)
Gross fixed capital formation (% of GDP)
Domestic credit to private sector (% of GDP)
Scientists and engineers in R&D (per million people)
Number of nominated experts in UNFCCC roster
Realised AIJ projects
Number of CDM projects with PDD and baseline study
Institutional Investor credit rating
Algeria no no 12059 22 8 ... 0 0 0 41,6Egypt, Arab Rep. no yes 14794 15 62 493 7 0 1 41,1Iran, Islamic Rep. no no 34621 30 33 590 23 0 0 36,6Jordan yes yes 2288 26 75 1948 2 1 0 38,5Kuwait no no 2825 9 69 212 2 0 0 79,2Lebanon no yes 3117 19 91 ... 10 0 0 25,2Morocco yes yes 8350 24 54 ... 1 1 0 49,4Saudi Arabia no no 33808 18 55 ... 1 0 0 52,4Syrian Arab Republic no yes 4131 21 8 29 5 0 0 22,7Tunisia yes no 5220 26 68 336 0 0 0 52,6Yemen, Rep. no yes 1812 20 6 ... 0 0 0 24,3
Data source
Appendix B: Data collection - North Africa and Middle East
20012001 2001 Dec 03 Sep 03Year of collection Dec 03 Dec 03 Dec 03
UNFCCC UNFCCC
1990-2000 (latest year available)
Nov 03
0,2 0 42,1
Lowest value within the group
029... 1812 9
Institutionalinvestor country
credit rating
... 11184 21 48 ...
World Bank's World
Development Indicators 2003
World Bank's World
Development Indicators 2003
World Bank's World
Development Indicators 2003
5
CDM watchWorld Bank's World
Development Indicators 2003
UNFCCC UNFCCC
30 91
Average of all selected countries of the group
...
6
Highest value within the group
... ... 34621
...
1948 23 1 0 79,2
22,700

48
Country Name Kyoto Ratification
DNA operating
Gross fixed capital formation (current million US$)
Gross fixed capital formation (% of GDP)
Domestic credit to private sector (% of GDP)
Scientists and engineers in R&D (per million people)
Number of nominated experts in UNFCCC roster
Realised AIJ projects
Number of CDM projects with PDD and baseline study
Institutional Investor credit rating
Azerbaijan yes yes 1185 21 5 2799 6 0 0 30,4Bangladesh yes no 10783 23 27 51 0 0 0 28,6China yes no 443647 38 127 545 58 4 2 59,9India yes yes 103126 22 29 157 6 1 11 48,0Indonesia no no 30300 21 20 ... 13 4 1 30,3Kazakhstan no no 5073 23 16 716 7 0 0 41,4Korea, Rep. yes no 114252 27 108 2319 10 0 1 68,5Malaysia yes yes 21931 25 149 160 3 0 2 61,7Nepal no yes 1058 19 32 ... 0 0 0 23,8Pakistan no yes 8384 14 28 69 7 0 0 26,2Philippines yes no 12546 18 40 156 5 0 0 43,8Sri Lanka yes yes 3505 22 28 191 10 1 0 34,1Thailand yes no 26732 23 98 74 15 1 2 56,9Turkmenistan yes no 2139 36 a) 2 ... 0 0 0 20,8Uzbekistan yes no 2196 19 ... 1754 2 0 0 20,5Vietnam yes yes 9449 29 39 274 0 2 0 37,7
Data source
a) only available for 2000
Appendix B: Data collection - Asia and Pacific
Institutionalinvestor country
credit rating
CDM watch
0,8 1 39,5
World Bank's World
Development Indicators 2003
World Bank's World
Development Indicators 2003
UNFCCC UNFCCC
Sep 032001 2001Year of collection Dec 03 Dec 03 Nov 032001 Dec 03 Dec 03
UNFCCC UNFCCC
38
... 1058 14
24
World Bank's World
Development Indicators 2003
149
1990-2000 (latest year
World Bank's World
Development Indicators 2003
Highest value within the group
... ... 443647 2799
Lowest value within the group
...
58 4 8 68,5
Average of all selected countries of the group
... ... 49769
0 20,5
47 712 9
2 51 0 0

49
Country Name Kyoto Ratification
DNA operating
Gross fixed capital form ation (current m illion US$)
Gross fixed capital form ation (% of GDP)
Dom estic credit to private sector (% of GDP)
Scientists and engineers in R&D (per m illion people)
Num ber of nom inated experts in UNFCCC roster
Realised AIJ projects
Num ber of CDM projects w ith PDD and baseline study
Institutional Investor credit rating
Argentina yes yes 37916 14 21 713 6 3 0 18,4Bolivia yes yes 1124 14 55 98 2 5 1 27,5Brazil yes yes 97637 19 35 323 6 0 10 37,1Chile yes yes 14240 21 66 370 35 4 4 65,2Colom bia yes yes 11120 13 25 101 14 0 2 37,2Costa Rica yes yes 2901 18 28 533 1 9 6 44,4Dom inican Republic yes no 4894 23 38 ... 0 0 0 36,6Ecuador yes no 4107 23 33 83 0 2 0 24,2El Salvador yes yes 2265 16 a) 42 47 0 0 1 46,4Guatem ala yes no 3558 17 20 ... 0 3 2 32,3Haiti no no a) 1.081 a) 27 15 ... 0 0 0 15,8Honduras yes no 1533 24 41 ... 0 4 0 25,3Jam aica yes yes 2329 30 13 ... 3 0 1 27,8Mexico yes no 121178 20 11 225 3 5 1 54,8Panam a yes yes 2620 26 126 124 0 1 3 45,0Paraguay yes no 1649 23 26 ... 4 0 0 22,4Peru yes yes 9908 18 24 229 3 0 0 38,3Trinidad and Tobago yes yes 1689 19 42 145 3 0 0 54,2Uruguay yes yes 2267 12 54 219 13 0 0 27,3Venezuela, RB no no 20543 16 12 194 0 0 0 27,1
Data source
a) only available for 2000
Average of all selected countries of the group
... ... 17174
65,2
Lowest value within the group
... ... 1081 12 11 47 15,8
713Highest value within the group
0 0
9... ... 121178 30
0
126
1,6
35
1,8
10
18 34 ...
W orld Bank's W orld
Developm ent Indicators 2003
W orld Bank's W orld
Developm ent Indicators 2003
W orld Bank's W orld
Developm ent Indicators 2003
W orld Bank's W orld
Developm ent Indicators 2003
35,4
2001 Nov 032001 1990-2000 (latest year available)
UNFCCC Institutionalinvestor country
credit rating
UNFCCC CDM watch
5
Appendix B: Data collection - Latin America and Caribbean
Year of collection Dec 03 Dec 03
UNFCCC UNFCCC
Dec 03 Dec 03 Sep 032001

50
Country Name Kyoto Ratification
DNA operating
Gross fixed capital formation (current million US$)
Gross fixed capital formation (% of GDP)
Domestic credit to private sector (% of GDP)
Scientists and engineers in R&D (per million people)
Number of nominated experts in UNFCCC roster
Realised AIJ projects
Number of CDM projects with PDD and baseline study
Institutional Investor credit rating
Angola no no 3217 34 4 ... 0 0 0 17,0Botswana yes no 1314 25 16 ... 1 0 0 62,2Cameroon yes no 1513 18 10 ... 0 0 0 19,9Ethiopia no no 1124 18 28 ... 8 0 0 16,1Gabon no no 1323 31 12 ... 0 0 0 22,7Ghana yes no 1256 24 a) 14 ... 1 0 0 25,8Kenya no no 1388 12 25 ... 2 0 0 24,6Mauritius yes yes 1057 23 63 360 3 2 1 53,9Mozambique no no 1500 42 3 ... 0 0 0 20,6Nigeria no no 11399 28 18 ... 5 0 0 20,2South Africa yes no 17518 15 149 992 5 2 2 54,6Sudan no no 2071 17 3 ... 3 0 0 10,5Tanzania yes no 1570 17 5 ... 0 0 0 21,8Uganda yes no 1114 20 6 24 0 2 1 20,1
Data source
a) only available for 2000
World Bank's World
Development Indicators 2003
Appendix B: Data collection - sub-Saharan Africa
UNFCCC UNFCCC Institutionalinvestor country
credit rating
CDM watchWorld Bank's World
Development Indicators 2003
1057 12 3
UNFCCC UNFCCC
2001 2001
World Bank's World
Development Indicators 2003
World Bank's World
Development Indicators 2003
Year of collection Dec 03 Dec 03 Dec 03Nov 03 Dec 032001 1990-2000 (latest year
Sep 03
8Highest value within the group
... ... 17518 62,2
Lowest value within the group
... ...
42
23 24 ...
149 992
24
2
2 0,4 0,3
2
0
Average of all selected countries of the group
... ... 3383 27,9
0 0 10,5

51
In d e x v a lu e s G ro s s fix e d c a p ita l fo rm a tio n (c u rre n t m ill io n U S $ )
G ro s s fix e d c a p ita l fo rm a tio n (% o f G D P )
D o m e s tic c re d it to p r iv a te s e c to r (% o f G D P )
S c ie n tis ts a n d e n g in e e rs in R & D (p e r m illio n p e o p le )
N u m b e r o f n o m in a te d e x p e rts in U N F C C C ro s te r
R e a lis e d A IJ p ro je c ts
N u m b e r o f C D M p ro je c ts w ith P D D a n d b a s e lin e s tu d y
In s titu tio n a l In v e s to r c re d it ra tin g
0 x< 5 0 0 0 ] x< 1 0 ] x< 5 ] x< 1 5 0 ] x< 2 ] x< 1 [ x< 1 [ x> 7 0 [1 [1 0 0 0 0 > x> 5 0 0 0 [ [1 3 > x> 1 0 [ [1 5 > x> 5 [ [3 0 0 > x> 1 5 0 [ [4 > x> 2 [ .. . . . . [7 0 > x> 6 4 [2 [1 5 0 0 0 > x> 1 0 0 0 0 [ [1 6 > x> 1 3 [ [2 5 > x> 1 5 [ [4 5 0 > x> 3 0 0 [ [6 > x> 4 [ x= 1 x = 1 [6 4 > x> 5 8 [3 [2 0 0 0 0 > x> 1 5 0 0 0 [ [1 9 > x> 1 6 [ [3 5 > x> 2 5 [ [6 0 0 > x> 4 5 0 [ [8 > x> 6 [ .. . . . . [5 8 > x> 5 2 [4 [2 5 0 0 0 > x> 2 0 0 0 0 [ [2 2 > x> 1 9 [ [4 5 > x> 3 5 [ [7 5 0 > x> 6 0 0 [ [1 0 > x> 8 [ x= 2 x = 2 [5 2 > x> 4 6 [5 [3 0 0 0 0 > x> 2 5 0 0 0 [ [2 5 > x> 2 2 [ [5 5 > x> 4 5 [ [9 0 0 > x> 7 5 0 [ [1 2 > x > 1 0 [ .. . . . . [4 6 > x> 4 0 [6 [3 5 0 0 0 > x> 3 0 0 0 0 [ [2 8 > x> 2 5 [ [6 5 > x> 5 5 [ [1 0 5 0 > x> 9 0 0 [ [1 4 > x > 1 2 [ x= 3 x = 3 [4 0 > x> 3 4 [7 [4 0 0 0 0 > x> 3 5 0 0 0 [ [3 1 > x> 2 8 [ [7 5 > x> 6 5 [ [1 2 0 0 > x> 1 0 5 0 [ [1 6 > x > 1 4 [ .. . . . . [3 4 > x> 2 8 [8 [4 5 0 0 0 > x> 4 0 0 0 0 [ [3 4 > x> 3 1 [ [8 5 > x> 7 5 [ [1 3 5 0 > x> 1 2 0 0 [ [1 8 > x > 1 6 [ x= 4 x = 4 [2 8 > x> 2 2 [9 [5 0 0 0 0 > x> 4 5 0 0 0 [ [3 7 > x> 3 4 [ [9 5 > x> 8 5 [ [1 5 0 0 > x> 1 3 5 0 [ [2 0 > x > 1 8 [ .. . . . . [2 2 > x> 1 6 [
1 0 x> 5 0 0 0 0 [ x> 3 7 [ x> 9 5 [ x> 1 5 0 0 [ x > 2 0 [ x> 4 [ x> 4 [ x< 1 6 ]M a x im u m v a lu e c h o s e n
5 0 0 0 0 3 7 9 5 1 5 0 0 2 0 4 4 1 6
M in im u m v a lu e c h o s e n
5 0 0 0 1 0 5 1 5 0 2 1 1 7 0
M o d e o f s c a lin g d ire c t ly p ro p o rt io n a l d ire c t ly p ro p o rtio n a l d ire c t ly p ro p o rt io n a l d ire c t ly p ro p o rt io n a l d ire c t ly p ro p o rt io n a l d ire c t ly p ro p o rt iod ire c t ly p ro p o rt io n a l d ire c tly p ro p o rtio n a l
H ig h e s t v a lu e w ith in s e le c te d c o u n tr ie s
4 4 3 6 4 7 4 2 1 4 9 2 7 9 9 5 8 9 1 0 7 9 ,2
L o w e s t v a lu e w ith in s e le c te d c o u n tr ie s
1 0 5 7 9 2 2 4 0 0 0 1 0 ,5
O th e r o rie n ta tio n v a lu e s
4 5 8 n o m in a te d e xp e rts o f 5 1 N o n -
A n n e x I c o u n trie s
7 0 p ro je c ts in 3 1 N o n -A n n e x
I c o u n trie s
5 9 p ro je c ts in 2 3 N o n -A n n e x I
c o u n tr ie s
5 0 ,9 0 ,8.. . 3 6 ,0
8 7 ,01 3 7 3 2 8 1
A v e ra g e o f a ll s e le c te d c o u n tr ie s
2 1 4 7 8 2 1 3 8
H ig h in c o m e c o u n try (a v e ra g e )
9 7 5 8 2 2 2
7 7 8M id d le in c o m e c o u n try (a v e ra g e )
1 4 0 2 2 2 3 5 8 3 9 ,0
1 8 ,0
A p p e n d ix B : C o n ve rs io n o f d a ta in to s c a le in d e x va lu e s
L o w in c o m e c o u n try (a v e ra g e )
3 4 8 2 2 0 2 4 .. .
v a lu e s o f o r ie n ta tio n

52
References
Anonymous (2003): Basic Requirements for CDM Projects in China,cop9.str3.com/SlideRepository/2003_12_4_157/ dna0212a/dna0212a.ppt, accessed Jan. 8,2004
Austin, Duncan; Faeth, Paul (2000): Financing Sustainable Development with the CleanDevelopment Mechanism, World Resource Institute (WIR), Washington, D.C.
Bhandari, Preety (2003): Facilitating CDM Implementation in India,www.teriin.org/events/docs/irt-cdm/pb.pdf, accessed Jan. 8, 2004
Baumert, Kevin; Kete, Nancy; Figueres, Christiana (2000): Designing the CleanDevelopment Mechanism to meet the needs of a broad range of interests, WRI, Washington,D.C.
Capacity for Sustainable Development (2003): Lessons Learned in JI and CDM CapacityBuilding, Capacity for Sustainable Development (CAP SD) newsletter, Amsterdam
CDM Watch (2003): Quick stats, http://cdmwatch.org, accessed Dec. 29, 2003
Deodhar, Vinay; Michaelowa, Axel; Krey, Matthias (2003): Financing structures for CDMprojects in India and capacity building options for EU-Indo collaboration, HWWA DiscussionPaper No. 247, Hamburg
Eyzaguirre, Jimena (2002): Types of projects, Center for Sustainable Development in theAmericas, in: Figueres, Christina (ed.): Establishing National Authorities for the CDM,International Institute for Sustainable Development and the Center for SustainableDevelopment in the Americas, p. 75-90
Figueres, Christina; Gowan, Mary (2002): The operation of the CDM, Center for SustainableDevelopment in the Americas, in: Figueres, Christina (ed.): Establishing National Authoritiesfor the CDM, International Institute for Sustainable Development and the Center forSustainable Development in the Americas, p. 21-32
Figueres, Christina; Olivas, Helen (2002): Evolution of National Authorities for the CDM,Center for Sustainable Development in the Americas, in: Figueres, Christina (ed.):Establishing National Authorities for the CDM, International Institute for SustainableDevelopment and the Center for Sustainable Development in the Americas, p. 33-49
Gonzales, Alan (2001): Financing issues and options for small-scale industrial CDM projectsin Asia, United Nations Development Program, Bangkok
Greenpeace (1999): Making the Clean Development Mechanism clean and green: an update,Bonn
Deutsche Gesellschaft für Technische Zusammenarbeit (GTZ) (2003): CDM Highlights,September 2003, www.gtz.de/climate/download/cdm-highlights/ CDM%20Highlights-09-03.pdf, accessed Jan. 8, 2004
International Institute for Sustainable Devwlopment (IISD) (2000): Earth NegotiationsBulletin, COP-6, Nov. 21
Jablonski, Sophie (2003): The nature of Climate Change mitigation projects under Kyoto,Cambridge University
Janssen, Josef (2002): Financing Industrial CDM Projects in ASEAN countries, UNIDO,Vienna
Janssen, Josef (2001): Risk management of investments in Joint Implementation and CleanDevelopment Mechanism projects, Difo-Druck, Bamberg

53
Jotzo, Frank; Michaelowa, Axel (2002): Estimating the CDM market under the MarrakechAccords, in: Climate Policy 2/2002, p. 179-196
Kim, Myung-Ja (2000): Statement by H.E. Myung Ja Kim, Ph.D. Minister of EnvironmentRepublic of Korea at the 6th Conference of Parties to the UN Framework Convention onClimate Change 21 November 2000, The Hague, the Netherlands,http://www.happygreen.co.kr/executive/execu_view7.asp?execu7id=64&execu7code=all,accessed Oct. 25, 2003
Krey, Matthias (2003): Transaction costs of CDM projects in India, diploma thesis,forthcoming, University of Flensburg, Flensburg
Liese, Egbert (2001): Terms of Reference – CERUPT 2001, Senter international, The Hague
Liu Deshun (2001): Building Frameworks for CDM Carbon Market To Meet DevelopingCountries’ Needs, International Workshop on Social-Economy Assessment for CDM andOther Mechanisms, 15 – 16 March 2001 Xindadu Hotel, Beijing, China,www.iges.or.jp/en/cp/output_all/workshop/ClimateAsia/ china/presentation/CPD-C-4.pdf,accessed Oct. 25, 2003
Michaelowa, Axel (2003): The current status of the international CDM process, presentationat Workshop “Clean Development Mechanism - Ein Zukunftsmarkt?”, Berlin, 19.9.
Michaelowa, Axel (2000): Project-based instruments: economic consequences of the Kyotoand Buenos Aires framework and options for future development, in: Brockmann, Karl-Ludwig; Stronzik, Marcus (eds.): Flexible mechanisms for an efficient climate policy,Physica, Heidelberg, p. 39-62
Michaelowa, Axel; Koch, Tobias (2001): Glossary of International Climate Policy Terms,HWWA-Report No. 208, Hamburg
Michaelowa, Axel; Vöhringer, Frank (2001): CDM: a European perspective, in: DevelopmentAlternatives Newsletter, 11, 11, p. 5-6
Ministry of Foreign Affairs (2002): Asia CDM Capacity Building Initiative,http://www.mofa.go.jp/policy/environment/wssd/2002/type2/3-2-2.html, accessed Jan. 8,2004
Ministry of Housing, Spatial Planning and the Environment of the Netherlands (2003):Personal communication, 20.10.2003
Point Carbon (2003): Validators’ venue: Unilateral CDM, in: CDM Monitor, October, p. 2
Prototype Carbon Fund (PCF) (2003a): PCF Operational Cycle,http://prototypecarbonfund.org/router.cfm?Page=DocLib&Dtype=23, accessed Nov. 23, 2003
Prototype Carbon Fund (PCF) (2003b): Carbon Finance Help desk. PersonalCommunication, 25.9.2003
Prototype Carbon Fund (PCF) (2002a): Annual Report, World Bank, Washington
Prototype Carbon Fund (PCF) (2002b): Financial Risk Assessment and Mitigation,http://prototypecarbonfund.org/router.cfm?Page=DocLib&Dtype=23, accessed Nov. 23, 2003
Roveda, Eduardo; Merenson, Carlos (1999): El Protocolo de Kyoto y el Mecanismo para undesarollo limpio, Santiago de Chile
Soltanieh, Mohammed (2003): Iran’s Readiness for Implementing CDM (Power PointPresentation), Climate Change Office Department of Environment Islamic Republic of Iran
Stewart, Richard; Anderson, Dean; Aslam, Malik; Eyre, Charles; Jones, Jed; Sands,Philippe; Yamin, Farhana (1999): The Clean Development Mechanism: Buildinginternational public-private partnership, UNCTAD /GDS/GFSB/Misc.7, Geneva

54
Tippman, Robert; Medina-Gómez, Sonia (2003): Making small scale projects competitive onthe Greenhouse Gas Market – Focus Africa, in: CDM investment newsletter, 1, p. 12-16
UNFCCC (2003a): Caring for Climate - a guide to the climate change convention and thekyoto protocol, Bonn
UNFCCC (2003b): CDM Project Design Document template,http://cdm.unfccc.int/Reference/Documents, accessed Nov. 29, 2003
UNFCCC (2003c): Roster of expertshttp://unfccc.int/program/mis/roster/index.html, accessed Nov. 29, 2003UNFCCC (2003d): Modalities and procedures for afforestation and reforestation projectactivities under the clean development mechanism in the first commitment period of theKyoto Protocol (Decision -/CP.9), Advance unedited version
UNFCCC (2001a): Report of the Conference of the Parties on Its Seventh Session. Part Two:Action Taken by the Conference of the Parties, Geneva
UNFCCC (2001b): Work programme on mechanisms (Decisions 7/CP.4 and 14/CP.5),Report by the Co-Chairmen of the negotiating group, FCCC/CP/2001/CRP.2, Bonn
UNFCCC (2000): Principles, modalities, rules and guidelines for the mechanisms underArticles 6, 12 and 17 of the Kyoto Protocol. Submissions from Parties. Note by thesecretariat, FCCC/SB/2000/MISC.1, Bonn
UNFCCC (1997): Kyoto Protocol to the United Nations Framework Convention on ClimateChange, Geneva
World Bank (2003a): Carbon Finance at the World Bank, Washington, D.C.
World Bank (2003b): World Development Indicators 2003, Washington, D.C.
World Bank (2002): South African National Study on the Clean Development Mechanism,Washington, D.C.
Zhang, ZhongXiang (2001): Comments on “Climate Change Policies and Measures in Korea”by Dr. Joon Y. Sung, International Workshop on Climate Policy in Asia 17- 18 December2001, Tokyo, Japan
Recommended