Embed Size (px)
Citation preview
Electricity Supply Industry in Transition: Issues and Prospect for Asia 14-16 January 2004
,--I
,'-'
A Technical and Economic Analysis of Heat andPower Generation from Biomethanation of Palm Oil
Mill Effluent
B.G. YeohSIRIM Environment and Bioprocess Technology CentreNo.1, Persia ran Dato' Menteri, Section 2, P.O. Box 7035,
40911 Shah Alam, Selangor, MalaysiaE-mail: [email protected]
ABSTRACT
Palm oil mill effluent (POME) has been identified as one of the major sources ofaquatic pollution in Malaysia. due to its high strength and economic importance. Withmore than 330 palm oil mills in operation, Malaysia produces some 10.6 million tonnesof crude palm oil annually, accounting for 52% of the total world production, andconcomitantly generates some 27 x 106 m3 POME. To meet with the regulatory
requirement, more than 85% of the mills use solely lagoon systems in wastewatertreatment, typically anaerobic first stage followed by facultative treatment. Researchdata associated with this study revealed that methane yield ranging from 0.47 to 0.92
m3kg-1-BODadded was attainable in the biomethanation of POME for reactiontemperature of between 35 to 55°C. Considering the associated socio-environmentalimpact, an analysis of the research data indicates that about 375 x 106 m3, or 225 Gg ofCH4 is evolved from open ponding systems used in POME treatment, accounting for10% of the CH4 inventory in Malaysia. In terms of greenhouse gas effect, this sourceamounts to 5,170 Gg in CO2 equivalent, or 3.6% of the estimated total emissions inMalaysia. As methane can be harnessed for the generation of either thermal or electricenergy, an economic assessment based on a life-cycle cost-benefit model as elucidatedin this study shows that an annual return on investment of 31 to 58%, or payback periodof 2.5 to 1.5 years, is possible in resource recovery systems utilising methane for heatgeneration and land application of digester effluent. The corresponding figures forelectricity generation systems are 1.8 to 6.4% and 9.6 to 6.7 years. In the latter case, thepalm oil industry as a whole would be in a position to potentially contribute 2,250 x 106
kWh annually, equivalent to about 4% of the national electricity demand. Thiscompares favourably with the Malaysian Government policy to achieve 5% of the totalelectricity generation by 2005 from renewable bioenergy sources. In terms of thermalenergy generation, the potential would be equivalent to 715 x 106 litres, worth someUSD 120 million according to the prevailing price. Bioenergy recovery from thetreatment of POME therefore not only contributes towards the sustainable growth of the
palm oil industry, but also assists Malaysia in achieving its sustainable developmentobjectives in connection with the United Nations Framework Convention on ClimateChange.
20-63
Keywords: Biogas; Climate change; Economic analysis; Energy recovery; Methane;Palm oil mill effluent; Renewable energy
INTRODUCTION
The palm oil industry has been expanding rapidly in the last three decades in Malaysia,with the planted area increasing by more than II fold from 291,000 ha in 1970 to3,313,000 ha in 1999 [I]. Concomitantly, the number of palm oil mills has also grownfrom 122 in 1977 to 334 in 1999, having a total processing capacity of 69 milliontonnes fresh fruit bunches (FFB) per year. Currently, Malaysia produces about 57million tonnes of FFB annually, from which 10.6 million tonnes of crude palm oil and1.3 million tonnes of palm kernel oil are extracted. In 1999, Malaysia exported 8.9million tonnes of palm oil, and is currently ranked as the largest producer of palm oil inthe world, accounting for 52% of the total world production. These figures put intoperspective the importance of the palm oil industry in the overall industrialdevelopment of Malaysia.
The process to extract oil from the FFB requires voluminous amount of water, mainlyfor sterilising the fruits and for oil clarification, resulting in the discharge of about 2.5m3 of effluent per tonne of crude oil processed [2]. Thus in 1999, a total of about 26.5million m3 of effluent was generated from the Malaysian palm oil industry. Fresh palmoil mill effluent, or POME as it is popularly known, is an acidic brownish colloidalsuspension characterised by high contents of organics and solids, and is discharged at atemperature of 80-90°C (Table I). It has been estimated that POME contributes toabout 30% of the total biochemical oxygen demand (BOD) load exerted on theMalaysian aquatic environment [3]. As one of the major sources of pollution, POMEwas among the first waste types to be singled out for statutory control. Table I alsoshows the regulatory discharge standards currently in force.
ANAEROBIC TREATMENT OF POME
The Status
In view of the high organic strength of POME, it has been recognised that first-stagetreatment of the wastewater using anaerobic technology is the best option. Anaerobicdigestion is a versatile biological treatment technology yielding methane as a usefulbioenergy. In this respect, however, the majority, that is more than 85%, of the palm oilmills use solely ponding systems due to their low capital and operating costs [6] sincemost mills are situated in the plantations, and this situation has more or less beenmaintained through the years [4]. This is because the industry generally perceives thatthe installation of waste treatment systems is principally intendeg to satisfy statutoryeffluent discharge requirements. Only a few mills have reported the use and operationof closed-tank anaerobic bioreactors equipped with biogas recovery systems [7, 8, 9,10].
20-64
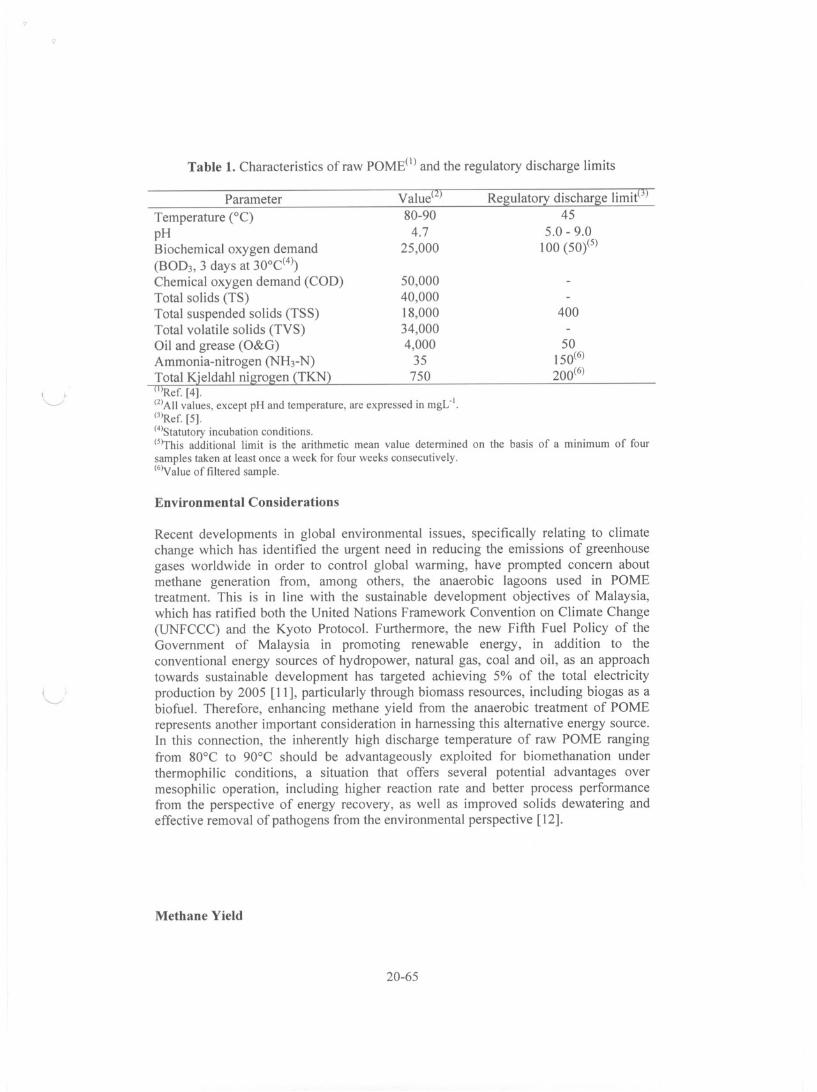
Table 1. Characteristics of raw POME(I) and the regulatory discharge limits
Parameter
Temperature (0C)pHBiochemical oxygen demand
(BOD], 3 days at 30°C(4)Chemical oxygen demand (COD)Total solids (TS)Total suspended solids (TSS)Total volatile solids (TVS)Oil and grease (O&G)Ammonia-nitrogen (NH]-N)
Total Kjeldahl nigrogen (TKN)(I)Ref. [4].(2) All values, except pH and temperature, are expressed in mgL·1•(3)Ref. [5].(4)Statutory incubation conditions.(S)This additional limit is the arithmetic mean value determined on the basis of a minimum of four
samples taken at least once a week for four weeks consecutively.(6)Yalue of filtered sample.
I~
Valuel1J
80-904.7
25,000
50,00040,00018,00034,0004,000
35750
Regulatory discharge limitm45
5.0 - 9.0
100 (50)(5)
400
50150(6)200(6)
Environmental Considerations
Recent developments in global environmental issues, specifically relating to climatechange which has identified the urgent need in reducing the emissions of greenhousegases worldwide in order to control global warming, have prompted concern aboutmethane generation from, among others, the anaerobic lagoons used in POMEtreatment. This is in line with the sustainable development objectives of Malaysia,which has ratified both the United Nations Framework Convention on Climate Change
(UNFCCC) and the Kyoto Protocol. Furthermore, the new Fifth Fuel Policy of theGovernment of Malaysia in promoting renewable energy, in addition to theconventional energy sources of hydropower, natural gas, coal and oil, as an approachtowards sustainable development has targeted achieving 5% of the total electricityproduction by 2005 [11], particularly through biomass resources, including biogas as abiofuel. Therefore, enhancing methane yield from the anaerobic treatment of POMErepresents another important consideration in harnessing this alternative energy source.In this connection, the inherently high discharge temperature of raw POME rangingfrom 80°C to 90°C should be advantageously exploited for biomethanation underthermophilic conditions, a situation that offers several potential advantages overmesophilic operation, including higher reaction rate and better process performancefrom the perspective of energy recovery, as well as improved solids dewatering andeffective removal of pathogens from the environmental perspective [12].
Methane Yield
20-65
An earlier study [13, 14] revealed that methane production was significantly enhancedin the thermophilic compared with mesophilic digestion of POME. However, itappeared to be little affected by the 5°C rise in reaction temperature from 45°C to
50°C, while a substantial increase was conspicuous at 55°C. Table 2 lists the gas yieldsat the various temperatures studied. An increase of 42% and 53% in methane yield wasnoted when the digestion temperature was raised to 55°C from 45°C and 50°Crespectively. Compared to mesophilic digestion, on the other hand, the methane yieldwas nearly doubled, with a 96% increase.
Table 2. Gas yields from anaerobic digestion of POMEat various reaction temperatures
Reaction
temperature (0C)35455055
Bio¥as yield(m3kg- -BO[)added)
0.780.920.991.41
Mean CH4 content(%)60
656565
CH4 yield
(m3kg-1-BO[)added)0.470.600.650.92
Basis of Analysis
COST-BENEFIT ANALYSIS
\ '--
The economic evaluation of the biomethanation of POME takes into consideration the
maximum utilisation of the biogas methane and the anaerobic liquor generated. It isbased on an average-sized mill capacity of 45 tonnes FFB h-I for 350 operating hoursper month, or an annual crop throughput of 189,000 tonnes. The seasonal cropavailability of oil palm for processing, befitting the said mill capacity, is estimated at12,000 tonnes FFB month-I for 8 months during the trough period, and 22,500 tonnesFFB month-I for 4 months during the peak period, while the wastewater load rangesfrom 240 m3d-1 to 450 m3d'I during the trough period and the peak period respectively,based on 25 working days per month. This is the range of hydraulic throughput for theanaerobic treatment system to be designed for this study.
Another consideration relating to land application of the anaerobically treatedwastewater warrants that the effluent quality should not exceed 5,000 mgL'1 of BO[),which is the regulatory limit set [5]. To take cognizance of the significant temperatureeffects on the anaerobic digestion process as discussed above, it is useful to make a
comparison of systems operated at digestion temperatures of 45°C, 50°C and 55°C.Table 3 lists the process parameters derived for the comparative economic analysis,which takes account of the capital and maintenance costs associated with and revenuegenerated from byproduct utilisation accordingly. Although methane can be harnessedfor the generation of both thermal and electric energy, particularly from the perspectiveof cogeneration, separate computations with respect to these two options, however, arecarried out in this study.
20-66
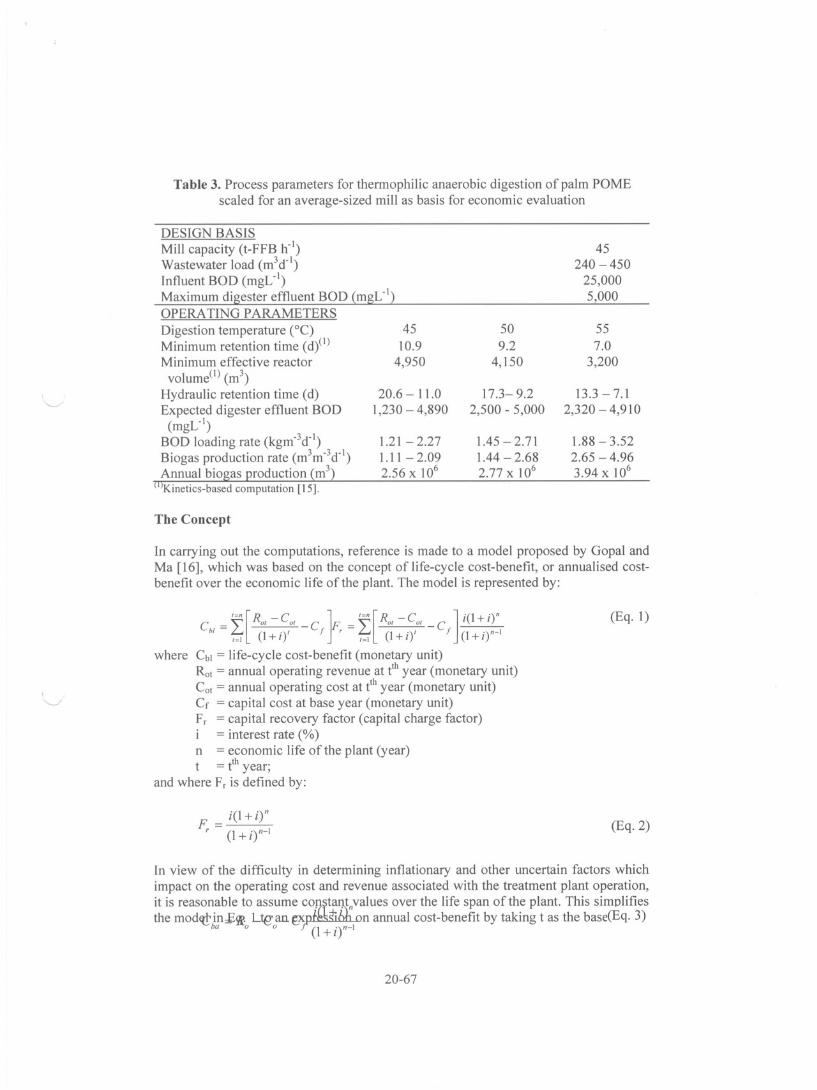
Table 3. Process parameters for thermophilic anaerobic digestion of palm POMEscaled for an average-sized mill as basis for economic evaluation
45
]0.94,950
20.6 - ] 1.0
1,230 - 4,890
1.21 - 2.271.11 - 2.092.56 x ]06
DESIGN BASIS
Mill capacity (t-FFB h-I)Wastewater load (m3dOI)Influent BOD (mgL-1)
Maximum digester effluent BOD (mgL-1)OPERATING PARAMETERS
Digestion temperature (0C)Minimum retention time (diI)Minimum effective reactor
volume(I) (m3)Hydraulic retention time (d)Expected digester effluent BOD
(mgL-1)
BOD loading rate (kgm-3d-I)Biogas production rate (m3mo3dOI)
Annual biogas production (m3)(I)Kinetics-based computation [15].
The Concept
509.2
4,]50
]7.3- 9.22,500 - 5,000
1.45 - 2.7]] .44 - 2.682.77 x 106
45240 - 450
25,0005,000
55
7.0
3,200
]3.3-7.1
2,320 - 4,9]0
1.88 - 3.522.65 - 4.963.94 x 106
]n carrying out the computations, reference is made to a model proposed by Gopal andMa [16], which was based on the concept of life-cycle cost-benefit, or annualised costbenefit over the economic life of the plant. The model is represented by:
I'---
C - ~[Rot -COI -C lC' _ ~[Rol -Cot C ] i(I + i)"bI - ~ (I + ir / J r - ~ (I + ir / (I + i)"-I
where CbI = life-cycle cost-benefit (monetary unit)Rot = annual operating revenue at ehyear (monetary unit)Cot = annual operating cost at tth year (monetary unit)Cf = capital cost at base year (monetary unit)Fr = capital recovery factor (capital charge factor)i = interest rate (%)n = economic life of the plant (year)t = tth year;
and where Fr is defined by:
F = i(1 + iYr (1 + iy-I
(Eg. I)
(Eg.2)
]n view of the difficulty in determining inflationary and other uncertain factors whichimpact on the operating cost and revenue associated with the treatment plant operation,
it is reasonable to assume co~ttal1'values over the life span of the plant. This simplifiesthe mod~in£fjf. Lte'an.expt it on annual cost-benefit by taking t as the base(Eg. 3)ba 0 () J (1 + i)n-I
20-67
where Cba = annual cost-benefit (monetary unit)Ra = annual operating revenue at base year (monetary unit)Ca = annual operating cost at base year (monetary unit)
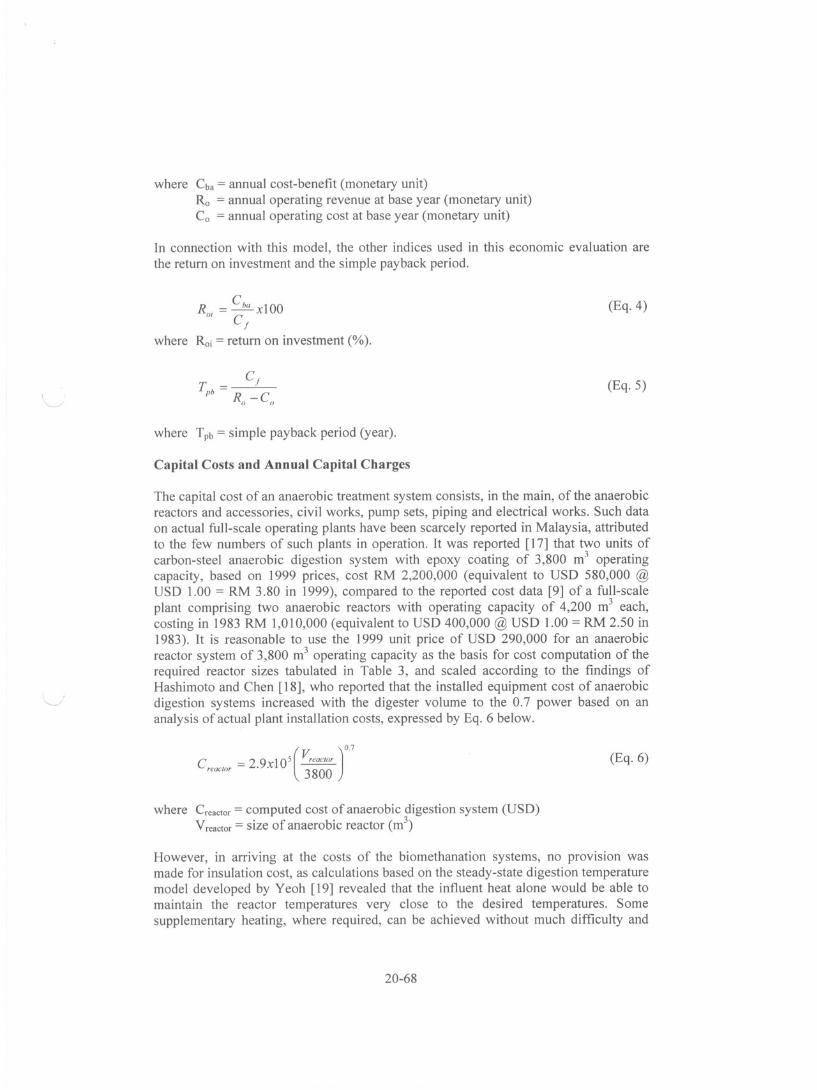
In connection with this model, the other indices used in this economic evaluation are
the return on investment and the simple payback period.
R . = Cba X 100UI CJ
where Roi = return on investment (%).
where Tpb = simple payback period (year).
Capital Costs and Annual Capital Charges
(Eq. 4)
(Eq. 5)
The capital cost of an anaerobic treatment system consists, in the main, of the anaerobicreactors and accessories, civil works, pump sets, piping and electrical works. Such dataon actual full-scale operating plants have been scarcely reported in Malaysia, attributedto the few numbers of such plants in operation. It was reported [17] that two units ofcarbon-steel anaerobic digestion system with epoxy coating of 3,800 m3 operatingcapacity, based on 1999 prices, cost RM 2,200,000 (equivalent to USD 580,000 @USD 1.00 = RM 3.80 in 1999), compared to the reported cost data [9] of a full-scaleplant comprising two anaerobic reactors with operating capacity of 4,200 m3 each,costing in 1983 RM 1,0 I0,000 (equivalent to USD 400,000 @ USD 1.00 = RM 2.50 in1983). It is reasonable to use the 1999 unit price of USD 290,000 for an anaerobicreactor system of 3,800 m3 operating capacity as the basis for cost computation of therequired reactor sizes tabulated in Table 3, and scaled according to the findings ofHashimoto and Chen [18], who reported that the installed equipment cost of anaerobicdigestion systems increased with the digester volume to the 0.7 power based on ananalysis of actual plant installation costs, expressed by Eq. 6 below.
C (V J7reaclor = 2.9xl05 ;;;~
where Creactar= computed cost of anaerobic digestion system (USD)Vreactar= size of anaerobic reactor (m3)
(Eq. 6)
However, in arriving at the costs of the biomethanation systems, no provision wasmade for insulation cost, as calculations based on the steady-state digestion temperature
model developed by Yeoh [19] revealed that the influent heat alone would be able tomaintain the reactor temperatures very close to the desired temperatures. Somesupplementary heating, where required, can be achieved without much difficulty and
20-68
cost by tapping the abundantly available steriliser exhaust steam from the milloperation. Field data reported on the operation of two 3,700 m3 non-insulatedconventional CSTR digesters [20] indicated that the digestion temperature was
maintained at 44-52°C by the inherent heat of the influent alone. It was also reported
that the temperature variation over a day due to intermittent feeding was 2-3°C andover the weekend, when the digesters were not fed, a drop of about 4°C could occur.However, no operational difficulty had been experienced with these temperaturefluctuations as reported.
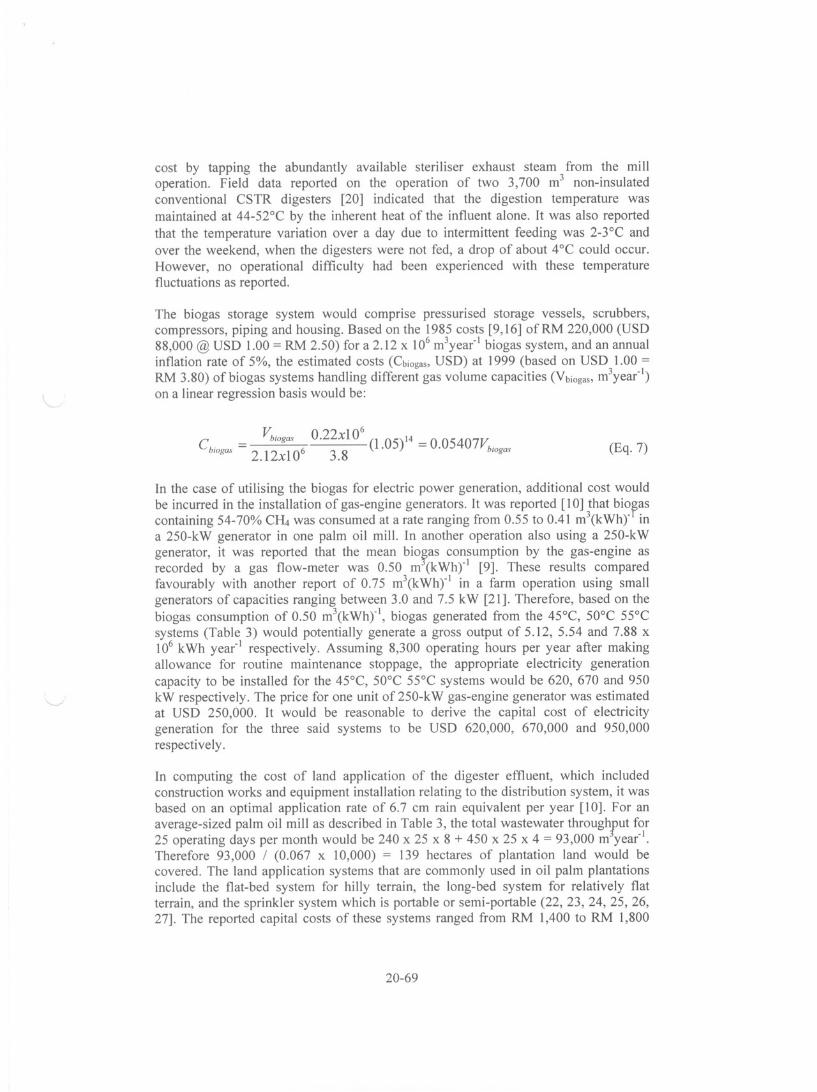
The biogas storage system would comprise pressurised storage vessels, scrubbers,compressors, piping and housing. Based on the 1985 costs [9,16] ofRM 220,000 (USD88,000 @ USD 1.00 = RM 2.50) for a 2.12 x 10⁶ m3yea(I biogas system, and an annualinflation rate of 5%, the estimated costs (Cbiogas,USD) at 1999 (based on USD 1.00 =RM 3.80) of biogas systems handling different gas volume capacities (V biogas,m3yea( I)
on a linear regression basis would be:
_ Vbiogol 0.22x10⁶ (1.05)14 = 0.05407Vbiogo'Cbiogol - 2.12x10⁶ 3.8 (Eq. 7)
In the case of utilising the biogas for electric power generation, additional cost would
be incurred in the installation of gas-engine generators. It was reported [10] that biopascontaining 54-70% CH4 was consumed at a rate ranging from 0.55 to 0.41 m\kWhr ina 250-kW generator in one palm oil mill. In another operation also using a 250-kW
generator, it was reported that the mean bio¥as consumption by the gas-engine asrecorded by a gas flow-meter was 0.50 m (kWhrl [9]. These results comparedfavourably with another report of 0.75 m3(kWhrI in a farm operation using smallgenerators of capacities ranging between 3.0 and 7.5 kW [21]. Therefore, based on thebiogas consumption of 0.50 m3(kWhrI, biogas generated from the 45°C, 50°C 55°Csystems (Table 3) would potentially generate a gross output of 5.12, 5.54 and 7.88 x10⁶ kWh yea(I respectively. Assuming 8,300 operating hours per year after makingallowance for routine maintenance stoppage, the appropriate electricity generation
capacity to be installed for the 45°C, 50°C 55°C systems would be 620, 670 and 950kW respectively. The price for one unit of 250-kW gas-engine generator was estimatedat USD 250,000. It would be reasonable to derive the capital cost of electricitygeneration for the three said systems to be USD 620,000, 670,000 and 950,000respectively.
In computing the cost of land application of the digester effluent, which includedconstruction works and equipment installation relating to the distribution system, it wasbased on an optimal application rate of 6.7 cm rain equivalent per year [10]. For an
average-sized palm oil mill as described in Table 3, the total wastewater throughput for25 operating days per month would be 240 x 25 x 8 + 450 x 25 x 4 = 93,000 m yea(I.Therefore 93,000 / (0.067 x 10,000) = 139 hectares of plantation land would becovered. The land application systems that are commonly used in oil palm plantationsinclude the flat-bed system for hilly terrain, the long-bed system for relatively flatterrain, and the sprinkler system which is portable or semi-portable (22, 23, 24, 25, 26,27]. The reported capital costs of these systems ranged from RM 1,400 to RM 1,800
20-69
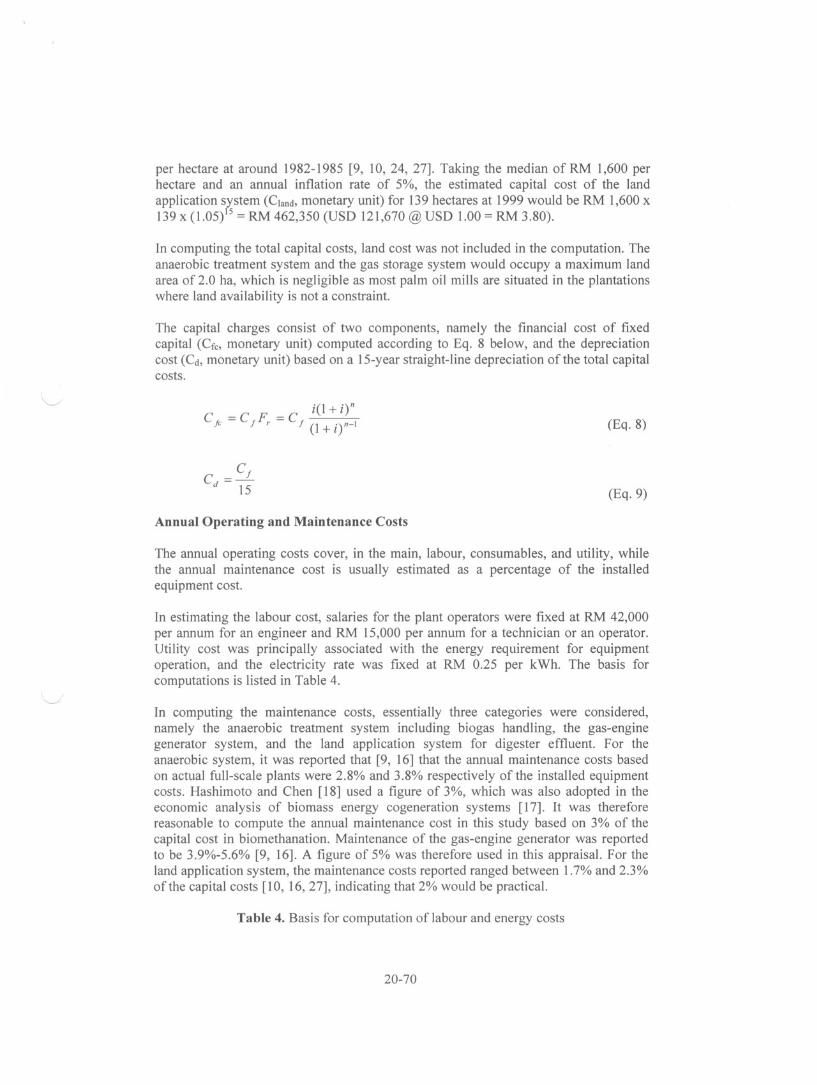
per hectare at around 1982-1985 [9, 10, 24, 27]. Taking the median of RM 1,600 perhectare and an annual inflation rate of 5%, the estimated capital cost of the landapplication system (Cland, monetary unit) for 139 hectares at 1999 would be RM 1,600 x139 x (1.05)15 = RM 462,350 (USO 121,670 @ USO 1.00 = RM 3.80).
In computing the total capital costs, land cost was not included in the computation. Theanaerobic treatment system and the gas storage system would occupy a maximum landarea of 2.0 ha, which is negligible as most palm oil mills are situated in the plantationswhere land availability is not a constraint.
The capital charges consist of two components, namely the financial cost of fixedcapital (Cre, monetary unit) computed according to Eq. 8 below, and the depreciationcost (Cd, monetary unit) based on a 15-year straight-line depreciation of the total capitalcosts.
CIC = CIFr = C i(1 +iYI (1 + i)n-l
Annual Operating and Maintenance Costs
(Eq. 8)
(Eq.9)
The annual operating costs cover, in the main, labour, consumables, and utility, whilethe annual maintenance cost is usually estimated as a percentage of the installedequipment cost.
In estimating the labour cost, salaries for the plant operators were fixed at RM 42,000per annum for an engineer and RM 15,000 per annum for a technician or an operator.Utility cost was principally associated with the energy requirement for equipmentoperation, and the electricity rate was fixed at RM 0.25 per kWh. The basis forcomputations is listed in Table 4.
In computing the maintenance costs, essentially three categories were considered,namely the anaerobic treatment system including biogas handling, the gas-enginegenerator system, and the land application system for digester effluent. For theanaerobic system, it was reported that [9, 16] that the annual maintenance costs basedon actual full-scale plants were 2.8% and 3.8% respectively of the installed equipmentcosts. Hashimoto and Chen [18] used a figure of 3%, which was also adopted in theeconomic analysis of biomass energy cogeneration systems [17]. It was thereforereasonable to compute the annual maintenance cost in this study based on 3% of thecapital cost in biomethanation. Maintenance of the gas-engine generator was reportedto be 3.9%-5.6% [9, 16]. A figure of 5% was therefore used in this appraisal. For theland application system, the maintenance costs reported ranged between 1.7% and 2.3%of the capital costs [10, 16,27], indicating that 2% would be practical.
Table 4. Basis for computation of labour and energy costs
20-70
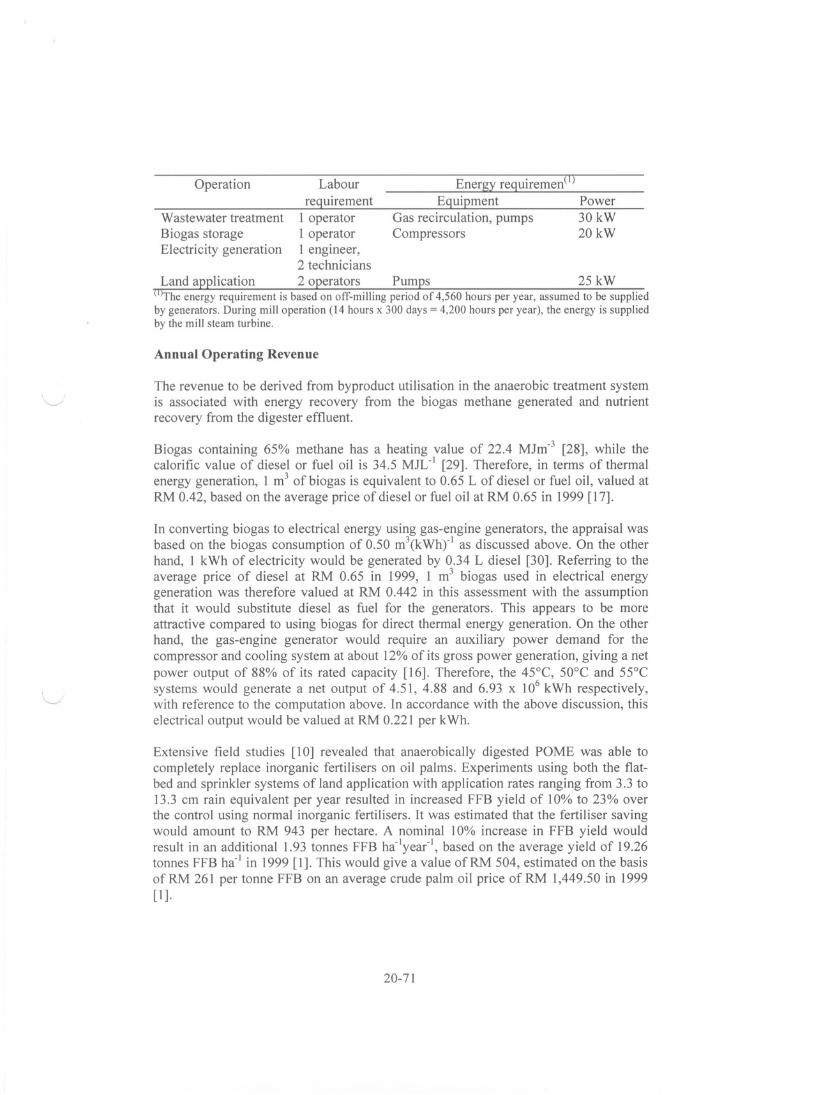
requirementI operator1 operator1 engineer,2 technicians
Land application 2 operators Pumps 25 kW(I)The energy requirement is based on off-milling period of 4,560 hours per year, assumed to be suppliedby generators. During mill operation (14 hours x 300 days = 4,200 hours per year), the energy is suppliedby the mill steam turbine.
Operation
Wastewater treatmentBiogas storageElectricity generation
Labour Energy requiremenmEquipment Power
Gas recirculation, pumps 30 kWCompressors 20 kW
Annual Operating Revenue
The revenue to be derived from byproduct utilisation in the anaerobic treatment systemis associated with energy recovery from the biogas methane generated and nutrientrecovery from the digester effluent.
Biogas containing 65% methane has a heating value of 22.4 MJm-3 [28], while thecalorific value of diesel or fuel oil is 34.5 MJL-1 [29]. Therefore, in terms of thermalenergy generation, 1 m3 of biogas is equivalent to 0.65 L of diesel or fuel oil, valued atRM 0.42, based on the average price of diesel or fuel oil at RM 0.65 in 1999 [17].
In converting biogas to electrical energy using gas-engine generators, the appraisal wasbased on the biogas consumption of 0.50 m3(kWhyl as discussed above. On the otherhand, I kWh of electricity would be generated by 0.34 L diesel [30]. Referring to theaverage price of diesel at RM 0.65 in 1999, I m3 biogas used in electrical energygeneration was therefore valued at RM 0.442 in this assessment with the assumptionthat it would substitute diesel as fuel for the generators. This appears to be moreattractive compared to using biogas for direct thermal energy generation. On the otherhand, the gas-engine generator would require an auxiliary power demand for thecompressor and cooling system at about 12% of its gross power generation, giving a netpower output of 88% of its rated capacity [16]. Therefore, the 45°C, 50°C and 55°Csystems would generate a net output of 4.51, 4.88 and 6.93 x 10⁶ kWh respectively,with reference to the computation above. In accordance with the above discussion, thiselectrical output would be valued at RM 0.221 per kWh.
Extensive field studies [10] revealed that anaerobically digested POME was able tocompletely replace inorganic fertilisers on oil palms. Experiments using both the flatbed and sprinkler systems of land application with application rates ranging from 3.3 to13.3 cm rain equivalent per year resulted in increased FFB yield of 10% to 23% overthe control using normal inorganic fertilisers. It was estimated that the fertiliser savingwould amount to RM 943 per hectare. A nominal 10% increase in FFB yield wouldresult in an additional 1.93 tonnes FFB ha-1yea{l, based on the average yield of 19.26tonnes FFB ha-1in 1999 [1]. This would give a value ofRM 504, estimated on the basisofRM 261 per tonne FFB on an average crude palm oil price ofRM 1,449.50 in 1999[1].
20-71
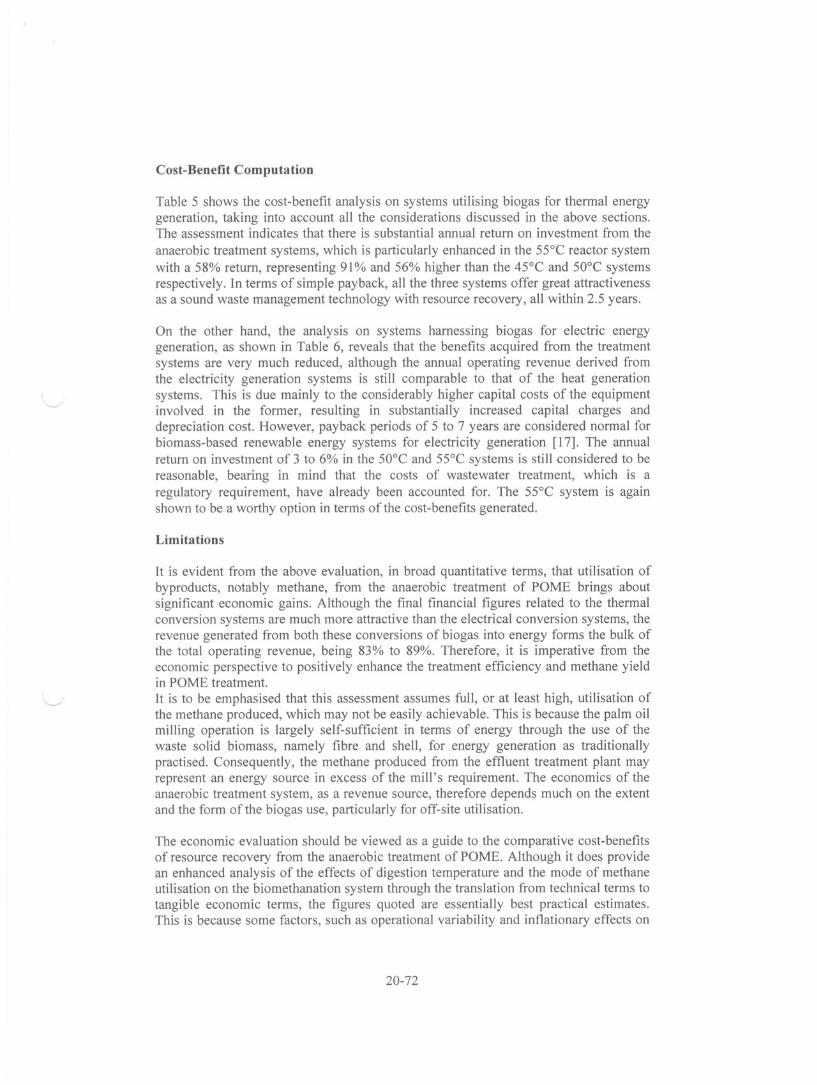
Cost-Benefit Computation
Table 5 shows the cost-benefit analysis on systems utilising biogas for thermal energygeneration, taking into account all the considerations discussed in the above sections.The assessment indicates that there is substantial annual return on investment from the
anaerobic treatment systems, which is particularly enhanced in the 55°C reactor systemwith a 58% return, representing 91% and 56% higher than the 45°C and 50°C systemsrespectively. In terms of simple payback, all the three systems offer great attractivenessas a sound waste management technology with resource recovery, all within 2.5 years.
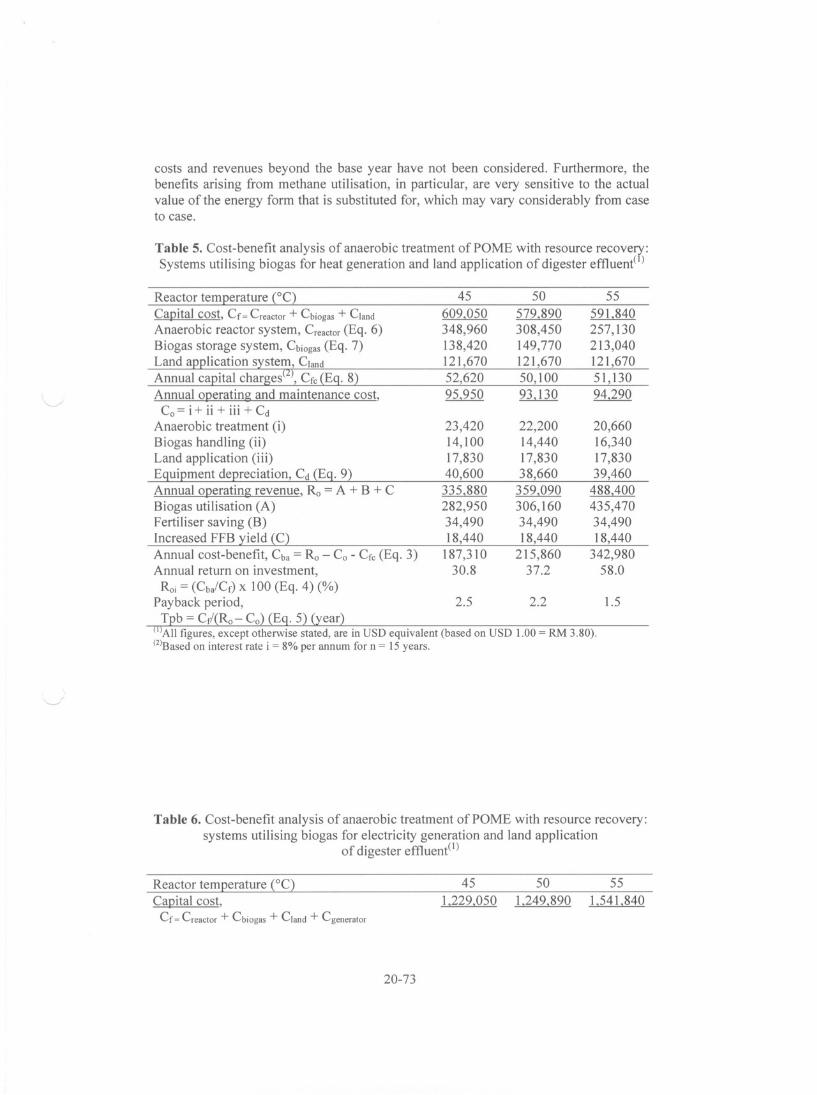
On the other hand, the analysis on systems harnessing biogas for electric energygeneration, as shown in Table 6, reveals that the benefits acquired from the treatmentsystems are very much reduced, although the annual operating revenue derived fromthe electricity generation systems is still comparable to that of the heat generationsystems. This is due mainly to the considerably higher capital costs of the equipmentinvolved in the former, resulting in substantially increased capital charges anddepreciation cost. However, payback periods of 5 to 7 years are considered normal forbiomass-based renewable energy systems for electricity generation [17]. The annualreturn on investment of 3 to 6% in the 50°C and 55°C systems is still considered to bereasonable, bearing in mind that the costs of wastewater treatment, which is aregulatory requirement, have already been accounted for. The 55°C system is againshown to be a worthy option in terms of the cost-benefits generated.
Limitations
It is evident from the above evaluation, in broad quantitative terms, that utilisation ofbyproducts, notably methane, from the anaerobic treatment of POME brings aboutsignificant economic gains. Although the final financial figures related to the thermalconversion systems are much more attractive than the electrical conversion systems, therevenue generated from both these conversions of biogas into energy forms the bulk ofthe total operating revenue, being 83% to 89%. Therefore, it is imperative from theeconomic perspective to positively enhance the treatment efficiency and methane yieldin POME treatment.It is to be emphasised that this assessment assumes full, or at least high, utilisation ofthe methane produced, which may not be easily achievable. This is because the palm oilmilling operation is largely self-sufficient in terms of energy through the use of thewaste solid biomass, namely fibre and shell, for energy generation as traditionallypractised. Consequently, the methane produced from the effluent treatment plant mayrepresent an energy source in excess of the mill's requirement. The economics of theanaerobic treatment system, as a revenue source, therefore depends much on the extentand the form of the biogas use, particularly for off-site utilisation.
The economic evaluation should be viewed as a guide to the comparative cost-benefitsof resource recovery from the anaerobic treatment of POME. Although it does providean enhanced analysis of the effects of digestion temperature and the mode of methaneutilisation on the biomethanation system through the translation from technical terms totangible economic terms, the figures quoted are essentially best practical estimates.This is because some factors, such as operational variability and inflationary effects on
20- 72
costs and revenues beyond the base year have not been considered. Furthermore, thebenefits arising from methane utilisation, in particular, are very sensitive to the actualvalue of the energy form that is substituted for, which may vary considerably from caseto case.
Table 5. Cost-benefit analysis of anaerobic treatment of POME with resource recoveR;:Systems utilising biogas for heat generation and land application of digester effluent( )
Reactor temperature (0C)Capital cost, Cr= Creactor+ Cbiogas+ ClandAnaerobic reactor system, Creactor(Eq. 6)Biogas storage system, Cbiogas(Eq. 7)Land application system, Cland
Annual capital charges(2), Crc(Eq. 8)Annual operating and maintenance cost,
Co= i + ii + iii + Cd
Anaerobic treatment (i)Biogas handling (ii)Land application (iii)Equipment depreciation, Cd (Eq. 9)Annual operating revenue, Ro = A + B + CBiogas utilisation (A)Fertiliser saving (B)Increased FFB yield (C)Annual cost-benefit, Cba = Ro - Co - Crc (Eq. 3)Annual return on investment,
Roi = (Cba/Cr) X 100 (Eq. 4) (%)Payback period,
Tpb = Cr/(Ro- Co) (Eq. 5) (year)(I)All figures, except otherwise stated, are in USD equivalent (based on USD 1.00 = RM 3.80).(2)Based on interest rate i = 8% per annum for n = 15 years.
45
609,050348,960138,420121,67052,62095,950
23,42014,10017,83040,600
335,880282,95034,49018,440
187,31030.8
2.5
50
579,890308,450149,770121,67050,10093,130
22,20014,44017,83038,660
359,090306,16034,49018,440
215,86037.2
2.2
55
591,840257,130213,040121,67051,130
94.290
20,66016,34017,83039,460
488,400435,47034,49018,440
342,98058.0
1.5
Table 6, Cost-benefit analysis of anaerobic treatment of POME with resource recovery:systems utilising biogas for electricity generation and land application
of digester effluent(l)
Reactor temperature (OC)Capital cost,
Cr= Creactor+ Cbiogas+ Cland+ Cgenerator
20- 73
45
1.229,050
50
1,249,890
55
1,541,840
Anaerobic reactor system, Creaetor(Eq. 6)Biogas storage system, Cbiogas(Eq. 7)Land application system, ClandGas-engine generators, CgeneratorAnnual capital charges(2), Cre (Eq. 8)Annual operating & maintenance cost,
Co= i+ ii + iii + iv + CdAnaerobic treatment (i)Biogas handling (ii)Land application (iii)Electricity generation (iv)Equipment depreciation, Cd (Eq. 9)Annual operating revenue, Ro = A + B + CBiogas utilisation (A)Fertiliser saving (B)Increased FFS yield (C)Annual cost-benefit, Cba = Ro - Co - Cre (Eq. 3)Annual return on investment,
Roi = (Cb.lCr)xl00 (Eq. 4) (%)Payback period, Tpb = Cr/(Ro - Co) (Eq. 5) 9.6 8.6
~All figures, except otherwise stated, are in USD equivalent (based on USD 1.00 = RM 3.80).
(2)Based on interest rate i = 8% per annum for n = 15 years.
348,960138,420121,670620,000106,190187,240
23,42014,10017,83049,95081,940
315,220262,29034,49018,440
21,7901.8
308,450149,770121,670670,000107,990191,\30
22,20014,44017,83052,45083,330
336,740283,81034,49018,440
37,6203.0
257,130213,040121,670950,000133,210224,590
20,66016,34017,83066,450102,790
455,960403,03034,49018,440
98,1606.4
6.7
PROSPECTS FOR COMMERCIALISATION
Policy Aspects
Notwithstanding the aforementioned limitations, there have recently been very positiveand important developments in Malaysia associated with this subject. The main energysources for the generation of electricity have traditionally been natural gas (71 %), fueloil and diesel (8%), hydro (12%) and coal (9%) based on 1999 statistics [31](Department of Electricity and Gas Supply Malaysia, 2000). In 1999, the total installedpower generation capacity in Malaysia was 13.632 GW, while the power demand was9.961 GW. Projections show that electricity demand in the country will grow by 6-10%annually.
The Government of Malaysia has formulated a strategy for renewable energy as thefifth fuel in addition to the aforementioned conventional energy sources as an approachtowards sustainable development. This recognition by the Government of theimportance and contribution of renewable energy in the total energy equation of thecountry is the most significant first step in initiating and implementing renewableprojects [32]. A holistic approach is adopted in promoting the utilisation of renewableresources including biomass, biogas, solar and mini-hydropower. This effort is beingintensified in the Fifth Malaysia Plan (2001-2005), particularly with respect to biomassresources, including biogas, for the purpose of heat and electricity generation, with the
20-74
target of achieving a contribution of 5% of the total electricity production (amountingto 500 MW) by 2005 [II]. Towards this end, the Ministry of Energy, Communicationsand Multimedia Malaysia launched a "Small Renewable Energy Programme" (SREP)in May 2001 to provide specific economic incentives for the promotion of smallelectricity generation plants of less than 10 MW capacities for grid connection, usingrenewable energy resources, predominantly biomass resources including biogas. Inaddition, following Malaysia's ratification of the Kyoto Protocol, infrastructure is beingput in place to prepare for the implementation of the Clean Development Mechanism(COM).
Methane generation from the anaerobic treatment of POME represents one of thesignificant sources of greenhouse gases in Malaysia, particularly from the open pondingsystems currently being used widely in the palm oil industry. Assuming a proximatelagoon temperature of 35°C, the potential methane production from POME in 1999from open ponding systems would amount to 375 x 106 m3 (Table 7), or 225 Gg, takingthe density of CH4 as 0.6 kgm-3. In comparison, the total CH4 emissions from allcategories in Malaysia were estimated at 2,231 Gg in 1994, the adopted reference yearfor the inventory of greenhouse gas emissions [33]. Methane is about 21 times morepotent than carbon dioxide in terms of its global warming potential, and the estimatedCO2 content in the biogas generated from POME was 247 x 106 m3 (or 445 Gg takingthe density as 1.8 kgm-3) in 1999 (based on Table 2); therefore, the said biogas sourceamounted to 5,170 Gg in CO2 equivalent in terms of its greenhouse effect. Theaforementioned report [33] estimated the total greenhouse gas emissions in Malaysia at144,314 Gg in CO2 equivalent in 1994. Maximising the conversion of biogas methanefrom the anaerobic treatment of palm oil mill effluent to energy therefore satisfies bothenvironmental and economic considerations.
Energy Potential
In view of the positive developments, there is growing awareness in the Malaysianpalm oil industry of the viability of anaerobic digestion and the attractive economicvalue of its byproducts, as the this study has revealed. Table 7 shows the potentialbioenergy recuperable from POME digested at various temperatures based on the statusin 1999. Taking the optimal digestion temperature of 55°C in accordance with thisstudy, it was equivalent to 715 million litres of fuel oil in terms of thermal energy,worth some USD 120 million at the 1999 price in Malaysia. In terms of electric energyobtainable through the use of gas-engine generators, it would generate 2,250 millionkWh, contributing to about 4% of the national electricity demand in 1999, based on thetotal demand of 56,400 million kWh [34]. Therefore, if the wastewater produced by thepalm oil industry were to be totally treated by thermophilic anaerobic digestion at 55°Cwith the biogas fully recovered for electric energy generation, it would satisfy almostthe Government's target of achieving 5% of the total electricity production from thissource alone. This compares much favourably with digestion carried outmesophilically, which would otherwise contribute only 2%. Undoubtedly, thesebenefits will be positively enhanced in cogeneration systems where both thermal andelectric energy are generated simultaneously.
Table 7. Energy potential of POME digested at various temperatures(l)
20-75
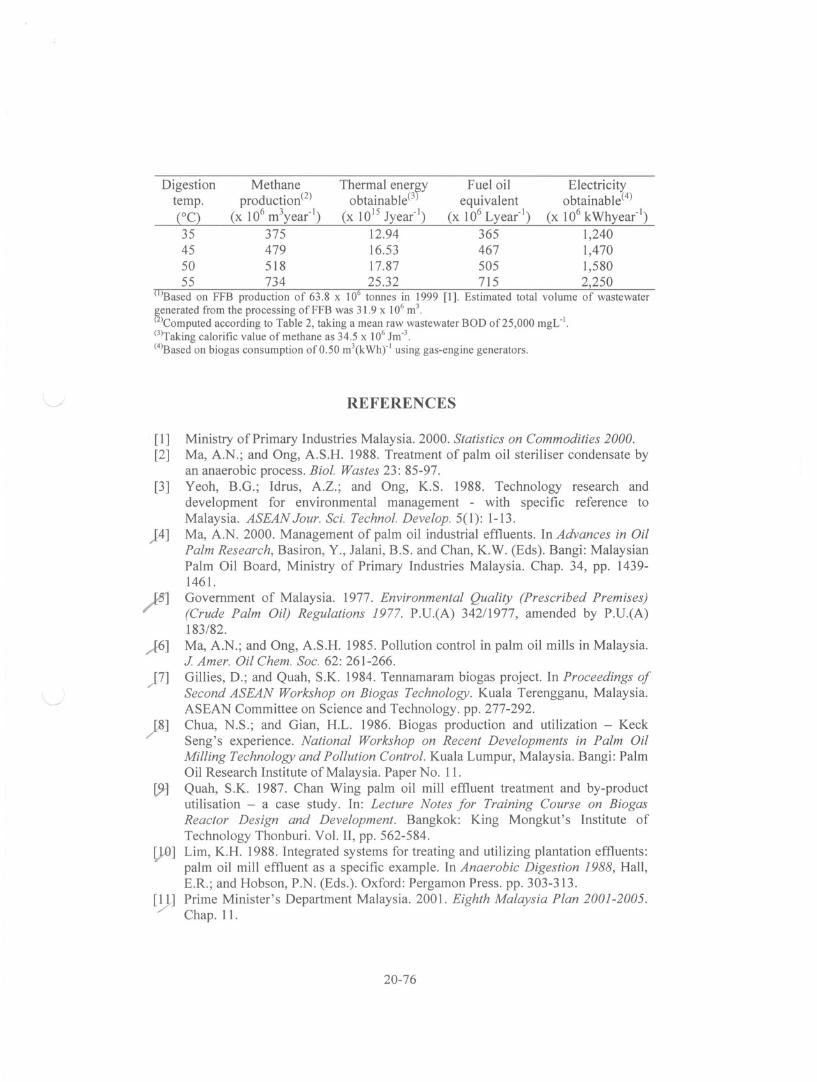
Digestion Methane Thermal enerF Fuel oil Electricitytemp. production(2) obtainable(3 equivalent obtainable(4)
(DC) (x 106 m3year"I) (x 1015 lyear"I) (x 106 Lyear"l) (x 106 kWhyear-l)35 375 12.94 365 1,24045 479 16.53 467 1,47050 518 17.87 505 1,58055 734 25.32 715 2,250
(l)Based on FFB production of 63.8 x 10⁶ tonnes in 1999 [1]. Estimated total volume of wastewater
8enerated from the processing of FFB was 31.9 x 10⁶ m3.2)Computed according to Table 2, taking a mean raw wastewater BOD of25,000 mgL-J•
(3)Taking calorific value of methane as 34.5 x 10⁶ Jm-3.(4)Based on biogas consumption of 0.50 m3(kWhY' using gas-engine generators.
REFERENCES
[1][2]
[3]
)4]
,.[6]
)7]
)8]
[9]
lJ-0]
Ministry of Primary Industries Malaysia. 2000. Statistics on Commodities 2000.Ma, A.N.; and Ong, A.S.H. 1988. Treatment of palm oil steriliser condensate byan anaerobic process. Bioi. Wastes 23: 85-97.Yeoh, B.G.; Idrus, A.Z.; and Ong, K.S. 1988. Technology research anddevelopment for environmental management - with specific reference toMalaysia. ASEAN Jour. Sci. Techno!. Develop. 5(1): 1-13.Ma, A.N. 2000. Management of palm oil industrial effluents. In Advances in OilPalm Research, Basiron, Y., lalani, B.S. and Chan, K.W. (Eds). Bangi: MalaysianPalm Oil Board, Ministry of Primary Industries Malaysia. Chap. 34, pp. 14391461.Government of Malaysia. 1977. Environmental Quality (Prescribed Premises)(Crude Palm Oil) Regulations 1977. P.U.(A) 342/1977, amended by P.U.(A)183/82.Ma, A.N.; and Ong, A.S.H. 1985. Pollution control in palm oil mills in Malaysia.J Amer. Oil Chem. Soc. 62: 261-266.Gillies, D.; and Quah, S.K. 1984. Tennamaram biogas project. In Proceedings ofSecond ASEAN Workshop on Biogas Technology. Kuala Terengganu, Malaysia.ASEAN Committee on Science and Technology. pp. 277-292.Chua, N.S.; and Gian, H.L. 1986. Biogas production and utilization - KeckSeng's experience. National Workshop on Recent Developments in Palm OilMilling Technology and Pollution Control. Kuala Lumpur, Malaysia. Bangi: PalmOil Research Institute of Malaysia. Paper No. 11.
Quah, S.K. 1987. Chan Wing palm oil mill effluent treatment and by-productutilisation - a case study. In: Lecture Notes for Training Course on BiogasReactor Design and Development. Bangkok: King Mongkut's Institute ofTechnology Thonburi. Vol. II, pp. 562-584.Lim, K.H. 1988. Integrated systems for treating and utilizing plantation effluents:palm oil mill effluent as a specific example. In Anaerobic Digestion 1988, Hall,E.R.; and Hobson, P.N. (Eds.). Oxford: Pergamon Press. pp. 303-313.Prime Minister's Department Malaysia. 2001. Eighth Malaysia Plan 2001-2005.Chap. 11.
20-76
[ 12]
[ 13]
[14]
[ 15]
)16]
[ 17]
[18]
[19]
[20]
[21 ]
[22]
[23]
[24]
[25]
Wiegant, W.M. 1986. Thermophilic anaerobic wastewater treatment. InAnaerobic Treatment: A Grown-up Technology, Conference Papers, Aquatech'86. Schiedam: Industrial Presentations. pp. 115-127.Yeoh, B.G.; Chew, T.Y.; Ma, A.N.; Cheah, S.c.; Chow, M.C.; Raj, R.; Ibrahim,A.; and Wahid, M.1.A. 1986. Improved anaerobic digestion of palm oil milleffluent using the thermophilic contact process. National Workshop on RecentDevelopments in Palm Oil Milling Technology and Pollution Control. KualaLumpur, Malaysia, 5-6 August. Bangi: Palm Oil Research Institute of Malaysia.Paper No. 10Yeoh, B.G. 1988. Anaerobic wastewater treatment pays: case of a strongagroindustrial effluent. In: Anaerobic Digestion 1988, Hall, E.R.; and Hobson,P.N. (Eds.). Oxford: Pergamon Press. pp. 315-324.Yeoh, B.G. 1986. A kinetic-based design for thermophilic anaerobic treatment ofa high-strength agroindustrial wastewater. Environ. Techno!. Left. 7: 509-518.Gopal, J.; and Ma, A.N. 1986. The comparative economics of palm oil milleffluent treatment and resource recovery systems. National Workshop on RecentDevelopments in Palm Oil Milling Technology and Pollution Control. KualaLumpur, Malaysia. Bangi: Palm Oil Research Institute of Malaysia. Paper No. 14.Pusat Tenaga Malaysia. 2000. Feasibility Study on Grid Connected PowerGeneration Using Biomass Cogeneration Technology.Hashimoto, A.G.; and Chen, Y.R. 1979. The overall economics of anaerobic
digestion. In Anaerobic Digestion, Stafford, D.A.; Wheatley, B.I.; and Hughes,D.E. (Eds.). London: Applied Science Publishers. pp. 449-466.Yeoh, B.G.; Roslan, M.Y.; and Quah, S.K. 1991. Optimising methane yield inanaerobic POME treatment through temperature and process manipulations. JIndus. Technol. 1(1): 19-31.Quah, S.K.; and Gilles D. 1981. Practical experience in production and use ofbiogas. In Proceedings of National Workshop on Oil Palm By-ProductUtilisation, Kuala Lumpur, Malaysia. Bangi: Palm Oil Research Institute ofMalaysia. pp. 119-125.Zexi, C. 1984. Application of biogas on farm internal combustion engine. InRenewable Energy Resources: International Progress, Veziroglu, T.N. (Ed.).Amsterdam: Elsevier Science. Part B, pp. 69-86.Kanagaratnam, J.; Lai, A.L.; Lim, P.; and Wood, B.1. 1981. Application methodsof digested palm oil mill effluent in relation to land characteristics and oil palmcrop. In Proceedings of National Workshop on Oil Palm By-Product Utilisation,Kuala Lumpur, Malaysia. Bangi: Palm Oil Research Institute of Malaysia. pp. 1622.
Quah, S.K.; Lim, K.H.; Gillies, D.; Wood, B.1.; and Kanagaratnam, J. 1982. SimeDarby POME treatment and land application systems. Regional Workshop onPalm Oil Mill Technology and Ejjluent Treatment. Kuala Lumpur, Malaysia.Lai, A.L.; Lim, K.H.; Wood, B.1.; and Kanagaratnam, J. 1982. Design and
operating approaches to land application of palm oil mill effluent on majorplantation crops. In Technology, Utilization and Management of AgriculturalWastes, Salam, S.A.; and Abang Abdullah, A.A. (Eds.). Serdang: UniversitiPertanian Malaysia. pp. 199-211.Lim, K.H.; Wood, B.1.; Lai, A.L.; Wan Sulaiman, W.H.; and Mohamed, S. 1983.Land application of digested POME supernatant on oil palm using a flatbed
20-77
system. Seminar on Land Application of Palm Oil and Rubber Factory Effluents,Kuala Lumpur, Malaysia.
[26] Lim, C.H.; P'ng, T.C.; Chan, K.W.; and Chooi, S.Y. 1983. Land application ofdigested palm oil mill effluent (POME) by sprinkler system. Seminar on LandApplication of Palm Oil and Rubber Factory Effluents. Kuala Lumpur, Malaysia.
[27] Yeow, K.H.; and Yeop, A.K. 1983. The present status of effluent utilisation inMalaysia. In Proceedings of RRIM Planters' Conference 1983. Kuala Lumpur,Malaysia. Kuala Lumpur: Rubber Research Institute of Malaysia. pp. 347-367.
[28] Metcalf & Eddy 1991. Wastewater Engineering: Treatment, Disposal and Reuse,Tchobanoglous, G.; and Burton, F.L. (Eds.). New York: McGraw-HilI. p.826.
[29] Constant, M.; Naveau, H.; Ferrero, G.-L.; and Nyns, E.-J. 1989. Biogas End-Usein the European Community. London: Elsevier Applied Science. p. 18.
[30] Salam, B.A. 1985. The contribution of the oil palm by-products towards thenational energy policy - an economist point of view. In Proceedings of theNational Symposium on Oil Palm By-Products for Agro-based Industries, KualaLumpur, Malaysia. Bangi: Palm Oil Research Institute of Malaysia. pp. 133-145.
[31] Department of Electricity and Gas Supply Malaysia .2000. Statistics of ElectricitySupply Industry in Malaysia, 2000 Edition.
[32] Dansk Energi Management A/S .2000. Support to the Development of a Strategyfor Renewable Energy as the Fifth Fuel in Malaysia. Economic Planning Unit,Prime Minister's Department Malaysia. Output 1: Short Draft Background Paper.
[33] Ministry of Science, Technology and the Environment Malaysia .2000. MalaysiaInitial National Communication Submitted to the United Nations FrameworkConvention on Climate Change.
[34] Ministry of Energy, Communications and Multimedia Malaysia .2000. NationalEnergy Balance Malaysia (1980-1999).
20-78
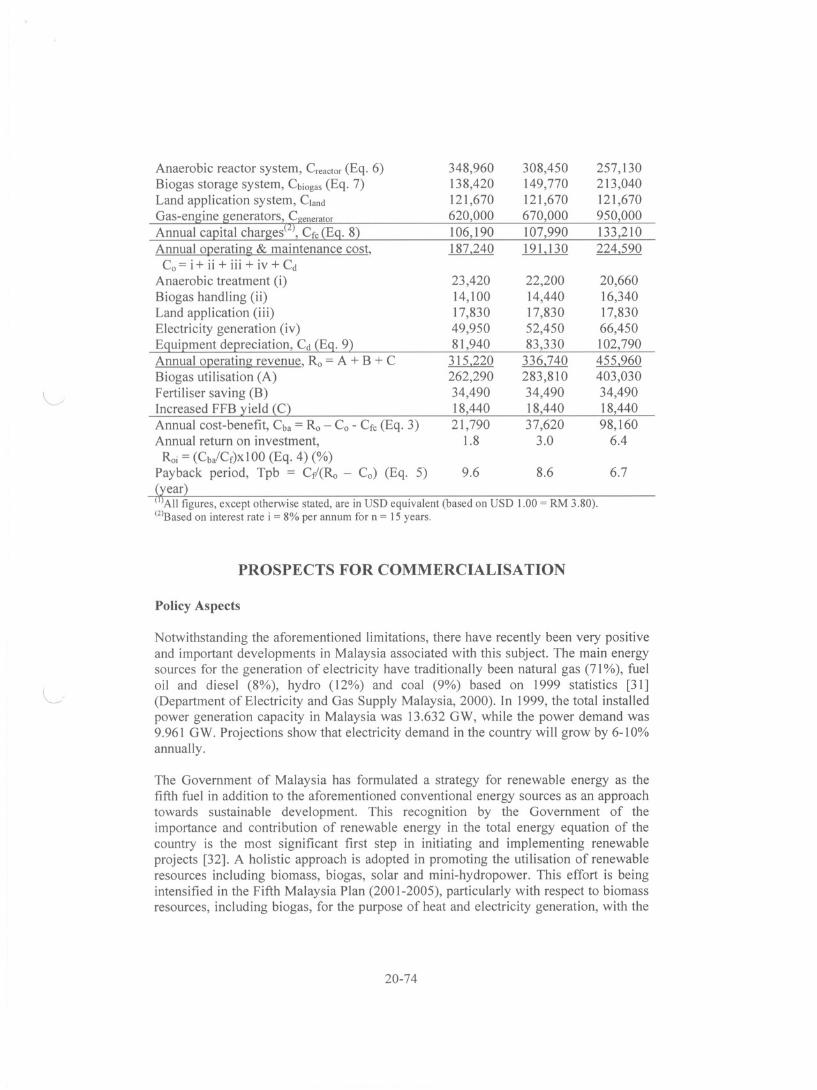
(
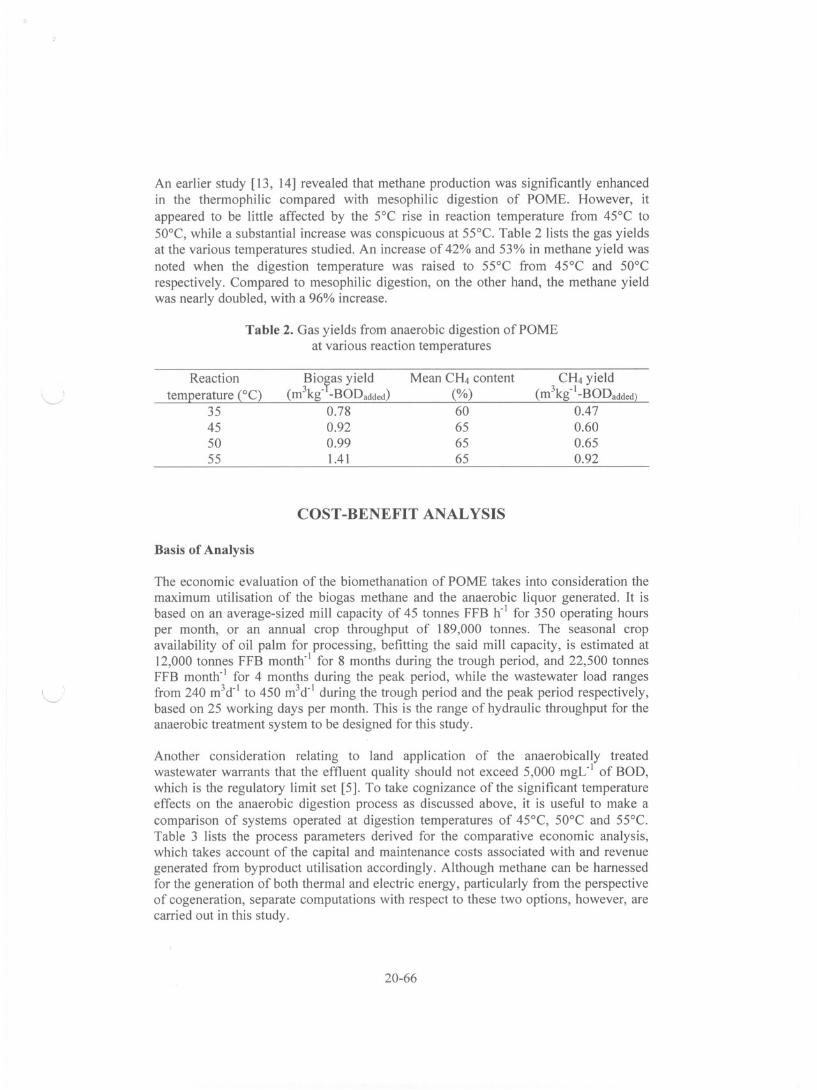
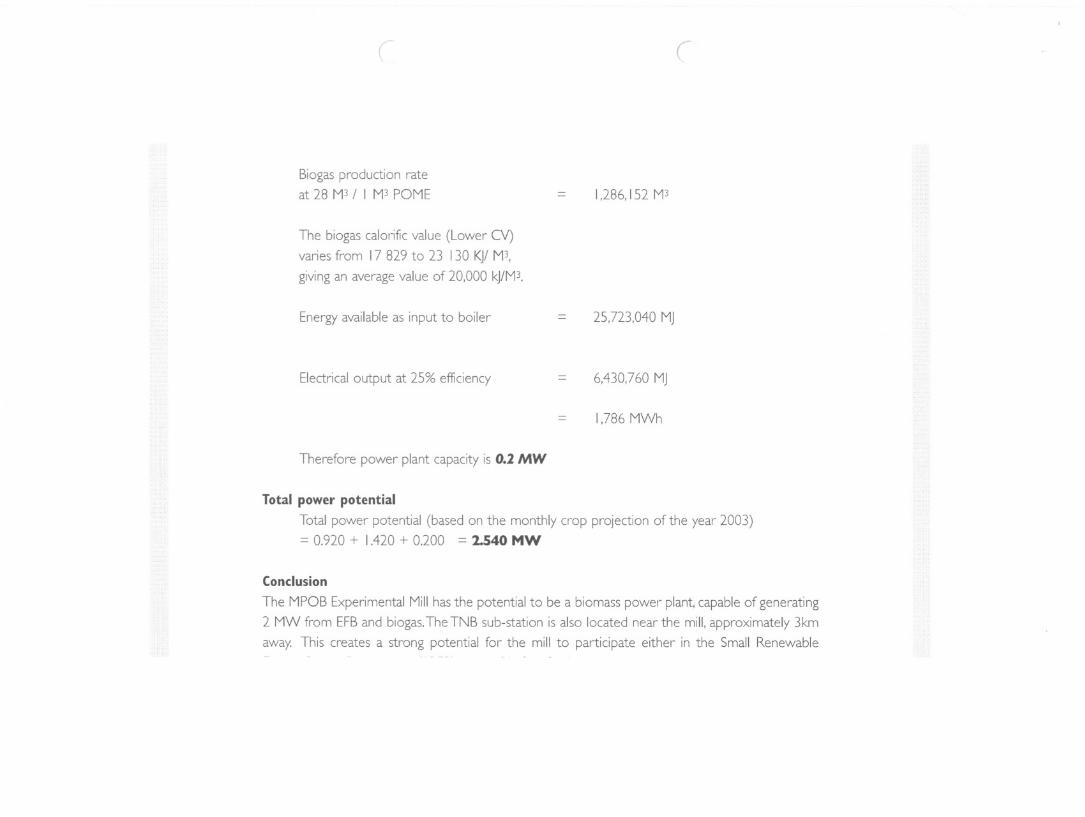
Biogas production rate
at 28 M3 / I M3 POME
The biogas calol-ific value (Lower CV)
varies from 17 829 to 23 130 KJ! M3,
giving an average value of 20,000 1~/M3,
Energy available as input to boiler
Electrical output at 25% efficiency
=
=
=
1,286,152 M3
25,723,040 MJ
6,430,760 MJ
(
Thet-efore power plant capacity is 0.2 MW
= I,786 MWh
Total power potential
Total power potential (based on the monthly cmp projection of the year 2003)
= 0.920 + 1.420 + 0.200 = 2.540 MW
Conclusion
The MPOB Experimental Mill has the potential to be a biomass powet- plant, capable of generating
2 MW fmm EFB and biogas. The TNB sub-station is also located near the mill, approximately 3km
away. This creates a stmng potential for- the mill to participate either in the Small Renewable