Available online at www.sciencedirect.com
www.elsevier.com/locate/brainres
b r a i n r e s e a r c h 1 5 6 0 ( 2 0 1 4 ) 3 6 – 4 5
http://dx.doi.org/10.0006-8993 & 2014 Pu
nCorresponding aFax: þ82 2 2072 0806
E-mail address: c
Research Report
Melody effects on ERANm elicited by harmonicirregularity in musical syntax
Chan Hee Kima,b, Sojin Leea,b, June Sic Kimb,c,d, Jaeho Seoli, Suk Won Yif,g,Chun Kee Chunga,b,c,e,h,n
aInterdisciplinary Program in Neuroscience, Seoul National University College of Natural Science, Seoul, Republic of KoreabMEG Center, Department of Neurosurgery, Seoul National University Hospital, Seoul, Republic of KoreacDepartment of Neurosurgery, Seoul National University College of Medicine, Seoul, Republic of KoreadSensory Organ Research Institute, Seoul National University, Seoul, Republic of KoreaeInterdisciplinary Program in Cognitive Science, Seoul National University College of Humanities, Seoul, Republic of KoreafDepartment of Music, The Graduate School Seoul National University, Seoul, Republic of KoreagWestern Music Research Institute, Seoul National University, Seoul, Republic of KoreahDepartment of Brain and Cognitive Science, Seoul National University College of Natural Science, Seoul, Republic of KoreaiImaging Language Group, Brain Research Unit, O. V. Lounasmaa Laboratory, Aalto University School of Science, FI-00076 Aalto, Finland
a r t i c l e i n f o
Article history:
Accepted 25 February 2014
Recent studies have reported that early right anterior negativity (ERAN) and its magnetic
counterpart (ERANm) are evoked by harmonic irregularity in Western tonal music; however,
Available online 4 March 2014
Keywords:
Musical syntax
Chord progression
Melody
ERANm
Magnetoencephalography
1016/j.brainres.2014.02.04blished by Elsevier B.V.
uthor at: MEG Center, [email protected] (C.K. Ch
a b s t r a c t
those studies did not control for differences of melody. Because melody and harmony have an
interdependent relationship and because melody (in this study melody is represented by the
highest voice part) in a chord sequence may dominate, there is controversy over whether ERAN
(or ERANm) changes arise from melody or harmony differences. To separate the effects of
melody differences and harmonic irregularity on ERANm responses, we designed two magne-
toencephalography experiments and behavioral test. Participants were presented with three
types of chord progression sequences (Expected, Intermediate, and Unexpected) with different
harmonic regularities in which melody differences were or were not controlled. In the
uncontrolled melody difference experiment, the unexpected chord elicited a significantly largest
ERANm, but in the controlled melody difference experiment, the amplitude of the ERANm peak
did not differ among the three conditions. However, ERANm peak latency was delayed more
than that in the uncontrolled melody difference experiment. The behavioral results show the
difference between the two experiments even if harmonic irregularity was discriminated in the
uncontrolled melody difference experiment. In conclusion, our analysis reveals that there is a
relationship between the effects of harmony and melody on ERANm. Hence, we suggest that a
5
oul National University Hospital, 101 Daehak-no, Jongno, Seoul 110-744, Republic of Korea.
ung).
b r a i n r e s e a r c h 1 5 6 0 ( 2 0 1 4 ) 3 6 – 4 5 37
melody difference in a chord progression is largely responsible for the observed changes in
ERANm, reaffirming that melody plays an important role in the processing of musical syntax.
& 2014 Published by Elsevier B.V.
1. Introduction
Many event-related potential (ERP) and event-related fieldstudies have investigated how the brain processes musicalsyntax in Western tonal music. Irregular chords, whichviolate harmonic progression rules in musical syntax, elicita specific neural response called early right anterior negativ-ity (ERAN) in the bilateral inferior frontal gyri (IFG) (Kim et al.,2011; Koelsch et al., 2000; Maess et al., 2001). Although ERANis generally lateralized to the right hemisphere, when alistener does not directly attend to stimuli, there is nosignificant lateralization and a relatively low amplituderesponse (Koelsch et al., 2001, 2002c). The amplitude of ERANis highest 150–250 ms after irregular chord onset, is generallyfollowed by a peak at 500–550 ms (i.e., an N5 peak), and iselicited by harmonic irregularity in bilateral hemispheres(Koelsch et al., 2001, 2002a, 2002b; Koelsch and Jentschke,2010). ERAN occurs in response to both out-of-key and in-keychords (Koelsch et al., 2007; Koelsch and Jentschke, 2008) andis elicited irrespective of tonality, which is gradually estab-lished as the musical context is recognized (Leino et al., 2007).In magnetoencephalography (MEG) studies, ERAN's magneticcounterpart (ERANm) responses tend to be larger for chordsthat are less expected or have lower conditional probability(Kim et al., 2011). Thus, ERAN and ERANm have beenassociated with harmonic irregularity in musical syntax.
Some studies have reported that “wrong” notes in anunfamiliar melody evoke ERP, similar to that evoked byunexpected chords (Besson and Macar, 1987; Besson et al.,1994; Besson and Faita, 1995; Brattico et al., 2006; Carrus et al.,2013; Nittono et al., 2000; Verleger, 1990). In addition, anunexpected tone in a melody can also evoke ERAN. Koelschand Jentschke (2010) reported that ERAN was elicited by bothirregular chords and irregular tone in the melody of thehighest voice in a chord sequence. Based on these previousstudies, it appears that ERAN and ERANm is reflective of allharmonic and melodic irregularities in musical syntax.
Harmony and melody, important factors in musical syn-
tax, have an interdependent relationship in Western tonal
music (Tompson, 1993). Through the features of melody,
listeners perceive the grouping structure, tonality, melodic
contour, and implied harmony in a musical phrase (Patel,
2008). ‘Chord sequences are also important in melody percep-
tion, in which the chords are implied by important melody
tones rather than as explicitly played tones’ (Patel, 2008).
Thus, listeners can perceive harmonic function in a melody
when they listen to the melody of the highest voice in a
harmonic progression, and they may pay more attention to
that highest voice. As a result, a difference in melody in the
highest voice can be an additional factor influencing the
perception of harmonic progression. This is a critical issue
because the stimuli in some previous studies included
inappropriate chords, but insufficiently considered differ-ences in melody in the highest voice. A harmonic progressionis comprised of multiple voice parts and is accompanied byprime melodies of the highest voice, typically the mostnoticeably perceived voice (Fujioka et al., 2005; Marie andTrainor, 2012). For this reason, there is a high probability thatERAN can result from both irregular chord function anddifferences in the highest voice in a chord progression, i.e.,melody. Moreover, melodic information that is sung is moreconcrete than harmonic information (Koelsch and Jentschke,2010), thus, melody may have a greater effect on ERAN thanthat from irregular chords. In this study, the term melodyrepresents the highest voice part of the harmonic sequence;it does not indicate a single tone sequence.
We hypothesized that ERAN changes will be weaker inamplitude and later in latency if the melody difference in thehighest voice part is excluded. To investigate how ERANmwith a melody difference in a chord progression differs fromERANm with a consistent melody, we conducted two MEGexperiments (Experiment 1, with melody difference; andExperiment 2, without melody difference). In those experi-ments, we used three types of chord progressions to repre-sent three levels of chord incongruity (Expected, Intermediate,and Unexpected conditions).
2. Results
2.1. Source estimation
In each experiment, the four dipoles in the individual parti-cipants were localized in Heschl's gyri (HG) and the IFG inboth hemispheres (Table 1). There were no significant differ-ences in the locations of the HG and IFG dipoles between thetwo experiments (in all cases, p40.05). In both experiments,we assume that the estimated dipole locations refer toactivities occurring in the same brain area. The IFG dipoleswere located farther anterior and more superior to those inthe HG (Kim et al., 2011; Maess et al., 2001).
2.2. Effects of the irregular harmonic progressions onERANm in the presence or absence of melody differences
The times of interest for ERANm1 and ERANm2 in eachexperiment are shown in Figs. 1 and 2. The latent periodsfor ERANm1 and ERANm2 were shorter in Experiment 1 thanin Experiment 2. In the bilateral hemisphere, the ERANm1
and ERANm2 periods in Experiment 1 were approximately35 ms and 115 ms, respectively, shorter than those in Experi-ment 2. The maximum ERANm1 and ERANm2 peaks wereelicited at approximately 145 ms and 225 ms in Experiment 1and at 180 ms and 340 ms in Experiment 2. Thus, the ERANm1
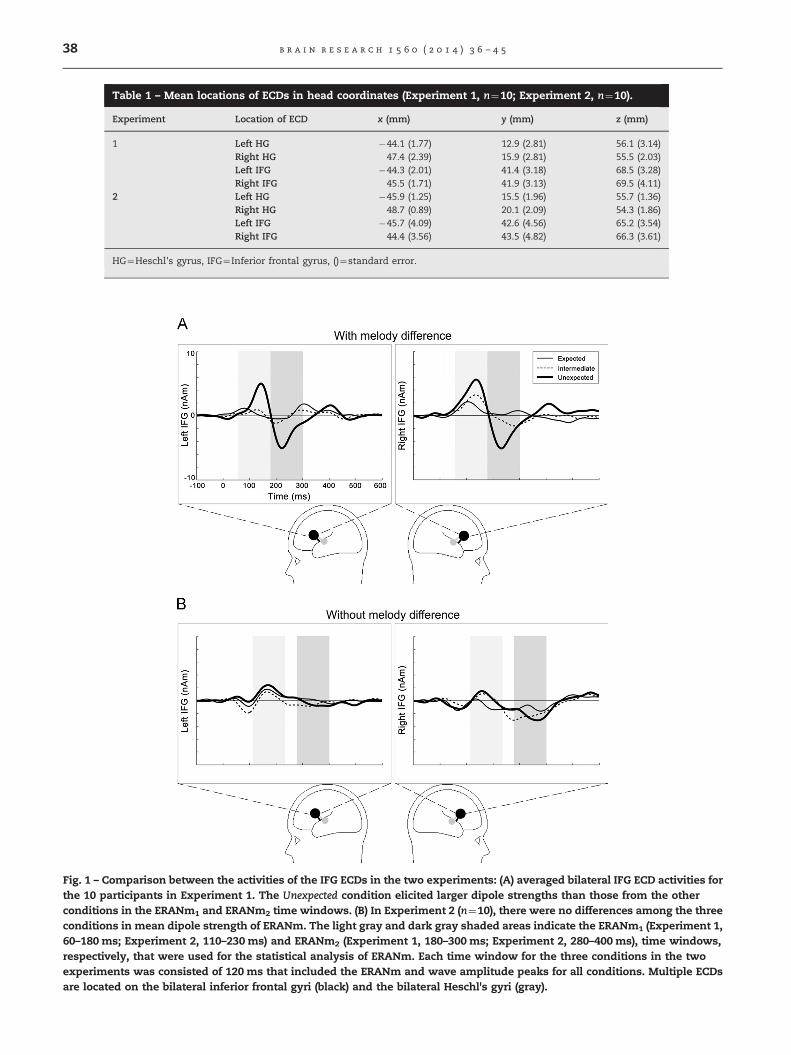
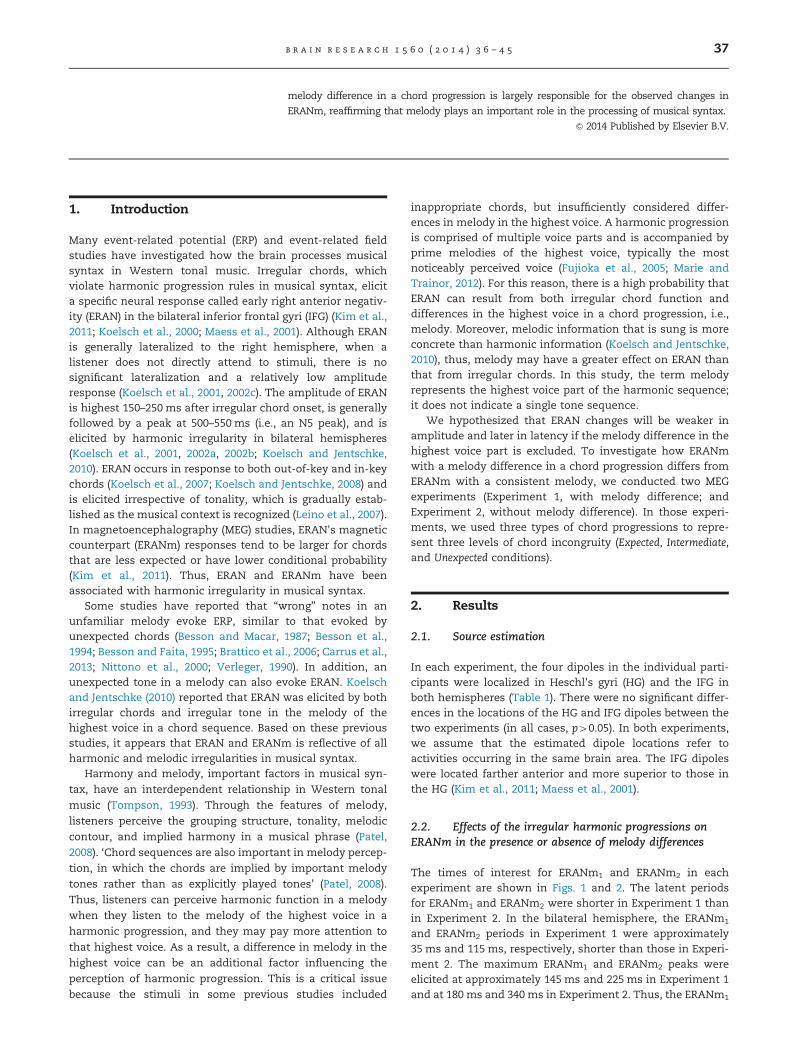
Fig. 1 – Comparison between the activities of the IFG ECDs in the two experiments: (A) averaged bilateral IFG ECD activities forthe 10 participants in Experiment 1. The Unexpected condition elicited larger dipole strengths than those from the otherconditions in the ERANm1 and ERANm2 time windows. (B) In Experiment 2 (n¼10), there were no differences among the threeconditions in mean dipole strength of ERANm. The light gray and dark gray shaded areas indicate the ERANm1 (Experiment 1,60–180 ms; Experiment 2, 110–230 ms) and ERANm2 (Experiment 1, 180–300 ms; Experiment 2, 280–400 ms), time windows,respectively, that were used for the statistical analysis of ERANm. Each time window for the three conditions in the twoexperiments was consisted of 120 ms that included the ERANm and wave amplitude peaks for all conditions. Multiple ECDsare located on the bilateral inferior frontal gyri (black) and the bilateral Heschl's gyri (gray).
Table 1 – Mean locations of ECDs in head coordinates (Experiment 1, n¼10; Experiment 2, n¼10).
Experiment Location of ECD x (mm) y (mm) z (mm)
1 Left HG �44.1 (1.77) 12.9 (2.81) 56.1 (3.14)Right HG 47.4 (2.39) 15.9 (2.81) 55.5 (2.03)Left IFG �44.3 (2.01) 41.4 (3.18) 68.5 (3.28)Right IFG 45.5 (1.71) 41.9 (3.13) 69.5 (4.11)
2 Left HG �45.9 (1.25) 15.5 (1.96) 55.7 (1.36)Right HG 48.7 (0.89) 20.1 (2.09) 54.3 (1.86)Left IFG �45.7 (4.09) 42.6 (4.56) 65.2 (3.54)Right IFG 44.4 (3.56) 43.5 (4.82) 66.3 (3.61)
HG¼Heschl's gyrus, IFG¼ Inferior frontal gyrus, ()¼standard error.
b r a i n r e s e a r c h 1 5 6 0 ( 2 0 1 4 ) 3 6 – 4 538
Fig. 2 – Difference waveforms for the Unexpected condition in the two experiments: (A) difference waveforms in Experiments 1and 2 are presented as black and gray solid lines, respectively. All waveforms were calculated from the values obtained bysubtracting Expected from Unexpected condition values. Peak amplitudes of ERANm were larger in the bilateral IFG inExperiment 1 than those in Experiment 2. In Experiment 2, ERANm latency was slower than that in Experiment 1. Thepresence of ERANm is denoted by bold arrows in Experiment 1 and by thin arrows in Experiment 2. An inverse triangledenotes the late negativity peak following ERANm. In Experiment 1, two ERANm peaks were observed, one at �145 ms(ERANm1) and the second at �225 ms (ERANm2). In Experiment 2, these two peaks were delayed by �35 ms and �115 ms,respectively, and occurred at �180 ms and �340 ms, respectively. (B) The black solid and black dotted lines representdifference waveforms in the left and right hemispheres, respectively. The waveforms were calculated from the valuesobtained by subtracting Expected from Unexpected values. The light gray and dark gray shaded areas indicate areas equal to theduration of the waveform time window (Fig. 1). The peak amplitudes of ERANm in both hemispheres in the two experimentswere similar.
b r a i n r e s e a r c h 1 5 6 0 ( 2 0 1 4 ) 3 6 – 4 5 39
and ERANm2 time windows in Experiment 2 were later thanthose in Experiment 1: 60–180 ms and 180–300 ms, respec-tively, in Experiment 1 and 110–230 ms and 280–400 ms,respectively, in Experiment 2 (Figs. 1 and 2B).
The amplitude of the ERANm peak was affected by both
condition and melody differences. The 2-way ANOVA
results indicate that the effects of chord function were
significant on both ERANm1 (F2, 76¼8.095, po0.001) and
ERANm2 (F2, 76¼5.433, p¼0.006). However, the interaction
between the two factors (chord function and experiment)
was different (ERANm1, F2, 76¼3.317, p¼0.042; ERANm2, F2,
76¼6.04, p¼0.004). The experiment effect was not significant
(ERANm1, F2, 38¼0.344, p¼0.919; ERANm2, F2, 38¼3.692,
p¼0.062). In our analysis of the 2-way ANOVA results, we
found that the chord condition effects were significant, but
only in Experiment 1 (ERANm1, F2, 38¼9.402, p¼0.001;
ERANm2, F2, 38¼13.469, po0.001) (Fig. 3). Among the com-
parisons of each chord condition, only the differences
between the Unexpected condition and the other conditions
were significant; Expected and Unexpected conditions
(ERANm1, p¼0.015; ERANm2, p¼0.001), Intermediate and
Unexpected conditions (ERANm1, p¼0.001; ERANm2,
p¼0.005). There was no significant difference between
Expected and Intermediate conditions (ERANm1 and ERANm2,p40.99). In Experiment 2, differences in chord condition onERANm were not detected (ERANm1, F2, 38¼0.686, p¼0.510;ERANm2, F2, 38¼0.117, p¼0.891). After expiry of the ERANmtime window, we observed a late negativity peak latency of350–600 ms, similar to the N5 latency reported in previousstudies (Jentschke and Koelsch, 2009; Koelsch et al., 2002c;Koelsch and Jentschke, 2010). Late negativity peak latencyin the Experiment 2 time window was 50 ms later than thatin Experiment 1. The effects of chord condition for theselate negativity peaks were significant, but only in Experi-ment 1 (F2, 38¼7.79, p¼0.001). Moreover, the differencebetween chord conditions was only significant for compar-isons of the Expected and Intermediate conditions with theUnexpected chord condition (Expected and Unexpected condi-tions, p¼0.009; Intermediate and Unexpected conditions,p¼0.026; Expected and Intermediate, p¼0.025).
2.3. Behavioral test
2.3.1. CorrectnessIn Experiment 1, participants responded correctly 91% of thetime for all three conditions (mean correct rate, 94.91%).
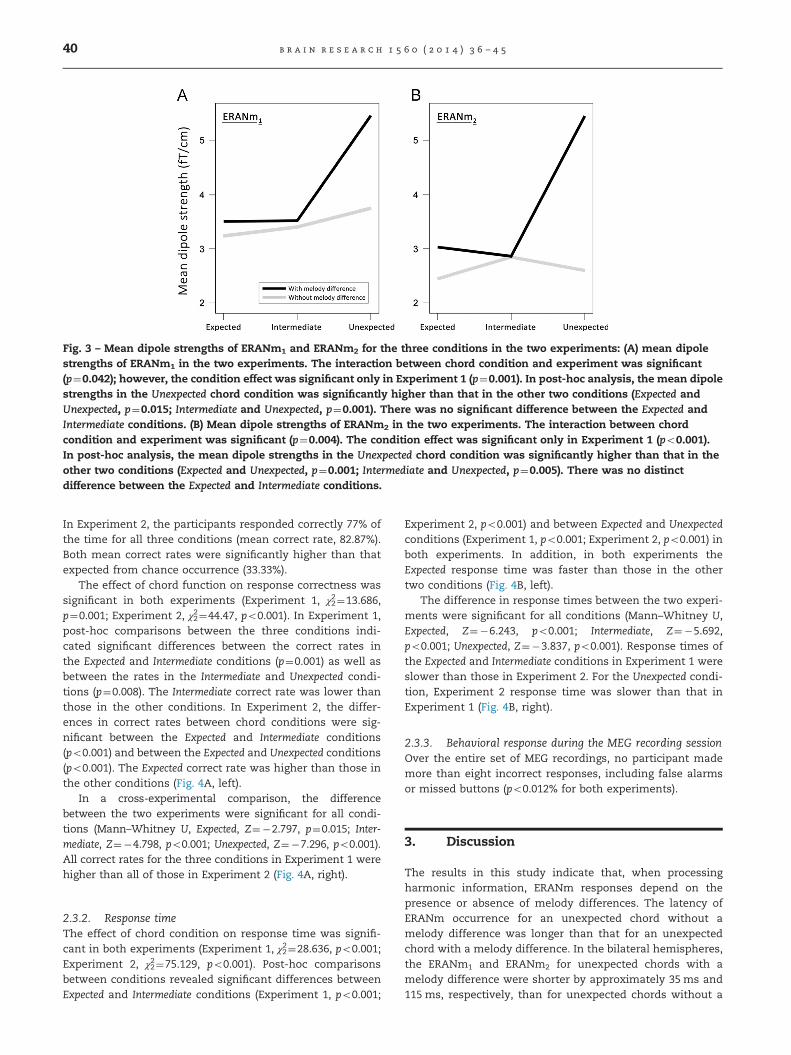
Fig. 3 – Mean dipole strengths of ERANm1 and ERANm2 for the three conditions in the two experiments: (A) mean dipolestrengths of ERANm1 in the two experiments. The interaction between chord condition and experiment was significant(p¼0.042); however, the condition effect was significant only in Experiment 1 (p¼0.001). In post-hoc analysis, the mean dipolestrengths in the Unexpected chord condition was significantly higher than that in the other two conditions (Expected andUnexpected, p¼0.015; Intermediate and Unexpected, p¼0.001). There was no significant difference between the Expected andIntermediate conditions. (B) Mean dipole strengths of ERANm2 in the two experiments. The interaction between chordcondition and experiment was significant (p¼0.004). The condition effect was significant only in Experiment 1 (po0.001).In post-hoc analysis, the mean dipole strengths in the Unexpected chord condition was significantly higher than that in theother two conditions (Expected and Unexpected, p¼0.001; Intermediate and Unexpected, p¼0.005). There was no distinctdifference between the Expected and Intermediate conditions.
b r a i n r e s e a r c h 1 5 6 0 ( 2 0 1 4 ) 3 6 – 4 540
In Experiment 2, the participants responded correctly 77% ofthe time for all three conditions (mean correct rate, 82.87%).Both mean correct rates were significantly higher than thatexpected from chance occurrence (33.33%).
The effect of chord function on response correctness wassignificant in both experiments (Experiment 1, χ22¼13.686,p¼0.001; Experiment 2, χ22¼44.47, po0.001). In Experiment 1,post-hoc comparisons between the three conditions indi-cated significant differences between the correct rates inthe Expected and Intermediate conditions (p¼0.001) as well asbetween the rates in the Intermediate and Unexpected condi-tions (p¼0.008). The Intermediate correct rate was lower thanthose in the other conditions. In Experiment 2, the differ-ences in correct rates between chord conditions were sig-nificant between the Expected and Intermediate conditions(po0.001) and between the Expected and Unexpected conditions(po0.001). The Expected correct rate was higher than those inthe other conditions (Fig. 4A, left).
In a cross-experimental comparison, the differencebetween the two experiments were significant for all condi-tions (Mann–Whitney U, Expected, Z¼�2.797, p¼0.015; Inter-mediate, Z¼�4.798, po0.001; Unexpected, Z¼�7.296, po0.001).All correct rates for the three conditions in Experiment 1 werehigher than all of those in Experiment 2 (Fig. 4A, right).
2.3.2. Response timeThe effect of chord condition on response time was signifi-cant in both experiments (Experiment 1, χ22¼28.636, po0.001;Experiment 2, χ22¼75.129, po0.001). Post-hoc comparisonsbetween conditions revealed significant differences betweenExpected and Intermediate conditions (Experiment 1, po0.001;
Experiment 2, po0.001) and between Expected and Unexpectedconditions (Experiment 1, po0.001; Experiment 2, po0.001) inboth experiments. In addition, in both experiments theExpected response time was faster than those in the othertwo conditions (Fig. 4B, left).
The difference in response times between the two experi-ments were significant for all conditions (Mann–Whitney U,Expected, Z¼�6.243, po0.001; Intermediate, Z¼�5.692,po0.001; Unexpected, Z¼�3.837, po0.001). Response times ofthe Expected and Intermediate conditions in Experiment 1 wereslower than those in Experiment 2. For the Unexpected condi-tion, Experiment 2 response time was slower than that inExperiment 1 (Fig. 4B, right).
2.3.3. Behavioral response during the MEG recording sessionOver the entire set of MEG recordings, no participant mademore than eight incorrect responses, including false alarmsor missed buttons (po0.012% for both experiments).
3. Discussion
The results in this study indicate that, when processingharmonic information, ERANm responses depend on thepresence or absence of melody differences. The latency ofERANm occurrence for an unexpected chord without amelody difference was longer than that for an unexpectedchord with a melody difference. In the bilateral hemispheres,the ERANm1 and ERANm2 for unexpected chords with amelody difference were shorter by approximately 35 ms and115 ms, respectively, than for unexpected chords without a
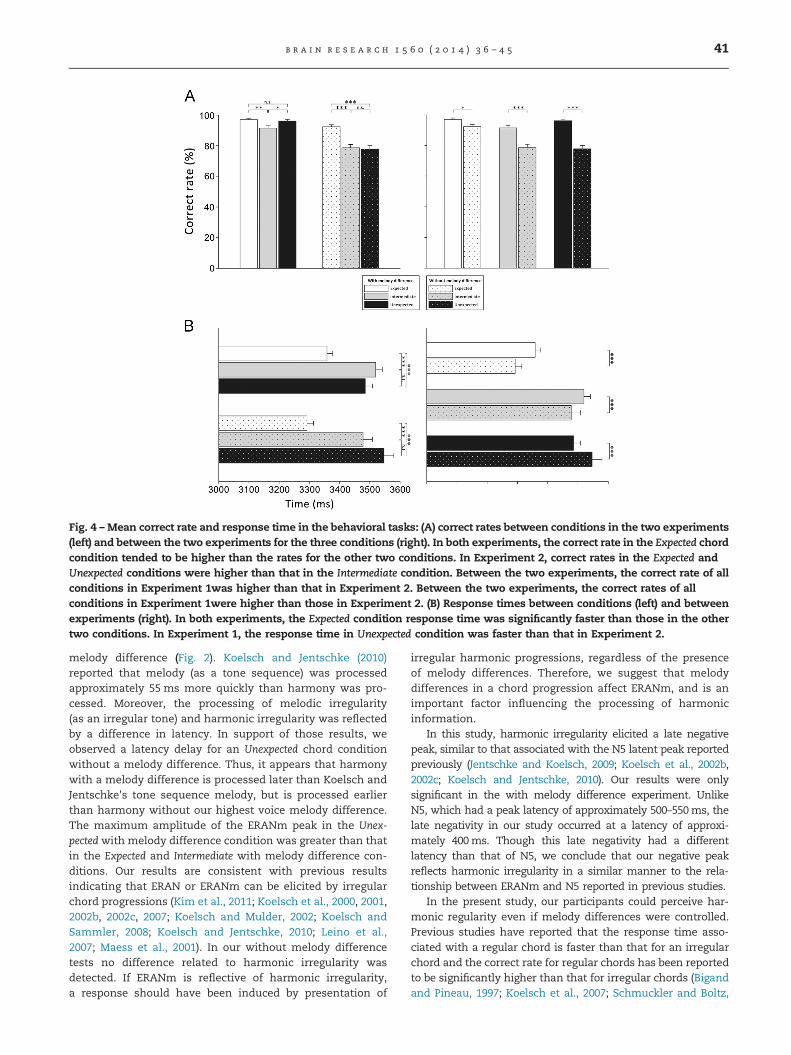
Fig. 4 – Mean correct rate and response time in the behavioral tasks: (A) correct rates between conditions in the two experiments(left) and between the two experiments for the three conditions (right). In both experiments, the correct rate in the Expected chordcondition tended to be higher than the rates for the other two conditions. In Experiment 2, correct rates in the Expected andUnexpected conditions were higher than that in the Intermediate condition. Between the two experiments, the correct rate of allconditions in Experiment 1was higher than that in Experiment 2. Between the two experiments, the correct rates of allconditions in Experiment 1were higher than those in Experiment 2. (B) Response times between conditions (left) and betweenexperiments (right). In both experiments, the Expected condition response time was significantly faster than those in the othertwo conditions. In Experiment 1, the response time in Unexpected condition was faster than that in Experiment 2.
b r a i n r e s e a r c h 1 5 6 0 ( 2 0 1 4 ) 3 6 – 4 5 41
melody difference (Fig. 2). Koelsch and Jentschke (2010)reported that melody (as a tone sequence) was processedapproximately 55 ms more quickly than harmony was pro-cessed. Moreover, the processing of melodic irregularity(as an irregular tone) and harmonic irregularity was reflectedby a difference in latency. In support of those results, weobserved a latency delay for an Unexpected chord conditionwithout a melody difference. Thus, it appears that harmonywith a melody difference is processed later than Koelsch andJentschke's tone sequence melody, but is processed earlierthan harmony without our highest voice melody difference.The maximum amplitude of the ERANm peak in the Unex-pected with melody difference condition was greater than thatin the Expected and Intermediate with melody difference con-ditions. Our results are consistent with previous resultsindicating that ERAN or ERANm can be elicited by irregularchord progressions (Kim et al., 2011; Koelsch et al., 2000, 2001,2002b, 2002c, 2007; Koelsch and Mulder, 2002; Koelsch andSammler, 2008; Koelsch and Jentschke, 2010; Leino et al.,2007; Maess et al., 2001). In our without melody differencetests no difference related to harmonic irregularity wasdetected. If ERANm is reflective of harmonic irregularity,a response should have been induced by presentation of
irregular harmonic progressions, regardless of the presenceof melody differences. Therefore, we suggest that melodydifferences in a chord progression affect ERANm, and is animportant factor influencing the processing of harmonicinformation.
In this study, harmonic irregularity elicited a late negativepeak, similar to that associated with the N5 latent peak reportedpreviously (Jentschke and Koelsch, 2009; Koelsch et al., 2002b,2002c; Koelsch and Jentschke, 2010). Our results were onlysignificant in the with melody difference experiment. UnlikeN5, which had a peak latency of approximately 500–550ms, thelate negativity in our study occurred at a latency of approxi-mately 400ms. Though this late negativity had a differentlatency than that of N5, we conclude that our negative peakreflects harmonic irregularity in a similar manner to the rela-tionship between ERANm and N5 reported in previous studies.
In the present study, our participants could perceive har-monic regularity even if melody differences were controlled.Previous studies have reported that the response time asso-ciated with a regular chord is faster than that for an irregularchord and the correct rate for regular chords has been reportedto be significantly higher than that for irregular chords (Bigandand Pineau, 1997; Koelsch et al., 2007; Schmuckler and Boltz,
b r a i n r e s e a r c h 1 5 6 0 ( 2 0 1 4 ) 3 6 – 4 542
1994). Our Expected condition (tonic chord function) produced ahigher correct rate and a faster response time than those in theIntermediate and Unexpected conditions (Fig. 4). Our results showthat a longer period is needed to process unexpected or lessexpected chord progressions, which is consistent with theresults in previous studies.
From our results, we infer that the high correct rateassociated with the Unexpected condition with melody differ-ence might only result from the presentation of a differentmelody (Fa). In the Unexpected chord condition, in which themelody difference between and within experiments wasclearly presented (i.e., Fa was different from Mi, the highestvoice note of the other conditions in Experiment 1and was alsodifferent from Do in Experiment 2), the correct rate was higherand the response time with melody difference was faster thanthat without melody difference. In other words, more time isneeded to perceive unexpected chord progressions without amelody difference than that with a melody difference. Further-more, the correct rates and response times in the two experi-ments were significantly different in the other experimentalconditions, thus revealing a difference in chord perceptionthat is associated with the presence of a melody difference.
The ERANm responses differed depending on whether thechord sequences were presented with or without melodydifferences. Our behavioral results also revealed differencesthat depended on melody difference; however, harmonic irre-gularity perception was possible even when listening to a chordprogression with a controlled melody difference. Even if bothERAN and N5 can be elicited preattentively, that is, even whenamusical stimulus has been ignored (Koelsch et al., 2001, 2002c;Maidhof and Koelsch, 2011), ERANm in our present studyreflected a harmonic irregularity in a chord sequence withmelody difference. We suggest that the irregularity in harmonicfunction, regardless of the presence of a melody difference,likely elicits brain responses other than ERANm or, alterna-tively, it likely involves brain areas other than the inferiorfrontal gyri, such as the superior temporal gyrus. In support ofour suggestion, recent intracranial study results (Sammleret al., 2013) point to the additional role of the superior temporalgyrus in the generation of the ERAN response.
In the without melody difference experiment, even thoughthe Unexpected and Expected conditions showed similar latencyin the bilateral IFG, the ERANm amplitude was larger in theright hemisphere (Fig. 2A). The right IFG is related to theprocessing or working memory of pitch (Zatorre and Samson,1991; Zatorre et al., 1994, 2002), and ERAN is lateralized to thathemisphere. On that basis, it could be inferred that distinctdifferences in ERANm could be observed if sample size isincreased and if the contrast between stimuli is controlled byonly two factors: regular and irregular chord sequences.
To eliminate melody differences in the with melodydifference experiment, we needed an unexpected chord thatcontained a note that was common with the other twoconditions. Instead of using a supertonic chord in the melodydifference experiment, we chose to use another irregularchord, the subdominant chord (Bigand et al., 2001; Koelschand Jentschke, 2008; Regnault et al., 2001). Because thesupertonic and subdominant chords are classified as havingpredominant functions in music theory (Murphy andStringham, 1951) and as their conditional probabilities are
similar, we conclude that the loss of ERANm in our experi-ment did not result from a functional difference between thesubdominant and supertonic chords. Nevertheless, we donote that the Unexpected conditions in our two experimentsare not perfectly comparable. Additionally, the highest voicein the Unexpected conditions for the with- and without-melody difference experiments were not identical. Consider-ing that a tonic is needed to establish tonality in a key, thetonic (Do) of a subdominant chord is more expected than thesubdominant (Fa) of a supertonic chord (Krumhansl, 1979).Finally, we will review our present study's limitations and, byundertaking further study, identify the brain responses thatreflect musical syntactic processing in terms of harmonicprogressions in the absence of the effects of the tonic andmelody differences.
In conclusion, our results suggest a relationship betweenharmonic function and melody have effects on ERANm. In thisstudy, we tried to separate the effects of melody differencesand harmonic irregularities on ERANm responses, and foundthat ERANm1 and ERANm2 in the Unexpected condition with amelody difference did reveal distinct peaks, however, it wasnot significant when melody difference was controlled. Withregard to subject behavior, the subject's perception of harmo-nic regularity was disturbed by the absence of melody. More-over, even if the subject could perceive harmony, regardless ofthe presence of a melody difference, their ERANm responsesdid not accurately reflect the perceived harmonic regularity.Hence, we suggest that melody differences in chord progres-sions are largely responsible for prominent ERANm responses.Our results affirm that melody plays an important role in theprocessing of musical syntax.
4. Experimental procedures
4.1. Participants
The present study was undertaken as two separate experi-ments, Experiment 1 and Experiment 2. For Experiment 1,we added one musician to the number in our previous study(Kim et al., 2011) (10 musicians; mean age, 24.373.4 years;mean musical training, 17.373.9 years; mean EdinburghHandedness coefficient, 89.1712.1). For Experiment 2, werecruited new musicians (10 musicians; mean age, 24.072.7years; mean musical training, 17.975.2 years; mean EdinburghHandedness coefficient, 86.2712.4). In both experiments, allparticipants were female. The study was approved by theInstitutional Review Board of the Clinical Research Institute,Seoul National University Hospital (IRB no. H-1105-070-362)
4.2. Stimuli
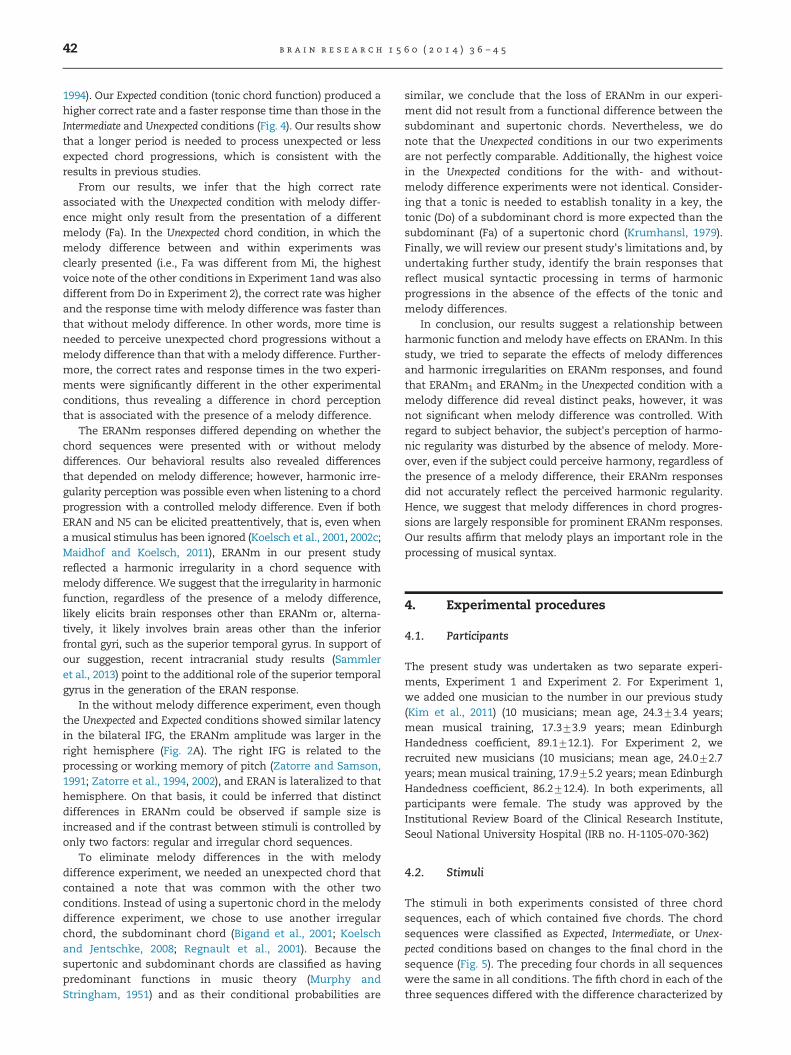
The stimuli in both experiments consisted of three chordsequences, each of which contained five chords. The chordsequences were classified as Expected, Intermediate, or Unex-pected conditions based on changes to the final chord in thesequence (Fig. 5). The preceding four chords in all sequenceswere the same in all conditions. The fifth chord in each of thethree sequences differed with the difference characterized by
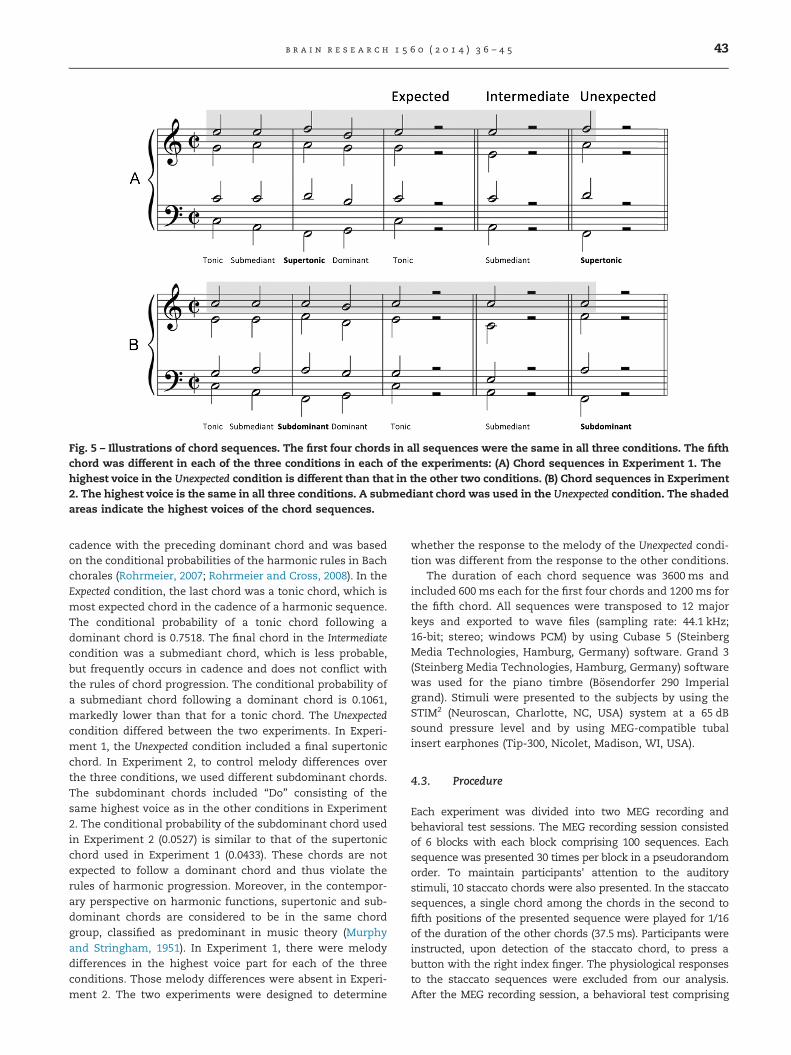
Fig. 5 – Illustrations of chord sequences. The first four chords in all sequences were the same in all three conditions. The fifthchord was different in each of the three conditions in each of the experiments: (A) Chord sequences in Experiment 1. Thehighest voice in the Unexpected condition is different than that in the other two conditions. (B) Chord sequences in Experiment2. The highest voice is the same in all three conditions. A submediant chord was used in the Unexpected condition. The shadedareas indicate the highest voices of the chord sequences.
b r a i n r e s e a r c h 1 5 6 0 ( 2 0 1 4 ) 3 6 – 4 5 43
cadence with the preceding dominant chord and was basedon the conditional probabilities of the harmonic rules in Bachchorales (Rohrmeier, 2007; Rohrmeier and Cross, 2008). In theExpected condition, the last chord was a tonic chord, which ismost expected chord in the cadence of a harmonic sequence.The conditional probability of a tonic chord following adominant chord is 0.7518. The final chord in the Intermediate
condition was a submediant chord, which is less probable,but frequently occurs in cadence and does not conflict withthe rules of chord progression. The conditional probability ofa submediant chord following a dominant chord is 0.1061,markedly lower than that for a tonic chord. The Unexpected
condition differed between the two experiments. In Experi-ment 1, the Unexpected condition included a final supertonicchord. In Experiment 2, to control melody differences overthe three conditions, we used different subdominant chords.The subdominant chords included “Do” consisting of thesame highest voice as in the other conditions in Experiment2. The conditional probability of the subdominant chord usedin Experiment 2 (0.0527) is similar to that of the supertonicchord used in Experiment 1 (0.0433). These chords are notexpected to follow a dominant chord and thus violate therules of harmonic progression. Moreover, in the contempor-ary perspective on harmonic functions, supertonic and sub-dominant chords are considered to be in the same chordgroup, classified as predominant in music theory (Murphyand Stringham, 1951). In Experiment 1, there were melodydifferences in the highest voice part for each of the threeconditions. Those melody differences were absent in Experi-ment 2. The two experiments were designed to determine
whether the response to the melody of the Unexpected condi-tion was different from the response to the other conditions.
The duration of each chord sequence was 3600 ms andincluded 600 ms each for the first four chords and 1200 ms forthe fifth chord. All sequences were transposed to 12 majorkeys and exported to wave files (sampling rate: 44.1 kHz;16-bit; stereo; windows PCM) by using Cubase 5 (SteinbergMedia Technologies, Hamburg, Germany) software. Grand 3(Steinberg Media Technologies, Hamburg, Germany) softwarewas used for the piano timbre (Bösendorfer 290 Imperialgrand). Stimuli were presented to the subjects by using theSTIM2 (Neuroscan, Charlotte, NC, USA) system at a 65 dBsound pressure level and by using MEG-compatible tubalinsert earphones (Tip-300, Nicolet, Madison, WI, USA).
4.3. Procedure
Each experiment was divided into two MEG recording andbehavioral test sessions. The MEG recording session consistedof 6 blocks with each block comprising 100 sequences. Eachsequence was presented 30 times per block in a pseudorandomorder. To maintain participants' attention to the auditorystimuli, 10 staccato chords were also presented. In the staccatosequences, a single chord among the chords in the second tofifth positions of the presented sequence were played for 1/16of the duration of the other chords (37.5 ms). Participants wereinstructed, upon detection of the staccato chord, to press abutton with the right index finger. The physiological responsesto the staccato sequences were excluded from our analysis.After the MEG recording session, a behavioral test comprising
b r a i n r e s e a r c h 1 5 6 0 ( 2 0 1 4 ) 3 6 – 4 544
three blocks was conducted. In each such block, 36 chordsequences were presented in a pseudorandom order. Theparticipants, by using an assigned keypad, responded bypressing a specific button to record which of the three condi-tions they perceived: Button 1 for an Expected chord sequence,button 2 for an Intermediate sequence, or button 3 for anUnexpected sequence condition. The stimuli were presented inthe same manner as that used in the MEG recording session.Each of the conditions was presented 36 times.
4.4. MEG data recording
During testing, participants were seated in an electromagne-tically shielded room. Magnetic fields were recorded at600.615 Hz (online band pass filter of 0.1–200 Hz) by using a306 channel, whole-head MEG (Vector View™ Elekta Neuro-mag Oy, Helsinki, Finland). Vertical and horizontal electro-oculograms (EOG) and electrocardiograms (ECG) were obtainedsimultaneously with the MEG recording. Triggers were used tomark the onset of the each chord in all sequences.
4.5. MEG data processing
To eliminate unexpected signals from external and internalsources, the temporal Signal-Space Separation (tSSS) algo-rithm implemented in MaxFilter (Elekta Neuromag, Helsinki,Finland) software was applied to all raw MEG signal data(Taulu and Simola, 2006; Taulu and Hari, 2009). For theanalysis, we used only the 204 orthogonal planar gradiometerin 102 locations. Each epoch was defined with a peristimulusinterval of between �100 ms and þ600 ms of chord onset.Epochs with eye-blinking or movement artifacts weredetected by visual inspection and excluded during resultaveraging. For each fifth chord in each of the three condi-tions, more than 140 artifact-free epochs were averaged foreach participant. All artifact-free epochs for each first chord(Z540 epochs) were also averaged for each participant.
Source estimation was conducted by using Brain ElectricalSource Analysis software 6 (BESA, Gräfelfing, Germany). Theaveraged MEG signals were band-pass filtered (0.3–25 Hz, zerophase), and multiple equivalent current dipoles (ECDs) wereestimated in each participant as follows. First, we estimatedthe source locations of P2m within a time window 180–190 ms after the onset of the first chord in order to calculatebrain responses to auditory stimuli. The P2m sources werelocalized in the bilateral auditory cortices near HG (Kurikiet al., 2006). Upon obtaining these P2m sources, two ERANmpeak sources—ERANm1 (the earlier peak) and ERANm2 (thelater peak)—were bilaterally estimated in the bilateral IFGwithin a time window approximately 140–250 ms after theonset of the fifth chord. The IFG dipoles were fit to thewaveform of the fifth chords—the grand mean waveform ofthe tonic, submediant, and supertonic chords—in each of thetwo experiments. Goodness of fit (GOF) values exceeded 80%in the two experiments. Finally, we estimated the sourceactivities for each of the three conditions in the bilateral HGand IFG by using a signal-space projection method (Tescheet al., 1995). After the ERANm sources were localized in thebilateral IFG, we determined the time window for use in the
two experiments. The time window for statistical analysiswas adjusted to include a 120 ms time range that included allERANm peak latencies in the waveforms for all conditions(Koelsch and Jentschke, 2008) (Figs. 1 and 2). After thestatistical analysis, the data were 10 Hz low-pass filtered forlegible waveforms (Koelsch et al., 2000, 2002b, 2002c; Koelschet al., 2007; Koelsch and Jentschke, 2008).
4.6. Statistical analysis
Some data were not appropriate for parametric statisticalanalysis because they violated normality and/or equal varianceassumptions. In these cases, we used a nonparametric methodinstead. Friedman tests were performed to analyze the subjects'behavioral data with chord functions as the factor of interest. Inthis test, correct rates and response times were transformed toranked variables and between-condition differences wereassessed by using post-hoc tests with a Bonferroni adjustmentfor multiple comparisons. In addition, the behavioral analysisincluded cross-experimental comparisons of the overall meancorrect rate and response time by using the Mann–Whitney Utest and Bonferroni multiple comparisons adjustment, respec-tively. Through that approach we compared the differencesbetween two experiments for the three experimental condi-tions. The Mann–Whitney U-test was also used to examinegroup differences among the four dipole locations between thetwo experiments. Differences in dipole locations between P2mand ERANmwithin a single subject were examined by using theWilcoxon Matched Pairs Signed-Rank test.
The strengths of ERANm at dipole locations in the bilateralIFG were considered a single ERANm component regardlessof hemisphere because there was no significant differencebetween the left and right IFG dipole strengths (paired t-test;both ERANm1 and ERANm2 in experiments 1 and 2, p40.05).Each time window was chosen to have a 120 ms range, inwhich the ERANm1 and ERANm2 windows did not overlap(Koelsch and Jentschke, 2008, 2010). To test ERANm differ-ences between the two experiments, we conducted a 2-wayrepeated measures ANOVA as a mixed model with onewithin-subject factor (Chord condition) and one between-subjects factor (Experiment). Chord conditions were Expected,Intermediate, and Unexpected, whereas the experiments wereExperiment 1 with melody difference and Experiment 2without melody difference. Post-hoc testing for the threeconditions was adjusted by a Bonferroni multiple comparisoncorrection. Late negativity following ERANm was approxi-mately 350–600 ms. The effects of chord condition in eachexperiment were calculated by using repeated measureANOVA.
All statistical tests were performed by using SPSS 12.0.1software (IBM, Armonk, NY, USA). For all analyses, weconsidered po0.05 as indicative of a significant alpha level.
Acknowledgments
This research was supported by the Basic Science ResearchProgram through the National Research Foundation of Korea(NRF) funded by the Ministry of Science, ICT & Future
b r a i n r e s e a r c h 1 5 6 0 ( 2 0 1 4 ) 3 6 – 4 5 45
Planning (2009-0081342). We would like to thank JiHyangNam for technical support in MEG acquisition.
r e f e r e n c e s
Besson, M., Macar, F., 1987. An event-related potential analysis ofincongruity in music and other non-linguistic contexts.Psychophysiology 24, 14–25.
Besson, M., Faita, F., 1995. An Event-Related Potential (ERP) studyof musical expectancy: comparison of musicians withnonmusicians. J. Exp. Psychol.: Hum. Percept. Perform. 21 (6),1278–1296.
Besson, M., Faita, F., Requin, J., 1994. Brain waves associated withmusical incongruities differ for musicians and non-musicians. Neurosci. Lett. 168, 101–105.
Bigand, E., Pineau, M., 1997. Global context effects on musicalexpectancy. Percept. Psychophys. 59 (7), 1098–1107.
Bigand, E., Tillmann, B., Poulin, B., D’Adamo, D.A., Madurell, F.,2001. The effect of harmonic context on phoneme monitoringin vocal music. Cognition 81 (1), B11–B20.
Brattico, E., Tervaniemi, M., Naatanen, R., Peretz, I., 2006. Musicalscale properties are automatically processed in the humanauditory cortex. Brain Res. 1117 (1), 162–174.
Carrus, E., Pearce, M.T., Bhattacharya, J., 2013. Melodic pitchexpectation interacts with neural responses to syntactic butnot semantic violations. Cortex 49 (8), 2186–2200.
Fujioka, T., Trainor, L.J., Bernhard, R., Ryusuke, K., Christo, P.,2005. Automatic encoding of polyphonic melodies inmusicians and nonmusicians. J. Cogn. Neurosci. 17 (10),1578–1592.
Jentschke, S., Koelsch, S., 2009. Musical training modulates thedevelopment of syntax processing in children. Neuroimage 47(2), 735–744.
Kim, S.G., Kim, J.S., Chung, C.K., 2011. The effect of conditionalprobability of chord progression on brain response: an MEGstudy. PLoS One 6 (2), e17337.
Koelsch, S., Mulder, J., 2002. Electric brain responses toinappropriate harmonies during listening to expressive music.Clin. Neurophysiol. 113 (6), 862–869.
Koelsch, S., Jentschke, S., 2008. Short-term effects of processingmusical syntax: an ERP study. Brain Res. 1212, 55–62.
Koelsch, S., Sammler, D., 2008. Cognitive components of regularityprocessing in the auditory domain. PLoS One 3 (7), e2650.
Koelsch, S., Jentschke, S., 2010. Differences in electric brainresponses to melodies and chords. J. Cogn. Neurosci. 22 (10),2251–2262.
Koelsch, S., Schroger, E., Gunter, T.C., 2002a. Music matters:preattentive musicality of the human brain. Psychophysiology39 (1), 38–48.
Koelsch, S., Schmidt, B.H., Kansok, J., 2002b. Effects of musicalexpertise on the early right anterior negativity: an event-relatedbrain potential study. Psychophysiology 39 (5), 657–663.
Koelsch, S., Gunter, T., Friederici, A.D., Schroger, E., 2000. Brainindices of music processing: “nonmusicians” are musical.J. Cogn. Neurosci 12 (3), 520–541.
Koelsch, S., Jentschke, S., Sammler, D., Mietchen, D., 2007.Untangling syntactic and sensory processing: an ERP study ofmusic perception. Psychophysiology 44 (3), 476–490.
Koelsch, S., Gunter, T.C., Schroger, E., Tervaniemi, M., Sammler, D.,Friederici, A.D., 2001. Differentiating ERAN and MMN: an ERPstudy. Neuroreport 12 (7), 1385–1389.
Koelsch, S., Gunter, T.C., Cramon, D.Y., Zysset, S., Gabriele, L.,Friederici, A.D., 2002c. Bach speaks: a cortical “language-network”serves the processing of music. Neuroimage 17 (2), 956–966.
Krumhansl, J.A., 1979. The psychological representation ofmusical pitch in a tonal context. Cogn. Psychol. 11, 346–374.
Kuriki, S., Kanda, S., Hirata, Y., 2006. Effects of musical experienceon different components of MEG responses elicited bysequential piano-tones and chords. J. Neurosci. 26 (15),4046–4053.
Leino, S., Brattico, E., Tervaniemi, M., Vuust, P., 2007.Representation of harmony rules in the human brain: furtherevidence from event-related potentials. Brain Res. 1142,169–177.
Maess, B., Koelsch, S., Gunter, T.C., Friederici, A.D., 2001. Musicalsyntax is processed in Broca’s area: an MEG study. Nat.Neurosci. 4 (5), 540–545.
Maidhof, C., Koelsch, S., 2011. Effects of selective attention onsyntax processing in music and language. J. Cogn. Neurosci. 23(9), 2252–2267.
Marie, C., Trainor, L.J., 2012. Development of simultaneous pitchencoding: infants show a high voice superiority effect. Cereb.Cortex 23 (3), 660–669.
Murphy, H.A., Stringham, E.J., 1951. Creative Harmony andMusicianship: An Introduction to the Structure of Music.Prentice-Hall, New York.
Nittono, H., Bito, T., Hayasaka, S., Hori, T., 2000. Event-relatedpotentials elicited by wrong terminal notes: effects oftemporal disruption. Biol. Psychol. 52, 1–16.
Patel, A.D., 2008. Music, Language, and the Brain. OxfordUniversity Press, New York.
Regnault, P., Bigand, E., Besson, M., 2001. Different brainmechanisms mediate sensitivity to sensory consonance andharmonic context: evidence from auditory event-related brainpotentials. J. Cogn. Neurosci. 13 (2), 241–255.
Rohrmeier, M.A., 2007. A generative grammar approach todiatonic harmonic structure. In: Proceedings of the 4th Soundand Music Computing Conference, SMC’07..
Rohrmeier, M.A., Cross, I., Statistical properties of tonal harmonyin Bach’s chorales, in: Proceedings of ICMPC 10, Sapporo,Japan, 2008.
Sammler, D., Koelsch, S., Ball, T., Brandt, A., Grigutsch, M.,Huppertz, H.J., Knosche, T.R., Wellmer, J., Widman, G., Elger, C.E.,Friederici, A.D., Schulze-Bonhage, A., 2013. Co-localizinglinguistic and musical syntax with intracranial EEG.Neuroimage 64, 134–146.
Schmuckler, M.A., Boltz, M.G., 1994. Harmonic and rhythmicinfluences on musical expectancy. Percept. Psychophys. 56 (3),313–325.
Taulu, S., Simola, J., 2006. Spatiotemporal signal space separationmethod for rejecting nearby interference in MEGmeasurements. Phys. Med. Biol. 51 (7), 1759–1768.
Taulu, S., Hari, R., 2009. Removal of magnetoencephalographicartifacts with temporal signal-space separation:demonstration with single-trial auditory-evoked responses.Hum. Brain Mapp. 30 (5), 1524–1534.
Tesche, C.D., Uusitalo, M.A., Ilmoniemi, R.J., Huotilainen,Kajola, M., Salonen, O., 1995. Signal-space projections ofMEG data characterize both distributed and well localizedneuronal sources. Electroencephalogr. Clin. Neurophysiol. 95,189–200.
Tompson, W.F., 1993. Modeling perceived relationships betweenmelody, harmony, and key. Percept. Psychophys. 1993 (53), 13–24.
Verleger, R., 1990. P3-evoking wrong notes: unexpected, awaited,or arousing?. Int. J. Neurosci. 55 (2–4), 171–179.
Zatorre, R.J., Samson, S., 1991. Role of the right temporalneocortex in retention of pitch in auditory short-termmemory. Brain 114 (6), 2403–2417.
Zatorre, R.J., Evans, A.C., Meyer, E., 1994. Neural mechanismsunderlying melodic perception and memory for pitch.J. Neurosci. 14 (4), 1908–1919.
Zatorre, R.J., Belin, P., Penhune, V.B., 2002. Structure and functionof auditory cortex: music and speech. Trends Cogn. Sci. 6 (1),37–46.
Recommended


